inequality and marylands future
TRANSCRIPT

Inequality in Our PolityToward a more equal Maryland May 31, 2014

WE LIVE IN A TOP-HEAVY WORLD
68.7%
22.9%
7.7%
0.7%3.0%
13.7%
42.3% 41.0%
0%
10%
20%
30%
40%
50%
60%
70%
80%
Under $10,000 $10,000-$100,000 $100,000-$1 million Over $1 million
Share of global population and wealth, by net worth class
% global population % global wealth
Credit Suisse Research Institute, October 2013

WE LIVE IN THE TOP-HEAVIEST NATION
2% 2% 3% 4% 4% 5% 5% 5%7% 8%
42%
0%
5%
10%
15%
20%
25%
30%
35%
40%
45%
Share of world’s adults holding over $1 million in net worth
Credit Suisse Research Institute, October 2013

WE LIVE IN AMERICA’S TOP-HEAVIEST STATE
7.7%
7.5%
7.3%
7.2%
6.8%
6.6%
6.5%
6.2%
6.1%
6.0%
5.8%
5.7%
0% 1% 2% 3% 4% 5% 6% 7% 8%
Maryland
New Jersey
Connecticut
Hawaii
Alaska
Virginia
New Hampshire
Delaware
DC
California
New York
Washington
Millionaire households as share of total households, 2013
Phoenix Marketing, January 2014

OUR MARYLAND TODAY
Potomac
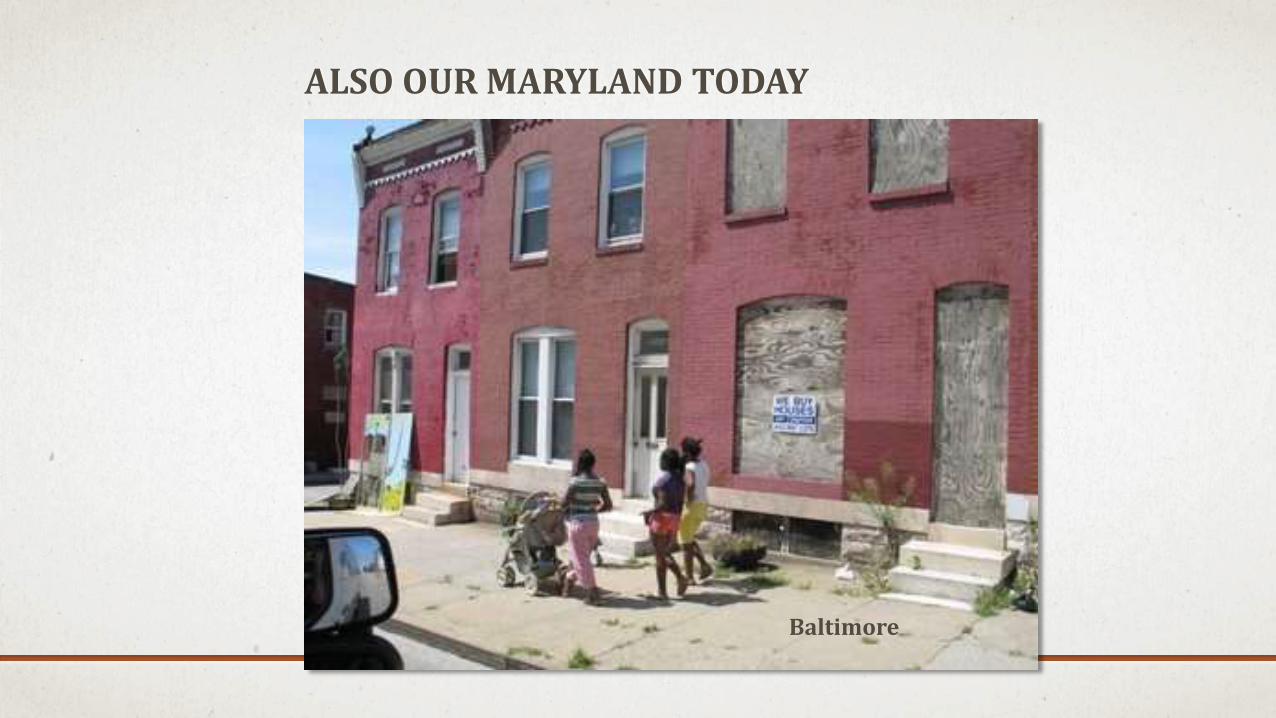
ALSO OUR MARYLAND TODAY
Baltimore
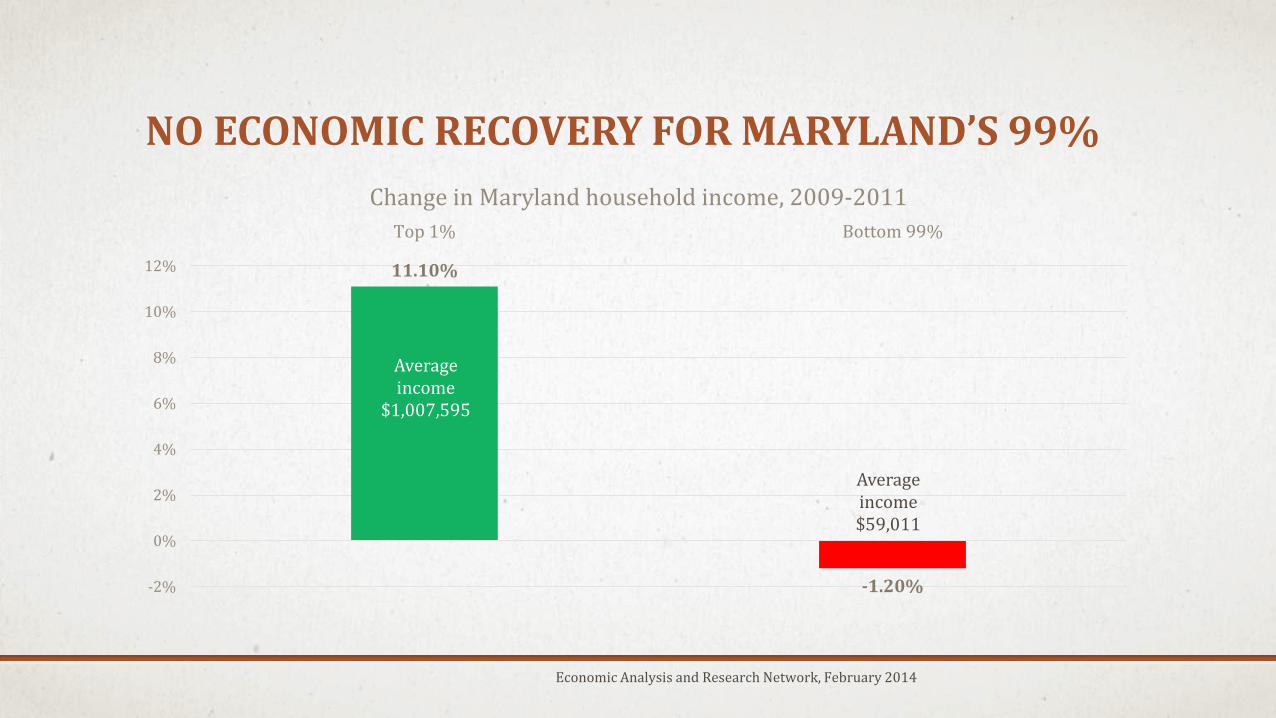
NO ECONOMIC RECOVERY FOR MARYLAND’S 99%
11.10%
-1.20%-2%
0%
2%
4%
6%
8%
10%
12%
Top 1% Bottom 99%
Change in Maryland household income, 2009-2011
Economic Analysis and Research Network, February 2014
Average income
$1,007,595
Averageincome$59,011

ONE COST OF OUR INEQUALITY
If Maryland’s 1968 level of
income equality still
prevailed today, the poorest
fifth of Marylanders would
be earning twice what they
currently take home.
Institute for Policy Studies, Closing the Inequality Divide, March 2013

OTHER COSTS WE CAN’T TALLY WITH DOLLARS
Louis Brandeis, Supreme Court, 1916-39
‘We can either have democracy in
this country or we can have great
wealth concentrated in the hands
of few. But we can't have both.’

BUT BRANDEIS DIDN’T KNOW THE HALF OF IT
Inequality – what we get when income and wealth concentrate – doesn’t just endanger democracy.
Inequality endangers everything basic to social decency.
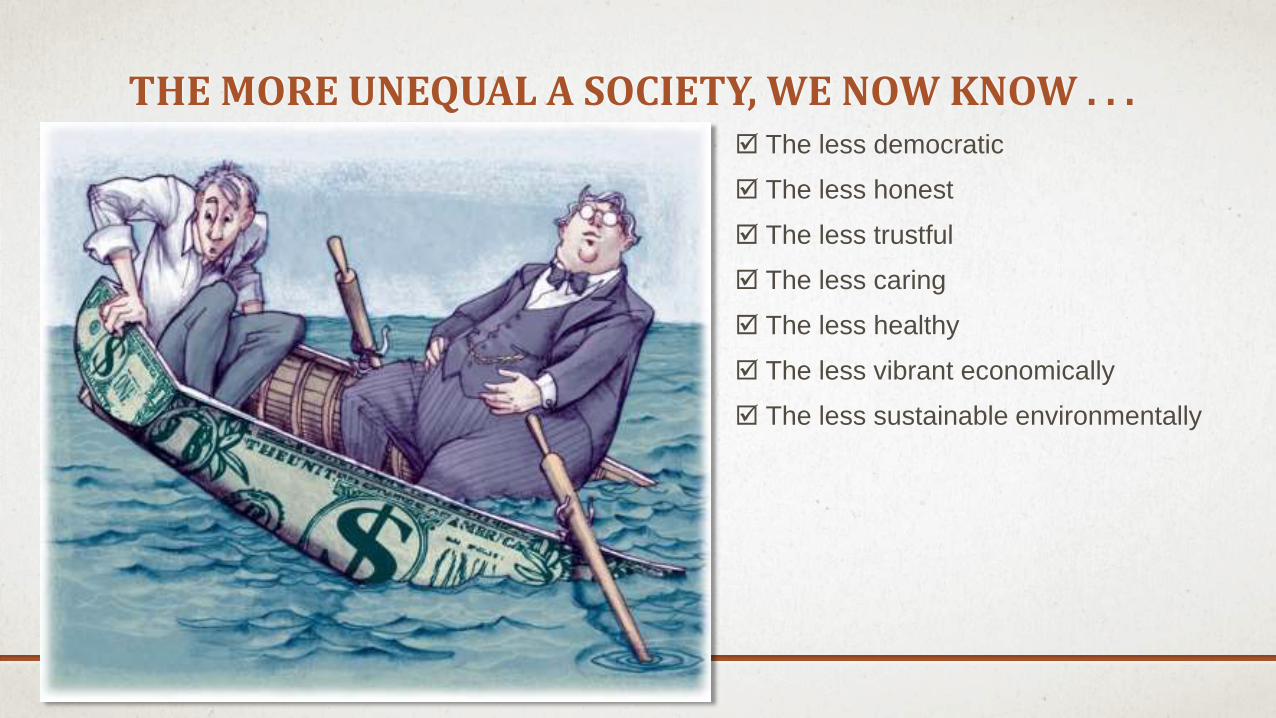
The less democratic
The less honest
The less trustful
The less caring
The less healthy
The less vibrant economically
The less sustainable environmentally
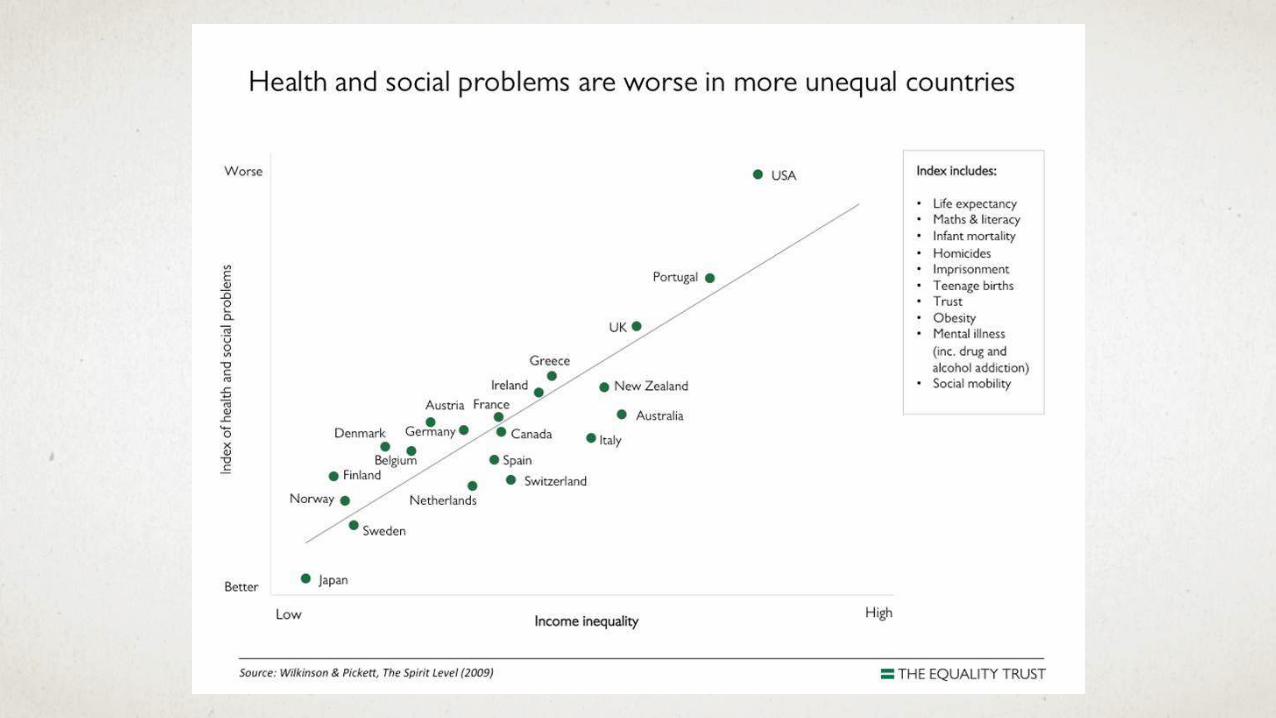
THE MORE UNEQUAL A SOCIETY, WE NOW KNOW . . .
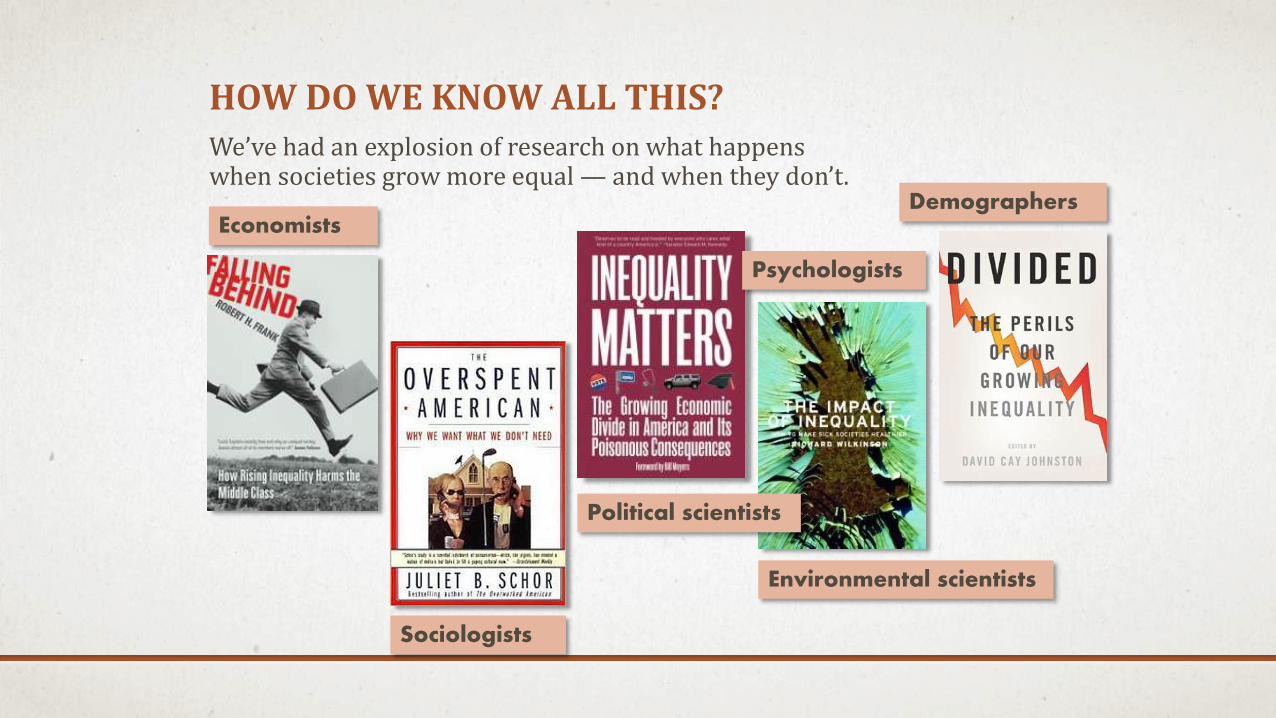
HOW DO WE KNOW ALL THIS?We’ve had an explosion of research on what happens when societies grow more equal — and when they don’t.
Economists
Political scientists
Environmental scientists
Sociologists
Psychologists
Demographers
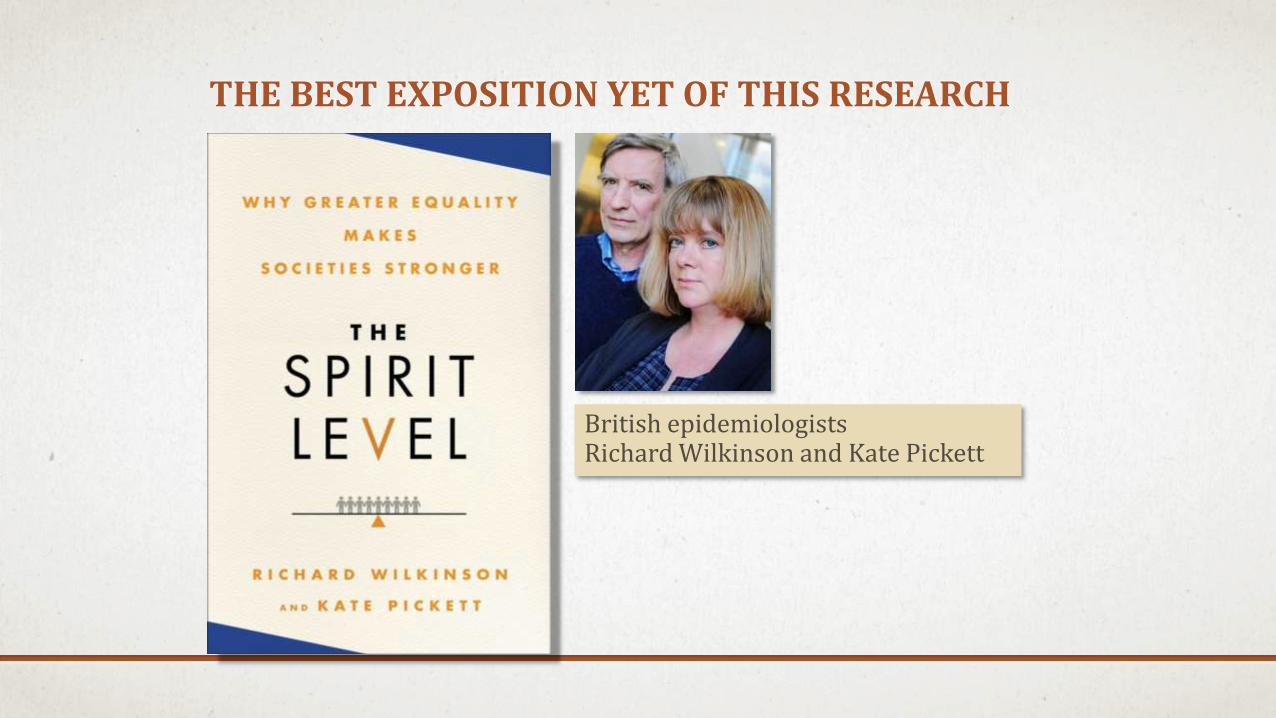
THE BEST EXPOSITION YET OF THIS RESEARCH
British epidemiologists Richard Wilkinson and Kate Pickett

WHAT CAN EPIDEMIOLOGISTS TEACH US?
About 25 years ago, epidemiological research began showing an amazing set of findings:
The greater the gap between a society’s top and bottom, the worse the society’s health.
Inequality has more of an impact on health than health care or individual health behaviors.
Epidemiologists study the health of populations

IN EQUAL SOCIETIES, PEOPLE LIVE LONGER
Not just poor people, but all people!
If you have an average income in a relatively equal society, you’re going to live longer than a average-income person living in an unequal society.

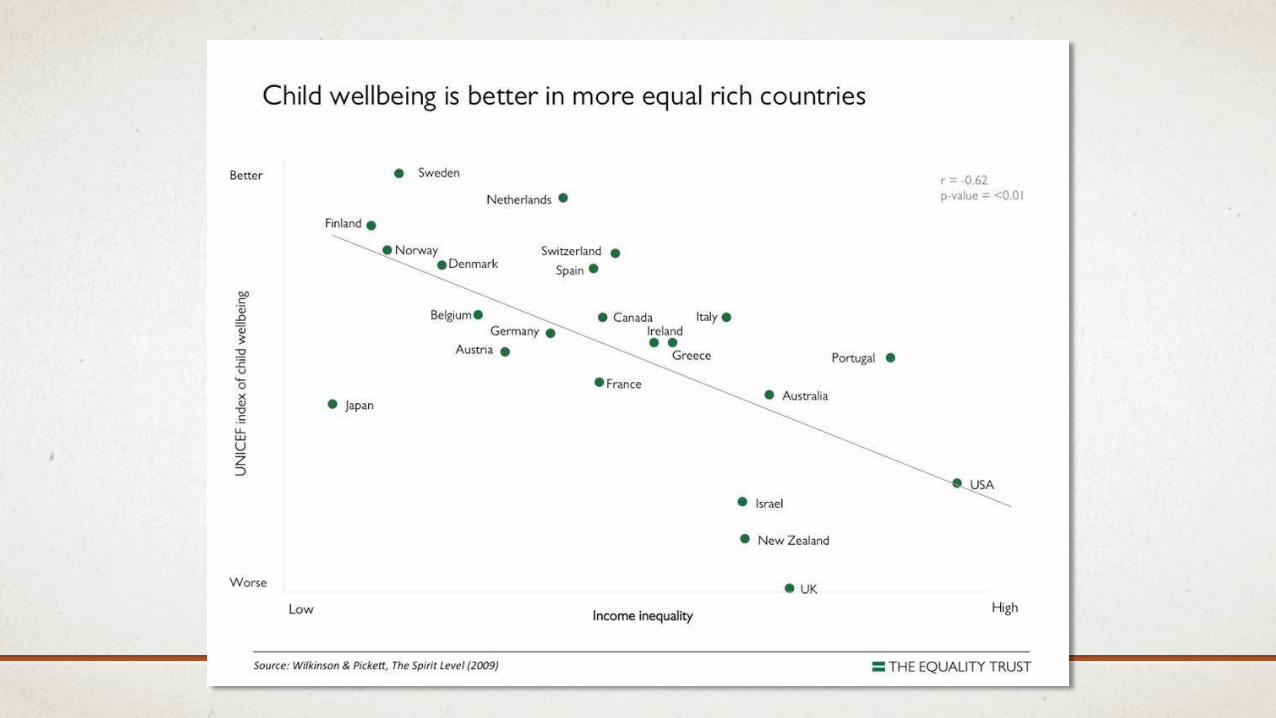
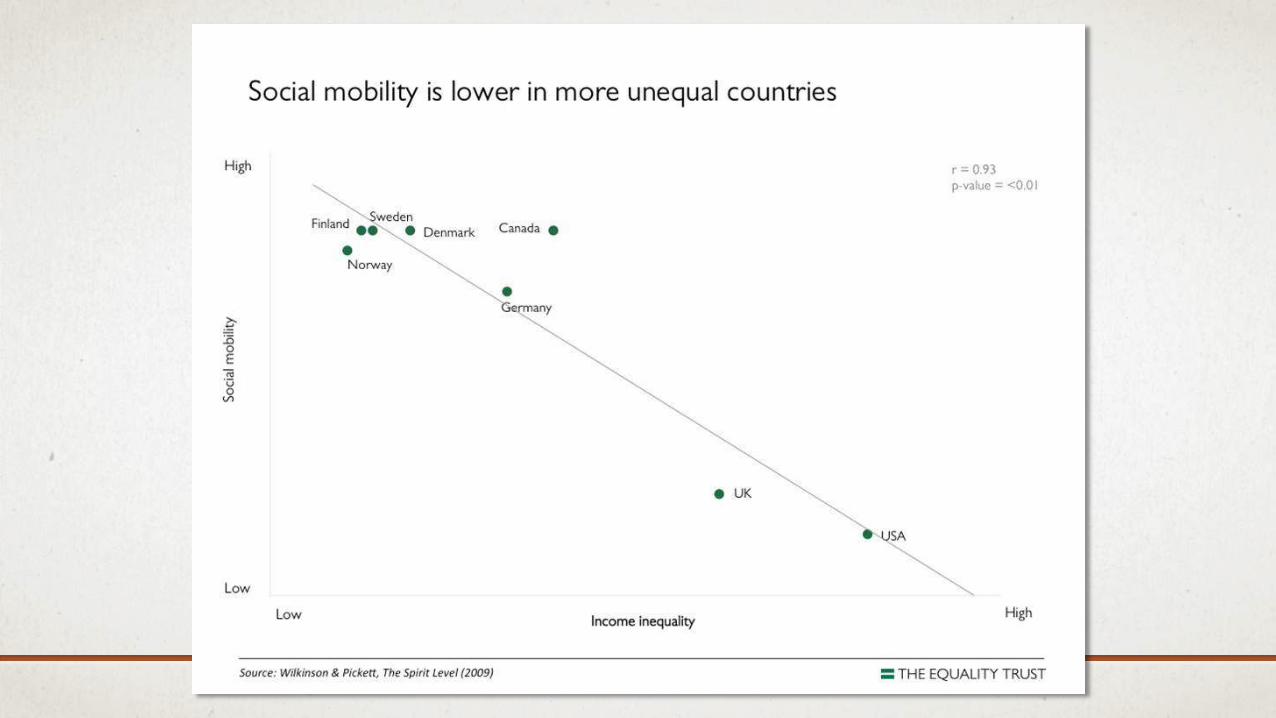
THE DATA: GREATER EQUALITY, LONGER LIVES
Source: Wilkinson and Pickett, The Spirit Level

‘If you want to know why one country does better or worse than
another, the first thing to look at is the extent of inequality.’
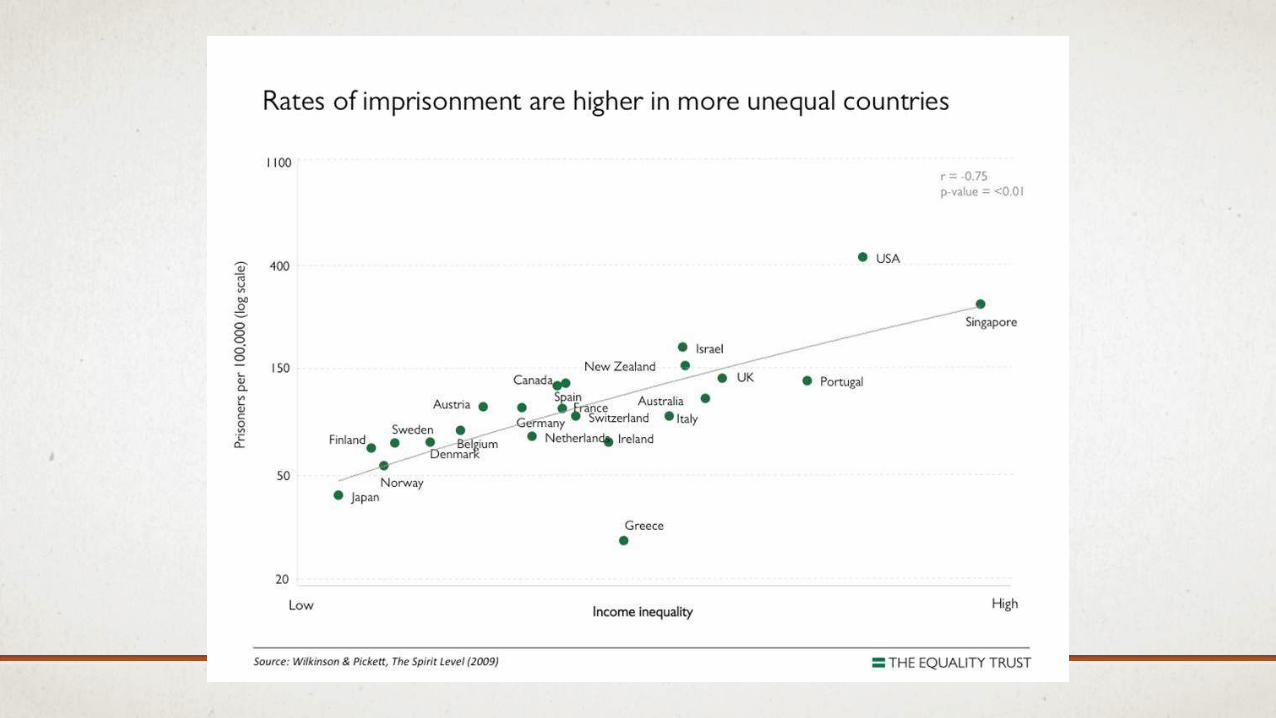
THIS SAME DYNAMIC SHOWS UP ALL OVER
Richard Wilkinson and Kate Pickett, 2009, The Spirit Level
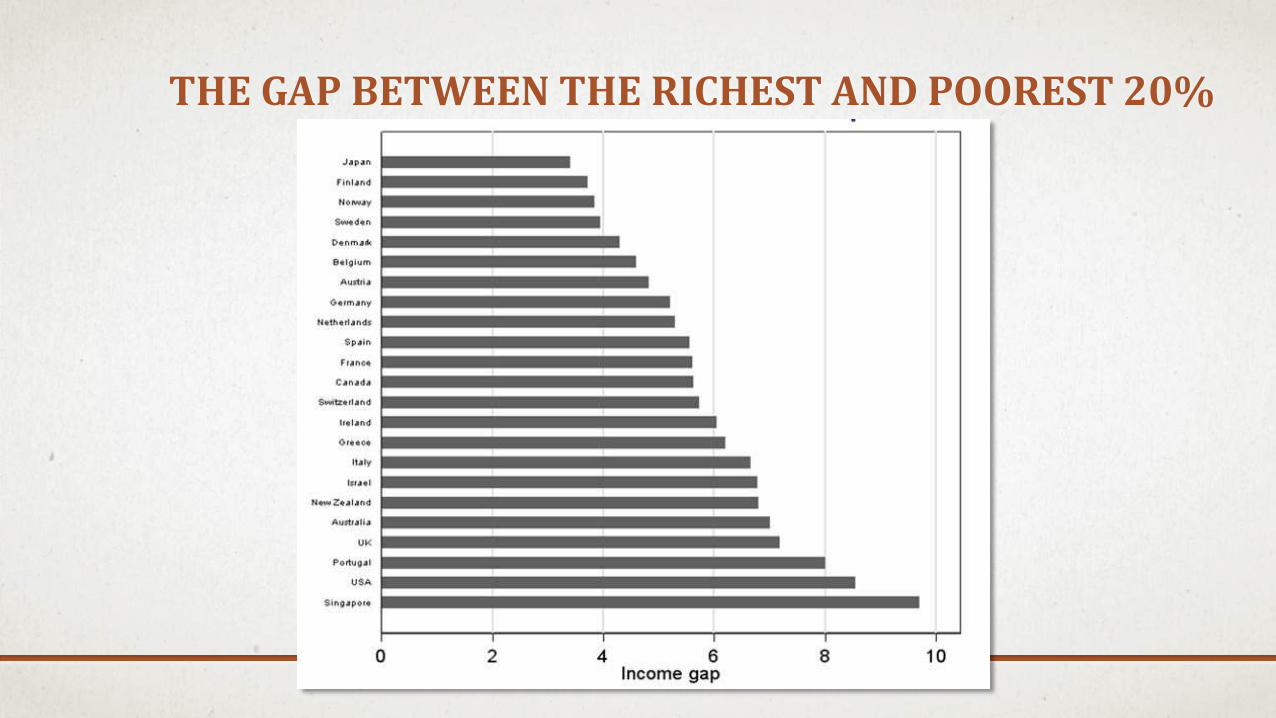
THE GAP BETWEEN THE RICHEST AND POOREST 20%


WHAT IF WE LOOK CLOSER TO HOME?
The same dynamics hold true for U.S.
states.

MORE CHILDREN DROP OUT IN UNEQUAL STATES
Wilkinson and Pickett, The Spirit Level
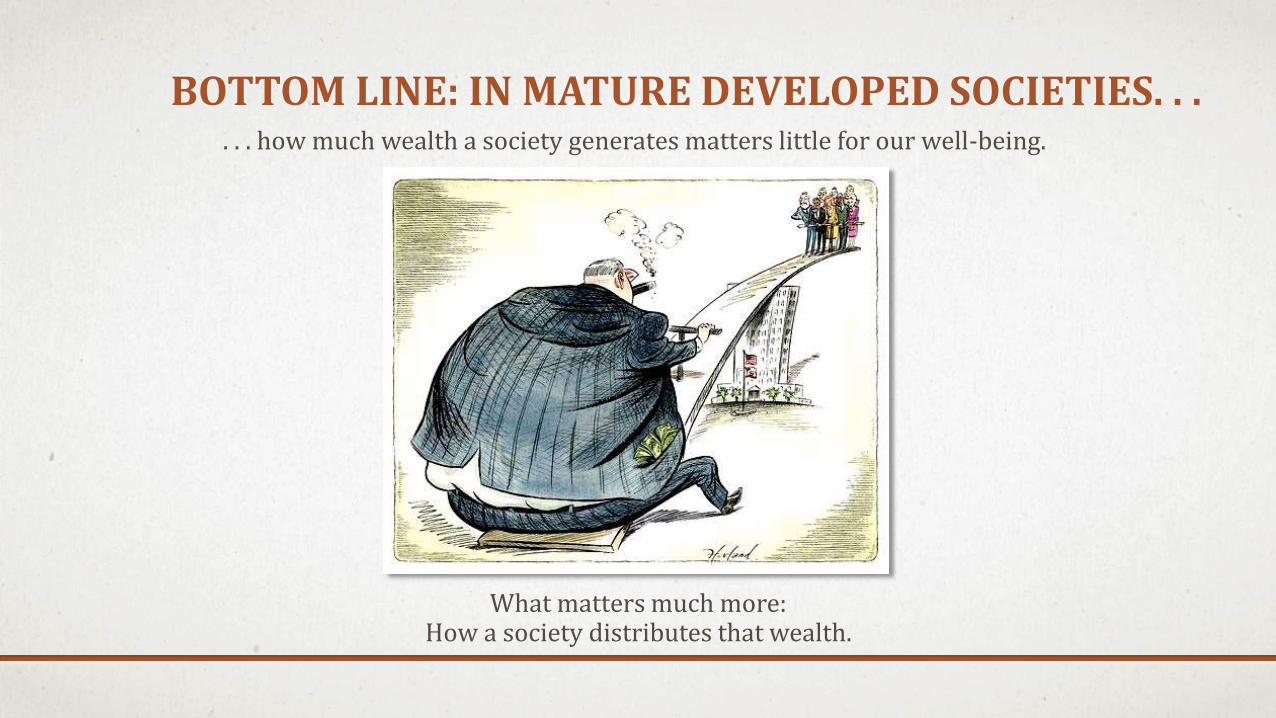
BOTTOM LINE: IN MATURE DEVELOPED SOCIETIES. . . . . . how much wealth a society generates matters little for our well-being.
What matters much more: How a society distributes that wealth.

IN SHORT: INEQUALITY MATTERS!

ESPECIALLY FOR OUR EARTH

GREATER INEQUALITY INCREASESTHE CULTURAL PRESSURE TO CONSUME
In a more equal society, where mostpeople can afford the same things, things don’t matter so much.
But where most people can’t afford the same things, things become a powerful marker of social status.
In a society growing more unequal, you either accumulate more and bigger things or find yourself labeled a failure.
Reason #1 why inequality drives environmental degradation
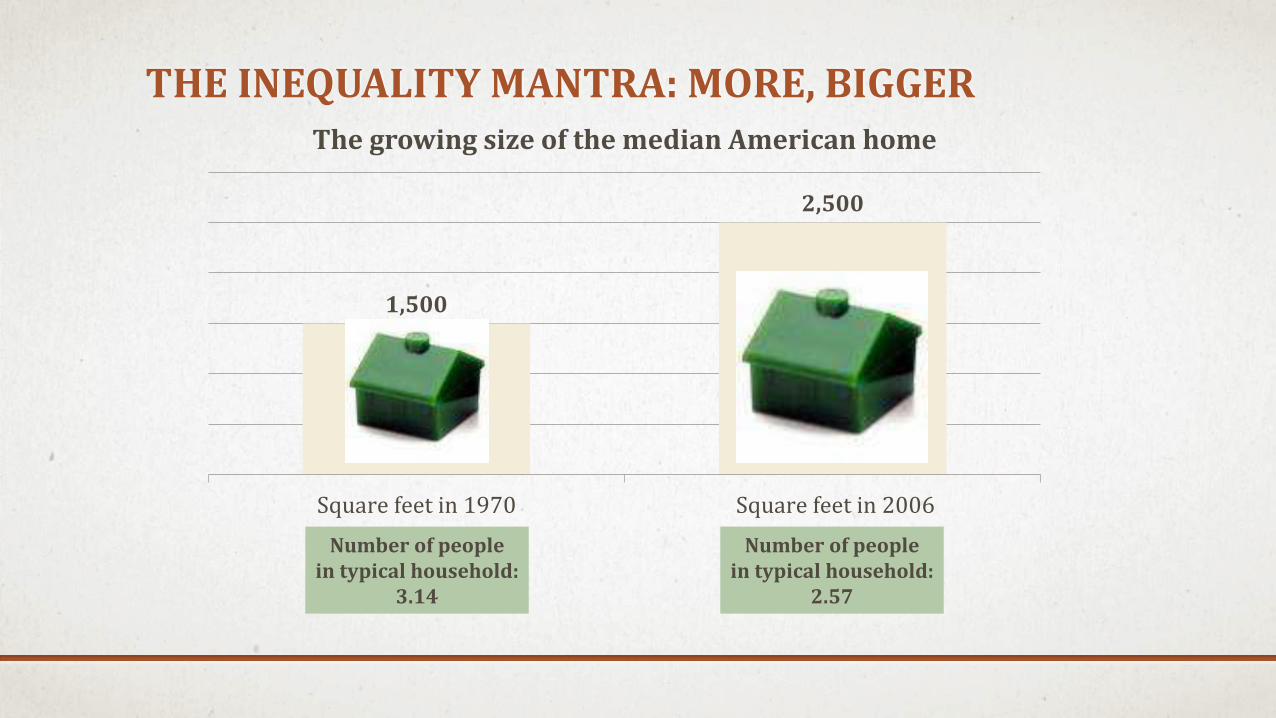
THE INEQUALITY MANTRA: MORE, BIGGER
1,500
2,500
Square feet in 1970 Square feet in 2006
The growing size of the median American home
Number of people in typical household:
3.14
Number of people in typical household:
2.57
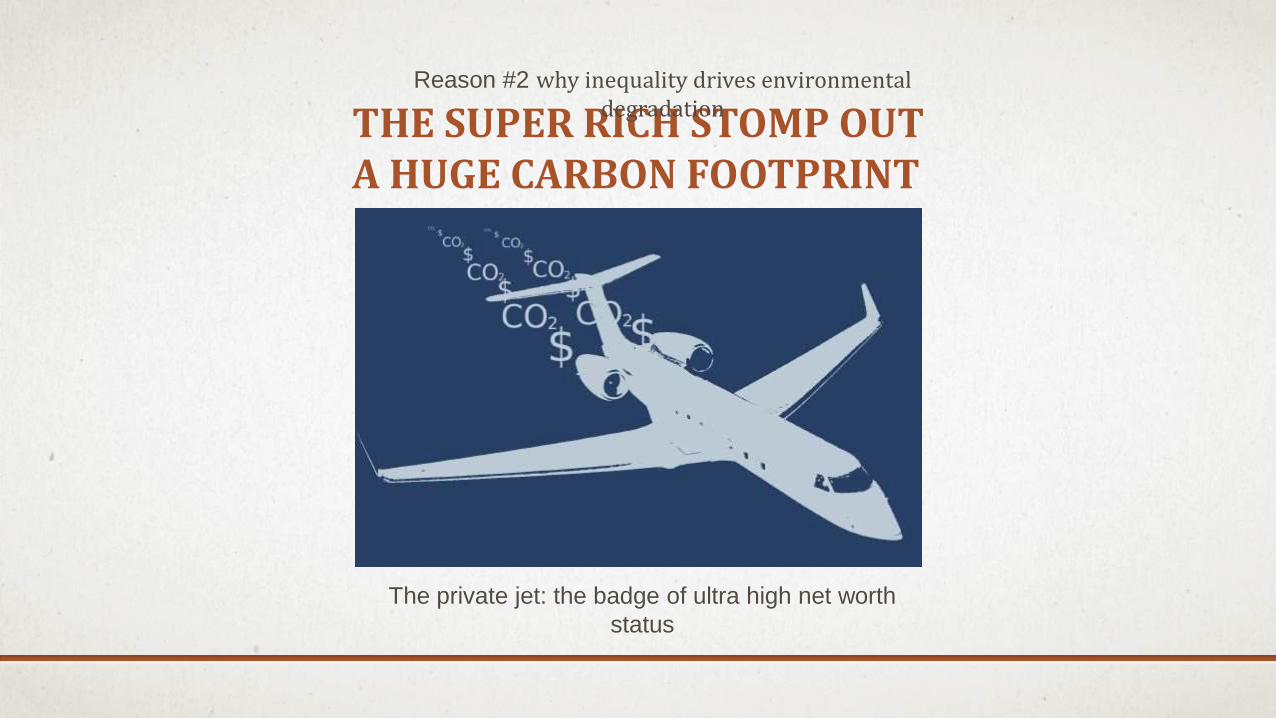
THE SUPER RICH STOMP OUT A HUGE CARBON FOOTPRINT
The private jet: the badge of ultra high net worth
status
Reason #2 why inequality drives environmental degradation

FLYING IN OUR UNEQUAL SKY
1,000
10,000
1970 2006
Number of private jets in active service
1,546
8,892
Commercial jet Private jet
Lbs. CO2 per passenger

PRIVATE JETS THE LUXURY TIP OF THE ICEBERG
“Look at the lives of the super-rich, who set the
pace for global consumption. Are their yachts
getting smaller? Their houses? Their artworks?
Their purchase of rare woods, rare fish, rare
stone? Those with the means buy ever bigger
houses to store the growing stash of stuff they
will not live long enough to use.”
George Monbiot, May 28, 2014

SUSTAINABILITY DEMANDS PUBLIC SPIRITEDNESSReason #3 why inequality drives environmental degradation
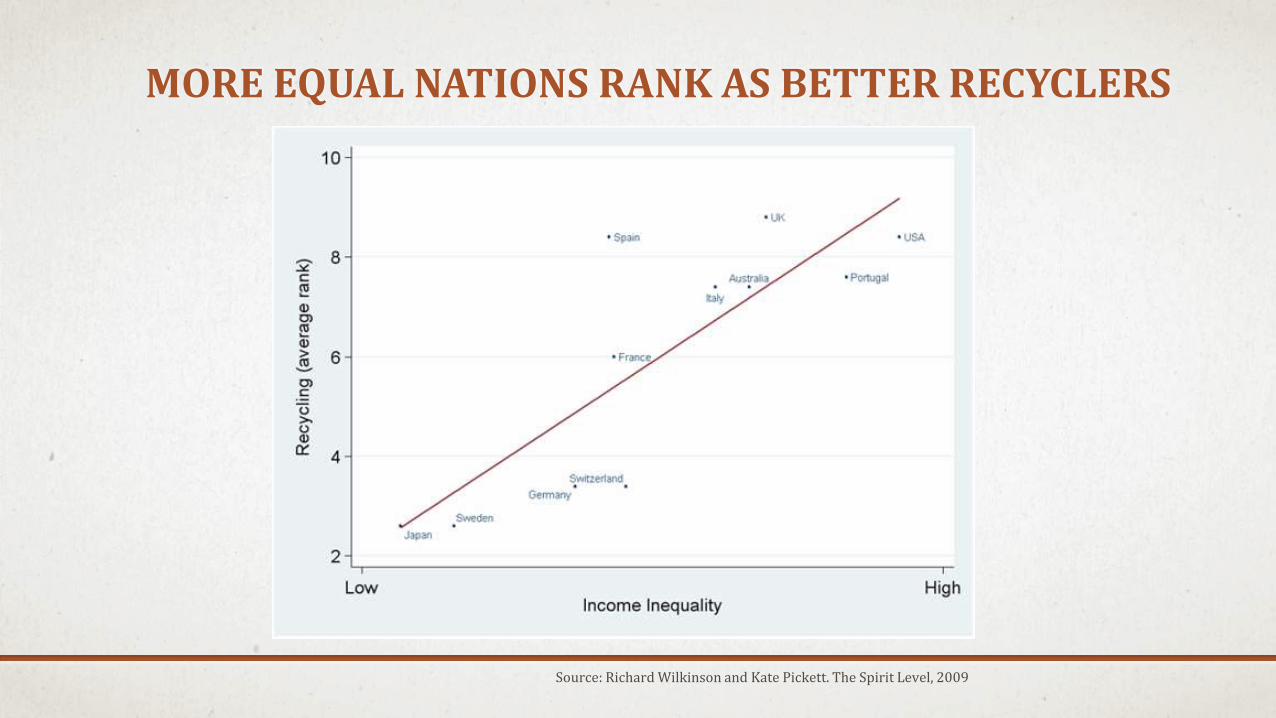
MORE EQUAL NATIONS RANK AS BETTER RECYCLERS
Source: Richard Wilkinson and Kate Pickett. The Spirit Level, 2009

GIVEN THE REALITY OF MASSIVE INEQUALITY, IS OUR ECOLOGICAL GOOSE COOKED?

HISTORY’S BAD NEWSThe Study: New NASA-funded research examines historic impact of inequality “on the fate of societies.”
The Finding: Under conditions “closely reflecting the reality of the world today,” the study finds an eventual social collapse — think Maya in Central America — “difficult to avoid.”
The Explanation: In deeply unequal societies, elites don’t feel the strain and pain from environmental degradation — until that degradation has gone too far to reverse.
This “buffer of wealth . . . allows elites to continue ‘business as usual.’”
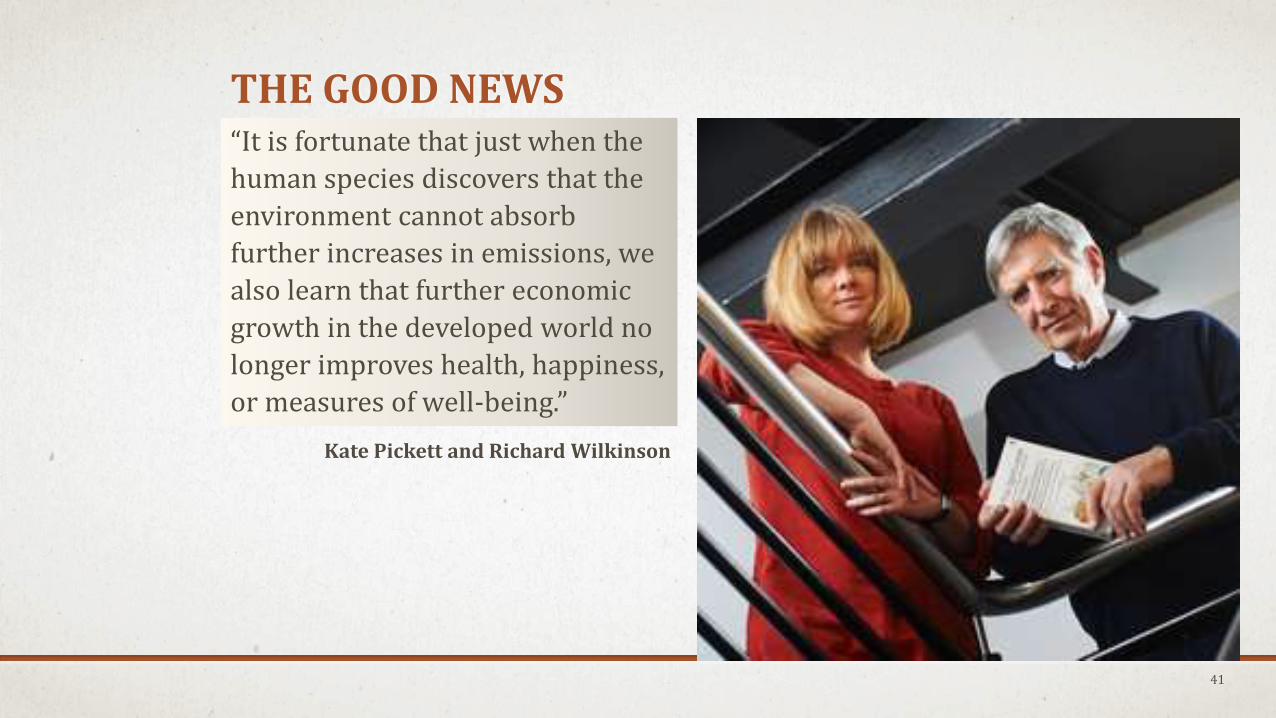
Kate Pickett and Richard Wilkinson
41
“It is fortunate that just when the
human species discovers that the
environment cannot absorb
further increases in emissions, we
also learn that further economic
growth in the developed world no
longer improves health, happiness,
or measures of well-being.”
THE GOOD NEWS

We don’t need to make moreto improve how well we live.
We need to share more.
We need to becomemore equal.
THE WAY FORWARD
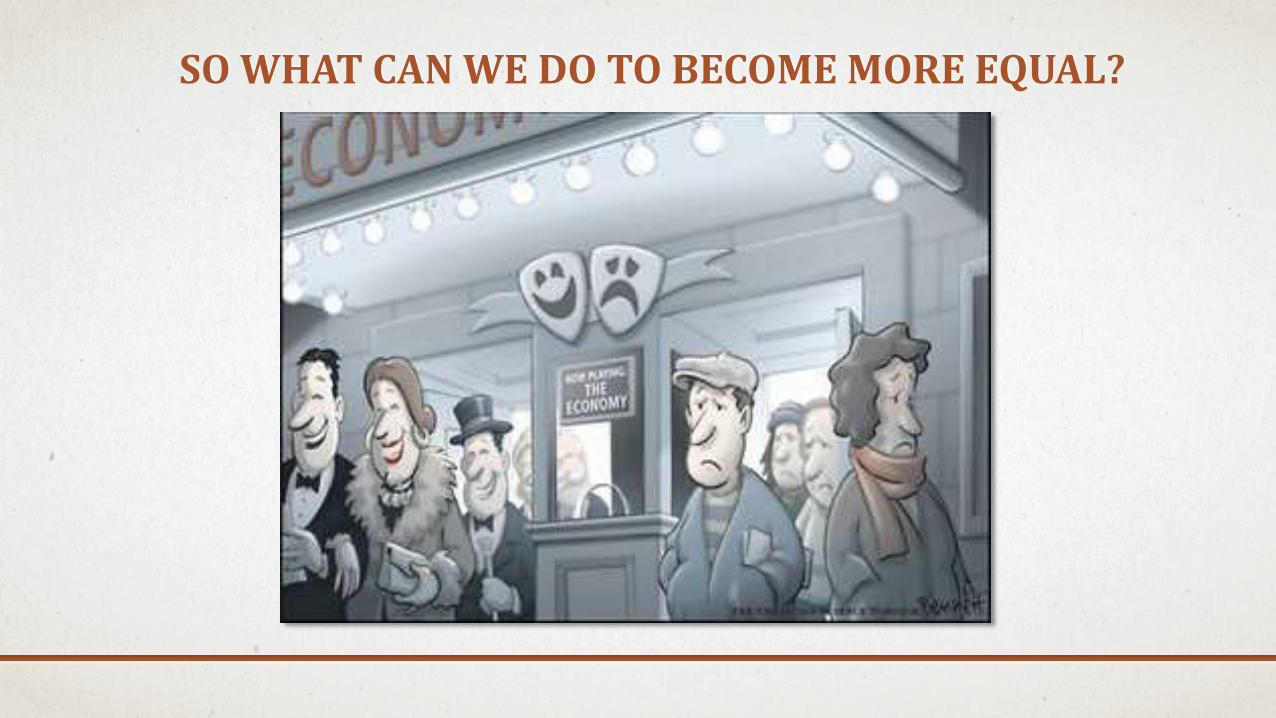
SO WHAT CAN WE DO TO BECOME MORE EQUAL?

STEP 1: RECOGNIZE WE CAN BECOME MORE EQUAL
0
200
400
600
800
1000
1200
1917 1922 1927 1932 1937 1942 1947 1952 1957 1962 1967 1972 1977 1982 1987 1992 1997 2002 2007 2012
Income of America’s top 0.1% as multiple of bottom 90% income, 1917-2012
Thomas Piketty/Emmanuel Saez, World Top Income Database, 2013
892 times
993 times

REASON TO CHEER IN MARYLAND HISTORY, TOO
26.4%
8.5%
17.0%
23.4%
9.9%
21.8%
0%
5%
10%
15%
20%
25%
30%
1928 1979 2007
Top 1% income share, United States and Maryland
USA
Maryland
Economic Policy Institute, 2013

STEP 2: UNDERSTAND HOW WE BECAME MORE EQUAL
UNIONS LEVEL UP THE BOTTOM HIGH TAXES LEVEL DOWN THE TOP
7.5%
28.3%
0
5
10
15
20
25
30
1930 1936 1942 1948 1954
Union members as % of employed
25%
91%
0
10
20
30
40
50
60
70
80
90
100
1925 1929 1933 1937 1941 1945 1949 1953
Top federal income tax rate

AMERICA NO LONGER LEVELS DOWN THE TOP
94%
70%
35%
39.6%
0
10
20
30
40
50
60
70
80
90
100
1925 1933 1941 1949 1957 1965 1973 1981 1989 1997 2005 2013
Tax rate on income in top tax bracket

UNIONS NO LONGER LIFTING UP THE BOTTOM
27%
13%
0%
5%
10%
15%
20%
25%
30%
Union members as a % of total workforce

HOW CAN WE GET BACK ON THE ROAD TO EQUALITY?
We need to recreate the institutional base for greater equality.
• A progressive tax system that levels down the rich.
• A labor movement strong enough to level up the poor.
But we need to go beyond the mid 20th century equality agenda.

HOW CAN WE GO BEYOND?
We already have a minimum wage.
How about a maximum?
An off-the-wall notion? Not to FDR.


MAXIMUM WAGE IDEA PREDATES FDR
Felix Adler, founder of Ethical Culture Society, proposes a 100 percent top tax rate in 1880.
In 1917, publisher E. W. Scripps calls for a 100 percent tax on all income over $50,000.
During World War I, New York attorney Amos Pinchot, brother of Pennsylvania Governor Gifford Pinchot, calls for a 100 percent tax rate on income over $100,000.
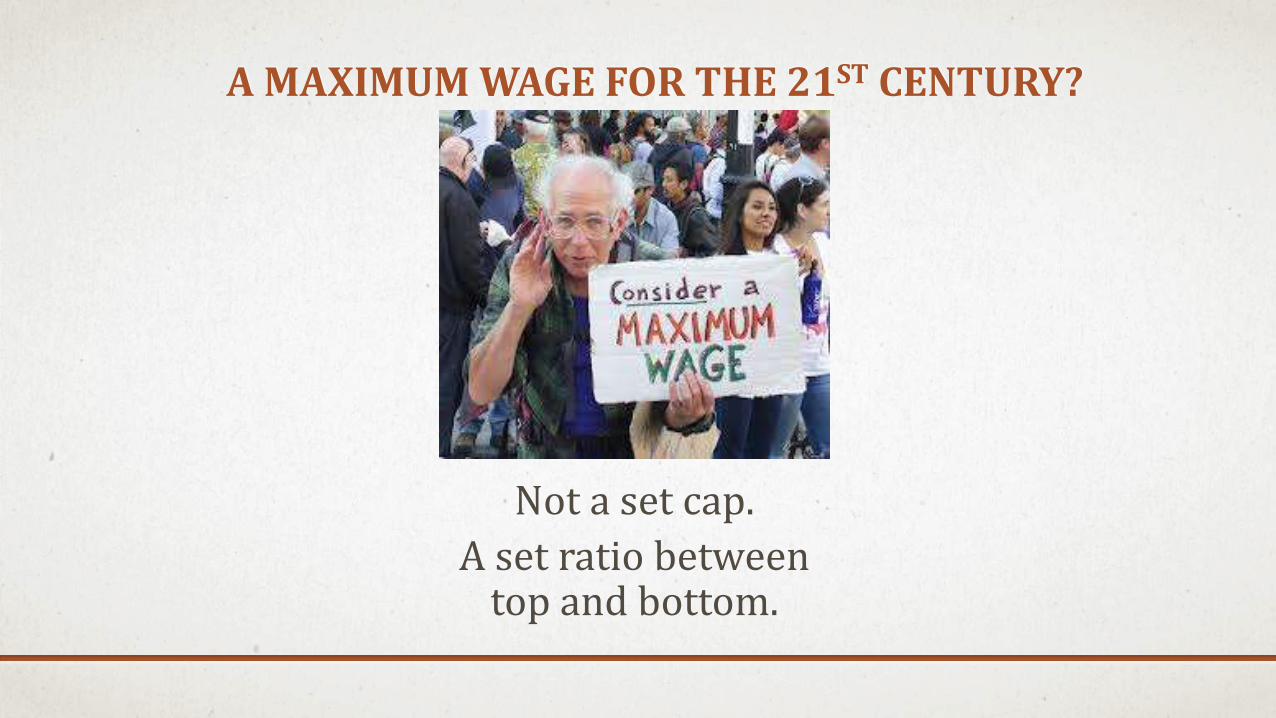
A MAXIMUM WAGE FOR THE 21ST CENTURY?
Not a set cap.
A set ratio between top and bottom.

ACTIVISTS WORLDWIDE PUSHING RATIOS
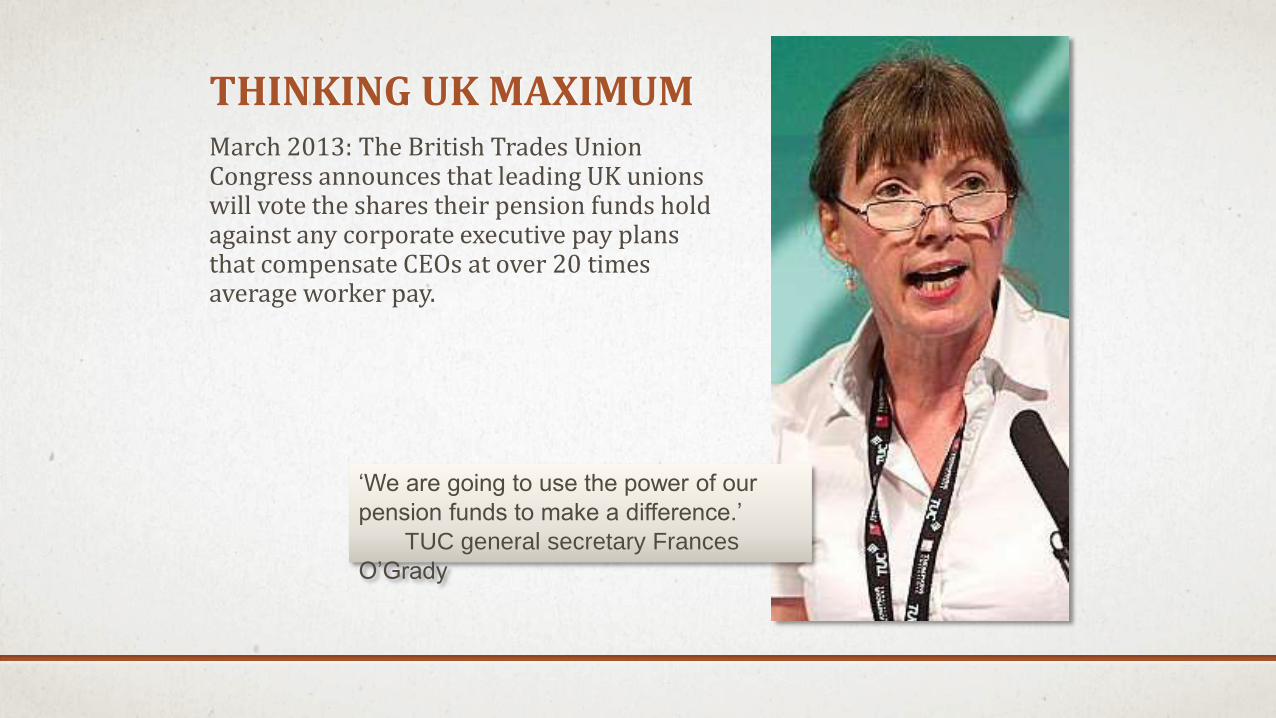
THINKING UK MAXIMUMMarch 2013: The British Trades Union Congress announces that leading UK unions will vote the shares their pension funds hold against any corporate executive pay plans that compensate CEOs at over 20 times average worker pay.
‘We are going to use the power of our
pension funds to make a difference.’
TUC general secretary Frances
O’Grady

THINKING SWISS MAXIMUMNovember 2013: Swiss vote on capping CEO pay at 12 times lowest worker pay

THINKING MARYLAND MAXIMUMFebruary 2014Faculty senate at St. Mary’s College narrowly votes down plan to set college’s lowest pay at 130 percent the official federal poverty level and limit the pay for St. Mary’s president to 10 times that lowest base pay.
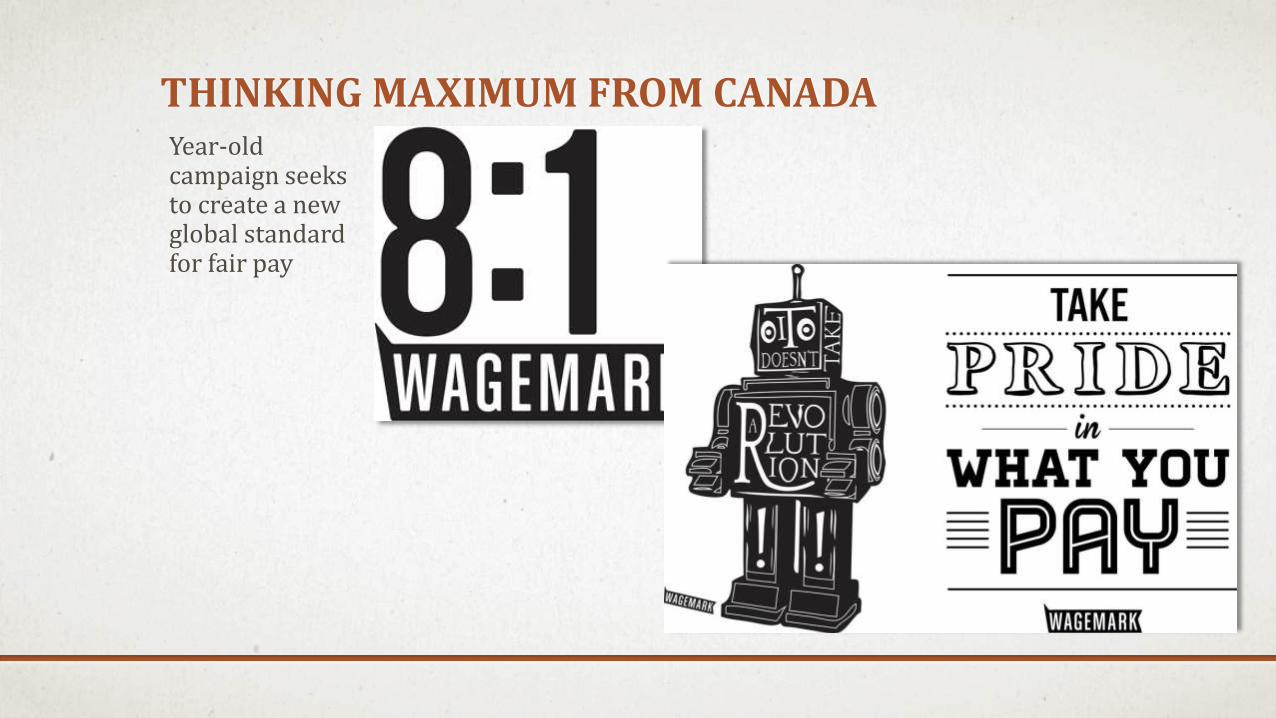
THINKING MAXIMUM FROM CANADAYear-old campaign seeks to create a new global standard for fair pay
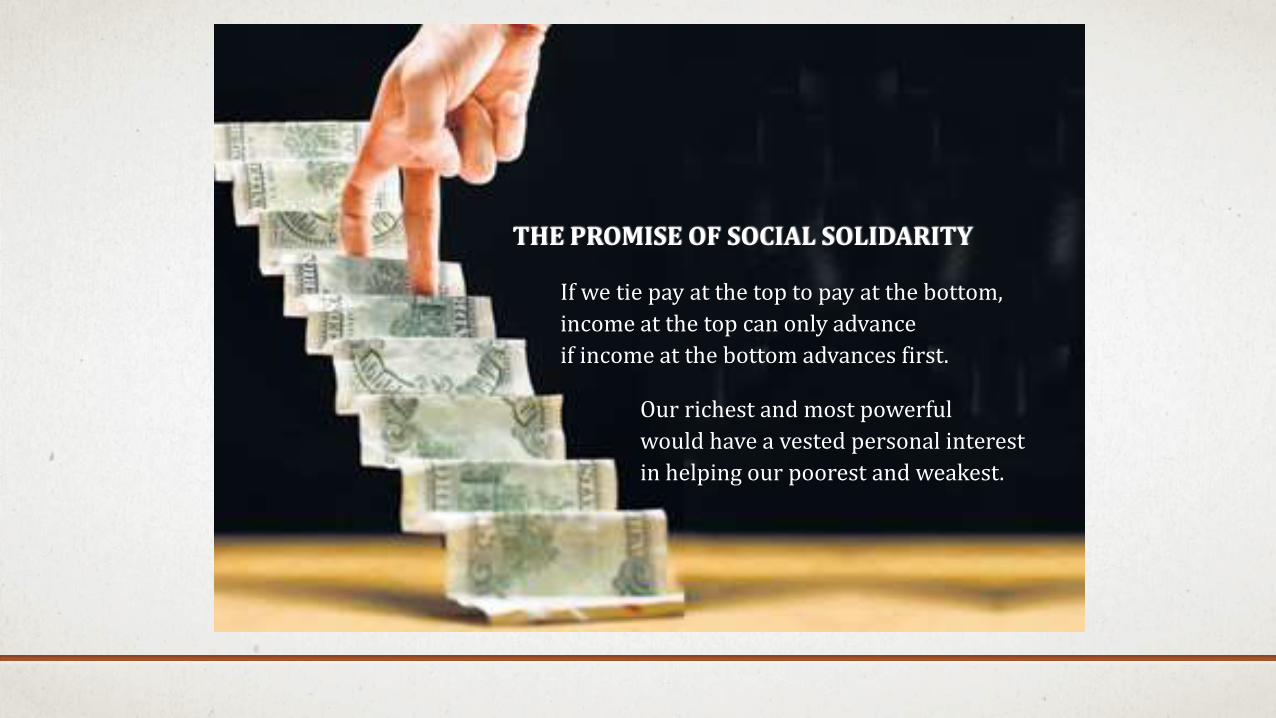
THE PROMISE OF SOCIAL SOLIDARITY
If we tie pay at the top to pay at the bottom,
income at the top can only advance
if income at the bottom advances first.
Our richest and most powerful
would have a vested personal interest
in helping our poorest and weakest.
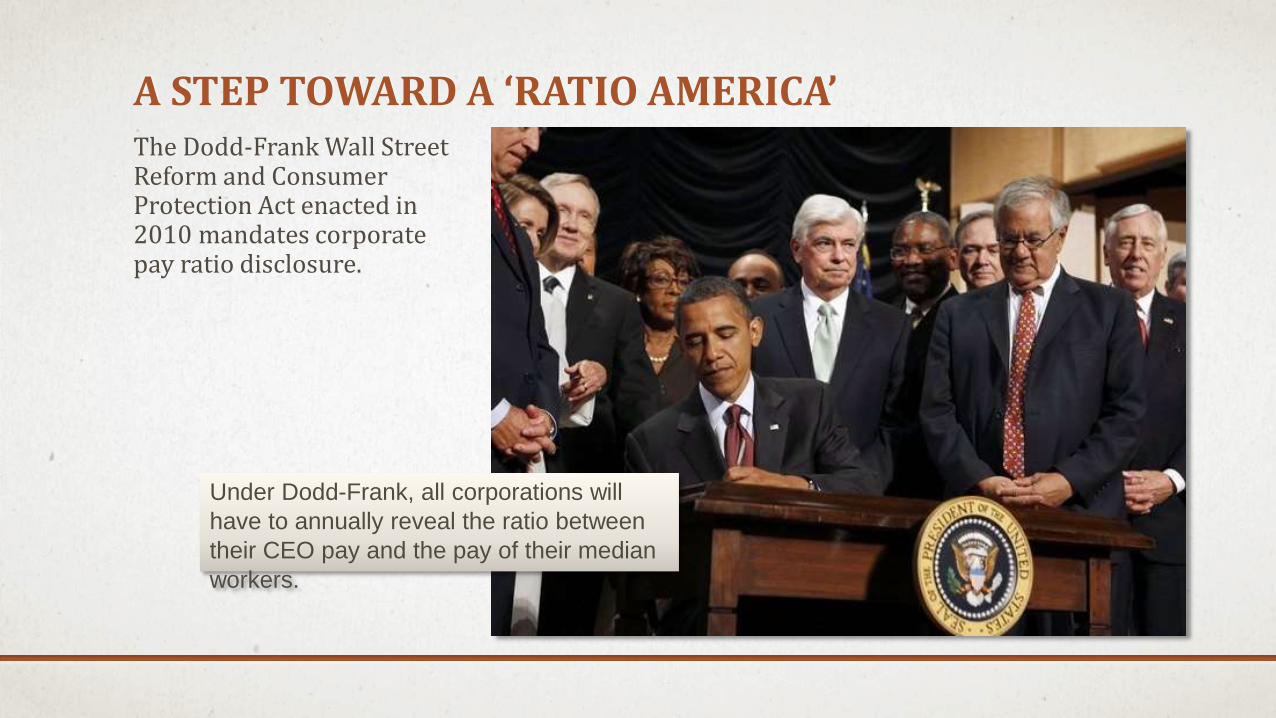
The Dodd-Frank Wall Street Reform and Consumer Protection Act enacted in 2010 mandates corporate pay ratio disclosure.
A STEP TOWARD A ‘RATIO AMERICA’
Under Dodd-Frank, all corporations will
have to annually reveal the ratio between
their CEO pay and the pay of their median
workers.
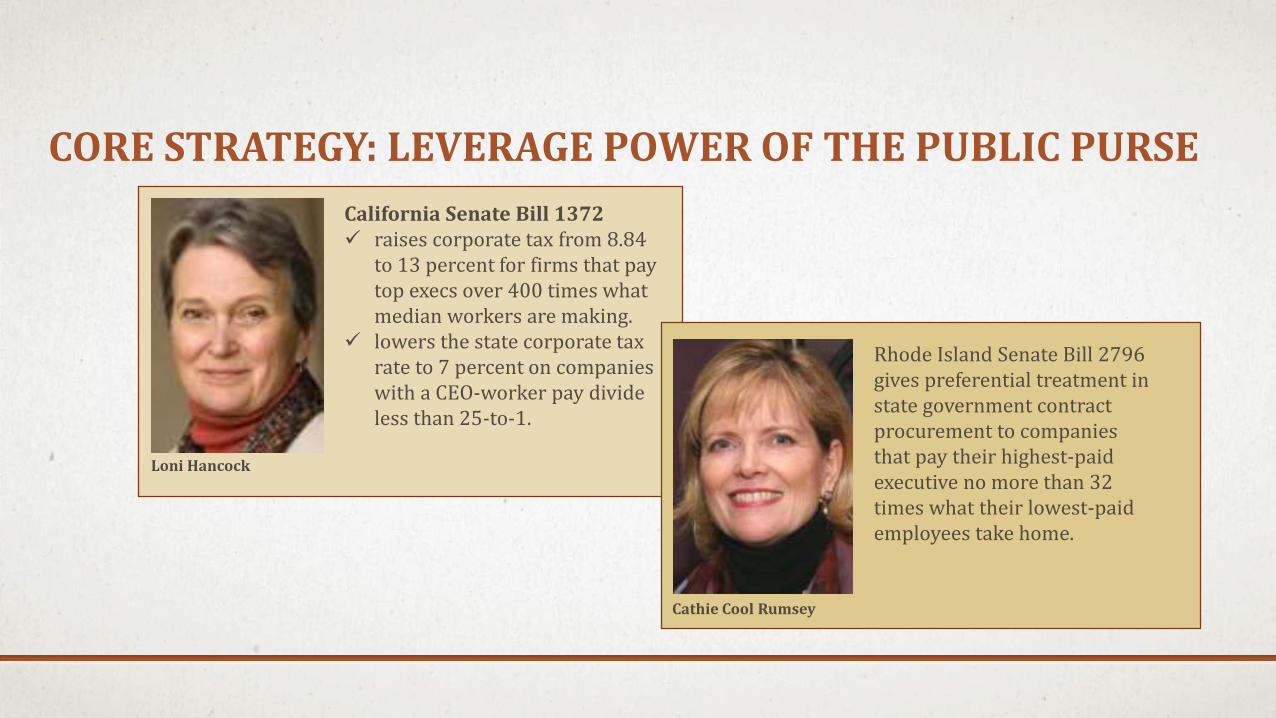
CORE STRATEGY: LEVERAGE POWER OF THE PUBLIC PURSE
California Senate Bill 1372 raises corporate tax from 8.84
to 13 percent for firms that pay top execs over 400 times what median workers are making.
lowers the state corporate tax rate to 7 percent on companies with a CEO-worker pay divide less than 25-to-1.
Loni Hancock
Rhode Island Senate Bill 2796 gives preferential treatment in state government contract procurement to companies that pay their highest-paid executive no more than 32 times what their lowest-paid employees take home.
Cathie Cool Rumsey

A THREE-STEP TOWARD GREATER EQUALITY
Disclose
Require all contractors who seek state, county, or city tax dollars to reveal ratio between top and median or lowest-paid workers.
Support
Give preferential treatment in the procurement process to enterprises with modest executive-worker pay divides.
Deny
Ban enterprises with excessive executive-workers ratios from any shot of obtaining tax dollars.

The top 1% share of national income in the United States, 1928-2028
24%
A quarter-century from now, what sort of society do we want to live in?
THE QUESTION ‘OCCUPYING’ AMERICA
The Institute for Policy Studies weekly email newsletter
Sign up at www.toomuchonline.org
For updates that can help keep you informed and engaged
An online portal into Web resources on our great divides

FOR INSPIRATION