inequalities in maternal health service … · maternal health is a priority programme of the...
TRANSCRIPT

INEQUALITIES IN MATERNAL
HEALTH SERVICE UTILISATION IN
NEPAL An analysis of routine and survey data
November 2018
Government of Nepal
Ministry of Health and Population

Supported by:
The contents of this brief do not necessarily reflect the official views of the Government of Nepal,
Ministry of Health and Population and the UK aid

i
Executive Summary
Nepal has made steady progress in improving maternal health service utilisation but inequalities among
different population sub-groups still persist. The objective of this analysis was to assess the levels and
trends of inequalities in availability and utilisation of maternal health services in Nepal using selected
indicators. Data from Nepal Health Facility Survey 2015, Health Management Information System (FY
2014/15 to 2016/17) and Nepal Demographic and Health Surveys (1996 to 2016) were used for analysis.
Both absolute and relative indicators of inequality were calculated to assess inequalities from socio-
economic positon – wealth quintile, caste/ethnicity composition and geographical position – ecological
zone, district and provinces. All analyses were conducted using Stata 15 and MS-Excel© 2016.
Availability and readiness of maternal health services: When considering ecological zone, inequality
is higher for availability of delivery services than for antenatal care services. Fewer health facilities in Terai
offer normal vaginal delivery services; while availability of caesarean delivery was lowest in the mountain
region. More public facilities showed readiness to provide delivery services vs private facilities. There is a
huge gap between Province 6 (Karnali) and Province 2 when it comes to availability of normal vaginal
delivery services. Province 5 showed highest readiness for both ANC and delivery services while Province
2 fared worst.
It is necessary to improve/strengthen existing health facilities in the services they provide. Additionally, investigate reasons for
underutilization of services, based on which, improvements in quality of existing services or expansion of the services (making
the services available) in other health facilities could be undertaken. Under performing provinces and regions should be
targeted.
Annual levels and trends of inequalities in utilisation of maternal health services: Consistent trends
in inequality could not be identified in terms of ecological zone and districts. Among provinces, inequality
is increasing in utilisation of delivery services. Province 2 is consistently performing poorly compared to
others. Larger drop outs between first ANC visits and four ANC visits as per protocol was revealed;
similarly, between PNC checkups within 24 hours of delivery and three PNC checkups as per protocol.
Granted, strictly not within the scope of this analysis – for retention of mothers during antenatal, delivery and postnatal
period, the quality of service delivery must be ensured; the social, economic and cultural barriers in regions that have lower
utilisation should be identified and addressed; and supply factors such as budgeting, human resource and capacity development
of staff should also be considered.
Long term levels and trends in inequality: In terms of wealth, from 1996 to 2016, although
disproportionately concentrated in richer households, the overall inequality shows a decreasing trend in
utilisation of all maternal health services. Wealth quintile specific utilisation is increasing over time but
there is a disparity between the poorest and the richest group, with richest group showing higher
utilisation. Among caste/ethnic groups, in general, utilisation is higher in Newar and lower in Dalit,
Muslim and Other Terai caste group. The average increase in utilisation is higher in Brahmin/Chhetri.
The poor should be incentivized to utilize maternal health care services – reduce financial barriers to access, minimize
catastrophic health expenditures, introduce new/strengthen existing social safety net programmes (existing conditional cash
transfer programme) that raise people out of poverty, and prevent poor from further destitution. Additionally, there should be
a focus on most disadvantaged caste and ethnic groups which are susceptible to both under utilisation of services and relative
poverty to bring about improvements in inequality in utilisation indicators.
The current levels and trends in equity gaps in maternal health services shows that with increasing coverage of services, bottom
inequality prevails, leading to marginal exclusion of the disadvantaged and most vulnerable groups. Barriers to access should
be identified and appropriate services should be targeted at these groups. Policies should be tailored to inequality patterns.
Note: Nepali version of this summary is available at the end of this report.

ii
Table of Contents
Executive Summary ............................................................................ i
List of Figures ................................................................................... iii
List of Abbreviations ........................................................................ iv
1. Background .................................................................................. 1
1.1 Objective ................................................................................... 3
2. Methods.......................................................................................... 4
2.1 Indicator selection and sources of data ................................... 4
2.2 Data Analysis ............................................................................ 5
2.3 Limitations ............................................................................... 6
3. Results ............................................................................................ 7
3.1 Availability and readiness of maternal health services ........... 7
3.2 Annual levels and trends of inequalities in utilisation of maternal health services (FY 2014/15 to 2016/17)...................... 8
3.2 Long term levels and trends in inequality (1996 to 2016) .... 10
4. Conclusions and Recommendations ........................................... 17
References ....................................................................................... 21
Annex I ............................................................................................. 23

iii
List of Tables
TABLE 1. LIST OF INDICATORS SELECTED TO ASSESS INEQUALITY IN AVAILABILITY AND UTILISATION OF
MATERNAL HEALTH SERVICES IN NEPAL ...................................................................................................... 4 TABLE 2. MATERNAL HEALTH SERVICE AVAILABILITY AND READINESS, NHFS 2015............................................. 7 TABLE 3. TRENDS AND PATTERNS OF INEQUALITIES IN UTILISATION OF MATERNAL HEALTH SERVICES:
ANTENATAL, DELIVERY AND POSTNATAL CARE SERVICES, HMIS 2014/15 – 2016/17 ..................................... 9 TABLE 4. WEALTH QUINTILE SPECIFIC TRENDS AND ESTIMATES FOR FOUR OR MORE ANC CHECK-UPS IN
1996, 2001, 2006, 2011 AND 2016 .................................................................................................................... 10 TABLE 5. CASTE/ETHNICITY SPECIFIC TRENDS AND ESTIMATES FOR FOUR OR MORE ANC CHECK-UPS IN
1996, 2001, 2006, 2011 AND 2016 .................................................................................................................... 11 TABLE 6. WEALTH QUINTILE SPECIFIC TRENDS AND ESTIMATES FOR DELIVERY IN A HEALTH FACILITY IN
1996, 2001, 2006, 2011 AND 2016 .................................................................................................................... 12 TABLE 7. CASTE/ETHNICITY SPECIFIC TRENDS AND ESTIMATES FOR DELIVERY IN A HEALTH FACILITY IN
1996, 2001, 2006, 2011 AND 2016 .................................................................................................................... 13 TABLE 8. WEALTH QUINTILE SPECIFIC TRENDS AND ESTIMATES FOR DELIVERIES BY CAESAREAN SECTION IN
1996, 2001, 2006, 2011 AND 2016 .................................................................................................................... 14 TABLE 9. CASTE/ETHNICITY SPECIFIC TRENDS AND ESTIMATES FOR DELIVERIES BY CAESAREAN SECTION IN
1996, 2001, 2006, 2011 AND 2016 .................................................................................................................... 15 TABLE 10. DISTRICT SPECIFIC TRENDS AND PATTERNS OF INEQUALITIES IN MATERNAL HEALTH SERVICES:
ANTENATAL, DELIVERY AND POSTNATAL CARE SERVICES, HMIS 2014/15 – 2016/17 ................................... 23
List of Figures
FIGURE 1. TREND IN CONCENTRATION INDEX OF MATERNAL SERVICE UTILISATION INDICATORS. .................... 16

iv
List of Abbreviations
ANC Antenatal Care
CS Caesarean Section
FY Fiscal Year
HMIS Health Management Information System
LNOB Leaving no one behind
M & E TWG Monitoring and Evaluation Technical Working Group
MOHP Ministry of Health and Population
NDHS Nepal Demographic and Health Survey
NFHS Nepal Family Health Survey
NHFS Nepal Health Facility Survey
NHSP Nepal Health Sector Programme
NHSS Nepal Health Sector Strategy
NHSSP Nepal Health Sector Support Programme
PNC Post-natal Care
PP Percentage Point
SDG Sustainable Development Goals

1
1. Background
epal’s population is diverse in caste, ethnicity, geographic distribution, and wealth. The
Government is committed to the Sustainable Development Goals set for 2030 and promotes equity
and inclusion in health service use. These Goals are principled on “leaving no one behind” (1).
There is a need to identify at-risk communities. Evidence of inequity informs policy-makers and programme
managers on where and how to focus efforts. So far, achieving equity has been slow despite being featured in
the earlier sectoral strategies. NHSP-I attempted to put clear systems in place to make sure that the poor and
vulnerable communities have priority for access (2). While the National Health Policy 2014 and Nepal Health Sector
Strategy (2015-2020), emphasize on multi-sectoral partnership, local governance, and decentralized service
delivery including mitigation of access barriers and promotion of equity and inclusion (3).
In the past two-decades, Nepal has made steady progress in improving maternal health service utilisation but
inequalities among different population sub-groups still persist (4). Women with four or more antenatal care
(ANC) visits increased from 14% in 2001 to 69%; and assistance during delivery from a skilled provider
increased from 11% in 2001 to 58% in 2016 (5) (6). In 2016, ANC 4+ visits were higher in urban areas (76%)
than rural (62%). Deliveries assisted by skilled provider were disproportionately concentrated among those
with higher education and greater wealth – 85% in those with school leaving certificate or higher education
and 89% in those belonging to the richest wealth quintile. Only 57% of both mothers and newborns received
a postnatal care check within two days of delivery in 2016. It was also concentrated in the richest quintile
(81%) and those with school leaving certificate or higher education (80%); and was lowest in Province 6 -
Karnali (39%).
Maternal health is a priority programme of the Ministry of Health and Population (MOHP) and aims to reach
the Sustainable Development Goals target of 70 maternal deaths per 100,000 live births by 2030 (1). Despite
the progress in maternal health on an average, the country is still facing widespread challenges, particularly
inequitable access and use of maternal health services resulting from financial, socio-cultural, and
geographical barriers (3). The ongoing policy and programme reviews in the health sector show that the status
quo strives to improve access to health services among under reached population - poorer, those with less
education and those living in remote areas - using the undifferentiated approach of service delivery. Empirical
findings from different national data sources still raise concerns over unequal utilisation of services. A
previous study concluded that to increase equitable use of maternal health services in Nepal, there is a need to
strengthen the health system to increase access to and utilisation of services among poorer women, those
with less education and those living in remote areas (4).
Equity is one of the basic principles of primary health care approach (7) and features implicitly or explicitly in
health-related progress and achievements (8). Although debatable, inequity in health is often defined as the
N
From a review of existing literature, it is evident that educational
status, wealth, geography, area of residence, age, parity,
caste/ethnicity and women’s autonomy are important factors that
influence the access and utilisation of maternal health care services
(Refer Box 1)

2
“differences which are unnecessary and avoidable, but in addition, are also considered unfair and unjust” (9;
10). Others do argue that health inequities cannot be recognized by formulation of irrefutable criteria and
what is viewed as unjust or unfair may depend on subjective values, political ideologies or normative
considerations (11). Some even say that emphasizing on income disparities and pro-poor policies only are
superficial solutions that ignore the underlying structural factors within the inequity dynamics in a given
context. (12). The health care system needs to have equity of access regardless of a client’s background. This
means that health care is easily accessible when needed and equitably distributed amongst the population.
Gender, education, occupation, income, ethnicity, and place of residence are all closely linked to people’s
access to, experiences of, and benefits from health care. In this report, analysis of the secondary data by
social, economic or geographical factors to help identify vulnerable populations and target health
interventions is considered as health equity analysis.
Thus, to reduce inequities in utilisation of maternal health services in Nepal, it is essential to explore and
examine the levels and trend of disparities in availability and utilisation of maternal health services. The
DFID/Nepal Health Sector Support Programme (NHSSP) together with Policy, Planning and Monitoring
Division, within the MOHP and Integrated Health Information Management Section, Department of Health
Services, analyzed the existing data on availability and utilisation of maternal health services from Nepal
Health Facility Survey 2015, Nepal Demographic and Health Surveys and Health Management Information
System. This report highlights equity gaps to inform programme managers and policy makers to make
evidence-based decisions to address the gaps and feed the planning processes at different levels. Such
monitoring of equity gaps in health service utilisation will be useful for policy-making and those involved in
the allocation of scarce health sector resources. This will also help provide momentum to leaving no one
Box 1. What the literature says:
A study in Tazakistan reported having a residence in rural areas, lower educational status and
belonging to the poorest quintile as the factors that decreased the likelihood of utilising ANC and
delivery services (18). There was significant use inequity by asset quintile, education, the area of
residence, and region in maternal health care in Indonesia. Older age and lower parity were positively
correlated with service utilisation (19). Analysis of data from four demographic and health surveys
indicated that the most significant determinants of inequality in maternal health use were maternal
education and wealth index. Women from the poorest wealth quintile and those with no formal
education were the most disadvantaged group in terms of their use of maternal health services in
Nepal regardless of age, place of residence (rural-urban), ecological zone (mountain, hill and Terai), or
caste/ethnicity (20). The poor, regardless of caste, are the most disadvantaged group in relation to
maternal health services in Gujarat, India. In addition to poverty, social class measured as caste in India
was also an important structural determinant of unequal use of maternal health services (21).
An analysis of the 2011 Ethiopian Demographic and Health Survey results showed that access and
utilisation of maternal service is less in women with lower education, women from rural areas and
women with low autonomy (22). Analysis of health service access and health status in a National
Household Survey of South Africa showed that women with lower education, women from rural areas
and women from lower quintile had lowest ANC coverage thus resulting in inequalities in utilisation of
maternal service (23). A study from Bangladesh indicated that wealthier and more educated mothers
utilized services to a greater extent than socioeconomically disadvantaged women; and women living
in urban areas utilized more maternal health services than those in rural areas (24). Likewise, a study
carried out in India showed that the factors with the largest contribution to utilisation of ANC services
were rich economic status of women, higher education, and residence in a rural area (25).

3
behind efforts.
1.1 Objective
The key objective of this analysis is to track progress on health outcomes revealing differences between sub-
groups that overall averages may mask. The specific objectives are to assess the levels and trends of
inequalities in availability and utilisation of maternal health services in Nepal and generate the evidence that is
not readily made available by the routine information systems and periodic survey reports, through an analysis
of secondary data. This analysis will be useful for policy-making. It will provide necessary evidence for the
allocation of scarce health sector resources to help address 'universal health coverage' and 'leaving no-one behind'.
The objective of this analysis is to assess the levels and trends of
inequalities in availability and utilisation of maternal health
services in Nepal using selected indicators

4
2. Methods
2.1 Indicator selection and sources of data
Inequalities were assessed using two major perspectives: 1. Maternal health service availability and 2. Maternal
health service utilisation. In this analysis, service availability denotes that services were physically accessible
and could be potentially utilized as required (13). While, utilisation was defined as the use of services as an
outcome of service availability. This analysis focused on selected indicators (Table 1) to analyze the
inequalities in availability and utilisation of maternal health services. These indicators were determined after
discussion with MOHP officials.
Table 1. List of indicators selected to assess inequality in availability and utilisation of maternal health services in Nepal
SN Indicators Data sources Disaggregation Measures 1 % of health facilities that offer antenatal
care, normal vaginal delivery and cesarean delivery service
NHFS Ecological zone, managing authority and provinces
Availability
2 % of health facilities with service readiness for ANC service among facilities that offer ANC services
NHFS Ecological zone, managing authority and provinces
Readiness
3 % of health facilities with service readiness for delivery service among facilities that offer ANC services
NHFS Ecological zone, managing authority and provinces
Readiness
4 % of pregnant women who had first antenatal care checkup as per protocol (4th month)
HMIS Ecological zone, districts and provinces
Utilisation
5 % of pregnant women who had four antenatal care checkups as per protocol (4
th, 6
th, 8
th and 9
th month)
HMIS Ecological zone, districts and provinces
Utilisation
6 % of institutional deliveries
HMIS Ecological zone, districts and province
Utilisation
% of live births in the five (or three) years preceding the survey delivered at a health facility
NDHS Wealth quintile and caste/ethnicity groups
Utilisation
7 % of live births in the five (or three) years preceding the survey delivered by caesarean section
NDHS Wealth quintile and caste/ethnicity groups
Utilisation
8 % of postpartum women who received a PNC checkup within 24 hours of delivery
HMIS Ecological zone, districts and provinces
Utilisation
9 % of women who had three post-natal checkup as per protocol (1
st within 24
hours, 2nd within 72 hours and 3rd within 7 days of delivery)
HMIS Ecological zone, districts and provinces
Utilisation
10 % of women who had a live birth in the five (or three) years preceding the survey who had 4+ antenatal care visits
NDHS Wealth quintile and caste/ethnicity groups
Utilisation

5
Nepal Health Facility Survey (NHFS) 2015, Health Management Information System (HMIS) raw data sets of
last three fiscal years (2014/15, 15/16 and 16/17) and Nepal Demographic and Health Survey (NDHS) data
(1996 to 2016) were used for this analysis (Table 1). HMIS data was used to analyze the annual levels and
trends of inequalities in utilisation of maternal health services. Similarly, NHFS data was used to analyze
inequalities in availability and readiness of maternal health services. Long term trends in inequalities were
examined using the NDHS series data. Using the wealth index information available in NDHS dataset the
household economic disparities in the selected indicators were also analyzed.
In addition to analyses of raw data, in certain tables, values from the published reports of these data sources
(indicated in table source where needed) have been used. Values calculated from analysis were cross-checked
with published figures where necessary. A number of suspected data quality related problems have been
noticed during the analysis of HMIS data. These include – underestimated expected live births, inconsistency
in trends of reported values and unavailability of data for certain districts.
2.2 Data Analysis
One absolute indicator of inequality was calculated – the difference between the top and bottom performing
category in each of the disaggregation available and their trends. Two relative inequality indicators were also
calculated – the ratio of the selected outcome (indicator) in the topmost category to the bottommost
category, their trends; and the concentration index (their trends) where household wealth information was
available. The differences between disaggregation categories was used to determine inequitable distribution
and utilisation of the services from socio-economic positon – wealth quintile, caste/ethnicity composition
and geographical position – ecological zone, district and provinces. All analyses were conducted using Stata
15 and MS-Excel© 2016. To obtain prevalence values from the NDHS and NHFS data, weights were applied
with svy command in Stata. Data source specific analysis and disaggregation are described below:
HMIS: Absolute and relative indicators of inequality and their annual trends were calculated to analyze the
inequalities in utilisation of maternal health services. HMIS data were disaggregated by ecological zone
(mountain, hill and Terai), districts and provinces to identify the top and bottom performers.
NDHS: The concentration index was used to capture inequality across all wealth quintiles. The
concentration index is expressed in a scale ranging from -1 to 1; a value of zero represents perfect equality,
whereas a value of 1 to -1 indicates that only the richest or the poorest households bear the burden.
NDHS data were disaggregated by wealth and caste/ethnicity groups to identify the top and bottom
performers. Subsequently, absolute and relative indicators of inequality and their trends were calculated.
NHFS: NHFS data were disaggregated by ecological zone, provinces and managing authority to identify
the top and bottom performers. Subsequently, absolute and relative indicators of inequality were
calculated. ANC service readiness was measured by constructing a separate variable based on the domains
of ANC service readiness identified in WHO reference manual (14). For this analysis, readiness was
defined as the availability of: 1) service delivery guideline and job-aid; 2) equipment; 3) availability of
diagnostic [hemoglobin and urine dipstick-protein] tests; and 4) medicine and commodities. Equal scores
(100/4) were assigned for each domain. Each domain consisted of dichotomized components e.g. domain
1 has two components – i. Availability of guideline (Yes/No) and ii. Availability of job aid (Yes/No). A
composite score was then calculated using total scores of all four domains of service readiness. The
calculated composite scores were then categorized into two groups – with readiness, and without readiness
using the ‘xtile’ stata command. Similarly, based on the WHO reference manual (14), PNC service

6
readiness was measured using three different domains: 1) staff and training; 2) equipment; and 3)
medicines and commodities; and scores were calculated as described above.
2.3 Limitations
When interpreting the results of this analysis, some limitations will need to be considered. This analysis
mainly focused on inequalities in maternal health services using available secondary data sources, namely,
NDHS 1996-2016, NHFS 2015 and DOHS Annual Report 2014-2016. The datasets were analyzed separately,
which limited us in the use of additional statistical analyses using a single model; however, since it was not the
objective to begin with, we are confident that even in its present state, this analysis is able to show inequalities
using different dimensions and makes use of all available sources of information; thus, also contributing to
the use of data for policy dialogue.
In this report, inequality simply refers to the uneven distribution
of health services or health resources as a result of several factors
while inequity refers to unfair, avoidable differences arising
usually from poor governance or cultural exclusion. Thus, in this
report, wherever measurements are explained, the term
equality/inequality is used but in places where there are
implications to be discussed, the term equity/inequity is used to
bring supply side justice and fairness to the forefront.
7
3. Results
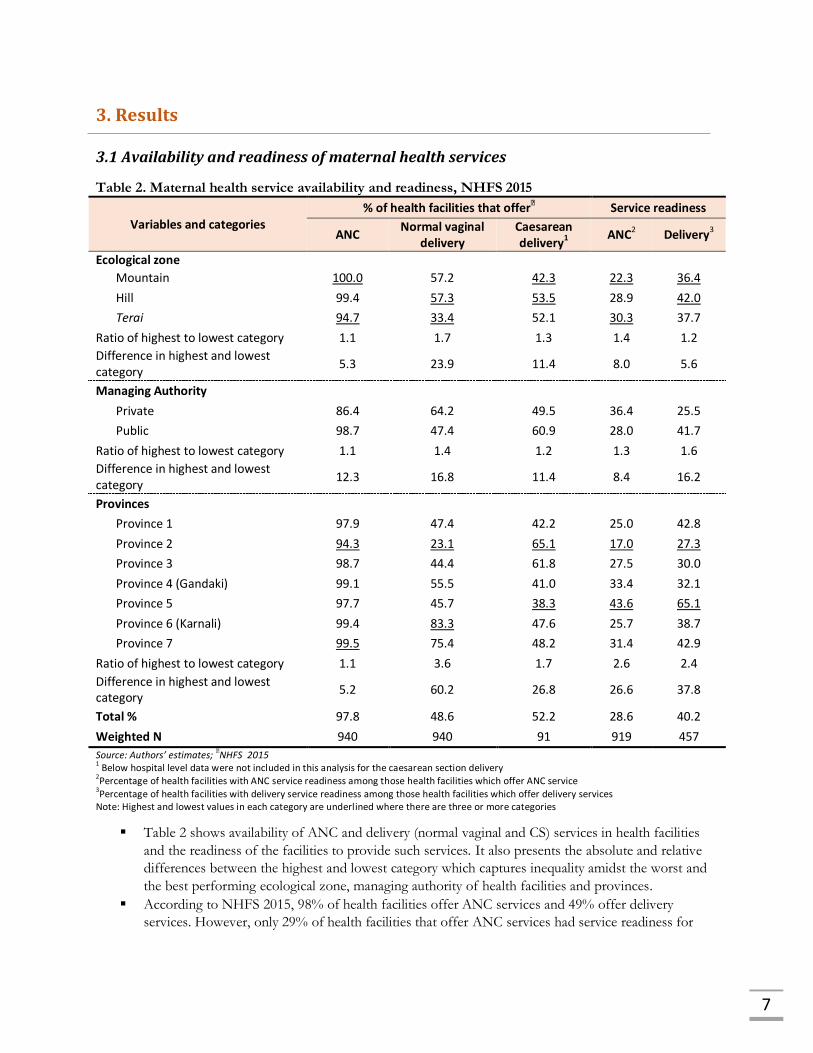
3.1 Availability and readiness of maternal health services
Table 2. Maternal health service availability and readiness, NHFS 2015
Variables and categories % of health facilities that offer
ꝉ Service readiness
ANC Normal vaginal
delivery Caesarean delivery1
ANC2 Delivery3
Ecological zone
Mountain 100.0 57.2 42.3 22.3 36.4
Hill 99.4 57.3 53.5 28.9 42.0
Terai 94.7 33.4 52.1 30.3 37.7
Ratio of highest to lowest category 1.1 1.7 1.3 1.4 1.2
Difference in highest and lowest category
5.3 23.9 11.4 8.0 5.6
Managing Authority
Private 86.4 64.2 49.5 36.4 25.5
Public 98.7 47.4 60.9 28.0 41.7
Ratio of highest to lowest category 1.1 1.4 1.2 1.3 1.6
Difference in highest and lowest category
12.3 16.8 11.4 8.4 16.2
Provinces
Province 1 97.9 47.4 42.2 25.0 42.8
Province 2 94.3 23.1 65.1 17.0 27.3
Province 3 98.7 44.4 61.8 27.5 30.0
Province 4 (Gandaki) 99.1 55.5 41.0 33.4 32.1
Province 5 97.7 45.7 38.3 43.6 65.1
Province 6 (Karnali) 99.4 83.3 47.6 25.7 38.7
Province 7 99.5 75.4 48.2 31.4 42.9
Ratio of highest to lowest category 1.1 3.6 1.7 2.6 2.4
Difference in highest and lowest category
5.2 60.2 26.8 26.6 37.8
Total % 97.8 48.6 52.2 28.6 40.2
Weighted N 940 940 91 919 457
Source: Authors’ estimates; ꝉNHFS 2015
1 Below hospital level data were not included in this analysis for the caesarean section delivery
2Percentage of health facilities with ANC service readiness among those health facilities which offer ANC service
3Percentage of health facilities with delivery service readiness among those health facilities which offer delivery services
Note: Highest and lowest values in each category are underlined where there are three or more categories
Table 2 shows availability of ANC and delivery (normal vaginal and CS) services in health facilities
and the readiness of the facilities to provide such services. It also presents the absolute and relative
differences between the highest and lowest category which captures inequality amidst the worst and
the best performing ecological zone, managing authority of health facilities and provinces.
According to NHFS 2015, 98% of health facilities offer ANC services and 49% offer delivery
services. However, only 29% of health facilities that offer ANC services had service readiness for

8
ANC service while only 40% of health facilities that offer delivery services had service readiness for
delivery services. Considering ecological zone, service readiness for both ANC (22%) and delivery (36%) services was
lowest in mountain region. The absolute difference in percentage points (PP) between the highest
and the lowest category was 8 PP for ANC and 5.6 PP for delivery services.
A higher percentage (99%) of public facilities offer ANC services. Sixty-four percent private hospitals
and 47% public health facilities offered normal vaginal delivery. Caesarean delivery services were
offered more by public hospitals (61% public and 50% private). Service readiness is higher in private
facilities for ANC while lower for delivery. However, it should be noted that all private facilities
assessed in NHFS were hospitals whereas most facilities in public sector were health posts and
results may not be comparable.
Service readiness for both ANC and delivery services was higher in Province 5 and lower in Province
2. An absolute difference of 27 PP for ANC services and 38 PP for delivery services was found. The
relative differences were comparable at 2.6 and 2.4 respectively.
3.2 Annual levels and trends of inequalities in utilisation of maternal health services (FY 2014/15 to 2016/17)
Table 3 shows the trends and patterns in utilization of maternal health service during antenatal,
delivery and postnatal period. It also presents the absolute and relative differences between the
highest and lowest category which captures inequality amidst the worst and the best performing
ecological zone, districts and provinces for aforementioned utilisation of maternal health services.
The table shows three year trends for each indicator – FY 2014/15 to FY 2016/17.
In all years considered for analysis, health facilities in mountain region reported least utilisation of
antenatal and delivery services. However, for postnatal services, utilisation is lowest in the hills.
Province 2 is consistently performing poorly utilisation of both ANC and delivery services.
In the past three years, remarkable changes were not seen in trend of women who visited a health
facility for ANC service at least at four months of pregnancy and those who continued to utilize the
services as per protocol (visits at fourth, sixth, eighth and ninth month). The situation is similar in
delivery as well as post-natal care.
Proportion of women who delivered at a health facility is higher than women who completed all four
ANC checkups as per protocol. Women who did not visit the health facility for ANC services may
also have delivered in health facilities.
Ten percent of women who delivered at health facilities did not receive PNC checkup within 24
hours of delivery in the last fiscal year (2016/17). And out of those who received PNC checkup
within 24 hours of delivery, around two third women failed to complete all postnatal checkups as per
protocol (24 hours, 72 hours and seventh day of delivery).
Disaggregated details about the trend and patterns in inequalities are presented in Annex I
I.

9
Table 3. Trends and patterns of inequalities in utilisation of maternal health services: antenatal, delivery and postnatal care services, HMIS 2014/15 – 2016/17
Variables and categories
First ANC visit as per protocol (%)
Four ANC checkups as per protocol (%)
Institutional deliveries (%)
PNC checkup within 24 hours of delivery (%)
Three PNC checkup as per protocol (%)
2016
/17
2015
/16
2014
/15
2016
/17
2015
/16
2014
/15
2016
/17
2015
/16
2014
/15
2016
/17
2015
/16
2014
/15
2016
/17
2015
/16
2014
/15
Ecological zone
Mountain 63.3 62.5 59.1 43.2 40.1 39.4 48.2 47.3 40.9 46.4 47.9 43.8 20.2 19.3 17.2
Hill 74.7 66.6 77.0 60.4 53.0 54.0 54.5 51.1 52.9 51.5 47.4 43.6 16.2 14.7 16.6
Terai 66.5 70.1 70.6 47.7 51.6 51.9 55.4 59.6 52.7 51.5 61.3 52.0 21.4 21.4 23.1
Ratio of highest to lowest category 1.2 1.1 1.3 1.4 1.3 1.4 1.2 1.3 1.3 1.1 1.3 1.2 1.3 1.5 1.4
Difference in highest and lowest category
11.4 7.6 17.9 17.2 12.9 14.6 7.3 12.2 12.0 5.1 13.9 8.4 5.1 6.7 6.5
Districts*
Lowest value 20.7 19.7 32.2 14.5 7.0 7.9 12.0 6.2 6.0 12.8 14.8 3.6 1.7 0.2 0.0
Highest value 129.0 160.5 127.3 109.6 116.0 99.2 126.7 121.2 128.0 105.0 129.0 125.5 52.7 69.9 76.8
Ratio of highest to lowest category 6.2 8.1 4.0 7.6 16.6 12.6 10.6 19.5 21.3 8.2 8.7 34.9 31.0 349.5 na
Difference in highest and lowest category
108.3 140.8 95.1 95.1 109 91.3 114.7 115 122 92.2 114.2 121.9 51 69.7 76.8
Provinces
Province 1 62.7 62.3 67.8 44.1 58.0 47.5 49.1 58.1 51.1 42.0 56.1 51.3 8.9 24.7 16.2
Province 2 57.9 60.5 63.2 37.3 40.7 42.3 43.9 39.7 24.7 43.7 43.3 34.4 22.9 20.1 22.3
Province 3 78.0 71.1 80.0 68.0 48.4 51.3 52.8 54.3 58.4 47.6 51.3 27.5 13.4 10.7 18.3
Province 4 (Gandaki) 75.1 72.1 75.7 58.8 61.8 61.9 45.8 52.2 55.4 42.9 47.1 53.9 13.6 13.3 19.7
Province 5 76.1 75.0 80.9 58.0 55.8 65.1 69.4 63.1 66.5 65.3 63.6 67.2 25.0 16.7 18.7
Province 6 (Karnali) 70.1 70.3 67.9 48.9 46.8 43.3 60.0 60.5 55.2 59.1 59.9 55.7 20.3 20.7 19.7
Province 7 72.3 70.1 70.2 55.2 54.5 54.8 67.8 67.4 66.2 67.4 67.0 65.0 34.8 26.3 26.7
Ratio of highest to lowest category 1.3 1.2 1.3 1.8 1.5 1.5 1.6 1.7 2.7 1.6 1.5 2.4 3.9 2.5 1.6
Difference in highest and lowest category
20.1 14.6 17.7 30.7 21.1 22.8 25.6 27.7 41.9 25.4 23.7 39.7 25.9 15.6 10.5
Total % 69.8 68.1 72.5 52.8 51.4 51.9 54.6 55.1 51.9 51.2 54.5 47.9 19.1 18.4 19.9 *Detail disaggregation in the annex I; Note: Highest and lowest values in each category, in a particular year are underlined where there are three or more categories.

10
3.2 Long term levels and trends in inequality (1996 to 2016)
Table 4. Wealth quintile specific trends and estimates for four or more ANC check-ups in 1996, 2001, 2006, 2011 and 2016
Categories Four or more ANC check-ups
Absolute increase (percent points)
Average increase per year
Total increase
1996 2001 2006 2011 2016 1996-2016 1996-2016
First quintile (poorest) 2.7 4.7 10.5 28.3 56.7 2.7 54.0
Second quintile 4.7 4.9 20.1 39.1 65.4 3.0 60.7
Third quintile 5.8 11.9 27.6 48 66.8 3.0 61.0
Fourth quintile 9.6 16.7 38 65.1 74.7 3.3 65.1
Fifth quintile (richest) 30.8 44.1 60.3 83.7 87.4 2.8 56.6
Total* 9.1 14.3 29.4 50.1 69.4 3.0 60.3
Ratio of fifth to first quintile 11.4 9.4 5.7 3.0 1.5
Difference in fifth and first quintile 28.1 39.4 49.8 55.4 30.8
Concentration index 0.491 0.465 0.323 0.218 0.083
Standard error of concentration index 0.059 0.034 0.023 0.012 0.008
Weighted N 4,254 4,736 4,065 4,148 3,998
Source: Authors’ estimates; *NFHS 1996, NDHS 2001-2016 reports
Note: Data for 1996 are estimated three years preceding the survey; for other years, data are estimated in the five years preceding the survey
Table 4 shows the wealth quintile specific trends and estimates for four or more ANC check-ups. It
also presents the absolute and relative differences between the first and fifth quintile which captures
inequality amidst the poorest and the richest groups. Furthermore, it calculates the concentration
index which captures inequality across all wealth groups. The absolute increase in four or more ANC
check-ups is also reflected in the table in PP. This takes into account the estimates in 1996 and 2016
to show a total increase and corresponding average increase per year.
The total proportion of women utilizing four of more ANC check-ups has steadily increased, from
9% in 1996 to 69% in 2016. Quintile specific estimates are also in an increasing trend but estimates
are larger in fifth quintile (richest) compared to first quintile (poorest) showing greater utilisation
among the well off. Between 1996 and 2016, the average increase in utilisation per year was lowest in
first quintile at 2.7 PP, while it was highest in fourth quintile at 3.3 PP. The corresponding total
increase in these quintiles were 54 PP and 65 PP, respectively.
The absolute difference (Q5-Q1) in utilisation has increased from 28 PP in 1996 to 55 PP in 2011;
but then decreased to 31 PP in 2016. Although the absolute difference has increased overtime,
estimates of relative difference (Q5/Q1) show decreasing disparity – the ratio of 11.4 in 1996 has
decreased to 1.5 in 2016. It should be noted that these estimates are based only on richest vs poorest
groups.
Unlike absolute and relative difference, the concentration index takes into account disparity across all
wealth groups. It decreased from 0.491 in 1996 to 0.083 in 2016 (also shown in Figure 2). The
positive values indicate that the utilisation of four or more ANC check-ups is disproportionately
concentrated in richer households. However, the values are decreasing overtime, which shows that
inequality has declined over the years. A concentration index value of zero would mean absence of
inequality.

11
Table 5. Caste/ethnicity specific trends and estimates for four or more ANC check-ups in 1996, 2001, 2006, 2011 and 2016
Categories Four or more ANC check-ups
Absolute increase (percent points)
Average increase per year
Total increase
1996 2001 2006 2011 2016 1996-2016 1996-2016
Dalit 4.4 10.2 21.5 39.9 62.2 2.9 57.8
Janajati 5.2 10.4 26.2 46.4 69.7 3.2 64.5
Other Terai caste 6.8 8.9 16.2 35.9 58.8 2.6 52.0
Muslim 2.6 9.1 17.8 34.8 52.5 2.5 49.9
Newar 32.9 41.3 57.2 82.8 79.9 2.4 47.0
Brahmin/Chhetri 14.3 20.7 40.3 63.5 81.1 3.3 66.8
Ratio of highest to lowest category
12.7 4.6 3.5 2.4 1.5
Difference in highest and lowest category
30.3 32.4 41.0 48.0 28.6
Weighted N 4,254 4,736 4,065 4,148 3,998
Source: Authors’ estimates Note: Highest and lowest values in each category, in a particular year are underlined where there are three or more categories. Data for 1996 are estimated three years preceding the survey; for other years, data are estimated five years preceding the survey
Table 5 shows the trends and estimates for four or more ANC check-ups distributed by categories of
caste and ethnicity. It also presents the absolute and relative differences between the highest and
lowest category which captures inequality amidst the worst and the best performing caste/ethnicity
groups. The absolute increase in four or more ANC check-ups is also reflected in the table in PP. It
takes into account estimates in 1996 and 2016 to show total increase and corresponding average
increase per year.
Caste/ethnicity specific estimates of four or more ANC check-ups are in increasing trend and
estimates in general are larger in Newar compared to other caste/ethnicity groups showing greater
utilisation among Newar. Between 1996 and 2016, the average increase in utilisation per year was
lowest in Newar at 2.4 PP, while it was highest in Brahmin/Chhetri at 3.3 PP. Likewise, the
corresponding total increase was highest in Brahmin/Chhetri (67 PP) and lowest in Newar (47 PP). In
1996, Newar already had a high percentage of utilisation compared to Brahmin/Chhetri, a possible
reason why the total and average increase were lower among them. An interesting trend to take note
is the consistent increase in utilization among other Terai caste/ethnicity groups over the years. The absolute difference (highest category – lowest category) in utilisation increased from 30 PP in
1996 to 48 PP in 2011; but then decreased to 29 PP in 2016. Estimates of relative difference (highest
category/lowest category) show decreasing disparity – the ratio of 12.7 in 1996 has decreased to 1.5
in 2016. It should be noted that these estimates are based only on categories with highest vs lowest
values.

12
Table 6. Wealth quintile specific trends and estimates for delivery in a health facility in 1996, 2001, 2006, 2011 and 2016
Categories Delivery in a health facility
Absolute increase (percent points)
Average increase per year
Total increase
1996 2001 2006 2011 2016 1996-2016 1996-2016
First quintile (poorest) 1.7 2.3 4.3 11.4 33.9 1.6 32.2
Second quintile 3.5 3.0 9.3 23.3 46.6 2.2 43.1
Third quintile 4.8 5.5 11.9 35.4 57.6 2.6 52.8
Fourth quintile 6.2 9.0 21.7 51.9 69.5 3.2 63.3
Fifth quintile (richest) 29.9 36.5 55.0 77.9 89.6 3.0 59.7
Total* 7.6 9.1 17.7 35.3 57.4 2.5 49.8
Ratio of fifth to first quintile 17.2 15.6 12.7 6.8 2.6 Difference in fifth and first quintile 28.2 34.2 50.7 66.5 55.6 Concentration index 0.551 0.558 0.481 0.349 0.186 Standard error of concentration index 0.070 0.048 0.030 0.015 0.011 Weighted N 4,373 6,972 5,545 5,391 5,060
Source: Authors’ estimates; *NFHS 1996, NDHS 2001-2016 reports
Note: Data for 1996 are estimated three years preceding the survey; for other years, data are estimated five years preceding the survey
Table 6 shows the wealth quintile specific trends and estimates for delivery in a health facility
(institutional deliveries). It also presents the absolute and relative differences between the first and
fifth quintile which captures inequality amidst the poorest and the richest groups. Furthermore, it
calculates the concentration index which captures inequality across all wealth groups. The absolute
increase in deliveries in a health facility is also reflected in the table in PP. This takes into account
estimates in 1996 and 2016 to show total increase and corresponding average increase per year.
Trends in the total proportion of women utilizing service for delivering in a health facility show
minimal increase from 1996 to 2001. Thereafter, the increase is remarkable, from 9% in 2001 to 57%
in 2016. Quintile specific estimates are also in increasing trend but estimates are larger in fifth quintile
(richest) compared to first quintile (poorest) showing greater utilisation among the well off. Between
1996 and 2016, the average increase in utilisation per year was lowest in first quintile at 1.6 PP, while
it was highest in fourth quintile at 3.2 PP. The corresponding total increase in these quintiles were 32
PP and 63 PP respectively.
The absolute difference (Q5-Q1) in utilisation has increased from 28 PP in 1996 to 67 PP in 2011;
but then decreased to 56 PP in 2016. Although the absolute difference has increased overtime,
estimates of relative difference (Q5/Q1) show decreasing disparity – the ratio of 17.2 in 1996 has
decreased to 2.6 in 2016. It should be noted that these estimates are based only on richest vs poorest
groups.
Unlike absolute and relative difference, the concentration index takes into account disparity across all
wealth groups. It decreased from 0.551 in 1996 to 0.186 in 2016 (also shown in Figure 2). The
positive values indicate that the utilisation of institutional deliveries is disproportionately
concentrated in richer households. However, the values are decreasing overtime, which shows that
inequality has declined over the years. A concentration index value of zero would mean absence of
inequality.

13
Table 7. Caste/ethnicity specific trends and estimates for delivery in a health facility in 1996, 2001, 2006, 2011 and 2016
Categories Delivery in a health facility
Absolute increase (percent points)
Average increase per year
Total increase
1996 2001 2006 2011 2016 1996-2016 1996-2016
Dalit 4.9 5.7 9.3 26.4 45.4 2.0 40.5
Janajati 4.4 6.2 14.2 28.9 57.9 2.7 53.5
Other Terai caste 6.4 6.8 15.2 37.9 48.1 2.1 41.7
Muslim 4.4 6.3 12.2 32.3 51.6 2.4 47.2
Newar 29.0 28.0 47.9 68.0 74.6 2.3 45.6
Brahmin/Chhetri 10.6 13.0 24 44.1 68.4 2.9 57.8
Ratio of highest to lowest category 6.6 4.9 5.2 2.6 1.6
Difference in highest and lowest category
24.6 22.3 38.6 41.6 29.2
Weighted N 4,373 6,972 5,545 5,391 5,060
Source: Authors’ estimates Note: Highest and lowest values in each category, in a particular year are underlined where there are three or more categories. Data for 1996 are estimated three years preceding the survey; for other years, data are estimated five years preceding the survey
Table 7 shows the trends and estimates for deliveries in a health facility (institutional deliveries)
distributed by categories of caste and ethnicity. It also presents the absolute and relative differences
between the highest and lowest category which captures inequality amidst the worst and the best
performing caste/ethnicity groups. The absolute increase in institutional deliveries is also reflected in
the table in PP. It takes into account estimates in 1996 and 2016 to show total increase and
corresponding average increase per year.
Caste/ethnicity specific estimates of institutional deliveries are in increasing trend and estimates are
larger in Newar in all survey years compared to other caste/ethnicity groups showing greater
utilisation among Newar. Except in 1996, estimates are lowest in Dalit. Between 1996 and 2016, the
average increase in utilisation per year was lowest in Dalit at two PP, while it was highest in
Brahmin/Chhetri at 2.9 PP. Likewise, the corresponding total increase was highest in Brahmin/Chhetri
(58 PP) and lowest in Dalit (41 PP). In 1996, Newar already had a high percentage of utilisation
compared to Brahmin/Chhetri, a possible reason why the total and average increase were lower among
them. The trend in absolute difference (highest category – lowest category) in utilisation of institutional
deliveries is not consistent. It decreased slightly from 1996 to 2001 but increased from 2001 to 2011.
In 2011, the absolute difference was 42 PP but it decreased to 29 PP in 2016. Estimates of relative
difference (highest category/lowest category) also show inconsistent trend. However, from 2006 to
2016 it decreased from 5.2 to 1.6. It shows that the disparity has decreased during this period
between these groups. It should be noted that these estimates are based only on categories with
highest vs lowest values.

14
Table 8. Wealth quintile specific trends and estimates for deliveries by caesarean section in 1996, 2001, 2006, 2011 and 2016
Deliveries by caesarean section
Absolute increase (percent points)
Average increase per year
Total increase
1996 2001 2006 2011 2016 1996-2016 1996-2016
First quintile (poorest) 0.1 0.2 0.8 1.0 2.4 0.1 2.3
Second quintile 0.6 0.3 0.5 0.8 4.2 0.2 3.6
Third quintile 0.8 0.2 1.0 4.6 6.8 0.3 6.1
Fourth quintile 1.2 1.1 2.0 7.1 9.4 0.4 8.2
Fifth quintile (richest) 3.2 3.6 11.9 14.1 28.2 1.3 25.0
Total 1.0 0.8 2.7 4.6 9 0.4 8.0
Ratio of fifth to first quintile 22.9 23.4 14.9 14.5 11.7 Difference in fifth and first quintile 3.1 3.5 11.1 13.2 25.8 Concentration index 0.526 0.621 0.621 0.541 0.442 Standard error of concentration index 0.124 0.128 0.102 0.061 0.043 Weighted N 4,349 6,977 5,545 5,391 5,060
Source: Authors’ estimates; *NFHS 1996, NDHS 2001-2016 reports
Note: Data for 1996 are estimated three years preceding the survey; for other years, data are estimated five years preceding the survey
Table 8 shows the wealth quintile specific trends and estimates for deliveries by caesarean section. It
also presents the absolute and relative differences between the first and fifth quintile which captures
inequality amidst the poorest and the richest groups. Furthermore, it calculates the concentration
index which captures inequality across all wealth groups. The absolute increase in deliveries by
caesarean section is also reflected in the table in PP. This takes into account estimates in 1996 and
2016 to show total increase and corresponding average increase per year.
Trends in the total proportion of women delivering by caesarean section has almost doubled from
5% in 2011 to 9% in 2016. Quintile specific estimates are also in increasing trend but estimates are
larger in fifth quintile (richest) compared to first quintile (poorest) showing greater utilisation among
the well off. Between 1996 and 2016, the average increase in utilisation per year was lowest in first
quintile at 0.1 PP, while it was highest in fifth quintile at 1.3 PP. The corresponding total increase in
these quintiles were two PP and 25 PP respectively.
The absolute difference (Q5-Q1) in utilisation has increased from three PP in 1996 to 26 PP in 2016.
In contrast, estimates of relative difference (Q5/Q1) show decreasing disparity – the ratio of 22.9 in
1996 has decreased to 11.7 in 2016. This indicates to the fact that in addition to richest groups,
deliveries by caesarean section is also increasing in poorest groups. It should be noted that these
estimates are based only on richest vs poorest groups.
Unlike absolute and relative difference, the concentration index takes into account disparity across all
wealth groups. It increased from 0.526 in 1996 to 0.621 in 2001 and 2006; then decreased to 0.442 in
2016 (also shown in Figure 2). The positive values indicate that the utilisation of caesarean section
deliveries is disproportionately concentrated in richer households. However, the values show
decreasing trend in the last decade, which shows that inequality has declined during this period. A
concentration index value of zero would mean absence of inequality.

15
Table 9. Caste/ethnicity specific trends and estimates for deliveries by caesarean section in 1996, 2001, 2006, 2011 and 2016
Deliveries by caesarean section
Absolute increase (percent points)
Average increase per year
Total increase
1996 2001 2006 2011 2016 1996-2016 1996-2016
Dalit 0.8 0.1 1.1 2.1 5.4 0.2 4.7
Janajati 0.8 0.6 2.0 3.0 8.1 0.4 7.3
Other Terai caste 1.5 0.9 2.1 6.0 7.1 0.3 5.6
Muslim 0.0 0.0 1.0 3.2 5.0 0.2 5.0
Newar 4.0 4.9 5.9 7.8 26.8 1.1 22.8
Brahmin/Chhetri 0.9 1.0 4.5 7.3 11.3 0.5 10.4 Ratio of highest to lowest category
6.0 3.7 5.4
Difference in highest and lowest category 4.0 4.9 5.0 5.7 21.8
Weighted N 4,373 6,977 5,545 5,391 5,060
Source: Authors’ estimates Note: Highest and lowest values in each category, in a particular year are underlined where there are three or more categories. Data for 1996 are estimated three years preceding the survey; for other years, data are estimated five years preceding the survey
Table 9 shows the trends and estimates for deliveries by caesarean section distributed by categories
of caste and ethnicity. It also presents the absolute and relative differences between the highest and
lowest category which captures inequality amidst the worst and the best performing caste/ethnicity
groups. The absolute increase in deliveries by caesarean section is also reflected in the table in PP. It
takes into account estimates in 1996 and 2016 to show total increase and corresponding average
increase per year.
Caste/ethnicity specific estimates of deliveries by caesarean section are in increasing trend and
estimates are larger in Newar in all survey years compared to other caste/ethnicity groups showing
greater utilisation among Newar. Except in 2011, estimates are lowest in Muslim. Between 1996 and
2016, the average increase in utilisation per year was lowest in Dalit and Muslim at 0.2 PP, while it
was highest in Newar at 1.1 PP. Likewise, the corresponding total increase was highest in Newar (23
PP) and lowest in Dalit and Muslim (5 PP). The trend in absolute difference (highest category – lowest category) in utilisation of caesarean
section deliveries increased remarkably from six PP in 2011 to 22 PP in 2016. Estimates of relative
difference (highest category/lowest category) show inconsistent trend. It decreased from 2006 to
2011, but increased from 3.7 in 2011 to 5.4 to 2016. It shows that the disparity has increased during
this period between these groups. It should be noted that these estimates are based only on
categories with highest vs lowest values.

16
Figure 1. Trend in concentration index of maternal service utilisation indicators.
0.491 0.465
0.323
0.218
0.083
0.551
0.558
0.481
0.349
0.186
0.526
0.621 0.621
0.541
0.442
0.000
0.100
0.200
0.300
0.400
0.500
0.600
0.700
0.800
1996 2001 2006 2011 2016
Co
nce
ntr
atio
n In
dex
Four or more ANC check-ups Delivery in a health facility
Deliveries by caesarian section

17
4. Conclusions and Recommendations
Availability and readiness of maternal health services:
o When considering ecological zone, inequality is higher for availability of delivery services
than for ANC services. Compared to other regions, fewer health facilities in Terai offer
normal vaginal delivery services; while availability of caesarean delivery was lowest in the
mountain region. In contrast, service readiness for ANC services show higher inequality
compared to delivery services. Health facilities in the mountains are least ready to provide
both ANC and delivery services.
Recommendation 1: MOHP in coordination with the Province and Local Governments, should address
inequalities in the availability of ANC and delivery services. First, it is necessary to investigate the reasons
for underutilization of existing services, based on which, improvements in quality of existing services or
expansion of the services (making the services available) in the existing health facilities could be undertaken.
Expansion of ANC services could be made through outreach centers like community health units,
particularly in the mountain region to capture the geographically hard to reach population.
o In managing authority, there was remarkably high inequality between public and private
facilities in the availability of caesarean delivery. Similarly, inequality is higher for delivery
service readiness compared to ANC service readiness. A larger percentage of public facilities
show readiness to provide delivery services as opposed to private facilities.
Recommendation 2: Caesarean delivery is a life-saving component within safe motherhood services. To save
mothers’ lives from delivery related complications, it is necessary to first improve/strengthen existing facilities
that provide caesarean delivery services and secondly initiate such services in those government health facilities
where there is need and that are easily accessible by mothers. It is essential to monitor caesarean section
services particularly in private health facilities to ensure that services are provided when the pregnancy is
complicated and there is medical indication for caesarean delivery. However, the government health facilities
should also be routinely monitored for quality of caesarean section service delivery.
o Among provinces, there is a huge gap between Province 6 (Karnali) and Province 2 when it
comes to availability of normal vaginal delivery services. Inequality in readiness for delivery
services is higher than for readiness for ANC services. Province 5 showed highest readiness
for both ANC and delivery services while Province 2 fared worst.
Recommendation 3: In the federal context, the local governments should prioritise to improve the availability
and readiness of maternal health services in Province 2 and Province 6. The federal ministry should support
the local level to improve service readiness for ANC and delivery services to increase their status in line with
other provinces.

18
Annual levels and trends of inequalities in utilization of maternal health services (FY 2014/15 to
2016/17):
o When considering ecological zone, there was not any consistent trends in inequality.
However, when looking at data from past two years only, inequality has increased in
utilisation of ANC services; while that for PNC services has declined ever so slightly.
Women may be unable to travel during post-partum period due to cultural reason and there
is also the possibility that they may receive PNC at home.
Recommendation 4: Local governments should introduce interventions that facilitate equitable utilization to
reduce drop-out of mothers in maternal health services utilisation; while the federal government may provide
strategic guidance during this process.
o Similarly, among districts, consistent trends in inequality were not seen. However, when
considering data from past two years only, inequality has decreased in utilisation of ANC
services, while increased for delivery as well as PNC services. Data shows that Manang,
Terhathum and Dhanusha districts have least utilisation of maternal health services in the
last three years.
Recommendation 5: The federal ministry along with provincial and local authorities should focus on targeted
interventions in the low performing areas to reduce inequities in maternal health service utilisation. In
addition, it is also necessary to prioritize programme on maternal health in other areas that also report lower
utilisation. Further inquiry may be needed to explore the reasons for low utilization in underperforming areas
– such as poor recording and reporting, other programmatic reasons.
o Among provinces, inequality is increasing in utilisation of delivery services. Province 2 is
consistently performing poorly compared to others. Particularly in utilisation of postnatal
care services, performance of Province 1 and Province 3 is also concerning.
Recommendation 6: Utilisation of delivery services should be improved in Province 2, while targeted
interventions are needed in Province 1 and 3 to improve utilisation of postnatal services.
o Assessing utilization of maternal health service during antenatal, delivery and postnatal
period, a larger drop outs between first ANC visits and four ANC visits as per protocol was
revealed; similarly, between PNC checkups within 24 hours of delivery and three PNC
checkups as per protocol. First PNC in most cases is similar to institutional delivery, while
for the remaining PNC visits they will have to travel to the health facility during post-partum
period – where there may be cultural barriers.
Recommendation 7: The first point of contact with health system for most pregnant women is first ANC
visit; and is an important entry point not just for maternal health but also for other programmes. A high
coverage of ANC and repeated contacts between the woman and the health services offer many opportunities
for providing evidence-based interventions likely to affect maternal, fetal, and neonatal health and survival
(15). Thus, in order to continuously retain them during antenatal, delivery and postnatal period, the quality
of ANC service delivery particularly during the first visit must be ensured. Although beyond the scope of this
present analysis, the social, economic and cultural barriers in regions that have lower ANC utilisation should
be identified and addressed to improve access to ANC services. Supply factors such as budgeting, human
resource and capacity development of staff should also be considered. These considerations also pave way for
future research in to factors associated with low utilisation of maternal health services in regions that are

19
identified to be poor performers. Similar recommendation applies for PNC services as well – both removal of
access barriers and improvement in quality should be focused. It might also be equally important to sensitize
and clearly communicate with new mothers about the importance of PNC during their first PNC checkup;
that should at least in theory motivate them for all three visits. Additionally, a qualitative inquiry may be
helpful to explore the barriers.
Long term levels and trends in inequality (1996 to 2016):
o Utilisation of maternal health services in the long term is also determined by factors such as
household economic status that are beyond direct control of the health system. In terms of
wealth, from 1996 to 2016, although disproportionately concentrated in richer households,
the overall inequality as calculated by concentration indices show a decreasing trend in
utilisation of all maternal health services (4+ ANC, institutional delivery and delivery by
caesarean section). Quintile specific utilisation is increasing over time but there is a disparity
between the poorest and the richest group, with richest group showing higher utilisation.
Absolute disparity may show an increasing trend in the past two decades. This is not
unusual, because inequalities in most cases will be small when national coverage is either very
low (first decade) or very high (second decade). Relative inequality between the poorest and
richest groups is decreasing, in general and this is expected with increasing coverage. As
coverage among the poor increases, the absolute differences become similar which leads to
lower ratios or relative inequalities (e.g., the ratio between 100% and 90% coverage is 1.1,
whereas the ratio between 20% and 10% is equal to 2.0) (16).
The inverse equity hypothesis suggests that new health interventions are initially adopted by
the wealthy and thus increase inequalities—as population coverage increases, only the
poorest will lag behind all other groups (17). Similar to a study that analysed institutional
deliveries to test this hypothesis (16), this analysis revealed that absolute inequalities were
greatest when national coverage was around 50% as in the case with institutional deliveries.
At low national coverage levels, top inequality was evident with coverage in the wealthiest
quintile taking off rapidly as in caesarean section deliveries; at 60% or higher national
coverage, bottom inequality appears predominant, with the poorest quintile lagging behind
as in four or more ANC check-ups.
Recommendation 8: It is important to introduce and provide momentum to efforts that deliver an incentive for
the poor to utilize maternal health care services. The financial barriers to access should be reduced not only in
the public sector but also in the private sector. Catastrophic health expenditures should be minimized. Social
safety net programmes (including strengthening of existing conditional cash transfer programmes) are needed
that raise people out of poverty, and prevent poor from further destitution.
o Considering caste/ethnicity, utilisation of all maternal health services is increasing in trend.
Particularly from 2011 to 2016, utilisation has increased in all marginalized groups (Muslim,
Dalit and other Terai caste). However, there are disparities in utilisation between caste and
ethnic groups. In general, utilisation is higher in Newar and lower in Dalit, Muslim and Other
Terai caste group. The average increase in utilisation is higher in Brahmin/Chhetri. Such
inequalities are decreasing in utilisation of four or more ANC check-ups and institutional
deliveries in relative terms. But increasing in utilisation of delivery by caesarean section in
absolute terms.

20
Recommendation 9: In addition to reducing inequalities in wealth, maternal health programming should be
focused on most disadvantaged caste and ethnic groups which are susceptible to both under utilisation of
services and relative poverty to bring about improvements in inequality in utilisation indicators. With
increasing national coverage of maternal health services, it is time that interventions are now targeted to
address inequality in bottom performers that are being left behind. To achieve this, it is necessary to design
policies that address the inequality patterns.
The current levels and trends in equity gaps in maternal health
services shows that with increasing coverage of services, bottom
inequality prevails, leading to marginal exclusion of the
disadvantaged and most vulnerable groups. Barriers to access
should be identified and appropriate services should be targeted at
these groups. Policies should be tailored to inequality patterns.
21
References
1. National Planning Commission . Nepal Sustainable Development Goals Status and Roadmap: 2016-2030. Kathmandu : National Planning Commission, Government of Nepal , 2017.
2. Ministry of Health and Population. Nepal Health Sector Programme - Implementation Plan (NHSP-IP). Kathmandu : Government of Nepal, MoHP, 2004.
3. —. Nepal Health Sector Strategy 2015-2020. Kathmandu : Government of Nepal, Ministry of Health and Population, 2015.
4. Trends and Inequalities in Use of Maternal Health Care Services in Nepal: Strategy in the Search for Improvements. Mehata, Suresh, et al. 2017, Hindawi BioMed Research International.
5. Ministry of Health [Nepal], New ERA, and ORC Macro. Nepal Demographic and Health Survey 2001. Calverton, Maryland, USA : Family Health Division, Ministry of Health; New ERA; and ORC Macro, 2002.
6. Ministry of Health Nepal, New ERA, and ICF. Nepal Demographic and Health Survey 2016. Kathmandu, Nepal : Ministry of Health, Nepal, 2017.
7. Declaration of Alma-Ata. Alma-Ata, USSR : Geneva, World Health Organization, 1978. International Conference on Primary Health Care. pp. 6–12.
8. Equity in health and health care in Malawi: analysis of trends. Zere, Eyob, et al. 2007, BMC Public Health.
9. World Health Organization. Health Impact Assessment: Glossary of terms used. [Online] World Health Organization, 2018. [Cited: Jul 31 , 2018.] http://www.who.int/hia/about/glos/en/index1.html .
10. The concept and principles of equity and health. Whitehead, M. 1992, Int J Health Serv , Vol. 22, pp. 429-45.
11. When are health inequalities a political problem? Vallgarda, S. 2006, European J Pub Health , Vol. 16, pp. 615-6.
12. Setting the stage for equity-sensitive monitoring of the maternal and child health Millennium Development Goals. Wirth ME, Balk D, Delamonica E, Storeygard A, Sacks E, Minujin A. 2006, Bull World Health Organ , Vol. 84, pp. 519-27.
13. What does access to health care' mean? Gulliford, Martin , et al. 2002, London : Journal of Health Services Research & Policy, 2002, Vol. Vol 7 No 3.
14. World Health Organization. Service Availability and Readiness Assessment. Geneva : World Health Organization, 2015.
15. The Partnership for Maternal Newborn and Child Health. Opportunities for Africa’s Newborns: Practical data, policy and programmatic support for newborn care in Africa. Cape Town : World Health Organization on behalf of The Partnership for Maternal Newborn and Child Health, 2006.
16. The Inverse Equity Hypothesis: Analyses of Institutional Deliveries in 286 National Surveys. Victora , CG, et al. 4, April 2018, American Journal of Public Health , Vol. 108, pp. 464-471.
17. Explaining trends in inequities: evidence from Brazilian child health studies. Victora , CG, et al. 9235, 2000, Lancet, Vol. 356, pp. 1093–1098.
18. Inequality and changes in women’s use of maternal health-care services in Tajikistan. Falkingham, J. 1, 2003, Stud Fam Plann, Vol. 34, pp. 32–43.
19. Trends and inequities in use of maternal health care services in Indonesia ,1986 – 2012. Nababan , HY, et al. 2018, Int J Women’s Heal, Vol. 10, pp. 11–24.

22
20. Surviving Sepsis Campaign: International Guidelines for Management of Sepsis and Septic Shock: 2016. Rhodes , A, et al. 3, Mar 18 , 2017, Intensive Care Med , Vol. 43, pp. 304–77.
21. Inequity in maternal health care service utilization in Gujarat: Analyses of district-level health survey data. Saxena , D, et al. 1, 2013, Glob Health Action, Vol. 6.
22. Determinants of maternal health service utilization in Ethiopia: analysis of the 2011 Ethiopian Demographic and Health Survey. Tarekegn , SM, Lieberman , LS and Giedraitis , V. 1, 2014, BMC Pregnancy Childbirth, Vol. 14, p. 161.
23. Equity in Maternal Health in South Africa: Analysis of Health Service Access and Health Status in a National Household Survey. Wabiri , N, et al. 9, 2013, PLoS One, Vol. 8.
24. Social inequalities in the utilization of maternal care in Bangladesh: Have they widened or narrowed in recent years? Hajizadeh , M, Alam , N and Nandi , A. 1, 2014, Int J Equity Health, Vol. 13, pp. 1–11.
25. Decomposing the Socio-economic Inequalities in Utilization of Full Antenatal Care in Jharkhand State, India. Gupta , A, Kumar , P and Dorcas , OA. 2, 2016, Int J Popul Stud, Vol. 2, pp. 92–106.

23
Annex I
Table 10. District specific trends and patterns of inequalities in maternal health services: antenatal, delivery and postnatal care services,
HMIS 2014/15 – 2016/17
Districts
First ANC visit as per protocol (%)
Four ANC checkups as per protocol (%)
Institutional deliveries (%)
PNC checkup within 24 hours of delivery (%)
Three PNC checkup as per protocol (%)
20
16
/17
20
15
/16
20
14
/15
20
16
/17
20
15
/16
20
14
/15
20
16
/17
20
15
/16
20
14
/15
20
16
/17
20
15
/16
20
14
/15
20
16
/17
20
15
/16
20
14
/15
Taplejung 53.2 50.1 63.9 36.3 36.3 46.4 36.0 37.4 30.8 39.0 39.0 36.5 15.1 13.7 14.1
Panchthar 69.4 67.4 75.4 42.5 46.3 50.6 39.1 42.1 47.7 37.1 42.7 47.2 10.8 12.0 13.1
Ilam 52.6 46.6 55.2 36.1 33.9 42.9 20.5 19.0 24.9 22.1 18.3 26.9 3.2 2.9 5.2
Jhapa 61.3 63.1 79.4 41.8 49.0 50.9 74.8 75.6 69.1 64.0 66.2 61.7 5.3 22.9 19.9
Morang 67.8 67.0 65.6 43.1 50.9 50.1 78.0 75.4 87.1 52.9 68.2 86.1 8.4 12.8 22.7
Sunsari 60.7 58.6 62.9 53.7 116.0 44.6 23.1 79.0 29.5 23.6 79.5 30.0 5.6 69.9 9.6
Dhankuta 56.4 59.2 64.2 37.2 44.3 49.4 14.4 17.6 17.2 18.2 20.4 22.3 4.5 7.8 9.8
Terhathum 54.4 57.4 65.6 34.3 32.8 34.6 28.3 24.9 25.9 24.2 23.6 28.6 1.7 0.2 0.9
Sankhuwasabha 64.0 66.8 66.2 46.6 44.7 49.7 60.6 46.2 52.1 50.2 48.1 52.4 12.1 15.9 21.6
Bhojpur 60.1 61.3 58.0 39.6 34.7 35.3 26.7 26.1 26.3 27.9 28.8 23.9 13.0 13.9 10.9
Solukhumbu 62.7 71.0 84.0 39.3 48.3 55.3 24.1 25.7 25.6 25.7 27.0 29.7 21.3 22.2 25.4
Okhaldhunga 60.9 56.4 60.7 43.0 38.1 41.3 61.1 53.0 49.9 62.2 54.8 53.3 30.4 26.5 30.9
Khotang 74.4 76.8 73.0 56.4 56.2 53.0 25.6 21.9 21.2 34.8 40.7 41.0 18.6 19.5 22.6
Udayapur 65.2 63.3 68.5 43.3 42.3 46.4 39.3 43.7 44.8 39.0 46.2 48.2 11.8 13.4 9.7
Saptari 77.2 86.3 96.8 62.2 74.8 79.1 33.1 55.1 32.7 34.4 58.5 37.4 28.8 28.4 34.0
Siraha 68.0 68.4 69.5 40.3 38.3 41.1 45.2 45.0 50.2 44.1 46.9 51.4 10.3 9.0 8.8
Dhanusa 45.0 41.3 49.3 21.1 22.2 25.0 58.6 6.2 6.0 67.1 19.0 17.7 12.9 13.2 14.3
Mahottari 69.3 70.2 69.2 46.9 48.6 49.8 16.3 24.3 21.3 30.4 48.1 39.3 18.6 30.2 33.2
Sarlahi 54.4 53.2 55.3 32.8 35.1 35.8 33.4 40.1 27.1 49.3 46.8 40.0 33.0 22.5 26.2
Sindhuli 53.0 48.8 51.6 29.0 26.0 23.7 23.7 25.2 24.0 25.6 24.9 25.3 4.2 5.4 7.1
Ramechhap 49.1 48.1 51.6 35.9 34.2 38.4 32.2 29.8 30.4 33.3 30.6 33.2 8.9 4.9 8.3
Dolakha 61.0 57.2 58.6 50.7 42.6 44.9 42.7 38.1 26.6 43.8 39.0 32.8 17.5 21.5 17.9

24
Districts
First ANC visit as per protocol (%)
Four ANC checkups as per protocol (%)
Institutional deliveries (%)
PNC checkup within 24 hours of delivery (%)
Three PNC checkup as per protocol (%)
20
16
/17
20
15
/16
20
14
/15
20
16
/17
20
15
/16
20
14
/15
20
16
/17
20
15
/16
20
14
/15
20
16
/17
20
15
/16
20
14
/15
20
16
/17
20
15
/16
20
14
/15
Sindhupalchok 46.6 43.1 43.3 29.2 25.2 26.3 21.7 23.8 17.1 17.4 24.7 21.2 3.7 3.3 5.1
Kavre 72.1 63.5 78.4 44.9 35.9 49.0 65.9 60.9 69.4 63.2 48.3 42.5 16.5 13.3 13.8
Lalitpur 20.7 19.7 36.7 78.0 83.7 92.3 77.6 70.0 81.4 59.4 58.5 79.2 28.4 30.0 34.3
Bhaktapur 64.9 60.5 49.6 37.8 31.2 30.7 21.5 23.9 23.4 19.9 25.6 23.4 6.8 6.6 5.4
Kathmandu 118.4 72.3 127.3 104.2 61.0 63.1 81.0 58.9 68.8 70.6 49.3 10.3 18.7 7.3 7.1
Nuwakot 53.6 68.4 52.9 40.5 50.5 38.1 34.2 37.8 33.8 32.8 39.9 39.1 4.9 15.8 19.1
Rasuwa 69.5 67.9 56.8 47.7 40.1 40.6 24.8 27.3 24.8 27.8 30.8 27.3 16.2 23.1 13.2
Dhading 67.6 70.6 70.4 53.9 50.9 52.2 41.8 44.6 42.9 41.0 42.6 42.6 11.2 18.5 15.9
Makwanpur 75.1 59.6 62.0 52.8 31.9 36.3 46.9 47.2 34.6 47.0 25.6 15.2 11.6 3.1 2.9
Rautahat 58.1 63.9 65.3 37.8 44.1 46.0 41.9 33.9 27.2 53.3 52.1 41.6 32.3 32.6 34.3
Bara 50.8 62.6 61.6 32.1 40.4 44.5 30.6 39.8 16.6 15.5 18.6 24.4 10.4 12.0 17.0
Parsa 42.5 39.8 43.2 28.1 24.1 21.2 97.4 82.8 19.5 52.7 62.2 25.0 37.9 12.3 10.3
Chitawan 75.9 160.5 73.9 68.8 38.8 47.5 18.3 99.2 120.0 18.5 129.0 26.2 3.2 8.4 76.8
Gorkha 60.2 68.2 67.0 46.2 41.5 42.5 35.0 39.4 34.3 36.6 41.2 38.8 18.8 15.3 15.3
Lamjung 73.6 66.2 76.2 53.9 58.3 80.6 42.1 45.7 47.8 42.6 46.5 50.6 14.1 19.5 30.6
Tanahu 43.2 39.2 53.0 25.6 24.1 37.0 22.9 21.2 21.6 22.4 19.7 22.7 8.3 5.1 5.0
Syangja 62.3 75.2 69.7 41.9 44.4 50.3 22.7 24.0 23.9 22.8 24.9 25.7 11.6 10.1 12.4
Kaski 129.0 111.0 106.8 109.6 105.5 91.0 102.0 110.6 128.0 85.7 89.6 111.7 21.3 18.3 36.4
Manang 44.4 21.7 30.2 14.5 7.0 7.9 12.0 8.7 6.5 12.8 14.8 3.6 10.3 7.8 0.0
Mustang 50.0 40.2 40.3 23.4 12.2 11.7 19.5 21.7 20.8 20.3 24.0 20.8 8.2 7.1 10.2
Myagdi 75.1 69.4 74.6 66.5 57.8 66.7 52.8 52.5 47.8 56.3 56.6 57.3 23.6 24.1 27.1
Parbat 53.5 47.5 59.5 43.0 41.5 52.3 29.1 26.5 25.4 27.6 22.8 23.9 6.1 7.3 9.7
Baglung 58.6 62.2 72.9 46.9 80.9 63.6 45.1 42.5 43.0 46.7 40.8 48.2 11.8 11.2 15.0
Gulmi 69.6 68.5 76.1 61.6 57.1 57.6 37.6 32.8 34.7 39.1 38.0 47.5 30.3 20.3 27.7
Palpa 85.5 103.1 105.0 69.1 62.0 67.1 89.1 84.2 94.3 86.1 72.7 89.8 13.0 18.0 17.2
Nawalparasi 80.3 72.6 84.2 63.6 55.3 68.3 34.8 26.1 31.9 34.8 26.5 32.3 5.2 4.4 5.8

25
Districts
First ANC visit as per protocol (%)
Four ANC checkups as per protocol (%)
Institutional deliveries (%)
PNC checkup within 24 hours of delivery (%)
Three PNC checkup as per protocol (%)
20
16
/17
20
15
/16
20
14
/15
20
16
/17
20
15
/16
20
14
/15
20
16
/17
20
15
/16
20
14
/15
20
16
/17
20
15
/16
20
14
/15
20
16
/17
20
15
/16
20
14
/15
Nawalpur 73.4
57.9
19.6
19.9
6.4 Rupandehi 90.6 82.4 100.1 69.0 71.9 99.2 109.0 105.7 115.7 105.0 108.1 107.6 42.6 35.0 33.8
Kapilbastu 77.4 74.4 77.8 53.9 51.3 58.2 31.4 18.0 17.4 33.7 27.3 31.3 14.3 17.2 19.8
Arghakhanchi 53.8 57.9 60.6 41.0 40.1 43.7 26.5 27.7 27.7 23.6 25.8 26.2 5.9 2.7 5.2
Pyuthan 64.1 61.3 62.8 47.8 45.6 43.2 55.0 53.2 48.0 55.3 55.0 49.3 5.6 5.0 4.7
Rolpa 63.1 59.3 56.2 44.2 41.7 42.4 50.0 48.1 46.5 49.4 47.9 46.4 10.8 11.8 13.7
Rukum 66.9 74.6 80.2 48.8 37.5 28.3 40.4 53.3 41.6 40.7 50.8 42.3 24.0 10.8 10.2
Rukum west 62.8 30.9
52.6
51.3 10.0 Salyan 74.4 70.1 67.9 58.5 50.3 44.2 54.0 52.9 49.0 53.9 52.4 45.6 10.4 12.9 11.1
Dang 71.4 71.7 75.1 60.7 55.6 69.1 66.3 66.3 67.0 66.5 65.4 66.5 51.3 8.6 11.7
Banke 75.3 83.3 75.2 49.5 48.1 46.0 126.7 121.2 125.7 97.9 115.4 125.5 13.0 14.9 26.8
Bardiya 71.2 70.3 77.4 56.0 53.9 55.6 50.6 53.3 57.7 48.0 52.7 57.7 27.7 22.2 16.3
Surkhet 81.7 78.8 84.6 73.5 68.0 65.9 80.8 78.3 77.5 81.6 79.3 76.9 21.8 25.0 23.0
Dailekh 70.4 71.2 67.1 47.7 52.2 51.2 70.0 71.5 71.7 66.9 68.2 69.4 22.1 21.9 30.2
Jajarkot 47.9 43.3 49.2 25.1 25.6 29.4 31.3 29.4 30.1 32.5 30.7 33.1 18.8 18.7 16.8
Dolpa 36.5 45.5 30.6 29.9 23.1 18.3 30.6 25.6 10.8 31.6 28.1 20.7 22.2 14.7 13.3
Jumla 76.3 79.8 71.7 34.5 40.4 40.7 54.0 57.5 51.2 56.0 57.7 56.1 29.5 22.9 24.2
Kalikot 74.5 64.6 53.1 50.6 37.1 32.6 72.3 68.4 55.8 70.3 66.3 55.9 45.3 35.8 24.3
Mugu 102.1 101.8 55.4 41.7 28.9 27.3 49.4 39.4 36.9 34.9 36.0 42.4 10.5 11.4 9.9
Humla 25.1 55.9 57.5 15.2 32.9 30.4 18.9 79.3 52.4 17.5 86.1 61.3 11.1 42.2 23.1
Bajura 72.3 70.7 58.7 47.7 45.3 36.3 69.0 68.3 55.5 68.1 68.0 53.1 31.6 23.5 19.0
Bajhang 76.2 67.8 64.0 61.1 51.9 46.4 75.8 69.8 60.9 74.8 67.5 62.0 31.5 21.4 22.5
Achham 87.9 90.5 88.0 72.7 79.9 73.8 73.7 74.3 67.0 75.1 79.3 76.4 52.1 58.8 58.8
Doti 73.5 80.6 72.2 52.5 54.1 54.3 71.0 74.8 72.8 70.5 73.9 73.0 31.1 29.6 23.7
Kailali 70.8 63.3 69.0 51.5 47.6 51.8 76.5 73.3 78.1 75.2 70.4 69.9 52.7 23.3 29.2
Kanchanpur 63.5 61.9 64.4 49.0 47.3 51.3 48.2 52.1 56.8 48.2 52.2 56.2 11.7 9.0 8.4

26
Districts
First ANC visit as per protocol (%)
Four ANC checkups as per protocol (%)
Institutional deliveries (%)
PNC checkup within 24 hours of delivery (%)
Three PNC checkup as per protocol (%)
20
16
/17
20
15
/16
20
14
/15
20
16
/17
20
15
/16
20
14
/15
20
16
/17
20
15
/16
20
14
/15
20
16
/17
20
15
/16
20
14
/15
20
16
/17
20
15
/16
20
14
/15
Dadeldhura 73.1 72.6 73.5 61.4 62.2 67.0 68.9 67.8 69.9 69.2 72.4 73.8 19.5 52.9 65.3
Baitadi 76.7 76.5 75.7 61.7 66.9 63.7 64.5 66.1 57.0 64.8 65.6 56.6 27.3 21.8 12.1
Darchaula 65.6 71.0 63.3 50.8 55.3 48.1 59.6 57.7 51.7 59.8 59.0 53.3 19.7 26.1 12.0
A 6.2 8.1 4.2 7.5 16.7 12.5 10.6 19.5 21.3 8.2 8.7 34.9 31.4 413.3
B 108.3 140.8 97.1 95.1 109.0 91.3 114.7 115.0 122.0 92.2 114.2 121.9 51.0 69.7 76.8
A=Ratio of highest to lowest value of the districts, B=Difference in highest and lowest value of the districts Note: Highest and lowest values in each category, in a particular year are underlined where there are three or more categories.

27
नेपालमा मातसृ्वास््य सेवाहरुको उपयोगितामा असमानता: सारंश
नेपालले मात ृस्वास््य सेवाको उपयोगितामा उल्लेख्य प्रितत हाससल िरेको भएता पतन ववसभन्न समुहित जनसङ्खख्याका आधारमा भने हालसम्म पतन सेवाको उपयोगितामा असमानता ववद्यमान रहेको छ । केही महत्वपूर्ण सूचकाङ्खकहरुका आधारमा नेपालमा मातसृ्वास््य सेवाको उपलब्धता र उपयोगितामा रहेको असमानताको तह तथा प्रवतृतको ववश्लेषर् तथा लेखाजोखा िनुण यस अध्ययनको उद्वेश्य रहेको छ । यस अध्ययनको लागि, नेपाल स्वास््य संस्था सवेक्षर् २०७२ को त्याङ्खक, स्वास््य व्यवस्थापन सूचना प्रर्ालीको आ.ब.२०७१÷७२ देखख २०७३÷७४ को त्यांङ्खक र सन ्१९९६ देखख २०१६ का नेपाल जनसांङ्खिख्यीक स्वास््य सभेक्षर्हरूको त्याङ्खकलाई ववश्लेषर् िररएको गथयो । सामाजजक आगथणक (िररवी, तथा जात÷जातीयता) तथा भौिोसलक (जजल्लाित,
तथा प्रदेशित) रुपमा स्वास््य सूचकाङ्खकहरूमा रहेको असमानताको अवस्थालाई गचत्रर् िनण सूचकाङ्खकहरूको पूर्ण तथा तुलनात्मक (absolute and relative) रुपमा ववश्लेषर् िररएको गथयो । Stata 15 र MS-Excel© 2016 को प्रयोि िरर सम्पूर्ण ववश्लेषर्हरु िररएको गथयो ।
मातसृ्वास््य सेवाहरूको उपलब्धता र तयार ीः भौिोसलक क्षते्रका आधारमा हेदाण, पूवण-प्रसुती हेरचाह सम्बजन्ध सेवाको उपलब्धताको तुलनामा प्रसुती सेवाहरूको उपलब्धतामा बढी असमानता रहेको गथयो । तुलनात्मक रुपमा तराईमा थोरै मात्रामा स्वास््य संस्थाहरूले सामान्य प्रसुतत सेवा प्रदान िने पाईयो भने हहमाली क्षेत्रमा शल्यक्रिया द्वारा प्रसुततसेवाको उपलब्धता कम रहेको गथयो । तनजी स्तरवाट संचासलत स्वास््य संस्था भन्दा धेरैजसो सरकारी स्वास््य संस्थाहरु प्रसुतत सेवाको लागि तयारी अवस्थामा रहेको देखखएको गथयो । सामान्य प्रसुतत सेवाको उपलब्धतामा प्रदेश ६, कर्ाणली प्रदेश र प्रदेश २ मा धेरै ठूलो फरक रहेको देखखयो । प्रदेश ५ मा पूवण-प्रसुती र प्रसुतत दबुै सेवाको लागि धेरैजसो स्वास्थय् संस्थाहरु तयारी अवस्थामा रहेका गथए भने प्रदेश २ मा सबैभन्दा कम स्वास्थय् संस्थाहरु तयारी अवस्थामा रहेका गथए ।
स्वास््य संस्थाहरुमा हाल प्रदान िररने स्वास््य सेवालाई थप सुधार र सुधृड िनुण आवश्यक रहेको छ । यसका साथै, स्वास््य सेवाको कम उपयोि हुनुको कारर्हरुको पहहचन िरी हाल उपलब्ध तथा बबस्तार िनुण पने सेवाको िुर्स्तरमा बबशेष ध्यान हदनु आवश्यक छ। सेवा बबस्तार िदाण स्वास््य सेवाहरुको उपयोिमा कमी भएका प्रदेश तथा क्षेत्रहरुमा लक्षक्षत िनुणपदणछ ।
मातसृ्वास््य सेवाहरुको उपयोगितामा असमानताको तह तथा प्रवतृत (बार्षिक): मातसृ्वास््य सेवाहरुको उपयोगितामा असमानताको प्रवतृतमा भौिोसलक क्षेत्र तथा जजल्लाित रूपमा एकरूपता पाईदैन। प्रसुतत सेवाको उपयोगितामा भने प्रदेश स्तरमा असमानता बहढरहेको छ । अन्य प्रदेशहरुको तुलनामा प्रदेश २ को प्रसुतत सेवाको अवस्था तनरन्तर रूपमा कमजोर रहेको छ ।

28
प्रोटोकल अनुसारको पहहलो पटकको पूवणप्रसुतत सेवा र चौथो पटकको पूवणप्रसुतत सेवा सलने महहला तथा प्रसुतत पस्चात ्२४ घण्टासभत्र िररने सुत्केरी जााँच र तेस्रो पटक िररने सुत्केरी जााँचसेवा सलने महहलाको संख्यामा धेरै कसम देखखयो।
सबै िभणवती महहलाहरूले िभणवती, प्रसुती तथा सुत्केरी सेवा उपयोि िनणकालागि िुर्स्तरीय स्वास््य सेवाको सुतनजश्चतता िररनुपदणछ । सेवाको न्यून उपयोिका कारर्हरुका रुपमा रहेका सामाजजक, आगथणक तथा सांस्कृततक व्यवधानहरूको पहहचान र सम्बोधन िररनु पदणछ । साथै,
बजेट, मानव श्रोत तथा कमणचारीको क्षमता असभववृिजस्ता पक्षलाई पतन ध्यान हदईनुपदणछ।
मातसृ्वास््य सेवाहरुको उपयोगितामा असमानताको तह तथा प्रवतृत (द र्िकाल न): आगथणक अवस्थाका आधारमा, सन ् १९९६ देखख २०१६ सम्म, मात ृ स्वास््य सेवाहरूको उपयोि असमानुपाततक रूपले धनी पररवारमा मात्र केजन्ित भएको भएता पतन समग्रमा असमानताको प्रवतृत भने घट्दो अवस्थामा रहेको छ। समयको अन्तरालसाँिै धनी तथा िररव सवमैा मात ृस्वास््य सेवाहरूको उपयोि बढ्दै िईरहेको भएता पतन धनी र िररब बीचमा धेरै ठूलो असमानता रहेको छ। धनी घरपररवारमा मात ृस्वास््य सेवाहरूको उपयोि बढीनै रहेको छ । जातजाततहरूमा परस्पर रूपमा हेदाण, सामान्यतया नेवारले उच्च र दसलत, मुजस्लम तथा तराईका अन्य जाततित समूहहरूले न्यून रुपमा मात ृ स्वास््य सेवाहरूको उपयोि िरेको देखखन्छ । ब्राम्हर् र क्षत्रीमा सेवा उपयोिको औसत बिृी उच्च देखखन्छ।
मातृ स्वास््य सेवाको उपयोि िनण िररबहरूलाई बबषेश सुबबधा प्रदान िरी प्रोत्साहहत िररनुपदणछ। स्वास््य ववमाको माध्यमबाट अपर्णट आईपने खचण कम िने, िररवलाई अर् िररव हुनवाट रोक्न हाल भईरहेका सामाजजक सूरक्षाका कायणिमहरू (प्रचसलत स-शतण कायणिम) सुद्ढीकरर् िने तथा नयााँ कायणिम द्वारा सेवाको पाँहुचमा बाधकका रुपमा रहेको आगथणक अवरोधलाई घटाउनु पदणछ। यसका साथै, मातृ स्वास््य सेवाको उपयोगिता सूचकाङ्खकको असमानतामा सुधार ल्याउन, सापेक्ष रूपमा िररबीको रेखामुतन रहेका तथा सेवाको न्यून उपयोि िने अतत संवेदनशील जाततित समूहलाई लक्षक्षत िरी कायणिम सञ्चालन िनुण पदणछ।
मात ृस्वास््य सेवाको समतामा रहेको अन्तरको तह तथा प्रवतृतले सेवा प्रवाहको क्षेत्र बबस्तारका साथ साथै तल्लो तहमा असामानता प्रबल रहेको र जसले अतत कमजोर तथा सङ्खकटाववमखु समूहलाई र्न ् क्रकनारातफण लिेको देखाएको छ । यी समूहलाई स्वास््य सेवामा पहुाँचका लागि रहेका अवरोधहरूको पहहचान िरी तथा उक्त समुह लक्षक्षत उपयुक्त सेवा प्रदान िनुण पदणछ । साथ साथै, असमानताको खाडल पुनणका लागि अनुकूल नीतत समेत बनाउनु पदणछ।

29