ineichen research & management wriston’s law of capital
TRANSCRIPT

Feature
Wriston’s Law of Capital can explain nearly everything: “Capital will
always go where it’s welcome and stay where it’s well treated…
Capital is not just money. It’s also talent and ideas. They, too, will
go where they’re welcome and stay where they are well treated.”
Democracies have turned authoritarian before. At one stage, it
becomes a matter of survival for capital to move elsewhere. Under
normal circumstances capital flight might be morally wrong.
However, current circumstances might not be normal. Middle
Eastern capital is on the move; Greek and Spanish capital is on the
move too; London and Geneva thereby benefiting from Wriston’s
Law of Capital. German entrepreneurs are setting up shop in
Switzerland as taxes, labour laws and red tape are insurmountable
for start-ups at home. In Italy the Mafia is the largest lender. France
just went Venezuela. Portugal is already in the process of going
after the pensions of its citizens. Whether these anecdotes are early
signs of a more destructive phase, no one knows. But the direction
of the trend seems clear.
Macro
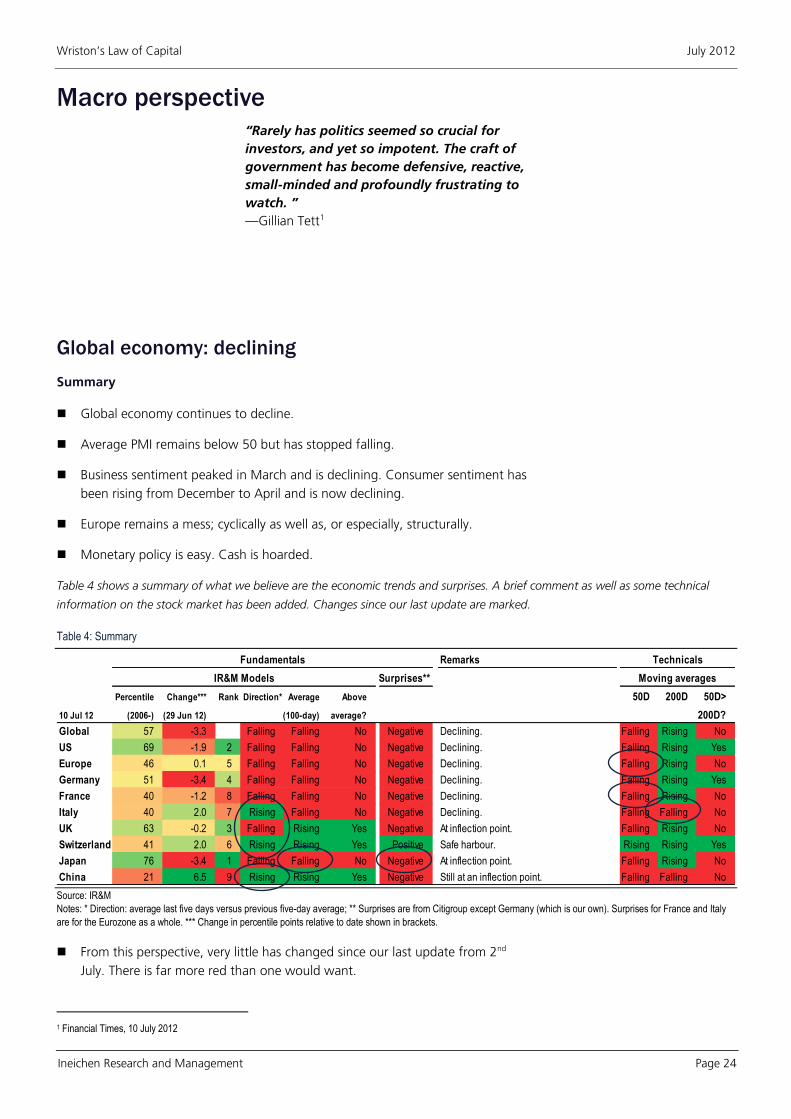
Global economy continues to decline.
Average PMI remains below 50 but has stopped falling.
Business sentiment peaked in March and is declining. Consumer
sentiment has been rising from December to April and is now
declining.
Europe remains a mess; cyclically as well as structurally.
Monetary policy is easy. Cash is hoarded.
Risk management research
Wriston’s Law of Capital
10 July 2012 Alexander Ineichen CFA, CAIA, FRM +41 41 511 2497 [email protected] www.ineichen-rm.com “For those who unfairly lump Social Security in with Bernie Madoff, in all fairness, you should point out the difference. No one was ever legally required to pay money to Madoff.” —Anonymous
Ineichen Research & Management (“IR&M”) is an independent research firm focusing on investment themes related to absolute returns and risk management.

R
Wriston’s Law of Capital July 2012
Ineichen Research and Management Page 2
Wriston’s Law of Capital
On a personal note .............................................................................................. 3
The IR&M logo explained ................................................................................ 3
Wriston’s Law of Capital .................................................................................. 6
Timing and rough patches ......................................................................... 11
What Keynes meant and what Keynesians did ......................................... 13
Corruption and the welfare state bubble .................................................. 14
Carlo Pietro Giovanni Guglielmo Tebaldo Ponzi would be proud ............. 19
Making a mockery out of democracy ........................................................ 20
Macro perspective ............................................................................................. 24
Global economy: declining ............................................................................ 24
United States: declining ................................................................................. 32
Europe: declining ........................................................................................... 37
Germany: declining ........................................................................................ 39
France: going Venezuela ................................................................................ 41
Italy: declining ................................................................................................ 43
UK: at inflection point .................................................................................... 45
Switzerland: Safe harbour ............................................................................. 47
Japan: at inflection point ............................................................................... 48
China: at inflection point ............................................................................... 49
Risk ................................................................................................................. 52
Appendix ............................................................................................................ 58
Government expenditure and corruption ................................................. 58
The Laffer curve ......................................................................................... 59
Publications ....................................................................................................... 60
Bibliography ....................................................................................................... 61

R
Wriston’s Law of Capital July 2012
Ineichen Research and Management Page 3
On a personal note
“The greatest enemy of knowledge is
not ignorance; it is the illusion of
knowledge.”
—Stephen Hawking
“People who think they know
everything are a great annoyance to
those of us who do.”
—Isaac Asimov
The IR&M logo explained
This is a very serious publication. Nevertheless, allow me to start with a joke that
has been floating around on the internet since 2009:
I asked my friend’s little girl what she wanted to be when she grows up. She
said she wanted to be Prime Minister of Canada some day.
Both of her parents, NDP [social-democratic party in Canada] supporters, were
standing there, so I asked her, “If you were Prime Minister what would be the
first thing you would do?”
She replied, “I’d give food and houses to all the homeless people.” Her
parents beamed, and said, “Welcome to the NDP Party!”
“Wow…what a worthy goal!” I told her. I continued, “But you don’t have to
wait until you’re Prime Minister to do that. You can come over to my house,
mow the lawn, pull weeds, and sweep my yard, and I’ll pay you $50. Then I’ll
take you over to the grocery store where the homeless guy hangs out. You
can give him the $50 to use toward food and a new house.”
She thought that over for a few seconds, then she looked me straight in the
eye and asked, “Why doesn’t the homeless guy come over and do the work,
and you can just pay him the $50?”
I smiled and said, “Welcome to the Conservative Party.”
Her parents still aren’t speaking to me.
1 Sometimes erroneously attributed to Winston Churchill.
“A joke’s a very serious thing.”
—Charles Churchill (1732-1764),
English poet and satirist1

R
Wriston’s Law of Capital July 2012
Ineichen Research and Management Page 4
While this jovial introduction is supposed to be funny, there is more to it. Humour,
like beauty, is supposedly in the eye of the beholder. However, understanding how
things work is not. Sometimes humour helps to understand things. Understanding
of complex issues requires different perspectives. There is the possibility that, as
Charlie Chaplin put it, “in the end, everything is a gag.” This means, if we don’t
understand the joke, we might be missing a certain perspective. And we cannot
deal with serious issues, such as managing risk for example, without covering all
known perspectives, as Winston Churchill suggests in the side text. Missing a
certain perspective means we don’t really understand what is going on. More
importantly, if we don’t understand the joke, the joke might be on us; as the
poker proverb (from 1979) states:
If after ten minutes at the poker table you do not know who the patsy is—you
are the patsy.
Warren Buffett used this analogy when discussing the weird market gyrations of
1987. He used Benjamin Graham’s metaphorical figure called “Mr. Market” and
indicated that a skilled investor should have knowledge that is superior to that of
“Mr. Market”. Full quote from the 1987 report:
But, like Cinderella at the ball, you must heed one warning or everything will
turn into pumpkins and mice: Mr. Market is there to serve you, not to guide
you. It is his pocketbook, not his wisdom, that you will find useful. If he
shows up some day in a particularly foolish mood, you are free to either ignore
him or to take advantage of him, but it will be disastrous if you fall under his
influence. Indeed, if you aren't certain that you understand and can value
your business far better than Mr. Market, you don't belong in the game. As
they say in poker, "If you've been in the game 30 minutes and you don't know
who the patsy is, you're the patsy."1
I have discussed the importance of knowing what one doesn’t know in other
research publications and surely will pick up the idea, which we can trace as far
back as Confucius, in the future. Here I’d rather focus on knowledge,
understanding, and wisdom.
While humour helps us understand, it is wise decisions that add value. More
cynically, and potentially more importantly, it is the avoidance of the opposite of
wisdom, foolishness, which adds the value. It is losses, especially large ones, which
kill the rate at which capital compounds. This is why knowing what one doesn’t
know is so important. The purpose of this (still rather new) research effort is mainly
to avoid foolishness. It is better to be safe than sorry. This means when things
economic are deteriorating, a different exposure to risk is required than when
things economic are improving. I have tried to capture this logic by using a
symbolised version of the knowledge pyramid in the logo of IR&M. (See Figure 1.)
1 Berkshire Hathaway 1987 Annual Report, 29 February 1988.
“It is my belief, you cannot deal with
the most serious things in the world
unless you understand the most
amusing.”
—Winston Churchill
“Real knowledge is to know the
extent of one’s ignorance.”
—Confucius

R
Wriston’s Law of Capital July 2012
Ineichen Research and Management Page 5
Figure 1: Knowledge Pyramid1 and explanation of IR&M logo
Source: www.ineichen-rm.com, concept adapted from Ackoff (1989)
Understanding is rated higher then knowledge, which is rated higher than
information, which is rated higher than just data. A great deal of damage has
been done by the regulatory bodies by requesting ever more granular data and
thereby focussing entirely on the lower end of the Knowledge Pyramid. And there
is very little evidence that the matter is improving in that regard. Solvency II for
example is so complex and ambiguous that smaller insurance companies will either
not be able to cope or will cope at a prohibitive cost. The idea that one ought to
simplify to reach “understanding” has not reached the regulatory bodies (or the
tax authorities, for that matter). A stepping stone to acquire wisdom is—
speculating a bit—being able to distinguish between knowledge and
understanding. Howard Marks on “understanding”:
In some ways, understanding the market is like mathematics. You don't have
to be knowledgeable regarding the specifics of the underlying subject matter
to know whether a conclusion makes sense. You just have to be able to apply
principles, tell logic from illogic, and exclude the deleterious effects of emotion
and psychology.2
These are arguably wise words; easier said than executed of course.
***
Below I discuss some aspect related to Wriston’s Law of Capital. I stumbled over
this a couple of years ago and believe this “law” is pure wisdom. It explains nearly
everything.
1 The Knowledge Pyramid is most often credited to Ackoff (1989). Some versions exclude “understanding”. The idea also
known as the “Data Information Knowledge and Wisdom Hierarchy” (DIKW) or the “Knowledge Hierarchy”.
2 Howard Marks, Memo to Oaktree Clients, 19 March 2012
“There is a great difference between
knowing and understanding: you
can know a lot about something and
not really understand it.”
—Charles F. Kettering (1876-1958),
American inventor, engineer,
businessman, and the holder of 186
patents

R
Wriston’s Law of Capital July 2012
Ineichen Research and Management Page 6
Wriston’s Law of Capital
One of the greatest books I own is The Lessons of History by Will and Ariel Durant,
first published in 1968. It is only 102 pages long with reasonably large letters. I
also own The Story of Civilization which comprises of eleven tombs, each several
hundred pages of small print. The latter is of course a much tougher read. The
former is a summary of the lessons from the latter. These lessons derived from
examining 5,000 years of history should not be ignored; or so one would assume.
However, some politicians do exactly that; thereby believing they know better,
capturing the moral and intellectual high ground. However, when the elite political
and academic intelligentsia are out of sync with the lessons of history, they
eventually fail. This includes the contemporary pursuit of trading freedom for
equality. In a chapter titled History and Biology, the Durants state the following
regarding this trade-off:
Nature smiles at the union of freedom and equality in our utopias. For
freedom and equality are sworn and everlasting enemies, and when one
prevails the other dies. Leave men free, and their natural inequalities will
multiply almost geometrically, as in England and America in the nineteenth
century under laissez-faire. To check the growth of inequality, liberty must be
sacrificed, as in Russia after 1917. Even when repressed, inequality grows; only
the man who is below the average in economic ability desires equality; those
who are conscious of superior ability desire freedom; and in the end superior
ability has its way. Utopias of equality are biologically doomed, and the best
that the amiable philosopher can hope for is an approximate equality of legal
justice and educational opportunity. A society in which all potential abilities
are allowed to develop and function will have a survival advantage in the
competition of groups.1
The idea to equalise incomes, to redistribute wealth from those that have to those
who do not, to increase the role of government in the name of equality; the idea
to increase living standards for everybody is arguably very laudable and should be
applauded. (And, at the polls, most often is.) However, these ideas, while morally
sound when examined superficially, eventually fail. In a game of competition it
makes no sense to limit one’s survival probability, it is unwise to do so. Lady
Thatcher was obviously on to something in the side text; modern day Robin Hoods
eventually run out of financing. Whether we call it socialist, or social-democracy,
or the third way doesn’t really matter. A society that gives incentives for ingenuity
and innovation and is generally business-friendly prospers. A society that gives
disincentives for ingenuity and innovation and is generally business-unfriendly
doesn’t. Chile is prospering; Venezuela isn’t.
In the inaugural piece of this risk management research effort I made fun about
forecasters as the future is not forecastable. The idea of this research is to
understand the present that allows to determine whether things economic are
improving or worsening. This determination then allows us—simplifying rather
generously—whether we should hedge certain (mainly directional) risks or whether
we can hope for the best in an unhedged fashion. However—and somehow there
is always a “however” of some sort—if history does indeed rhyme, then the
1 Durant (1968), p. 20.
2 Margaret Thatcher , in a TV interview for Thames TV This Week on 5 February 1976
“The past may not repeat itself, but
it sure does rhyme.”
—Mark Twain
“Socialist governments traditionally
do make a financial mess. They
always run out of other people's
money. It's quite a characteristic of
them.”
—Margaret Thatcher2
“History does not repeat itself - at
best it sometimes rhymes.”
—Mark Twain

R
Wriston’s Law of Capital July 2012
Ineichen Research and Management Page 7
sequent falling of domino stones might not be entirely random or unpredictable. I
believe that Wriston’s Law of Capital has some predictive power. What does it
stand for and who was Walter Wriston?
Wriston’s Law of Capital is named after Walter Bigelow Wriston (1919-2005).
Walter Wriston was a banker and former chairman and CEO of Citicorp. As chief
executive of Citibank / Citicorp (later Citigroup) from 1967 to 1984, Wriston,
according to Wikipedia, was widely regarded as the single most influential
commercial banker of his time.
The term “Wriston’s Law of Capital” was coined by Rich Karlgaard from Forbes
magazine in an article on his blog, Digital Rules, in 2006:
Capital will always go where it’s welcome and stay where it’s well treated…
Capital is not just money. It’s also talent and ideas. They, too, will go where
they’re welcome and stay where they are well treated.1
I came across this “law” a couple of years ago and believe it can explain nearly
everything.2 The key is that “capital” is not just money, its people and ideas too.
The most prominent contemporary example is the United States of America. For
most of its short history, the US has been a magnet for capital, i.e., risk capital,
people who want to work hard, people who want to study hard, people who are
unwelcome elsewhere, patents, ideas, talent, etc. It is no coincidence that Silicon
Valley is in the US. The most extreme, history-changing fact I can think of is the
Manhattan Project. The Manhattan Project didn’t just occur randomly in the US.
The people behind the Manhattan Project left Europe, Germany mainly, for the US.
They brought a long their capital, relationships, brains, and ideas. Imagine for a
moment how the 20th century could have evolved if Germany hadn’t been a
Semitic anti-magnet, but, like the US, a magnet. (The assimilation of various ethnic
and religious groups in the US obviously didn’t go as smoothly as these lines might
imply.)
In a very commendable book called Day of Empire, the author, Amy Chua,
professor of law at Yale Law School, examines tolerance in relation to empire
building and empire sustainability. While her views on parenting might not be for
everyone, the bottom line of the book is that tolerance—essentially the
“welcome” and “well treated” parts in Wriston’s Law of Capital—is very
important or even key when building and sustaining an empire. The funny thing is
that being nice to people is good for society. Who would have thought? It is not a
coincidence, according to Chua, that both Germany and Japan failed in sustaining
their empire. They weren’t particularly nice to their neighbours in the first halve of
the 20th century. So people, the lucky ones with well-developed survival instincts;
dare we say the “fittest”, just left. As Chua put it:
In 1930s Europe, Nazi intolerance caused the loss of incalculable scientific
talent. The list of brilliant physicists and mathematicians who fled Hitler is
astounding, including Edward Teller, known as the “father of the hydrogen
bomb”; the aeronautical genius Theodore von Karman; John von Neumann, a
child prodigy and the cocreator of game theory; Lise Meitner, after whom
Element 109, meitnerium, is named; Leo Szilard, conceiver of the nuclear
1 “Predicting the Future: Part II,” Rich Karlgaard, Forbes, 13 February 2006.
2 I first came across Walter Wriston in The Gartman Letter.
The US is a magnet for capital
whereby capital is defined broadly
as risk capital, people, ideas,
patents, IPs, talent, business
connections, etc.
“It is a little embarrassing that after
forty-five years of research and
study, the best advice I can give to
people is to be a little kinder to each
other.”
—Aldous Huxley

R
Wriston’s Law of Capital July 2012
Ineichen Research and Management Page 8
chain reaction; Enrico Fermi, builder of the first experimental nuclear reactor;
the Nobel Prize-winning physicists Hans Bethe and Eugene Wigner; Niels Bohr;
and of course Albert Einstein...
Up until the 1930s, Germany and Hungary were home to some of the world’s
leading physicists. Practically overnight, their departure turned America into
“the world’s dominant force in pure science.” Einstein, whose property was
confiscated by the Nazis in 1933, explained that he would “only live in a land
where there reigns political freedom, tolerance and equality of all citizens
before the law.”1
Tolerance comes and goes. It is essential in the beginning of attracting capital
(again, capital in a broader sense) but eventually vanes. The history of Europe is a
case in point. Chua explains the rise and fall of societies and empires over the past
500+ years of European history not with tolerance but with relative tolerance.
Jewish and Asian immigrants in the 1930s might or might have been welcome in
the United States. However, there was more “political freedom, tolerance and
equality of all citizens” in the US than there was elsewhere in the world, hence the
migration. It always seems to work like that.
Spain’s rise and fall for example can be explained with relative tolerance; the
“welcome” and “well treated” parts in Wriston’s Law of Capital. Spain was for
most of the 14th and 15th centuries a magnet, i.e., the best place (or the only place)
for non-Christians to live and prosper in Western Europe. The benefits Spain
reaped from its relative tolerance were vital to its territorial expansion and imperial
rise. It all went away though. In 1478 the Spanish Inquisition was founded by
papal bull. Thus ended the era of Spanish relative tolerance.2 Capital, as defined
above, left; moved elsewhere; somewhere where it was “welcome” and “well
treated”. The mass exodus of Spain’s conversos (converted Jews) and Jews left a
catastrophic financial vacuum. The price of capital increased as a result of
“capital” not being welcome and well treated. By maltreating capital, Spain
destroyed its own primary source of credit and thereafter became completely
dependent on foreign bankers, including the Dutch, the Germans, the French, and
especially the hated Genoese. It doesn’t take too much imagination to transport
the medieval maltreatment of capital and the political conflict derived thereof to
today.
In a nutshell, Spain either destroyed or drove out its most valuable sources of
human, financial, and social capital. By 1640 it was at the brink of collapse. In
other words, the authorities going after the capital, rather than treating it well, the
relative intolerance, takes a while to cause misery. The practical relevance today is
that capital is on the move again. It is not well treated everywhere; hence the
movement.
Wriston’s Law of Capital suggests that capital just moves on when it is not
welcome and well treated. In the case of Spain, capital migrated to Holland. This is
why the quote in the side text is not just funny; it is also full of historical wisdom.
Socialist animosities (and governmental malpractice) towards the private sector
resulted in benefits for its neighbours. It is the reason why the election of Mr.
1 Chua (2007), p. 254.
2 Ibid., p. 133.
3 “Trouble in Venezuela brings benefits to its neighbour,” Financial Times, 8 May 2012
Not tolerance, but relative tolerance
is the key
Spain was once a magnet
“The highest result of education is
tolerance.”
—Helen Keller (1880-1968), American
writer and political activist
“Chavez is the best president
Columbia has ever had.”
—Columbian home owner3

R
Wriston’s Law of Capital July 2012
Ineichen Research and Management Page 9
Hollande could result in a similar relative economic decay of France; similar to the
economic decay of Venezuela. I called this “going Venezuela” in one or two
recent updates. Venezuela has been at odds with Wriston’s Law of Capital for
more than ten years; France since May 2012. When I read about a new socialist
idea coming from Mr. Hollande or Mr. Ayrault I cannot help myself thinking how
genuinely applicable the following three pieces of wisdom are. The first is from
Thomas Sowell, the economist, and the latter two from Winston Churchill.
Socialism has a record of failure that’s so blatant that only an intellectual could
ignore or evade it.
I contend that for a nation to try to tax itself into prosperity is like a man
standing in a bucket and trying to lift himself up by the handle.
Socialism is a philosophy of failure, the creed of ignorance, and the gospel of
envy, its inherent virtue is the equal sharing of misery.
While this research effort tries to move away from forecasting, as forecasting the
future is rather difficult, and not necessarily necessary from a risk management
standpoint; I believe Wriston’s Law of Capital allows making educated guesses
about the movement of capital; and therefore about future prosperity. Certain
patterns are repeatable. The “going Venezuela” idea is based on historical
patterns and the ignorance towards these developments is just mindboggling; or
insane, as Albert Einstein might have put it: “Insanity: doing the same thing over
and over again and expecting different results.”
The tiny Dutch Republic rose as Spain fell. It is a good example of Wriston’s Law of
Capital, relative tolerance or intolerance, or (Spain) “going Venezuela”. Capital
moved north after Spain failed and started hunting down those “who delivered
the goods,” essentially the doers, the talent, i.e., the “capital”. The Dutch Republic
became a magnet for streams of religious refugees from all over Europe—
Protestants from the south Netherlands, Huguenots from France, German
Lutherans, Quakers and Pilgrims from England, and Jews from Spain.2 As the
United States would do two centuries later, the Dutch used tolerance to attract
capital (again, human capital, talent, etc.). These immigrants poured money into
the Dutch Republic, infusing bank reserves, augmenting state funds, fuelling Dutch
colonialism, and playing a central role in the establishment of the famous
Amsterdam Stock Exchange. Collectively, these immigrants formed the engine that
propelled the Dutch Republic. Max Weber3 coined the term “spirit of capitalism”
in reference to the massive influx of (Protestant) merchants, skilled workers, and
industrialists. History does indeed rhyme and those who do not remember the past
are most likely condemned to repeat it. Venezuela didn’t remember the past.
Many socialist governments in Europe do not remember the past. They think
1 The Life of Reason, Volume 1, 1905
2 Chua (2007), p. 149.
3 Max Weber, a German sociologist, economist, and politician, wrote The Protestant Ethic and the Spirit of Capitalism. In
the book, Weber wrote that capitalism in northern Europe evolved when the Protestant (particularly Calvinist) ethic
influenced large numbers of people to engage in work in the secular world, developing their own enterprises and engaging
in trade and the accumulation of wealth for investment. In other words, the Protestant work ethic, according to Weber, was
an important force behind the unplanned and uncoordinated mass action that influenced the development of capitalism.
Note that there is a parallel between the work ethic of the Calvinists and the work ethic of apostles of The Church of Jesus
Christ of Latter-day Saints currently most vividly represented through Mitt Romney. Replacing the current freebies-for-
everyone administration with Romney’s hard-work-and-prosper attitude could potentially mark an inflection point.
“Those who cannot remember the
past are condemned to repeat it.”
—George Santayana, Spanish-
American philosopher, 1863-19521
Holland was a magnet;
Hollande isn’t.

R
Wriston’s Law of Capital July 2012
Ineichen Research and Management Page 10
there’s a new way or a third way. The new leadership in France for example is
going against most “don’ts” listed below.
The following bullet points are “cannots” based on historical precedence. To some
extent these cannots capture the spirit of the Founding Fathers of the US. I believe
they stem from Rev. William J. H. Boetcker (1873-1962), an American religious
leader who lectured around the United States about industrial relations at the turn
of the twentieth century. He authored the following pamphlet titled The Ten
Cannots in 1916. At one time President Ronald Reagan used them in a speech,
wrongly attributing them to Abraham Lincoln.
You cannot bring prosperity by discouraging thrift.
You cannot help small men by tearing down big men.
You cannot strengthen the weak by weakening the strong.
You cannot lift the wage earner by pulling down the wage payer.
You cannot help the poor man by destroying the rich.
You cannot keep out of trouble by spending more than your income.
You cannot further brotherhood of men by inciting class hatred.
You cannot establish security on borrowed money.
You cannot build character and courage by taking away man's initiative and
independence.
You cannot help men permanently by doing for them what they could and
should do for themselves.
The historic parallel between the rise of the Dutch Republic and the United States
is obvious. There might be a parallel in relation to their fall too. The Glorious
Revolution of 1688 saw the Dutch William of Orange ascend to the throne, and
win the English, Scottish, and Irish crowns, ending eighty years of rivalry between
the Netherlands and England. After becoming king of England, William brought
over the financiers to continue provisioning his forces, which now included the
English army. They would soon be followed by many of Holland’s talent. Thus
began a massive outflow of capital—as defined broadly before—from the Dutch
Republic to England. As Chua puts it:
As an ironic result, it was England that would overwhelmingly benefit from the
amalgamation of Dutch and English power. Basically, the Dutch Republic
exported its tolerance, its most enterprising financiers, and its entire “business
model” to England, which then replaced the Dutch Republic as Europe’s
preeminent land of freedom and opportunity for immigrants and religious
minorities.2
1 According to research by Mark T. Shirey, citing Nice Guys Finish Seventh: False Phrases, Spurious Sayings, and
Familiar Misquotations by Ralph Keyes, 1992, this quote was first uttered by mid-nineteenth century French historian and
statesman François Guizot (1787-1874) when he observed, “Not to be a republican at 20 is proof of want of heart; to be
one at 30 is proof of want of head.” (N'être pas républicain à vingt ans est preuve d'un manque de cœur ; l'être après
trente ans est preuve d'un manque de tête.) This quote or a variant thereof has been attributed variously to George
Bernard Shaw, Benjamin Disraeli, Otto von Bismarck, and others. The following quote, for those who—like myself
obviously—are into these things, was falsely attributed to Winston Churchill: “If you're not a liberal when you're 25, you
have no heart. If you're not a conservative by the time you're 35, you have no brain.” Churchill was obviously a
conservative first; then, later in life, developed a “heart”.
2 Chua (2007), p. 166.
“Any man who is not a socialist at
age 20 has no heart. Any man who
is still a socialist at age 40 has no
head.”
—Georges Benjamin Clemenceau
(1841-1929), French journalist and
statesman1

R
Wriston’s Law of Capital July 2012
Ineichen Research and Management Page 11
Currently the United States is exporting its “business model” too. However, Chua
argues that China is unlikely to repeat the US “business model,” i.e., will not
become what she calls a hyperpower. China is not a magnet. It is a closed society,
even if not as closed as Japan. Chinese PhDs (where PhD stands for “poor, hungry
and devoted”) want to move to the US rather than the other way round. The
Chinese way of life may be not as appealing and exportable as the American way
of life. Only time will tell, of course. Speaking of timing:
Timing and rough patches
A one-sentence and somewhat mean-spirited (for which I “somewhat” apologise)
but not entirely meritless summary of European history in the 20th century could be
the following: Europe gets itself into a big mess and then gets bailed out by the
Americans.
This statement would certainly apply to the Great War. It was European in the
making and American in the ending. It also applies to WWII. WWII was European
(and Japanese) in the making and American in the ending. (We could “blame” the
Treaty of Versailles for WWII, which was not entirely European in the making.) It is
potentially also true for the Bosnia War that started without US involvement,
showed Europe incapable of solving a problem on its own soil on its own, and
was, again, ended via involvement of the US. (We know today that whether the
US has the collective blessings from the UN Security Council or not is a minor
detail. Also, if the IMF or World Bank bails out some European sovereign it is
essentially a “bailout by the Americans” as these organisations are mainly
American.)
(There is a first indication that this trend will continue in the 21st century: The Libya
conflict—which was not caused by Europe but was geographically at its borders—
was solved via involvement of the US. Officially a NATO offensive, the European
forces run out of munitions only one month into the conflict. If this weren’t so sad,
it would be comical.)
In our investment management profession, event risk is all the rage at the
moment. It’s all about tail risk and Black Swans. The main reason for this
development is mainly the 2008 experience that had an impact on the financial
professional’s mind while Nassim Taleb supported the vocabulary we use today.
But the tail risk is done. We had the crash. Tail events are unlikely to occur when
everyone expects them to occur. What is more worrisome is the aftermath of the
tail event. I like to use the term “negative compounding” which essentially means
that money, wealth, and assets deflate away in real terms. This is not really “tail
risk;” a “rough patch” would be the better description. The problem, of course, is
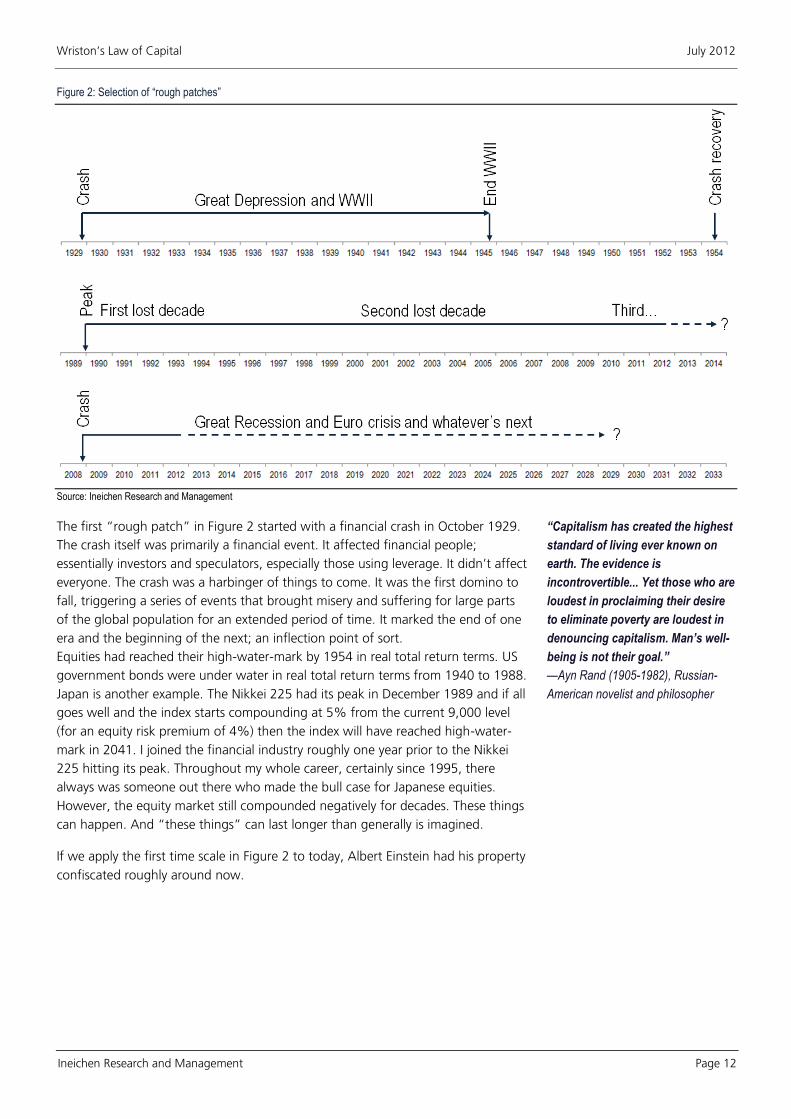
that these investor-unfriendly environments can last long. Figure 2 was designed
to add the perspective as to how long these things can last.
1 From Chua (2007), p. 288.
2 From Lowenstein, R. (2000) “When Genius Failed—The Rise and Fall of Long-Term Capital Management,” New York:
Random House, p. 297.
“We’ve had a couple hundred bad
years, but now we’re back.”
—Shanghai resident1
“Europe is the result of plans. It is,
in fact, a classic utopian project, a
monument to the vanity of
intellectuals, a programme whose
inevitable destiny is failure: only the
scale of the final damage done is in
doubt.”
—Margaret Thatcher
“I’m not worried about markets
trading down. I’m worried they
won’t trade at all.”
—Peter Fisher, Head trader for the NY
Federal Reserve visiting LTCM2
R
Wriston’s Law of Capital July 2012
Ineichen Research and Management Page 12
Figure 2: Selection of “rough patches”
Source: Ineichen Research and Management
The first “rough patch” in Figure 2 started with a financial crash in October 1929.
The crash itself was primarily a financial event. It affected financial people;
essentially investors and speculators, especially those using leverage. It didn’t affect
everyone. The crash was a harbinger of things to come. It was the first domino to
fall, triggering a series of events that brought misery and suffering for large parts
of the global population for an extended period of time. It marked the end of one
era and the beginning of the next; an inflection point of sort.
Equities had reached their high-water-mark by 1954 in real total return terms. US
government bonds were under water in real total return terms from 1940 to 1988.
Japan is another example. The Nikkei 225 had its peak in December 1989 and if all
goes well and the index starts compounding at 5% from the current 9,000 level
(for an equity risk premium of 4%) then the index will have reached high-water-
mark in 2041. I joined the financial industry roughly one year prior to the Nikkei
225 hitting its peak. Throughout my whole career, certainly since 1995, there
always was someone out there who made the bull case for Japanese equities.
However, the equity market still compounded negatively for decades. These things
can happen. And “these things” can last longer than generally is imagined.
If we apply the first time scale in Figure 2 to today, Albert Einstein had his property
confiscated roughly around now.
“Capitalism has created the highest
standard of living ever known on
earth. The evidence is
incontrovertible... Yet those who are
loudest in proclaiming their desire
to eliminate poverty are loudest in
denouncing capitalism. Man’s well-
being is not their goal.”
—Ayn Rand (1905-1982), Russian-
American novelist and philosopher

R
Wriston’s Law of Capital July 2012
Ineichen Research and Management Page 13
What Keynes meant and what Keynesians did
Financial professionals in Portugal already had their pensions confiscated. (Perhaps
we shouldn’t be too surprised, given Portugal’s history in the 1970s.) The practical
relevance of all this is that the current investment landscape resembles a “rough
patch”. The movement of capital has already started. The rough patch is not just a
liquidity-turned-credit-turned-sovereign-crisis, unfortunately. I do not want to scare
anyone but potentially the welfare state idea as we know it is coming to an end.
This could be disruptive for many years. Whether we call this the age of
deleveraging, or great depression II, or rough patch doesn’t really matter. What
matters is that we do not know how bad it’s going to get. We also don’t know
how long it takes. Figure 2 is just a hint that these things can last long and
become progressively worse before they become better. Since this line of research
is supposed to be related to risk management and because risk management is not
a quantitative exercise but a thought process, we need to think about these
things. Many investors agree that the ideas from the 1980s and 1990s do not
work as well anymore. Furthermore, the second quote in the side text has arguably
merit. Figure 3 below is a take on what went wrong in the industrialised
economies.
Figure 3: What went wrong in the West
Source: Protégé Partners 4Q 2009 quarterly letter
Keynes idea was about counter-cyclical fiscal stimulus, i.e. boosting aggregate
demand by expanding debt to weather the trough of the business cycle and
correspondingly shrinking demand by retiring debt during the ensuing boom.3
However, this latter point was sort of ignored. The West, supported intellectually
by scholarly Keynesians, just kept on spending and now the West is arguably in a
borrowing-frenzy related mess. There are many ways to reduce debt and take
from those with wealth, inflation being probably the most politically palatable and
elegant. However, inflation is not the topic of this document. History teaches us
that there are other ways to get to the money.
1 This quote, or a variant thereof, is occasionally attributed to Dwight D. Eisenhower.
2 Galbraith, John Kenneth (1994) “A short history of financial euphoria,” London: Penguin Books, p. 11.
3 From Protégé Partners 4Q 2009 quarterly letter
Mon
ey
Time
Save
Borrow
Borrowing
Business Cycle
What Keynes Meant
Mon
ey
Time
Borrow
Borrowing
Business Cycle Borrow
Borrow
What “Keynesians” Did
“Expect the best, plan for the worst,
and prepare to be surprised.”
—Denis Waitley, American
motivational speaker and author of
self-help books1
"There can be few fields of human
endeavor in which history counts
for so little as in the world of
finance."
—John Kenneth Galbraith2
“None of us can have as much as
we want of all the things we want.”
—Oliver Wendell Holmes (1809-1894),
American writer

R
Wriston’s Law of Capital July 2012
Ineichen Research and Management Page 14
At the moment, many market wizards and former market wizards are
recommending real assets in this environment. The investment thesis, which is
beyond the scope of this publication, is sound. However, if the real assets get
nationalised the investor loses everything. Democracies have turned authoritarian
(or totalitarian) in the past. This is not something to worry about; the notion is
something to think about. (Well, depending on the reader’s location, it might
actually be something to worry about.) History teaches us that failed authorities—
simplifying a bit—somehow get to the money.
In February 2012 Warren Buffett made the case that if the gold stock of 170,000
metric tons were melted together to a cube it would measure 68 feet per side and
fit on a baseball field. The value of this cube would be equal to all the US
cropland, 16 Exxon Mobils, and USD1 trillion in cash. His argument was that the
latter was superior to the former for cash flow reasons. This is of course true.
However, if you own cropland, blue chip shares, and cash and private property is
nationalised and the currency devalued, you have nothing. Whereas in the case of
hiding some physical gold from the authorities, you still own some gold. The cash
flow argument, therefore, is true and very well-articulated. However, it applies to
normal circumstances; to an environment in which the authorities have no
incentive to look for money where it can be found. We might not be living in such
an environment. The cash flow argument is valid only when we assume the
current financial repression is not turning into something worse, say, something
more authoritarian. Students of history won’t find this last line of argument too
farfetched.
At the time of writing (early July) a big bank was in the process of stumbling over a
scandal that involved manipulating Libor by a couple of basis points, potentially in
a cartel like fashion with some other big banks. This is of course a scandal at a
time where bankers are probably not at the pinnacle of the population’s collective
admiration and affection. However, it pales compared to the governmental-
approved manipulation of interest rates, or, nowadays, the whole yield curve.
Interest rates were supposed to be one of the most important parameters for
investors and savers to make their allocation decisions. Interest rates have been
distorted for years or decades even; not by a couple of basis points but by
hundreds of basis points. Central banks too operate in a cartel like fashion. How
can a heavy smoker be surprised if his kid tries a fag?
Corruption and the welfare state bubble
In the following I juggle with two variables, the incentive of the authorities to
expropriate its citizens and the likelihood of them doing so. I use high government
expenditure as a percentage of GDP as a proxy for the former and the Perceived
Corruption Index (PCI) as a proxy for the latter. High government expenditure is an
indication for the welfare state which I believe is on the way out because—in its
current form—is non-financeable. The Perceived Corruption Index I like to use as a
proxy for how rotten and dishonest the authorities are. The idea of this analysis is
that the higher the incentive to steal and the more corrupt the authorities, the
higher is the risk for the holder of wealth.
1 From The Soul of Man Under Socialism, Fortnightly Review (London, February 1891, repr. 1895).
Real assets should do well in times
of debt monetisation
“Disobedience, in the eyes of
anyone who has read history, is
man's original virtue. It is through
disobedience and rebellion that
progress has been made.”
—Oscar Wilde (1854-1900)1
Source: Capital Finance International

R
Wriston’s Law of Capital July 2012
Ineichen Research and Management Page 15
Table 1 show the tax burden as percentage of GDP, government expenditure as
percentage of GDP, as well as the Perceived Corruption Index. Columns four and
five show the rank of columns two and three from a sample of 168 countries. The
last column shows the average rank. I apply our Reggae colour coding to the
whole list. The table shows worst to best from a selection of European countries,
as well as Russia, US, China, the worst from the 168 (Libya) and the best
(Singapore). I have added the whole table into the Appendix of this document,
sorted from best to worst.
Table 1: Government expenditure and corruption, selection from 168 countries
Source: IR&M, Heritage foundation, transparency.org
The first two columns are for 2012, the Perceived Corruption Index is from 2011.
Investing in Singapore or Switzerland is probably safer than investing in Libya
or Russia.
The Nordic model seems to work for the moment despite being most likely on
the wrong side of the Laffer curve2. Scandinavia created itself a welfare-state
nirvana. The running costs are high. However, problems in Europe are
elsewhere. Furthermore, Scandinavian countries are among the least corrupt.
One could argue the authorities are already expropriating its citizens via taxes.
One critique point of the Nordic model is that women need to work as there is
little of the family’s patriarch income left after all these redistributive taxes
have been collected. However, a regression between the European countries
in column 2 of Table 1 and the World Bank’s women workforce participation
rate reveals that there is no correlation, i.e. women have to work elsewhere
too. In a nutshell, the Nordic economies do indeed have an incentive to go
1 Welfare: Tackling the Fastest-Growing Part of Government Spending, The Foundry, 12 April 2012
2 I live in the canton of Zug in Switzerland. The canton of Zug started to realise what is behind the Laffer curve in the
1950s. Prior to understanding the Laffer curve, there were only grazing cows here. However, Zug has been a magnet for
business ever since understanding what is behind the Laffer curve. I have added some remarks on the Laffer curve in the
Appendix of this document.
Tax
burden
% GDP
(1)
Govt.
expend.
% GDP
(2)
Perc.
Corruption
Index
(3)
Rank
of (2)
from 168
Rank
of (3)
from 168
Average
rank
from 168
Libya 5.4 52.3 2.0 158 159 159
Russia 34.4 41.4 2.4 115 136 126
Greece 29.4 52.9 3.4 159 77 118
I taly 43.5 51.8 3.9 157 66 112
Hungary 39.1 50.2 4.6 151 52 102
France 41.9 56.2 7.0 163 25 94
Portugal 35.2 49.8 6.1 150 32 91
Belgium 43.2 54.1 7.5 161 19 90
Austria 42.8 53.1 7.8 160 16 88
United Kingdom 34.3 51.2 7.8 155 16 86
Spain 30.7 45.8 6.2 138 31 85
Denmark 48.2 58.4 9.4 165 2 84
Sweden 46.4 55.2 9.3 162 4 83
Finland 43.1 56.2 9.4 163 2 83
Ireland 27.8 48.2 7.5 145 19 82
Netherlands 39.1 51.4 8.9 156 7 82
Germany 37.0 47.5 8.0 143 14 79
Norway 41.0 46.4 9.0 141 6 74
United States 24.0 42.2 7.1 121 24 73
Luxembourg 37.5 42.2 8.5 121 11 66
China 17.5 23.0 3.6 33 72 53
Switzerland 30.3 33.7 8.8 85 8 47
Singapore 13.4 17.0 9.2 9 5 7
“There is only one way to kill
capitalism: by taxes, taxes and even
more taxes.”
—Karl Marx
“From a historical perspective,
since the War on Poverty began in
the 1960s, the government has
spent $19.8 trillion (inflation-
adjusted) to fund a growing list of
welfare programs. This is nearly
three times the cost of all military
wars in U.S. history from the
Revolutionary War through the
current war in Afghanistan.”
—Robert Rector, senior research
fellow at The Heritage Foundation1

R
Wriston’s Law of Capital July 2012
Ineichen Research and Management Page 16
after the money to finance their expensive welfare state but are already doing
so via the tax authorities.
Greece and Italy are different. The authorities there too have an incentive to
go after the money. However, their societies, especially the political apparatus,
are rotten. From a risk management perspective this is a big difference. Italy
shares its ranking on the Perceived Corruption Index with Ghana, Macedonia,
and Samoa and is therefore perceived as more corrupt than Cuba and Saudi
Arabia.1 (The 945 members of the Senate and the Chamber of Deputies earn
an average annual salary of EUR140,000 – almost twice as much as British
MPs. They are chauffeured around in expensive cars. According to one source,
there are a staggering 30,000 of these executive cars and they cost the Italian
taxpayer an estimated EUR2 billion a year. And that’s just the tip of the
corruption ice berg, a minor anecdote.) What are the chances that for example
property rights will be respected when the going gets a bit tougher?
France, Spain and Portugal seem to be in between these two regions. They too
have an incentive to go after the money but are not as corrupt as Italy and
Greece. However, nationalisation-prone Portugal has already started;
nationalising some pensions, as already mentioned before. Figure 4 shows the
PCI for a selection of countries.
Figure 4: Perceived Corruption Index, 2011, selected countries
Source: IR&M, transparency.org
Table 2 shows the best and worst 15 countries based on our ranking between
government expenditure and corruption. These tables obviously need to be taken
with a pinch of investment salt.
1 Comparing Italy to Ghana is potentially unfair. Ghana currently has growth prospects.
3
4
5
6
7
8
9
10
2002 2003 2004 2005 2006 2007 2008 2009 2010 2011
Denmark
Finland
Sweden
Norway
Netherlands
Switzerland
Luxembourg
Germany
United Kingdom
France
Spain
Portugal
Saudi Arabia
Cuba
Italy
Ghana
Greece

R
Wriston’s Law of Capital July 2012
Ineichen Research and Management Page 17
Table 2: Government expenditure and corruption, best and worst from 168 countries
Source: IR&M, Heritage foundation, transparency.org
The first two columns are for 2012, the Perceived Corruption Index is from 2011.
One of the lessons of the 2008 financial crisis was that one ought to know
where one’s money really is. It shouldn’t be too surprising that increasingly
investors want Singapore or Hong Kong as a booking centre. At the moment,
it seems safer there.
Note that Chile and Peru are on the green list in Table 2 while Venezuela is on
the—appropriately coloured—red list.
Please note that I do not have a problem with the welfare state; it is the welfare
state bubble that is of concern. The welfare state idea is a good one. It lifted large
parts of various populations out of poverty. A developed society should clearly care
about minimising suffering. However, the idea was taken too fare. At times it feels
like socialism in a new wrapper; the “third way” being a marketing gimmick akin
the “new economy” a couple of years ago. The practical relevance from a risk
management perspective is that it is becoming apparent that the financing of this
welfare state bubble is not working very well and authorities who have had their
backs at the wall in the past did some really—how shall I put this—capital-
unfriendly things.
The table below shows the social welfare function. The social welfare function,
proposed by Amartya Sen in 1973, is a measure of a society's overall welfare
calculated as the product of GDP per capita and the difference between 1 and the
society's Gini-coefficient. The Gini-coefficient is a measure between 0 and 1 with a
low number indicating income is more equally—and in the minds of a vast
majority therefore more fairly—distributed. The colour coding was applied to the
whole sample of 126 countries where both indicator where available.
1 Germany reformed its social model. Europe can, too, Josef Joffe, Bloomberg News, 17 April 2012
Tax
burden
% GDP
(1)
Govt.
expend.
% GDP
(2)
Perc.
Corruption
Index
(3)
Rank
of (2)
from 168
Rank
of (3)
from 168
Average
rank
from 168
Singapore 13.4 17.0 9.2 9 5 7
Hong Kong 13.9 17.3 8.4 12 12 12
Bahamas 15.3 22.2 7.3 30 21 26
Costa Rica 13.8 17.5 4.8 14 47 31
Macau 27.4 19.9 5.2 20 42 31
Chile 16.1 24.4 7.2 40 22 31
United Arab Emirates 1.8 25.8 6.8 45 28 37
Mauritius 18.9 23.5 5.2 35 42 39
Qatar 5.6 29.7 7.2 63 22 43
El Salvador 14.0 17.2 3.4 10 77 44
Australia 27.1 33.1 8.8 79 8 44
Peru 15.2 17.4 3.4 13 77 45
Switzerland 30.3 33.7 8.8 85 8 47
Rwanda 12.3 26.8 5.0 49 46 48
Madagascar 10.5 14.6 3.0 3 95 49
Tax
burden
% GDP
(1)
Govt.
expend.
% GDP
(2)
Perc.
Corruption
Index
(3)
Rank
of (2)
from 168
Rank
of (3)
from 168
Average
rank
from 168
Libya 5.4 52.3 2.0 158 159 159
Burundi 18.1 50.7 1.9 153 163 158
Equatorial Guinea 2.2 49.0 1.9 148 163 156
Maldives 14.1 64.9 2.5 166 128 147
Ukraine 36.9 48.5 2.3 147 144 146
Zimbabwe 39.0 45.2 2.2 134 146 140
Belarus 24.9 46.6 2.4 142 136 139
Angola 9.0 39.5 2.0 111 159 135
Solomon Islands 23.8 48.2 2.7 145 114 130
Uzbekistan 20.8 34.2 1.6 87 167 127
Russia 34.4 41.4 2.4 115 136 126
Yemen 8.0 35.2 2.1 92 155 124
Lesotho 56.9 65.5 3.5 167 74 121
Moldova 32.0 45.2 2.9 134 107 121
Venezuela 14.5 33.0 1.9 78 163 121
Not the welfare state but the welfare
state bubble is of great concern
“We will have to cut benefits. We
shall promote individual
responsibility. And our guiding
principle will be that we can only
redistribute what we have earned.”
—Gerhard Schröder, to the
Bundestag, 14 March 20031

R
Wriston’s Law of Capital July 2012
Ineichen Research and Management Page 18
Table 3: Social welfare function, top 20
Source: IR&M, World Bank, Wikipedia, own calculations
Note that the success of Luxembourg can be (partly) explained by Wriston’s Law of
Capital. Luxembourg’s main business is funds which employs thousands of
lawyers, tax advisors, financial engineers, administrators, etc. i.e., well
remunerated white collar workers. It’s a hub; a magnet. Prior to becoming a
financial hub there were only cows and steel there, with both gradually becoming
less competitive. In 1966 Switzerland introduced tough regulation for funds. At
the time Switzerland was a hub for the funds business. Switzerland wanted to
protect investors. (History does indeed rhyme, does it not?) The tough regulation
was hardly revised between 1966 and 1994. When Europe introduced more
business friendly funds regulation1 in 1985, business just left. The funds business
was more “welcome” in Luxembourg, and has been “well treated” there ever
since.
I have used the term “going Venezuela” for France’s remarkable move towards
the political left; essentially a move diametrically opposed to Wriston’s Law of
Capital. The reason for this term is that Venezuela more or less did everything
wrong economically over the past 10+ years; it too went against the “law of
capital”. When a society shoots one own goal after another, its socio-economic
fate becomes predictable. Prosperity, in absolute terms and irrespectively of how it
is measured, goes down while social tensions and crime rise. In relative terms, it
becomes less competitive than its neighbours, hence the brilliant quote in the side
text for the second time.
1 85/611/EWG
2 “Trouble in Venezuela brings benefits to its neighbour,” Financial Times, 8 May 2012
GDP per
capita
2011
Gini
coefficient
(latest)
Social
welfare
function
Luxembourg 88,787 0.26 65,702
Norway 57,092 0.28 41,106
Singapore 61,103 0.43 35,134
Sweden 41,447 0.23 31,914
Switzerland 47,817 0.34 31,703
Denmark 41,015 0.24 31,171
Austria 42,122 0.26 31,170
Netherlands 43,339 0.31 29,947
Germany 39,414 0.28 28,378
Ireland 41,642 0.32 28,317
Iceland 37,115 0.25 27,836
Belgium 38,633 0.28 27,816
Finland 37,581 0.26 27,810
Canada 40,541 0.32 27,527
United States 48,442 0.45 26,643
Australia 39,466 0.35 25,574
France 35,194 0.28 25,340
United Kingdom 36,511 0.34 24,097
Hong Kong 49,990 0.52 23,845
Spain 32,701 0.32 22,237
“Chavez is the best president
Columbia has ever had.”
—Columbian home owner2

R
Wriston’s Law of Capital July 2012
Ineichen Research and Management Page 19
Carlo Pietro Giovanni Guglielmo Tebaldo Ponzi would be proud
France is by no means the only economy potentially
“going Venezuela”. Over the past two months I have
been picking on France mainly because its electorate
move in the wrong direction was the most recent as well
as quite fascinating, and because some of the one and
two-liners by the new government officials were/are
particularly daft. But electoral success through
overpromising and thereby loading debt on the shoulders
of future generations is by no means a French or
European phenomena. France is not the only country that
is run by an intellectual with no hands-on business
experience; the US for example, is too.
According to one estimate the present value of the US’s
liabilities including unfunded welfare promises is north of
USD50 trillion. According to another estimate, apparently,
more than 50% of the US population is net receiver of
transfer payments. In Germany more than three quarters of the population benefit
from a transfer payment in one form or another. The trend is clearly towards
“getting worse”. It actually resembles a Ponzi or a pyramid scheme; which—
actually—is illegal in most jurisdictions. (A Ponzi scheme is illegal by definition.)
There is a consensus that governments borrowing senselessly cannot continue
forever. As professor Joseph Stiglitz, for what it’s worth, put it:
Economists agree this can’t go on. We can borrow and borrow, but eventually
there will be a day of reckoning.
Or Ludwig von Mises, essentially saying the same thing in the 1940s:
The wavelike movement affecting the economic system, the recurrence of
periods of boom which are followed by periods of depression, is the
unavoidable outcome of the attempts, repeated again and again, to lower the
gross market rate of interest by means of credit expansion. There is no means
of avoiding the final collapse of a boom brought about by credit expansion.
The alternative is only whether the crisis should come sooner as a result of the
voluntary abandonment of further credit expansion, or later as a final and total
catastrophe of the currency system involved.1
The West is already in a liquidity trap where cash is hoarded and monetary policy
instruments were overused and are now largely ineffective. This essentially means
more and more borrowing results in fewer and fewer options. As Richard Fischer,
President of the Federal Reserve Dallas, put it in March 2011:
Throughout history, feckless governments have dodged their fiscal
responsibility by turning to their monetary authority to devalue the currency,
monetize debt and inflate their way out of structural deficits.2
1 Von Mises (1996), p. 572.
2 “In GOLD we TRUST,” Erste Group, July 2011.
“There are two ways to conquer and
enslave a nation. One is by the
sword. The other is by debt.”
—John Adams (1735-1826), Founding
Father and second US President

R
Wriston’s Law of Capital July 2012
Ineichen Research and Management Page 20
Making a mockery out of democracy
I find it fascinating how the following quote applies to today. It is nearly a hundred
years old. We, as risk managers, now really need to become students of history;
the faster the better.
Lenin is said to have declared that the best way to destroy the capitalist system
was to debauch the currency. By a continuing process of inflation,
governments can confiscate, secretly and unobserved, an important part of
the wealth of their citizens. By this method they not only confiscate, but they
confiscate arbitrarily; and, while the process impoverishes many, it actually
enriches some. The sight of this arbitrary rearrangement of riches strikes not
only at security, but at confidence in the equity of the existing distribution of
wealth. Those to whom the system brings windfalls, beyond their deserts and
even beyond their expectations or desires, become 'profiteers,' who are the
object of the hatred of the bourgeoisie, whom the inflationism has
impoverished, not less than of the proletariat. As the inflation proceeds and
the real value of the currency fluctuates wildly from month to month, all
permanent relations between debtors and creditors, which form the ultimate
foundation of capitalism, become so utterly disordered as to be almost
meaningless; and the process of wealth-getting degenerates into a gamble
and a lottery.1
The current risk-on/risk-off market environment does indeed resemble a lottery.
Whether citizens are impoverished through negative real interest rates caused by
inflation or deflation-fighting or financial repression doesn’t really matter; it’s the
impoverishing bit in Keynes statement that matters from a risk management
perspective. The following literary titbit is also relevant today. It stems from
Alexander Fraser Tytler (1747-1813), Scottish-born lawyer, writer, historian, and
professor of history at the University of Edinburgh:
A democracy cannot exist as a permanent form of government. It can only
exist until the voters discover that they can vote themselves largesse (money-
benefits) from the public treasury. From that moment on, the majority always
votes for the candidates promising the most benefits from the public treasury
with the result that a democracy always collapses over loose fiscal policy
followed by a dictatorship. The average age of the world’s greatest civilizations
has been 200 years.2
The practical relevance is the following. Under normal circumstances it is illegal as
well as morally wrong to go against one’s countries rules, regulations and law. In a
capitalistic system, the rule of law is the most important thing, even more
important than roads and cheap energy. But what happens when one’s own
country turns illegal and corrupt? If history is a constant battle between freedom
and repression, as some claim, then the spirit behind the quote in the side text
doesn’t cause property owners, entrepreneurs, holders of wealth, and capitalists to
break out in uncontrolled festivity and joy, does it. It’s of course not just one
quote—potentially taken out of context—that is worrisome. It is the deep rooted
spirit and freedom-adverse beliefs that stand behind such statements that are the
1 Keynes in The Economic Consequences of the Peace, 1919.
2 The Decline and Fall of the Athenian Republic (1776)
3 Firefighting, The Economist, 14 July 2011
“The longer you can look back, the
farther you can look forward.”
—Winston Churchill
Negative real interest rates
impoverishes the saver
“We must re-establish the primacy
of politics over the markets.”
—Angela Merkel, May 20103

R
Wriston’s Law of Capital July 2012
Ineichen Research and Management Page 21
bone of contention. A temporary short selling ban is just a minor detail but it is
potentially a harbinger of things to come that are much uglier. History does indeed
suggest that repression in one form or another can go on for a long time until it
eventually fails. Risk management would get much more difficult if temporary
short selling bans turn into permanent short selling bans and then permanent
short selling bans turn into a ban of all other hedging instruments and techniques;
like short futures, long puts, CDS, long gold, physical or otherwise, cash, etc. Well,
the holding of cash is already being punished via negative real interest rates.
Democracies have turned authoritarian before. At one stage, it becomes a matter
of survival for capital to move elsewhere; again, capital defined broadly. Under
normal circumstances capital flight might be morally wrong. However, does the
adage “normal circumstances” really apply to today? Given where some countries
rank on the Perceived Corruption Index and given where the West stands in terms
of the stage in its welfare-state-pyramid-scheme? Middle Eastern capital is on the
move; Greek and Spanish capital is on the move too; London and Geneva thereby
benefiting from Wriston’s Law of Capital. German entrepreneurs are setting up
shop in Switzerland as taxes, labour laws and red tape are insurmountable for
start-ups at home. In Italy the Mafia is the largest lender. Portugal is already in the
process of going after the pensions of its citizens. France just went Venezuela.
Whether these anecdotes are early signs of a more destructive phase, I do not
know. But the direction of the trend seems clear.
Authorities turning against capital and savings are a game changer. However,
there is no one sticking up a red flag and warning us that now indeed the game
has changed. Change in this case happens gradually. This is why the term “tail
risk” is in a bubble and might not be very helpful. Tail risk implies a sudden, low-
probability, high-impact event of some sort, causing losses. However, this report is
mainly about gradual change to the investor’s disadvantage. These gradual
changes are more difficult to identify or spot. An earthquake is an earthquake and
the impact is sudden and clear to everybody. However, an extended period of
negative real interest rates or slow expropriation via nationalisation and/or taxes is
a different beast entirely.
One of the lessons of history is that democracies do not last very long and die from
suicide, rather than murder. John Adams in a letter to John Taylor dated 15 April
1814:
Democracy has never been and never can be so durable as aristocracy or
monarchy; but while it lasts, it is more bloody than either. … Remember,
democracy never lasts long. It soon wastes, exhausts, and murders itself. There
never was a democracy yet that did not commit suicide. It is in vain to say that
democracy is less vain, less proud, less selfish, less ambitious, or less avaricious
than aristocracy or monarchy. It is not true, in fact, and nowhere appears in
history. Those passions are the same in all men, under all forms of simple
government, and when unchecked, produce the same effects of fraud,
violence, and cruelty. When clear prospects are opened before vanity, pride,
avarice, or ambition, for their easy gratification, it is hard for the most
considerate philosophers and the most conscientious moralists to resist the
1 Note that George Soros’s biography also relates to Wriston’s Law of Capital. His family “was not welcome” at home, so
they left.
“Democracy is the road to
socialism.”
—Karl Marx
“Most of the poverty and misery in
the world is due to bad government,
lack of democracy, weak states,
internal strife, and so on.”
—George Soros1
“Civilizations die from suicide, not
by murder.”
—Arnold J. Toynbee (1889 – 1975),
British historian

R
Wriston’s Law of Capital July 2012
Ineichen Research and Management Page 22
temptation. Individuals have conquered themselves. Nations and large bodies
of men, never.
Please note that I might be biased when it comes to democracy: I’m Swiss and live
in Switzerland. From where I sit, Germany, for example is not democratic, and the
whole European Union complex is not really democratic either. Many nations in
Europe got the Euro as well as a European constitution and wanted neither. Hardly
any northern European citizen wants Eurobonds, i.e. the mutualisation of financial
folly, but might get exactly that. The intellectual elite make the big decisions for
the citizens. Some argue this is the ultimate arrogance by elitist people whose
combination of ignorance and arrogance is so profound that they claim to
understand things they do not even know they do not know.
(A German colleague once told me that—in the case of Germany—it’s better that
way because the German electorate made some really poor decisions in the 1930s.
The colleague’s view; not mine. I think the gentlemen in the side text hit—as so
often, it seems—the proverbial nail on its head.)
Not only is the European Union not democratic, it cheats and is dishonest too. One
of the Maastricht Treaties’ criteria from 1991 was that government debt should
not exceed 60%. Another one was that government deficit to GDP shouldn’t
exceed 3%. The treaty signees made a complete mockery of the rules, regulations
and law. And the authorities and politicians expect banks and hedge funds and
other market participants to abide the law? Who is kidding who? So the Eurozone
is not only a failing experiment, it’s a fraud too. But it’s not just the Eurozone. The
pyramid scheme is directly related to democracy. Politicians need to get elected
and want to gain political capital. That is how they are incentivised. But one
cannot do that by promising blood, toil, tears and sweat. Political capital is gained
by promising early retirement, free money, and whatever the goodies de jour
might be.
Switzerland is perceived as more democratic than other, so-called democracies.
What is relevant for this publication is that Switzerland is not only relatively
tolerant from a movement of capital point of view, it is also adheres to Wriston’s
Law of Capital constantly, as opposed to an on-and-off basis. Many countries
politically ping-pong (a very sophisticated political science term) between an
administration that is business friendly and one that isn’t. This ping-ponging
cannot be efficient. Switzerland followed Wriston’s Law of Capital without
interruption for decades.1 This means it was a magnet for capital in the 1930s as
well as today and all periods in between. It is reasonably obvious that failed and/or
corrupt governments don’t like that, and do whatever they can to tie off these
flows and migrations. This was the case in the 1930s as it is today; it’s just that the
1 Switzerland too has socialists. However, apart from travelling to Davos in January to throw a couple of cobblestones into
a McDonalds window or parade in Zurich on the first of May, no real harm is done to society. Never ever was there a
socialist or communist majority on a national level, hence—touch wood—the sustained prosperity.
The Swiss are often perceived as humourless and boring by non-Swiss. Many years ago, I made the case that “boring is
good” as a reference to Gordon Gekko’s “greed is good.” The argument was that compounding of capital is best when it is
“boring”, i.e., there are no unnecessary risks and “exciting” drawdowns. Volatility, non-participation in wars, socio-
economic experiments, and the political ping-ponging between business-friendly and business-unfriendly administrations
might be attractive from one perspective; but from a sustainable wealth building and prosperity point of view, it isn’t. Or as
Oscar Wilde put it: “It is better to have a permanent income than to be fascinating.”
“It has been said that democracy is
the worst form of government
except all the others that have been
tried.”
—Winston Churchill
“With the exception only of the
period of the gold standard,
practically all governments of
history have used their exclusive
power to issue money to defraud
and plunder the people.”
—F.A. Von Hayek
“Me? Switzerland. Still the best. Got
a healthy distrust for big
government.”
—Gordon Gekko, response to the
question where he puts his money,
Money Never Sleeps

R
Wriston’s Law of Capital July 2012
Ineichen Research and Management Page 23
political means that are different.1 It seems to me, that failed and corrupt
governments have a tendency to put non-failed and non-corrupt governments
under pressure, in their pursuit of “going after the capital.” Again, what
constitutes a failed and corrupt government, and what not, is—potentially—
dependent on the beholders location.
The difficult part to gasp is that the movement of capital, that would be illegal
under normal circumstances, might be essential for survival in non-normal
circumstances. (Again, this is of course specific to the investor’s location. Whatever
the case might be, in banking, the location of the booking centre is already an
issue for some investors; probably the more sophisticated, history-sensitised and
thoughtful.) Given that the movement of capital has already began; the risk
management process has changed and might become increasingly difficult for
large pools of capital with inert decision market processes. It might be an even
greater challenge for state-sponsored institutions; especially if the sponsoring state
is a (financially and morally) bankrupt fraud.
***
Ending the first section on this cheerful note, let’s have a look at the macro
landscape.
1 Some readers will object to this last sentence and argue that some countries are involved in buying stolen data; thereby
the ends justifying the means. If the means are illegal (fencing is illegal) and the ends are corrupt and repressive, then
there is indeed an uncomfortable parallel to earlier epochs.
“For those who unfairly lump Social
Security in with Bernie Madoff, in all
fairness, you should point out the
difference. No one was ever legally
required to pay money to Madoff.”
—Anonymous
R
Wriston’s Law of Capital July 2012
Ineichen Research and Management Page 24
Macro perspective “Rarely has politics seemed so crucial for
investors, and yet so impotent. The craft of
government has become defensive, reactive,
small-minded and profoundly frustrating to
watch. ”
—Gillian Tett1
Global economy: declining
Summary
Global economy continues to decline.
Average PMI remains below 50 but has stopped falling.
Business sentiment peaked in March and is declining. Consumer sentiment has
been rising from December to April and is now declining.
Europe remains a mess; cyclically as well as, or especially, structurally.
Monetary policy is easy. Cash is hoarded.
Table 4 shows a summary of what we believe are the economic trends and surprises. A brief comment as well as some technical
information on the stock market has been added. Changes since our last update are marked.
Table 4: Summary
Remarks
Surprises**
Percentile Change*** Rank Direction* Average Above 50D 200D 50D>
10 Jul 12 (2006-) (29 Jun 12) (100-day) average? 200D?
Global 57 -3.3 Falling Falling No Negative Declining. Falling Rising No
US 69 -1.9 2 Falling Falling No Negative Declining. Falling Rising Yes
Europe 46 0.1 5 Falling Falling No Negative Declining. Falling Rising No
Germany 51 -3.4 4 Falling Falling No Negative Declining. Falling Rising Yes
France 40 -1.2 8 Falling Falling No Negative Declining. Falling Rising No
Italy 40 2.0 7 Rising Falling No Negative Declining. Falling Falling No
UK 63 -0.2 3 Falling Rising Yes Negative At inflection point. Falling Rising No
Switzerland 41 2.0 6 Rising Rising Yes Positive Safe harbour. Rising Rising Yes
Japan 76 -3.4 1 Falling Falling No Negative At inflection point. Falling Rising No
China 21 6.5 9 Rising Rising Yes Negative Still at an inflection point. Falling Falling No
Fundamentals Technicals
IR&M Models Moving averages
Source: IR&M
Notes: * Direction: average last five days versus previous five-day average; ** Surprises are from Citigroup except Germany (which is our own). Surprises for France and Italy
are for the Eurozone as a whole. *** Change in percentile points relative to date shown in brackets.
From this perspective, very little has changed since our last update from 2nd
July. There is far more red than one would want.
1 Financial Times, 10 July 2012

R
Wriston’s Law of Capital July 2012
Ineichen Research and Management Page 25
GDP growth rates: falling
Table 5 shows year-on-year GDP (seasonally adjusted in most cases) for a range of economies. We have colour-coded the data to
show highs (green) and lows (red), synchronisation of the data, and past and current trend. The average is equally weighted.
Table 5: Global real GDP, SAAR (seasonally adjusted annual rate)
09 11 12 11 03 12
2.9 2.3 1.9 Average
1.5 1.6 2.0 US
9.1 8.9 8.1 China
2.7 2.0 1.2 Germany
1.3 0.7 0.0 Eurozone
-0.5 -0.6 2.8 Japan
0.5 0.6 -0.2 UK
1.5 1.2 0.3 France
0.4 -0.5 -1.4 I taly
0.8 0.3 -0.4 Spain
2.1 1.4 0.8 Brazil
3.0 1.9 1.7 Canada
n.a.n.a.n.a.n.a.n.a.n.a.n.a.n.a.n.a.n.a.n.a.n.a.n.a.n.a.n.a.n.a.n.a.n.a.n.a.n.a.n.a.n.a.n.a.n.a.n.a.n.a.n.a.n.a.n.a.6.7 6.1 5.3 India
5.0 4.8 4.9 Russia
2.6 2.5 4.3 Australia
3.6 3.3 2.8 South Korea
3.5 1.9 0.4 Taiwan
4.4 3.0 0.4 Hong Kong
6.0 3.6 1.6 Singapore
1.6 1.9 2.0 Switzerland
Jun 1998 to Jun 2011
Source: IR&M, Bloomberg. Notes: Not seasonally adjusted: Japan, South Korea, Singapore, and Switzerland. Original data: US: Bureau of Economic Analysis; China: National
Bureau of Statistics; Germany: Federal Statistical Office; Japan: Economic and Social Institute; UK: Office for National Statistics; France: INSEE; Italy: ISTAT; Spain: Eurostat;
Brazil: IBGE; Canada: STCA; India: Central Statistical Organisation; Russia: Federal Service of State Statistics; Australia: Bureau of Statistics; South Korea: Bank of Korea;
Taiwan: Directorate General of Budget Accounting & Statistics; Hong Kong: Census & Statistics Department; Switzerland: State Secretariat for Economic Affairs.
Average GDP peaked in Q2 2010 and has fallen more or less gradually ever
since.
Japan and Australia surprised on the upside.
The Eurozone and some countries in Europe are for all practical purposes in
recession.

R
Wriston’s Law of Capital July 2012
Ineichen Research and Management Page 26
PMI: below 50 but stable
Table 6 shows a selection of global Purchasing Manager Indices (PMI) for the manufacturing sector. These are diffusion indices
and therefore oscillate between 0 and 100. A reading above 50 is associated with an expanding industrial activity whereas a
reading below 50 signifies contracting activity.
Table 6: PMI
Feb Mar Apr May Jun
52 51 49 48.7 48.6 Average
51 51 51 50.6 48.9 Global PMI (JPM)
52 53 55 53.5 49.7 US: ISM
64 62 56 52.7 52.9 US: Chicago
51 53 53 50.4 50.2 China
51 51 51 50.7 49.9 Japan
49 48 46 45.1 45.1 Eurozone
50 48 46 45.2 45.0 Germany
52 52 50 45.9 48.6 UK
50 47 47 44.7 45.2 France
48 48 44 44.8 44.6 I taly
49 51 47 45.4 48.1 Switzerland
50 50 50 49.0 48.4 Sweden
51 51 49 49.3 48.5 Brazil
51 50 44 42.4 47.2 Australia
58 54 48 55.7 n.a. New Zealand
58 55 54 53.6 48.2 South Africa
50 50 50 50.4 50.4 Singapore
Jul 2007 to Jan 2012
Source: IR&M, Bloomberg. Original data: Global: JP Morgan; US: Institute for Supply Management; Chicago: Kingsbury International; China: China Federation of Logistics and
Purchasing (CFLP); Japan: Markit/Nomura; Eurozone, Germany, UK, France, Italy, New Zealand: Markit; Switzerland: Credit Suisse; Sweden: Swedbank Markets; Brazil: NTC
Economics; Australia: Australian Industry Group; New Zealand: Bank of New Zealand; South Africa: Kagiso Securities; Singapore Institute of Purchasing and Materials
Management.
Average PMI peaked in February 2011, had fallen to 49 in October and
November of 2011, and had risen to a lower peak in February 2012. The
average PMI has been in decline ever since.
The widely followed ISM indicator fell below 50 in June, while a fall from 53.5
to 52.0 was expected.
Europe, especially the Eurozone, continues to contract. The PMIs of the
Eurozone and Italy have been below 50, i.e., the economies are contracting,
since August 2011.
Please note that the updates of this table allowed spotting the difference
between the seemingly growing US with stagnating Europe very early on. In
other words, the table does not just inform about the general trend, it allows
us to spot geographic differences as well.

R
Wriston’s Law of Capital July 2012
Ineichen Research and Management Page 27
PMI Services: below 50 but stable
Table 7 shows a selection of global Purchasing Manager Indices (PMI) for the services (non-manufacturing) sector. These are
diffusion indices and therefore oscillate between 0 and 100. A reading above 50 is associated with an expanding activity
whereas a reading below 50 signifies contracting activity.
Table 7: Non-manufacturing PMI
Source: IR&M, Bloomberg. Original data: See previous table.
The services PMI are reasonably consistent with the manufacturing PMI, i.e.
peaking some while ago and falling ever since.
The services PMI for Germany, the beacon of hope in Europe, has been falling
too.
In 2008/2009 the Eurozone services PMI was below 50 for 15 months.
Currently, the services PMI has been below 50 for 10 months, ignoring one
brief spike to 50.4 in January.
Feb Mar Apr May Jun
52 52 49 49.0 49.7 Average
56 55 52 52.5 50.6 Gl. Services PMI
57 56 54 53.7 52.1 US: Non-Man
57 58 56 55.2 56.7 China
49 49 47 46.7 47.1 Eurozone
53 52 52 51.8 49.9 Germany
54 55 53 53.3 51.3 UK
50 50 45 45.1 47.9 France
44 44 42 42.8 43.1 I taly
54 53 49 47.7 47.4 Sweden
47 47 40 43.5 48.8 Australia
n.a.n.a.n.a.n.a.n.a.n.a.n.a.n.a.n.a.n.a.57 54 54 49.7 53.0 Brazil
Jul 2007 to Jan 2012

R
Wriston’s Law of Capital July 2012
Ineichen Research and Management Page 28
Business sentiment: declining
Table 8 shows a selection of business and economic sentiment and expectations indicators for the past five years. Some are more
leading than others. We show all figures in percentiles. The period high is set to 100 and is shown green. The period low is,
therefore, set to 0 and is red. The colour coding allows getting a feel for the trend on a reasonably high frequency basis. There is
an update nearly every day.
Table 8: Business sentiment
Mar Apr May Jun Jul
68.3 66.8 60.2 52.9 52.7 Average
81 60 76 53 n.a. US: Empire State
67 62 44 30 n.a. US: Philadelphia Fed
68 78 63 53 n.a. US: Richmond Fed
85 68 66 79 n.a. US: Dallas Fed
81 89 88 56 n.a. US: AIM
58 69 68 53 n.a. US: NFIB
41 33 21 16 15 EZ: Sentix
59 56 50 49 n.a. EZ: Economic
68 63 58 55 n.a. EZ: Business
33 26 27 n.a. n.a. China
71 72 61 39 n.a. Germany: ZEW Exp.
83 83 73 68 n.a. Germany: IFO Climate
75 75 69 58 n.a. Germany: IFO Exp.
54 63 53 57 n.a. UK (EC)
78 74 31 39 n.a. UK (Lloyds)
68 61 56 54 n.a. France
48 45 38 43 n.a. I taly
58 60 56 31 n.a. Switzerland
68 68 66 62 n.a. Sweden
91 95 87 80 n.a. Japan (ESRI)
90 85 84 80 n.a. Japan: Small biz
63 65 73 67 63 South Korea
66 69 57 56 n.a. Australia
85 87 79 65 n.a. New Zealand
Aug 2007 to Feb 2012
Source: IR&M, Bloomberg. Original: US: NY Fed, Philadelphia Fed, Richmond Fed, Dallas Fed, AIM (Associated Industries of Massachusetts), NFIB (Small Business Optimism
Index), Eurozone (EZ): Sentix Behavioral Indices, EC (Economic Sentiment Indicator and Business Climate Indicator); China: National Bureau of Statistics, Germany: ZEW
(Expectation of Economic Growth), IFO (Business Climate and Business Expectations); UK: EC, Lloyds TSB; France: INSEE; Italy: ISEA; Switzerland: ZEW/Credit Suisse,
Sweden: National Institute of Economics, Japan: ESRI, Japan Finance Corp for Small Business; South Korea: BoK; Australia: National Australia Bank; New Zealand: National
Bank of New Zealand. Note: The table sows percentiles. 100 (green) marks high for period shown, 0 (red) is the low. The average is equally weighted.
The most recent peak of the average of these business sentiment and
expectations indicators was in February 2011.
The average of all these indicators started to rise in December and peaked this
April. There was a sharp drop in May and, on average, these indicators have
been falling ever since.
This table too allowed to spot the divergence between the US and Europe
reasonably early. The table showed that while the US has been shooting the
proverbial lights out, Europe wasn’t.
Four indicators stand out as being earlier than other indicators: The
Philadelphia Fed Business Outlook Index, the ZEW Germany Expectation of
Economic Growth Index, the UK’s Lloyds sentiment index, and the ZEW-Credit
Suisse Switzerland Expectation of Economic Growth Index. Note that these
four indices have turned orange recently.

R
Wriston’s Law of Capital July 2012
Ineichen Research and Management Page 29
Consumer sentiment: declining
Table 9 shows a selection of consumer sentiment indicators for the past five years. We show all figures in percentiles. The period
high is set to 100 and is shown green. The period low is set to 0 and is red.
Table 9: Consumer sentiment
Mar Apr May Jun Jul
43.7 45.7 45.6 44.2 44.3 Average
51 50 45 42 n.a. US: Conf Board
60 60 68 51 n.a. US: Michigen
45 43 45 44 n.a. Eurozone
18 36 43 n.a. n.a. China
64 62 61 61 62 Germany
66 65 70 n.a. n.a. Japan
22 22 27 28 n.a. UK: GfK
45 44 44 52 n.a. UK: Lloyds TSB
31 38 41 41 n.a. France
27 0 0 0 n.a. I taly
50 51 39 60 n.a. Spain
0 13 2 0 n.a. Netherlands
29 39 25 n.a. n.a. Switzerland
47 55 58 52 n.a. Sweden
63 66 63 54 n.a. Denmark
46 50 46 52 n.a. Ireland
7 8 13 22 n.a. Greece
94 100 95 85 n.a. Brazil
51 43 53 n.a. n.a. Canada
38 35 36 37 n.a. Australia
54 62 62 44 n.a. New Zealand
56 64 67 56 n.a. South Korea
Aug 2007 to Feb 2012
Source: IR&M, Bloomberg. Original: US: Conference Board and University of Michigan Survey Research Center; Eurozone, France, Spain, Greece: European Commission;
China: National Bureau of Statistics of China; Germany: GfK (for the month ahead); Japan: Economic and Social Research Institute (ESRI); UK: GfK and Nationwide; Italy:
ISAE; Netherlands: Dutch Statistics Office; Switzerland: UBS; Sweden: National Institute of Economic Research; Ireland: IIB Bank; Brazil: Fundacao Getulio Vargas; Canada:
OECD; Australia: Westpac Banking Corporation; New Zealand: ANZ Bank; South Korea: Bank of Korea, since July 2008. Note: The table sows percentiles. 100 (green) marks
high for period shown, 0 (red) is the low. The average is equally weighted.
One of the characteristics of the aftermath of the Great Recession is that
consumer sentiment never really recovered; unlike after most other post-WWII
recession.
The average consumer sentiment has been falling to October 2011, has risen
to May 2012 and has been stable ever since.
Sentiment in Italy and the Netherlands is at a low point; understandably in
case of the former, less so in the case of the latter. The consumer sentiment in
Greece has been rising throughout most of 2012.
Note that some of the consumer sentiment indicators, that turned red early on
in the last recession, have turned orange and red now too.

R
Wriston’s Law of Capital July 2012
Ineichen Research and Management Page 30
Summary PMI, business and consumer sentiment
Chart 1 below shows a summary of the average PMI (Table 6), average business sentiment
(Table 8) and consumer sentiment (Table 9).
Chart 1: Summary
0
15
30
45
60
75
90
30
35
40
45
50
55
60
2007 2008 2009 2010 2011 2012
Bu
sin
es
s s
en
tim
ent a
nd
co
nsu
me
r c
on
fid
ence
(p
erc
en
tile
s)
PM
I
PMI Business sentiment Consumer confidence
Source: IR&M, Bloomberg
Our interpretation of the summary above is that the economic trend is down.
The practical relevance is that large drawdowns in equities typically occur not
when things economic are improving but when they are deteriorating. We do
not know for how long “things economic” will be deteriorating; no one does.

R
Wriston’s Law of Capital July 2012
Ineichen Research and Management Page 31
Economic trend vs global equity market
Chart 2 shows a model that was designed to give an indication of the economic trend nearly every day. The idea behind the
model is that these indicators are not random but trend. Models such as these allow us to decide whether the global economy is
expanding or things economic are deteriorating. The moving average is the trend. We then combine the trend with expectations.
The shaded areas show periods where reality is “coming in” worse than economists and strategists are expecting, i.e., the
economic data is below consensus.
Note here that these graphs (there are more below) do not in any way predict the future. Whether these variables turn
tomorrow or keep falling for years to come, we do not know. The idea is simply to pick up the trend and its derivative, the
surprises. We believe that being hedged when the trend is down and surprises are negative prevents experiencing long periods
of negative compounding. Also, it seems to us, negative tail events do not normally happen out of the blue. They occur when
things economic are not well and the red line in the graph below is declining.
Chart 2: IR&M global economic model vs FTSE World Index
40
55
70
85
100
115
130
145
150
200
250
300
350
400
450
500
2006 2007 2008 2009 2010 2011 2012
IR&
M G
lob
al M
od
el (
1.1
.20
06
= 1
00
)
FT
SE
Wo
rld
Ind
ex
Negative Surprises in G10 (Citi) FTSE World (lhs) IR&M Global Model (rhs) 100-day MAV
Source: IR&M, Bloomberg. Note: Surprises are based on Citigroup Expectations indices. IR&M Global Model is based on 21 indicators, was designed to give a data point
nearly every day, and remains work in progress.
Surprises turned negative on 23rd April 2012, around the same time when the
model line crossed the moving average. The trend has been negative ever
since.
The idea behind exhibits such as this one is to help the investor regarding the
decision whether to hedge risk or not. Large drawdowns in the equity market
happen when surprises are negative and economy, represented here through
a model, is deteriorating. This is currently the case.
The reason why many investors find the current environment difficult is
because of the introduction and effect of the various policy options. Both the
timing as well as the impact of the remaining policy options is nearly
impossible to predict.

R
Wriston’s Law of Capital July 2012
Ineichen Research and Management Page 32
United States: declining
Economic trend vs US stock market
Chart 3 shows a model based on economic variables relevant to the economy in the United States.
Chart 3: IR&M US economic model vs S&P 500
10
20
30
40
50
60
70
80
90
100
110
600
700
800
900
1000
1100
1200
1300
1400
1500
1600
2006 2007 2008 2009 2010 2011 2012
IR&
M U
S M
od
el (
1.1
.20
06
= 1
00
)
S&
P 5
00
Negative surprises in US (Citi) SPX (lhs) IR&M US Model (rhs) 100-day MAV
Source: IR&M, Bloomberg. Note: Surprises are based on Citigroup Expectations indices. IR&M US Model is based on 23 indicators, was designed to give a data point nearly
every day, and remains work in progress.
Economic surprises in the US have been negative since 25 April 2012 while our
model crossed the moving average shortly thereafter. Our interpretation of
these facts is that the US economy is deteriorating.
In our last quarterly report, a gain of between 9.3% and 13.3% in the S&P
500 could have been locked in for the 2012 calendar year via the Dec
1375/1425 zero cost collar. At the close of 9 July, the index at 1,352, the Dec
1300/1360 zero cost collar would have allowed the investor to lock in a
calendar year gain of between 3.3% and 8.1%. This means at the beginning
of July, a positive absolute return could still be locked in for the calendar year.
However, the possible locked in gain today is lower than three months ago.
Our implicit recommendations in this report and its’ updates is that when the
economic conditions (represented through the dark blue and red lines) is
deteriorating and surprises are falling, one ought to hedge. We currently do
not know how long “things economic” will be deteriorating and how bad it
might get.

R
Wriston’s Law of Capital July 2012
Ineichen Research and Management Page 33
Monetary policy stance
Chart 4 shows monthly non-farm payrolls and the Fed fund rate. Note that non-farm payrolls are subject to vast revisions many
months after data release.
Chart 4: Fed fund rate with non-farm payrolls
0
1
2
3
4
5
6
7
8
-1000
-800
-600
-400
-200
0
200
400
600
2000 2001 2002 2003 2004 2005 2006 2007 2008 2009 2010 2011 2012
Fe
d fu
nd
ra
te, %
No
n-f
arm
pa
yro
lls, k
Non-farm payrolls, lhs Fed fund rate, rhs
Source: IR&M, Bloomberg
Fed tightening seems a non-issue at the moment. The last time the Fed started
tightening was when non-farm payrolls were above 200,000 (red line) for
three consecutive months. (The Fed also “promised” not to tighten until at
least 2013; or was it 2014? We can’t remember; hence the non-issue.)
The Bureau of Labor Statistics surprised the market on Friday 6th July with a
80,000 new jobs being created; below the 100,000 that were estimated.
Operation Twist 1 ended in June. On 20 June, the Fed announced a
continuation of this intervention to the end of the year. Like its predecessors,
this latest round of monetary easing was motivated by clear evidence the
economy would not live up to the Fed's forecast. Members of the Federal
Open Market Committee (FOMC), the Fed’s main policymaking body, now
expect growth of between 1.9% and 2.4% this year, down sharply from their
April forecast of growth between 2.4% and 2.9%. This time a year ago,
FOMC members were expecting growth of about 3.5% in 2012.
There is an argument to be made that, given the Bernanke put, investors need
not to hedge. The authorities are doing the hedging via monetary and fiscal
policies. Assuming for a moment this can go one forever, no hedging is
required; buy the dips. Caveat lector.

R
Wriston’s Law of Capital July 2012
Ineichen Research and Management Page 34
Business outlook
Chart 5: Philadelphia Fed Business Outlook
-80
-60
-40
-20
0
20
40
60
80
1965 1970 1975 1980 1985 1990 1995 2000 2005 2010 2015
Ph
ilad
elp
hia
Fe
d B
us
ine
ss O
utl
oo
k
Source: IR&M, Bloomberg. Note: Shaded area show official US recessions.
The Philly falling below -20 nearly guaranteed a recession in the past.
However, in August 2011 it fell below 20 and the economy is not in a phase
that could be described as an official recession. The indicator has been falling
since April and was at -17 in June.

R
Wriston’s Law of Capital July 2012
Ineichen Research and Management Page 35
High frequency economic indicators
Table 10 shows eleven economic, high-frequency variables that are related to the business cycle in one way or another. The first
line shows the average of the percentiles since 2007 of these indicators. The idea behind this table is to get a near real-time
reading of the direction in which the economy is heading. Chart 6 graphs the average percentile compared to the S&P 500.
Table 10: High frequency indicators
March April May June July
High Low Median W9 W10 W11 W12 W13 W14 W15 W16 W17 W18 W19 W20 W21 W22 W23 W24 W25 W26 W27 Last Economic proxy
76 9 61 61 60 62 63 62 64 63 61 61 61 59 57 57 53 54 54 54 54 52 52 Average percentile
98 -141 4 45 39 33 27 19 7 15 5 -8 -23 -24 -25 -25 -54 -50 -61 -64 -60 -63 -63 US Surprise Index
291 -19 183 170 171 194 188 188 174 172 170 168 162 158 143 145 121 137 131 137 134 128 125 US Yield curve (10-2Y)
28 -30 -1 -3.0 -2.5 -1.7 -0.6 0.3 1.3 1.8 1.2 0.6 0.1 0.0 0.4 0.1 -0.7 -2.1 -2.8 -3.2 -3.2 -2.9 -2.9 ECRI Leading (Growth)
2 -54 -43 -39 -37 -34 -35 -35 -31 -33 -31 -36 -38 -40 -44 -42 -39 -38 -36 -38 -36 -38 -38 Bloomberg Cons Comfort
1.16 0.57 0.93 1.01 1.01 1.01 1.02 1.01 1.01 1.02 1.00 1.03 1.01 1.00 0.96 0.98 0.96 0.98 0.97 0.98 0.96 0.96 0.95 Cons Discret vs. Staples
0.86 -4.03 -0.23 -0.32 -0.43 -0.47 -0.44 -0.34 -0.18 -0.06 0.01 0.02 -0.06 -0.13 -0.19 -0.23 -0.24 -0.25 -0.24 -0.22 -0.19 -0.19 -0.19 Aruoba Diebold Scotti
667 282 397 373 374 363 364 363 362 388 389 392 368 370 372 373 389 380 389 392 388 374 374 US Jobless claims
5.5 -2.5 2.6 2.7 1.7 2.3 3.3 2.7 4.2 4.5 3.2 3.6 4.2 3.3 4.5 3.8 2.9 2.8 2.9 3.6 2.7 1.4 1.4 US chain store sales, YoY
638 316 479 547 546 548 542 540 538 540 536 543 532 530 522 515 510 513 517 509 502 505 504 CRB RIND
463 127 336 390 386 388 381 383 380 363 370 382 372 365 347 345 331 329 338 331 349 341 341 Copper
1022 237 504 383 386 388 389 390 389 390 394 397 400 405 408 414 415 416 414 412 407 403 403 Container Ship Index
2007-
Source: IR&M, Bloomberg. Notes: US Surprise Index is from Citigroup. Bloomberg Consumer Comfort was previously from ABC News. Consumer Discretionary underperforms
Consumer Staples during economic slowdown. The Aruoba Diebold Scotti Business Conditions Index (ADS BCI Index) is designed to track real business conditions at high
frequency and is a daily index, published with a one week lag. CRB RIND is the Commodity Research Bureau/Reuters US Spot Raw Industrials Index consisting of raw
industrial components with pre-cyclical characteristics. The prices of index constituents are not as much distorted through aggressive trading activity.
The average percentile has been falling, slowly but gradually.
Surprises have been falling materially since April. It is difficult to be bullish if
reality is continuously worse than expectations.
Chart 6: Average percentile from high frequency indicators (Table 10) vs. S&P 500
600
700
800
900
1000
1100
1200
1300
1400
1500
10
20
30
40
50
60
70
80
90
100
2009 2010 2011 2012
S&
P 5
00
Av
era
ge
pe
rce
nti
le
Average percentile (lhs) S&P 500 Index (rhs)
Source: IR&M, Bloomberg.
The trend is down.
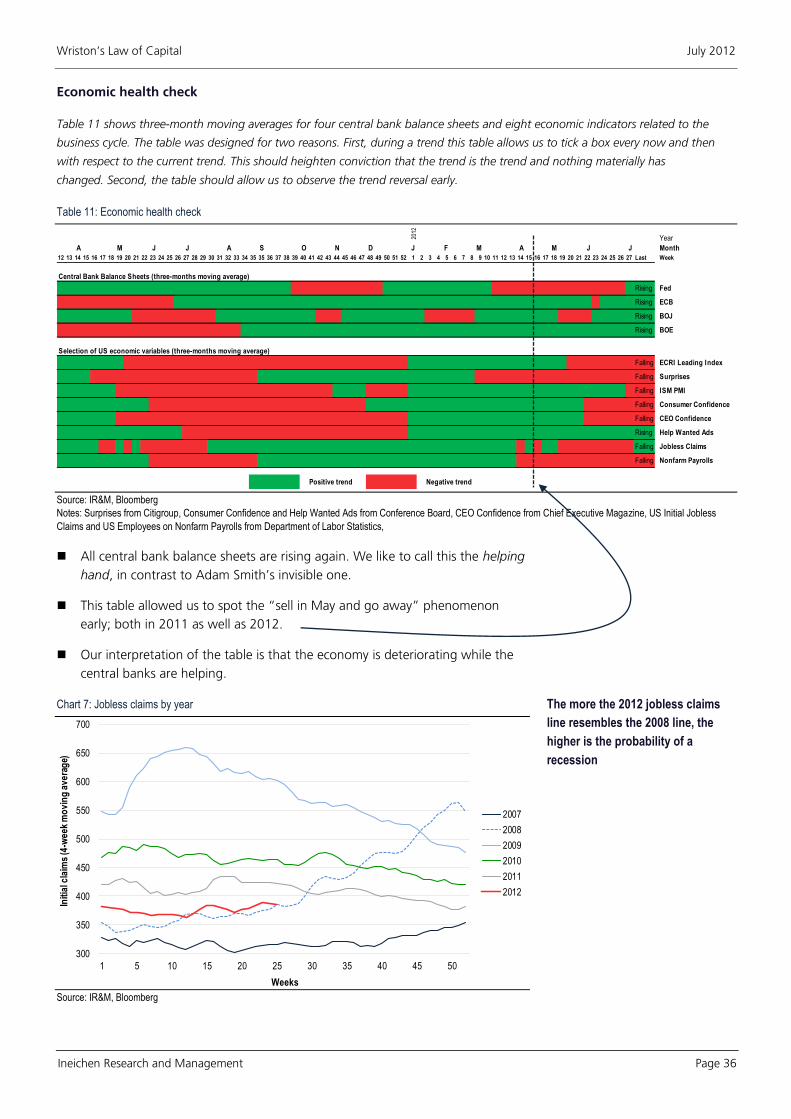
R
Wriston’s Law of Capital July 2012
Ineichen Research and Management Page 36
Economic health check
Table 11 shows three-month moving averages for four central bank balance sheets and eight economic indicators related to the
business cycle. The table was designed for two reasons. First, during a trend this table allows us to tick a box every now and then
with respect to the current trend. This should heighten conviction that the trend is the trend and nothing materially has
changed. Second, the table should allow us to observe the trend reversal early.
Table 11: Economic health check
2012
Year
A M J J A S O N D J F M A M J J Month
12 13 14 15 16 17 18 19 20 21 22 23 24 25 26 27 28 29 30 31 32 33 34 35 35 36 37 38 39 40 41 42 43 44 45 46 47 48 49 50 51 52 1 2 3 4 5 6 7 8 9 10 11 12 13 14 15 16 17 18 19 20 21 22 23 24 25 26 27 Last Week
Central Bank Balance Sheets (three-months moving average)
Rising Fed
Rising ECB
Rising BOJ
Rising BOE
Selection of US economic variables (three-months moving average)
Falling ECRI Leading Index
Falling Surprises
Falling ISM PMI
Falling Consumer Confidence
Falling CEO Confidence
Rising Help Wanted Ads
Falling Jobless Claims
Falling Nonfarm Payrolls
Positive trend Negative trend
Source: IR&M, Bloomberg
Notes: Surprises from Citigroup, Consumer Confidence and Help Wanted Ads from Conference Board, CEO Confidence from Chief Executive Magazine, US Initial Jobless
Claims and US Employees on Nonfarm Payrolls from Department of Labor Statistics,
All central bank balance sheets are rising again. We like to call this the helping
hand, in contrast to Adam Smith’s invisible one.
This table allowed us to spot the “sell in May and go away” phenomenon
early; both in 2011 as well as 2012.
Our interpretation of the table is that the economy is deteriorating while the
central banks are helping.
Chart 7: Jobless claims by year
300
350
400
450
500
550
600
650
700
1 5 10 15 20 25 30 35 40 45 50
Init
ial c
laim
s (4
-we
ek
mo
vin
g a
ve
rag
e)
Weeks
2007
2008
2009
2010
2011
2012
Source: IR&M, Bloomberg
The more the 2012 jobless claims
line resembles the 2008 line, the
higher is the probability of a
recession
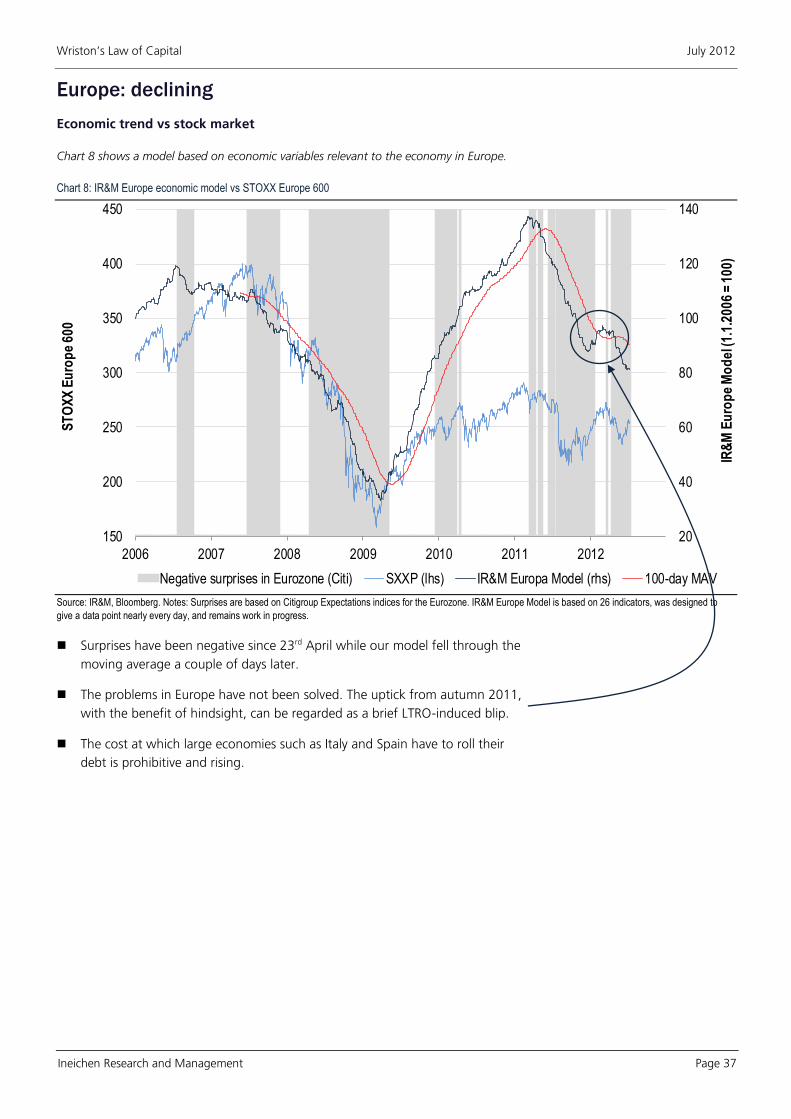
R
Wriston’s Law of Capital July 2012
Ineichen Research and Management Page 37
Europe: declining
Economic trend vs stock market
Chart 8 shows a model based on economic variables relevant to the economy in Europe.
Chart 8: IR&M Europe economic model vs STOXX Europe 600
20
40
60
80
100
120
140
150
200
250
300
350
400
450
2006 2007 2008 2009 2010 2011 2012
IR&
M E
uro
pe
Mo
de
l (1
.1.2
00
6 =
10
0)
ST
OX
X E
uro
pe
60
0
Negative surprises in Eurozone (Citi) SXXP (lhs) IR&M Europa Model (rhs) 100-day MAV
Source: IR&M, Bloomberg. Notes: Surprises are based on Citigroup Expectations indices for the Eurozone. IR&M Europe Model is based on 26 indicators, was designed to
give a data point nearly every day, and remains work in progress.
Surprises have been negative since 23rd April while our model fell through the
moving average a couple of days later.
The problems in Europe have not been solved. The uptick from autumn 2011,
with the benefit of hindsight, can be regarded as a brief LTRO-induced blip.
The cost at which large economies such as Italy and Spain have to roll their
debt is prohibitive and rising.
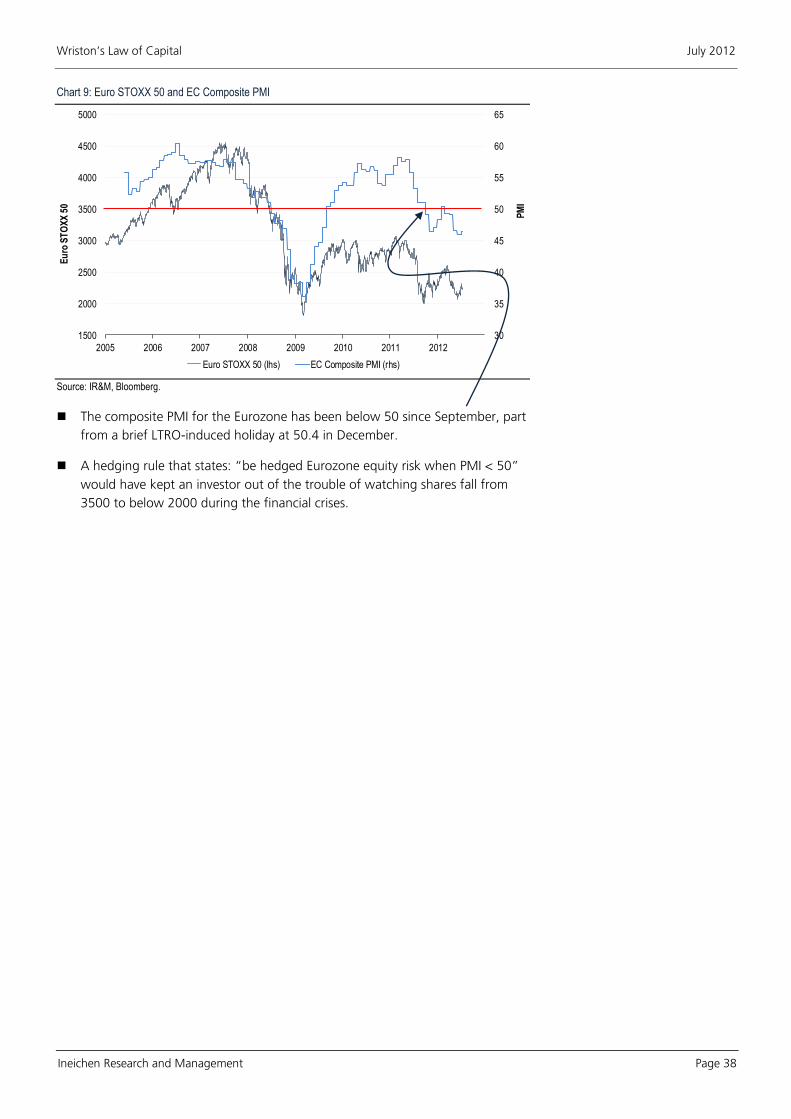
R
Wriston’s Law of Capital July 2012
Ineichen Research and Management Page 38
Chart 9: Euro STOXX 50 and EC Composite PMI
30
35
40
45
50
55
60
65
1500
2000
2500
3000
3500
4000
4500
5000
2005 2006 2007 2008 2009 2010 2011 2012
PM
I
Eu
ro S
TO
XX
50
Euro STOXX 50 (lhs) EC Composite PMI (rhs)
Source: IR&M, Bloomberg.
The composite PMI for the Eurozone has been below 50 since September, part
from a brief LTRO-induced holiday at 50.4 in December.
A hedging rule that states: “be hedged Eurozone equity risk when PMI < 50”
would have kept an investor out of the trouble of watching shares fall from
3500 to below 2000 during the financial crises.

R
Wriston’s Law of Capital July 2012
Ineichen Research and Management Page 39
Germany: declining
Economic trend vs stock market
Chart 10 shows a model based on economic variables relevant to the economy in Germany.
Chart 10: IR&M Germany economic model vs DAX
50
65
80
95
110
125
140
3000
4000
5000
6000
7000
8000
9000
2006 2007 2008 2009 2010 2011 2012
IR&
M G
erm
an
y M
od
el (
1.1
.20
06
= 1
00
)
DA
X
Negative surprises in Germany (IR&M) DAX (lhs) IR&M Germany Model (rhs) 100-day MAV
Source: IR&M, Bloomberg. Notes: IR&M Germany Model is based on 15 indicators, was designed to give a data point nearly every day, and remains work in progress.
Surprises have been negative since mid-May, around the same time the model
fell below its moving average. The economy is now deteriorating.
Note that large drawdowns in the DAX occur when the trend is down. We
believe paying attention to these crosses, therefore, makes sense. It gives the
investor an opportunity to think about hedging.

R
Wriston’s Law of Capital July 2012
Ineichen Research and Management Page 40
Chart 11 shows the last and current business cycle based on IFO (Institut für Wirtschaftsforschung) climate indices. The horizontal
axis shows current business climate whereas the vertical axis shows business climate expectations for the next six months. All is
well in the upper right quadrant where current conditions as well as expectations are high. Then things economic start slowing
down and the path goes from the upper right hand quadrant to the lower left hand quadrant. Once the nadir is reached, the
path is from the lower left to the upper right again. Then the whole circle starts anew. The practical risk management relevance
is that one ought to be hedged on the way from the upper right hand corner to the lower left hand corner. It is in those periods
where the DAX experiences its losses. Chart 12 shows the DAX with PMI.
Chart 11: IFO Pan Germany Business Conditions and Expectations
70
75
80
85
90
95
100
105
110
115
80 85 90 95 100 105 110 115 120
Ex
pe
cta
tio
ns
(IF
O)
Current Business Conditions (IFO)
Recovery
Recession
Boom
Slowdown
02-2011
12-2008
11-2009
10-2011
02-2009
05-2012
06-2012
Source: IR&M, Bloomberg
The latest indication puts the German economy in the slowdown quadrant; i.e.
the trend is from the upper right hand corner towards the lower left. Our
interpretation of this is that financial conservatism is superior to financial
aggression.
Chart 12: DAX and PMI
30
35
40
45
50
55
60
65
2000
3000
4000
5000
6000
7000
8000
9000
2000 2001 2002 2003 2004 2005 2006 2007 2008 2009 2010 2011 2012
PM
I
DA
X
DAX (lhs) PMI (rhs)
Source: IR&M, Bloomberg
German PMI has fallen below 50 in March and has been continuously falling
ever since.

R
Wriston’s Law of Capital July 2012
Ineichen Research and Management Page 41
France: going Venezuela
Economic trend vs stock market
Chart 13 shows a model based on economic variables relevant to the economy in France.
Chart 13: IR&M France economic model vs CAC 40
50
60
70
80
90
100
110
120
130
2500
3000
3500
4000
4500
5000
5500
6000
6500
2006 2007 2008 2009 2010 2011 2012
IR&
M F
ran
ce
Mo
de
l (1
.1.2
006
= 1
00
)
CA
C 4
0
Negative surprises in Eurozone (Citi) CAC 40 (lhs) IR&M France Model (rhs) 100-day MAV
Source: IR&M, Bloomberg. Notes: Surprises are based on Citigroup Expectations indices for the Eurozone. IR&M France Model is based on 15 monthly indicators, was
designed to give a data point nearly every day, and remains work in progress.
Going socialist is probably not very helpful; see main section of this report.
Chart 14: INSEE Manufacturing Sentiment and General Production Expectations
-80
-60
-40
-20
0
20
40
60 70 80 90 100 110 120
Ge
ne
ral P
rod
uc
tio
n E
xp
ec
tati
on
s (I
NS
EE
)
Manufacturing Sentiment (INSEE)
Recovery
Recession
Boom
Slowdown
03-2011
03-2009
01-2012
05-2012
06-2012
Source: IR&M, Bloomberg
Our interpretation of this chart is that the economy is heading the wrong way.
Chart 14 is analogous to Chart 11.
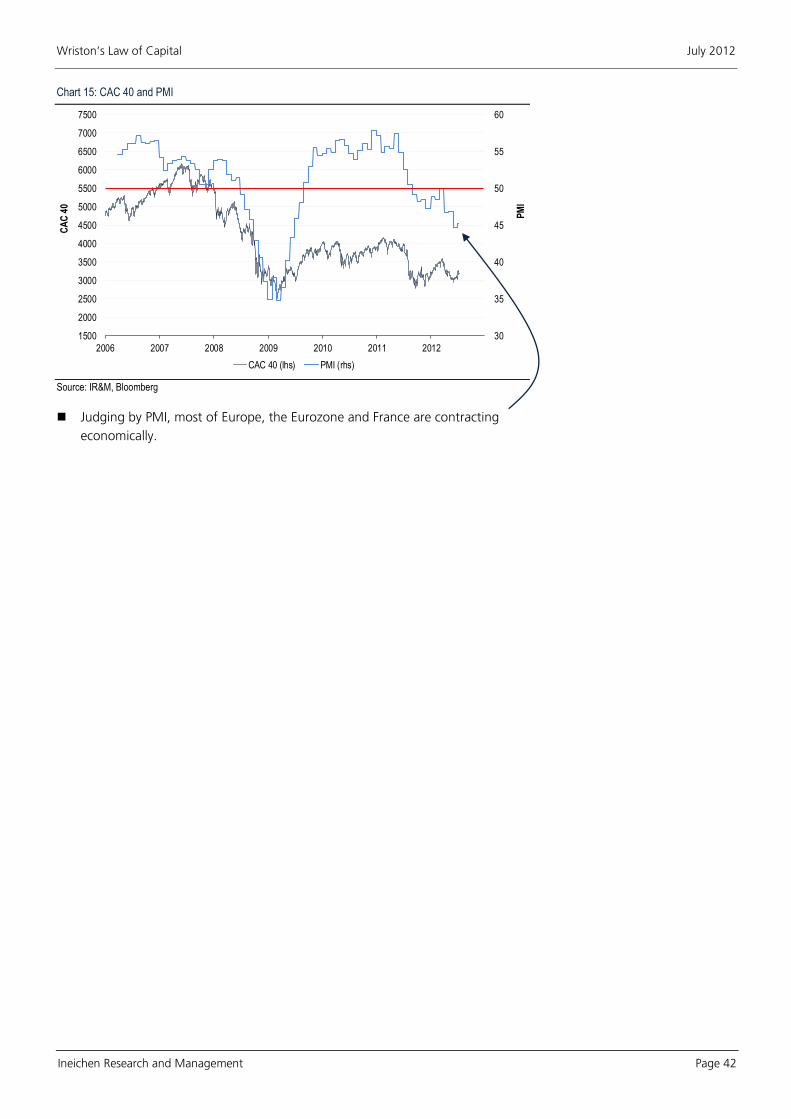
R
Wriston’s Law of Capital July 2012
Ineichen Research and Management Page 42
Chart 15: CAC 40 and PMI
30
35
40
45
50
55
60
1500
2000
2500
3000
3500
4000
4500
5000
5500
6000
6500
7000
7500
2006 2007 2008 2009 2010 2011 2012
PM
I
CA
C 4
0
CAC 40 (lhs) PMI (rhs)
Source: IR&M, Bloomberg
Judging by PMI, most of Europe, the Eurozone and France are contracting
economically.

R
Wriston’s Law of Capital July 2012
Ineichen Research and Management Page 43
Italy: declining
Economic trend vs stock market
Chart 16 shows a model based on economic variables relevant to the economy in Italy. Chart 17 shows consumer sentiment.
Chart 16: IR&M Italy economic model vs FTSE MIB
60
70
80
90
100
110
120
130
10000
15000
20000
25000
30000
35000
40000
45000
2006 2007 2008 2009 2010 2011 2012
IR&
M It
aly
Mo
de
l (1
.1.2
00
6 =
10
0)
FT
SE
MIB
Negative surprises in Eurozone (Citi) MIB (lhs) IR&M Italy Model (rhs) 100-day MAV
Source: IR&M, Bloomberg. Notes: Surprises are based on Citigroup Expectations indices for the Eurozone. IR&M Italy Model is based on 13 indicators, was designed to give a
data point nearly every day, and remains work in progress.
The steady decline of “things economic” in Italy has prevented the investor
from becoming overtly bullish on Italian risk assets. However, many of Italy’s
problems are not shown by economic models, as pointed out in the first
section of this document. And we haven’t even mentioned the horrid
demographics in Italy.
Yes, we do indeed hear the contrarians sing in chorus “buy when you hear the
canons, and sell when you hear the violins.” We understand that logic.
However, it seems wiser to wait until the canons fall silent a bit. There most
likely will be an interval between the canon fire and one hears violins in Italy.
(Given that Berlusconi wants to come back—thereby not lifting the rank of
Italy in the Perceived Corruption Index all too much—there might be a satirical
comedy prior to the violins.)
“Buy when the cannons are
thundering and sell when the violins
are playing.”
—N.M. Rothschild (Nathan Mayer
Rothschild)

R
Wriston’s Law of Capital July 2012
Ineichen Research and Management Page 44
Chart 17: Italian consumer sentiment and FTSE MIB
85
90
95
100
105
110
115
120
125
10000
15000
20000
25000
30000
35000
40000
45000
50000
1995 2000 2005 2010
Ita
lian
Co
ns
um
er
Co
nfi
den
ce
FT
SE
MIB
FTSE MIB (lhs) Italy: Consumer confidence (rhs)
Source: IR&M, Bloomberg
Consumer sentiment is at a multi-year low.
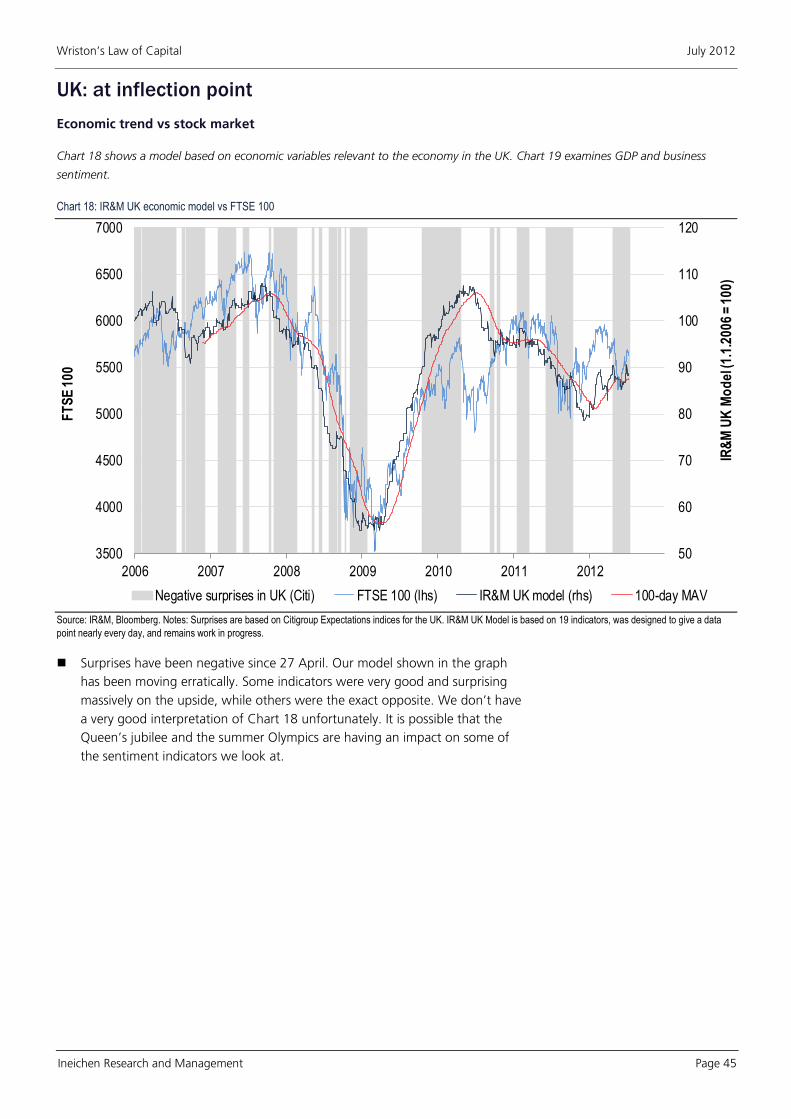
R
Wriston’s Law of Capital July 2012
Ineichen Research and Management Page 45
UK: at inflection point
Economic trend vs stock market
Chart 18 shows a model based on economic variables relevant to the economy in the UK. Chart 19 examines GDP and business
sentiment.
Chart 18: IR&M UK economic model vs FTSE 100
50
60
70
80
90
100
110
120
3500
4000
4500
5000
5500
6000
6500
7000
2006 2007 2008 2009 2010 2011 2012
IR&
M U
K M
od
el (
1.1
.20
06
= 1
00
)
FT
SE
10
0
Negative surprises in UK (Citi) FTSE 100 (lhs) IR&M UK model (rhs) 100-day MAV
Source: IR&M, Bloomberg. Notes: Surprises are based on Citigroup Expectations indices for the UK. IR&M UK Model is based on 19 indicators, was designed to give a data
point nearly every day, and remains work in progress.
Surprises have been negative since 27 April. Our model shown in the graph
has been moving erratically. Some indicators were very good and surprising
massively on the upside, while others were the exact opposite. We don’t have
a very good interpretation of Chart 18 unfortunately. It is possible that the
Queen’s jubilee and the summer Olympics are having an impact on some of
the sentiment indicators we look at.

R
Wriston’s Law of Capital July 2012
Ineichen Research and Management Page 46
Chart 19: UK GDP and business sentiment
-80
-60
-40
-20
0
20
40
60
-8
-6
-4
-2
0
2
4
6
2002 2003 2004 2005 2006 2007 2008 2009 2010 2011 2012
Llo
yd
s T
SB
Bu
sin
es
s B
aro
me
ter
UK
GD
P
UK GDP (lhs) Lloyds TSB Business Barometer (rhs)
Source: IR&M, Bloomberg.
The Lloyds TSB Business Barometer was an early indicator last time around.
The spike in March and April had us a bit confused.
Our current interpretation of the information we look at is that the UK is in
recession but potentially at an inflection point. It seems that the UK was well-
advised to stay out of the Eurozone. Furthermore, we get the impression that
the current administration understands Wriston’s Law of Capital. In Europe,
that’s quite a differentiator.

R
Wriston’s Law of Capital July 2012
Ineichen Research and Management Page 47
Switzerland: Safe harbour
Economic trend vs stock market
Chart 20 shows a model based on economic variables relevant to the economy in Switzerland.
Chart 20: IR&M Switzerland economic model vs SMI
20
40
60
80
100
120
140
160
3000
4000
5000
6000
7000
8000
9000
10000
2006 2007 2008 2009 2010 2011 2012
IR&
M S
wit
zerl
an
d M
od
el (
1.1
.20
06
= 1
00
)
SM
I
Negative surprises in Switzerland (Citi) SMI (lhs) IR&M Switzerland Model (rhs) 100-day MAV
Source: IR&M, Bloomberg. Notes: Surprises are based on Citigroup Expectations indices for Switzerland. IR&M Switzerland Model is based on 16 indicators, was designed to
give a data point nearly every day, and remains work in progress.
Surprises have been positive since 8 March 2012. Our interpretation of the
chart shown here is that the trend is up. However, Switzerland is not an island.
Switzerland’s PMI for example is strongly correlated with the Eurozone which
is Switzerland’s main trading partner.
The long-term implications of the currency peg are unknown. Intuitively one
would assume pegging a strong currency to a failed experiment is unwise; but
then who knows?
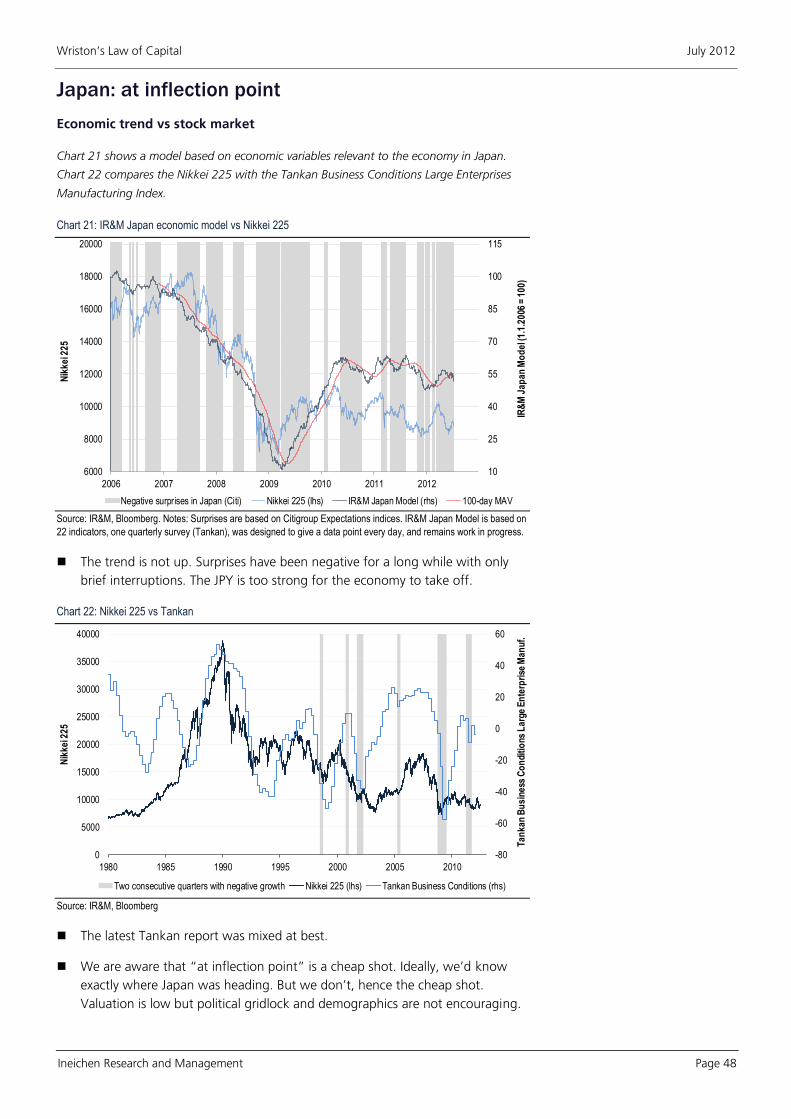
R
Wriston’s Law of Capital July 2012
Ineichen Research and Management Page 48
Japan: at inflection point
Economic trend vs stock market
Chart 21 shows a model based on economic variables relevant to the economy in Japan.
Chart 22 compares the Nikkei 225 with the Tankan Business Conditions Large Enterprises
Manufacturing Index.
Chart 21: IR&M Japan economic model vs Nikkei 225
10
25
40
55
70
85
100
115
6000
8000
10000
12000
14000
16000
18000
20000
2006 2007 2008 2009 2010 2011 2012
IR&
M J
ap
an
Mo
de
l (1
.1.2
006
= 1
00
)
Nik
ke
i 22
5
Negative surprises in Japan (Citi) Nikkei 225 (lhs) IR&M Japan Model (rhs) 100-day MAV
Source: IR&M, Bloomberg. Notes: Surprises are based on Citigroup Expectations indices. IR&M Japan Model is based on
22 indicators, one quarterly survey (Tankan), was designed to give a data point every day, and remains work in progress.
The trend is not up. Surprises have been negative for a long while with only
brief interruptions. The JPY is too strong for the economy to take off.
Chart 22: Nikkei 225 vs Tankan
-80
-60
-40
-20
0
20
40
60
0
5000
10000
15000
20000
25000
30000
35000
40000
1980 1985 1990 1995 2000 2005 2010
Ta
nk
an
Bu
sin
ess
Co
nd
itio
ns
La
rge
En
terp
rise
Ma
nu
f.
Nik
ke
i 22
5
Two consecutive quarters with negative growth Nikkei 225 (lhs) Tankan Business Conditions (rhs)
Source: IR&M, Bloomberg
The latest Tankan report was mixed at best.
We are aware that “at inflection point” is a cheap shot. Ideally, we’d know
exactly where Japan was heading. But we don’t, hence the cheap shot.
Valuation is low but political gridlock and demographics are not encouraging.

R
Wriston’s Law of Capital July 2012
Ineichen Research and Management Page 49
China: at inflection point
Economic trend vs stock market
Chart 23 shows a model based on economic variables relevant to the economy in China.
Chart 23: IR&M China economic model vs Shanghai Composite
70
80
90
100
110
120
130
600
1600
2600
3600
4600
5600
6600
2006 2007 2008 2009 2010 2011 2012
IR&
M C
hin
a M
od
el (
1.1
.20
06
=1
00
)
Sh
an
gh
ai C
om
po
site
Negative surprises in China (Citi) Shanghai Composite (lhs) Model 100-day MAV
Source: IR&M, Bloomberg. Notes: Surprises are based on Citigroup Expectations indices. IR&M China Model is based on
19 indicators, includes a daily read of relative performance between property stocks and a market index, was designed to
give a data point every day, and remains work in progress. Note that we had issues with data on China in the past.
The debate between hard and soft landing is not going away. Our
interpretation of the data is that China is at an inflection point. Surprises have
been negative since mid-March though.
Chart 24: PMI vs industrial output
20
30
40
50
60
70
0
5
10
15
20
25
2005 2006 2007 2008 2009 2010 2011 2012
PM
I
Ind
us
tria
l ou
tpu
t, y
oy
Industrial output, yoy (lhs) PMI (CFLP, rhs) New Export Orders PMI (CFLP, rhs)
Source: IR&M, Bloomberg
Official PMI was at 50.2 in June; exactly the middle between the economy
contracting and expanding; hence the term “inflection point”. New orders
dipped below 50. Industrial output is contracting but not collapsing.

R
Wriston’s Law of Capital July 2012
Ineichen Research and Management Page 50
Economic health check
Thanks to WikiLeaks we know what politburo member Li Keqiang thinks are important and incorruptible measures for China’s
economic speed. Given China’s high level of perceived corruption, it makes sense to look for incorruptible proxies. Li Keqiang is
the First-ranking Vice-Premier and deputy Party secretary of the State Council of the People's Republic of China, the seventh
ranked member of the Politburo Standing Committee, the People's Republic of China's de facto highest decision-making body.
Most official statistics are “for reference only” he once confide—smiling, apparently—to the US ambassador. The three variables
he looks at are electricity consumption, rail cargo volume, and bank lending. We look at electricity and rail cargo volume as a
form of economic health check. Note that some researchers suggest that electricity data is corrupted too.
Chart 25: Electricity
0
50
100
150
200
250
300
350
400
450
1 2 3 4 5 6 7 8 9 10 11 12
Ele
ctr
icit
y, b
n k
wh
Month
2005
2006
2007
2008
2009
2010
2011
2012Falling electricity is the warning
sign to look out for.
Source: IR&M, Bloomberg
Electricity remains above the previous year.
Chart 26: Freight traffic volume
100,000
120,000
140,000
160,000
180,000
200,000
220,000
240,000
260,000
280,000
1 2 3 4 5 6 7 8 9 10 11 12
Ch
ina
Fre
igh
t Tra
ffic
Vo
lum
es
Ra
ilwa
ys
Month
2005
2006
2007
2008
2009
2010
2011
2012Falling freight traffic is the
warning sign to look out for.
Source: IR&M, Bloomberg
Freight traffic has been higher than in the previous year. We can tick these
two boxes and move on.

R
Wriston’s Law of Capital July 2012
Ineichen Research and Management Page 51
Inflation
The spectre of inflation is not only an issue for China. One could argue inflation in China, or any negative surprises out of China,
economic or geopolitical, are akin to a sword of Damocles bumbling over the global economy. The following graph shows CPI
with agricultural wholesale prices. The reason inflation is important from a risk assessment standpoint is that food inflation
spiralling out of control would not only bear the risk of economic weakness but also heighten the risk of intra-national tensions.
Chart 27: China CPI
-10
-5
0
5
10
15
20
25
-4
-2
0
2
4
6
8
10
2000 2001 2002 2003 2004 2005 2006 2007 2008 2009 2010 2011 2012
Ag
ric
ult
ura
l wh
ole
sa
le p
ric
es
CP
I
China CPI YoY (lhs) China agricultural wholesale prices YoY (rhs)
Source: IR&M, Bloomberg
Inflation seems under control. However, falling inflation has been interpreted
by the market both positively as well as negatively. Good, giving the
authorities more options to intervene; bad; because the authorities need to
intervene again.
Chart 28: China Real Estate Climate
94
96
98
100
102
104
106
108
0
1000
2000
3000
4000
5000
6000
7000
2000 2001 2002 2003 2004 2005 2006 2007 2008 2009 2010 2011 2012
Ch
ina
Re
al E
sta
te C
lima
te
Sh
an
gh
ei C
om
po
site
Shanghai Composite (lhs) China Real Estate Climate (rhs)
Source: IR&M, Bloomberg
Real estate prices as well as real estate sentiment has been falling. However,
the stock market has not crashed. It is not entirely unthinkable that the local
private investor soon will regard the stock market as the least unattractive
option.

R
Wriston’s Law of Capital July 2012
Ineichen Research and Management Page 52
Risk
Yield curves
Table 12 shows six yield curves, the changes over one week, one month, and year-to-date, as well as the 10-year range.
Table 12: Yield curves
1.53
2.64
1.35
2.19
1.60
2.99
0.80
1.85
0.56
0.95
3.26
0
1
2
3
4
5
6
7
3M 6M 2Y 5Y 10Y 30Y 3M 6M 2Y 5Y 10Y 30Y 3M 6M 2Y 5Y 10Y 30Y 3M 6M 2Y 5Y 10Y 30Y 3M 6M 2Y 5Y 10Y 30Y 3M 6M 2Y 5Y 10Y
Yie
ld,
%
10Y Range
10/07/12
01/06/12
30/12/11
31/12/10
USD EUR GBP JPY CHF CNY
Source: IR&M, Bloomberg
Note: Numbers in graph stand for 10-year and 30-year yields. Short end of CHF yield curve “disappears” because yields are negative.
We call the fall and flattening of the yield curve “Japanisation”. The first three
yield curves seem to be continuously moving to resemble the yield curve of
Japan (or Switzerland).
We expect this chart to warn us early when these curves start to move
northwards. This will be relevant for bond risk as well as assessments of
currencies. It is not entirely unthinkable that inflation will be an issue during
most people’s life time. Speaking of inflation:

R
Wriston’s Law of Capital July 2012
Ineichen Research and Management Page 53
Central banks
Chart 29 shows the sum of four central bank balance sheets.
Chart 29: Total assets central banks
3,000
4,000
5,000
6,000
7,000
8,000
9,000
2007 2008 2009 2010 2011 2012
US
Db
n
Total assets central banks (Fed, ECB, BoJ, BoE)
Source: IR&M, Bloomberg
The trend is unmistakably from the lower left to the upper right. This is a
“helping hand” rather than an invisible one. The cost to society from this
“help” is yet unknown. However, history suggests that the help is not entirely
“free of charge”.
Chart 30: Target rates
0
1
2
3
4
5
6
7
8
9
10
1990 1995 2000 2005 2010
Ta
rge
t ra
te (<
10
%)
US, EU, and UK easing US EU UK Japan China
Source: IR&M, Bloomberg
Central banks, including China, are easing. Money was, is, and remains cheap.
And is hoarded.
EUR rates fell below 1% for the first time on 5th July.

R
Wriston’s Law of Capital July 2012
Ineichen Research and Management Page 54
Financial risk monitor
Table 13 is a risk monitor. The idea is to show heightened risk or stress very early on. We update this frequently in our on-screen
updates.
Table 13: Financial risk monitor
Source: IR&M, Bloomberg
Note: *10-year period or since data is available.
The colour coding allows to spot where the issues are at a brief glance.
The bone of contention in the Eurozone crisis is the sovereign risk of Italy and
Spain. They’re too big to fail, but doing exactly that.
Default insurance for Italy and Spain has been rising during July.
2010 2011 2012
Market Risk proxy High Low Median 11 12 01 02 03 04 05 06 07 08 09 10 11 12 01 02 03 04 05 06 Last
Composite St. Louis Fed Stress 5.5 -1.3 0.1 0.2 0.1 -0.1 -0.1 -0.1 -0.3 -0.1 0.1 0.0 0.8 1.1 0.7 1.0 0.7 0.5 0.3 0.1 0.2 0.4 0.3 0.3
BB Financial Conditions 1.3 -12.7 -0.1 -0.3 0.2 0.1 0.4 0.4 0.6 0.5 0.5 0.0 -0.9 -1.8 -1.0 -1.0 -1.0 -0.5 -0.1 0.1 0.0 -0.7 -0.1 -0.1
Citi Macro Risk 0.99 0.0 0.42 0.51 0.28 0.33 0.32 0.32 0.31 0.44 0.40 0.68 0.90 0.97 0.82 0.85 0.79 0.59 0.47 0.36 0.35 0.72 0.36 0.40
Liquidity LIBOR 1M OIS Spread 338 1 9 7 8 9 11 12 10 9 8 8 13 15 16 18 22 17 13 12 10 8 8 8
Euro Libor-OIS Spread 196 -2 27 33 41 21 25 21 16 28 20 35 64 81 81 98 97 77 63 42 39 39 42 39
Euro Basis Swap Spread -3 -300 -38 -56 -60 -31 -33 -21 -8 -26 -28 -46 -80 -105 -92 -131 -114 -72 -67 -51 -45 -50 -54 -57
Credit TED Spread 464 9 31 15 18 16 17 21 24 21 24 16 32 35 44 53 57 49 41 40 37 40 38 37
EmMa Spread 1037 111 278 277 241 246 237 227 234 247 239 256 336 462 376 418 425 398 338 314 330 413 378 372
CDX.NA.IG 279 29 95 100 85 84 82 96 88 89 91 96 115 144 121 128 120 101 94 91 95 123 112 111
iT raxx 5Y Europe 217 20 88 117 105 98 98 102 97 102 106 117 153 202 162 185 173 143 129 125 140 180 166 173
iT raxx 5Y E. Crossover 1150 150 410 522 437 416 386 384 353 370 395 438 646 839 660 757 755 620 568 613 650 719 662 678
Sovereign iT raxx 5Y E. Sovereign 386 47 183 203 210 176 179 174 187 197 217 270 293 339 304 327 357 338 343 269 275 326 282 285
(5Y CDS) Greece 5047 5 36 976 1074 869 941 1003 1350 1420 1952 1722 2261 3536 >5000 essentially default
Ireland 1192 5 222 611 615 596 585 642 661 669 769 790 769 700 694 711 726 621 603 572 566 726 553 547
Portugal 1527 4 32 543 500 433 465 580 653 679 745 924 918 1110 970 1060 1093 1484 1175 1076 961 1185 805 841
Spain 621 3 35 365 350 249 249 233 237 251 270 363 358 382 340 408 394 376 368 437 476 599 531 587
Italy 592 6 27 269 238 180 183 151 148 164 171 310 361 470 445 487 503 416 381 397 445 563 488 522
Belgium 406 2 8 201 218 173 174 139 143 151 143 199 230 260 269 304 316 245 238 233 252 282 240 224
France 250 2 11 105 101 99 91 74 74 73 80 122 154 187 176 200 222 181 176 169 193 219 189 184
Rates BBOX (swaption volat.) 138 68 91 96 101 100 97 99 96 96 98 98 93 94 96 97 94 86 91 89 86 82 80 79
Bonds MOVE (bond volat.) 265 51 96 102 110 96 91 91 77 72 89 88 98 101 107 100 91 72 76 79 63 74 73 63
Equities VIX (equity volat.) 81 10 19 24 18 20 18 18 15 15 17 25 32 43 30 28 23 19 18 16 17 24 17 18
Skew Index (CBOE) 142 106 119 117 121 130 129 125 127 124 122 121 120 115 121 117 116 122 125 125 120 119 119 120
FX VXY (G7 FX volat.) 24 6 10 13 13 11 10 11 11 11 11 12 12 14 12 13 12 11 10 10 9 11 10 9
10-year*

R
Wriston’s Law of Capital July 2012
Ineichen Research and Management Page 55
Macro and geopolitical uncertainty
Chart 31 combines the Citigroup Macro risk index with the Citigroup G10 Economic Surprise
Index. All is well when these indices are rising, surprises rising above the zero line.
Chart 31: Macro risk and financial conditions
0.0
0.1
0.2
0.3
0.4
0.5
0.6
0.7
0.8
0.9
1.0-120
-100
-80
-60
-40
-20
0
20
40
60
80
2007 2008 2009 2010 2011 2012
Cit
i M
ac
ro R
isk
Ind
ex
Cit
igro
up
Ec
on
om
ic S
urp
ris
e In
dex
-G
10
Citi Economic Surprise Index (G10, lhs) Citi Macro Risk Index (reversed scale, rhs)
Positive surprises
Negative surprises Risk aversion
Risk seeking
Source: IR&M, Bloomberg
Many risks that investors face today are beyond “macro” as the first section of
this report tries to bring across.
Table 14 shows the IR&M bubble monitor that we update quarterly. It’s a tick-the-box
approach to six characteristics that are typically associated with a building bubble. Note that
the box ticking is only semi-factual, i.e., some ticks are open to debate.
Table 14: IR&M bubble monitor
Source: IR&M
Note: changes to previous quarterly report are marked with grey.
Chinese real estate bubble seems to be deflating in an orderly fashion.
The deflating of the welfare state bubble might not be as orderly.
GoldUS
Treas.
China real
estate
China
stocks
EmMa
stocks
Prices at or close to all-time-high
Very strong recent price rise
Money too cheap for too long
Excessive use of leverage
Retail participation
Front-page news (TV, Mags, etc.)
No Yes, be alert!

R
Wriston’s Law of Capital July 2012
Ineichen Research and Management Page 56
Table 15 shows the IR&M conflict monitor that we update quarterly. It’s a tick-the-box
approach to a selection of geopolitical as well as currency (war) conflict zones.
Table 15: IR&M conflict monitor
Source: IR&M
Binyamin Netanyahu, the Israeli prime minister, has been to Washington DC.
Whether he got the sign off to attack Iran or whether was asked to hold back,
indefinitely or until after the US elections, we don’t know.
The Middle East and the Eurozone remain in turmoil.
Note that this table is also an indication for the impact of Wriston’s Law of
Capital. The migration of capital and the flight of capital currently have its
origin in areas in turmoil.
1 The Guardian, Netanyahu on Iran: 'None of us can afford to wait much longer', 6 March 2012
Geopolitical Q1 Q2 Q3 Q4 Q1 Q2 Q3 Currency Q1 Q2 Q3 Q4 Q1 Q2 Q3
North Korea vs RoW China vs US
Iran vs US/RoW Brazil vs West
India vs China South Korea vs West
India vs Pakistan Euro
Russia vs Japan
Middle East
Alert levels:
2011 20112012 2012
"Amazingly, some people refuse to
acknowledge that Iran's goal is to
develop nuclear weapons. You see,
Iran claims that it's enriching
uranium to develop medical
research. Yeah, right. If it looks like
a duck, walks like a duck, and
quacks like a duck, then what is it?
That's right, it's a duck. But this
duck is a nuclear duck and it's time
the world started calling a duck a
duck.
Fortunately, President Obama and
most world leaders understand that
the idea that Iran's goal is not to
develop nuclear weapons is
ridiculous.”
—Binyamin Netanyahu1

R
Wriston’s Law of Capital July 2012
Ineichen Research and Management Page 57
Fear gauge
Chart 32 shows the most prominent risk/fear gauge, the legendary VIX.
Chart 32: VIX
0
20
40
60
80
100
120
140
160
1985 1987 1989 1991 1993 1995 1997 1999 2001 2003 2005 2007 2009 2011
VIX
VIX
1987 crash
Gulf war Asian crisis
Russian default
9/11
Enron/Worldcom
Iraq war
Subprime crisis
Lehman
EUR debtcrisis
Tohoku
EUR debt crisis
Source: IR&M, Bloomberg
VIX has risen from the abnormally low levels of 15% at the end of March
pointed out in our last quarterly report. However, the average for 2012 is
19.1% which compares to 24.1% in 2011, 22.5% in 2010, 31.5% in 2009
and 32.6% in 2008. Somehow Chart 33 suggests that the calendar year is not
over yet.
Chart 33: VIX by calendar year
0
10
20
30
40
50
60
70
80
90
1 25 50 75 100 125 150 175 200 225 250
VIX
Trading days
2008
2009
2010
2011
2012
Source: IR&M, Bloomberg

R
Wriston’s Law of Capital July 2012
Ineichen Research and Management Page 58
Appendix
Government expenditure and corruption
Table 16: Government expenditure and corruption, all 168 countries, sorted by last column, good to bad
Source: IR&M, Heritage foundation, transparency.org
The first two columns are for 2012, the Perceived Corruption Index is from 2011.
Tax
burden
% GDP
(1)
Govt.
expend.
% GDP
(2)
Perc.
Corruption
Index
(3)
Rank
of (2)
from 168
Rank
of (3)
from 168
Average
rank
from 168
Singapore 13.4 17.0 9.2 9 5 7
Hong Kong 13.9 17.3 8.4 12 12 12
Bahamas 15.3 22.2 7.3 30 21 26
Costa Rica 13.8 17.5 4.8 14 47 31
Macau 27.4 19.9 5.2 20 42 31
Chile 16.1 24.4 7.2 40 22 31
United Arab Emirates 1.8 25.8 6.8 45 28 37
Mauritius 18.9 23.5 5.2 35 42 39
Qatar 5.6 29.7 7.2 63 22 43
El Salvador 14.0 17.2 3.4 10 77 44
Australia 27.1 33.1 8.8 79 8 44
Peru 15.2 17.4 3.4 13 77 45
Switzerland 30.3 33.7 8.8 85 8 47
Rwanda 12.3 26.8 5.0 49 46 48
Madagascar 10.5 14.6 3.0 3 95 49
Uruguay 25.1 32.3 7.0 74 25 50
Thailand 14.9 20.4 3.4 23 77 50
Saint Lucia 28.1 32.8 7.0 76 25 51
Gambia 13.6 22.0 3.5 27 74 51
Panama 17.0 19.8 3.3 19 83 51
Indonesia 11.4 16.7 3.0 7 95 51
China 17.5 23.0 3.6 33 72 53
Bahrain 4.0 30.4 5.2 67 42 55
Guatemala 10.7 14.3 2.7 1 114 58
Bangladesh 8.6 14.3 2.7 1 114 58
Zambia 15.0 22.4 3.2 31 87 59
Namibia 28.9 30.0 4.4 64 55 60
South Korea 25.6 33.1 5.4 79 41 60
Vanuatu 17.2 25.9 3.5 46 74 60
Malaysia 15.7 30.3 4.3 66 57 62
New Zealand 31.0 42.8 9.5 123 1 62
Ethiopia 8.6 17.2 2.7 10 114 62
Sri Lanka 12.8 24.9 3.3 42 83 63
Burkina Faso 12.6 23.1 3.0 34 95 65
South Africa 23.4 30.6 4.1 69 61 65
Dominican Republic 13.1 16.9 2.6 8 123 66
Luxembourg 37.5 42.2 8.5 121 11 66
Japan 28.1 42.0 8.0 120 14 67
Saint Vincent and the Grenadines 27.1 36.2 5.8 99 35 67
Morocco 23.0 29.0 3.4 58 77 68
Jordan 16.2 33.2 4.5 81 54 68
Cape Verde 20.6 35.7 5.5 97 39 68
Gabon 14.3 24.8 3.0 41 95 68
Canada 31.1 44.1 8.7 129 10 70
Colombia 15.0 29.4 3.4 62 77 70
Tanzania 15.3 25.7 3.0 44 95 70
Philippines 12.8 18.5 2.6 17 123 70
Tunisia 19.9 30.8 3.8 71 70 71
Benin 16.1 25.9 3.0 46 95 71
Uganda 12.5 15.3 2.4 5 136 71
Botswana 30.4 39.3 6.1 109 32 71
Cameroon 10.3 17.5 2.5 14 128 71
Bhutan 9.9 38.6 5.7 106 37 72
United States 24.0 42.2 7.1 121 24 73
Liberia 22.1 29.0 3.2 58 87 73
Norway 41.0 46.4 9.0 141 6 74
Mexico 17.5 26.9 3.0 52 95 74
Seychelles 30.9 36.7 4.8 100 47 74
Pakistan 9.3 19.9 2.5 20 128 74
Macedonia 26.1 33.3 3.9 82 66 74
Barbados 32.3 44.7 7.8 133 16 75
India 16.8 29.0 3.1 58 91 75
Kazakhstan 21.5 23.5 2.7 35 114 75
Central African Republic 8.7 15.4 2.2 6 146 76
Oman 4.2 39.3 4.8 109 47 78
Senegal 18.3 26.8 2.9 49 107 78
Germany 37.0 47.5 8.0 143 14 79
Mali 16.4 25.9 2.8 46 112 79
Honduras 15.7 23.5 2.6 35 123 79
Turkey 24.6 37.2 4.2 102 58 80
Sierra Leone 10.4 22.9 2.5 32 128 80
Togo 14.5 21.9 2.4 26 136 81
Estonia 34.7 45.2 6.4 134 29 82
Netherlands 39.1 51.4 8.9 156 7 82
Albania 25.7 31.9 3.1 72 91 82
Malta 27.8 43.3 5.6 125 38 82
Paraguay 14.5 19.6 2.2 18 146 82
Ireland 27.8 48.2 7.5 145 19 82
Samoa 22.7 35.9 3.9 98 66 82
Comoros 10.4 22.1 2.4 28 136 82
Finland 43.1 56.2 9.4 163 2 83
Sweden 46.4 55.2 9.3 162 4 83
Georgia 24.4 38.5 4.1 105 61 83
Nepal 12.2 19.9 2.2 20 146 83
Tax
burden
% GDP
(1)
Govt.
expend.
% GDP
(2)
Perc.
Corruption
Index
(3)
Rank
of (2)
from 168
Rank
of (3)
from 168
Average
rank
from 168
Israel 31.4 44.3 5.8 131 35 83
Nicaragua 22.2 23.8 2.5 38 128 83
Denmark 48.2 58.4 9.4 165 2 84
Dominica 31.6 43.3 5.2 125 42 84
Iceland 34.1 51.0 8.3 154 13 84
Iran 9.3 27.8 2.7 53 114 84
Cyprus 25.8 45.8 6.3 138 30 84
Spain 30.7 45.8 6.2 138 31 85
Laos 13.1 21.1 2.2 24 146 85
Côte d'Ivoire 16.5 21.1 2.2 24 146 85
Kuwait 1.5 41.9 4.6 119 52 86
Cambodia 9.4 18.3 2.1 16 155 86
United Kingdom 34.3 51.2 7.8 155 16 86
Turkmenistan 21.8 14.7 1.6 4 167 86
Niger 13.6 25.5 2.5 43 128 86
Poland 34.3 44.6 5.5 132 39 86
Suriname 30.6 32.9 3.0 77 95 86
Syria 11.5 26.8 2.6 49 123 86
Trinidad and Tobago 14.1 34.1 3.2 86 87 87
Lithuania 13.8 44.1 4.8 129 47 88
Austria 42.8 53.1 7.8 160 16 88
Brazil 34.3 38.8 3.8 108 70 89
Slovakia 29.3 41.5 4.0 116 63 90
Romania 27.4 38.7 3.6 107 72 90
Armenia 16.4 28.9 2.6 57 123 90
Belgium 43.2 54.1 7.5 161 19 90
Slovenia 37.9 49.0 5.9 148 34 91
Portugal 35.2 49.8 6.1 150 32 91
Ghana 23.7 41.5 3.9 116 66 91
Latvia 26.9 43.3 4.2 125 58 92
Jamaica 26.7 37.1 3.3 101 83 92
Tonga 19.5 35.5 3.1 94 91 93
Croatia 19.1 42.8 4.0 123 63 93
Mozambique 15.4 32.0 2.7 73 114 94
Saudi Arabia 5.4 45.7 4.7 137 51 94
France 41.9 56.2 7.0 163 25 94
Malawi 16.5 35.5 3.0 94 95 95
Vietnam 22.3 33.4 2.9 83 107 95
Guinea 15.8 24.1 2.1 39 155 97
Haiti 11.7 22.1 1.8 28 166 97
Swaziland 35.9 38.1 3.1 104 91 98
Czech Republic 34.8 45.9 4.4 140 55 98
Bulgaria 25.7 40.7 3.3 113 83 98
Egypt 15.3 34.6 2.9 89 107 98
Argentina 31.6 37.9 3.0 103 95 99
Tajikistan 17.6 28.6 2.3 55 144 100
Kenya 20.7 28.7 2.2 56 146 101
Ecuador 17.9 34.5 2.7 88 114 101
Hungary 39.1 50.2 4.6 151 52 102
Nigeria 6.9 30.4 2.4 67 136 102
Lebanon 17.2 32.5 2.5 75 128 102
Mauritania 15.2 30.6 2.4 69 136 103
Bolivia 22.6 35.5 2.8 94 112 103
Mongolia 20.6 35.2 2.7 92 114 103
Montenegro 26.7 47.7 4.0 144 63 104
São Tomé and Príncipe 16.7 41.2 3.0 114 95 105
Papua New Guinea 22.4 30.2 2.2 65 146 106
Democratic Republic of the Congo 15.9 28.2 2.0 54 159 107
Chad 7.1 29.3 2.0 61 159 110
Djibouti 21.0 43.8 3.0 128 95 112
I taly 43.5 51.8 3.9 157 66 112
Algeria 11.1 41.7 2.9 118 107 113
Azerbaijan 14.4 34.8 2.4 90 136 113
Cuba 21.2 75.2 4.2 168 58 113
Greece 29.4 52.9 3.4 159 77 118
Guinea-Bissau 10.2 35.0 2.2 91 146 119
Kyrgyzstan 22.2 33.4 2.1 83 155 119
Bosnia and Herzegovina 37.0 50.2 3.2 151 87 119
Guyana 21.6 40.0 2.5 112 128 120
Lesotho 56.9 65.5 3.5 167 74 121
Moldova 32.0 45.2 2.9 134 107 121
Venezuela 14.5 33.0 1.9 78 163 121
Yemen 8.0 35.2 2.1 92 155 124
Russia 34.4 41.4 2.4 115 136 126
Uzbekistan 20.8 34.2 1.6 87 167 127
Solomon Islands 23.8 48.2 2.7 145 114 130
Angola 9.0 39.5 2.0 111 159 135
Belarus 24.9 46.6 2.4 142 136 139
Zimbabwe 39.0 45.2 2.2 134 146 140
Ukraine 36.9 48.5 2.3 147 144 146
Maldives 14.1 64.9 2.5 166 128 147
Equatorial Guinea 2.2 49.0 1.9 148 163 156
Burundi 18.1 50.7 1.9 153 163 158
Libya 5.4 52.3 2.0 158 159 159

R
Wriston’s Law of Capital July 2012
Ineichen Research and Management Page 59
The Laffer curve
Refresher from Wikipedia
The Laffer curve was coined by journalist Jude Wanniski in the 1970s, with
Wanniski naming the curve after an idea sketched on a napkin in a restaurant
by Arthur Laffer. Laffer later pointed out that the concept was not original,
noting similar ideas in the writings of both 14th century Muslim philosopher
Ibn Khaldun (who discussed the idea in his 1377 Muqaddimah) and John
Maynard Keynes. Numerous other historical precedents also exist.
The Laffer Curve is a theoretical representation of the relationship between
government revenue raised by taxation and all possible rates of taxation. It is
used to illustrate the concept of taxable income elasticity (that taxable income
will change in response to changes in the rate of taxation). The curve is
constructed by thought experiment. First, the amount of tax revenue raised at
the extreme tax rates of 0% and 100% is considered. It is clear that a 0% tax
rate raises no revenue, but the Laffer curve hypothesis is that a 100% tax rate
will also generate no revenue because at such a rate there is no longer any
incentive for a rational taxpayer to earn any income, thus the revenue raised
will be 100% of nothing. If both a 0% rate and 100% rate of taxation
generate no revenue, it follows from the extreme value theorem that there
must exist at least one rate in between where tax revenue would be a
maximum. The Laffer curve is typically represented as a graph which starts at
0% tax, zero revenue, rises to a maximum rate of revenue raised at an
intermediate rate of taxation and then falls again to zero revenue at a 100%
tax rate. One potential result of the Laffer curve is that increasing tax rates
beyond a certain point will become counterproductive for raising further tax
revenue.
Based on economic analysis John Keynes father of Keynesian economics and
his followers recommended "pump-priming" the economy to avoid recession:
cutting taxes, increasing government borrowing, and spending during
economic down-turns.
Supply-side economics is a school of macroeconomic thought that argues that
economic growth can be most effectively created by lowering barriers for
people to produce (supply) goods and services, such as adjusting income tax
and capital gains tax rates, and by allowing greater flexibility by reducing
regulation. Consumers will then benefit from a greater supply of goods and
services at lower prices.
Typical policy recommendations of supply-side economics are lower marginal
tax rates and less regulation. Maximum benefits from taxation policy are
achieved by optimizing the marginal tax rates to spur growth, although it is a
common misunderstanding that supply side economics is concerned only with
taxation policy when it is about removing barriers to production more
generally.

R
Wriston’s Law of Capital July 2012
Ineichen Research and Management Page 60
Publications
Risk management research (subscription based)
Pompous meddling continues 2 July 2012
Empty monetary bag of tricks 22 June 2012
Helping hand rather than an invisible one 15 June 2012
Fed recommends to hedge too 8 June 2012
Waiting for the next fix 1 June 2012
Hopium running low 25 May 2012
Euro area tearing itself apart 18 May 2012
PMIs make for horrid reading 7 May 2012
Just in the middle of the river 2 May 2012
Risky fragility 19 April 2012
What makes bears blush (Q2 2012 report) 11 April 2012
Conditionally well but subject to revision 4 April 2012
Not yet out of the woods 22 March 2012
Eerily unchanged 15 March 2012
Ltroveneous double liquidity whammy 2 March 2012
Bullish middle-game: an intermezzo? 17 February 2012
Shooting the economic lights out 3 February 2012
Confidence rally 27 January 2012
Relatively difficult (Q1 2012 report) 16 January 2012
Global economy stabilises a bit 22 December 2011
Santa put 8 December 2011
Europe in the tails 28 November 2011
Gap between US and Europe opening 16 November 2011
October looks like a short sigh of relief 3 November 2011
On can kicking and bouncing dead cats 25 October 2011
Kicked can cause dead cat to bounce 16 October 2011
Beware of lights at the end of tunnel 7 October 2011
Europe doubling down (inaugural quarterly report, available on www.ineichen-rm.com) 3 October 2011
Europe is levering up, ie, doubling down 30 September 2011
Summer of 2008 revisited 23 September 2011
Depression rather than recession 16 September 2011
Déjà vu 9 September 2011
Global economy arguably in recession 2 September 2011
Risk levels in Europe have risen strongly 26 August 2011
US recession a sure thing 19 August 2011
PIIGSF? 12 August 2011
Early indications continue to deteriorate 5 August 2011
Free six months trials available. (No gmail, hotmail, yahoo, etc. accounts)
Absolute returns research (available on www.ineichen-rm.com)
Diversification? What diversification? June 2012
Regulomics May 2011
Equity hedge revisited September 2010
Absolute returns revisited April 2010

R
Wriston’s Law of Capital July 2012
Ineichen Research and Management Page 61
Bibliography Ackoff, Russell L. (1989) "From Data to Wisdom," Journal of Applied Systems Analysis, 16: 3-9.
Chua, Amy (2007) “Day of Empire—How Hyperpowers Rise to Global Dominance-and Why They Fall,” New York:
Anchor Books.
Durant, Will and Ariel (1968) “The Lessons of History,” New York: Simon & Schuster, Inc.
Von Mises, Ludwig. (1996) Human Action—A Treatise on Economics, 4th edition. San Francisco: Fox & Wilkes. First
published 1949 by Yale University.
Copyright © 2012 by Ineichen Research and Management AG, Switzerland
All rights reserved. Reproduction or retransmission in whole or in part is prohibited except by permission. The information set forth in this document has been obtained from publicly available sources,
unless stated otherwise. All information contained in this report is based on information obtained from sources which Ineichen Research and Management (“IR&M”) believes to be reliable. IR&M
provides this report without guarantee of any kind regarding its contents.
This document is for information purposes only and should not be construed as investment advice or an offer to sell (nor the solicitation of an offer to buy) any of the securities it refers to. The
information has not been independently verified by IR&M or any of its affiliates. Neither IR&M nor any of its affiliates makes any representations or warranties regarding, or assumes any responsibility
for the accuracy, reliability, completeness or applicability of, any information, calculations contained herein, or of any assumptions underlying any information, calculations, estimates or projections
contained or reflected herein. Neither this document nor the securities referred to herein have been registered or approved by any regulatory authority of any country or jurisdiction.
This material is confidential and intended solely for the information of the person to whom it has been delivered and may not be distributed in any jurisdiction where such distribution would
constitute a violation of applicable law or regulation.
While this document represents the author’s understanding at the time it was prepared, no representation or warranty, either expressed or implied, is provided in relation to the accuracy,
completeness or reliability of the information contained herein, nor it is intended to be a complete statement or summary of the securities markets or developments referred to in the document. It
should not be regarded by recipients as a substitute for the exercise of their own judgment.
Investing in securities and other financial products entails certain risks, including the possible loss of the entire amount invested. Certain investments in particular, including those involving structured
products, futures, options and other derivatives, are complex, may entail substantial risk and are not suitable for all investors. The price and value of, and income produced by, securities and other
financial products may fluctuate and may be adversely impacted by exchange rates, interest rates or other factors. Information available on such securities may be limited. The securities described
herein may not be eligible for sale in all jurisdictions or to certain categories of investors. You should obtain advice from your own tax, financial, legal and accounting advisers to the extent that you
deem necessary and only make investment decisions on the basis of your objectives, experience and resources.
Past performance is not necessarily indicative of future results.
Unless specifically stated otherwise, all price information is indicative only.
No liability whatsoever is accepted for any loss (whether direct, indirect or consequential) that may arise from any use of the information contained in or derived from this document. IR&M does not
provide tax advice and nothing contained herein is intended to be, or should be construed as a, tax advice. Recipients of this report should seek tax advice based on the recipient’s own particular
circumstances from an independent tax adviser.