industry post-regulation e-cigarette summit 2017 · industry post-regulation e-cigarette summit...
TRANSCRIPT

17th November 2017
www.ECigIntelligence.com
Industry Post-Regulation E-Cigarette Summit 2017 Tim Phillips, ECigIntelligence

Agenda
Post-TPD: Has regulation been a success? Heated Tobacco: a success? Innovation: what next?
2
1
2
3

TPD: Has it been a success?
• Products notified: c. 150,000; 32,000+ in UK
• Companies notifying: 2,500+
• EC’s Common Entry Gate stretched to breaking:
– Peak: 40,000 submissions in one day; averaged 1,000+ per day
– huge problems with early notifications, system now upgraded
• Peak of activity pre November 2016 and May 2017 deadlines
• More submissions per company: increasing confidence in the regulatory system?
-
20
40
60
80
100
120
3Q 2016 4Q 2016 1Q 2017 2Q 2017
Submissions per Notifying Party
0
20,000
40,000
60,000
80,000
100,000
120,000
140,000
160,000
3Q 2016 4Q 2016 1Q 2017 2Q 2017
Total E-cigarette product submissions
Source: European Commission; October 2017
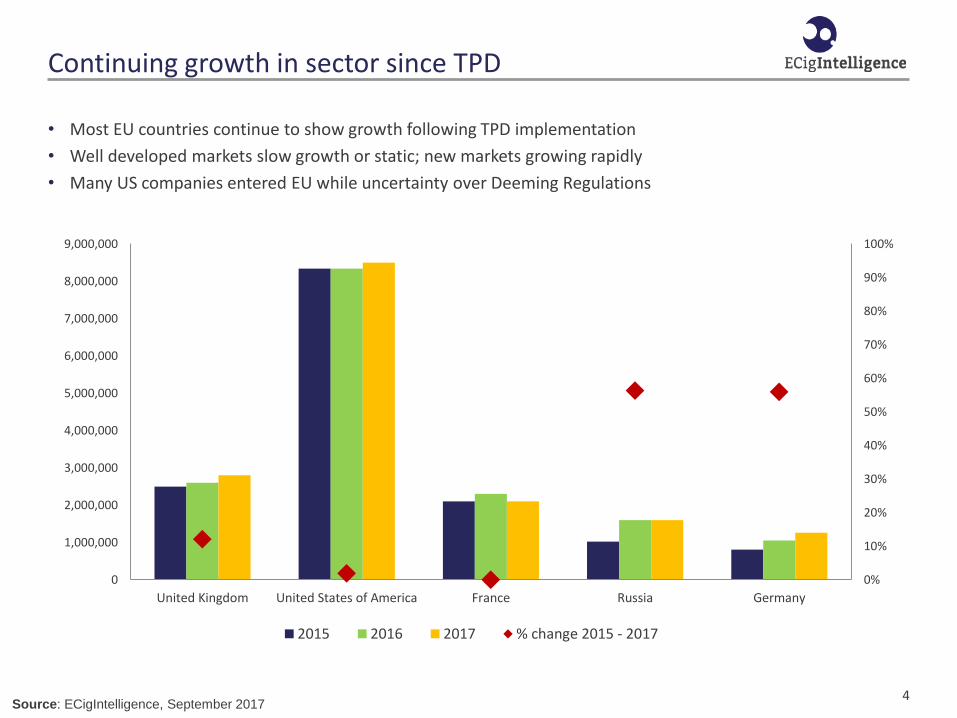
Continuing growth in sector since TPD
• Most EU countries continue to show growth following TPD implementation
• Well developed markets slow growth or static; new markets growing rapidly
• Many US companies entered EU while uncertainty over Deeming Regulations
4
0%
10%
20%
30%
40%
50%
60%
70%
80%
90%
100%
0
1,000,000
2,000,000
3,000,000
4,000,000
5,000,000
6,000,000
7,000,000
8,000,000
9,000,000
United Kingdom United States of America France Russia Germany
2015 2016 2017 % change 2015 - 2017
Source: ECigIntelligence, September 2017

How much of EU market captured by TPD?
• In many countries, regulations only apply to nicotine containing e-liquid
• Shake and Vape: definition?
– huge cost savings for consumers
– consumer demand for larger volumes
– no notification requirement
• Many markets confirmed no enforcement against shake & vape; for others, emerging area of law
5
0%
10%
20%
30%
40%
50%
60%
Germany France Italy Poland UnitedKingdom
Estimated % of total market using non-TPD product
€ 0.00
€ 0.10
€ 0.20
€ 0.30
€ 0.40
€ 0.50
€ 0.60
Germany France Italy United Kingdom
Price of e-liquid (€/ml): TPD 10ml vs Shake&Vape
10ml bottle 60ml short fill + 10ml shot
Source: ECigIntelligence consumer survey 2017
30% average price difference

Nicotine strength: consumer preferences suit Shake&Vape
• Among advanced tank users, predominance of 3 and 6 mg/ml liquid
• Shake & Vape products generally cater to these consumers (50ml 0mg + 10ml nic. shot)
6 Source: ECigIntelligence consumer surveys carried out during 2017
0%
10%
20%
30%
40%
50%
60%
No nicotine 3mg/ml 6mg/ml 12mg/ml 18mg/ml Other
Nicotine concentration (mg/ml) among advance tank users
UK (n=334) France (n=80) Germany (n=204) Italy (n=96) Poland (n=100) US (n=6046)

However consumer demand for larger bottle sizes is global
• Consumers are using increasing volume of liquid as power of devices increases/nicotine concentration decreases
• US bottles have been getting larger, with growth in 60ml and 120ml this year at expense of 30ml and smaller
7
0%
5%
10%
15%
20%
25%
30%
35%
40%
45%
10 15 30 60 120 160
Bottle size (ml) of last e-liquid purchase in the U.S.
2016 2017
Source: ECigIntelligence consumer surveys, 2016 n=5898; 2017 n=4228

But price difference not as pronounced in US
• Although 10ml bottles are rare in the US, comparison of prices of 60ml with <15ml suggest smaller price difference
• Could be due to regulatory cost savings?
8
0.00 €
0.10 €
0.20 €
0.30 €
0.40 €
0.50 €
0.60 €
0.70 €
15ml and under 30ml 60ml 100ml and over
Price per ml online for different bottle sizes in the U.S., 2016-2017
2016 2017
2016 Average: $0.53
2017 Average: $0.40
-26%
Source: ECigIntelligence

Heated tobacco (t-vapor): online tracking of strong growth
9
0
10
20
30
40
50
60
70
80
90
100
0
1,000,000
2,000,000
3,000,000
4,000,000
5,000,000
6,000,000
Go
ogl
e T
ren
ds
Tota
l mo
nth
ly v
isit
s
Total monthly visits Google Trends
Notes: monthly visits to: IQOS (all official websites), discoverglo.com, discoverglo.jp, ploom.jp.
Google Trends Keywords used: IQOS, Ploom Tech, Glo, Heated tobacco, アイコス (IQOS in
Japanese); Google Trends data indexed to 100% Source: SimilarWeb and Google Trends,
September 2017

0.8 2.2
3.5 4.9
7.6
9.6
12.7
14.6
1,461,509 2,605,630
5,981,516
4,900,215
5,652,323
10,064,741 10,157,826
9,092,768
0
2,000,000
4,000,000
6,000,000
8,000,000
10,000,000
12,000,000
0
5
10
15
20
25
Q4 2015 Q1 2016 Q2 2016 Q3 2016 Q4 2016 Q1 2017 Q2 2017 Q3 2017
Tota
l mo
nth
ly v
isit
s
Off
take
sh
are
Japanese offtake share Total monthly visits in Japan
Note: Offtake share represents select C-Store sales volume for HeatSticks as a
percentage of the total retail sales volume for cigarettes and heated tobacco units.
Monthly visits to: iqos.jp
Source: SimilarWeb, PMI, October 2017
IQOS in Japan: online traffic and sales correlation

0
500,000
1,000,000
1,500,000
2,000,000
2,500,000
3,000,000
3,500,000
4,000,000
IQOS Ploom glo
Notes: monthly visits to: iqos.jp, discoverglo.com AND discoverglo.jp, ploom.jp
Source: SimilarWeb, September 2017
glo launched in Japan
Ploom officialy
launched in Japan
Heated Tobacco: new entrants in Japan

IQOS traffic share globally: slow growth in non-Japan markets
12
0%
10%
20%
30%
40%
50%
60%
70%
80%
90%
100%
iqos.jp iqos.ru kr.myiqos.com iqos.com.ua iqos.co.il iqos.it
iqos.ro iqos.de iqos.pt iqos.gr iqos.co.uk iqos.ch
Source: SimilarWeb, September 2017
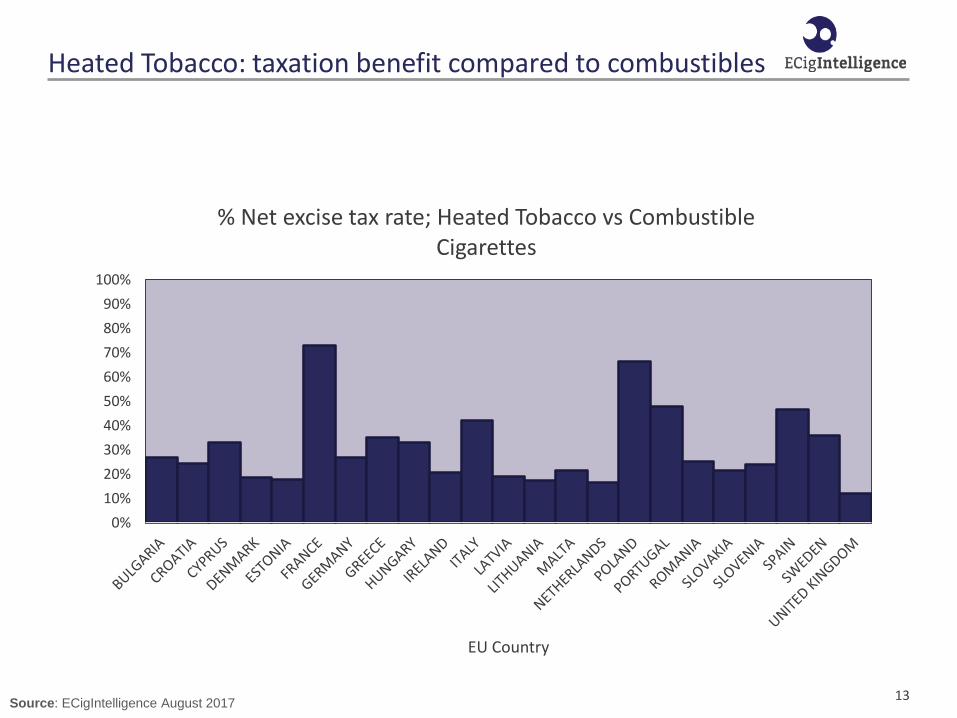
Heated Tobacco: taxation benefit compared to combustibles
13
0%
10%
20%
30%
40%
50%
60%
70%
80%
90%
100%
EU Country
% Net excise tax rate; Heated Tobacco vs Combustible Cigarettes
Source: ECigIntelligence August 2017

Pod systems in US: new products focus on lower power
14 Notes: starter kits come with varying number of empty or prefilled pods
Source: ECigIntelligence October 2017
[CELLRANGE]
[CELLRANGE]
[CELLRANGE]
[CELLRANGE]
[CELLRANGE]
[CELLRANGE]
[CELLRANGE]
[CELLRANGE]
[CELLRANGE]
[CELLRANGE]
[CELLRANGE]
[CELLRANGE]
[CELLRANGE]
[CELLRANGE]
[CELLRANGE]
[CELLRANGE]
[CELLRANGE] [CELLRANGE] [CELLRANGE] [CELLRANGE]
[CELLRANGE]
0
500
1,000
1,500
2,000
2,500
$0 $10 $20 $30 $40 $50 $60 $70
Bat
tery
, mA
h
Starter kit or equivalent prices (USD)
Established pod systems
New pod systems in 2017

US Pods: majority refillable; nic. salts preferred
15
Notes: n= 21 pod system devices
Source: ECigIntelligence
Hybrid open / closed pod system,
19%
Open pod system, 33% Easily hacked, 24%
Hard to hack, 14%
Can´t be hacked, 10%
Closed pod system, [VALUE]
Notes: xAOC/Convenience Database from Nielsen
Source: Nielsen data provided by Wells & Fargo Securities LLC