industry / nrc meeting on generic letter 2008-01
TRANSCRIPT

Industry / NRC Meeting on Generic Letter 2008-01,
“Managing Gas Accumulation in Emergency Core Cooling, Decay Heat Removal, and Containment
Spray Systems”
December 5th, 2008

2
Agenda
Welcome and Introductions
Recent gas transport testing– Analysis methodology for gas transport
– Bounding criteria for assessing gas transport and impact on pump performance,
Break – 10 am
Continuation
Public Comment
Lunch – 11:45 am

Agenda
Generic aspects of initial staff assessments of Generic Letter 2008-01 responses
Coordination of NRC / NEI / Owners Groups / Industry activities– 90 day letter template
– Owners Groups reports supporting GL responses
– GAT Long term plans
Break – 2 PM
Continuation
Public Comment
Adjourn – 4 PM3

Welcome and Introductions
Indroductions
Web Cast Participant Instructions– Send participant names to David Beaulieu
– Phones on mute please unless asking a question
– Time will be allowed for web cast participant questions
4
Industry Presentations
Industry Overview of Recent gas transport testing
Analysis methodology for gas transport
Bounding criteria for assessing gas transport and impact on pumpperformance
5

Long Term Plans
6

Long Term Plans
TS Traveler to be developed to address appropriate surveillance requirements and bases
Gas transport in pump suction piping
Pump acceptance criteria– Decision analysis
7

Public comment
Next meeting schedule
Close
8


2
Westinghouse Proprietary Class II
BackgroundProject aimed at filling gap in industry knowledge– Gas transport data in large diameter elbows and
vertical pipes Project Objectives– Flow regime identification– Phenomenon identification– Empirically based scaling arguments– Guidance for plant specific gas transport in pump
suction piping

3
Westinghouse Proprietary Class II
Project PhasesPWROG funded projectTesting conducted at Purdue UniversityPhase I (2005) – PA-SEE-0217– Examined gas transport in 6” and 8” piping– WCAP-16631 documented program and results
Phase II (2008-2010) – PA-SEE-0460– Review APS Test Data– Examine gas transport in 4” and 12” piping– Determine temperature effects using 4” piping– Develop scaling methodology to cover 4” to 30” pipe

4
Westinghouse Proprietary Class II
StatusProject kick-off meeting was held at Purdue University– Lessons learned from 6” and 8” testing– Improvements to test loop identified
12” loop testing currently in progress

5
Westinghouse Proprietary Class II
Schedule12” testing will be completed in 2008
4” loop construction, testing, and scaling will be completed in 2009
Interim reports provided ASAP after testing phases, with final WCAP in 2010

6
Overview of 6” and 8” Testing

7
Testing performed at Purdue UniversityFull scale model of pump suction piping with 25’ vertical drop Two pipe sizes tested– 6-inch and 8-inch diameterAcrylic pipe used to enhance visualization– Cameras at 4 locations
Three types of gas volume fraction void meters used to quantify transport process
Test Summary

8
Facility P&ID
Void Meters
Separator Tanks

9
25’ Vertical Acrylic Pipe with arch type void meters

10
Top Horizontal Header with Ring type Void Meter

11
Range of Initial conditions– 75-80 test runs performed on each pipe size– Gas volume in upper horizontal piping
–Range of 5% - 20% gas volume fraction– Liquid flow rate
–Range of 200 – 900 gpm (6-inch)–Range of 400 – 1800 gpm (8-inch)
Gas transport characteristics–Void fraction and flow regime were
measured as function of location and time
Test Parameters

12
Summary of ResultsQuantitative correlations developed to support plant specific assessments– Void fraction as a function of flowrate and vertical
drop length– Objective identification of flow regime
Qualitative Results from viewing acrylic pipe section– Top Horizontal Pipe– Vertical Pipe– Bottom Horizontal Pipe

13
Top Horizontal
Air quickly transported to downstream end by the descending elbow
Elbow acts as buffer to slow down the air transport into the vertical drop section
Rate of air release from buffer increases with flow

14
VerticalAbility to pull air down from top elbow increases with flow velocity
Air held up in top sections at lower flow rates
Void fraction decreases with downward distance due to– Increase in static pressure– Buoyancy prolongs the transport time for a fixed
volume of air – Bigger bubbles disperse into smaller bubbles

15
Bottom HorizontalBottom elbow acts as buffer to store air as a layer on the top of the pipe
Water slips under elongated air pockets immediately downstream of elbow
Some elongated air pockets float back into the incoming vertical pipe (i.e., bubble-recirculation) resulting in less void to the pump
Air is gradually entrained in liquid stream resulting in a reduction in void fraction to the pump

16
Typical Profile Variation during Transport


2
Presentation SummaryBackground
Basis of Interim Criteria
Review of Draft Division of Safety Systems (DSS) Criteria
Review of PWROG Interim Criteria
Comparison of Criteria
Future Efforts
Take-aways

3
BackgroundEvery US licensee is required by GL-2008-01 to evaluate their Emergency
Core Cooling System (ECCS), Decay Heat Removal (DHR) system and
containment spray (CS) system design, operation and test procedures to
assure that gas intrusion is minimized and monitored in order to maintain
system operability and compliance with the requirements of 10 CFR 50
Appendices A and B.
PWROG/BWROG include the development of interim pump criteria.
PWROG funded PA-450 Task 2 to develop interim pump criteria.
The interim pump criteria was published via V-EC-1866, Rev. 0

4
Basis of Interim Pump Criteria in V-EC-1866Comprehensive Literature Search
Access to previous Industry OE
Pump Test Data

5
DSS Pump Operation Interim Criteria (Draft)
Pump Operation Interim Criteria Allowable Φ
Steady state (>20 sec following initiation of gas ingestion) with 40% < Q/QBEP < 120%
2%
Steady state with Q/QBEP < 40 % or >120% 1%
Maximum during 5 second transient with 70% < Q/QBEP< 120%
10% (peak)
Maximum during 5 second transient with Q/QBEP < 70% or > 120%
5% (peak)

6
V-EC-1866 Pump Interim Criteria (PWROG)
Pump Operation Interim Criteria Allowable Φ
Steady state with 40% < Q/QBEP < 120% 2%
Steady state with Q/QBEP < 40 % or >120% Not specified
WDF (single stage) transient limit with 70% < Q/QBEP <120% for 20 sec.
5% (avg.)
CA (multi-stage, stiff shaft) transient limit with 70% <Q/QBEP < 140% for 20 sec.
20% (avg.)
RLIJ, JHF (multi-stage, flexible shaft) transient limit with 70% < Q/QBEP < 120% for 5 sec.
10% (avg.)

7
BWROG CriteriaBWROG Criteria Allowable
Ф
Steady state Q/QBEP ≤ 120% 2%
Steady state with Q/QBEP >120% 1%
Average during 5 second transient 10%

8
Differences Between DSS and V-EC-1866 (PWROG) Steady State Criteria
DSS and V-EC-1866 in agreement for 40% < Q/QBEP < 120%.
DSS includes specific additional guidance at off-nominal conditions of < 40%
and > 120% BEP.
Basis of DSS
– NUREG/CR-2792 and industry information state that outside of this range 2% may be inappropriate for some conditions.
– Engineering judgment that 1% should accommodate most considerations.
– DSS notes that even 1% may still pose concerns with gas accumulation in some pumps over time.

9
Differences Between DSS and V-EC-1866 (PWROG) Steady State Criteria
V-EC-1866 does not provide a specific limit for off-nominal conditions < 40%
or > 120% BEP.
Basis for V-EC-1866 (Per section 5.2 of the report)
– Range of steady state limit based on review of existing data.
– For operation at these off-nominal conditions and beyond, V-EC-1866 notes that input from vendor should be obtained.
10
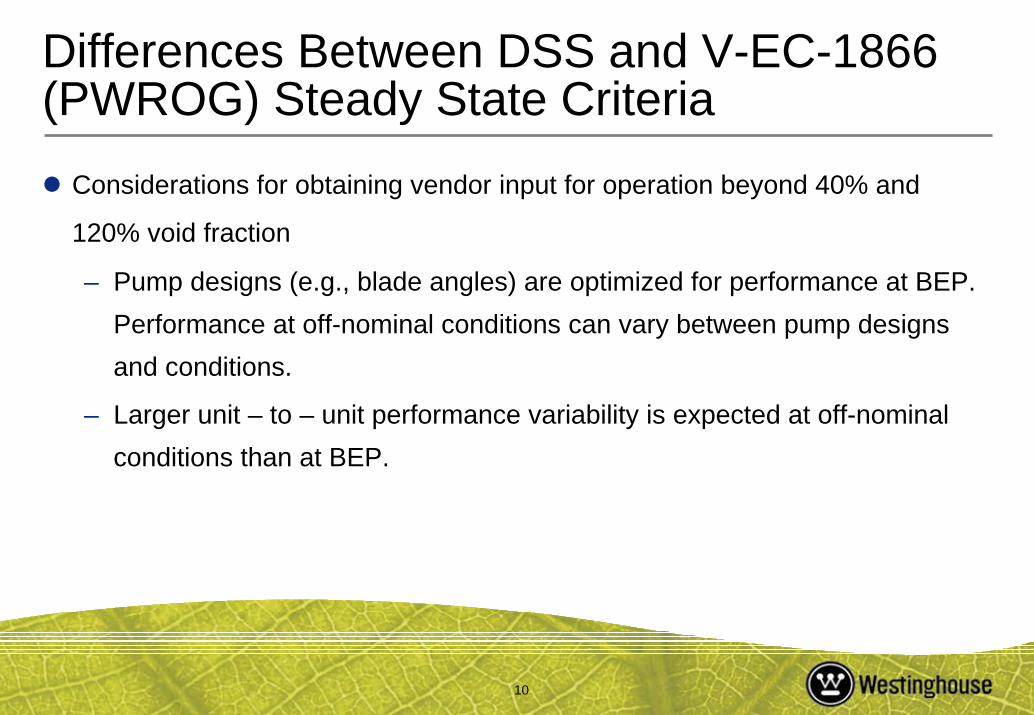
Differences Between DSS and V-EC-1866 (PWROG) Steady State Criteria
Considerations for obtaining vendor input for operation beyond 40% and
120% void fraction
– Pump designs (e.g., blade angles) are optimized for performance at BEP. Performance at off-nominal conditions can vary between pump designs and conditions.
– Larger unit – to – unit performance variability is expected at off-nominal conditions than at BEP.

11
Summary of Differences Between DSS and V-EC-1866 (PWROG) Steady State Criteria
DSS and V-EC-1866 are in agreement with 2% void fraction for 40% < Q/QBEP
< 120%.
DSS includes specific additional criteria of 1% void fraction at off-nominal
conditions of < 40% and > 120% BEP.
V-EC-1866 notes that outside of the above criteria vendor input is required.
12
Differences Between DSS and V-EC-1866 (PWROG) Transient Criteria
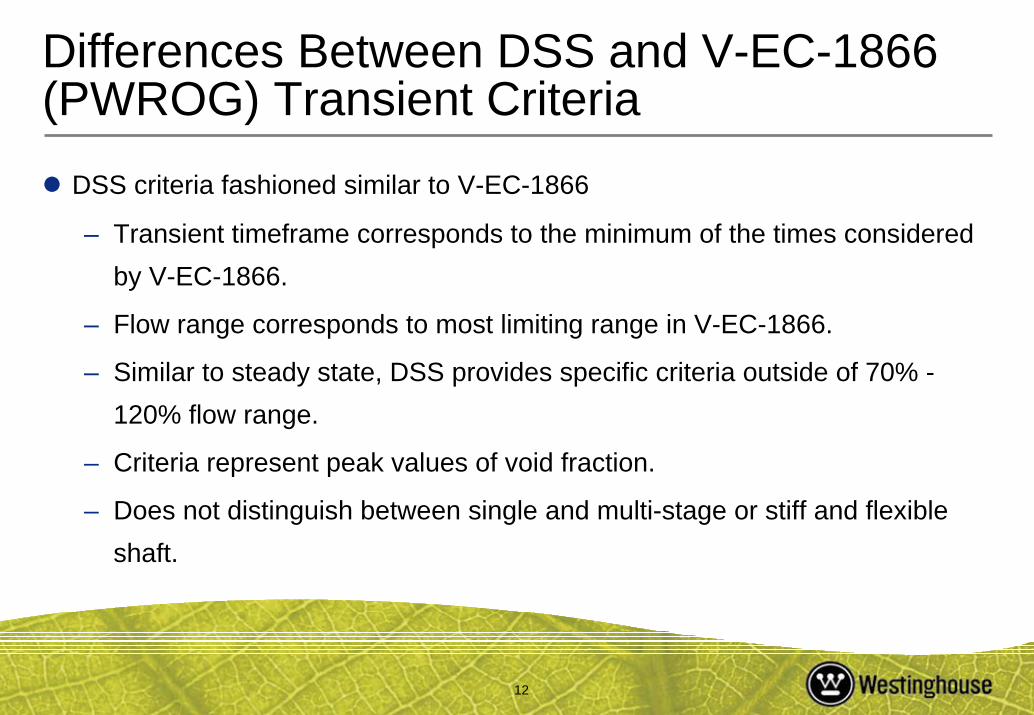
DSS criteria fashioned similar to V-EC-1866
– Transient timeframe corresponds to the minimum of the times considered by V-EC-1866.
– Flow range corresponds to most limiting range in V-EC-1866.
– Similar to steady state, DSS provides specific criteria outside of 70% -120% flow range.
– Criteria represent peak values of void fraction.
– Does not distinguish between single and multi-stage or stiff and flexible shaft.

13
Differences Between DSS and V-EC-1866 (PWROG) Transient Criteria
V-EC-1866 criteria
– Based on test data for two different pumps.
– Transient timespan based on testing.
– Provides flexibility based on pump design.
– Similar to steady state, does not provide specific guidance outside of the flow range.
– Utilizes average values of void fraction vice peak value over timeframe.
14
Differences Between DSS and V-EC-1866 (PWROG) Transient Criteria
V-EC-1866 Transient Timespan
– Timespan based on test data and adjusted via a safety factor of 10x (See Appendix
C, section 1).

15
Differences Between DSS and V-EC-1866 (PWROG) Transient Criteria
Transient Criteria established for multiple designs.
– Test data shows that multi-stage pumps can tolerate higher void fractions with less degradation than a single stage pump. (See section 3.2)
– For a single stage, if air bubbles are present in the vane passage up to a particular distance along the impeller blade, a corresponding percentage head degradation is expected.
– For a multi-stage, if air bubbles are present in the vane passage up to a particular distance along the impeller blade, a corresponding percentage head degradation is expected for only the first stage. The remaining stages should not be impacted relative to head rise. As such, the overall head degradation for the pump is less.

16
Differences Between DSS and V-EC-1866 (PWROG) Transient Criteria
Flexible vs. stiff shaft requirements (See Appendix C, section 3)– Both flexible and stiff shaft requirements assume that the pump is not air
bound.– Flexible shaft needs a tighter criteria than a stiff shaft based on the
imbalance applied to the impeller and the subsequent response of the rotor.
– Both of the above statements assume that air binding is not occurring.– Flexible Rotor
– Larger deflections resulting in possible contact or rub on seals resulting in removal of material and/or excessive loads on bearings.
– Excessive loads can over-stress the rotor leading to cracked shafts.

17
Differences Between DSS and V-EC-1866 (PWROG) Transient Criteria
Flow range
– Range of steady state limit based on review of existing data.
– For operation at these off-nominal conditions and beyond, V-EC-1866 notes that input from vendor should be obtained.
– Similar “considerations” as noted in steady state discussion.

18
Differences Between DSS and V-EC-1866 (PWROG) Transient Criteria
Significant Differences Between DSS and V-EC-1866
– Requires that pump user make a comparison between actual pump and pump discussed in V-EC-1866 (pump attributes)
– Requires that pump user contact pump manufacturer if outside of the criteria

19
Differences Between DSS and V-EC-1866 (PWROG) Transient Criteria
Average allowable void fraction
– Based on test data.
– Conservative, as actual tests were performed for longer periods of time with no adverse impact on the tested pump.
– From the previous presentation, the peak void fraction dampens out during transport down vertical pipe and transitions into the horizontal pipe.
Peak void fraction
– It is noted that based on gas transport data, void fraction as a function time is not a step function. A typical plot of void fraction versus time is presented on the next slide.
– Peak void fraction is only present for a portion of the time interval.

20
Differences Between DSS and V-EC-1866 (PWROG) Transient Criteria

21
NPSH Considerations
NPSHR is part of steady state criteria. NPSHR testing is accomplished at stable test points. There is no “transient” NPSHR data.NPSHR criteria based on performance near BEP.NPSHR a/w = NPSHR w (1+0.5 (void fraction))

22
Future EffortsThe Owners Groups are exploring future options relative to the applicability of
the interim criteria.

23
Take-awaysFor flowrates less than 40% BEP, Froude number does not support significant
gas transport to the pump.
Base transient criteria on pump types/attributes vice a general criteria.
NPSHR applicable to steady state not transient conditions.
Use of average void fraction vice peak void fraction.
Transient limits ensure that for the pumps tested, head breakdown did not
occur ensuring no gas binding.
Methods to determine gas void fraction at the pump inlet to be included in the
draft DSS paper.
NRC Handout and Slides
December 5, 2008

Generic Letter 2008-01 9-month Response Rating Sheet for NRC Preliminary Assessment of Submittal Comprehensiveness
ENTER PLANT NAME HERE
No. Item Rating0-10
Comments
i ECCS, DHR (RHR, SDC), & CSS identified if applicable? ii History & background discussed? 1 Licensing basis documents indentified & addressed including
summary of review results such as applicability & weaknesses
1.1 TS 1.2 TS bases 1.3 UFSAR 1.4 Responses to NRC generic communications as applicable 1.5 Regulatory commitments as applicable 1.6 License conditions as applicable 1.7 Identification of TSTF & other TS improvements 2 Design evaluation 2.1 Gas volume acceptance criteria vs. location. Include suction &
discharge pipes, & (BWRs) GSI-193 (suppression pool gas)
2.2 Pump acceptance criteria including qualifications for weakness in owners groups recommendations, recognition of potential start pulsations, ongoing data development efforts, NPSH
2.3 Design basis document changes summarized 2.4 P&ID & isometric drawing reviews 2.5 Needed vent valve modifications accomplished or committed 2.6 Walkdowns completed & results including acceptance criteria 2.7 Walkdown plans for completion Enter 10 if not needed2.8 Potential gas intrusion mechanisms addressed 2.9 List of incomplete items & completion schedule 3 Testing evaluation 3.1 Procedures reviews results addressed including venting history 3.2 Procedures revisions to be accomplished addressed 3.3 Gas void determination method & documentation addressed 3.4 List of incomplete items & completion schedule 4 Corrective actions 4.1 Interim coverage of TS inadequacies by TRM or procedures to
ensure meeting Appendix B requirements
4.2 Corrective actions completed listed & summarized 4.3 List of incomplete items & completion schedule, commitments OVERALL RATING

GL 2008-01 9-month ResponseInitial Assessment Ratings of Submittal Comprehensiveness
0
2
4
6
8
10
12
14
16
18
20
0-1 1-2 2-3 3-4 4-5 5-6 6-7 7-8 8-9 9-10
Overall Assessment RatingScale: 0 = No Information or Unacceptable, 10 = Complete Coverage
Freq
uenc
y
Assessment ratings do not indicate the quality of the work in the plants. The ratings are an assessment ofthe comprehensiveness of the written 9-month submittal.

GL 2008-01 9-month ResponseInitial Assessment Ratings of Submittal Comprehensiveness
PWR Responses
0
2
4
6
8
10
12
0-1 1-2 2-3 3-4 4-5 5-6 6-7 7-8 8-9 9-10
Overall Assessment RatingScale: 0 = No Information or Unacceptable, 10 = Complete Coverage
Freq
uenc
y
Assessment ratings do not indicate the quality of the work in the plants. The ratings are an assessment of the comprehensiveness of the written 9-month submittal.

GL 2008-01 9-month ResponseInitial Assessment Ratings of Submittal Comprehensiveness
BWR Responses
0
2
4
6
8
10
12
14
0-1 1-2 2-3 3-4 4-5 5-6 6-7 7-8 8-9 9-10
Overall Assessment RatingScale: 0 = No Information or Unacceptable, 10 = Complete Coverage
Freq
uenc
y
Assessment ratings do not indicate the quality of the work in the plants. The ratings are an assessment of the comprehensiveness of the written 9-month submittal.