industry insights globalising australia · manager economic outlook department of industry,...
TRANSCRIPT

Industry Insights
Globalising Australia2/2018

Further information
For more information on other department initiatives please visit the department’s website at: www.industry.gov.au
For more information or to comment on the release, please contact:
Manager Economic Outlook Department of Industry, Innovation and Science
GPO Box 2013 CANBERRA ACT 2601
Telephone: +61 2 6276 1776 Email: [email protected]
Project team
Shane Aves
Tim Bradley
Melissa Bray
Rene Chaustowski
Melissa Eaton
Alissar Hassan
Warwick Jones
Kristy Krautler
Nathan Lawrence
Laura Ling
Kelly O’Brien
Rayeed Rahman
Will Young
Acknowledgements
The project team would like to acknowledge the contributions of Lisa Gropp (Business Council of Australia), Ric Gros (METS Ignited), Nicholas Davis (World Economic Forum), Josh Wilson (Department of Industry, Innovation and Science) and all others who provided comments, support and feedback during the production of this report.
The images for ths publication are sourced from www.shutterstock.com
© Commonwealth of Australia 2018
ISSN: 2209-1513 (Online)
Ownership of intellectual property rights in this publication
Unless otherwise noted, copyright (and any other intellectual property rights, if any) in this publication is owned by the Commonwealth of Australia (referred to below as the Commonwealth).
Creative Commons licence
With the exception of the Coat of Arms, this publication is licensed under a Creative Commons Attribution 3.0 Australia Licence.
Creative Commons Attribution 3.0 Australia Licence is a standard form license agreement that allows you to copy, distribute, transmit and adapt this publication provided that you attribute the work. A summary of the licence terms is available from: http://creativecommons.org/licenses/by/3.0/au/deed.en. The full licence terms are available from http://creativecommons.org/licenses/by/3.0/au/legalcode
The Commonwealth’s preference is that you attribute this publication (and any material sourced from it) using the following wording: ‘Source: Licensed from the Commonwealth of Australia under a Creative Commons Attribution 3.0 Australia Licence.’
The Commonwealth of Australia does not necessarily endorse the content of this publication.

WWW.INDUSTRY.GOV.AU/INDUSTRYINSIGHTS
Industry Insights
Globalising Australia2/2018

i
From the Acting Chief EconomistOver the past three years, Australia has been remembering the great and terrible events of World War 1: Gallipoli, Fromelles, Pozieres and Villers-Bretoneaux, through the lens of the century that has passed since one of the greatest disasters to befall humanity. But how will people a hundred years from now view the first decades of the 21st Century?
Most likely, they will remember it as a time of one of the great triumphs of humanity, when hundreds of millions of people were lifted out of grinding poverty into a world of opportunity. At the heart of this triumph is the revival of world trade that had been snuffed out by World War 1. International trade reached a low point of a quarter of global GDP by mid-20th Century but has risen year by year to be around half now. For developing nations, it has been the greatest poverty buster the world has ever known while developed nations experienced conditions that for previous generations were only enjoyed by the very rich.
Where does Australia sit in this global story? The first few decades of the 21st century will likely characterise the Australian economy as one that capitalised on a rapidly growing and industrialising China. Yet while we like to think of ourselves as a trading nation, we are in fact one of the least integrated into global trade networks. The World Bank recently ranked Australia 152 out of 170 countries in terms of global integration.
In this second edition of Industry Insights — a successor to our Australian Industry Report — we look at how global trade is shaping the Australian economy. This edition presents three inter-related chapters, each examining the broad theme from a different perspective.
Chapter one shows that what we trade and how we trade also differs from other developed nations. Australian exports are highly specialised in a few goods, which are typically produced by many other countries. Australia has the lowest participation in Global Value Chains (GVCs) of any developed nation.
Generally, the closer an economy is to the centre of a trade bloc, the more enmeshed it will be in GVCs. Taiwan is in the middle of an intense manufacturing zone surrounded by mainland China, Japan and Korea. Australia is on the periphery of trading blocs and has a lower GVC participation. The legacy of Australia’s pre-1990s trade policy and high trade costs, as discussed in the previous edition of Industry Insights, also play a part.
Chapter two offers a ‘peek behind the curtain’ to help understand Australia’s international trade composition. It goes beyond the raw trade figures and measures the value flow through the trade process. Value flow accounts for the issue that nearly every product embodies the production and inputs of other businesses across industries and countries. This chapter challenges the commonly held view of Australia’s trade in two ways.

ii
First, most think that Australia is mainly a commodity exporter to China. The wider East Asian region is indeed the primary destination for much of Australia’s exports, but the sources of final demand are much more diverse. North America and Western Europe account for a much greater proportion of final demand for our exports, as they have done throughout Australia’s history.
Changes in demand in these regions are reflected back to Australia through the complex global production process. For example, a shipment of iron ore to China could become a refrigerator destined for the United States or Europe. In this case, it is America and Europe demand driving demand for Australian iron ore. An implication is that protectionist measures will be transmitted through the whole trading network, with even bilateral measures having global implications.
Second, conventional trade statistics show services exports making up around a quarter of Australia’s exports, but measured as value flows service exports make up nearly half. The difference is that value flow measures the services embedded in our commodities and advanced manufacturing exports.
The importance of Australia’s service sector to our export performance is greater than currently realised. This gives urgency to reforming services industries to ensure that all trade exposed sectors of the economy remain competitive.
The final chapter discusses how Australia’s domestic economy is adapting to global trade by examining whether we have a ‘smile curve’ in manufacturing. This refers to the idea that the lower value parts of the production process (the physical transformation) are outsourced to where it can be done at the lowest cost, while the higher value parts of the production process such as research and development, product design, sales and marketing are retained.
The Australian industrial structure reflects the smile curve as do most (but by no means all) developed countries. One implication of this finding is that when we are considering industry restructuring we need to look past industry sectors. Instead we should look at the value added at stages in the production process and ensure Australian workers are moving to the higher value stages.
What does this Insight say about the future of Australia in the global economy? Although each chapter and their companion articles takes a different perspective, the potential for growth in services exports beyond the traditional sectors of tourism and education is the golden thread that links this Insight. Australia has an opportunity to capitalise on growing services demand for an enriching and ageing Asia on our global doorstep.
But as the Productivity Commission’s, Shifting the Dial report observes, services remain one of the least reformed parts of the economy and some hard decisions may be necessary by both governments and industry to grasp the opportunity. There is every reason to be confident this will happen. Australia is often described as the lucky country. But its history is also of a country that made its own luck by seizing the opportunities that came its way.
David Turvey
Acting Chief Economist Department of Industry, Innovation and Science
June 2018

iv
List of tables v
List of figures vi
01
0203
Contents
Aerial photograph of Melbourne’s freeways and skyline
Changes in global trade shaping the Australian economy 1
Feature Article: The 200th anniversary of David Ricardo 15
Digging deeper into global supply chains 17
Feature Article: Looking ahead – observations from METS 39
Manufacturing and the smile curve 43
Feature Article: Transitioning industries 55

v
IND
USTR
Y INSIG
HTS G
lobalising Australia
List of figuresand tables
List of figuresFigure 1.1 Australia’s two-way trade as a proportion of gross domestic product (GDP), 1901 to 2015–16 5
Figure 1.2 Australia’s key trade and investment partners, share of total, 2016 6
Figure 1.3 Revealed comparative advantage (RCA) by industry, 2015 9
Figure 1.4
Economic complexity vs income per capita, 2015 10
Figure 2.1 Stylised example of a value chain for tyres 20
Figure 2.2Comparison of gross trade and value-added trade 21
Figure 2.3Ratio of Australian value added to gross exports (VAX) by destination region, 2000 to 2014 24
Figure 2.4International proportions of domestic value-added content to gross exports, 2010 and 2014 27
Figure 2.5 Industry value added to Australian Mining production, 2000 and 2014 31
Figure 2.6 Industry value added to Australian Manufacturing production, 2000 and 2014 32
Figure 2.7Decomposition of the effects resulting in a reduction in the value-added content of Australian Manufacturing, 2000 to 2014 33
Figure 2.8Industry value added to Australian Services production, 2000 and 2014 34
Figure 2.9Decomposition of the effects leading to an increase in the value-added content of Australian Services, 2000 to 2014 35
Figure 3.1 Household expenditure on goods and services & income, 1998–99 to 2015–16 45

vi
List of figures and tables
List of tablesTable 1.1 Trade exposure vs gross value added (GVA) growth by industry 11
Table 2.1 Regional shares of Australian exports, 2014 23
Table 2.2 Industry shares of Australian exports, 2014 25
Table 2.3 Comparison of Australian and international average gross and value-added proportions of total exports by industry, 2014 28
Table 2.4Difference in the Australian vs other countries’ value-added exports ratio by industry contribution, 2014 29
Table 2.5Gross and value-added Australian exports as a proportion of gross domestic product (GDP) by industry, 2000 and 2014 30
Table A1Ratio of Australian value added to gross exports and sector weighting, from industry to export region, 2014 38
Table 2.6 Growth and employment by sub-segment 40
Figure 3.2The traditional smile curve 47
Figure 3.3 Share of Australian forward participation in GVCs, by region, 2000 to 2011 48
Figure 3.4Exports and domestic supply by product group, 2014–15 49
Figure 3.5 World share of exports by product type and price of labour by country, 2014 51
Figure 3.6 The smile curve of Australia’s manufacturing industry, 2006–2016 53
Figure 3.7 Australia’s ranking of economic complexity, 1980–2016 56

01
Aerial view of Australian suburban houses1
IND
USTR
Y INSIG
HTS G
lobalising Australia
2
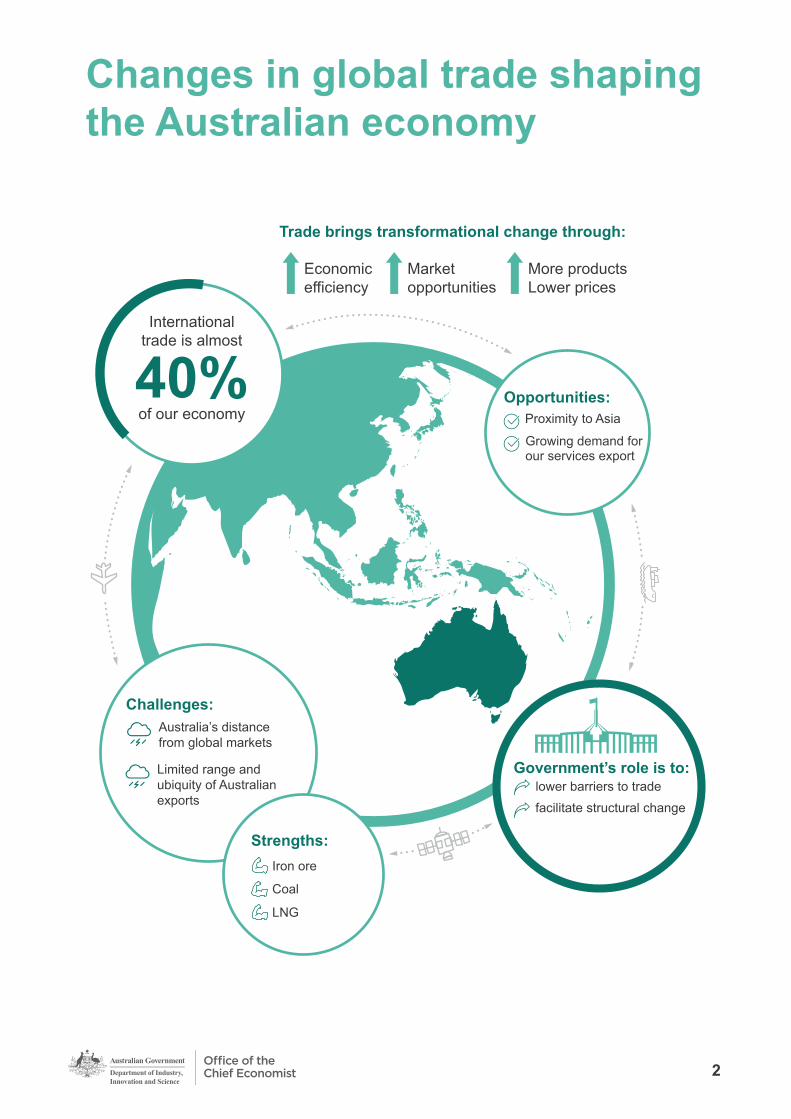
Economic efficiency
Market opportunities
More productsLower prices
Trade brings transformational change through:
Opportunities: Proximity to Asia
Growing demand for our services export
Australia’s distance from global markets
Limited range and ubiquity of Australian exports
Challenges:
International trade is almost
40%of our economy
Strengths: Iron ore
LNG
Coal
Government’s role is to: lower barriers to tradefacilitate structural change
Changes in global trade shaping the Australian economy

CH
AP
TER
1C
hanges in global trade shaping the Australian econom
y
IND
USTR
Y INSIG
HTS G
lobalising Australia
3
The way the world trades is changing. Global trade is shifting to Asia as China grows and integrates quickly. Services, particularly as inputs to final goods, are increasing in importance to trade as developing economies improve their labour force capabilities and move up the value chain.1
New technologies and changing tastes have influenced what is traded and afforded Australian businesses new market opportunities in the Asia-Pacific region. China’s middle class is growing rapidly and its population is ageing, increasing demand for the premium-quality products and world-class services that Australia can offer. Services such as aged care, asset management and insurance services may provide growth opportunities for Australian businesses in overseas markets.
Trade integration and globalisation not only benefits businesses, but consumers as well. Trade liberalisation, that occurred over a 30 year period from the late 80s, has left the average Australian household $8,448 better off in 2016.2 Consumers now have access to a much wider range of products at cheaper prices (see Box 1.1).
This chapter first looks at how Australian trade has changed and the impact of trends in global trade. The chapter then examines the domestic characteristics that shaped Australian industries and the way they have been influenced by globalisation and trade exposure. Australian exports have been dominated by mining and agriculture due to our comparative advantage in these industries. Australia’s exports are focussed on a narrow range of products that are produced by many other countries, an anomaly among developed countries. Yet low complexity also indicates that Australia is a highly specialised economy, suggesting it has adapted to competitive trade pressures.
It concludes with a discussion on how Australia can continue to succeed in a changing global trade environment. Australia should continue to work towards freer markets by reducing non-tariff barriers, seeking to negotiate trade agreements that are broadly inclusive of countries and sectors, and only concluding free trade agreeements that are modern and comprehensive. As Australia continues to integrate into the global economy, the economy will continue to restructure to capitalise on these opportunities, particularly in the services industries.3 In doing so, there is a role for governments to help facilitate transitions for regions and workers in adapting to these structural changes.
1 In this report, industries are capitalised when referring specifically to ABS industry definitions.2 Centre for International Economics (CIE) (2017) Australian trade liberalisation — Analysis of the economic
impacts, report commissioned by Department of Foreign Affairs and Trade3 See chapter 1 of Industry Insights 1/2018 — Flexibility and growth for further discussion on the changes
that have occurred in the Australian economy following significant tariff reform and trade liberalisation in the 1970s.
CH
AP
TER
1 Changes in global trade shaping the A
ustralian economy
4
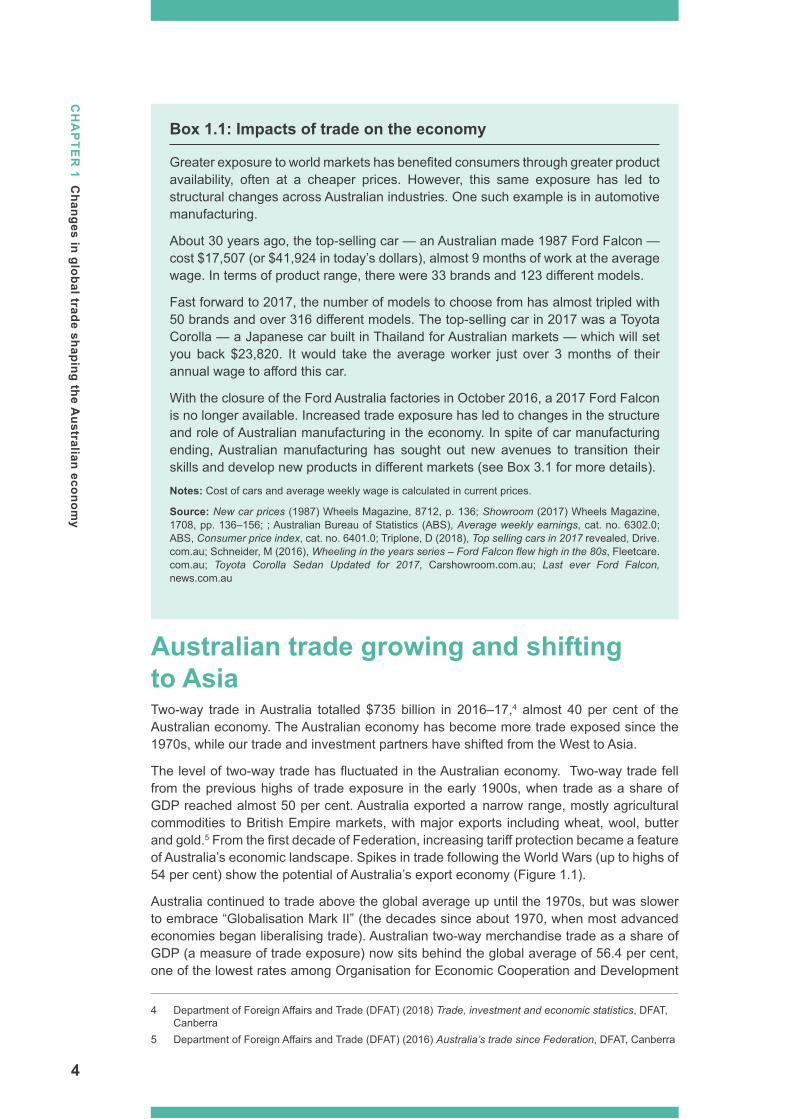
Box 1.1: Impacts of trade on the economy
Greater exposure to world markets has benefited consumers through greater product availability, often at a cheaper prices. However, this same exposure has led to structural changes across Australian industries. One such example is in automotive manufacturing.
About 30 years ago, the top-selling car — an Australian made 1987 Ford Falcon — cost $17,507 (or $41,924 in today’s dollars), almost 9 months of work at the average wage. In terms of product range, there were 33 brands and 123 different models.
Fast forward to 2017, the number of models to choose from has almost tripled with 50 brands and over 316 different models. The top-selling car in 2017 was a Toyota Corolla — a Japanese car built in Thailand for Australian markets — which will set you back $23,820. It would take the average worker just over 3 months of their annual wage to afford this car.
With the closure of the Ford Australia factories in October 2016, a 2017 Ford Falcon is no longer available. Increased trade exposure has led to changes in the structure and role of Australian manufacturing in the economy. In spite of car manufacturing ending, Australian manufacturing has sought out new avenues to transition their skills and develop new products in different markets (see Box 3.1 for more details).
Notes: Cost of cars and average weekly wage is calculated in current prices.
Source: New car prices (1987) Wheels Magazine, 8712, p. 136; Showroom (2017) Wheels Magazine, 1708, pp. 136–156; ; Australian Bureau of Statistics (ABS), Average weekly earnings, cat. no. 6302.0; ABS, Consumer price index, cat. no. 6401.0; Triplone, D (2018), Top selling cars in 2017 revealed, Drive.com.au; Schneider, M (2016), Wheeling in the years series – Ford Falcon flew high in the 80s, Fleetcare.com.au; Toyota Corolla Sedan Updated for 2017, Carshowroom.com.au; Last ever Ford Falcon, news.com.au
Australian trade growing and shifting to AsiaTwo-way trade in Australia totalled $735 billion in 2016–17,4 almost 40 per cent of the Australian economy. The Australian economy has become more trade exposed since the 1970s, while our trade and investment partners have shifted from the West to Asia.
The level of two-way trade has fluctuated in the Australian economy. Two-way trade fell from the previous highs of trade exposure in the early 1900s, when trade as a share of GDP reached almost 50 per cent. Australia exported a narrow range, mostly agricultural commodities to British Empire markets, with major exports including wheat, wool, butter and gold.5 From the first decade of Federation, increasing tariff protection became a feature of Australia’s economic landscape. Spikes in trade following the World Wars (up to highs of 54 per cent) show the potential of Australia’s export economy (Figure 1.1).
Australia continued to trade above the global average up until the 1970s, but was slower to embrace “Globalisation Mark II” (the decades since about 1970, when most advanced economies began liberalising trade). Australian two-way merchandise trade as a share of GDP (a measure of trade exposure) now sits behind the global average of 56.4 per cent, one of the lowest rates among Organisation for Economic Cooperation and Development
4 Department of Foreign Affairs and Trade (DFAT) (2018) Trade, investment and economic statistics, DFAT, Canberra
5 Department of Foreign Affairs and Trade (DFAT) (2016) Australia’s trade since Federation, DFAT, Canberra

CH
AP
TER
1C
hanges in global trade shaping the Australian econom
y
IND
USTR
Y INSIG
HTS G
lobalising Australia
5
(OECD) countries.6 Slower liberalisation of trade barriers and longer distances from world markets both played a role in Australia’s relatively low trade exposure.
Figure 1.1: Australia’s two-way trade as a proportion of gross domestic product (GDP), 1901 to 2015–16
Note: Data changed from calendar years to financial years in 1913
Source: Department of Foreign Affairs and Trade (2016), Trade time series data — Historical trade and economic data (1901 to 2014-15); Australian Bureau of Statistics, International Trade in Goods and Services, cat. no. 5368.0
There have been significant changes in Australia’s trading partners over the last 100 years. The United Kingdom (UK) was Australia’s main trading partner from Federation up until 1965. From the 1970s, Japan and the United States (US) replaced the UK for around four decades. Today, the US remains important but the majority of Australia’s main trading partners are located in the Asian region, including China, Japan and South Korea (Figure 1.2). Asia’s growing presence in the global market has affected Australia significantly. China became a major trading partner in the early twenty-first century, boosted by large demand for commodity resources.
Foreign investment is also an important driver of Australia’s economic growth, filling the gap between what Australia saves and invests every year. Foreign investment brings in new businesses with connections in different markets and opens up additional export opportunities. It also encourages competition and increased innovation by bringing new technologies and services to the Australian market.
6 World Trade Organisation (2017) Merchandise trade (%GDP) https://data.worldbank.org/indicator/TG.VAL.TOTL.GD.ZS
0
10
20
30
40
50
60
1901 1920 1939 1958 1977 1996 2015
Per
cen
t
Merchandise goods Merchandise goods and services

CH
AP
TER
1 Changes in global trade shaping the A
ustralian economy
6
Figure 1.2: Australia’s key trade and investment partners, share of total, 2016
0 5 10 15 20 25 30
China
United States
Japan
South Korea
United Kingdom
New Zealand
Singapore
Hong Kong
Per cent
Share of total investment Share of total two-way trade
Source: Department of Foreign Affairs and Trade (2017), Australia’s trade in goods and services; Department of Foreign Affairs and Trade (2017), Trade and investments statistics — Which countries invest in Australia
The total value of foreign investment in Australia was $3.2 trillion at the end of 2016. The US and the UK are the primary investors, making up 26.9 per cent and 16.2 per cent of all foreign investment respectively. However, Japan, Hong Kong, Singapore and China were also in the top 10 in 2016, showing strong growth in investment over the past five years. Growth in Chinese investment alone has averaged 37.9 per cent in the past five years to 2016.7
The composition of Australian exports has also changed over time. In the last decade, manufacturing exports have declined as a share of total goods exports. Mining exports have risen with the mining boom and increased demand from China, and now account for over 50 per cent of total goods exports. Services, despite increasing their overall share of the economy, has not experienced the same growth in exports although this is not unique internationally. However, as shown in Chapter 2, the aggregate numbers do not account for the services that are used as intermediate inputs into goods exports.
Three-quarters of the value of services in global trade is as an intermediate input, and this role is growing.8 Services inputs contribute to merchandise trade by coordinating value chains, providing accounting advice or other business services. New technologies have increased the range of business services that can be offshored, such as back-office
7 Department of Foreign Affairs and Trade (DFAT) (2017) Which countries invest in Australia, DFAT, Canberra
8 Organisation for Economic Cooperation and Development (OECD) (2017) Global Economic Outlook, OECD Publishing, p. 78

CH
AP
TER
1C
hanges in global trade shaping the Australian econom
y
IND
USTR
Y INSIG
HTS G
lobalising Australia
7
functions, software development and legal review. This gives producers access to cost-effective services inputs, which improves their competitiveness. Other services, such as freight logistics, ensure goods can reach their destination in a timely and efficient manner.9
National characteristics shape tradeAustralia’s trade profile has developed as a result of multiple factors, including natural endowments, a highly skilled workforce, and geographic isolation. These factors have led to Australia having a trade mix with exports focused primarily on resources with a small number of key trading partners.
Australia’s comparative advantagesComparative advantage can be measured using a metric known as revealed comparative advantage (RCA). RCA is a way to measure how much more efficiently a country can produce a good compared to others (see Box 1.2).
Australia’s economy and how it trades is shaped by its comparative advantages. Australian exports are mostly in industries which rely on natural resource endowments, capital, and land, such as mining and agriculture (Figure 1.3). An abundance of skilled labour has also developed strong export markets for education services and high-value manufactured goods.
9 For a detailed discussion of how services contributes to a number of industries in Australia, see Australian Industry Report (2015), chapter 2 on enabling services and their role in the economy.

CH
AP
TER
1 Changes in global trade shaping the A
ustralian economy
8
Box 1.2: Measuring international competitiveness using revealed comparative advantage
A country will export more of a certain product when it is relatively better at producing that product than other countries, what economists call ‘comparative advantage’. Differences in comparative advantages between producers create the basis for exchange through trade. At a global level, countries specialise and exchange goods and services through international trade.
In practice, measuring how competitive a country is in a certain product is difficult because of factors such as differences in trade barriers between countries and changing prices or exchange rates. Instead, comparative advantage can be measured by ’revealed comparative advantage’ (RCA), which is a measure of how much a country exports compared to the rest of the world. RCA is the proportion of a country’s exports in a sector divided by the proportion of world exports in that sector.
If the RCA is greater than one for a particular sector, that country has a comparative advantage in that sector. The higher the number, the stronger the comparative advantage. An RCA of 5 implies a country exports 5 times more of a particular good compared to that good’s share of world production.
If the RCA is less than one, the country has a comparative disadvantage in that industry. An RCA of 0.05 would indicate that a country exports 20 times less than expected given their relative size.
When RCAs change, this can be because of:g Australia’s changing export compositiong Changes in world exports in that sector.
Source: Gans J et al. (2012). Principles of economics, 5th edition, Cengage Australia, Melbourne
Revealed Comparative Advantage (Sector A)=
Australia’s exports in Sector AAustralia’s total exports
World’s exports in Sector AWorld’s total exports

CH
AP
TER
1C
hanges in global trade shaping the Australian econom
y
IND
USTR
Y INSIG
HTS G
lobalising Australia
9
Figure 1.3: Revealed comparative advantage (RCA) by industry, 2015
Note: Goods are classified according to the HS 1988/1992 Harmonized Commodity Description and Coding System. This chart uses a log scale with base 5.
Source: World Integrated Trade Systems (2017) Revealed comparative advantage
Much of Australia’s increasing specialisation in minerals exports is due to strong demand from China for Australian ores and minerals, which has helped drive growth in Mining exports. Proximity to the Asia-Pacific region has also been beneficial and a key driver in developing Australia’s comparative advantage in mineral exports.
Australian exports, particularly minerals exports, could be even higher if not for geographic isolation. Distance is a strong determinant of a country’s price competitiveness in resources, given high shipping costs. A recent study found that “resource exports would be 35–50 per cent higher if their location were at the world average distance from their various resource markets.”10 While Australia has an advantage by being relatively close to China, the ‘tyranny of distance’ is still a major impediment for Australian trade, particularly for resources.
Australian exports lack complexityEconomic complexity is a measure of differentiation of a country’s exports, and has two dimensions: diversity — how many products a country exports; and ubiquity — how many other countries export the same products. Complexity increases with diversity and decreases with ubiquity. The measure looks at a country’s industry composition and the relative diversification of its exports.
10 Robertson P and Robitaille M, ‘The tyranny of distance and the gravity of resources’, Economic Record, 93(302) (2017), p. 2
Machinery and Electric
Capital Goods
Textiles and Clothing
Consumer Goods
Food Products
Metals
Vegetable
Fuels
Animal Products
Raw Materials
Minerals
0.04 0.2 1 5 25
RCA

CH
AP
TER
1 Changes in global trade shaping the A
ustralian economy
10
0
20
Economic complexity index
40
60
80
100
–3 –2 –1 0 1 2 3
Inco
me
per c
apita
, $00
0 U
S d
olla
rs
OECD Non-OECD
Australia
As with comparative advantage, factors such as natural endowments and geographical location play a role in shaping this measure. The Australian economy has very low complexity for an advanced country, owing mostly to its high proportion of commodity exports and distance from major markets. Geographic isolation plays a significant role in Australia’s lack of economic complexity. Distance from a significant regional bloc like Asia (compared to other countries in that region) has prevented Australia from greater involvement in global value chains, particularly for manufactured goods. Outsourcing production of smaller parts of a manufactured good can be cost-effective if labour, transport and other associated costs are cheaper than producing domestically.
Australia’s economic complexity is an anomaly among advanced economies, with the economic complexity closer to that of a developing country (Figure 1.4).11 Countries with highly complex exports include Japan, Germany, Switzerland, Sweden and South Korea. Australia ranks 53rd — comparable to the economies of Kazakhstan, Cambodia, Kenya and Saudi Arabia — and is the least complex of all the OECD countries.
Figure 1.4: Economic complexity vs income per capita, 2015
Note: Negative values in economic complexity indicate complexity is below the global average.
Source: World Bank (2017) World Bank Open Data — GNI per capita (constant 2010 US$); The Atlas of Economic Complexity (2017), Country rankings — Economic complexity index
Low complexity in Australia suggest there is significant export and growth potential to diversify its export base. Low complexity also points to risks in Australia’s lack of diversity, with a narrow range of exports meaning the economy is more subject to income volatility
11 Note that economic complexity is not a perfect measure of competitive advantages. The index only considers merchandise goods and exports and does not take into account the prevalence of services in the Australian economy, such as education and personal travel services exports. The measure also underscores the significant advancements Australia has made in the mining sector where production can be complex but produces a homogeneous product.

CH
AP
TER
1C
hanges in global trade shaping the Australian econom
y
IND
USTR
Y INSIG
HTS G
lobalising Australia
11
through demand shocks for specific goods. While Australia has benefited significantly from China’s demand for commodities, low complexity suggests a negative shock to export demand would be more detrimental for Australia than for a more complex economy. Yet low complexity also indicates that Australia is a highly specialised economy, suggesting it has adapted to competitive trade pressures.
Trade exposure heightens competitionAs Australia has become more globalised, Australian industries have been exposed to more competition from other countries. Trade exposure looks at the proportion of an industry’s output that is either exported or imported. For example, mining is highly trade exposed because it exports a large per cent of its total production. Manufacturing is also highly trade exposed but this is due to a large proportion of imports from other countries.
Globalisation has resulted in Australia producing more of what it is good at, such as mining, and less where it is comparatively inefficient, such as certain manufacturing products (Table 1.1). Services generally have lower levels of trade exposure, so they have not been as heavily affected by globalisation.
Table 1.1: Trade exposure vs gross value added (GVA) growth by industry
Industry Trade exposure (per cent)
Growth in GVA (per cent)
Share of GVA (per cent)
Mining 64.4 39.6 5.8
Manufacturing 57.2 -9.5 5.8
Agriculture 19.7 10.8 2.8
Distribution services 12.4 14.2 16.2
Personal services 12.2 7.1 4.9
Other business services 5.0 18.8 21.8
Social services 2.9 17.0 17.4
Utilities 0.5 2.2 2.4
Construction 0.5 0.2 7.4
Weighted average 13.1 14.4
Notes: Growth in GVA is calculated over a five year period from 2011–12 to 2016–17. Trade exposure includes the impact of exports and imports. Weighted average calculated using share of GVA
Source: Australian Bureau of Statistics, Input-Output Tables 2014–15, cat. No. 5209.0.55.001 Table 8; Australian Bureau of Statistics, Australian System of National Accounts, cat. No. 5204.0
Most trade liberalisation to date has been in reducing barriers to goods trade. As a result, manufacturing operations have shifted overseas to access cheaper labour in developing economies. Australian manufacturing’s share of GDP has declined steadily since 1975.
Manufacturing still forms an important part of the Australian economy, adapting to the changing global economy by pursuing higher value-adding activities, such as research and

CH
AP
TER
1 Changes in global trade shaping the A
ustralian economy
12
development, and marketing.12 Adopting advanced techniques, technologies and business models is helping Australian manufacturers stay competitive through improved cost competitiveness, product innovation and better offerings of support services. Though many manufacturing industries in Australia are yet to fully embrace this trend. Industries such as aerospace and medical manufacturing, for example, are not fully using opportunities in key export markets, particularly for intermediate goods.13
Mining is also highly trade-exposed, but Australian mines are among the most-competitive in the world.14 In contrast to manufacturing, trade exposure has facilitated significant growth in mining, particularly due to demand from China.
The differing experiences of Manufacturing and Mining highlight the impact of trade exposure. Manufacturing has faced strong import competition from low-cost countries following trade liberalisation and has reduced in size. The industry has adapted and diversified into other areas where Australia has a comparative advantage, despite falling as a proportion of the economy. Australia has various competitive advantages in Mining, and the industry has experienced strong growth.15
Services are growing as a share of the Australian economy but trade exposure has played a minor role in this growth. Growth in services is mostly due to shifting consumer preferences, with people increasing their demand for services as they get older and wealthier.
Yet some trade-exposed services have increased their share of Australia’s economy and exports. Travel services grew their share of total services exports from 47.0 per cent in 2000 to 64.6 per cent in 2016–17.16
Capitalising on the changing global economyThere are a number of ways that Australia can ensure it capitalises on the new opportunities that arise from the changing nature of trade. Recent reports provide a number of recommendations to ensure that Australia continues to succeed in a changing global economy.17 The recommendations fall under three broad categories relating to continued open international engagement, broader domestic policy and community engagement.
Services industry provides growth opportunities for AustraliaTechnological progress, urbanisation and rising incomes are leading to an increase in the share of services across the globe. Australia has an opportunity to capitalise on this growing demand for tradeable services, particularly demand coming from the Asian region.
12 For further information about the changing composition of manufacturing, refer to chapter 3.13 Advanced Manufacturing Growth Centre (AMGC) (2017) Sector Competitiveness Plan, AMGC, Sydney, p. 4614 Department of Industry, Innovation and Science (2017) Resources and Energy Quarterly15 Although this relationship holds for the past five years it has varied over time due to external factors, such
as the changing trade exposure of industries, the effect of the Global Financial Crisis (GFC) and relative price changes.
16 Department of Foreign Affairs and Trade (DFAT) (2017) Trade in Services Australia 2016–17, DFAT, Canberra
17 Productivity Commission (PC) (2017) Rising protectionism — challenges, threats and opportunities for Australia, PC, Canberra; OECD (2017) Global Economic Outlook — Making trade work for all, OECD Publishing; Committee for Economic Development of Australia (CEDA) (2017) Australia’s place in the world, CEDA, Melbourne
IND
USTR
Y INSIG
HTS G
lobalising Australia
13
CH
AP
TER
1C
hanges in global trade shaping the Australian econom
y
Services exports can be inhibited by language barriers and geographic distances. Despite these disadvantages, Australia has a strong comparative advantage in services compared to other countries in Asia and Oceania. This is particularly the case for financial and insurance services, as well as personal and recreational services.
The ageing population in several Asian countries presents significant opportunities for Australian businesses. There are already more people aged over 65 in Asia (about 365 million) than the total population in the US.18 This number is expected to grow to over 1 billion, more than the populations of the Eurozone and North America combined, in the next 25 years. Aged care services, such as health care and nursing, as well as asset management and other insurance services, are all industries that could benefit from this demographic change.
However there are the added difficulties associated with services as many of Australia’s trading partners have very high barriers to entry in their services markets. To ensure Australian businesses are able to expand to opportunities in overseas markets, continued negotiations encouraging open and inclusive trade agreements with a range of countries are essential.
Capitalising on trade opportunitiesTo ensure that the global economy does not fall back into protectionist tendencies, it is important to continue to work towards freer markets. This can be done by reducing non-tariff barriers (such as barriers to services trade and investment), negotiating inclusive trade agreements, and concluding free trade agreements which are modern and comprehensive.
Although Australia has very low tariff rates, the World Bank’s Doing Business survey ranks Australia 95th for ease of trading across borders.19 Given the current geopolitical environment, it is now more important than ever that Australia does not reverse the process of trade liberalisation that has been underway since the 1980s. The impact of a global trade war would have significant consequences for Australia. For example, the Productivity Commission (PC) has estimated that a significant increase in protectionism worldwide (a scenario in which all countries raise tariffs by 15 per cent) would have a negative impact on Australia. Australian GDP would fall by over 1 per cent a year, equating to a loss of close to 100,000 jobs and $1,500 less income per year for the average household.20
Distribution of the benefits from tradeTrade has provided immense benefits for the Australian economy. Yet there are distributional impacts associated with changes from trade, particularly during transitional periods.
Global economic integration has been a source of prosperity for many years, but is coming under growing scrutiny due to a range of concerns, including perceptions of uneven sharing of the benefits. Over the past couple of decades, income inequality has risen in various OECD countries.21
Discontent with the distributional impact of globalisation should not be ignored. Structural change has adverse impacts on some workers and can be particularly fraught in regional areas where employment is connected with one particular industry. There is a role for
18 Deloitte (2017) ‘Demographics fuelling Asia’s shifting balance of power’, Voice of Asia, 3, p. 319 World Bank Group (2018) Ease of Doing Business in Australia, viewed 5 April 2018,
http://www.doingbusiness.org/data/exploreeconomies/australia 20 Productivity Commission (PC) (2017) Rising protectionism — challenges, threats and opportunities for
Australia, PC, Canberra, p. 621 Organisation for Economic Co-operation and Development (OECD) (2011) Divided we stand — why
inequality keeps rising, OECD, Paris

CH
AP
TER
1 Changes in global trade shaping the A
ustralian economy
14
governments to help facilitate transitions for regions and workers that are particularly affected by structural changes.
Domestically, policies that boost regional resilience and provide transitional assistance can help to ensure that regional imbalances are not exacerbated. These include ensuring workers are prepared for the demands of the changing workforce, improving regional mobility to stimulate labour mobility, and facilitating the diffusion of knowledge to build on local comparative advantages.
ConclusionTrade has increased economic efficiency, created new opportunities for businesses, given consumers access to more products at cheaper prices, strengthened competition, and shaped patterns of specialisation. However, the nature of the global trading environment is changing.
To ensure that industries can keep up with the changing trade environment, Australia needs to continue to pursue free trade while providing a safety net and transitional support for those negatively affected by globalisation. Australian businesses have so far been successful in capitalising on our comparative advantages and natural resource endowments such as during the mining boom. Future sources of export growth include capitalising on the growing demand for services in Asia, particularly given our highly skilled workforce.

15
The 200th anniversary of David RicardoLisa GroppChief Economist, Business Council of Australia
Australia’s living standards have always been, and will continue to be, underwritten by international trade and investment.
Last year marked the 200th anniversary of David Ricardo’s theory of comparative advantage, it’s timely to remind ourselves why we trade. Essentially, we trade with other countries for the same reason we specialise and trade with each other at home. Specialising in what we can produce at lower opportunity cost means we can earn and consume more. We trade because it is a positive-sum game.
In addition, openness to bigger global markets means more-intense competition, driving innovation and productivity growth at home. International trade and investment are important conduits for the diffusion of knowledge and technology into our economy. We have also seen rapid growth in trade in intermediate goods, allowing for even greater specialisation across countries and global supply chains.
Ultimately it is Australian households, as both wage-earners and consumers that benefit from higher productivity, access to imported goods and services at lower cost, and much greater product variety.
We also know that competition, whether from international or domestic businesses, inevitably creates winners and losers. Exporters see benefits from sales abroad. In contrast, the businesses and their employees competing against imports see intense competition, often from foreign businesses that don’t face the same taxes, regulations or wages, which on the face of it seems blatantly unfair.
So, although international trade brings great national and global benefits, some can lose, at least in the short term, driving anti-trade sentiment.
The answer isn’t and shouldn’t be to impede imports (or some exports) by pursuing protectionist or mercantilist policies, whatever the mechanism — tariffs; quotas; discriminatory taxes, subsidies or regulations; or local purchasing preference, to name just
FEATU
RE
AR
TICLE
The 200th anniversary of David R
icardo

a few. As Australia learnt after many decades behind a tariff wall designed to protect the manufacturing sector and some parts of agriculture, the income costs of forgone exports, a high domestic cost structure and low productivity became too great. We learnt the hard way that arguments for protection are based on the fallacy that foreigners bear the costs.
This doesn’t mean we shouldn’t actively promote the benefits and minimise the adjustment costs of trade. We maximise the benefits primarily by nurturing a flexible, dynamic and innovative domestic economy — one that promotes competition and the process of creative destruction to drive innovation and continuous improvement and that allows our scarce endowments to flow to their highest-valued uses, including export sectors. An economy that is not burdened by excessive, inflexible regulations or inefficient business and personal taxes that deter investment and risk-taking.
Higher productivity means we can compete against countries with much lower wages or other apparent ‘unfair’ advantages while paying high wages. It is relative unit costs that matter.
Adjustment pressures cannot be avoided, but they can be managed by providing a well-targeted safety net and reskilling displaced workers. In practice, it is difficult disentangling the adjustment impacts of trade from technology and other economic shocks, so the focus should be on facilitating and cushioning adjustment whatever the cause, including through access to lifelong learning.
It is sometimes argued that Australia is too reliant on relatively ‘simple’ resource exports, which make up roughly half of all our goods exports.
But we need to be careful about walking away from the principle of comparative advantage. More-complex exports will not deliver higher national income if the opportunity costs of producing them are commensurately higher. We cannot produce and export everything to everybody because we do not have unlimited endowments. At any rate, the process of mineral and resource extraction in Australia is highly sophisticated and innovative even if at the end of the day the product being exported is a lump of rock.
While we should avoid trying to pick export winners, we shouldn’t impede existing or potential winners through unfavourable policy settings.
For example, our agricultural export potential would benefit from greater investment and linkages to growing Asian markets, yet lower screening thresholds discourage foreign direct investment in the sector which has the potential to provide both.
Trade in services is also often tightly interwoven with foreign direct investment and the market linkages it can bring.
Comparative advantage is not set in concrete. New technologies, including digital technologies that reduce transaction costs, are opening up new global trading possibilities at a rapid rate, including opportunities for much greater specialisation in global supply chains.
The rate of change reinforces the need for flexibility and responsiveness across businesses of all sizes and all business models, and regulatory and policy settings must not impede this.
It is worth bearing in mind that exporting can demand large-scale operations. Indeed, the ABS estimates that 95 per cent of our goods exports come from large businesses. While exports from smaller businesses are to be encouraged, policies that effectively penalise larger businesses and business growth by imposing distortionary thresholds, for example, could impede our export potential.
It goes without saying that Australia should also continue to seek to reduce global barriers and push back against global protectionist pressures, but doing this won’t deliver the maximum gains if we fail to get our own house in order. Arguably our strongest bargaining chip and authority in international trade negotiations comes from being an exemplar of the domestic benefits that flow from a truly open economy.
FEATU
RE A
RTIC
LE The 200th anniversary of D
avid Ricardo
16

CH
AP
TER
1 C
hanges in global trade shaping the Australian econom
y
02
Aerial photograph of Australian outback and dry road with roadtrain17
IND
USTR
Y INSIG
HTS G
lobalising Australia

CH
AP
TER
1 Changes in global trade shaping the A
ustralian economy $100 $110
$110 – $100 = $10$100
Total = $210
Total = $110
Australia’s iron ore exports to China
Value of Australia’s exports making it to the United States
Value of China’s exports making it to the United States
China’s steel exports to United States
Gross export statistics
Value-added trade statistics
Gross trade vs value added tradeA value-added look at trade measures the individual country contributions at each stage of the global supply chain. This is different to the conventional measure of gross exports which measures the full price of a product every time it crosses an international border.
In the example below, Australia exports $100 of iron ore to China which is transformed into steel and exported to the United States for $110.
Digging deeper into global supply chains

CH
AP
TER
2D
igging deeper into global supply chains
IND
USTR
Y INSIG
HTS G
lobalising Australia
19
It’s common knowledge that China is our largest export partner, but to what extent does Chinese demand drive Australian export growth? After all, a shipment of iron ore to China could become a car destined for the United States (US) or a refrigerator exported to Europe, the United Kingdom (UK) or any other global consumer. In this example, it is US demand for cars that determines whether that shipment of iron ore will be made or not, rather than Chinese domestic demand per se.
Similarly, the production process involves a plethora of intermediate goods and services that conventional trade statistics do not capture as exports. But they are, since these goods and services are embodied in the product. The suppliers of these intermediate goods and services could benefit from a more-nuanced understanding of how global supply chains affect their business.
Following on from work done by the Reserve Bank of Australia (RBA),22 this chapter updates their work and explores these issues further, identifying the key sources of export growth for Australian industries and how the sectors that supply them have changed over time. The chapter begins by explaining the concept of ‘value added’, followed by a modern analysis of the Australian export market. Here the true sources of export demand are revealed, as are the silent contributions made by industries that are typically only thought of in a domestic context. The chapter then presents a detailed analysis of recent changes to Mining production and the Manufacturing and Services industries before concluding with a brief summary of the lessons learned.
Traditional measures only capture half the storyNearly every conceivable product or service embodies the production and inputs of other businesses. While consumers pay the product’s final value to the last business involved in the production process, businesses at every other stage have also contributed their capital and labour as intermediate inputs. Every stage of the production process adds value until the final product reaches the consumer. Figure 2.1 shows a hypothetical production process for tyres. The final price is the total value added by capital and labour at each stage of the production process.
At stage one of this hypothetical production process for a tyre, the value of capital and labour required to produce the iron ore and coal inputs are $0.50 each, while the value to produce the chemicals is $9 (a total capital and labour price of $10 for stage one). At stage two of the production process, four components are required to produce a tyre (of which iron ore, coal and chemicals from stage one of the production process are inputs). The value of capital and labour required to produce the steel component is $2, to produce the required energy is $3, to produce the rubber component is $20 and the design/assembly of the finished tyre is $5. This is a total capital and labour component price of $20 for stage one. At stage 3, an additional $45 of capital and labour is required for the tyre to reach the consumer.
22 Kelly, G and La Cava, G (2014) International Trade Costs, Global Supply Chains and Value-Added Trade in Australia, Reserve Bank of Australia.

CH
AP
TER
2 Digging deeper into global supply chains
20
Figure 2.1: Stylised example of a value chain for tyres
Source: Department of Industry, Innovation and Science (2018), author calculations
‘Value added’ is the measure of these individual contributions and can be thought of as the last price of a product sold, less the price that business paid to other businesses for its inputs (i.e. $75 minus $30). In the context of international trade, it is the country’s firms participating in the global supply chain that add value. Similarly, it is the last country in the global supply chain that becomes the end consumer where the product or service is then absorbed as final demand.
Conventional trade statistics overstate the total value of worldwide trade because they treat all products and services as final. In the case of gross export statistics, they record the full price of a product every time it crosses an international border. The entire product’s value is then attributed to the exporting country without accounting for the value already added by other countries. This treatment effectively double-counts the intermediate inputs used at every stage of the global supply chain. Box 2.1 demonstrates the difference between the conventional treatment of gross exports and the value-added approach.
Although they are closely related, gross trade statistics and the value-added approach measure two quite different aspects of international trade, but both methods have their place. A useful method for comparing between industries or the various bilateral trade relationships Australia has with other regions is to find the ratio of value-added exports to gross exports. This is known as the Value-Added Exports (VAX) ratio.23 By definition, a VAX ratio of less than one occurs when value-added exports are less than gross exports. This can occur when some of the value of a country’s exports is imported from another country and not sourced from domestic value-added. A VAX ratio greater than one (when value-added exports are greater than gross exports) can occur when some of a country’s domestic value-added reaches a trading partner indirectly through being embedded in an
23 Johnson RC and Noguera G (2012), Fragmentation and Trade in Value Added over Four Decades, NBER Working Paper No 18186.
Steel $2
Energy $3
Rubber $20
Design $5
Chemicals $9
Coal 50¢
Iron Ore 50¢
+$20 capital and labour price=$30
Tyre$75
$10 capital and labour price=$10
+$45 capital and labour price=$75

CH
AP
TER
2D
igging deeper into global supply chains
IND
USTR
Y INSIG
HTS G
lobalising Australia
21
Box 2.1: Comparison of gross trade and value-added trade
Suppose Red Ores Limited — a hypothetical Australian exporter — sells AUD$100 of iron ore to China, where it is then processed into steel. The steel is then sold to a manufacturer in the US for AUD$110, where it is consumed domestically. Red Ores has exported AUD$100 of value from Australia to the US, albeit indirectly and in a transformed state. China’s value-added trade with the US is then AUD$10, which represents the value added during the production process (AUD$110 minus AUD$100). The value-added approach draws a line directly from the original source of a product’s inputs to its final destination where the end product is eventually consumed.
Figure 2.2 illustrates how this example would be treated using conventional trade statistics compared with the value-added approach. Conventional measures record the full price of the product every time it crosses an international border. In this example, the Australian shipment of iron ore has been counted twice, while the value added approach only records the net contribution made by each country to the final product. Conventional trade statistics overstate the value of international trade, particularly as products move further down the global supply chain.
Figure 2.2: Comparison of gross trade and value-added trade
Source: Kelly, G and La Cava, G (2014) International Trade Costs, Global Supply Chains and Value-Added Trade in Australia, Reserve Bank of Australia.
China(+10)
Gross trade Value added trade
China(+10)
US(–110)
Australia(+100)
US(–110)
Australia(+100)
$100
$10$110$100
$210 total $110 total

CH
AP
TER
2 Digging deeper into global supply chains
22
intermediate country’s exports. For example, iron ore form Australia is exported to China and transformed into an earth moving component for a machine built in the United States which is then exported to Australia.24
Each VAX ratio relates to one particular trade relationship, such as exports flowing from the Australian Resources industry (which includes the mining and agricultural sectors) to China. Here the VAX ratio describes the amount of value created by the Resources industry per dollar of resources exported to China.
Identifying the true sources of export demandIn the earlier stylised example of a global supply chain (Figure 2.2), iron ore was exported from Australia to the US through China, where it was first transformed into steel. If this particular example was indicative of the entire Australia–China–US supply chain, then the resulting VAX ratio between China and the US would be less than one. This is in fact what the data shows. This implies that Chinese production for the US is relatively downstream, meaning that a large proportion of China’s exports are sent directly to the US for consumption. In contrast, a VAX ratio greater than one would imply a more indirect trading relationship. The majority of goods and services would first pass through a third country before arriving at their final destination.
Table 2.1 compares some of Australia’s key trade partners using data obtained from the World Input-Output Database (WIOD) for 2014.25 The first row shows that while only 4.3 per cent of Australian gross exports were exported directly to North America (the US, Canada and Mexico), 9 per cent of Australia’s value-added exports are consumed there. Australia produced 1.69 times more of the value consumed in North America than the amount of goods and services it exported there directly.
24 Kelly, G and La Cava, G (2014) International Trade Costs, Global Supply Chains and Value-Added Trade in Australia, Reserve Bank of Australia
25 Timmer MP, Dietzenbacher E, Los B, Stehrer R and de Vries GJ (2015), An Illustrated User Guide to the World Input-Output Database: The Case of Global Automotive Production, Review of International Economics, 23, pp. 575–605

CH
AP
TER
2D
igging deeper into global supply chains
IND
USTR
Y INSIG
HTS G
lobalising Australia
23
Table 2.1: Regional shares of Australian exports, 2014
Gross exports (per cent)
Value-added exports
(per cent)Difference
(p.p.) VAX ratioNorth America 4.3 9.0 4.7 1.69
United Kingdom 1.3 1.8 0.5 1.14
European Union (EU) 2.1 4.6 2.5 1.75
Non-Euro EU 0.9 1.4 0.5 1.23
South Korea & Taiwan 9.6 5.9 -3.7 0.49
Japan 16.2 14.5 -1.7 0.72
China 26.9 25.3 -1.6 0.75
Rest of World 38.8 37.5 -1.3 0.77
Total 100.0 100.0 0.0 0.80
Source: World Input-Output Database (2016) Input-Output Tables; Department of Industry, Innovation and Science (2017)
The results are based on new sources of data that attempt to harmonise across 44 countries, making a number of necessary assumptions in the process.
According to these statistics, it follows that demand from North America is 1.69 times more important to the Australian economy than conventional trade statistics imply. The results are similar for other advanced Western economies but the opposite is true for the manufacturing hubs of North-East Asia. These countries often act as assembly points where intermediate goods and services — Australian resources in particular — are transformed into new products to satisfy demand elsewhere in the world.
These results have important implications for how global opportunities and risks are assessed. North American demand shocks, for example, have a much larger direct effect on Australian exports than traditional trade statistics suggest. They also highlight the importance for Australia of other countries’ steps to reduce their trade costs. Improvements made anywhere along the global supply chain can potentially benefit Australia. Figure 2.3 shows how the VAX ratio between Australia and its trading partners has developed over time. It shows that Australia’s VAX ratio with North America and the Euro-zone has been increasing over time, suggesting that demand from these regions has been increasing in importance for the Australian economy.

CH
AP
TER
2 Digging deeper into global supply chains
24
Figure 2.3: Ratio of Australian value added to gross exports (VAX) by destination region, 2000 to 2014
Source: World Input-Output Database (2016) Input-Output Tables; Department of Industry, Innovation and Science (2017)
0.0
0.2
0.4
0.6
0.8
1.0
1.2
1.4
1.6
1.8
2.0
2000 2002 2004 2006 2008 2010 2012 2014
VAX
ratio
North America Euro-zone
United Kingdom
JapanChina
South Korea& Taiwan
Australia

CH
AP
TER
2D
igging deeper into global supply chains
IND
USTR
Y INSIG
HTS G
lobalising Australia
25
Industries’ silent contributions to exportsThe same type of analysis can be applied to Australian industries. Just as gross trade flows mask the true destination of many Australian goods and services, they also tend to understate the contribution made by some sectors of the domestic economy. Underrepresented industries may be more exposed to the global economy than they themselves realise.
Table 2.2 shows industry contributions to Australian exports. For example, the value added to Australian exports by the Manufacturing industry is just 37 per cent of its gross exports (VAX ratio is 0.37). In contrast, the Services industry contributes 44.5 per cent of the value-added content that Australia exports around the world, despite representing just a quarter of gross exports.
Table 2.2: Industry shares of Australian exports, 2014
Industry
Gross exports
(per cent)
Value-added exports
(per cent)Difference
(p.p.) VAX ratioResources 48.3 39.1 -9.1 0.65
Agriculture 4.3 5.2 0.9 0.96
Mining 43.9 33.9 -10.0 0.62
Manufacturing 24.9 11.6 -13.3 0.37
Construction/Utilities 0.5 4.8 4.3 8.23
Services 26.4 44.5 18.1 1.35
Total 100.0 100.0 0.0 0.80
Source: World Input-Output Database (2016) Input-Output Tables; Department of Industry, Innovation and Science (2017)
The interdependencies are clear — industries rely on each other to produce exported goods and services. When a goods producer exports a product, they are effectively producing a container to ship the production of other domestic industries all around the world. Even the construction of factories and the energy that supplies them becomes an export using this model.
The industry-averaged results presented so far tend to smooth out the considerable variation that occurs within industries. For example, while the share of Resources exported directly to North America is only 0.4 per cent, the VAX ratio is around 12 (see Appendix A). This means that approximately five per cent of Australian Resources exports are destined for North America, despite purchasing only a fraction of this amount directly.26 Going back to Box 2.1, these commodities are first being shipped to a third country where they are transformed into steel, a car, a refrigerator, or even breakfast cereal before they reach North America. Similarly, while Resources only comprise 4.4 per cent of all Australian exports to North America, they are 31 per cent in value-added terms. Again, whilst this is the average for all Resources exports, higher concentrations exist for certain commodities (see Appendix A).
26 Value-added exports are equal to the VAX ratio multiplied by the amount of gross exports.

CH
AP
TER
2 Digging deeper into global supply chains
26
Australia and the world — an international perspectiveResearch by the RBA (2014) has found that, by international standards, Australian production is highly fragmented (number of stages in the production process) and relatively upstream (stages away from the finished product), partly because of the importance of resource exports. This work showed that during the late 1990s, Australian production became more fragmented and further upstream. These changes coincided with a period of significant structural change in Australia and resulted from both the changing composition of Australian industry and adaptation within industries.27
Increasingly fragmented production can often signify a country’s growing integration into the global supply chain, as trade costs decline and the production process is increasingly outsourced to regions with comparative advantage. However, the domestic value-added content of Australian exports remains the second-highest in the world. Figure 2.4 shows the average country’s proportion of domestic value-added content was 61.5 per cent in 2014, while it was 80 per cent for Australia. This is mostly due to Australia’s geographic isolation and its industry composition. Indeed, the top ten countries either have large internal economies or are commodity exporters. As of 2014, Resources comprised 48 per cent of Australian gross exports, the second-highest after Norway, while Manufacturing was responsible for just 25 per cent of exports compared to the global average of 57 per cent. Because the more upstream Resources industry inherently has a higher proportion of value-added content, higher concentrations of resource exports in place of manufactured goods tend to increase a country’s overall VAX ratio.
27 Kelly, G and La Cava, G (2014) International Trade Costs, Global Supply Chains and Value-Added Trade in Australia, Reserve Bank of Australia

CH
AP
TER
2D
igging deeper into global supply chains
IND
USTR
Y INSIG
HTS G
lobalising Australia
27
Figure 2.4: International proportions of domestic value-added content to gross exports, 2010 and 2014
0.0 0.1 0.2 0.3 0.4 0.5 0.6 0.7 0.8 0.9 1.0
VAX ratio
RussiaAustralia
IndonesiaUnited States
China
BrazilUnited Kingdom
JapanIndia
ItalyRest of the world
RomaniaGermany
FranceCroatiaCyprus
SwedenTurkeyPoland
SpainMexico
Average*Greece
PortugalAustriaFinland
NetherlandsKorea
DenmarkLithuaniaSloveniaBulgaria
TaiwanEstonia
BelgiumCzech Republic
IrelandSlovak Republic
HungaryMalta
Luxenbourg
Lativa
Norway
Canada
Switzerland
Notes: World average is the unweighted mean rate for 43 countries and the Rest of the World
Source: World Input-Output Database (2016) Input-Output Tables; Department of Industry, Innovation and Science (2017)

CH
AP
TER
2 Digging deeper into global supply chains
28
Australian industry VAX ratios also tend to differ from global averages. The ratio for Resources, for example, is less than half the global average (Table 2.3).
This at least partially reflects Australia’s status as a major net exporter of commodities.28
Table 2.3: Comparison of Australian and international average gross and value-added proportions of total exports by industry, 2014
VAX ratio Industry weightIndustry sector Australia World avg. Australia World avg.
Resources 0.65 1.46 0.48 0.09
Manufacturing 0.37 0.36 0.25 0.57
Construction/Utilities 8.23 4.82 0.00 0.02
Services 1.35 1.22 0.26 0.32
All industries 0.80 0.62 1.00 1.00
Notes: World averages are the unweighted mean rate for 43 countries and the Rest of the World
Source: World Input-Output Database (2016) Input-Output Tables; Department of Industry, Innovation and Science (2017)
The increased dominance of goods exporters in Australia relative to other countries also plays a role in increasing the VAX ratio for other industries, since goods exporters rely on them for their own production. Services, in particular, account for around 20 per cent of the total value embodied in resources and manufactured goods. Legal and Accounting, Head Offices and Management Consultancy Activities; Wholesale Trade, except Motor Vehicles and Motorcycles; and the Land Transport and Transport via Pipelines sectors make the largest contributions.
Overall, Australia’s VAX ratio is 0.185 higher than the world average. This result can be broken down into the effects caused by Australian industry VAX ratios differing from those found elsewhere in the world, and the effect caused by industry composition. The former is called the ‘within effect’ because it represents the overall change due to differences between two countries within the same industry, while the latter is known as the ‘between effect’ because it captures the overall change due to different allocations of gross exports between industries — that is, their industry weights.
As a rule, the closer a nation is to the centre of a global trading block, the more diverse its exports and the lower its VAX. Table 2.4 shows that, in 2014, if Australia had a more typical industry composition, its overall VAX ratio would have been lower than the world average by 0.047 (‘within effect’). But Australia’s industry composition was not typical. As already discussed, high concentrations of Resources exports in place of Manufacturing tends to increase the overall domestic value-added content of a country’s exports. Had industry composition been the only factor, then the Australian VAX ratio would have been 0.231 higher than the world average (‘between effect’). The combination of these two effects explains why the Australian VAX ratio was 0.185 higher than the world average. Table 2.4 shows how each industry contributed to the difference.
28 Commodities can be consumed domestically, embodied in other industries’ exports or exported directly. A relative increase in the latter reduces the VAX ratio.

CH
AP
TER
2D
igging deeper into global supply chains
IND
USTR
Y INSIG
HTS G
lobalising Australia
29
Table 2.4: Difference in the Australian vs other countries’ value-added exports ratio by industry contribution, 2014
VAX ratio differences
Industry composition
Industry World avg. (‘within effect’) Industry total29
Resources –0.205 0.206 0.001
Manufacturing 0.006 0.083 0.089
Construction/Utilities 0.073 –0.053 0.020
Services 0.079 –0.004 0.075
Total –0.047 0.231 0.185
Source: World Input-Output Database (2016) Input-Output Tables; Department of Industry, Innovation and Science (2017)
Changing structures in the Australian export marketAustralia has increasingly become a net exporter of intermediate products and a net importer of final products over the past two decades. This reflects the growing fragmentation of production across borders, as the emerging economies in Asia become major importers of Australian resource commodities that are used as intermediate goods for processing and export.30 2930
At the turn of the millennium, Manufacturing was Australia’s largest export industry (40 per cent in 2000), but that mantle has since been handed to Resources. Measured as a proportion of GDP, manufactured exports have almost halved since 2000, while Resources exports have more than doubled. But as already discussed, these conventional measures tend to undervalue the silent contribution made by other sectors to the Australian export market. Table 2.5 shows the extent of the discrepancy. Services, for example, have consistently contributed around 45 per cent of the domestic value-added content in Australian exports since the beginning of the 2000s. The Services industry was and is Australia’s largest exporter in terms of the export value it creates for the country. Again, it’s worth noting that even though the goods-producing sectors appear to contribute less to the country than conventional statistics imply, they produce the products that allow other sectors to export through them.
29 For industry i the difference between Australia and country j, averaged over 43 countries and the rest of the world is:
30 Kelly, G and La Cava, G (2014) International Trade Costs, Global Supply Chains and Value-Added Trade in Australia, Reserve Bank of Australia

CH
AP
TER
2 Digging deeper into global supply chains
30
Table 2.5: Gross and value-added Australian exports as a proportion of gross domestic product (GDP) by industry, 2000 and 2014
Gross exports (per cent of GDP)
Value-added exports (per cent of GDP)
Industry 2000 2014 Chg. 2000 2014 Chg.
Resources 3.3 5.0 1.7 2.7 3.3 0.6
Manufacturing 4.8 2.6 –2.2 2.0 1.0 –1.1
Construction/Utilities 0.0 0.0 0.0 0.3 0.4 0.1
Services 3.0 2.8 –0.3 3.9 3.7 –0.1
Total exports 11.2 10.4 –0.7 8.9 8.4 –0.6
Source: World Input-Output Database (2016) Input-Output Tables; Department of Industry, Innovation and Science (2017)
Given the magnitude of changes that have occurred in recent years, it may come as a surprise that the VAX ratio for Australia was at the same level in 2014 as it was in 2000. But underneath the surface, almost every industry has reduced its VAX ratio since then. Services is the exception, in part due to the growth in goods exports that rely on its contribution. Had these effects been all that was in play, then Australia’s VAX ratio would have been 0.74 in 2014 rather than its actual value of 0.80. But these effects have been fully offset as the economy moves away from exporting manufactured goods to resources.
Degrees of fragmentation are the outcome of complex interactions between trade costs (like tariffs and compliance requirements), transportation costs and coordination costs associated with offshoring, as well as the possibilities for substitution between the goods and services used in production.31 Because the VAX ratio is related to fragmentation, it’s similarly affected. But where fragmentation measures the number of stages in production, the VAX ratio is calculated using export values in US dollars. Consequently, it is also affected by relative price movements, like the dramatic increase in commodity export prices that occurred over the period. With so many interactions, each industry has its own story. Broadening the analysis from exports to all domestic production, the following sections delve deeper into some of the recent trends in key industries.
31 Los, et al. (2015) ‘How Global are Global Value Chains? A New Approach to Measure International Fragmentation’, Journal of Regional Science, 55(1), pp. 66–92

CH
AP
TER
2D
igging deeper into global supply chains
IND
USTR
Y INSIG
HTS G
lobalising Australia
31
Mining sector productionThe Resources industry includes both agricultural and mining sectors, but since the Mining and Quarrying sector (mining sector) accounts for around 90 per cent of exports, it makes sense to focus on developments in this sector. Figure 2.5 shows the share of each industry’s contribution to Mining output in terms of value added.
Figure 2.5: Industry value added to Australian Mining production, 2000 and 2014
0 10 20 30 40 50 60 70
Mining
Manufacturing
Utilities
Construction
Services
Imports
Per cent
20142000
Source: World Input-Output Database (2016) Input-Output Tables; Department of Industry, Innovation and Science (2017)
Imports and Australian Services in 2014 were responsible for a greater share of the value created within the Mining sector than they were in 2000. Financial Services Activities; Legal and Accounting; Head Offices and Management Consultancy Activities; and Administrative and Support Services were the standout sectors. Their contributions all peaked in 2012, coinciding with the peak of the mining investment boom. These are essential services for businesses wishing to raise capital and expand their operations.
Whereas the increased contribution from Services can be related to structural change in the Mining sector, rising imports are more closely related to price competition from overseas. Around 83 per cent of the overall change in imported value added was due to the changing composition in the industry (the ‘within effect’). In the absence of any changes to their input requirements, the foreign contribution to Australia’s mining output still would have increased by 83 per cent of the amount it did. The remaining 17 per cent of the increase is due to the industry sourcing different goods and services from industries that are inherently more reliant on imports (the ‘between effect’).

CH
AP
TER
2 Digging deeper into global supply chains
32
There are significant links between the ‘within effect’ and Australia’s increasing terms of trade between 2000 and 2014. This suggests that international price competition may be responsible for the increase. Analysis shows that the link is strongest with currency movements occurring one year earlier.32
Manufacturing industry productionA similar analysis for the Manufacturing industry is a more-complicated story because it is a broad industry that describes the production from 19 separate industry sectors. Over time, the final demand for each of these 19 sectors changes, as well as the sectors that supply them and their proportion of foreign value added.
As was the case for the Mining sector, the domestic Manufacturing industry now produces a smaller proportion of the value embodied in its own products than it did in 2000 (Figure 2.6). To be clear, this says nothing about the health of the Manufacturing industry by itself; it simply means that Manufacturing has become more integrated with other sectors domestically and abroad. It is a reflection of increased trade in intermediaries as the production process becomes more specialised. Increasing trade between sectors has the potential to increase the productivity of Australian businesses. Prices fall and production rises, increasing both efficiency and the size of the economy. Businesses decide to outsource their production when they expect that the productivity gains will outweigh the additional supply costs.
Figure 2.6: Industry value added to Australian Manufacturing production, 2000 and 2014
Source: World Input-Output Database (2016) Input-Output Tables; Department of Industry, Innovation and Science (2017)
32 Regression analysis on the ‘within effect’ (holding industry composition constant) suggests that a one per cent change in the Trade Weighted Index leads to a 0.665 per cent increase in the overall level of foreign value added (p=0.012).
0 10 20 30 40 50
Agriculture
Mining
Manufacturing
Utilities
Construction
Services
Imports
Per cent
20142000

CH
AP
TER
2D
igging deeper into global supply chains
IND
USTR
Y INSIG
HTS G
lobalising Australia
33
Around the time of the Global Financial Crisis (GFC), there was a significant shift in demand for different types of manufactured products, away from durable goods to non-durables. Taking one example, from 2007 onwards, the share of non-durable Food, Beverages and Tobacco Products increased from 37.5 to 42.0 per cent of final demand. In contrast, the share of Motor Vehicles, Trailers and Semi-Trailers (an example of durable goods) fell from 13.5 to 9.5 per cent of Manufacturing output.
Variations in final demand for the goods produced by different Manufacturing sectors (‘between effect’) do not explain the industry’s declining contribution to its own products. Figure 2.7 shows the contributing factors. Primarily responsible was the trend of increased outsourcing within most of the Manufacturing sectors (‘within effect’).
Figure 2.7: Decomposition of the effects resulting in a reduction in the value-added content of Australian Manufacturing, 2000 to 2014
–3.5
–3.0
–2.5
–2.0
–1.5
–1.0
–0.5
0.0
0.5
1.0
1.5
2001 2002 2003 2004 2005 2006 2007 2008 2009 2010 2011 2012 2013 2014
Per
cent
age
poin
t cha
nge
Shifting final demand between sectors (between effect)
Level of outsourcing within sectors (within effect)
Cumlative changeSource: World Input-Output Database (2016) Input-Output Tables; Department of Industry, Innovation andScience (2017)
While the individual contributions from almost every Manufacturing sector declined, the largest changes were declines in the manufacture of Motor Vehicles, Trailers and Semi-Trailers; and Machinery and Equipment and increases in Other Transport Equipment.33
Declining industry shares, coupled with increased outsourcing, are signs that a sector is struggling to remain competitive relative to its peers. More-competitive sectors, on the other hand, are likely to maintain or increase their industry shares, as they grow faster than the industry as a whole. In either case, the outsourcing of less-productive processes to more-productive specialists improves the sector’s competitiveness compared to what it otherwise would have been.
33 Other Transport Equipment includes shipbuilding, boatbuilding, aircraft manufacturing, railway rolling stock manufacturing, related repair services and other.

CH
AP
TER
2 Digging deeper into global supply chains
34
Manufacturing is increasingly sourcing a greater proportion of its inputs from overseas. However, unlike Mining, regression analysis does not find any relationship between the level of imports and short-term currency movements, although they do follow a similar long-term trend. China’s accession to the World Trade Organization (WTO) in 2001 is a likely source driving both these trends, but it does not explain why the proportion of imported content seems relatively unaffected by short-term currency fluctuations.
One possible explanation is that the intermediate goods and services embodied in manufactured products are not easily substituted. Manufactured products are often designed around existing ‘off the shelf’ components made by other businesses, or suppliers are contracted to custom-make the components. The costs associated with changing a design, finding new suppliers, and subsequent retooling can be prohibitive. It can also take years to build a trusted customer supplier relationship. Where this is the case, it is reasonable to expect that Manufacturing businesses are relatively unresponsive to short-to-medium-term currency fluctuations. However, a substantial and sustained currency appreciation could make switching to a foreign supplier worthwhile.
Services industry productionThe Australian Services industry, unlike other industries, increasingly produces the majority of the value embodied in its own products, increasing from 85.4 per cent to 87.6 per cent between 2000 and 2014 (Figure 2.8).
Figure 2.8: Industry value added to Australian Services production, 2000 and 2014
0 20 40 60 80 100
Agriculture
Mining
Manufacturing
Utilities
Construction
Services
Imports
Per cent
20142000
Source: 2016 World Input-Output Database (2016) Input-Output Tables; Department of Industry, Innovation and Science (2017)

CH
AP
TER
2D
igging deeper into global supply chains
IND
USTR
Y INSIG
HTS G
lobalising Australia
35
At the industry level it appears that not much has changed, just a slight decline in the share of manufactured and imported content. But there have been changes at the sectoral level. Demand for Real Estate services increased, while Accommodation and Food services became responsible for a greater share of its own production from 2008, as did the Retail Trade sector in 2009. Relative price increases within these sectors no doubt play some role, since the WIOD measures production by value in US dollars. Rising property prices, for example, increase the value of each sale, and this shows up in the data as an increase in final demand. While some of these changes were significant, their effects were mostly offset by changes in other sectors.
Insurance, Reinsurance and Pension Funding, in particular, was affected heavily by the GFC and the European debt crisis. As monetary authorities around the world attempted to reinflate their economies, the return on financial assets declined. A large part of these companies’ earnings are generated from financial investments.
Figure 2.9 shows the aggregate change in Services’ own value added since 2000. Because the Real Estate sector outsources less of its production relative to other sectors, rising demand for this sector resulted in an overall increase of 0.7 percentage points to Services’ own value added (‘between effect’).
The ‘within effect’ added a further 1.5 percentage points due to the increasing contribution from the Retail Trade; Accommodation and Food Services; and Public Administration, Defence and Compulsory Social Security sectors in particular.
Figure 2.9: Decomposition of the effects leading to an increase in the value-added content of Australian Services, 2000 to 2014
-1.0
-0.5
0.0
0.5
1.0
1.5
2.0
2.5
3.0
Per
cent
age
poin
t cha
nge
Shifting final demand between sectors (between effect)
Level of outsourcing within sectors (within effect)
Cumulative change
Source: World Input-Output Database (2016) Input-Output Tables; Department of Industry, Innovation and Science (2017)

CH
AP
TER
2 Digging deeper into global supply chains
36
There was another change evident in Figure 2.9 — Services reduced its level of imported intermediate inputs by 0.8 per cent from 2000 to 2014. On first inspection this seems counterintuitive, given the terms of trade boom and what has occurred in the Mining and Manufacturing industries. However, this was the result of final demand shifting between service sectors (demand effect) and individual sectors’ changing supply patterns (‘between effect’). Because some sectors rely more heavily on imports than others, the effect was to reduce the overall proportion of imported content by 0.3 and 0.9 percentage points respectively. Within sectors, the change was more consistent with that experienced by other industries. In the absence of any sectoral changes in demand or supply patterns, the proportion of imported value added would have increased by 0.4 percentage points.
ConclusionThe world is now seeing the results of falling trade, transport and other coordination costs through the increased trade in intermediate goods and services. As a result, trade has become more fragmented across borders, as each stage of the global supply chain now produces a smaller share of the final product’s value.
In 2014, the RBA showed that Australian production is still highly fragmented and relatively upstream, partly because of the dominance of the resources industry.34 Australia’s competitive advantage in resource extraction has led to growth in the share of commodity exports in place of manufactured goods. Industry composition was one of the main reasons why, in 2014, Australian exports had the second highest level of domestic value-added content in the world.
The recent introduction of global input/output tables has allowed for a closer look into the workings of global supply chains. Analysis of the WIOD shows that the advanced economies of North America and the EU are significantly more important sources of Australian export demand than conventional trade statistics suggest. Global trade is also far more complex than many people realise. The Services industry, for example, is responsible for almost half of Australia’s total export value, despite representing just a quarter of gross exports. And it has been this way since at least the turn of the century. Services was, and remains, Australia’s largest exporter in terms of the export value it creates for the country.
The value-added approach allows a peek behind the curtain, exposing the drivers of change and their flow-through effects on industry supply patterns. Investment in buildings and structures, for example, coincided with the Mining sector becoming more reliant on financial and legal services. The associated terms of trade boom was probably behind the growing tendency for mining companies to source more of their inputs from overseas. Manufacturing also tended to increase its international outsourcing, particularly from China. Services, on the other hand, decreased its foreign reliance and increased its own value added. Within service sectors, however, there was a tendency to increase imported value added. But this was more than offset by demand shifts between sectors to those that are less reliant on imports.
The purpose of this chapter has been to highlight the complexity of global supply chains and to provide nuance to future trade debates. And there are some clear implications. Whether it be between countries or sectors of the domestic economy, policies designed to increase trade could benefit from understanding where value is created and where it is consumed as this could improve how businesses respond to global opportunities and risk.
34 Kelly, G and La Cava, G (2014) International Trade Costs, Global Supply Chains and Value-Added Trade in Australia, Reserve Bank of Australia

CH
AP
TER
2D
igging deeper into global supply chains
IND
USTR
Y INSIG
HTS G
lobalising Australia
37
Appendix A Value-added to gross exportsTable A1 shows the VAX ratio and proportion of Australian gross exports by destination and industry. Reading down the columns shows the VAX ratio between Australian industries and destination regions on the left, and the regional proportions (weight w) of the relevant industry’s gross exports. Similarly, reading across the table gives the VAX ratio at the top of each row and the industry’s proportion of all gross exports going to that region below. The intersection of weights (in bold) is the proportion of all Australian exports going to a region from each industry. Industry and regional totals are the VAX ratios and proportion of all gross exports for that industry or region.
For example, the first entry in Table A1 shows the VAX ratio for Australian Resources destined for North America is 12.03. Resources comprise 4.4 per cent of gross exports to North America and 0.4 per cent of Resources exports are destined for there, while resources exported to North America represent just 0.2 per cent of Australia’s total exports.
The end of the first row shows that the VAX ratio for all Australian exports to North America is 1.69, and 4.3 per cent of Australian exports are destined for the region. Similarly, the totals in the first column show that the VAX ratio for Australian resources exported to the world is 0.65 and that resources comprise 48.3 per cent of all exports. At the intersection of industry and regional totals is the 2014 Australian VAX ratio for all exports to the world. That figure is 0.80, which shows that Australian value-added exports is four-fifths of gross exports.

CH
AP
TER
2 Digging deeper into global supply chains
38
Table A1: Ratio of Australian value added to gross exports and sector weighting, from industry to export region, 2014
Resources Manufacturing Construction/ Utilities Services Region total
VAX w VAX w VAX w VAX w W VAX w
North America
VAX 12.03 0.004 0.50 0.100 8.63 0.086 2.19 0.058 1.69
w 0.044 0.002 0.585 0.025 0.009 0.000 0.362 0.015 1.000 0.043
UKVAX 4.39 0.002 0.44 0.019 5.71 0.024 1.18 0.026 1.14
w 0.061 0.001 0.381 0.005 0.009 0.000 0.549 0.007 1.000 0.013
EUVAX 2.28 0.012 0.72 0.024 8.18 0.047 1.94 0.035 1.75
w 0.272 0.006 0.283 0.006 0.010 0.000 0.434 0.009 1.000 0.021
Non-euro
EU
VAX 1.42 0.005 0.85 0.006 1.00 0.187 1.30 0.016 1.23
w 0.265 0.002 0.158 0.001 0.098 0.001 0.479 0.004 1.000 0.009
JapanVAX 0.53 0.237 0.39 0.117 33.23 0.035 2.09 0.071 0.72
w 0.704 0.114 0.179 0.029 0.001 0.000 0.115 0.019 1.000 0.162
ChinaVAX 0.56 0.365 0.37 0.190 13.88 0.154 1.71 0.170 0.75
w 0.655 0.176 0.176 0.047 0.003 0.001 0.167 0.045 1.000 0.269
S. Korea & Taiwan
VAX 0.35 0.130 0.29 0.082 25.03 0.019 1.40 0.047 0.49
w 0.657 0.063 0.213 0.020 0.001 0.000 0.129 0.012 1.000 0.096
Rest of World
VAX 0.76 0.246 0.33 0.462 6.71 0.447 1.04 0.577 0.77
w 0.305 0.118 0.297 0.115 0.005 0.002 0.393 0.152 1.000 0.388
w 1.000 1.000 1.000 1.000
Industry Total
VAX 0.65 0.37 8.23 1.35 0.80 1.000
w 0.483 0.249 0.005 0.264 1.000 1.000
Source: World Input-Output Database (2016) Input-Output Tables; Department of Industry, Innovation and Science (2017)

39
FEATU
RE
AR
TICLE
Looking ahead — observtions from
METS
Looking ahead — observations from METSRic Gros CEO, METS IgnitedAustralia is blessed with mineral wealth and, despite being a young nation, has built a world-leading, competitive mining industry and Mining Equipment, Technologies and Services (METS) and research sector. Australia today is a world-leading exporter of commodities, including iron ore, coal, lithium, gold, zinc and copper.
The commoditised nature of mining has meant that mining companies have a heavy reliance on METS companies for innovation across all aspects of their value chain and on Public Funded Research Organisations for research into new technologies and applications. This relationship has become a source of competitive advantage. This has then been leveraged to produce unique, diverse, customer-focused solutions for mineral exploration, extraction and processing equipment, and engineering services, as well as contract mining, mine software products and other related equipment.
Australian METS firms are competitive across the entire mining supply chain, with notable areas of global excellence; for example, 60 per cent of the world’s mining computer software is developed in Australia.
The METS sector is a success story. In 2015, its overall Gross Value Added (GVA) contribution to Australia totalled $86.2 billion, and it employed 503,000 Australians.
The specialised METS segment, or those products and services that are specific to the mining industry, represented a GVA of $43.3 billion. It also provided 314,000 jobs, and has grown at a rate of 6.5 per cent year-on-year since 2005, delivering over 150,000 new jobs during this period.
GVA from exports to over 200 mining jurisdictions, totalling $3.6 billion, form an important element of the specialised sector exports.
These are impressive numbers, but some sub-segments within the specialised METS Sector are growing at even faster rates. As shown in Figure 2.3, these are averaging 13.5 per cent year-on-year, or 261 per cent over a 10-year window.

FEATU
RE A
RTIC
LE Looking ahead —
observtions from M
ETS
Table 2.6: Growth and employment by sub-segment
Specialised METS segments
GVA by segment Jobs
GVA 2006 GVA 2015Growth $ of each
GVA growth % Jobs 2015
Total new jobs
Developing segments
Professional and Tech Services 4.8 2.6 –2.2 2.0 1.0 –1.1
Tech Equip Manufacturing 0.0 0.0 0.0 0.3 0.4 0.1
ICT 3.0 2.8 –0.3 3.9 3.7 –0.1
Other 11.2 10.4 –0.7 8.9 8.4 –0.6
Total 6.9 18.0 11.1 260.9 152,000 94,304
Other segments
Construction 5.2 8.1 2.9 155.8 44,000 15,753
Contract Mining 3.4 5.5 2.1 161.8 36,000 13,745
Wholesale Trade 2.1 3.6 1.5 171.4 23,000 9,583
Transport Services 3.0 4.4 1.4 146.7 28,000 8,909
Basic Equip Man 2.6 3.6 1.0 138.5 31,000 8,611
Total 16.3 25.2 8.9 154.6 162,000 56,602
Total Specialised METS 23.2 43.2 20.0 186.2 314,000 150,906
Source: METS Ignited
These ‘faster-developing’ segments have increased GVA by some $11.1 billion and have added an additional 94,000 jobs to the economy. These segments and are represented by the following areas:g Professional & Technical Services
□ surveying and mapping□ engineering design and consulting□ scientific testing and analysis□ scientific research□ technical and vocational education and training□ other specialised design
g Technical Equipment and Technical Services□ scientific equipment□ sophisticated mineral processing capabilities□ other specialised machine tools
g ICT (Information and Communication Technologies)g Other Services
□ advanced water purifications□ desalination□ precision electronic equipment.
40
41
As the mining industry evolved, the demand for research grew. Australia today has a world-class mining research capability represented by: CSIRO, Data 61, Mining3, CRC Optimising Resource Extraction, Deep Exploration Technologies CRC and universities with mining-related faculties — University of Queensland, Queensland University of Technology, University of New South Wales, University of Technology Sydney, RMIT, University of Western Australia, Curtin, Newcastle University, Federation University, University of South Australia, and University of Wollongong. These are complemented by facilitative institutions like Australian Mineral Industries Research Association Limited, Australian Coal Association Research Program, Australian Research Council and Minerals Research Institute of Western A. Australia, while accounting for only 3.7 per cent of the world’s publications, delivers 6.9 per cent of the world’s one per cent most-highly cited publications. Australia’s research capability is world-class across all sectors, not just the resources industry.
Despite the success of the Australian METS industry to date and the strength of its research capability, a range of key challenges and ecosystem trends are threatening its ability to compete.g In 2015, Australia ranked 10th for innovation input but 24th for innovation output, and
72nd (out of 141 countries) for innovation efficiency, or the ability to translate inputs into outputs.
g Australia is ranked poorly (33rd and declining) on collaboration — a critical innovation measure.
g This poor track record for commercialising its innovations seems to be correlated with a comparatively low level of collaboration through the innovation process. This results in a lack of alignment between problems and solutions, reflecting the relationships between METS, the mining and research sectors, which are often characterised as transactional rather than strategic. Consequently, it leaves much value ‘on the table’.
g The Australian capital markets lack depth — especially in early-stage and long-term capital — which, combined with weak management skills with the sector, limits growth in business scale.
g Despite the number of major Australian mining houses and world-class R&D infrastructure, few Australian METS have emerged as major global Original Equipment Manufacturers, inhibiting access to global supply chains of the T1 miners.
g There is competition from new and emerging markets such as China and India.
The emerging opportunities and megatrends
VCI, a specialist consulting company, recently postulated:
“In 2036, all mining equipment will be autonomous and controlled as part of an integrated value chain system, which will be optimised using artificial intelligence on a market pull basis, creating highly responsive production systems. Integration with preferred customers and suppliers will become seamless. Maintenance that isn’t automated will be undertaken by staff assisted by augmented reality technology. Robots and drones will be cheap and ubiquitous and will carry out ad hoc physical tasks with zero risk to people.”
FEATU
RE
AR
TICLE
Looking ahead – observtions from M
ETS
FEATU
RE A
RTIC
LE Looking ahead – observtions from
ME
TS
VCI also identified the following megatrends impacting the world of mining over the next 20 years: g The global demand for minerals will driven by rising middle class in India and China.g There will be fewer high-quality near-surface ore bodies, requiring deeper underground
and underwater mines.g Business models will be challenged by globalisation and technological advances. g There will be increasing societal expectations focusing on sustainable practices and
information transparency. g The Internet of Things and increasing computing power will facilitate automation and
data analytics, driving productivity, increasing safety shifting employment profiles and demanding integrated systems and interoperability.
g Technology advances will change extraction methods and economics and will impact on demand for specialty industrial minerals and rare earths.
g Global green energy, including battery storage and smart distribution grids, will impact demand on traditional fossil fuels like coal.
A successful transition The face of mining in 2026 will be significantly different to 2016, transforming the world of METS, the role of research and how they interact with one another and the global mining industry.
Success will depend on: g METS, mining and research industries collaborating more effectively and earlier in the
innovation process, with access to Living Labs to able to accelerate ideation, design, prototyping and testing.
g METS, and specifically SMEs, clustering to achieve scale, accelerate innovation and to optimise value-chain opportunities.
g METS aligning their focus to the strategies and roadmaps of mining companies. g Increasing the capital market’s level of investment in the METS sector.g Well-aligned industry development initiatives across government, research, METS
and miners.
Industry 4.0 will facilitate a revolution of innovation across the globe. Australian METS companies are well-placed to play a dominant role in the mining industry of the future and potentially growing a significant share of a world market. However, it will require innovation in its business models and technologies and, more importantly, in behaviours and relationships and the way in which we collaborate and align across the whole ecosystem, from government to research, METS, capital markets, and miners.
FEATU
RE A
RTIC
LE Looking ahead – observtions from
METS
42

IND
USTR
Y INSIG
HTS G
lobalising Australia
4343
03
Manufacturing and soldiering of iron tips onto a pcb board
IND
USTR
Y INSIG
HTS G
lobalising Australia
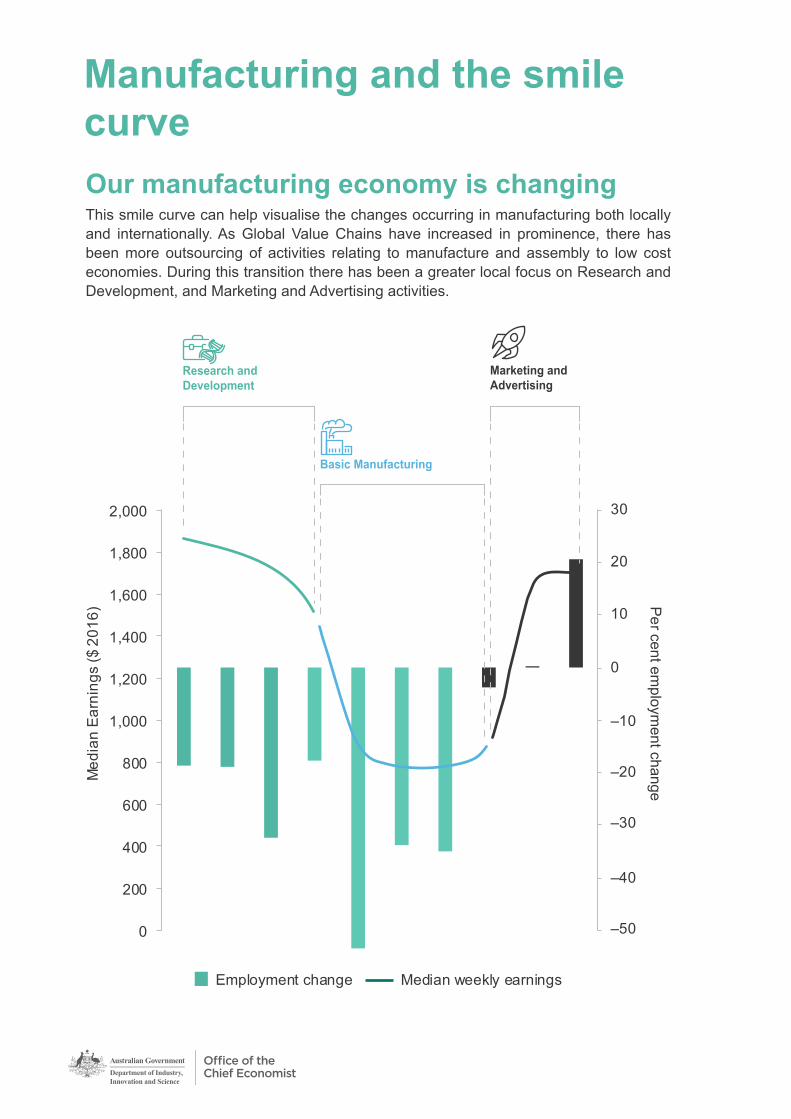
Marketing and Advertising
Research and Development
Basic Manufacturing
Our manufacturing economy is changingThis smile curve can help visualise the changes occurring in manufacturing both locally and internationally. As Global Value Chains have increased in prominence, there has been more outsourcing of activities relating to manufacture and assembly to low cost economies. During this transition there has been a greater local focus on Research and Development, and Marketing and Advertising activities.
–50
–40
–30
–20
–10
0
10
20
30
0
200
400
600
800
1,000
1,200
1,400
1,600
1,800
2,000
Med
ian
Earn
ings
($ 2
016)
Employment change Median weekly earnings
Per cent employm
ent change
Manufacturing and the smile curve
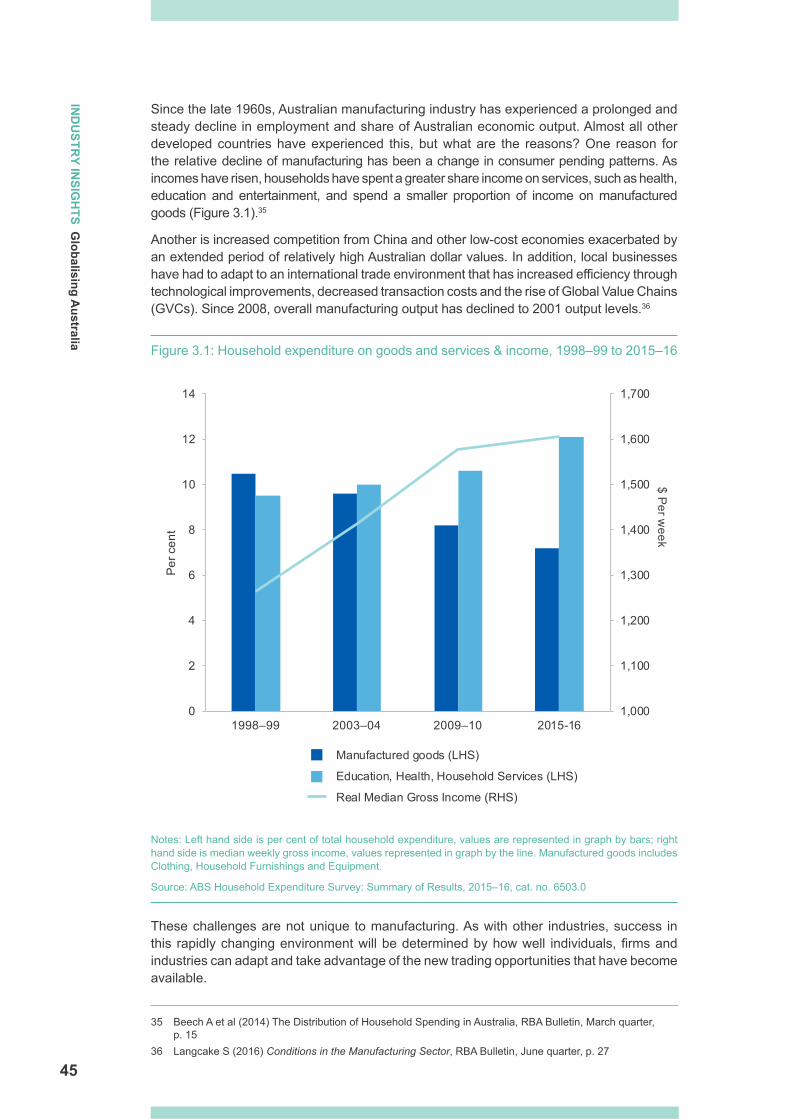
CH
AP
TER
3M
anufacturing and the smile curve
IND
USTR
Y INSIG
HTS G
lobalising Australia
45
Since the late 1960s, Australian manufacturing industry has experienced a prolonged and steady decline in employment and share of Australian economic output. Almost all other developed countries have experienced this, but what are the reasons? One reason for the relative decline of manufacturing has been a change in consumer pending patterns. As incomes have risen, households have spent a greater share income on services, such as health, education and entertainment, and spend a smaller proportion of income on manufactured goods (Figure 3.1).35
Another is increased competition from China and other low-cost economies exacerbated by an extended period of relatively high Australian dollar values. In addition, local businesses have had to adapt to an international trade environment that has increased efficiency through technological improvements, decreased transaction costs and the rise of Global Value Chains (GVCs). Since 2008, overall manufacturing output has declined to 2001 output levels.36
Figure 3.1: Household expenditure on goods and services & income, 1998–99 to 2015–16
Notes: Left hand side is per cent of total household expenditure, values are represented in graph by bars; right hand side is median weekly gross income, values represented in graph by the line. Manufactured goods includes Clothing, Household Furnishings and Equipment.
Source: ABS Household Expenditure Survey: Summary of Results, 2015–16, cat. no. 6503.0
These challenges are not unique to manufacturing. As with other industries, success in this rapidly changing environment will be determined by how well individuals, firms and industries can adapt and take advantage of the new trading opportunities that have become available.
35 Beech A et al (2014) The Distribution of Household Spending in Australia, RBA Bulletin, March quarter, p. 15
36 Langcake S (2016) Conditions in the Manufacturing Sector, RBA Bulletin, June quarter, p. 27
1,000
1,100
1,200
1,300
1,400
1,500
1,600
1,700
0
2
4
6
8
10
12
14
1998–99 2003–04 2009–10 2015-16
Per c
ent
Manufactured goods (LHS)
Education, Health, Household Services (LHS)
Real Median Gross Income (RHS)
$ Per week
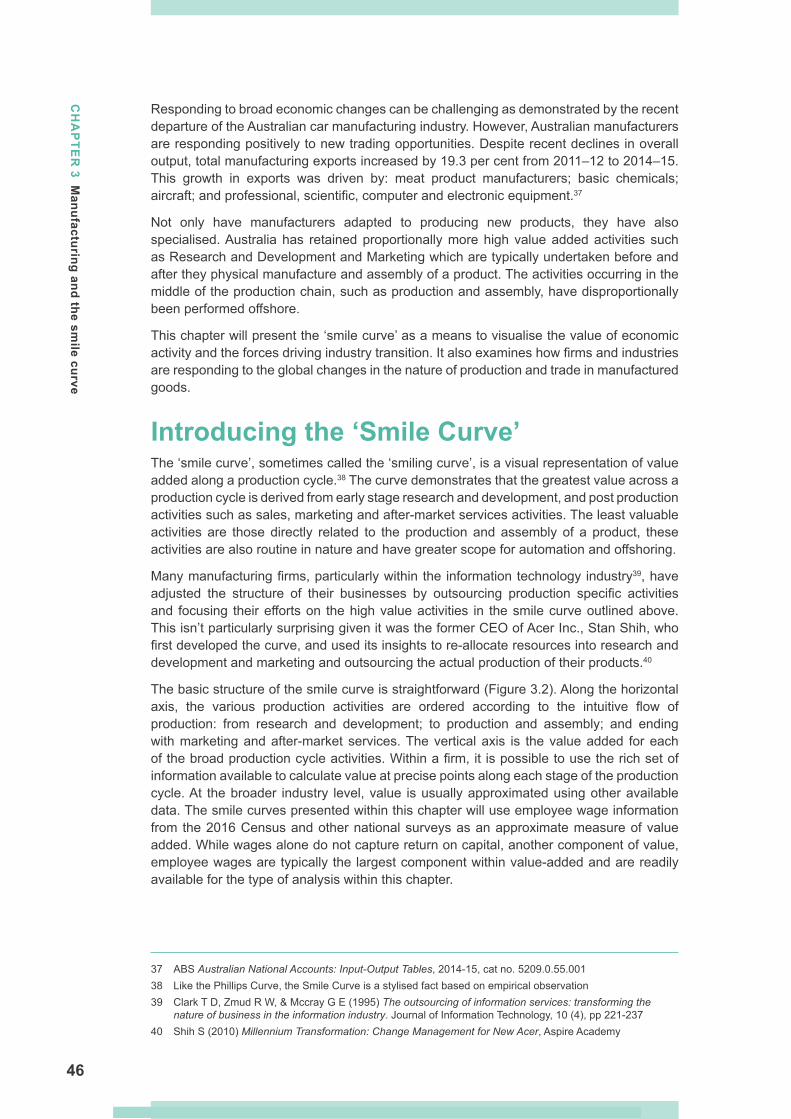
CH
AP
TER
3 Manufacturing and the sm
ile curve
46
Responding to broad economic changes can be challenging as demonstrated by the recent departure of the Australian car manufacturing industry. However, Australian manufacturers are responding positively to new trading opportunities. Despite recent declines in overall output, total manufacturing exports increased by 19.3 per cent from 2011–12 to 2014‒15. This growth in exports was driven by: meat product manufacturers; basic chemicals; aircraft; and professional, scientific, computer and electronic equipment.37
Not only have manufacturers adapted to producing new products, they have also specialised. Australia has retained proportionally more high value added activities such as Research and Development and Marketing which are typically undertaken before and after they physical manufacture and assembly of a product. The activities occurring in the middle of the production chain, such as production and assembly, have disproportionally been performed offshore.
This chapter will present the ‘smile curve’ as a means to visualise the value of economic activity and the forces driving industry transition. It also examines how firms and industries are responding to the global changes in the nature of production and trade in manufactured goods.
Introducing the ‘Smile Curve’The ‘smile curve’, sometimes called the ‘smiling curve’, is a visual representation of value added along a production cycle.38 The curve demonstrates that the greatest value across a production cycle is derived from early stage research and development, and post production activities such as sales, marketing and after-market services activities. The least valuable activities are those directly related to the production and assembly of a product, these activities are also routine in nature and have greater scope for automation and offshoring.
Many manufacturing firms, particularly within the information technology industry39, have adjusted the structure of their businesses by outsourcing production specific activities and focusing their efforts on the high value activities in the smile curve outlined above. This isn’t particularly surprising given it was the former CEO of Acer Inc., Stan Shih, who first developed the curve, and used its insights to re-allocate resources into research and development and marketing and outsourcing the actual production of their products.40
The basic structure of the smile curve is straightforward (Figure 3.2). Along the horizontal axis, the various production activities are ordered according to the intuitive flow of production: from research and development; to production and assembly; and ending with marketing and after-market services. The vertical axis is the value added for each of the broad production cycle activities. Within a firm, it is possible to use the rich set of information available to calculate value at precise points along each stage of the production cycle. At the broader industry level, value is usually approximated using other available data. The smile curves presented within this chapter will use employee wage information from the 2016 Census and other national surveys as an approximate measure of value added. While wages alone do not capture return on capital, another component of value, employee wages are typically the largest component within value-added and are readily available for the type of analysis within this chapter.
37 ABS Australian National Accounts: Input-Output Tables, 2014-15, cat no. 5209.0.55.00138 Like the Phillips Curve, the Smile Curve is a stylised fact based on empirical observation39 Clark T D, Zmud R W, & Mccray G E (1995) The outsourcing of information services: transforming the
nature of business in the information industry. Journal of Information Technology, 10 (4), pp 221-23740 Shih S (2010) Millennium Transformation: Change Management for New Acer, Aspire Academy
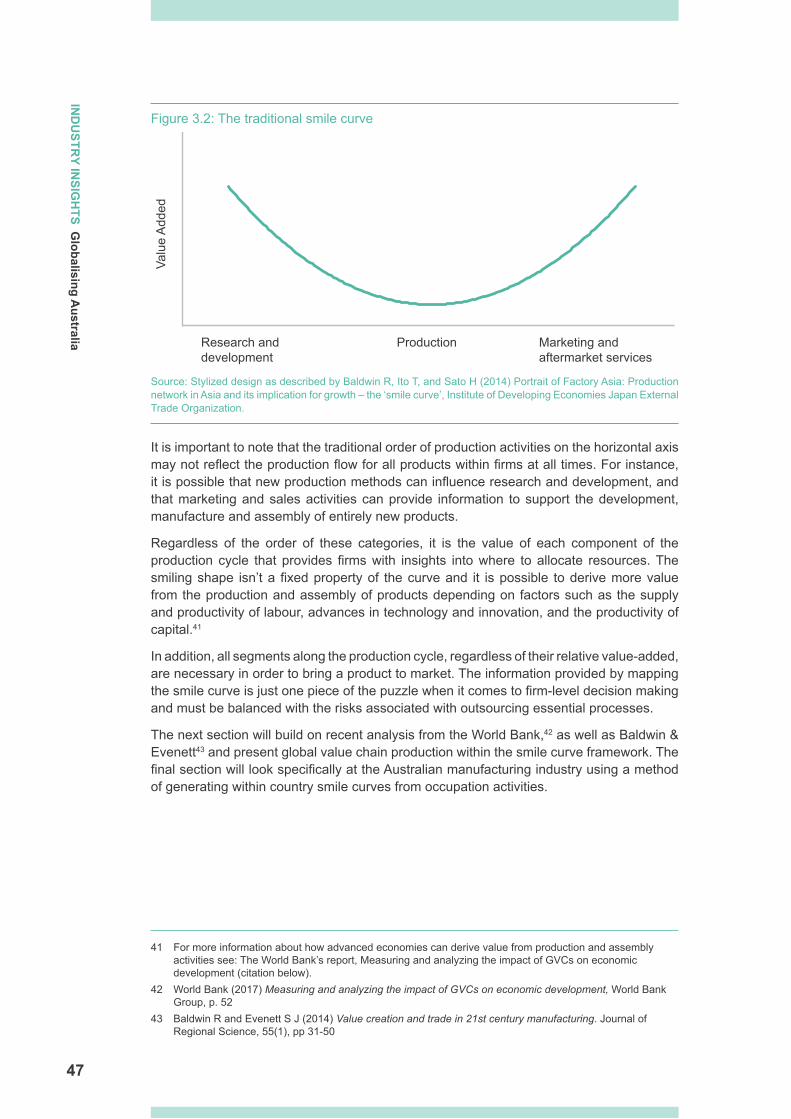
IND
USTR
Y INSIG
HTS G
lobalising Australia
47
CH
AP
TER
3M
anufacturing and the smile curve
Figure 3.2: The traditional smile curve
Source: Stylized design as described by Baldwin R, Ito T, and Sato H (2014) Portrait of Factory Asia: Production network in Asia and its implication for growth – the ‘smile curve’, Institute of Developing Economies Japan External Trade Organization.
It is important to note that the traditional order of production activities on the horizontal axis may not reflect the production flow for all products within firms at all times. For instance, it is possible that new production methods can influence research and development, and that marketing and sales activities can provide information to support the development, manufacture and assembly of entirely new products.
Regardless of the order of these categories, it is the value of each component of the production cycle that provides firms with insights into where to allocate resources. The smiling shape isn’t a fixed property of the curve and it is possible to derive more value from the production and assembly of products depending on factors such as the supply and productivity of labour, advances in technology and innovation, and the productivity of capital.41
In addition, all segments along the production cycle, regardless of their relative value-added, are necessary in order to bring a product to market. The information provided by mapping the smile curve is just one piece of the puzzle when it comes to firm-level decision making and must be balanced with the risks associated with outsourcing essential processes.
The next section will build on recent analysis from the World Bank,42 as well as Baldwin & Evenett43 and present global value chain production within the smile curve framework. The final section will look specifically at the Australian manufacturing industry using a method of generating within country smile curves from occupation activities.
41 For more information about how advanced economies can derive value from production and assembly activities see: The World Bank’s report, Measuring and analyzing the impact of GVCs on economic development (citation below).
42 World Bank (2017) Measuring and analyzing the impact of GVCs on economic development, World Bank Group, p. 52
43 Baldwin R and Evenett S J (2014) Value creation and trade in 21st century manufacturing. Journal of Regional Science, 55(1), pp 31-50
ProductionResearch and development
Marketing and aftermarket services
Valu
e A
dded
CH
AP
TER
3 Manufacturing and the sm
ile curve
48
Smiling globallyAustralia has relatively high labour costs, a modest local consumer market, and large distances to major global consumer markets. These factors typically make it difficult for Australian manufacturers to compete internationally. However, since the turn of this century, there has been a major shift in how products are manufactured and assembled, from locally-integrated single manufacturers toward specialised manufacturing and services linked through GVCs.44 This shift to GVCs has offered new opportunities to Australian manufacturers and exporters, yet Australia’s contribution to GVCs remains skewed toward basic materials and energy.
Australia’s contribution to GVCsAs a result of the shift in manufacturing processes, Australia’s forward participation in GVCs is increasing. Forward participation occurs when goods that have been imported undergo further processing in the receiving country before being exported again. A comprehensive analysis of Australia’s role in GVCs can be found in Chapter 2, however it is worth reiterating here the characteristics of the trading relationship between Australia and China.
The share of Australian value added exports to China that is being transformed and exported by China has tripled since the turn of the century (Figure 3.3) with only a small contraction during the Global Financial Crisis. An example includes iron ore, which is mined in Australia, sent to China where it can be transformed into steel for export, or transformed again into other export products such as household appliances.
Figure 3.3: Share of Australian forward participation in GVCs, by region, 2000 to 2011
Notes: Forward participation includes products which have been exported, transformed by the importing country, and subsequently exported again.
Source: OECD Trade in Value Added Database, Forward Participation in GVCs. Australian Government Department of Industry, Innovation and Science (2018).
The rise in GVCs and Australia’s increasing contribution to trade in primary and intermediate goods is a positive development. However, there is also potential for growth in Australia’s
44 World Bank (2017) Measuring and analyzing the impact of GVCs on economic development, World Bank Group, p. 52
0
5
10
15
20
25
30
35
2000 2001 2002 2003 2004 2005 2006 2007 2008 2009 2010 2011
Per
cen
t
World
China

CH
AP
TER
3M
anufacturing and the smile curve
IND
USTR
Y INSIG
HTS G
lobalising Australia
49
trade in activities at the edges of the smile curve, particularly the trade in professional, scientific and technical services.
As has been highlighted in Chapter 1, Australian exports are dominated by materials, energy and basic manufacturing products. Figure 3.4 below presents the top 11 Australian export product groups in 2014-15, ordered by the volume of exports. The top services export products making the list include education and training related services as well as the Professional, Scientific and Technical Services.
Figure 3.4: Exports and domestic supply by product group, 2014–15
Source: ABS Australian National Accounts: Input Output Tables, 2014–15 cat. no. 5209.0.55.001, Table 2
0 50 100 150 200 250
Professional, Scientific, Technical Services
Education Related Services
Road Transport
Sheep, Grains, Beef, Cattle
Wholesale Trade
Non Ferrous Metal Ore Mining
Meat product Manufacturing
Oil and Gas Extraction
Basic Non-Ferrous Metal Manfacturing
Coal Mining
Iron Ore Mining
$ Billion
Exports Domestic Supply

CH
AP
TER
3 Manufacturing and the sm
ile curve
50
The production of basic metals and meat manufacturing products in this list comprises of activities that have traditionally occurred in the centre of the smile curve. The Professional, Scientific and Technical Services sector, however, is a category that includes a broad range of services, including activities that are located at the both edges of the curve, these being scientific research services, engineering design as well as advertising services and market research.
A feature of Australia’s Professional, Scientific and Technical Services is the low share of exports out of overall supply.45 Currently, 3.6 per cent of the production of these products is exported, a much lower export exposure than the equivalent product types exported by the United States (seven per cent in 2015) and the United Kingdom (23 per cent in 2015).46 When compared to these peer economies with equivalent living standards, the low export rate of Australian Professional, Scientific and Technical Services demonstrates that if this rate increased to similar levels, this sector could be a source of future Australian export growth beyond raw materials.
Global trade is smilingWhile the firm level smile curve can show the value of distinct stages of a production chain, analysis of global value chains can map the distinct regions in which each stage of global production occurs. When plotted with a measure of value, such as wages, it is possible to generate a curve that resembles the traditional smile curve.
Inspired by the work of Ming, Bo and Shang-jin,47 Figure 3.5 plots the top five exporters of products within each smile curve category: research and development; basic manufacturing; and marketing and advertising.
By using wages as a proxy for value an assumption is made that the share of the value of wages of total value added — including return on capital — is consistent across the broad activity categories and across regions. In addition, national average wages may not be equally distributed across activity types, or similarly distributed across regions. Nevertheless, when plotted this way with wages as a measure of value, the locations of the largest exporters of these products align with the broad understanding of global economic activity. In addition, the effect of return on capital on comparative advantage may explain how high cost regions have remained globally competitive.
45 Wholesale Trade also has low exports to local supply, however this ratio is in line with peer economies.46 Australian Government Department of Industry, Innovation and Science (2018), analysis of Input-Output
Tables produced by: Australian Bureau of Statistics National Accounts (2017) Input Output Tables, 2014-15, cat. no. 5209.0.55.001, Table 2; Bureau of Economic Analysis (2017) Use of commodities by industry valued at producers’ prices 1997-2016, 71 Industries, The United States Department of Commerce; and The United Kingdom Office for National Statistics (2017) Input-output supply and use tables, Table 2, ONS.gov.uk. For each country, categories relating to Professional, scientific and technical services’ were used, these being: “Miscellaneous professional, scientific, and technical services” for the USA; combined “Scientific research and development services”, “Advertising and market research services”, “Other professional, scientific and technical services”; and “Professional, Scientific and Technical Services” for Australia.
47 Ming Y, Bo M, and Shang-jin W (2015) Measuring smile curves in global value chains, IDE Discussion Paper, Institute of Developing Economies.

CH
AP
TER
3M
anufacturing and the smile curve
IND
USTR
Y INSIG
HTS G
lobalising Australia
51
Figure 3.5: World share of exports by product type and price of labour by country, 2014
Notes: Size of each bubble represents share of world exports within each product group using World Input Output Tables. Wages information is the mean annual full time equivalent wage in 2016 US dollars (PPP) from the OECD in all cases except China, where the median annual wage for all employees was used from the ILO. The product groups on the horizontal axis were categorised using World Input Output Tables as follows: The Research and Development includes ‘Scientific research and development’ and the ‘other professional, scientific and technical activities’; Basic manufacturing includes the manufacturing categories, ‘basic metals’, ‘chemicals and chemicals products’, ‘fabricated metal products’, ‘furniture and other’, ‘other non-metallic mineral products’, ‘paper and paper products’, ‘rubber and plastic products’, ‘textiles, wearing apparel and leather products’, ‘wood, cork, straw and plaiting’; Marketing and advertising includes ‘advertising and market research’.
Ordering of regions within each broad product export category has been organised aesthetically, the mean weighted positions of each category on the vertical axis are consistent with the theoretical position of activity along the smile curve.
Source: Timmer M. P et al (2015) An illustrated user guide to the world input-output database: the case of global automotive production, Review of International Economics, 23: pp. 575-605. OECD, 2018. Labour Earnings, Average Annual Wages. Stat.OECD.org. International Labour Organisation, 2018. Key indicators of the labour market, mean nominal monthly earnings of employees. Ilo.org/ilostat/
Research and Development
Basic Manufacturing
Marketing and Advertising
USA
GBR
KOR
DEU
JPN
CHN
DEU
USA
JPN
ITA
USA
DEU
BELFRA
GBR
10,000
20,000
30,000
40,000
50,000
60,000
Aver
age
Annu
al W
ages

CH
AP
TER
3 Manufacturing and the sm
ile curve
52
From this graph some compelling insights can be derived. First, the major exporters of products at the edges of the curve are located in high wage economies. In these sectors, wages are used as an approximate measure of value. These products often require labour with higher level skills and education, and firms within countries with relatively deep human and physical capital have a comparative advantage in high value added sectors. Australia’s relatively low share of exports of professional and scientific services products is notable in this regard.
Second, the combined global share of exports of basic manufacturing products from the United States and Germany are similar to that of China (15.6 per cent and 16.8 per cent respectively). This demonstrates that it is possible for high labour cost economies to remain globally competitive provided that there is sufficient investment in sophisticated capital, new production technology and the availability of relevant skillsets to utilise these.
Smiling locallyUp to now, this chapter has presented the smile curve framework and applied it at a global scale by mapping export trade activity across separate sectors. This section will present a new approach to visualising smile curves within the Australian manufacturing industry, using industry and occupation information to plot the value of activities along the smile curve.
As demonstrated by Sebastien Miroudot from the OECD, occupations within the manufacturing industry can be grouped together to broadly align with the main activity categories of the traditional smile curve. When value added (in terms of employee wages), and employment growth is plotted along these same set of occupations, and the occupations within each activity type are ordered by average income, a distinct smile shape emerges (Figure 3.6).
This curve demonstrates that, within the manufacturing industry, there has been greater value added from activities that align with research and development as well as marketing and advertising, compared to the activities directly related to the production and assembly of goods.

IND
USTR
Y INSIG
HTS G
lobalising Australia
53
CH
AP
TER
3 M
anufacturing and the smile curve
Figure 3.6: The smile curve of Australia’s manufacturing industry, 2006 – 2016
Notes: The three segments of the line are comprised of occupations (ordered from left to right) that align with R&D (1. Business and Systems Analysts, and Programmers; 2. Engineering Professionals; 3. Natural and Physical Science Professionals), Basic Manufacturing (4. Miscellaneous Factory Process Workers; 5. Packers and Product Assemblers; 6. Factory Process Workers not further defined; 7. Food Process Workers), and Marketing and Advertising (8. Sales, Marketing and 9. Public Relations; Information and Organisation Professionals). The values occupations within each category are plotted, and ordered by each occupation’s average weekly earnings (FTE, $ 2016) as per the left vertical axis. The shaded bars represent employment growth (right vertical axis) for each of these same occupations between 2006 and 2016. The relative strength of food process workers employment may be reflecting the recent growth in output, exports and productivity across the broader food and agribusiness industry.
Source: ABS Census of Population and Housing 2006 and 2016
Similarly, there has also been greater demand for labour at the edges of the curve. During a period of overall declines in employment within the manufacturing industry, Figure 3.6 demonstrates that the occupations relating to research and development and marketing, experienced more modest declines and in some cases gained employment by over 10 per cent over the period. This implies that the manufacturing industry is improving its overall capacity to undertake these higher value activities, and is in a better position to capitalise on the export potential of these products.
–50
–40
–30
–20
–10
0
10
20
30
0
200
400
600
800
1,000
1,200
1,400
1,600
1,800
2,000
Med
ian
Earn
ings
($ 2
016)
Employment change Median weekly earnings
Per cent employm
ent change Research and Development
Basic Manufacturing
Marketing and Advertising

CH
AP
TER
3 Manufacturing and the sm
ile curve
54
Box 3.1: Profiles of Australian Manufacturers
Australian firms are responding to industry transition by engaging in high value research and development activities, and participating in new global market opportunities:
Astor Industries is a manufacturer of premier plastic injection moulded, electroplated, decorated and assembled components. They are an industry leader in automotive decorative badges – supplying to Holden, Mitsubishi, Ford and Toyota as an Original Equipment Manufacturer (OEM)48 both locally and abroad. The end of car making in Australia could have closed the car badge manufacturer, but the company is thriving by branching into new markets. In addition, Astor now makes glasses frames for eyewear retailer Dresden Optics.
Scott Automation & Robotics specialises in the design and manufacture of automated production, robotics and process machinery. They are leading experts in automation and robotic solutions globally – solutions that improve productivity, reliability, yield, and safety for manufacturers and processors in industries. The world class builders of advanced automation systems are used particularly for the appliance, meat processing, mining and superconductor industries.
Source: Department of Industry Innovation and Science, Communications Branch
48 An Original Equipment Manufacturer (OEM) is a supplier of parts and equipment that are installed in the production of new vehicles.
As the global standard of living continues to rise, the growth in demand for services is expected to outpace the growth in demand for goods. This chapter has discussed the forces that are driving change within Australia’s manufacturing industry and demonstrated that in response to these forces there has been a relative shift in the types of activities being performed, from physical production and assembly to professional and scientific services and marketing.
The rise of global value chains and the corresponding increase in world trade of intermediate goods and services is a relatively new phenomena. Worldwide, the major exporters of products at the edges of the smile curve are located in advanced economies with high standards of living, sophisticated capital equipment and skilled human capital. Regions with these characteristics have a comparative advantage in high value added sectors, and Australia is in a unique position to take advantage of these opportunities
Many Australian manufacturers have already shifted investment toward research and development as well as marketing and in doing so are opening up new domestic and international business opportunities. Australia’s relatively low share of exports of professional and scientific services products is a source of potential growth and continued investment in these activities will help Australia achieve its export potential.

55
Transitioning industriesNicholas Davis, Head of Society and Innovation, Member of the Executive Committee, World Economic ForumThe complex choreography between companies, technologies, social norms and economic conditions makes it impossible to predict the future, and difficult to make sense of the present.
Nevertheless, the rhythm and rhymes of history suggest that we are at a period where the way in which value is created, exchanged and distributed is changing around the world. At the World Economic Forum, we refer to this as “The Fourth Industrial Revolution”. One driver of this revolution is the availability of a set of powerful technologies that are converging and reinforcing one another – building on the digital infrastructure developed and constructed over the past 50 years, which most of us take for granted today.
The framework of the Fourth Industrial Revolution highlights the need for Australia to be firmly integrated into global value chains and knowledge networks, to benefit from the flows of value and accumulation of capabilities that they represent, and also in order to help lead a transition occurring on a scale far larger than Australia’s own economic transformations.
Industry, government and social leaders interested in ensuring that Australian citizens can prosper through a time of technological and economic transition therefore face two important challenges.
First, are Australian businesses and institutions prepared to grasp the opportunities offered by increasingly powerful emerging technologies, starting with the adoption and use of broad digital capabilities that can lead to machine learning, advanced robotics and use of new computing models?
This question is frequently asked from many different directions, but even more attention is needed. As EY’s Digital Australia report and the World Economic Forum’s data show, Australia’s digital readiness is slipping in relation to other countries, and the 2016 Australian Industry Report cited data that Australian companies are lagging in the sophisticated use of digital technologies.
FEATU
RE
AR
TICLE
Transitioning industries

One important perspective on Australia’s readiness in transition is the role that networks and levels of complexity play in a country’s ability to produce higher value-added goods within global value chains. Hidalgo and Hausmann’s theory of economic complexity argues that products are a result of combinations of knowledge, natural resources and financial capital, influenced by both relational and organisational factors that capture cultural aspects, network effects and the policy landscape.49 By focusing on the complementarity of value-adding activities, rather than the existence of individual factors of production, economic complexity offers opportunities to investigate the dynamic process by which new capabilities result in new products, and vice-versa.
As should be expected from an economy in transition, Australia has risen in recent years in both measures and rankings of economic complexity. Unfortunately, this comes after 34 years of declining levels of complexity: in 1980, Australia was ranked as the 51st most-complex economy in the world; in 2014, it ranked 89th. Since then, it has risen to 72nd in 2016, far below its ranking on other measures of economic output.50
Figure 3.7: Australia’s ranking of economic complexity, 1980–2016
Source: Observatory for Economic Complexity, http://atlas.media.mit.edu/en/visualize/line/sitc/eci/show/aus/all/1980.2016/
Measuring complexity within countries is more challenging, but recent sub-regional analysis of economic complexity by Reynolds et al are more encouraging than the national picture, and reveal interstate trends useful for policy-making.51
49 Hidalgo C and Hausmann R (2009) ‘The Building Blocks of Economic Complexity’ in Proceedings of the National Academy of Sciences of the United States of America, 106, pp. 10570-5. 10.1073/pnas.0900943106. http://www.pnas.org/content/106/26/10570.abstract
50 Simoes AJG and Hidalgo CA (2011) The Economic Complexity Observatory: An Analytical Tool for Understanding the Dynamics of Economic Development. Workshops at the Twenty-Fifth AAAI Conference on Artificial Intelligence. http://atlas.media.mit.edu/en/profile/country/aus/, accessed October 2017
51 Reynolds C et al (2017) A sub-national economic complexity analysis of Australia’s states and territories, Regional Studies, pp. 1-12
0
10
20
30
40
50
60
70
80
90
100
Com
plex
ity R
ank
Australia Canada China
Japan United Kingdom United States
FEATU
RE A
RTIC
LE Transitioning industries
56

57
Yet a plethora of data show that Australian organisations need to work far harder to overcome sectoral boundaries, geographic distance and barriers between disciplines to work together more often and more effectively. Australia’s Industry Monitor 2016 reports that the level of collaboration among Australian firms – a key driver of knowledge accumulation and a strong indicator of profitability growth – is well below the OECD average. The percentage of Australian firms collaborating with universities and other non-commercial research organisations is among the lowest in the OECD.52
The second challenge is perhaps even more important: choosing what purpose, whose values and which principles will set the goals and guiderails for the transition to a new economy.
The key insight here is that technologies are neither mere tools, nor inevitable masters – two views which dominate the current, polarised discourse about the potential impact of technologies such as artificial intelligence, neuro technologies or distributed ledgers.
Every day, managers, investors, educators, developers and individual users make choices around the design, diffusion and use of technologies that shape how they affect us. And these choices matter – because our very natural human desires and biases become part of the technologies and systems that surround us. As Langdon Winner argued in 1980, technological artefacts have politics53 – and this is perhaps even more true of an algorithm returning search results or a personalised gene therapy than Winner’s examples of a weapon of mass destruction, automated agricultural machinery or a road to a beach designed to exclude people of colour.
Living at a time of transition in how we create value is a huge opportunity for Australia’s entrepreneurs, business leaders, social influencers, policy-makers and citizens. Both the emerging technologies themselves and the human values being embedded in them are in flux. All around the world, regulations around self-driving vehicles are literally being written for the first time. Corporate data policies are being frantically updated as consumers call for awareness and control over the information they exchange with firms, and the entry into force of the European Union’s General Data Protection Regulation (GDPR) fast approaches.
Productively engaging in these processes will require more than better consultation approaches, incentives for partnerships or more investment in lobbying – it will require CEOs and government leaders to reflect deeply on the values, purpose and principles that influence their choices of technology, the design of new systems and the resulting impact on Australian organisations and individuals.
As Simon Longstaff puts it, “We are responsible for the things we make” – and this includes our future economy as well as the technological and production systems that influence it.54
Grasping the industrial opportunities of an economy in transition therefore means shifting from trying to predict the future to taking every opportunity to shape it, capitalising on the very complex dynamics that make it so challenging to comprehend. And perhaps most importantly, we must ensure that we understand the role, and rising importance, of human values within global value chains.
52 Office of the Chief Economist (2016), Industry Monitor 2016, Canberra, ACT, Australia53 Winner L (1980) Do Artifacts Have Politics?, Daedalus, Vol. 109, No. 1, Modern Technology: Problem or
Opportunity? (Winter,1980), pp. 121-13654 Longstaff S (2017), Everyday Ethics, Simon and Schuster
FEATU
RE
AR
TICLE
Transitioning industries
FEATU
RE A
RTIC
LE Transitioning industries

FEATU
RE A
RTIC
LE Transitioning industries
58Aerial panorama of small coastal town in Australia

Connect with us:
www.industry.gov.au/OCE
@economist_chief
https://au.linkedin.com/in/cullymark