industry greenhouse gas and wage sustainability
TRANSCRIPT

INDUSTRY GREENHOUSE GAS AND WAGE SUSTAINABILITY
Baseline Analysis of Los Angeles County Industries
Prepared for: California Energy Commission
Prepared by: Economic Roundtable
Publ ic Interest Energy Research (P IER) Program
FINAL PROJECT REPORT
2015
CEC ‐500 ‐10 ‐033

Prepared by: Economic Roundtable Primary Author(s): Daniel Flaming Patrick Burns Stephanie Pincetl Ŧ Economic Roundtable 315 W. Ninth St., Suite 502 Los Angeles, CA 90015 Phone: 213-892-8104 | Fax: 213-291-9245 http://www.economicrt.org Contract Number: 500‐10‐033 Prepared for: California Energy Commission Edgar Ventura Contract Manager Aleecia Gutierrez Office Manager Energy Generation Research Office Laurie ten Hope Deputy Director ENERGY RESEARCH AND DEVELOPMENT DIVISION Robert P. Oglesby Executive Director
DISCLAIMER
This report was prepared as the result of work sponsored by the California Energy Commission. It does not necessarily represent the views of the Energy Commission, its employees or the State of California. The Energy Commission, the State of California, its employees, contractors and subcontractors make no warrant, express or implied, and assume no legal liability for the information in this report; nor does any party represent that the uses of this information will not infringe upon privately owned rights. This report has not been approved or disapproved by the California Energy Commission nor has the California Energy Commission passed upon the accuracy or adequacy of the information in this report.

i
ACKNOWLEDGEMENTS
We would like to express our gratitude to the multidisciplinary team that has collaborated in
formulating a methodology to develop energy baselines for California regions.
Stephanie Pincetl was the principal investigator who was awarded funding by the California
Energy Commission to assemble an expert team and synthesize findings from their work.
Zoe Elizabeth together with Kristen Holdsworth managed this project on behalf of the
California Center for Sustainable Communities Research at UCLA.
Mikhail Chester with the School of Sustainability at Arizona State University provided the
United States and California EIO‐LCA models and suggestions for using the models.
Mike McCoy, formerly Director of the Urban Land Use and Transportation Center of the
Institute of Transportation Studies at University of California, Davis and now Chair of
California’s Strategic Growth Council, provided expert advice about developing models of
urban systems.
Giovanni Circella, formerly with the Institute of Transportation Studies at University of
California, Davis and now with the Georgia Institute of Technology, shared data.
Andrea Gough, manager of the California Energy Commission’s Demand Analysis Office,
provided crucial data breaking out electricity consumption by each industry in Los Angeles
County over the past 22 years.
Keith O’Brien in the California Energy Commission’s Demand Analysis Office provided data on
natural gas consumption by each industry in Los Angeles County over the past five years.
Juan Matute with UCLA’s Lewis Center and the Institute of Transportation Studies provided
valuable suggestions about the geographic scale for aggregating data and use of the California
Emissions Estimator Model in calculating greenhouse gas emissions from customer trips.
Shungbin Cho from the Southern California Association of Governments provided trip
generation factors from the Institute of Transportation Engineers.
We are particularly grateful to Eric Masanet, Scott Matthews and Derrick Carlson, who
developed the California multi‐regional input‐output life‐cycle assessment model which was
crucial for estimating direct energy consumption and greenhouse gas emissions by industry.
We are similarly grateful for the path breaking work by the Green Design Institute at Carnegie
Mellon University in developing the U.S. Economic Input‐Output Life Cycle Assessment model,
which we used to estimate life cycle energy consumption and greenhouse gas emissions factors.
Yvonne Yen Liu, our colleague at the Economic Roundtable, improved our work through her
careful review and insightful suggestions.
Finally, we would like to express our deep appreciation to the California Energy Commission
for recognizing the importance of this research and for underwriting our work.

ii
PREFACE
The California Energy Commission Energy Research and Development Division supports
public interest energy research and development that will help improve the quality of life in
California by bringing environmentally safe, affordable, and reliable energy services and
products to the marketplace.
The Energy Research and Development Division conducts public interest research,
development, and demonstration (RD&D) projects to benefit California.
The Energy Research and Development Division strives to conduct the most promising public
interest energy research by partnering with RD&D entities, including individuals, businesses,
utilities, and public or private research institutions.
Energy Research and Development Division funding efforts are focused on the following
RD&D program areas:
Buildings End‐Use Energy Efficiency
Energy Innovations Small Grants
Energy‐Related Environmental Research
Energy Systems Integration
Environmentally Preferred Advanced Generation
Industrial/Agricultural/Water End‐Use Energy Efficiency
Renewable Energy Technologies
Transportation
Industry Greenhouse Gas and Wage Sustainability is one of the final reports for the PIER Regional
Energy Baselines Methodolgies project (contract number 500‐10‐033,) conducted by the
Regents of the University of California, Los Angeles. The information from this project
contributes to Energy Research and Development Division’s Transportation Program.
For more information about the Energy Research and Development Division, please visit the
Energy Commission’s website at www.energy.ca.gov/research/ or contact the Energy
Commission at 916‐327‐1551.
iii
ABSTRACT
A baseline profile of Los Angeles County industries is developed using three dimensions of
sustainability: greenhouse gas emissions, social sustainability based on wages for workers, and
economic viability based on size and growth, with primary emphasis on the first two factors.
The metric for assessing greenhouse impacts in different industries and geographic areas is the
ratio of jobs to emissions indexed three ways: direct emission from establishment activities,
direct emissions from gasoline consumed by customers driving to establishments in private
light duty vehicles, and the full life cycle emissions from the supplier chain linked to each
establishment as well as from on‐site work at each establishment.
Direct establishment emissions are estimated using the California multi‐regional input‐output
(MRIO) life‐cycle assessment (LCA) model. Life cycle emissions are estimated using the U.S.
Economic Input‐Output Life Cycle Assessment (EIO‐LCA) model. Correction factors for
calibrating the models to Los Angeles County are derived from county‐level California Energy
Commission data breaking out energy consumption by industry as well as from annual changes
in the ratio of industry energy consumption to the amount of value added by industries.
Overall consumption of electricity and natural gas by industries in the county has remained
roughly constant since 2008, with slight progress in increasing the amount of value added to the
economy per terajoule of energy consumed. The steep downward trajectory in energy
consumption required to meet state and national goals for reducing greenhouse gas emissions is
not yet evident.
Progress toward sustainability requires an industry trajectory that adds 1) higher levels of value
to the economy for each terajoule that is consumed, 2) cleaner sources of power that release less
greenhouse gas per terajoule consumed, and 3) higher wages so that all workers are paid
enough to support a minimum standard of living.
Keywords: California multi‐regional input‐output life‐cycle assessment (MRIO‐LCA) model,
U.S. Economic Input‐Output Life Cycle Assessment (EIO‐LCA) model, electricity consumption
by industry, natural gas consumption by industry, direct greenhouse gas emissions, life cycle
greenhouse gas emissions, emissions per job, environmental sustainability, social sustainability,
social indicators, economic sustainability, sustainable wages, environmental and economic
sustainability trade‐offs, industry sustainability rankings, industry baseline profile, Los Angeles
County, Los Angeles City, Southern California Association of Governments (SCAG) sub‐regions
Please use the following citation for this report:
Flaming, Daniel; Patrick Burns; Stephanie Pincetl. (Economic Roundtable). 2014. Industry
Greenhouse Gas and Wage Sustainability. California Energy Commission. Publication
number: CEC‐XXX‐2014‐XXX.

iv
TABLE OF CONTENTS
PREFACE ................................................................................................................................................... ii
ABSTRACT .............................................................................................................................................. iii
TABLE OF CONTENTS ......................................................................................................................... iv
LIST OF FIGURES ................................................................................................................................ viii
LIST OF TABLES ...................................................................................................................................... x
EXECUTIVE SUMMARY ........................................................................................................................ 1
Introduction ........................................................................................................................................ 1
Project Purpose ................................................................................................................................... 1
Project Results ..................................................................................................................................... 2
Project Benefits ................................................................................................................................... 4
CHAPTER 1: Sustainability Baseline for Wage and Greenhouse Gas Outcomes from Los
Angeles County Industries...................................................................................................................... 6
1.1 Electricity and Natural Gas Consumption ............................................................................. 6
1.1.1 Electricity Consumption by Industry Sector .................................................................. 7
1.1.2 Natural Gas Consumption by Industry Sector .............................................................. 9
1.1.3 Electricity and Natural Gas ............................................................................................. 10
1.2 Economic and Wage Sustainability of Los Angeles County Industries ........................... 16
1.2.1 Wage Sustainability ......................................................................................................... 17
1.2.2 Economic Sustainability .................................................................................................. 18
1.3 Summary of Baseline Conditions in Los Angeles County ................................................. 20
1.3.1 Index of Economic Performance .................................................................................... 20
1.3.2 Policy Implications ........................................................................................................... 21
CHAPTER 2: Greenhouse Gas and Economic Outcomes from Industries in Sub‐regions of
Los Angeles County ................................................................................................................................ 22
2.1 Introduction .............................................................................................................................. 23
2.2 Direct Energy Consumption and GHG Emissions per Job ................................................ 26
2.2.1 Energy Consumption ....................................................................................................... 26
2.2.2 Greenhouse Gas Emissions ............................................................................................. 27
v
2.3 Direct Emissions per Job from Gasoline Consumed for Customer Trips ........................ 27
2.4 Life Cycle Emissions per Job .................................................................................................. 30
2.4.1 Ratio of Life Cycle to Direct Emissions ......................................................................... 32
2.5 Average Direct Emissions per Job in Each Region .............................................................. 32
CHAPTER 3: Environmental and Economic Sustainability Trade‐offs ....................................... 34
3.2 Overall Geographic Ranking .................................................................................................. 35
3.2.1 Geographic Aggregation ................................................................................................. 35
3.2.2 Overall Ranking of Geographic Areas in Los Angeles County ................................. 36
3.2.3 County of Los Angeles Industry Rankings .................................................................. 37
3.2.4 City of Los Angeles Industry Rankings ........................................................................ 42
3.2.5 San Fernando Valley Industry Rankings ...................................................................... 44
3.2.6 North Los Angeles County Industry Rankings ........................................................... 46
3.2.7 Los Angeles Metro Industry Rankings ......................................................................... 49
3.2.8 Arroyo Verdugo Industry Rankings ............................................................................. 51
3.2.9 San Gabriel Valley Industry Rankings .......................................................................... 53
3.2.10 Westside Cities Industry Rankings ................................................................................ 56
3.2.11 South Bay Cities Industry Rankings .............................................................................. 58
3.2.12 Gateway Cities Industry Rankings ................................................................................ 60
3.2.13 Las Virgenes Industry Rankings .................................................................................... 63
3.3 Sustainability Summary for Los Angeles Industries ........................................................... 65
3.3.1 Policy Implications ........................................................................................................... 66
GLOSSARY .............................................................................................................................................. 68
REFERENCES .......................................................................................................................................... 71
APPENDIX A: Methodology for Assessing Industry Sustainability based on both
Environmental and Economic Impacts ................................................................................................. 1
A.1 Overview ..................................................................................................................................... 1
A.2 Geographic Aggregation ........................................................................................................... 2
A.3 Direct Energy Consumption and Greenhouse Gas Emissions by Industrial,
Commercial and Governmental Establishments (Scope 1) .............................................................. 2

vi
A.4 Life Cycle Energy Consumption and Greenhouse Gas Emissions by Industrial,
Commercial and Governmental Establishments (Scope 1, 2, 3) ...................................................... 6
A.5 Greenhouse Gas Emissions from Customer Trips to Commercial and Governmental
Establishments (Scope 1) ....................................................................................................................... 9
A.6 Discussion of MRIO‐LCA and EIO‐LCA .............................................................................. 11
APPENDIX B: Spatial Co‐Occurrence of Indicators of Social Well Being and Commercial
Energy Consumption and Greenhouse Gas Emissions ..................................................................... 1
B.1 Overview ..................................................................................................................................... 1
B.2 Description of Social Indicator Data ........................................................................................ 1
B.2.1 Data Sources ........................................................................................................................ 2
B.3 Spatial Co‐Occurrence of Environmental Indicators and Social Indicators ...................... 7
B.3.1 Purpose ................................................................................................................................ 7
B.3.2 Findings about Co‐Occurrence of Environmental and Social Indicators ................... 7
B.3.3 Implications of Not Finding Spatial Correlation in the Occurrence of
Environmental and Social Indicators ............................................................................................ 19
APPENDIX C: Energy Consumption, Greenhouse Gas Emissions and Wages, by Geographic
Region ......................................................................................................................................................... 1
C.1 Direct Energy Consumption, GHG Emissions and Wages per Job .................................... 1
C.1.2 Annual Wages per Job by SCAG Subregions ................................................................... 16
C.1.3 Average gallons of gasoline and metric tons of GHG per job for public trips, Los
Angeles County .................................................................................................................................... 20
C.1.4 Life Cycle Terajoules and Metric Tons GHG per Job, LA County ................................ 25
C.2.1 Economic and Environmental Ranking Data, LA County ............................................. 36
C.2.2 Economic and Environmental Ranking Data, City of LA .............................................. 48
C.2.3 Economic and Environmental Ranking Data, San Fernando Valley ............................ 60
C.2.4 Economic and Environmental Ranking Data, North L.A. County ............................... 65
C.2.5 Economic and Environmental Ranking Data, L.A. City Metro ..................................... 70
C.2.6 Economic and Environmental Ranking Data, Arroyo Verdugo ................................... 75
C.2.7 Economic and Environmental Ranking Data, San Gabriel Valley COG ...................... 80
C.2.8 Economic and Environmental Ranking Data, Westside Cities ...................................... 85

vii
C.2.9 Economic and Environmental Ranking Data, South Bay Cities COG .......................... 90
C.2.10 Economic and Environmental Ranking Data, Gateway Cities COG ............................ 95
C.2.11 Economic and Environmental Ranking Data, Las Virgenes Malibu COG ................ 100

viii
LIST OF FIGURES
Figure 1: Distribution of Electricity Consumption among Los Angeles County Industries in
2012 ........................................................................................................................................................... 6
Figure 2: Annual Terajoules of Electricity Consumed by Industries in Los Angeles County..... 7
Figure 3: Annual Terajoules of Natural Gas Consumed by Industries in Los Angeles County . 8
Figure 4: Distribution of Natural Gas Consumption among Industries in 2012; Excluding
Electric Power Generation and Petroleum Extraction and Refining .............................................. 9
Figure 5: Annual Terajoules of Electricity and Natural Gas Consumed by Industries .............. 10
Figure 6: Value Created in All Industry Sectors per Terajoule of Electricity and Natural Gas 11
Figure 7: Amount of Value Added per Terajoule of Electricity and Natural Gas Consumed by
Industry Sectors in 2011 ...................................................................................................................... 12
Figure 8: Tons of CO2e Emitted from Direct Industry Consumption of Electricity and Natural
Gas Consumed in 2012 ........................................................................................................................ 13
Figure 9: State and Federal Targets for Reducing Greenhouse Gas Emissions by 2050 ............ 15
Figure 10: Annual Average Wages in in Los Angeles County Industries 2011 .......................... 16
Figure 11: Distribution of Los Angeles County Labor Force based on Hourly Wages .............. 17
Figure 12: Median Earned Income 1979 to 2011 .............................................................................. 18
Figure 13: Los Angeles County Industry Employment Size 2011 ................................................. 19
Figure 14: Change in Los Angeles County Industry Employment 1996 to 2011 ......................... 20
Figure 15: Los Angeles County Industries Ranked by Economic and Social Sustainability ..... 21
Figure 16: Direct Terajoules of Energy Consumed per Job, Los Angeles County 2011 ............. 25
Figure 17: Metric Tons of Greenhouse Gases Directly Emitted per Job, Los Angeles County
2011 ......................................................................................................................................................... 26
Figure 18: Percent of Direct GHG emissions from Customer Trips vs. Establishment Activities
in 2011 .................................................................................................................................................... 29
Figure 19: Life Cycle Metric Tons of GHG emissions per Job in Los Angeles County, 2011 .... 30
Figure 20: Terajoules of Energy Directly Consumed per Job in 2011 for Sub‐regions of Los
Angeles County .................................................................................................................................... 31
Figure 22: Nine SCAG Sub‐regions in Los Angeles County .......................................................... 35
Figure A.1: Estimating Direct Establishment Emissions .................................................................. 3

ix
Figure A.2: Estimating Life Cycle Establishment Emissions ........................................................... 6
Figure A.3: Estimating Emissions Generated by Customer Trips to Establishments ................ 10
Figure B.1: Census Tracts in Los Angeles County, 2010 ................................................................... 2
Figure B.3: Percent of Households that are Rent Burdened by Census Tract ‐ 2010 .................... 8
Figure B.2: Percent of Families in Poverty by Census Tract ‐ 2010 ................................................. 8
Figure B.4: Terajoules of Energy Directly Consumed by Establishments in Census Tract ......... 9

x
LIST OF TABLES
Table 1.1: California Greenhouse Gas Emission Trajectory ........................................................... 15
Table 2.1: Metric Tons of Direct GHG per Job in 2011 from Establishment Activities and
Customer Gasoline ............................................................................................................................... 28
Table 3.2: Overall Ranking of Geographic Areas ............................................................................ 37
Table 3.3: County of Los Angeles Industry Rankings ..................................................................... 38
Table 3.4: City of Los Angeles Industry Rankings .......................................................................... 42
Table 3.5: San Fernando Valley Industry Rankings ........................................................................ 45
Table 3.6: North Los Angeles County Industry Rankings ............................................................. 47
Table 3.7: Los Angeles Metro Industry Rankings ............................................................................ 50
Table 3.8: Arroyo Verdugo Industry Rankings ................................................................................ 52
Table 3.9: San Gabriel Valley Industry Rankings ............................................................................ 54
Table 3.10: Westside Cities Industry Rankings ................................................................................ 57
Table 3.11: South Bay Cities Industry Rankings .............................................................................. 59
Table 3.12: Gateway Cities Industry Rankings ................................................................................ 61
Table 3.13: Las Virgenes Industry Rankings .................................................................................... 64
Table 3.14: Summary of Los Angeles County Industry Rankings ................................................ 65
Table A.1: Computations for Life Cycle Energy Consumption and Greenhouse Gas Emissions
................................................................................................................................................................... 8
Table C.1.1: Direct Energy Consumption, Greenhouse Gas Emissions and Wages, for Los
Angeles County and City ...................................................................................................................... 1
Table C.1.2: Annual Wages per Job by SCAG Subregions ............................................................. 16
Table C.1.3: Average Gallons of Gasoline and Metric Tons of GHG per Job for Public Trips .. 20
Table C.1.4: Life Cycle Terajoules and Metric Tons of GHG per Job, Los Angeles County ...... 25
Table C.2.1: Economic and Environmental Ranking Data, LA County ........................................ 36
Table C.2.2: Economic and Environmental Ranking Data, City of LA ......................................... 48
Table C.2.3: Economic and Environmental Ranking Data, San Fernando Valley ....................... 60
Table C.2.4: Economic and Environmental Ranking Data, North L.A. County .......................... 65
Table C.2.5: Economic and Environmental Ranking Data, L.A. City Metro ................................ 70

xi
Table C.2.6: Economic and Environmental Ranking Data, Arroyo Verdugo .............................. 75
Table C.2.7: Economic and Environmental Ranking Data, San Gabriel Valley COG ................. 80
Table C.2.8: Economic and Environmental Ranking Data, Westside Cities ................................ 85
Table C.2.9: Economic and Environmental Ranking Data, South Bay Cities COG .................... 90
Table C.2.10: Economic and Environmental Ranking Data, Gateway Cities COG .................... 95
Table C.2.11: Economic and Environmental Ranking Data, Las Virgenes Malibu COG ......... 100

xii

1
EXECUTIVE SUMMARY
Introduction
Los Angeles is a world metropolis situated in a fragile air shed that provides homes and jobs for
a transnational labor force. The region’s future will emerge out of an economy deeply
intertwined with both environmental and socio‐economic realities. Achieving sustainability
requires an industry structure that provides enough jobs for the labor force, pays sustaining
wages to workers, and sharply reduces the ratio of greenhouse gas emissions to jobs.
This report provides an integrated framework for assessing both the environmental and social
sustainability of industries. Socio‐ecological interrelations are assessed based on greenhouse gas
emissions per job, socio‐economic interrelations are assessed based on wages per job and also the
economic robustness of industries. Scaling these effects to a single job provides a policy tool for
analyzing how each industry affects: 1) the environmental balance sheet for employing the
region’s labor force while remaining under the greenhouse gas emission ceilings set forth in
federal, state and local goals, 2) the social balance sheet for providing the region’s labor force
with wages that support a basic standard of living.
Energy enables workers to add value to the economy. Consumption of energy by industry and
concomitant greenhouse gas emissions are essential prerequisites for the jobs of most workers
in Los Angeles County’s labor force. This analysis documents the relationship between
environmental impacts and job opportunities in Los Angeles in the context of energy use,
greenhouse gas emissions and climate change, and future urban sustainability.
Project Purpose
The purpose for this project is to identify industry development and job growth options that
will make the region more environmentally and socially sustainable. This baseline profile of Los
Angeles County industries uses three dimensions of sustainability: greenhouse gas emissions,
economic viability based on size and growth, and social sustainability based on wages for
workers. This inclusive framework for assessing sustainability draws on the concept of three
pillars of sustainable development that was put forward by the United Nations Brundtland
Commission in 1987.
Emission reduction targets for both the United States and California converge on reducing
greenhouse gas emissions by 83 percent in 2050. The baseline evidence presented in this report
indicates that the amount of energy consumed by Los Angeles’ industries has remained roughly
constant and has not yet shifted into the steep downward trajectory required to meet 2050 goals.
Local government can help achieve the goals for reducing greenhouse gas emissions by making
land use decisions and enacting development policies that encourage a regional industry
structure that adds growing value to the economy and employs growing numbers of workers
while decreasing amounts of greenhouse gases released. Information in this report can be used
in assessing trade‐offs for achieving both social and environmental sustainability.

2
Project Results
Outcomes from analyzing the baseline relationship between energy, greenhouse gas emissions
and social indicators led to using three industry‐specific factors in assessing trade‐offs for
achieving overall sustainability. The three factors are 1) energy consumption and greenhouse
gas emissions, 2) industry viability, and 3) wage levels, with greatest emphasis for the first and
third factors. These industry factors provide tools for addressing the three dimensions of
sustainability for the region’s industries ‐ environmental, social and economic viability.
This analysis of the baseline relationship between energy, greenhouse gases and wage
sustainability draws on multiple data sets to produce estimates of greenhouse gas and wage
outcomes for each type of industry in each sub‐region of the county. Data sources include:
Longitudinal establishment data for each employer in the county with addresses,
industry classifications, employment levels, and payroll amounts for each facility.
Annual data from the California Energy Commission identifying the amount of
electricity and natural gas consumed by each industry in Los Angeles County.
Direct energy consumption and greenhouse gas emission factors for each industry
provided by the California multi‐regional input‐output (MRIO) life‐cycle assessment
(LCA) model.
Life cycle energy consumption and greenhouse gas emission factors for each industry
provided by The U.S. Economic Input‐Output Life Cycle Assessment (EIO‐LCA) model.
This combination of data sources means that industry employment and payroll data is accurate
and specific to each sub‐region, however greenhouse gas emission factors represent statewide
averages for each industry in the case of direct emission estimates using the MRIO‐LCA model,
and national averages for each industry in the case of life cycle estimates using the EIO‐LCA
model. An additional limitation is that both the MRIO‐LCA and EIO‐LCA models are derived
from the Bureau of Economic Analysis’ 2002 benchmark Input‐Output Make and Use tables.
Correction factors for the time lag built into these models comes from annual energy
consumption data provided by the California Energy Commission, which are applied to direct
emission estimates produced using the California MRIO‐LCA model, and annual changes in the
amount of value added per worker in each industry in Los Angeles, which are incorporated into
both the MRIO‐LCA and EIO‐LCA models.
Three key strengths of MRIO‐LCA and EIO‐LCA models are their comprehensiveness,
consistency, and use of very rich, complex and reliable data from the Bureau of Economic
Analysis. The 2002 benchmark Input‐Output Make and Use tables describe each industry
separately, covering the entire industry structure. A single framework of industry relationships
is used to produce energy and emissions factors for every industry, covering the entire
economy. These models made it possible for this analysis to link employment at each
establishment with standardized industry factors for energy consumption and greenhouse
emissions in order to estimate the environmental impact of each establishment.

3
Overall consumption of electricity and natural gas by industries in the county has remained
constant since 2008, with slight progress in increasing the amount of value added to the
economy per terajoule of energy consumed. Extracting and refining petroleum for
transportation uses (leaving out the impacts of burning the fuel in transportation uses) accounts
for nearly a third of the greenhouse gasses emitted by industries in Los Angeles County.
Measured against environmental benchmarks, the county’s industries have not yet made visible
progress in meeting the federal target for 2020 of reducing greenhouse gas emissions 17 percent
below 2005 levels.
Measured against social benchmarks, employment is increasing concentrated in the service
sector, with a large segment of employment in low‐wage service industries. Los Angeles
County lags behind the state and nation in median levels of earned income, and the city lags
behind the county.
The metric for assessing greenhouse impacts in different industries and geographic areas was
the ratio of jobs to emissions indexed three ways: direct emission from establishment activities,
direct emissions from gasoline consumed by customers driving to establishments in private
light duty vehicles and the full life cycle emissions from the supplier chain linked to each
establishment added to direct emissions from establishment activities.
The three industries with the highest greenhouse gas emissions per job in 2011 were petroleum
refining (12,292 tons), air transportation (1,442 tons), and utilities (941 tons). These high
emissions in a small number of basic industries skewed the overall average upward. The entire
industry base of the county emitted an average of 33 tons of greenhouse gases per job in 2011.
At the low end of the spectrum, office‐based industries had direct greenhouse gas emissions of
roughly one‐twentieth of a ton per job.
Customer trips are estimated to account for a metric ton or more annually of greenhouse gas
emissions per employee in 20 major industries, and account for more emissions per job than
establishment activities in 18 major industries. The emission profile of a number of industries
shifts from negligible to significant emissions per job when the impact of gasoline consumed for
customer trips is taken into account.
Industries in each sub‐region of Los Angeles County are ranked on two scales, wage
sustainability and greenhouse gas sustainability based on both direct emissions from
establishment activities and emissions from gasoline consumed for customer trips to
establishments. The quintile benchmarks used for ranking were derived by dividing Los
Angeles County’s labor force in 2011 into wage quintiles and greenhouse gas quintiles, with an
equal number of employees in each quintile on each scale.
In many instances the ranking for environmental sustainability differs from the ranking for
wage sustainability. In the near‐term, these rankings differences identify trade‐offs. In the long‐
term, they identify sustainability weaknesses that need to be improved to increase industry
sustainability and long‐term prospects for viability.

4
When Los Angeles County industries are rolled up into 23 broad sectors and broken out into
quintile rankings based on wage and greenhouse sustainability, only five sectors representing
26 percent of total employment, both pay at least average wages and emit less than 2.2 metric
tons of greenhouse gasses per job each year. Three‐quarters of the county’s industry base pays
less than average wages, has average or higher emissions, or both.
The very highest levels of greenhouse gas emissions are from cornerstone industries that
provide energy and movement that are essential for the economy ‐ petroleum extraction and
refining, electric power generation and distribution, air transportation, and trucking.
The lowest wages are predominantly in routine service industries – retail, restaurants, hotels
and personal services.
Some industries are both socially and environmentally sustainable when seen individually,
however, all industries are dependent on the energy and transportation sectors of the economy,
which are emission‐intensive. The long‐term sustainability of all industries is dependent on
cleaner sources of energy and higher levels of value added to the economy per unit of energy
consumed.
Progress toward environmental sustainability requires improved technologies and industry
processes for producing electricity and petroleum and for moving people and goods much
more efficiently and with much less dependence on fossil fuels. To become more socially,
economically and environmentally sustainable, Los Angeles County must move its industry
base toward:
1. Higher levels of value added to the economy for each terajoule that is consumed,
preferably achieved through greater energy efficiency for existing industries.
2. Cleaner sources of power that release less greenhouse gas per terajoule consumed.
3. Higher wages so that all workers are paid enough to support the minimum standard of
living necessary for health, efficiency, and general well‐being. Possible approaches for
achieving sustainable wages include incentives for higher‐wage industries and increases
in the minimum wage.
Project Benefits
Data from this study is operationally relevant for informing land use decisions in Los Angeles
County, Los Angeles City and each of the nine Southern California Association of Governments
(SCAG) sub‐regions in the county. This can take place, for example, by using this information in
developing city master plans as well as in in zoning and permit approval decisions. This
includes detailed data for assessing sustainability strengths and weaknesses of industries in
each region:
Direct and life cycle energy consumption per job by industry
Direct and life cycle greenhouse gas emissions per job by industry
Direct greenhouse gas emissions from gasoline consumed for customer trips

5
Average wages in each industry in each region
Policy relevant information includes identification of industry sectors that:
1. Support a growing economy that is socially and environmentally sustainable.
2. Provide significant labor force benefits but at an unsustainable environmental cost and
should be targeted for energy efficiency investments to increase competitiveness.
3. Provide jobs with low associated greenhouse gas emissions but do not pay sustaining
wages and should be targeted for wage improvements.
4. Have significant carrying costs for both the social safety net because of low wages and
the environment because of high greenhouse gas emissions.

6
CHAPTER 1: Sustainability Baseline for Wage and Greenhouse Gas Outcomes from Los Angeles County Industries
This report provides an integrated framework for assessing both the environmental and social
sustainability of industries. Socio‐ecological interrelations are assessed based on greenhouse gas
emissions per job, socio‐economic interrelations are assessed based on wages per job and also the
economic robustness of industries. Scaling these effects to a single job provides a policy tool for
analyzing how each industry affects: 1) the environmental balance sheet for employing the
region’s labor force while remaining under the greenhouse gas emission ceilings set forth in
federal, state and local goals, 2) the social balance sheet for providing the region’s labor force
with wages that support a basic standard of living.
This baseline profile measures Los Angeles County industries using three dimensions of
sustainability: greenhouse gas emissions, social sustainability based on wages for workers, and
economic viability based on size and growth.1 The next chapter uses this framework to analyze
industry conditions and sustainability trade‐offs in sub‐regions of the county
1.1 Electricity and Natural Gas Consumption
Electricity and natural gas provide most of the energy that enables workers to add value to the
economy, and are therefore essential prerequisites for the jobs of most workers in Los Angeles
1 The concept of three pillars of sustainable development is attributable to the United Nations Brundtland
Commission (1987), “Our Common Future,” http://www.un‐documents.net/our‐common‐future.pdf.
Figure 1: Distribution of Electricity Consumption among Los Angeles County Industries in 2012
Source: California Energy Commission, Energy Consumption Database
1%
5%
5%
7%
7%
8%
8%
8%
11%
11%
12%
17%
0% 5% 10% 15% 20%
Ag, Mining, Constuction
Health Care
Schools & Colleges
Transport & Warehouse
Hotels & Restaurants
Utilities
Nondurable Mfg
Durable Mfg
Petro. Extract. & Refine
Retail
Other Commercial
Offices
7
County’s labor force. The relationship between energy consumption, concomitant greenhouse
gas (GHG) emissions, and value added to the economy provides a starting point for
investigating industry sustainability.
1.1.1 Electricity Consumption by Industry Sector
The distribution of electricity consumption among industries in 2012 is shown in Figure 1.
Offices were the largest consumer (17 percent), followed by other commercial (12 percent), retail
(11 percent), and petroleum extraction and refining (11 percent). Petroleum‐related electricity
consumption is primarily for refineries.
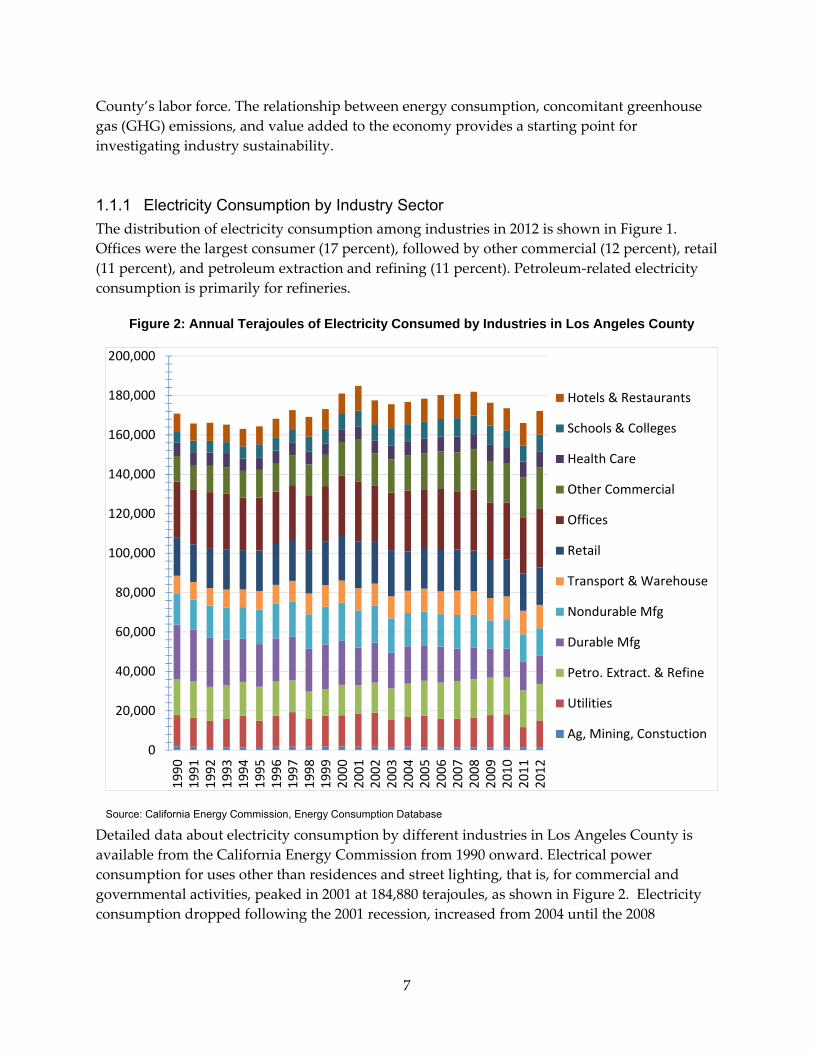
Detailed data about electricity consumption by different industries in Los Angeles County is
available from the California Energy Commission from 1990 onward. Electrical power
consumption for uses other than residences and street lighting, that is, for commercial and
governmental activities, peaked in 2001 at 184,880 terajoules, as shown in Figure 2. Electricity
consumption dropped following the 2001 recession, increased from 2004 until the 2008
Figure 2: Annual Terajoules of Electricity Consumed by Industries in Los Angeles County
Source: California Energy Commission, Energy Consumption Database
0
20,000
40,000
60,000
80,000
100,000
120,000
140,000
160,000
180,000
200,000
1990
1991
1992
1993
1994
1995
1996
1997
1998
1999
2000
2001
2002
2003
2004
2005
2006
2007
2008
2009
2010
2011
2012
Hotels & Restaurants
Schools & Colleges
Health Care
Other Commercial
Offices
Retail
Transport & Warehouse
Nondurable Mfg
Durable Mfg
Petro. Extract. & Refine
Utilities
Ag, Mining, Constuction

8
recession, although not to the 2001 level, and then declined through 2011.2 Industry electricity
consumption increased in 2012, from 166,064 terajoules in 2011 to 172,192 terajoules in 2012.
This suggests an overall pattern of fluctuation that follows business cycles within a
consumption band of 160,000 to 180,000 terajoules of electricity a year to power the county’s
industries.
Electricity consumption by industries has remained fairly stable over the 23‐year time window
shown in Figure 2. The greatest rates of change were an average annual decline of 2.7 percent
2 Terajoules are used as the unit of measure in this discussion so as to provide a common framework for
describing all forms of energy used by industries, including electricity, natural gas and petroleum.
Natural gas and petroleum are primary forms of energy and electricity is a secondary form, however both
the MRIO‐LCA and EIO‐LCA models used in chapter 2 and the discussion of the overall industry profile
of Los Angeles County industries, as measured by natural gas and electricity consumption, require this
integrated fame of reference. Care has been taken to avoid double counting natural gas used to generate
electricity when discussing the combined consumption of natural gas and electricity.
Figure 3: Annual Terajoules of Natural Gas Consumed by Industries in Los Angeles County
Source: California Energy Commission, Energy Consumption Database
0
50,000
100,000
150,000
200,000
250,000
300,000
350,000
400,000
450,000
2008 2009 2010 2011 2012
Hotels & Restaurants
Schools & Colleges
Health Care
Other Commercial
Office
Retail
Transport. & Warehousing
Nondurable Manufacturing
Durable Manufacturing
Electric Power Gen. & Dist.
Petroleum Extract. & Refining
Water, Sewage, Waste Mgmt.
Ag., Mining, Construction

9
for durable manufacturing and an average annual growth of 2.4 percent for other commercial –
a catch‐all category made up mostly of technical and professional services.3
1.1.2 Natural Gas Consumption by Industry Sector
In 2012, industries in Los Angeles County consumed roughly 2.4 times as many terajoules of
natural gas as they did of electricity. However, 37 percent of the natural gas consumed by
industries is used to generate electric power, and thus is double‐counted when it reappears in
this study as electric power. When natural gas used to generate electric power is left out of the
calculation, industries consume 1.5 times as many terajoules in the form of natural gas as in the
form of electricity.
A breakout of natural gas consumption by industry sectors from 2008 through 2012 is shown in
Figure 3.4 In 2012, 69 percent of the natural gas consumed by industries was used to extract and
refine petroleum (32 percent) and to generate electricity (37 percent).
Double counting of natural gas energy used to generate electricity is avoided by removing it
from the natural gas inventory in this section of the baseline analysis. This is necessary because
GHG emission factors for electricity include the impacts of consuming natural gas to generate
electricity. There is a related issue with natural gas as it is consumed at petroleum refineries to
produce transportation fuel. However, unlike electricity, the consumption of natural gas at
refineries is not included as a direct impact when computing greenhouse gas emissions, so it
3 This is labelled “miscellaneous” by the California Energy Commission and includes: gasoline stations,
motion picture and recording, information services, data processing services, commercial and industrial
leasing, architects and engineers, other professional and technical services, technical and trade schools,
arts, entertainment and recreation, RV parks, repair and personal services, religious organizations, civic
organizations, justice and public safety.
4 The time window for data breaking out natural gas consumption in Los Angeles County by industry is
shorter than the comparable breakout for electric power. The natural gas breakout covers 2008 to 2012.
Figure 4: Distribution of Natural Gas Consumption among Industries in 2012; Excluding Electric Power Generation and Petroleum Extraction and Refining
Source: California Energy Commission, Energy Consumption Database
1%
1%
6%
7%
8%
8%
8%
9%
11%
14%
27%
0% 10% 20% 30%
Ag., Mining, Construction
Water, Sewage, Waste
Retail
Transport. & Warehousing
Health Care
Schools & Colleges
Office
Durable Manufacturing
Other Commercial
Hotels & Restaurants
Nondurable Manufacturing

10
does not result in double counting. The natural gas energy that is embedded in refined
petroleum appears only in life‐cycle computations of emission impacts.
When the industry uses of natural gas that transform it into other forms of energy, i.e.,
electricity and petroleum, are removed from the mix, the remaining 31 percent of the inventory
is consumed for the establishment‐based uses shown in Figure 4.
Nondurable manufacturing accounts for 27 percent of establishment‐based consumption,
followed by hotels and restaurants, which consume 14 percent. Heating commercial buildings,
the use encompassed by two categories, other commercial and offices, accounts for a total of 19
percent of establishment‐based consumption of natural gas.
1.1.3 Electricity and Natural Gas
There is less year‐to‐year variation in the combined consumption of electricity and natural gas
by the county’s industries (excluding consumption of natural gas for electric power generation)
than there is when electricity or natural gas consumption are studied individually (Figure 5).
Over the five years of 2008 to 2012, industries in Los Angeles Counties consumed an annual
average of 421,000 terajoules of natural gas and electricity. In 2012, total consumption of these
two forms of energy slightly exceeded the 2008 level. Throughout the five‐year interval shown
in Figure 5, industry consumed 41 percent of the combined energy provided by electricity and
natural gas in the form of electricity and 59 percent in the form of natural gas (excluding natural
gas used for electric power generation).
Figure 5: Annual Terajoules of Electricity and Natural Gas Consumed by Industries
Source: California Energy Commission, Energy Consumption Database
0
50,000
100,000
150,000
200,000
250,000
300,000
350,000
400,000
450,000
2008 2009 2010 2011 2012
Terajoules
Natural gas except for electric power generation Electric power
426,011 411,123 416,514422,643 426,796

11
1.1.4 Value Created in the Economy per Terajoule of Electricity and Natural Gas
A critical metric for assessing energy consumption is the amount of value that is added to the
economy through the use of energy. “Value added” is the wealth created by local industries.
Value is added almost entirely through the work done by the labor force. The economy and the
jobs of workers become more environmentally sustainable when more value is created per unit
of energy, and even more so, when more value is created per unit of greenhouse gas emitted.
From 2008 through 2011, all industries combined added an average of $1,175,000 to the
economy for every terajoule of electricity and natural gas that they consumed (excluding
natural gas used to generate electricity), as shown in Figure 6. 5 There was a 1 percent increase
from 2008 to 2011 in the amount of value added per terajoule of energy consumed by industries.
This hints at slight progress toward increased energy efficiency.
The amount of value added per terajoule of energy consumed in 2011 is broken out by broad
industry sector in Figure 7, with electric power and natural gas each shown separately. Looking
first at natural gas consumption, offices added the most value to the economy ‐ $20,733,129 per
terajoule of natural gas consumed and petroleum extraction, refining added next to the least ‐
$97,619, and electric power generation added the least ‐ $37,895. The low amount of value
5 Energy consumption data is from the California Energy Commission, value added data for Los Angeles
County is from IMPLAN data for the county in each year.
Figure 6: Value Created in All Industry Sectors per Terajoule of Electricity and Natural Gas
Source: California Energy Commission, Energy Consumption Database; IMPLAN annual value added data for Los Angeles County in 2010 dollars, source data is from the U.S. Bureau of Economic Analysis Regional Economic Accounts
$1,158,509 $1,214,133
$1,163,462 $1,164,925
$0
$200,000
$400,000
$600,000
$800,000
$1,000,000
$1,200,000
$1,400,000
2008 2009 2010 2011
Value Added Activity per Terajoule of
Electricity and Natural G
as

12
added per terajoule of natural gas consumed in producing petroleum and electric power
represents the outcomes for energy‐intensive industrial activities that produce comparatively
inexpensive commodities – refined petroleum and electricity.
Looking now at the amount of value added per terajoule of electricity consumed, many
industries consume more energy in the form of natural gas than electricity, but the industry
ranking based on energy‐intensity is the same as for natural gas except for the combined sectors
of agriculture, mining and construction. This sector added the most value to the economy per
terajoule of metered electricity – $10,404,698. In the cases of agriculture and mining this
reflected high reliance on petroleum (which is not shown in this figure) as an energy source; in
the case of construction this reflected the fact that on‐site electricity used for construction is not
typically billed to the construction company.
Offices added the next highest amount of value to the economy per terajoule of electricity
consumed – $7,275,797. Utilities added the least value to the economy per terajoule of
electricity consumed – $367,441 – except $0 for electric power. This reflects the large amount of
Figure 7: Amount of Value Added per Terajoule of Electricity and Natural Gas Consumed by Industry Sectors in 2011
Sources: California Energy Commission, Energy Consumption Database and IMPLAN annual value added data for Los Angeles County in 2010 dollars
$0.00
$0.72
$0.37
$0.91
$1.32
$1.22
$1.72
$2.41
$2.49
$1.49
$4.22
$10.40
$7.28
$0.04
$0.10
$0.71
$0.68
$0.54
$0.82
$2.35
$2.01
$4.79
$9.80
$7.26
$1.20
$20.73
$0 $5 $10 $15 $20 $25
Electric Power
Petro. Extract. & Refine
Utilities ex. Electricity
Schools & Colleges
Nondurable Mfg
Hotels & Restaurants
Durable Mfg
Health Care
Transport & Warehouse
Retail
Other Commercial
Ag, Mining, Constuction
Offices
Millions of Dollars of Value Added per Terajoule in 2011
Natural Gas
Electricity

13
energy required to produce and move low‐cost commodities, for example water. In the case of
electric utilities it reflects incorporation of utility electricity consumption as part of overall
energy loss in producing and distributing electric power.
1.1.5 GHG Emissions from Industry Consumption of Electricity and Natural Gas
In 2012, electricity and natural gas directly consumed by industries in Los Angeles County
produced an estimated 27.5 million tons of greenhouse gas emissions, as shown in Figure 8.
Extracting and refining petroleum accounted for nearly a third of these emissions – 8.7 million
tons, followed by nondurable manufacturing – 2.9 tons and offices – 2.9 tons. Combining the
Figure 8: Tons of CO2e Emitted from Direct Industry Consumption of Electricity and Natural GasConsumed in 2012
Sources: California Energy Commission, Energy Consumption Database; United States Environmental Protection Agency eGRID2012 Version 1.0 for electricity emissions and Greenhouse Gas Equivalencies Calculator for natural gas emissions
0
2,000,000
4,000,000
6,000,000
8,000,000
10,000,000
12,000,000
14,000,000
16,000,000
Tons CO2e fromElectric Power
Tons CO2e fromNatural Gas
Tons of CO2 Equivalen
t in 2012
Schools & Colleges
Health Care
Hotels & Restaurants
Other Commercial
Offices
Retail
Transport & Warehouse
Nondurable Mfg
Durable Mfg
Utilities ex. Electric
Petro. Extract. & Refine
Ag, Mining, Constuction
13.4 Million Tons 14.1 Million Tons

14
impacts of electricity and natural gas for all industries, 64.4 tons of greenhouse gases were
emitted for every terajoule of energy consumed. 6
These emissions estimates provide a benchmark for estimating the trajectory of reductions
needed to meet federal targets for reducing overall production of greenhouse gas.
1.1.6 Reductions in GHG Necessary to Meet State and Federal Targets
California Assembly Bill 32, the Global Warming Solutions Act of 2006, establishes a
comprehensive program to reduce greenhouse gas emissions from all sources throughout the
state. The scoping plan for AB 32, which was adopted in 2008 uses 1990 as the benchmark year
and sets out the goals for reducing total emissions as well as per capita emissions through 2050,
as shown in Table 1.1. The goal for 2050 is to reduce the states total greenhouse gas emissions
by 80 percent from what they were in 1990 or 83 percent of what they were in 2005. The goals
anticipate population growth and call for reducing per capita greenhouse gas emissions by 90
percent in 2050, with a seven percent reduction achieved by 2000 and holding through 2010.
In advance of the 2009 United Nations Climate Change Conference in Copenhagen, the White
House announced the following targets for reducing greenhouse gas emissions:7
2020: 17 percent below 2005 levels
2025: 30 percent below 2005 levels
2030 42 percent below 2005 levels
2050: 83 percent below 2005 levels
These targets have not yet by adopted by Congress and signed into law, but they provide
federal benchmarks for reductions in greenhouse gas emissions. Emission reduction targets for
both the United States and California are shown in Figure 9. Both sets of goals converge on
reducing greenhouse gas emissions by 83 percent in 2050.
6 This estimate is based on United States Environmental Protection Agency eGRID2012 Version 1.0 factor
of 77.6 tons of CO2 equivalent emissions for every terajoule of electricity generated in California and the
Greenhouse Gas Equivalencies Calculator factor of 50.3 metric tons or 55.4 short tons of CO2 equivalent
emissions for every terajoule of natural gas consumed.
The basis for the GHG emissions benchmark is a statewide average electricity generation emission value,
which does not reflect the differences in emission based on differences in the sources of power utilized by
different electric utilities throughout the state. A methodological alternative for future studies is to use
utility‐specific data available through the California Energy Commissions Power Source reports
7 U.S. White House (November 25, 2009), ” President to Attend Copenhagen Climate Talks,”
http://www.whitehouse.gov/the‐press‐office/president‐attend‐copenhagen‐climate‐talks

15
Achieving the goals set out by the state and federal governments will be a remarkable
accomplishment.
The baseline evidence presented in this report indicates that the amount of energy consumed by
Los Angeles’ industries has remained roughly constant and has not yet shifted into the steep
downward trajectory shown in Figure 9.
Local government can help achieve the targeted reductions in greenhouse gas emissions
through land use and development policies that encourage a regional industry structure that
adds growing value to the economy and employs growing numbers of workers while releasing
decreasing amounts of greenhouse gases.
Figure 9: State and Federal Targets for Reducing Greenhouse Gas Emissions by 2050
Sources: U.S. Department of Energy (December 02, 2009), EERE Network News; California “Climate Change Scoping Plan: A Framework for Change,” December 2008, p 118.
0%
20%
40%
60%
80%
100%
120%
1990 2000 2005 2010 2020 2025 2030 2040 2050
Annual GHG Emissions as % of 2005
California AB 32 U.S. Department of Energy
Table 1.1: California Greenhouse Gas Emission Trajectory
Year
Millions of Metric Tons of CO2 Equivalent for California
Total Emissions as
% of 1990 Level
Total Emissions
as % of 2005 Level
Metric Tons of CO2
Equivalent per Person
Per Capita Emissions as
% of 1990 Level
1990 427 100% 88% 14.3 100% 2000 452 106% 93% 13.3 93% 2005 487 114% 100% 13.3 93% 2010 522 122% 107% 13.3 93% 2020 422 99% 87% 9.6 67% 2030 284 67% 58% 5.8 41% 2040 185 43% 38% 3.4 24% 2050 85 20% 17% 1.4 10%
Source: California Air Resources Board, “Climate Change Scoping Plan: A Framework for Change,” December 2008, Page 118. 2005 data is interpolated from 2000 and 2010 to provide a comparison point for the federal benchmark.

16
1.2 Economic and Wage Sustainability of Los Angeles County Industries
This section of the baseline analysis addresses two non‐environmental dimensions of industry
sustainability. The first dimension is wage sustainability – does an industry pay its workers
enough to support “the minimum standard of living necessary for health, efficiency, and
general well‐being?”8 The second dimension is economic sustainability – is an industry large
enough to be significant and is it growing or declining? These non‐environmental dimensions of
sustainability are integrated with wages given triple weight to create an index of economic
performance.9 Wages were triple weighted to reflect their importance for social sustainability.
8 These criteria for the minimum level of worker compensation are from Section § 202 ‐ Congressional
finding and declaration of policy, The Fair Labor Standards Act of 1938.
9 An overall index of economic performance was created, with wages given triple weight. Three factors
were combined in this index: employment size, change in employment size, and average industry wage.
A higher score on the index indicates higher performance. Each of the 23 industry sectors was ranked
based on each of the three factors. The index was created by adding together an industry’s ranking on
these three factors, after the wage ranking had been multiplied by three to give it triple weight. With
three factors being combined and the wage factor triple weighted, wage levels accounted for 60 percent of
the overall ranking, industry size 20 percent, and change in industry size 20 percent.
Figure 10: Annual Average Wages in in Los Angeles County Industries 2011
Source: California Employment Development Department Establishment Database for Los Angeles County
$0 $10 $20 $30 $40 $50 $60 $70 $80 $90 $100
Hotel & RestaurantsOther Personal Svcs.
Retail: GeneralAgriculture, ForestryRetail: Home Goods
Janitors, Temps, GuardsMfg: Food & Apparel
EducationalCouriers & Storage
TransportationMfg: Paper & ChemicalHealth & Social AssistReal Estate & Rental
Wholesale TradeConstruction
Mfg: Metal & MachineryPublic Administration
Prof., Scientific, & Tech.Arts & Entertainment
InformationHolding CompaniesFinance & Insurance
UtilitiesMining, Petro Extraction
2011 Annual Wages ‐ Thousands of $
$159K

17
1.2.1 Wage Sustainability
Wages are central to the well‐being of workers. Annual average wages in Los Angeles County’s
formal economy are shown in Figure 10. Thirty‐five percent of jobs are in the seven industries
with average wages for all workers (managers through janitors) that are under $40,000. At the
bottom are hotels and restaurant jobs, paying under $20,000 a year. This low‐wage cluster tops
out with food and apparel manufacturing industries with average wages of about $39,000 a year
The middle cluster of industries starts with education, paying an average of about $51,000 a
year, and extends through metal and machinery manufacturing, paying average wages of about
$71,000 a year. This cluster of nine industries accounts for 41 percent of employment.
The highest paying cluster of industries starts with public administration, paying an average of
about $77,000 a year, and extends to a small employment cohort in utilities earning an average
of about $99,000 a year and an even smaller cohort in mining and petroleum extraction earning
an average of about $159,000 a year. This cluster of the eight highest paying industries accounts
for 24 percent of Los Angeles County’s employment in the formal economy.
The hourly wage distribution of Los Angeles County’s entire labor force, including workers in
both the formal and informal economies, is shown in Figure 11.10 Informal workers typically
have lower wages, pulling down the earnings levels for formal workers shown in Figure 10, but
providing a more complete picture of earnings. Forty‐three percent of workers are paid less
than fifteen dollars an hour. This hourly wage is approximately 200 percent of the poverty
threshold, representing a minimum living wage in a high‐cost region like Los Angeles. The
large number of low‐wage workers means that many households do not have enough income to
pay for basic life necessities.
10 Household survey respondents to the American Community Survey include individuals who work
informally.
Figure 11: Distribution of Los Angeles County Labor Force based on Hourly Wages
Source: U.S. Census Bureau, American Community Survey Public Use Microdata Sample, Los Angeles County 2007-2011
0 500,000 1,000,000 1,500,000 2,000,000 2,500,000 3,000,000 3,500,000 4,000,000
Part time
Full time
Number of Workers
<$9 $9-14.99 $15-21.99 $22-34.99 $35+
Hourly Wage

18
Median earnings of the entire labor force, including informal workers, are shown in Figure 12.
This time series from 1979 through 2011 shows earned income of the median worker, the typical
worker who is in the middle of the wage distribution. Los Angeles City and County have lower
median earnings than California and the United States. Median earnings in Los Angeles City
are particularly low – in 2011 they were 11 percent less than in the county, 16 percent less than
in the United States, and 19 percent less than in California.
1.2.2 Economic Sustainability
1.2.2.1 Industry Size
The most basic characteristic of an industry is whether it can be found in a region and the share
of total employment that it provides. A summary view of Los Angeles County’s industry
structure at the 2‐digit NAICS classification level is shown in Figure 13. Only 12 percent of
employment is in goods‐producing industries. This is the industry super‐sector whose primary
product is making tangible things – growing food, extracting minerals, making and distributing
electric power and other utilities, constructing buildings, and manufacturing consumable and
durable goods. Many goods‐producing industries are comparatively small. Mining and
Figure 12: Median Earned Income 1979 to 2011
Source: U.S. Census Bureau 1980, 1990 and 2000 Decennial Census and 2005 to 2012 American Community Survey Public Use Microdata Samples and tables
$25,000
$30,000
$35,000
$40,000
1979 1989 1999 2004 2005 2006 2007 2008 2009 2010 2011
California
UnitedStates
Los AngelesCounty
Los AngelesCity

19
agriculture each account for only a tenth of one percent of employment. Utilities and
construction each account for only one percent.
Service‐producing industries account for the other 88 percent of employment. This includes
transportation (4 percent), wholesale trade (6 percent), retail trade (10 percent), information (5
percent), finance (6 percent), professional services (8 percent), health and education (21 percent),
leisure and hospitality (11 percent), other services (13 percent), and public administration
(excluding schools and health care 4 percent).
1.2.2.2 Industry Growth Trajectory
A second critical dimension of industry performance is growth or decline. For example, until
the end of the cold war and the collapse of military aerospace manufacturing in Los Angeles in
1990, high technology firms and the secondary tier of metal working suppliers accounted for 10
percent of jobs in the county. By 2012, this sector had lost 61 percent of the jobs it had in 1990.11
Despite its high wages, employment in this sector is precarious due to long‐term decline.
Change in the employment size of industry sectors from 1996 to 2011 is shown in Figure 14. The
six industries with the highest rates of job growth are in the service sector. The four industries
with the highest rate of job loss are in the goods‐producing sector. Decline in construction can
11 California Employment Development Department, Industry Employment Data for Los Angeles
County, 1990‐2012.
Figure 13: Los Angeles County Industry Employment Size 2011
Source: California Employment Development Department Establishment Database for Los Angeles County
0 50 100 150 200 250 300 350 400 450 500
Mining, Petro ExtractionAgriculture, Forestry
UtilitiesConstruction
Couriers & StorageHolding Companies
Mfg: Paper & ChemicalReal Estate & RentalArts & EntertainmentMfg: Food & Apparel
TransportationRetail: General
Finance & InsurancePublic Administration
InformationMfg: Metal & Machinery
Wholesale TradeJanitors, Temps, Guards
Other Personal Svcs.Prof., Scientific, & Tech.
Retail: Home GoodsHotel & Restaurants
EducationalHealth & Social Assist
2011 Employment ‐ Thousands

20
probably be explained by the highly volatile nature of the industry. Low employment in 2011
was the result of the recent recession.
1.3 Summary of Baseline Conditions in Los Angeles County
1.3.1 Index of Economic Performance
An overall ranking of industries’ economic performance is shown in Figure 15. This index was
derived by averaging the rankings of each industry based on size in 2011, change in size from
1996 to 2011, and average wage in 2011. The average wage was given triple weight when
computing the rankings because of the central importance of earnings for social sustainability.
Industries that rank highest on the economic performance index are knowledge‐intensive, for
example professional services, finance, information and health care, or capital‐intensive, for
example, petroleum extraction and utilities.
Industries that rank lowest on the index pay low wages, for example, agriculture, food and
apparel manufacturing, retail, courier and storage services, paper and chemical manufacturing,
janitors and security guards, and hotels and restaurants.
Overall consumption of electricity and natural gas by industries in the county has remained
constant since 2008, with slight progress in the amount of value added to the economy per
Figure 14: Change in Los Angeles County Industry Employment 1996 to 2011
Source: California Employment Development Department Establishment Database for Los Angeles County
‐6% ‐5% ‐4% ‐3% ‐2% ‐1% 0% 1% 2% 3% 4%
ConstructionMfg: Food & Apparel
Mfg: Paper & ChemicalMfg: Metal & Machinery
Holding CompaniesInformation
Couriers & StoragePublic Administration
Janitors, Temps, GuardsEducational
Wholesale TradeFinance & Insurance
TransportationAgriculture, Forestry
Retail: GeneralUtilities
Mining, Petro ExtractionReal Estate & RentalRetail: Home Goods
Health & Social AssistHotel & Restaurants
Prof., Scientific, & Tech.Arts & EntertainmentOther Personal Svcs.
% Change in Employment 1996‐2011

21
terajoule of energy consumed. Extracting and refining petroleum for transportation uses
(leaving out the impacts of burning the fuel when it is used in transportation) accounts for
nearly a third of the greenhouse gasses emitted by industries in Los Angeles County.
The county’s industries have not yet made visible progress in meeting state and federal targets
for 2020. Both targets call for roughly similar outcomes – the state goal is reducing greenhouse
gas emissions one percent below the 1990 level, the federal goal is reducing emissions 17
percent below the 2005 level.
Looking at social sustainability benchmarks, employment is increasing concentrated in the
service sector, with a large segment of employment in low‐wage service industries. Los Angeles
County lags behind the state and nation in median levels of earned income, and the city lags
behind the county.
1.3.2 Policy Implications
Progress toward environmental sustainability requires improved technologies and industry
processes for producing electricity and petroleum and for moving people and goods much
more efficiently and with much less dependence on fossil fuels. To become more socially,
economically and environmentally sustainable, Los Angeles County must move its industry
base toward:
Figure 15: Los Angeles County Industries Ranked by Economic and Social Sustainability
Source: California Employment Development Department Establishment Database for Los Angeles County.
Note: The progression from cooler to warmer colors in the figure reflects progressively lower levels of sustainability.
0 10 20 30 40 50 60 70 80 90 100
Agriculture, ForestryMfg: Food & Apparel
Retail: GeneralCouriers & Storage
Mfg: Paper & ChemicalJanitors, Temps, Guards
Hotel & RestaurantsOther Personal Svcs.
ConstructionRetail: Home Goods
TransportationEducational
Real Estate & RentalMfg: Metal & Machinery
Wholesale TradeHolding Companies
InformationHealth & Social Assist
UtilitiesArts & Entertainment
Mining, Petro ExtractionFinance & Insurance
Prof., Scientific, & Tech.
Economic Performance 100 = Highest

22
1. Higher levels of value added to the economy for each terajoule that is consumed.
2. Cleaner sources of power that release less greenhouse gas per terajoule consumed.
3. Higher wages so that all workers are paid enough to support “the minimum standard of
living necessary for health, efficiency, and general well‐being.”

23
CHAPTER 2: Greenhouse Gas and Economic Outcomes from Industries in Sub-regions of Los Angeles County
2.1 Introduction
Los Angeles is a world metropolis situated in a fragile air shed that provides homes and jobs for
a transnational labor force. This region’s future will emerge out of an economy deeply
intertwined with environmental and socio‐economic realities. Achieving sustainability requires
an industry structure that sharply reduces the ratio of greenhouse gas emissions to jobs in the
region, provides enough jobs for the labor force, and pays sustaining wages to workers.
This analysis documents the relationship between environmental impacts and job opportunities
in Los Angeles in the context of energy use, greenhouse gas emissions and climate change, and
future urban sustainability. It provides information that encompasses the entire employment
base in Los Angeles County’s formal economy. (Analyzing impacts from the informal economy
is outside the scope of this study.) It describes the energy intensity and economic sustainability
of industry activity in the city and county of Los Angeles as well as in each of SCAG’s nine sub‐
regions in the county. The most frequently used metric is the ratio of jobs to greenhouse gas
emissions estimated through three frameworks:
1. Direct emission from establishment activities
2. Direct emissions from estimated gasoline consumed by customers driving to
establishments in private light duty vehicles
3. Life cycle emissions from the supplier chain linked to activities at each establishment as
well as from establishment activities
Activities that severely stress the environment represent areas in which more efficient industrial
processes are needed to preserve jobs as constraints on greenhouse gas emissions become
increasingly severe. Activities with a light environmental footprint that provide a significant
number of jobs represent win‐win opportunities for economic growth. Similarly, jobs that pay
less than living wages identify sectors where the wage floor is too low to pay for basic expenses.
Jobs that pay living wages represent social sustainability strengths of the region. Policy‐relevant
information from this analysis includes identification of industry sectors that:
1. Provide opportunities for a growing economy that is socially and environmentally
sustainable, or
2. Provide significant labor force benefits but at an unsustainable environmental cost and
should be targeted for energy efficiency investments to increase their competitiveness,
or
3. Provide jobs with low associated greenhouse gas emissions but do not pay sustaining
wages and should be targeted for wage improvements, or
4. Have significant carrying costs for both the social safety net and the environment.

24
Trade‐offs of the sustainability strengths and weaknesses of the industry structure in each sub‐
region are analyzed in the next chapter.
This analysis of the baseline relationship between energy, greenhouse gases and wage
sustainability draws on multiple data sets to produce estimates of greenhouse gas and wage
outcomes from each type of industry in each sub‐region of the county. (Some data sources are
specific to individual establishments, and others that are specific to the county, the state or the
nation. (For a detailed discussion of the methods used, see Appendix A.) A partial list of data
sources includes:
Longitudinal establishment data for each employer in the county with specific
addresses, industry classifications, employment levels, and payroll amounts at each
facility.
Data from the Bureau of Economic Analysis for Los Angeles County, via Impact
Analysis for Planning (IMPLAN), showing the amount of value added per employee in
each industry, in each year.
The California multi‐regional input‐output (MRIO) life‐cycle assessment (LCA) model
developed for the California Air Resources Board and the California Environmental
Protection Agency, which provides direct energy consumption and greenhouse gas
emission factors for each industry.
Annual data from the California Energy Commission identifying the amount of
electricity and natural gas consumed by each sector in Los Angeles County. This data
provides industry‐level correction factors for the estimates produced using the
California MRIO‐LCA model.
The U.S. Economic Input‐Output Life Cycle Assessment (EIO‐LCA) model developed by
Green Design Institute, Carnegie Mellon University, which provides life cycle energy
consumption and greenhouse gas emissions factors for each industry.
Data from the Air Resources Board breaking out the amount of gasoline used annually
in Los Angeles County by different types of vehicles.
Data from Argonne National Laboratory’s GREET 1 model that provides vehicle
emission factors for each year based on California’s fuel mix and vehicle mileage
characteristics.
This combination of data sources means that industry employment and payroll data is accurate
and specific to each sub‐region, however greenhouse gas emission factors represent statewide
averages for each industry in the case of direct emission estimates using the MRIO‐LCA model,
and national averages for each industry in the case of life cycle estimates using the EIO‐LCA
model. An additional limitation is that both the MRIO‐LCA and EIO‐LCA models are derived
from the Bureau of Economic Analysis’ 2002 benchmark Input‐Output Make and Use tables.
Correction factors for the time lag built into these models comes from annual energy
consumption data provided by the California Energy Commission, which are applied to direct
emission estimates produced using the California MRIO‐LCA model, and annual changes in the

25
amount of value added per worker in each industry in Los Angeles, which is obtained from
IMPLAN and incorporated into estimates made using both the MRIO‐LCA and EIO‐LCA
models.
Three key strengths of MRIO‐LCA and EIO‐LCA models are their comprehensiveness, their
consistency, and their use of very rich, complex and reliable data from the Bureau of Economic
Analysis. (For additional discussion about the MRIO‐LCA and EIO‐LCA models, see section A.6
in Appendix A.) The 2002 benchmark Input‐Output Make and Use tables describe each industry
separately, covering the entire industry structure. A single framework of industry relationships
is used to produce energy and emissions factors for every industry, covering the entire
economy.
These models made it possible for this analysis to link employment at each establishment with
standardized industry factors for energy consumption and greenhouse emissions in order to
estimate the environmental impact of each establishment. These establishment‐level estimates
were aggregated by industry for each sub‐region of the county, thereby protecting
establishment confidentiality and also populating industry classifications with sufficiently large
numbers of firms as to be statistically reliable.
Figure 16: Direct Terajoules of Energy Consumed per Job, Los Angeles County 2011
Source: California Employment Development Department Establishment Database; California MRIO-LCA direct impacts model
0.01 0.01 0.01 0.02 0.02 0.02 0.03 0.04 0.04 0.04 0.05 0.05 0.05 0.05 0.08 0.08 0.09 0.12 0.16 0.26 0.33 0.34 0.45 0.49 0.63 0.71 0.93
1.5 2.7 2.8
6.2
0 1 2 3 4 5 6 7 8 9 10
Finance & InsuranceAdmin Support & Waste Mgmnt
Other ServicesPostal Service
Arts & EntertainmentProfessional, Scientific, & Tech Srv
Wholesale TradeHolding Companies
Health & Social AssistanceInformation
Real Estate & LeasingEducational Services
WarehousingRetail Trade
Support Activities for TransportHotels & Restaurants
Sightseeing TransportationMetal & Other Durable Mfg
Food & Apparel ManufacturingPublic AdministrationWater Transportation
ConstructionWood, Chem, Plastic, Cement Mfg.
Agriculture, ForestryLA COUNTY AVERAGE
Passenger TransitCouriers
Truck TransportationMining, Petroleum Extraction
Pipeline TransportationAir Transportation
UtilitiesPetroleum Refining
Terajoules per Job
15347

26
2.2 Direct Energy Consumption and GHG Emissions per Job
2.2.1 Energy Consumption
There is great variation in the amount of energy required for the activities that workers carry
out in their jobs. The estimated number of terajoules consumed from all sources per job in each
industry is shown in Figure 16. Petroleum refineries consumed 153 terajoules for each person
they employed in 2011.
Other industries that consumed large amounts of energy per job include utilities (47), air
transportation (6.2), pipeline transportation (2.8), petroleum extraction (2.7), and truck
transportation (1.5). Industries that produce energy or move things are energy‐intensive.
Figure 17: Metric Tons of Greenhouse Gases Directly Emitted per Job, Los Angeles County 2011
Source: California Employment Development Department Establishment Database; California MRIO-LCA direct impacts model
0.01 0.04 0.05 0.1 0.1 0.1 0.1 0.1 0.1 0.1 0.1 0.1 0.2 0.3 0.5 0.5 1 1 1 2 2 2 2 3 4 4 4 4 10 14 16
33 35 43
76 127 137
211 222
343 394
0 50 100 150 200 250 300 350 400
Motion Picture TheatersEmployment Services
InformationSpecialized Design SrvFinance & Insurance
AccountingLegal Services
Architecture & EngineeringWholesale Trade
Veterinary & Other Prof Srv.Document Copying & Mail
Retail TradeArts & Entertainment
Rental & LeasingAmbulatory Health Care
HospitalsSocial AssistanceOther Services
Educational ServicesRestaurants
Nursing Care FacilitiesMetal & Other Durable Mfg
Postal ServiceTravel Agencies & Tours
BakeriesWarehousing
HotelsFood & Apparel Mfg.
Sightseeing TransportationWood, Chem, Plastic, Cement
Public AdministrationLA COUNTY AVERAGE
AgricultureWaste Management
Water TransportationPassenger Transit
Pipeline TransportationCouriers
Water & SewageTruck Transportation
Natural Gas DistributionPetroleum Extraction
Electric Power GenerationAir TransportationPetroleum Refining
Direct Metric Tons GHG per Job in 2011
12,2921,4421,439544

27
The countywide average was 0.63 terajoules per job per year.
At the low end of energy consumption, finance and insurance establishments consumed 0.01
terajoules per job. Other office‐based jobs have similarly low levels of energy consumption.
These ratios of energy consumption to jobs combine reliable establishment‐level employment
data with the industry energy and emission factors from the California MRIO‐LCA model. The
outcomes from that model corrected based on data from the California Energy Commission
reporting electricity and natural gas by industry in Los Angeles County. This justifies a high
level of confidence in the industry spread produced by the ratios. The methods used to produce
this data are described in greater detail in Appendix A.
Appendix C provides more detailed information about direct energy consumption per job,
breaking out these impacts at the 4‐digit NAICS industry classification level for Los Angeles
County and City, and the 3‐digit level for each of the nine SCAG sub‐regions.
2.2.2 Greenhouse Gas Emissions
Energy consumption correlates closely with greenhouse gas emission, with some variation in
this correlation based on variation in energy source among industries. Natural gas produces
50.3 metric tons of CO2 equivalent emissions for every terajoule consumed, electricity produces
70.4 tons, and vehicle gasoline produces 83.9 tons.12
The three industries with the highest direct greenhouse gas emissions per job in 2011 were
petroleum refining (12,292 tons), air transportation (1,442 tons), and electric power generation
(1,439 tons), as shown in Figure 17.
The overall industry base of the county directly emitted 33 tons of greenhouse gases for each job
in 2011.
At the other end of the spectrum, office‐based industries had direct GHG emissions of roughly
one‐twentieth of a ton per job.
2.3 Direct Emissions per Job from Gasoline Consumed for Customer Trips
The trip generation models used for land use planning were used in this analysis to estimate
greenhouse gas emissions from customer trips.13 Land use planners currently estimate the level
12 This estimate is derived from United States Environmental Protection Agency eGRID2012 Version 1.0.
13 These estimates were derived from the California Emissions Estimator Model, Table 4.3 Mobile Trip
Rates, South Coast Air Quality Management District, 2011, and for industries not covered by that model,
from the ITE Trip Generation Handbook ‐ 2nd Edition. Industries such as manufacturing that do not have
public customer traffic are not assigned a trip generaton factor.

28
of vehicle traffic that will be generated by new developments in determining parking and road
improvement requirements. Customer traffic also creates greenhouse gas emissions from
combustion of gasoline.
Trip generation data were calibrated to employment and linked with the amount of gasoline
consumed for customer trips by the public to business and government. This methodology is
Table 2.1: Metric Tons of Direct GHG per Job in 2011 from Establishment Activities and Customer Gasoline
Industry and NAICS Code
Establish-ment
ActivitiesCustomer Gasoline
Bakeries (3118) 3.6 1.0
Retail Trade (44-45) 0.1 7.0
Air Transportation (481) 1,442.0 2.2
Water Transportation (483) 76.2 0.5
Passenger Transit (485) 126.8 0.3
Sightseeing Transportation (487) 10.1 0.6
Postal Servicer (491) 2.4 3.9
Couriers (492) 210.9 3.7
Finance & Insurance (52) 0.1 4.2
Rental & Leasing (53) 0.3 1.0
Motion Picture Theaters (5121) 0.0 52.3
Legal Services (5411) 0.1 0.3
Accounting (5412) 0.1 0.2
Architecture & Engineering (5413) 0.1 0.2
Specialized Design Srv (5414) 0.1 0.0
Veterinary & Misc Prof Srv (5419) 0.1 1.2
Employment Services (5613) 0.0 0.2
Copying & Mail Service (5614) 0.1 2.3
Travel Agencies (5615) 3.4 0.3
Educational Services (61) 1.0 1.2
Ambulatory Health Care (621) 0.5 1.9
Hospitals (622) 0.5 1.1
Nursing Care Facilities (623) 2.1 1.0
Social Assistance (624) 0.5 0.9
Arts & Entertainment (71) 0.2 2.1
Hotels (721) 4.0 2.3
Restaurants (722) 2.1 13.5
Other Services (81) 0.9 1.3
Public Administration (92) 15.6 1.5
Los Angeles County Average 32.7 2.5
Source: Economic Roundtable model for estimating GHG emissions from vehicle operations for customer trips. See Appendix A.5.

29
described in greater detail in Appendix A. Impacts of commercial transportation, including
commercial vehicle fleets, are included in the direct industry impacts shown by the California
MRIO‐LCA model. Including impacts from customer traffic adds a missing piece to estimates of
industry greenhouse gas emissions generated by industry activity.
Emissions from both establishment activities and customer trips are shown in Table 2.1.
Customer trips account for a metric ton or more of GHG emissions per employee in 20
industries. Motion picture theaters lead this list with 52 tons per year per employee, followed by
restaurants with 13 tons, and then retail trade with 7 tons.
The emission profile of a number of industries shifts from negligible to significant emissions per
job when the impact of customer traffic is taken into account. Gasoline consumed for customer
trips accounts for more emissions per job than establishment activities in 18 industries, as
shown in Figure 18.
Appendix C provides detailed industry information about greenhouse gas emissions associated
with vehicle operations during customer trips.
Figure 18: Percent of Direct GHG emissions from Customer Trips vs. Establishment Activities in 2011
Source: Economic Roundtable method for estimating GHG emissions from vehicle operations for customer trips. See Appendix A.5.
0% 10% 20% 30% 40% 50% 60% 70% 80% 90% 100%
Air TransportationPassenger Transit
Water TransportationCouriers
Sightseeing TransportationLA COUNTY AVERAGE
Travel Agencies & ToursPublic Administration
BakeriesNursing Care Facilities
HotelsSpecialized Design SrvEducational Services
Other ServicesPostal Service
Social AssistanceHospitals
AccountingArchitecture & Engineering Srv
Legal ServicesAmbulatory Health Care
Rental & LeasingEmployment Services
RestaurantsVeterinary & Other Prof Srv.
Arts & EntertainmentDocument Copying & Mail Srv.
Retail TradeFinance & Insurance
Motion Picture Theaters
Establishment Activities Customer Gasoline

30
2.4 Life Cycle Emissions per Job
Life cycle emissions include all of the embedded greenhouse emissions released through
industry activities of upstream suppliers. The estimated life cycle greenhouse gas emissions per
job in in Los Angeles County in 2011 are shown in Figure 19. The method used to produce these
estimates is described in Appendix A. Tables breaking out life cycle impacts in greater industry
and geographic detail are provided in Appendix C.
The life cycle average for all industries in 2011 was an estimated 136 metric tons of greenhouse
gases per job. Life cycle estimates are less reliable than those for direct emissions, but they have
Figure 19: Life Cycle Metric Tons of GHG emissions per Job in Los Angeles County, 2011
Source: Economic Roundtable calculation of life cycle GHG emissions. See Appendix A.4 additional information.
3 10 13 14 15 15 16 16 16 18 18 18 22 25 25 25 28 31 31 31 33 33 36 47 50 50
71 121
136 138 145 156
224 318
485
0 50 100 150 200 250 300 350 400 450 500
Employment ServicesDocument Copying & Mail Srv.
AccountingPostal ServiceOther Services
Transport Support ActivitiesFinance and InsuranceNursing Care Facilities
Legal ServicesRetail Trade
Specialized Design SrvAmbulatory Health CareTravel Agencies & Tours
Veterinary & Other Prof Srv.Restaurants
Architecture & EngineeringArts & Entertainment
Wholesale TradeSightseeing Transportation
Real Estate and LeasingMotion Picture Theaters
HotelsEducational Services
WarehousingHospitals
InformationConstructionAgriculture
LA COUNTY AVERAGEMetal & Other Durable Mfg
Public AdministrationBakeries
Passenger TransitFood & Apparel MfgWaste ManagementPetroleum Extraction
Water & SewageWood, Chem, Plastic, Cement Mfg
Pipeline TransportationNatural Gas Distribution
Electric Power Generation
Life Cycle Metric Tons GHG per Job in 2011
15,3265,517
1,000
3,6951,359
651

31
two important uses.14 First, they provide an index of the comparative life cycle impacts of
different industries. Second, they identify industries with high life cycle impacts that may well
face increasing competitive hurdles as market costs associated with carbon continue to increase
and prices charged by upstream suppliers increase.
The ranking of industries based on life cycle emissions (Figure 19) is roughly similar to the
ranking based on direct emissions (Figure 17). In both the direct and life cycle rankings, energy
sources and transportation have the highest emissions per job.
Electric power generation is the high‐emission outlier based on life cycle impacts, whereas
petroleum refining is the outlier based direct impacts. Electric power generation and
distribution has far greater life cycle impacts than any other industry – 15,326 metric tons of
greenhouse gas emissions per job per year.
14 As explained in Appendix section A.4, the correction factor used to bring U.S. EIO‐LCA life cycle factors into alignment with actual impacts in Los Angeles County was annual changes in the ratio of
energy consumed by individual industries to the value added by industries in the county. This correction
factor improves the reliability of the estimates but is not as robust as the actual quantities of energy
consumed by each industry that were used to correct MRIO‐LCA factors in estimating direct emissions.
Because of anomalies in life cycle GHG estimates from the EIO‐LCA model compared to direct GHG
estimates from the MRIO‐LCA model, life cycle data for five industries has been removed from estimates
shown in this chapter and in Appendix C: Petroleum Refining, Air Transportation, Truck Transportation,
Water Transportation, and Couriers.
Figure 20: Terajoules of Energy Directly Consumed per Job in 2011 for Sub-regions of Los Angeles County
Source: Economic Roundtable calculation of direct energy consumption. See Appendix A.3 for additional information.
0.08
0.08
0.1
0.2
0.4
0.4
0.6
0.7
0.8
0.9
1.1
0.0 0.2 0.4 0.6 0.8 1.0 1.2
Las Virgenes
Arroyo Verdugo
Westside Cities
San Fernando Valley
No Los Angeles Co
Gateway Cities
Los Angeles County
San Gabriel Valley
Los Angeles City
South Bay Cities
Metro Los Angeles
Terajoules of Direct Energy per Job in 2011

32
Government activities have above average life cycle impacts 145 annual metric tons of
greenhouse gases compared to an overall average of 136 tons. These above‐average impacts are
the result of energy‐intensive activities such as building, maintaining and operating the utility
and transportation infrastructures, operating heavy vehicles to transport goods, and operating
vehicles to provide public safety services.
2.4.1 Ratio of Life Cycle to Direct Emissions
For all industries in the county, life cycle GHG impacts are roughly four times greater than
direct impacts (136 vs. 33 metric tons of emissions per job per year), but this ratio varies widely
among industries. A rough rule of the thumb is that industries with low direct impacts often
have proportionately larger upstream impacts in their supplier chain, and industries with high
direct impacts often have proportionately smaller upstream impacts in their supplier chain. The
ratio of life cycle to direct GHG emissions per job is shown below for a sample of industries.
Agriculture 3
LOS ANGELES COUNTY AVERAGE 4
Hotels 8
Public Administration 9
Waste Management 11
Restaurants 12
Warehousing 12
Social Assistance 19
Ambulatory Health Care 38
Education 38
Hospitals 100
Real Estate and Leasing 120
Retail Trade 124
Professional, Scientific, and Technical 268
Wholesale Trade 276
Finance and Insurance 287
Information 1,026
2.5 Average Direct Emissions per Job in Each Region
The estimated energy consumption and greenhouse emissions per job are the same for
industries throughout the county, but there are substantial differences in the industry structure
of different regions, producing wide variation in the amount of energy consumed and
greenhouse gas released per job in different regions of the county. Figure A.1 in Appendix A is
a map of SCAG sub‐regions in Los Angeles County.
The highest energy consumption per job (1.1 terajoules) is in Metro Los Angeles, which is the
urban core of the region with a high concentration of manufacturing and utility establishments.
The South Bay Cities are next with 0.9 terajoules per job in 2011, as shown in Figure 20.

33
The lowest energy consumption per job is in Las Virgenes (Malibu sub‐region) and Arroyo
Verdugo (a small sub‐region made up of La Canada Flintridge and Montrose) with 0.08
terajoules consumed per job. This low level of energy consumption is attributable to industry
structures in these areas that are heavily tilted toward retail and services.
The pattern shifts with greenhouse gas emissions. The South Bay Cities are the regional hub for
petroleum refining and have the highest greenhouse gas emissions per job, as shown in Figure
21. This includes 71 metric tons of GHG per job from establishment activities and almost 3 tons
from customer trips.
Los Virgenes (Malibu) has a small, service‐based economy and the lowest emissions per job – 3
tons from establishment activities and almost 3 tons from customer trips.
A different pattern emerges for customer trip emissions. The highest level of emissions from
customer trips is in Arroyo‐Verdugo – 5.2 tons per job, followed by North Los Angeles County
with 3.7 tons per job. This is the result of industry structures in these sub‐regions that are
skewed toward retail and consumer service industries, including restaurants.
Figure 21: Metric Tons of GHG per Job from Establishment Activity and Customer Trips for Sub-regions of Los Angeles County, 2011
Source: Economic Roundtable calculation of direct GHG emissions. See Appendix A.3, A.5 for additional information.
0 10 20 30 40 50 60 70 80
Las Virgenes
Arroyo Verdugo
San Fernando Valley
Westside Cities
North Los Angeles County
San Gabriel Valley
Gateway Cities
Los Angeles County
Los Angeles City
Metro Los Angeles
South Bay Cities
Metric Tons of GHG per Job 2011
Establishment Activities Customer Gasoline
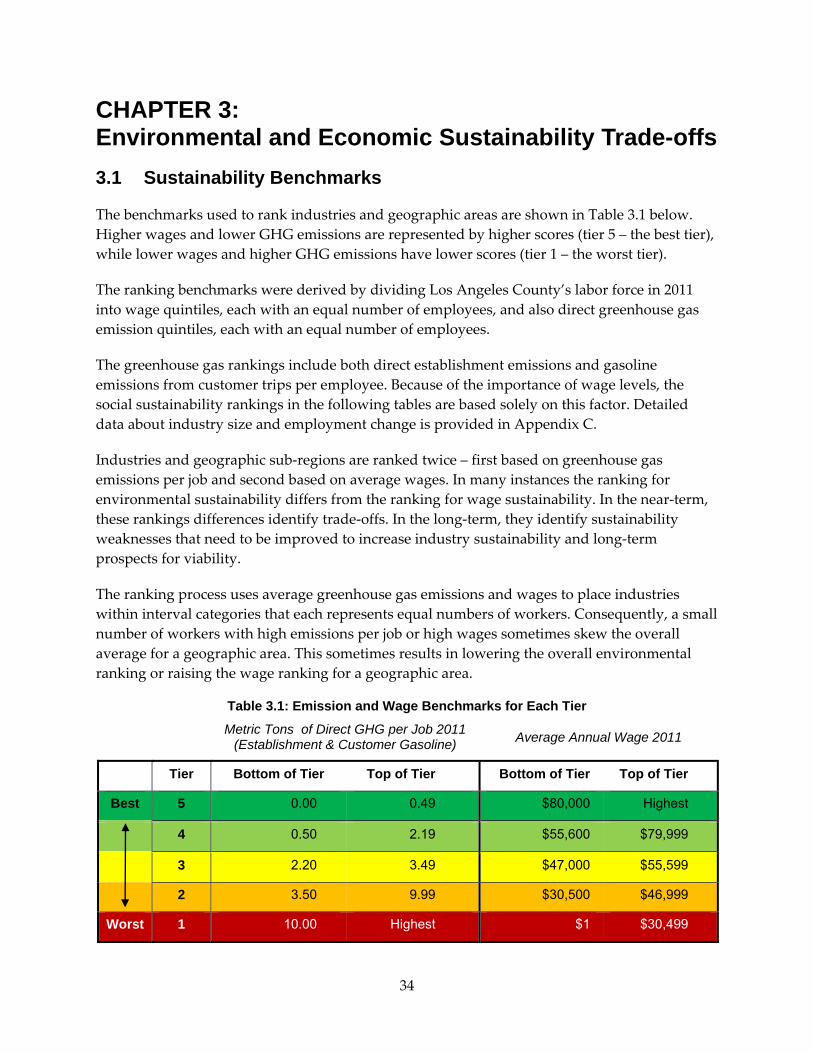
34
CHAPTER 3: Environmental and Economic Sustainability Trade-offs
3.1 Sustainability Benchmarks
The benchmarks used to rank industries and geographic areas are shown in Table 3.1 below.
Higher wages and lower GHG emissions are represented by higher scores (tier 5 – the best tier),
while lower wages and higher GHG emissions have lower scores (tier 1 – the worst tier).
The ranking benchmarks were derived by dividing Los Angeles County’s labor force in 2011
into wage quintiles, each with an equal number of employees, and also direct greenhouse gas
emission quintiles, each with an equal number of employees.
The greenhouse gas rankings include both direct establishment emissions and gasoline
emissions from customer trips per employee. Because of the importance of wage levels, the
social sustainability rankings in the following tables are based solely on this factor. Detailed
data about industry size and employment change is provided in Appendix C.
Industries and geographic sub‐regions are ranked twice – first based on greenhouse gas
emissions per job and second based on average wages. In many instances the ranking for
environmental sustainability differs from the ranking for wage sustainability. In the near‐term,
these rankings differences identify trade‐offs. In the long‐term, they identify sustainability
weaknesses that need to be improved to increase industry sustainability and long‐term
prospects for viability.
The ranking process uses average greenhouse gas emissions and wages to place industries
within interval categories that each represents equal numbers of workers. Consequently, a small
number of workers with high emissions per job or high wages sometimes skew the overall
average for a geographic area. This sometimes results in lowering the overall environmental
ranking or raising the wage ranking for a geographic area.
Table 3.1: Emission and Wage Benchmarks for Each Tier
Metric Tons of Direct GHG per Job 2011
(Establishment & Customer Gasoline) Average Annual Wage 2011
Tier Bottom of Tier Top of Tier Bottom of Tier Top of Tier
Best 5 0.00 0.49 $80,000 Highest
4 0.50 2.19 $55,600 $79,999
3 2.20 3.49 $47,000 $55,599
2 3.50 9.99 $30,500 $46,999
Worst 1 10.00 Highest $1 $30,499

35
3.2 Overall Geographic Ranking
3.2.1 Geographic Aggregation
This analysis uses employer data from the California Employment Development Department,
which provides establishment‐level employment and payroll data for every employer in Los
Angeles County from 1996 through 2011—a total of 1,011,707 employers. This information
provides a practical tool for evaluating trade‐offs to identify the most sustaining workforce
employment and job creation opportunities.
Information provided by these time‐series records includes the following information for the
approximately 400,000 employers that are active in Los Angeles County in any given year:
Figure 22: Nine SCAG Sub-regions in Los Angeles County

36
Address
Six‐digit North American Industry Classification System (NAICS)
Monthly employment
Quarterly payroll
This highly disaggregated data is aggregated into the nine Southern California Association of
Governments (SCAG) sub‐regions shown in Figure 22. The sub‐region breakout groups
Burbank and Glendale with the San Fernando Valley, leaving only the small communities of La
Canada Flintridge and La Crescenta‐Montrose in the Arroyo Verdugo sub‐region.
Employment and payroll information was used to calculate average wages.15 Since the data is
establishment level administrative records rather than the worker level records, it supports
computation of average but not median wages. This constraint was not limiting ‐ average
industry wage was judged to be the best single measure of industry social sustainability.16
Factors for greenhouse gas emission for each industry from the California multi‐regional input‐
output (MRIO‐LCA) model and for gasoline emission from customer trips were linked to
employment at each establishment to estimate direct greenhouse gas emissions. The
methodology for these estimates was discussed in Chapter 2 and is explained in greater detail in
Appendix A.
Summary tables with rolled‐up rankings for each geographic area are shown in this chapter.
More detailed industry data aggregated at the three‐digit NAICS level for each of the nine
SCAG sub‐regions, and at the four‐digit NAICS level for Los Angeles City and County is
provided in Appendix C.
3.2.2 Overall Ranking of Geographic Areas in Los Angeles County
The city and county of Los Angeles and each of the nine SCAG sub‐regions are given overall
sustainability rankings in Table 3.2. All but two geographic areas have the lowest greenhouse
gas ranking (1), as a result of the skewing effect of high‐emission industries in each area.
However, there is wide variation within this “worst” ranking, ranging from 10.20 metric tons of
greenhouse gas emissions per job in the San Fernando Valley to 74.06 metric tons per job in the
15 In the ranking tables, employment numbers for sub‐regions and industries fall about 1 percent short of
total employment shown in each table for three reasons. First, a small number of establishments do not
have accurate address data, so they can not be assigned to a sub‐region. Second, if industries have five or
fewer establishments in a geographic area, data are suppressed. Third, establishemnts whose industry
classification is not determined are incuded in total employment but not in industry breakouts.
16To provide a consistent unit of measure of pay it was necessary to annualize worker earnings, yielding
data for average earnings. There is significant wage variation within industries – differences among
occupations and also differences among establishments and geographic areas. The average summarizes
the overall outcome from all of this polycentric variation. By using average earnings we are able to show
the overall effect of an industry on labor income in a community.

37
South Bay. Los Virgenes and Arroyo Verdugo, with most employment in service‐producing
industries and therefore fewer emissions per job, are in the second‐worst tier (2) for greenhouse
gas emissions.
The City of Los Angeles and four of the SCAG sub‐regions have average wage levels that place
them in the next to the highest tier (4) for wage sustainability. The county and the San Fernando
Valley are in the middle range (tier 3). Four sub‐regions are in the next to the lowest wage tier
(2): North Los Angeles County, Arroyo Verdugo, San Gabriel Valley, and Gateway Cities.
Table 3.2: Overall Ranking of Geographic Areas
Geographic Area
Em
plo
yme
nt
2011
An
nu
al A
vg
. Wa
ge,
20
11 $
Ave
rag
e W
ag
e
Ran
k
Est
ablis
hm
en
t D
irec
t M
T o
f G
HG
s P
er J
ob
20
11
Cu
sto
mer
Gas
olin
e M
T o
f G
HG
s P
er J
ob
20
11
Co
mb
ine
d M
etri
c T
on
s o
f G
HG
s P
er
Job
In
201
1
Gre
enh
ou
se G
as
Ran
k
Los Angeles County 3,954,626 $53,434 3 32.58 2.48 35.06 1
Los Angeles City 1,572,622 $57,512 4 42.62 2.40 45.02 1
San Fernando Valley 789,782 $51,266 3 7.79 2.41 10.20 1
North Los Angeles County 74,297 $40,241 2 11.37 3.66 15.03 1
Los Angeles Metro Area 1,121,339 $60,982 4 57.03 2.29 59.31 1
Arroyo Verdugo 9,108 $39,547 2 3.68 5.19 8.86 2
San Gabriel Valley 618,163 $44,434 2 18.64 2.77 21.41 1
Westside Cities 221,915 $72,979 4 9.39 2.34 11.73 1
South Bay Cities 360,558 $58,594 4 71.45 2.61 74.06 1
Gateway Cities 681,367 $43,099 2 26.03 2.50 28.53 1
Las Virgenes 42,168 $64,458 4 3.11 2.58 5.69 2
Sources: California Employment Development Department; California MRIO-LCA model; California Energy Commission; IMPLAN; U.S. EIO-LCA model; SCAG; California Emissions Estimator Model; California Department of Motor Vehicles; California Air Resource Board; Argonne National Laboratory.
3.2.3 County of Los Angeles Industry Rankings
Sustainability rankings for all of the industries in Los Angeles at a high level of aggregation (for
more detailed information see Appendix C) are shown in Table 3.3. Most industries present
trade‐offs between environmental and wage sustainability strengths. Of the 46 industry
categories shown in Table 3.3, only 13 industries are in the same tier for both environmental and
wage rankings; 36 industries have different environmental and wage rankings.
3.2.3.1 Low Wage Industries
Seven industries that employ 29 percent of the labor force have average wages of thirty
thousand dollars a year or less. This average includes all workers in the industry, from manager
to janitors. To become socially sustainable these industries need to raise wage levels.

38
Restaurants and Bars $17,905
Other Services (personal and repair services) $24,673
Employment Services (temporary employment agencies) $27,294
Agriculture, Forestry $28,803
Nursing Care Facilities $29,945
Hotels $30,069
Retail Trade $30,586
Four of these seven very‐low‐wage industries are in the lowest two quintiles based on
greenhouse gas impacts and thus are doubly challenged to both raise wages and reduce
emissions. These four industries are restaurants and bars, agriculture and forestry, hotels, and
retail trade. The other three industries have average or above average greenhouse gas rankings
– nursing care (tier 3) other services (tier 4) and employment services (tier 5).
3.2.3.4 Low Wage, High Emission Industries
Nine industries are in the first or second tier for both greenhouse gas emissions and wages.
Average annual wages and greenhouse gas emissions per job are:
Restaurants and Bars $17,905 15.56 metric tons
Agriculture, Forestry $28,803 35.66 metric tons
Hotels $30,069 6.31 metric tons
Retail Trade $30,586 7.19 metric tons
Sightseeing Transportation $32,188 10.75 metric tons
Bakeries $33,692 4.56 metric tons
Food and Apparel Manufacturing $39,369 4.5 metric tons
Passenger Transit $39,697 127.14 metric tons
Truck Transportation $41,948 343.18 metric tons
Couriers $43,899 214.61 metric tons
Four of these nine industries were flagged earlier because of their low wages. Many low wage
industries have adverse environmental impacts in addition to adverse social impacts. To
become sustainable these industries are challenged to both raise wages and decrease
greenhouse gas emissions.
Table 3.3: County of Los Angeles Industry Rankings
Industry Group Title (NAICS)
Em
ploy
men
t 20
11
Ann
ual A
vg. W
age,
20
11 $
Avg
. Wag
e Q
uint
ile
Ran
king
Est
ablis
hmen
t D
irect
MT
of
GH
Gs
Per
Job
201
1
Cus
tom
er G
asol
ine
MT
of G
HG
s P
er
Job
2011
Com
bine
d M
etric
T
ons
of G
HG
s P
er
Job
In 2
011
GH
G Q
uint
ile
Ran
king
Agriculture, Forestry (11) 5,793 $28,803 1 35.66 0.00 35.66 1
Mining, Petroleum Extraction (21) 4,250 $155,719 5 277.54 0.00 277.54 1

39
Industry Group Title (NAICS)
Em
ploy
men
t 20
11
Ann
ual A
vg. W
age,
20
11 $
Avg
. W
age
Qui
ntile
R
anki
ng
Est
ablis
hmen
t D
irect
MT
of
GH
Gs
Per
Job
201
1
Cus
tom
er G
asol
ine
MT
of G
HG
s P
er
Job
2011
Com
bine
d M
etric
T
ons
of G
HG
s P
er
Job
In 2
011
GH
G Q
uint
ile
Ran
king
Electric Power Gen. & Trans. (2211) 16,560 $109,316 5 1,439.43 0.00 1,439.43 1
Natural Gas Distribution (2212) 5,043 $83,114 5 393.89 0.00 393.89 1
Water, Sewage & Other Systems (2213) 7,641 $80,467 5 221.96 0.00 221.96 1
Construction (23) 108,717 $53,346 3 0.08 0.00 0.08 5
Food & Apparel Manufacturing (31) 89,798 $39,369 2 4.50 0.00 4.50 2
Bakeries (3118) 15,620 $33,692 2 3.56 1.00 4.56 2
Wood, Chem, Plastic, Cement Mfg. (32) 64,497 $48,023 3 14.30 0.00 14.30 1
Petroleum Refining (324) 4,127 $109,796 5 12,274.62 0.00 12,274.62 1
Metal & Other Durable Mfg. (33) 198,084 $69,659 4 2.17 0.00 2.17 4
Wholesale Trade (42) 210,917 $55,522 3 0.11 0.00 0.11 5
Retail Trade (44-45) 398,253 $30,586 2 0.14 7.04 7.19 2
Air Transportation (481) 18,161 $63,078 4 1,442.02 2.17 1,444.19 1
Water Transportation (483) 3,026 $64,775 4 76.18 0.49 76.67 1
Truck Transportation (484) 25,632 $41,948 2 343.18 0.00 343.18 1
Passenger Transit (485) 20,896 $39,697 2 126.82 0.32 127.14 1
Pipeline Transportation (486) 608 $101,644 5 136.52 0.00 136.52 1
Sightseeing Transportation (487) 1,114 $32,188 2 10.13 0.63 10.75 1
Support Activities for Transp. (488) 46,981 $61,518 4 9.93 0.02 9.95 2
Postal Service (491) 18,873 $60,054 4 2.38 3.91 6.29 2
Couriers (492) 18,547 $43,899 2 210.86 3.75 214.61 1
Warehousing (493) 16,189 $47,108 3 3.89 0.00 3.89 2
Motion Picture & Video (5121) 119,091 $95,311 5 0.01 0.47 0.48 5
Information, ex. Motion Pictures & Video (51) 79,252 $92,446 5 0.11 0.40 0.50 4
Finance & Insurance (52) 142,749 $95,708 5 0.05 4.22 4.27 2
Rental & Leasing (53) 73,682 $52,917 3 0.26 1.02 1.28 4
Legal Services (5411) 47,920 $104,859 5 0.07 0.26 0.34 5
Accounting (5412) 40,712 $67,929 4 0.07 0.17 0.25 5
Arch. & Engineering Srv. (5413) 36,299 $107,039 5 0.08 0.24 0.31 5
Specialized Design Srv (5414) 8,275 $66,661 4 0.05 0.05 0.10 5
Veterinary & Other Prof Srv. (5419) 14,996 $46,015 2 0.13 1.15 1.28 4
Other Prof., Sci., & Tech. Svc. (54) 114,292 $85,388 5 0.15 0.00 0.15 5
Holding Companies (55) 55,162 $94,513 5 0.00 0.00 0.00 5
Employment Services (5613) 89,580 $27,294 1 0.04 0.23 0.28 5
Document Copying & Mail Srv. (5614) 15,356 $37,700 2 0.13 2.31 2.45 3
Travel Agencies (5615) 8,086 $49,692 3 3.36 0.27 3.63 2
Other Admin. Support & Waste Mgmnt. (56) 128,127 $36,665 2 3.21 0.14 3.35 3
Educational Services (61) 356,462 $49,847 3 0.97 1.24 2.21 3

40
Industry Group Title (NAICS)
Em
ploy
men
t 20
11
Ann
ual A
vg. W
age,
20
11 $
Avg
. W
age
Qui
ntile
R
anki
ng
Est
ablis
hmen
t D
irect
MT
of
GH
Gs
Per
Job
201
1
Cus
tom
er G
asol
ine
MT
of G
HG
s P
er
Job
2011
Com
bine
d M
etric
T
ons
of G
HG
s P
er
Job
In 2
011
GH
G Q
uint
ile
Ran
king
Ambulatory Health Care (621) 182,500 $55,646 4 0.48 1.87 2.35 3
Hospitals (622) 148,221 $67,255 4 0.49 1.13 1.62 4
Nursing Care Facilities (623) 70,905 $29,945 1 2.10 0.95 3.05 3
Social Assistance (624) 68,746 $32,501 2 0.52 0.90 1.42 4
Arts, Entertainment, & Rec. (71) 79,990 $90,194 5 0.22 2.08 2.30 3
Hotels (721) 40,880 $30,069 1 4.00 2.31 6.31 2
Restaurants & Bars (722) 295,488 $17,905 1 2.10 13.46 15.56 1
Other Services (81) 261,112 $24,673 1 0.88 1.25 2.14 4
Public Administration (92) 156,543 $75,290 4 15.27 1.48 16.75 1
Total 3,954,626 $53,434 3 32.58 2.48 35.06 1
Sources: California Employment Development Department; California MRIO-LCA model; California Energy Commission; IMPLAN; U.S. EIO-LCA model; SCAG; California Emissions Estimator Model; California Department of Motor Vehicles; California Air Resource Board; Argonne National Laboratory.
3.2.3.2 Very High Emission Industries
Ten industries have 100 or more metric tons of direct greenhouse gas emissions per employee
per year from establishment activities and customer trips.
Petroleum Refining 12,275 metric tons
Air Transportation 1,444 metric tons
Electric Power Generation and Distribution 1,439 metric tons
Natural Gas Distribution 394 metric tons
Truck Transportation 343 metric tons
Mining, Petroleum Extraction 278 metric tons
Water, Sewage and Other Systems 222 metric tons
Couriers 215 metric tons
Pipeline Transportation 137 metric tons
Passenger Transit 127 metric tons
These very‐high‐emission industries provide energy and transportation for the entire industry
structure of the region. These services are indispensable for the economy; however these ten
industries are estimated to produce over 90 percent of all direct greenhouse gas emissions
released by industries in Los Angeles County. Progress toward environmental sustainability
requires improved technologies and industry processes for producing electricity and petroleum
and for moving people and goods much more efficiently and with much less dependence on
fossil fuels.
A strength of these industries is that seven of them pay above average wages. The three surface
transportation industries, truck transportation, couriers and passenger transit pay below

41
average wages and are in tier 2. Air transportation is in wage tier 4, paying above average
wages. And five of the industries are in the highest wage tier (5): petroleum refining, electric
power generation and distribution, natural gas distribution, mining and petroleum extraction,
water and sewage systems, and pipeline transportation.
3.2.3.3 High Wage, Low Emission Industries
Ten industries are in the fourth or fifth tier for both greenhouse gas emissions and wages.
Average annual wages and greenhouse gas emissions per job are:
Architecture and Engineering Services $107,039 0.31 metric tons
Legal Services $102,049 0.34 metric tons
Motion Picture and Video $95,311 0.48 metric tons
Holding Companies $94,513 0.00 metric tons
Information (ex. Motion Pictures) $92,446 0.50 metric tons
Other Prof., Scientific, and Tech. Services $85,388 0.15 metric tons
Metal & Other Durable Manufacturing $69,659 2.17 metric tons
Accounting $67,929 0.25 metric tons
Hospitals $67,255 1.62 metric tons
Specialized Design Services $66,661 0.10 metric tons
These nine service‐producing and one goods‐producing industries pay high wages and have a
light environmental footprint. Many jobs in these industries require post‐graduate education,
making them inaccessible to a large share of the labor force.
While these industries are both socially and environmentally sustainable when seen
individually, all are dependent on supplier chains that include at least some energy‐intensive
vendors as well as the energy‐intensive transportation sector. The long‐term sustainability of
these industries is dependent on cleaner sources of energy and higher levels of value added to
the economy per unit of energy consumed.
This sustainability profile for Los Angeles County provides a baseline of comparison for smaller
geographic areas within the county. The following sections provide profiles for the City of Los
Angeles and the nine Southern California Association of Governments (SCAG) sub‐regions in
the county.17
17 Tabless 3.3 through 3.13 demonstrate aggregate payroll data from each establishment, thereby
providing distinct industry wage profiles for each geographic area. In contrast, greenhouse gas emission
factors for each industry are consistent across the county (see Chapter 2 and Appendix A for more
detailed information). However, because Tables 3.3 through 3.13 show rolled‐up industry categories,
there is variation across geographic areas in the amount of emissions shown per job in the same rolled‐up
industry because of differences in the underlying, finer‐grained industry structures of different
geographic areas.

42
3.2.4 City of Los Angeles Industry Rankings
The City of Los Angeles has higher average wages than the county ($57,512 vs. $53,434) but also
higher average emissions per job (45.02 vs. 35.06 metric tons), resulting in an overall profile of
somewhat greater social sustainability but somewhat less environmental sustainability in its
industry base. The city’s sustainability rankings are shown in Table 3.4.
3.2.4.1 Wage Profile
Eight industries are in a higher wage tier in the city than in the county because the average pay
is higher (agriculture and forestry; support activities for transportation; couriers; veterinary and
other professional services; employment services; travel agencies; nursing care facilities; and
hotels), and one industry is in a lower wage tier (sightseeing transportation).
Average wages in the city are also boosted by a much higher concentration of government jobs
and a somewhat higher concentration of financial sector jobs. The share of the city labor force is
greater than the share of the county labor force in:
Public Administration 60 percent larger share
Finance, Insurance and Real Estate 12 percent larger share
3.2.4.2 Emissions Profile
Compared to the county, the city has a significantly larger share of employment concentrated in
three high emission industries, resulting in an overall emissions‐per‐job profile that is higher
than the county. The share of the city labor force is greater than the share of the county labor
force in:
Air Transportation 118 percent greater share
Electric Power Generation and Transmission 40 percent greater share
Couriers 33 percent greater share
3.2.4.3 Alignment of Wage and Emission Rankings
Compared to the county, the city has a larger share of employment concentrated in high‐wage
industries, two of which are also high‐emission industries. The share of the city labor force is
greater than the share of the county labor force in:
Air Transportation 118 percent greater share
Legal Services 74 percent greater share
Public Administration 60 percent greater share
Electric Power Generation and Transmission 40 percent greater share
Accounting 38 percent greater share
Table 3.4: City of Los Angeles Industry Rankings

43
Industry Group Title (NAICS)
Em
ploy
men
t 20
11
Ann
ual A
vg. W
age,
20
11 $
Avg
. W
age
Qui
ntile
R
anki
ng
Est
ablis
hmen
t D
irect
MT
of
GH
Gs
Per
Job
201
1
Cus
tom
er G
asol
ine
MT
of G
HG
s P
er
Job
2011
Com
bine
d M
etric
T
ons
of G
HG
s P
er
Job
In 2
011
GH
G Q
uint
ile
Ran
king
Agriculture, Forestry (11) 1,710 $30,953 2 43.38 0.00 43.38 1
Mining, Petroleum Extraction (21) 1,277 $273,105 5 217.91 0.00 217.91 1
Electric Power Gen. & Trans. (2211) 9,193 $109,356 5 1,439.43 0.00 1,439.43 1
Natural Gas Distribution (2212) 2,150 $97,657 5 393.89 0.00 393.89 1
Water, Sewage & Other Systems (2213) 2,285 $87,091 5 222.42 0.00 222.42 1
Construction (23) 35,990 $48,517 3 0.08 0.00 0.08 5
Food & Apparel Manufacturing (31) 36,857 $35,860 2 3.24 0.00 3.24 3
Bakeries (3118) 5,485 $32,090 2 3.48 1.13 4.61 2
Wood, Chem, Plastic, Cement Mfg. (32) 18,066 $49,091 3 9.44 0.00 9.44 2
Petroleum Refining (324) 1,397 $120,940 5 15,112.11 0.00 15,112.11 1
Metal & Other Durable Mfg. (33) 44,737 $63,077 4 1.70 0.00 1.70 4
Wholesale Trade (42) 68,661 $52,939 3 0.11 0.00 0.11 5
Retail Trade (44-45) 137,368 $31,712 2 0.14 7.12 7.27 2
Air Transportation (481) 15,780 $62,275 4 1,442.02 2.16 1,444.18 1
Water Transportation (483) 923 $61,559 4 76.18 0.42 76.60 1
Truck Transportation (484) 5,099 $38,205 2 343.18 0.00 343.18 1
Passenger Transit (485) 8,966 $42,689 2 126.82 0.39 127.21 1
Pipeline Transportation (486) 173 $88,814 5 136.52 0.00 136.52 1
Sightseeing Transportation (487) 289 $27,166 1 10.40 0.63 11.02 1
Support Activities for Transp. (488) 18,901 $51,765 3 6.31 0.03 6.35 2
Postal Service (491) 6,850 $60,404 4 2.38 3.91 6.29 2
Couriers (492) 9,785 $47,916 3 210.86 3.75 214.61 1
Warehousing (493) 1,981 $53,182 3 3.89 0.00 3.89 2
Motion Picture & Video (5121) 30,440 $130,686 5 0.01 0.67 0.68 4
Information, ex. Motion Picture & Video (51) 36,619 $95,072 5 0.11 0.51 0.63 4
Finance & Insurance (52) 63,800 $122,693 5 0.05 3.71 3.76 2
Rental & Leasing (53) 33,781 $55,113 3 0.26 0.98 1.23 4
Legal Services (5411) 33,122 $112,388 5 0.07 0.27 0.34 5
Accounting (5412) 22,352 $69,098 4 0.07 0.17 0.24 5
Arch. & Engineering Srv. (5413) 9,642 $84,021 5 0.08 0.24 0.32 5
Specialized Design Srv (5414) 3,420 $66,957 4 0.05 0.06 0.11 5
Veterinary & Other Prof Srv. (5419) 5,975 $55,719 4 0.13 0.99 1.12 4
Other Prof., Sci., & Tech. Svc. (54) 46,900 $86,046 5 0.12 0.00 0.12 5
Holding Companies (55) 19,514 $101,948 5 0.00 0.00 0.00 5
Employment Services (5613) 24,679 $34,940 2 0.04 0.23 0.28 5
Document Copying & Mail Srv. (5614) 7,219 $35,767 2 0.13 2.03 2.16 4
Travel Agencies (5615) 3,284 $58,813 4 3.36 0.27 3.63 2

44
Industry Group Title (NAICS)
Em
ploy
men
t 20
11
Ann
ual A
vg. W
age,
20
11 $
Avg
. W
age
Qui
ntile
R
anki
ng
Est
ablis
hmen
t D
irect
MT
of
GH
Gs
Per
Job
201
1
Cus
tom
er G
asol
ine
MT
of G
HG
s P
er
Job
2011
Com
bine
d M
etric
T
ons
of G
HG
s P
er
Job
In 2
011
GH
G Q
uint
ile
Ran
king
Other Admin. Support & Waste Mgmnt. (56) 52,486 $36,143 2 1.82 0.13 1.95 4
Educational Services (61) 159,584 $53,930 3 1.10 1.17 2.27 3
Ambulatory Health Care (621) 68,923 $56,917 4 0.48 1.87 2.35 3
Hospitals (622) 62,755 $67,529 4 0.49 1.13 1.62 4
Nursing Care Facilities (623) 26,562 $32,594 2 2.10 0.96 3.06 3
Social Assistance (624) 34,977 $37,417 2 0.55 0.76 1.31 4
Arts, Entertainment, & Rec. (71) 34,233 $105,451 5 0.22 1.70 1.92 4
Hotels (721) 16,892 $31,462 2 4.01 2.30 6.31 2
Restaurants & Bars (722) 113,776 $18,829 1 2.10 13.12 15.21 1
Other Services (81) 118,868 $27,086 1 0.95 1.13 2.07 4
Public Administration (92) 99,748 $78,741 4 16.19 1.51 17.70 1
Total 1,572,622 $57,512 4 42.62 2.40 45.02 1
Sources: California Employment Development Department; California MRIO-LCA model; California Energy Commission; IMPLAN; U.S. EIO-LCA model; SCAG; California Emissions Estimator Model; California Department of Motor Vehicles; California Air Resource Board; Argonne National Laboratory.
3.2.5 San Fernando Valley Industry Rankings
The San Fernando Valley sub‐region, which also includes the Santa Clarita Valley, Burbank and
Glendale, has lower average wages than the county ($51,266 vs. $53,434) and also lower average
emissions per job (10.20 vs. 35.06 metric tons), resulting in an overall profile of somewhat less
social sustainability and somewhat greater environmental sustainability in its industry base.
The San Fernando Valley’s sustainability rankings are shown in Table 3.5.
3.2.5.1 Wage Profile
Average wages in the San Fernando Valley are shaped by a much higher concentration of
motion picture and video jobs, a somewhat higher concentration of construction, accounting
and durable manufacturing jobs, and a lower share of education, wholesale, hospital, hotel and
government jobs. The industry distribution of the San Fernando Valley labor force differs from
the industry distribution of the county labor force in:
Motion Picture and Video (wage tier 5) 242 percent larger share
Construction (wage tier 2) 36 percent larger share
Accounting (wage tier 5) 22 percent larger share
Metal and Other Durable Mfg. (wage tier 4) 17 percent larger share
Educational Services (wage tier 2) 23 percent smaller share
Wholesale Trade (wage tier 4) 29 percent smaller share
Hospitals (wage tier 4) 31 percent smaller share
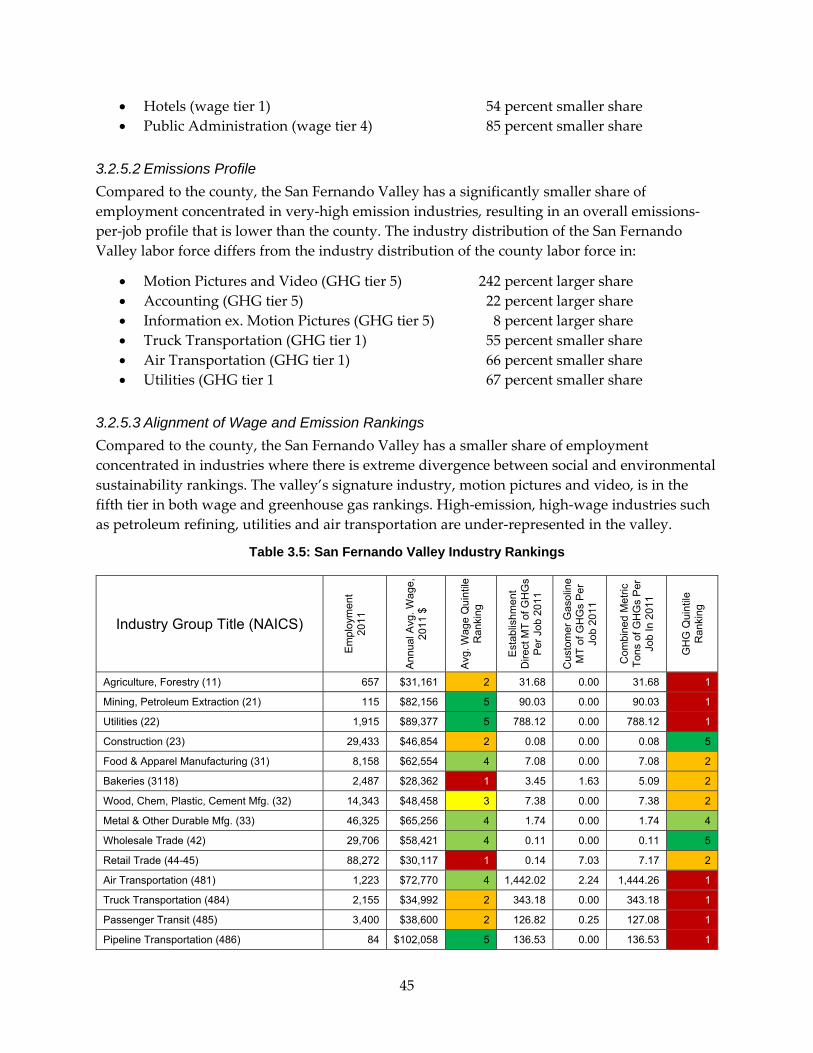
45
Hotels (wage tier 1) 54 percent smaller share
Public Administration (wage tier 4) 85 percent smaller share
3.2.5.2 Emissions Profile
Compared to the county, the San Fernando Valley has a significantly smaller share of
employment concentrated in very‐high emission industries, resulting in an overall emissions‐
per‐job profile that is lower than the county. The industry distribution of the San Fernando
Valley labor force differs from the industry distribution of the county labor force in:
Motion Pictures and Video (GHG tier 5) 242 percent larger share
Accounting (GHG tier 5) 22 percent larger share
Information ex. Motion Pictures (GHG tier 5) 8 percent larger share
Truck Transportation (GHG tier 1) 55 percent smaller share
Air Transportation (GHG tier 1) 66 percent smaller share
Utilities (GHG tier 1 67 percent smaller share
3.2.5.3 Alignment of Wage and Emission Rankings
Compared to the county, the San Fernando Valley has a smaller share of employment
concentrated in industries where there is extreme divergence between social and environmental
sustainability rankings. The valley’s signature industry, motion pictures and video, is in the
fifth tier in both wage and greenhouse gas rankings. High‐emission, high‐wage industries such
as petroleum refining, utilities and air transportation are under‐represented in the valley.
Table 3.5: San Fernando Valley Industry Rankings
Industry Group Title (NAICS)
Em
ploy
men
t 20
11
Ann
ual A
vg. W
age,
20
11 $
Avg
. Wag
e Q
uint
ile
Ran
king
Est
ablis
hmen
t D
irect
MT
of
GH
Gs
Per
Job
201
1
Cus
tom
er G
asol
ine
MT
of G
HG
s P
er
Job
2011
Com
bine
d M
etric
T
ons
of G
HG
s P
er
Job
In 2
011
GH
G Q
uint
ile
Ran
king
Agriculture, Forestry (11) 657 $31,161 2 31.68 0.00 31.68 1
Mining, Petroleum Extraction (21) 115 $82,156 5 90.03 0.00 90.03 1
Utilities (22) 1,915 $89,377 5 788.12 0.00 788.12 1
Construction (23) 29,433 $46,854 2 0.08 0.00 0.08 5
Food & Apparel Manufacturing (31) 8,158 $62,554 4 7.08 0.00 7.08 2
Bakeries (3118) 2,487 $28,362 1 3.45 1.63 5.09 2
Wood, Chem, Plastic, Cement Mfg. (32) 14,343 $48,458 3 7.38 0.00 7.38 2
Metal & Other Durable Mfg. (33) 46,325 $65,256 4 1.74 0.00 1.74 4
Wholesale Trade (42) 29,706 $58,421 4 0.11 0.00 0.11 5
Retail Trade (44-45) 88,272 $30,117 1 0.14 7.03 7.17 2
Air Transportation (481) 1,223 $72,770 4 1,442.02 2.24 1,444.26 1
Truck Transportation (484) 2,155 $34,992 2 343.18 0.00 343.18 1
Passenger Transit (485) 3,400 $38,600 2 126.82 0.25 127.08 1
Pipeline Transportation (486) 84 $102,058 5 136.53 0.00 136.53 1

46
Industry Group Title (NAICS)
Em
ploy
men
t 20
11
Ann
ual A
vg. W
age,
20
11 $
Avg
. W
age
Qui
ntile
R
anki
ng
Est
ablis
hmen
t D
irect
MT
of
GH
Gs
Per
Job
201
1
Cus
tom
er G
asol
ine
MT
of G
HG
s P
er
Job
2011
Com
bine
d M
etric
T
ons
of G
HG
s P
er
Job
In 2
011
GH
G Q
uint
ile
Ran
king
Sightseeing Transportation (487) 367 $36,412 2 12.30 0.63 12.93 1
Support Activities for Transp. (488) 2,198 $50,325 3 11.00 0.23 11.22 1
Postal Service (491) 3,854 $59,802 4 2.38 3.91 6.29 2
Couriers (492) 2,884 $41,247 2 210.86 3.75 214.61 1
Warehousing (493) 769 $49,250 3 3.89 0.00 3.89 2
Motion Picture & Video (5121) 81,224 $80,378 5 0.01 0.11 0.12 5
Information, ex. Motion Pictures & Video (51) 17,059 $96,902 5 0.12 0.11 0.23 5
Finance & Insurance (52) 33,167 $73,661 4 0.05 2.91 2.95 3
Rental & Leasing (53) 17,136 $47,901 3 0.29 1.20 1.49 4
Legal Services (5411) 7,554 $72,047 4 0.07 0.25 0.34 5
Accounting (5412) 9,960 $82,055 5 0.07 0.16 0.24 5
Arch. & Engineering Srv. (5413) 3,900 $64,250 4 0.08 0.21 0.29 5
Specialized Design Srv (5414) 1,045 $64,867 4 0.05 0.05 0.10 5
Veterinary & Other Prof Srv. (5419) 4,072 $42,765 2 0.13 0.99 1.12 4
Other Prof., Sci., & Tech. Svc. (54) 21,443 $71,900 4 0.10 0.00 0.10 5
Holding Companies (55) 6,796 $87,690 5 0.00 0.00 0.00 5
Employment Services (5613) 13,458 $29,107 1 0.04 0.26 0.30 5
Document Copying & Mail Srv. (5614) 3,441 $38,445 2 0.13 2.06 2.20 4
Travel Agencies (5615) 2,039 $52,108 3 3.36 0.27 3.63 2
Other Admin. Support & Waste Mgmnt. (56) 33,655 $36,013 2 2.23 0.19 2.42 3
Educational Services (61) 55,079 $45,270 2 0.80 1.31 2.11 4
Ambulatory Health Care (621) 48,418 $53,615 3 0.52 1.85 2.37 3
Hospitals (622) 20,533 $63,650 4 0.49 1.13 1.62 4
Nursing Care Facilities (623) 15,334 $30,729 2 2.10 0.96 3.06 3
Social Assistance (624) 12,744 $26,406 1 0.51 0.96 1.46 4
Arts, Entertainment, & Rec. (71) 16,186 $119,322 5 0.18 1.34 1.52 4
Hotels (721) 3,739 $26,987 1 4.00 2.23 6.23 2
Restaurants & Bars (722) 55,456 $17,271 1 2.10 13.77 15.87 1
Other Services (81) 57,114 $20,818 1 0.70 1.25 1.95 4
Public Administration (92) 4,751 $74,223 4 16.62 1.40 18.02 1
Total 789,782 $51,266 3 7.79 2.41 10.20 1
Sources: California Employment Development Department; California MRIO-LCA model; California Energy Commission; IMPLAN; U.S. EIO-LCA model; SCAG; California Emissions Estimator Model; California Department of Motor Vehicles; California Air Resource Board; Argonne National Laboratory.
3.2.6 North Los Angeles County Industry Rankings
North Los Angeles County, which is comprised of the Antelope Valley, has much lower average
wages than the county ($40,241 vs. $53,434) and also much lower average emissions per job

47
(15.03 vs. 35.06 metric tons), resulting in an overall profile of less social sustainability but
greater environmental sustainability in its industry base. The North County’s sustainability
rankings are shown in Table 3.6.
3.2.6.1 Wage Profile
Average wages in the North County are shaped by low representation in knowledge‐ and
capital‐intensive industries, and high representation in warehousing, durable manufacturing
and retail industries. The industry distribution of the North County labor force differs from the
industry distribution of the county labor force in:
Warehousing (wage tier 2) 275 percent larger share
Metal and Other Durable Mfg. (wage tier 4) 96 percent larger share
Retail trade (wage tier 1) 65 percent larger share
Educational Services (wage tier 2) 47 percent larger share
Ambulatory Health Care (wage tier 4) 45 percent larger share
Construction (wage tier 2) 41 percent larger share
3.2.6.2 Emissions Profile
Compared to the county, the North County has a significantly larger share of employment
concentrated in low‐emission industries, and almost no employment in very‐high‐emission
industries, resulting in an overall emissions‐per‐job profile that is significantly lower. The
industry distribution of the North County labor force differs from the industry distribution of
the county labor force in:
Metal and Other Durable Mfg. (GHG tier 4) 96 percent larger share
Restaurants and Bars (GHG tier 1) 20 percent larger share
Truck Transportation (GHG tier 1) 39 percent smaller share
3.2.6.3 Alignment of Wage and Emission Rankings
Compared to the county, the North County has a smaller share of employment concentrated in
industries where there is extreme divergence between social and environmental sustainability
rankings. The North County’s signature industries, warehousing, durable manufacturing and
retail trade, each have similar wage and greenhouse gas rankings. Very‐high‐emission, high
wage industries such as petroleum refining, electric power generation and air transportation
have almost no presence in the North County.
Table 3.6: North Los Angeles County Industry Rankings

48
Industry Group Title (NAICS)
Em
ploy
men
t 201
1
Ann
ual A
vg. W
age,
20
11 $
Avg
. W
age
Qui
ntile
R
anki
ng
Est
ablis
hmen
t D
irect
MT
of
GH
Gs
Per
Job
201
1
Cus
tom
er G
asol
ine
MT
of G
HG
s P
er
Job
2011
Com
bine
d M
etric
T
ons
of G
HG
s P
er
Job
In 2
011
GH
G Q
uint
ile
Ran
king
Agriculture, Forestry (11) 384 $25,278 1 64.02 0.00 64.02 1
Utilities (22) 609 $86,103 5 741.58 0.00 741.58 1
Construction (23) 2,879 $46,154 2 0.08 0.00 0.08 5
Food & Apparel Manufacturing (31) 111 $33,530 2 3.47 0.00 3.47 3
Bakeries (3118) 20 $45,283 2 3.44 2.57 6.01 2
Wood, Chem, Plastic, Cement Mfg. (32) 576 $37,034 2 1.98 0.00 1.98 4
Metal & Other Durable Mfg. (33) 7,286 $89,259 5 0.97 0.00 0.97 4
Wholesale Trade (42) 1,061 $39,428 2 0.11 0.00 0.11 5
Retail Trade (44-45) 12,345 $23,364 1 0.15 7.50 7.64 2
Truck Transportation (484) 296 $28,914 1 343.18 0.00 343.18 1
Passenger Transit (485) 553 $28,252 1 126.82 0.25 127.07 1
Support Activities for Transp. (488) 129 $34,878 2 11.58 0.11 11.69 1
Postal Service (491) 303 $57,019 4 2.38 3.91 6.29 2
Couriers (492) 273 $37,953 2 210.86 3.75 214.61 1
Warehousing (493) 1,140 $42,477 2 3.89 0.00 3.89 2
Motion Picture & Video (5121) 179 $15,931 1 0.01 11.03 11.04 1
Information, ex. Motion Pictures & Video (51) 573 $48,917 3 0.11 0.00 0.11 5
Finance & Insurance (52) 3,582 $35,514 2 0.06 4.13 4.19 2
Rental & Leasing (53) 827 $29,912 1 0.21 0.84 1.05 4
Legal Services (5411) 215 $52,433 3 0.07 0.27 0.34 5
Accounting (5412) 261 $24,274 1 0.07 0.26 0.33 5
Arch. & Engineering Srv. (5413) 244 $60,290 4 0.08 0.23 0.31 5
Veterinary & Other Prof Srv. (5419) 389 $23,926 1 0.13 1.23 1.36 4
Other Prof., Sci., & Tech. Svc. (54) 621 $48,197 3 0.13 0.00 0.13 5
Holding Companies (55) 135 $58,879 4 0.00 0.00 0.00 5
Employment Services (5613) 210 $22,962 1 0.04 0.27 0.31 5
Document Copying & Mail Srv. (5614) 453 $27,393 1 0.13 1.86 2.00 4
Travel Agencies (5615) 57 $38,529 2 3.36 0.27 3.63 2
Other Admin. Support & Waste Mgmnt. (56) 1,390 $27,292 1 6.16 0.52 6.68 2
Educational Services (61) 9,872 $45,175 2 0.67 1.35 2.02 4
Ambulatory Health Care (621) 4,979 $57,044 4 0.44 1.92 2.35 3
Hospitals (622) 3,273 $61,304 4 0.49 1.13 1.62 4
Nursing Care Facilities (623) 1,397 $28,152 1 2.10 0.97 3.07 3
Social Assistance (624) 1,403 $25,181 1 0.54 0.83 1.37 4
Arts, Entertainment, & Rec. (71) 801 $20,420 1 0.23 2.57 2.80 3
Hotels (721) 948 $24,210 1 3.86 2.42 6.28 2
Restaurants & Bars (722) 6,672 $14,996 1 2.10 17.28 19.38 1
Other Services (81) 4,651 $17,470 1 0.53 1.08 1.61 4

49
Industry Group Title (NAICS)
Em
ploy
men
t 201
1
Ann
ual A
vg. W
age,
20
11 $
Avg
. W
age
Qui
ntile
R
anki
ng
Est
ablis
hmen
t D
irect
MT
of
GH
Gs
Per
Job
201
1
Cus
tom
er G
asol
ine
MT
of G
HG
s P
er
Job
2011
Com
bine
d M
etric
T
ons
of G
HG
s P
er
Job
In 2
011
GH
G Q
uint
ile
Ran
king
Public Administration (92) 2,891 $43,937 2 12.77 0.88 13.65 1
Total 74,297 $40,241 2 11.37 3.66 15.03 1
Sources: California Employment Development Department; California MRIO-LCA model; California Energy Commission; IMPLAN; U.S. EIO-LCA model; SCAG; California Emissions Estimator Model; California Department of Motor Vehicles; California Air Resource Board; Argonne National Laboratory.
3.2.7 Los Angeles Metro Industry Rankings
The Los Angeles Metro sub‐region, which is the City of Los Angeles without the San Fernando
Valley, has higher average wages than the county ($60,982 vs. $53,434) and also higher average
emissions per job (59.31 vs. 35.06 metric tons), resulting in an overall profile that is somewhat
more socially sustainable but let environmentally sustainable than the county. Los Angeles
Metro’s sustainability rankings are shown in Table 3.7.
3.2.7.1 Wage Profile
Average wages in Los Angeles Metro are shaped by strong representation in high‐wage
industries, some of which are also high‐emission industries. The industry distribution of Los
Angeles Metro’s labor force differs from the industry distribution of the county labor force in:
Air Transportation (wage tier 4) 194 percent larger share
Public Administration (wage tier 4) 134 percent larger share
Legal Services (wage tier 5) 104 percent larger share
Utilities (wage tier 5) 58 percent larger share
Accounting (wage tier 4) 47 percent larger share
Construction (wage tier 3) 44 percent smaller share
Wood, Chem., Plastic, Cement Mfg. (wage tier 3) 51 percent smaller share
Truck Transportation (wage tier 2) 52 percent smaller share
Warehousing (wage tier 3) 65 percent smaller share
3.2.7.2 Emissions Profile
Compared to the county, Los Angeles Metro has a significantly larger share of employment
concentrated in high‐emission industries, resulting in an overall emissions‐per‐job profile that is
higher than the county. The industry distribution of Los Angeles Metro’s labor force differs
from the industry distribution of the county labor force in:
Air Transportation (GHG tier 1) 194 percent larger share
Public Administration (GHG tier 1) 134 percent larger share
Utilities (GHG tier 1) 58 percent larger share
Couriers (GHG tier 1) 37 percent larger share

50
Petroleum Refining (GHG tier 1) 19 percent larger share
3.2.7.3 Alignment of Wage and Emission Rankings
Compared to the county, Los Angeles Metro has a larger share of employment concentrated in
industries with both high wages and high emissions. The industry distribution of the city labor
force differs from the industry distribution of the county labor force in:
Air Transportation (GHG tier 1, wage tier 4) 194 percent larger share
Public Administration (GHG tier 1, wage tier 4 134 percent larger share
Utilities (GHG tier 1, wage tier 5) 58 percent larger share
Petroleum Refining (GHG tier 1, wage tier 5) 19 percent larger share
Table 3.7: Los Angeles Metro Industry Rankings
Industry Group Title (NAICS)
Em
ploy
men
t 201
1
Ann
ual A
vg. W
age,
20
11 $
Avg
. Wag
e Q
uint
ile
Ran
king
Est
ablis
hmen
t D
irect
MT
of
GH
Gs
Per
Job
201
1
Cus
tom
er G
asol
ine
MT
of G
HG
s P
er
Job
2011
Com
bine
d M
etric
T
ons
of G
HG
s P
er
Job
In 2
011
GH
G Q
uint
ile
Ran
king
Agriculture, Forestry (11) 1,347 $30,362 1 42.39 0.00 42.39 1
Mining, Petroleum Extraction (21) 1,190 $287,196 5 232.42 0.00 232.42 1
Utilities (22) 13,066 $104,758 5 1,099.88 0.00 1,099.88 1
Construction (23) 17,244 $55,426 3 0.08 0.00 0.08 5
Food & Apparel Manufacturing (31) 31,274 $32,570 2 2.67 0.00 2.67 3
Bakeries (3118) 4,343 $32,149 2 3.42 1.18 4.60 2
Wood, Chem, Plastic, Cement Mfg. (32) 8,960 $52,303 3 13.11 0.00 13.11 1
Petroleum Refining (324) 1,387 $121,182 5 15,193.21 0.00 15,193.21 1
Metal & Other Durable Mfg. (33) 14,740 $56,440 4 1.78 0.00 1.78 4
Wholesale Trade (42) 48,473 $51,215 3 0.11 0.00 0.11 5
Retail Trade (44-45) 79,769 $32,371 2 0.14 7.08 7.23 2
Air Transportation (481) 15,157 $61,467 4 1,442.02 2.16 1,444.18 1
Water Transportation (483) 923 $61,559 4 76.18 0.42 76.60 1
Truck Transportation (484) 3,471 $39,954 2 343.18 0.00 343.18 1
Passenger Transit (485) 6,148 $44,256 2 126.82 0.43 127.25 1
Pipeline Transportation (486) 120 $84,230 5 136.52 0.00 136.52 1
Sightseeing Transportation (487) 276 $24,806 1 10.64 0.63 11.27 1
Support Activities for Transp. (488) 18,132 $51,920 3 6.11 0.01 6.13 2
Postal Service (491) 5,016 $60,540 4 2.38 3.91 6.29 2
Couriers (492) 7,229 $49,811 3 210.86 3.75 214.61 1
Warehousing (493) 1,621 $53,850 3 3.89 0.00 3.89 2
Motion Picture & Video (5121) 19,788 $135,674 5 0.01 0.80 0.81 4
Information, ex. Motion Pictures & Video (51) 27,207 $95,754 5 0.11 0.68 0.78 4
Finance & Insurance (52) 40,299 $150,443 5 0.05 4.38 4.43 2

51
Industry Group Title (NAICS)
Em
ploy
men
t 201
1
Ann
ual A
vg. W
age,
20
11 $
Avg
. W
age
Qui
ntile
R
anki
ng
Est
ablis
hmen
t D
irect
MT
of
GH
Gs
Per
Job
201
1
Cus
tom
er G
asol
ine
MT
of G
HG
s P
er
Job
2011
Com
bine
d M
etric
T
ons
of G
HG
s P
er
Job
In 2
011
GH
G Q
uint
ile
Ran
king
Rental & Leasing (53) 22,283 $60,990 4 0.28 0.91 1.18 4
Legal Services (5411) 27,730 $119,882 5 0.07 0.27 0.34 5
Accounting (5412) 17,008 $71,154 4 0.07 0.15 0.22 5
Arch. & Engineering Srv. (5413) 7,187 $90,779 5 0.08 0.26 0.33 5
Specialized Design Srv (5414) 2,690 $68,266 4 0.05 0.06 0.11 5
Veterinary & Other Prof Srv. (5419) 3,242 $67,472 4 0.13 0.96 1.09 4
Other Prof., Sci., & Tech. Svc. (54) 33,725 $91,748 5 0.12 0.00 0.12 5
Holding Companies (55) 14,935 $107,446 5 0.00 0.00 0.00 5
Employment Services (5613) 17,055 $37,809 2 0.04 0.22 0.26 5
Document Copying & Mail Srv. (5614) 4,961 $35,591 2 0.13 2.02 2.15 4
Travel Agencies (5615) 2,065 $61,918 4 3.36 0.27 3.63 2
Other Admin. Support & Waste Mgmnt. (56) 32,893 $35,614 2 1.01 0.05 1.06 4
Educational Services (61) 122,717 $56,204 4 1.19 1.14 2.32 3
Ambulatory Health Care (621) 36,913 $59,361 4 0.48 1.93 2.41 3
Hospitals (622) 50,973 $68,035 4 0.49 1.13 1.62 4
Nursing Care Facilities (623) 14,667 $33,485 2 2.10 0.95 3.06 3
Social Assistance (624) 25,678 $41,152 2 0.56 0.73 1.29 4
Arts, Entertainment, & Rec. (71) 27,802 $95,369 5 0.24 1.77 2.00 4
Hotels (721) 14,703 $31,775 2 4.01 2.29 6.31 2
Restaurants & Bars (722) 79,791 $19,470 1 2.10 12.57 14.67 1
Other Services (81) 85,139 $28,939 1 1.03 1.07 2.10 4
Public Administration (92) 103,951 $78,268 4 15.87 1.52 17.39 1
Total 1,121,339 $60,982 4 57.03 2.29 59.31 1
Sources: California Employment Development Department; California MRIO-LCA model; California Energy Commission; IMPLAN; U.S. EIO-LCA model; SCAG; California Emissions Estimator Model; California Department of Motor Vehicles; California Air Resource Board; Argonne National Laboratory.
3.2.8 Arroyo Verdugo Industry Rankings
The Arroyo Verdugo sub‐region, which consists of La Crescenta‐Montrose and La Canada
Flintridge, has much lower average wages than the county ($39,547 vs. $53,434) and also much
lower average emissions per job (8.86 vs. 35.06 metric tons), resulting in an overall profile of
somewhat less social sustainability and somewhat greater environmental sustainability in its
industry base. Arroyo Verdugo’s sustainability rankings are shown in Table 3.8.

52
3.2.8.1 Wage Profile
The industry structure of Arroyo Verdugo is concentrated in four industries that pay average or
below average wages. The industry distribution of Arroyo Verdugo’s labor force differs from
the industry distribution of the county labor force in:
Educational Services (wage tier 3) 111 percent larger share
Restaurants and Bars (wage tier 1) 91 percent larger share
Other (personal and repair) Services (wage tier 1) 47 percent larger share
Retail Trade (wage tier 1) 45 percent larger share
3.2.8.2 Emissions Profile
There is very little presence of extractive, transportation or utility industries in Arroyo Verdugo,
resulting in an overall emissions‐per‐job profile that is very low compared to the county.
3.2.8.3 Alignment of Wage and Emission Rankings
Compared to the county, the Arroyo Verdugo has a smaller share of employment concentrated
in industries where there is extreme divergence between social and environmental
sustainability rankings. Very‐high‐emission, high‐wage industries have almost no presence in
Arroyo Verdugo.
Table 3.8: Arroyo Verdugo Industry Rankings
Industry Group Title (NAICS)
Em
ploy
men
t 201
1
Ann
ual A
vg. W
age,
20
11 $
Avg
. Wag
e Q
uint
ile
Ran
king
Est
ablis
hmen
t D
irect
MT
of
GH
Gs
Per
Job
201
1
Cus
tom
er G
asol
ine
MT
of G
HG
s P
er
Job
2011
Com
bine
d M
etric
T
ons
of G
HG
s P
er
Job
In 2
011
GH
G Q
uint
ile
Ran
king
Utilities (22) 63 $76,902 4 258.59 0.00 258.59 1
Construction (23) 409 $40,972 2 0.08 0.00 0.08 5
Food & Apparel Manufacturing (31) 32 $18,349 1 0.04 0.00 0.04 5
Wood, Chem, Plastic, Cement Mfg. (32) 135 $105,608 5 15.26 0.00 15.26 1
Metal & Other Durable Mfg. (33) 34 $44,488 2 0.88 0.00 0.88 4
Wholesale Trade (42) 188 $67,337 4 0.11 0.00 0.11 5
Retail Trade (44-45) 1,330 $23,830 1 0.14 6.74 6.89 2
Truck Transportation (484) 11 $31,155 2 343.18 0.00 343.18 1
Passenger Transit (485) 9 $24,213 1 126.82 0.00 126.82 1
Support Activities for Transp. (488) 105 $87,918 5 12.56 0.00 12.56 1
Motion Picture & Video (5121) 41 $71,655 4 0.01 7.63 7.64 2
Information, ex. Motion Pictures & Video (51) 127 $55,175 3 0.12 0.00 0.12 5
Finance & Insurance (52) 326 $58,100 4 0.07 6.33 6.40 2
Rental & Leasing (53) 196 $45,509 2 0.21 1.52 1.72 4
Accounting (5412) 50 $41,374 2 0.07 0.27 0.34 5
Arch. & Engineering Srv. (5413) 90 $41,256 2 0.08 0.25 0.33 5

53
Industry Group Title (NAICS)
Em
ploy
men
t 201
1
Ann
ual A
vg. W
age,
20
11 $
Avg
. W
age
Qui
ntile
R
anki
ng
Est
ablis
hmen
t D
irect
MT
of
GH
Gs
Per
Job
201
1
Cus
tom
er G
asol
ine
MT
of G
HG
s P
er
Job
2011
Com
bine
d M
etric
T
ons
of G
HG
s P
er
Job
In 2
011
GH
G Q
uint
ile
Ran
king
Specialized Design Srv (5414) 25 $58,984 4 0.05 0.03 0.08 5
Veterinary & Other Prof Srv. (5419) 50 $35,381 2 0.12 2.15 2.27 3
Other Prof., Sci., & Tech. Svc. (54) 257 $53,127 3 0.13 0.00 0.13 5
Holding Companies (55) 174 $66,283 4 0.00 0.00 0.00 5
Document Copying & Mail Srv. (5614) 25 $38,259 2 0.13 2.58 2.72 3
Travel Agencies (5615) 49 $48,598 3 3.36 0.27 3.63 2
Other Admin. Support & Waste Mgmnt. (56) 101 $38,069 2 0.18 0.10 0.28 5
Educational Services (61) 1,733 $50,486 3 0.45 1.36 1.80 4
Ambulatory Health Care (621) 454 $62,698 4 0.37 2.02 2.39 3
Nursing Care Facilities (623) 64 $17,497 1 2.10 0.63 2.74 3
Social Assistance (624) 319 $23,199 1 0.34 1.72 2.05 4
Arts, Entertainment, & Rec. (71) 259 $49,994 3 0.36 2.61 2.97 3
Restaurants & Bars (722) 1,301 $16,617 1 2.10 21.47 23.57 1
Other Services (81) 886 $17,455 1 1.66 2.75 4.41 2
Total 9,108 $39,547 2 3.68 5.19 8.86 2
Sources: California Employment Development Department; California MRIO-LCA model; California Energy Commission; IMPLAN; U.S. EIO-LCA model; SCAG; California Emissions Estimator Model; California Department of Motor Vehicles; California Air Resource Board; Argonne National Laboratory.
3.2.9 San Gabriel Valley Industry Rankings
The San Gabriel Valley has lower average wages than the county ($44,434 vs. $53,434) and also
lower average emissions per job (21.41 vs. 35.06 metric tons), resulting in an overall profile of
somewhat less social sustainability and somewhat greater environmental sustainability in its
industry base. The valley’s sustainability rankings are shown in Table 3.9.
3.2.9.1 Wage Profile
Average wages in the San Gabriel Valley’s large economy are shaped by a mix of strongly
represented industries with differing of income levels. The overall outcome is an average
income that is nearly ten percent lower than in the county. The industry distribution of the San
Gabriel Valley labor force differs from the industry distribution of the county labor force in:
Utilities (wage tier 5) 89 percent larger share
Warehousing (wage tier 2) 59 percent larger share
Nursing Care Facilities (wage tier 1) 58 percent larger share
Agriculture, Forestry (wage tier 1) 45 percent larger share
Holding Companies (wage tier 5) 36 percent larger share
Wood, Chem, Plastic, Cement Mfg. (wage tier 2) 31 percent larger share
Finance and Insurance (wage tier 4) 30 percent larger share

54
Construction (wage tier 4) 29 percent larger share
Wholesale Trade (wage tier 3) 24 percent larger share
Architecture and Engineering Services (wage tier 5) 19 percent larger share
Ambulatory Health Care (wage tier 3) 17 percent larger share
Truck Transportation (wage tier 2) 15 percent larger share
Retail Trade (wage tier 1) 14 percent larger share
3.2.9.2 Emissions Profile
Compared to the county, the San Gabriel Valley has a significantly smaller share of employment
concentrated in very‐high‐emission industries, resulting in an overall emissions‐per‐job profile
that is lower than the county. The industry distribution of the valley labor force differs from the
industry distribution of the county labor force in:
Air Transportation (GHG tier 1) 98 percent smaller share
Petroleum Refining (GHG tier 1) 83 percent smaller share
Public Administration (GHG tier 1) 54 percent smaller share
Couriers (GHG tier 1) 40 percent smaller share
Hotels (GHG tier 2) 30 percent smaller share
3.2.9.3 Alignment of Wage and Emission Rankings
Compared to the county, the San Gabriel Valley has a smaller share of employment
concentrated in industries where there is extreme divergence between social and environmental
sustainability rankings. The only significant exception is utilities, which while strongly
represented in the valley, accounts for only one percent of total employment.
Table 3.9: San Gabriel Valley Industry Rankings
Industry Group Title (NAICS)
Em
ploy
men
t 201
1
Ann
ual A
vg. W
age,
20
11 $
Avg
. Wag
e Q
uint
ile
Ran
king
Est
ablis
hmen
t D
irect
MT
of
GH
Gs
Per
Job
201
1
Cus
tom
er G
asol
ine
MT
of G
HG
s P
er
Job
2011
Com
bine
d M
etric
T
ons
of G
HG
s P
er
Job
In 2
011
GH
G Q
uint
ile
Ran
king
Agriculture, Forestry (11) 1,311 $27,226 1 29.40 0.00 29.40 1
Mining, Petroleum Extraction (21) 216 $75,022 4 2.88 0.00 2.88 3
Utilities (22) 8,624 $97,428 5 879.98 0.00 879.98 1
Construction (23) 21,960 $56,313 4 0.07 0.00 0.07 5
Food & Apparel Manufacturing (31) 14,011 $40,449 2 5.87 0.00 5.87 2
Bakeries (3118) 1,729 $25,934 1 3.74 1.07 4.82 2
Wood, Chem, Plastic, Cement Mfg. (32) 13,222 $43,280 2 11.02 0.00 11.02 1
Petroleum Refining (324) 111 $82,882 5 3,497.08 0.00 3,497.08 1
Metal & Other Durable Mfg. (33) 28,543 $54,969 3 3.40 0.00 3.40 3
Wholesale Trade (42) 40,858 $48,722 3 0.11 0.00 0.11 5
Retail Trade (44-45) 71,145 $27,920 1 0.15 7.21 7.36 2
Air Transportation (481) 48 $47,950 3 1,441.92 2.22 1,444.15 1

55
Industry Group Title (NAICS)
Em
ploy
men
t 201
1
Ann
ual A
vg. W
age,
20
11 $
Avg
. W
age
Qui
ntile
R
anki
ng
Est
ablis
hmen
t D
irect
MT
of
GH
Gs
Per
Job
201
1
Cus
tom
er G
asol
ine
MT
of G
HG
s P
er
Job
2011
Com
bine
d M
etric
T
ons
of G
HG
s P
er
Job
In 2
011
GH
G Q
uint
ile
Ran
king
Water Transportation (483) 97 $41,812 2 76.19 0.03 76.21 1
Truck Transportation (484) 4,615 $37,640 2 343.18 0.00 343.18 1
Passenger Transit (485) 3,599 $32,599 2 126.82 0.25 127.07 1
Sightseeing Transportation (487) 90 $20,031 1 12.56 0.63 13.19 1
Support Activities for Transp. (488) 2,359 $42,880 2 12.56 0.04 12.60 1
Postal Service (491) 3,288 $60,824 4 2.38 3.91 6.29 2
Couriers (492) 1,739 $43,839 2 210.86 3.75 214.61 1
Warehousing (493) 4,029 $44,090 2 3.89 0.00 3.89 2
Motion Picture & Video (5121) 1,165 $39,235 2 0.01 7.05 7.06 2
Information, ex. Motion Pictures & Video (51) 8,744 $71,188 4 0.10 0.49 0.59 4
Finance & Insurance (52) 29,118 $66,640 4 0.06 5.37 5.43 2
Rental & Leasing (53) 8,846 $38,357 2 0.21 1.09 1.30 4
Legal Services (5411) 3,645 $64,574 4 0.07 0.27 0.34 5
Accounting (5412) 4,572 $43,530 2 0.07 0.24 0.31 5
Arch. & Engineering Srv. (5413) 6,769 $88,529 5 0.08 0.25 0.33 5
Specialized Design Srv (5414) 1,253 $53,337 3 0.05 0.03 0.08 5
Veterinary & Other Prof Srv. (5419) 1,682 $35,389 2 0.13 1.64 1.77 4
Other Prof., Sci., & Tech. Svc. (54) 16,887 $80,407 5 0.24 0.00 0.24 5
Holding Companies (55) 11,732 $97,871 5 0.00 0.00 0.00 5
Employment Services (5613) 14,036 $25,836 1 0.04 0.23 0.27 5
Document Copying & Mail Srv. (5614) 2,005 $34,959 2 0.13 3.31 3.45 3
Travel Agencies (5615) 1,399 $33,070 2 3.36 0.27 3.63 2
Other Admin. Support & Waste Mgmnt. (56) 18,737 $37,002 2 4.70 0.24 4.94 2
Educational Services (61) 62,695 $46,471 2 0.98 1.26 2.24 3
Ambulatory Health Care (621) 33,354 $53,848 3 0.49 1.80 2.29 3
Hospitals (622) 24,453 $62,139 4 0.49 1.13 1.62 4
Nursing Care Facilities (623) 17,497 $28,425 1 2.10 0.91 3.01 3
Social Assistance (624) 11,877 $26,304 1 0.49 1.02 1.52 4
Arts, Entertainment, & Rec. (71) 8,766 $34,793 2 0.21 2.04 2.25 3
Hotels (721) 4,478 $26,274 1 4.00 2.30 6.30 2
Restaurants & Bars (722) 49,582 $15,804 1 2.10 13.65 15.75 1
Other Services (81) 38,233 $22,647 1 0.92 1.41 2.33 3
Public Administration (92) 11,252 $65,047 4 15.29 1.45 16.74 1
Total 618,163 $44,434 2 18.64 2.77 21.41 1
Sources: California Employment Development Department; California MRIO-LCA model; California Energy Commission; IMPLAN; U.S. EIO-LCA model; SCAG; California Emissions Estimator Model; California Department of Motor Vehicles; California Air Resource Board; Argonne National Laboratory.

56
3.2.10 Westside Cities Industry Rankings
The Westside Cities (which do not include the western portion of the City of Los Angeles) have
higher average wages than the county ($72,979 vs. $53,434) and much lower average emissions
per job (11.73 vs. 35.06 metric tons), resulting in an overall profile of greater social and
environmental sustainability in its industry base. The Westside City’s sustainability rankings
are shown in Table 3.10.
3.2.10.1 Wage Profile
Average wages in the Westside Cities are shaped by a much higher concentration of
knowledge‐intensive industries as well as leisure and recreation industries. The industry
distribution of the Westside labor force differs from the industry distribution of the county
labor force in:
Hotels (wage tier 2) 288 percent greater share
Specialized Design Services (wage tier 5) 162 percent greater share
Motion Picture and Video (wage tier 5) 111 percent greater share
Information, ex. Motion Pictures (wage tier 5) 81 percent greater share
Hospitals (wage tier 5) 79 percent greater share
Other Prof., Sci., and Tech. Services (wage tier 5) 77 percent greater share
Rental and Leasing (wage tier 4) 74 percent greater share
Accounting (wage tier 4) 63 percent greater share
Arts, Entertainment, and Recreation (wage tier 5) 56 percent greater share
Legal Services (wage tier 5) 46 percent greater share
Veterinary and Other Prof Services (wage tier 4) 43 percent greater share
Restaurants and Bars (wage tier 1) 36 percent greater share
3.2.10.2 Emissions Profile
Compared to the county, the Westside Cities have a significantly smaller share of employment
concentrated in very‐high‐emission industries, resulting in an overall emissions‐per‐job profile
that is much lower than the county. The industry distribution of the Westside labor force differs
from the industry distribution of the county labor force in:
Truck Transportation (GHG tier 1) 97 percent smaller share
Wood, Chem, Plastic, Cement Mfg. (GHG tier 1) 80 percent smaller share
Utilities (GHG tier 1) 68 percent smaller share
Couriers (GHG tier 1) 62 percent smaller share
Mining, Petroleum Extraction (GHG tier 1) 59 percent smaller share
Public Administration (GHG tier 1) 44 percent smaller share
Air Transportation (GHG tier 1) 28 percent smaller share

57
3.2.10.3 Alignment of Wage and Emission Rankings
Compared to the county, the Westside Cities have a smaller share of employment concentrated
in industries where there is extreme divergence between social and environmental
sustainability rankings. The only significant exception is petroleum refining, which is not
shown in Table 3.10 due to data suppression because of the small number of establishments, but
which is included in overall Westside results.
Table 3.10: Westside Cities Industry Rankings
Industry Group Title (NAICS)
Em
ploy
men
t 201
1
Ann
ual A
vg. W
age,
20
11 $
Avg
. Wag
e Q
uint
ile
Ran
king
Est
ablis
hmen
t D
irect
MT
of
GH
Gs
Per
Job
201
1
Cus
tom
er G
asol
ine
MT
of G
HG
s P
er
Job
2011
Com
bine
d M
etric
T
ons
of G
HG
s P
er
Job
In 2
011
GH
G Q
uint
ile
Ran
king
Agriculture, Forestry (11) 122 $38,084 2 8.87 0.00 8.87 2
Mining, Petroleum Extraction (21) 98 $111,324 5 424.14 0.00 424.14 1
Utilities (22) 527 $77,508 4 571.19 0.00 571.19 1
Construction (23) 3,090 $65,491 4 0.08 0.00 0.08 5
Food & Apparel Manufacturing (31) 738 $47,655 3 1.47 0.00 1.47 4
Bakeries (3118) 195 $19,522 1 3.02 1.64 4.66 2
Wood, Chem, Plastic, Cement Mfg. (32) 716 $102,076 5 12.61 0.00 12.61 1
Metal & Other Durable Mfg. (33) 1,687 $71,050 4 1.21 0.00 1.21 4
Wholesale Trade (42) 7,065 $79,969 4 0.11 0.00 0.11 5
Retail Trade (44-45) 24,732 $39,140 2 0.13 5.85 5.98 2
Air Transportation (481) 733 $82,641 5 1,442.03 2.17 1,444.20 1
Water Transportation (483) 14 $24,094 1 76.20 0.63 76.83 1
Truck Transportation (484) 42 $35,919 2 343.21 0.00 343.21 1
Passenger Transit (485) 1,291 $55,370 3 126.82 0.48 127.31 1
Sightseeing Transportation (487) 65 $25,486 1 0.92 0.63 1.55 4
Support Activities for Transp. (488) 228 $52,606 3 11.65 0.07 11.73 1
Postal Service (491) 650 $62,248 4 2.38 3.91 6.29 2
Couriers (492) 399 $41,915 2 210.86 3.75 214.61 1
Warehousing (493) 39 $37,888 2 3.89 0.00 3.89 2
Motion Picture & Video (5121) 14,073 $136,634 5 0.01 0.25 0.25 5
Information, ex. Motion Pictures & Video (51) 8,059 $123,616 5 0.05 0.32 0.38 5
Finance & Insurance (52) 7,130 $138,874 5 0.04 2.94 2.98 3
Rental & Leasing (53) 7,177 $66,366 4 0.29 0.68 0.97 4
Legal Services (5411) 3,913 $139,710 5 0.07 0.26 0.34 5
Accounting (5412) 3,729 $78,210 4 0.07 0.13 0.20 5
Arch. & Engineering Srv. (5413) 2,086 $89,199 5 0.08 0.25 0.33 5
Specialized Design Srv (5414) 1,218 $82,358 5 0.05 0.08 0.14 5
Veterinary & Other Prof Srv. (5419) 1,201 $62,944 4 0.13 1.14 1.27 4
Other Prof., Sci., & Tech. Svc. (54) 11,373 $110,807 5 0.17 0.00 0.17 5
Holding Companies (55) 1,826 $118,975 5 0.00 0.00 0.00 5

58
Industry Group Title (NAICS)
Em
ploy
men
t 201
1
Ann
ual A
vg. W
age,
20
11 $
Avg
. W
age
Qui
ntile
R
anki
ng
Est
ablis
hmen
t D
irect
MT
of
GH
Gs
Per
Job
201
1
Cus
tom
er G
asol
ine
MT
of G
HG
s P
er
Job
2011
Com
bine
d M
etric
T
ons
of G
HG
s P
er
Job
In 2
011
GH
G Q
uint
ile
Ran
king
Employment Services (5613) 5,614 $33,161 2 0.04 0.23 0.27 5
Document Copying & Mail Srv. (5614) 735 $62,092 4 0.13 2.08 2.22 3
Travel Agencies (5615) 501 $55,248 3 3.36 0.27 3.63 2
Other Admin. Support & Waste Mgmnt. (56) 5,749 $45,759 2 0.55 0.09 0.64 4
Educational Services (61) 12,120 $44,384 2 0.75 1.46 2.22 3
Ambulatory Health Care (621) 11,706 $67,055 4 0.40 1.95 2.35 3
Hospitals (622) 14,903 $99,793 5 0.49 1.13 1.62 4
Nursing Care Facilities (623) 2,986 $31,580 2 2.10 0.96 3.06 3
Social Assistance (624) 3,132 $37,220 2 0.50 0.98 1.48 4
Arts, Entertainment, & Rec. (71) 7,021 $213,956 5 0.13 0.82 0.95 4
Hotels (721) 8,899 $36,020 2 4.01 2.29 6.30 2
Restaurants & Bars (722) 22,586 $21,866 1 2.10 9.08 11.18 1
Other Services (81) 15,232 $30,916 2 0.97 1.61 2.58 3
Public Administration (92) 4,926 $83,095 5 15.02 1.58 16.60 1
Total 221,915 $72,979 4 9.39 2.34 11.73 1
Sources: California Employment Development Department; California MRIO-LCA model; California Energy Commission; IMPLAN; U.S. EIO-LCA model; SCAG; California Emissions Estimator Model; California Department of Motor Vehicles; California Air Resource Board; Argonne National Laboratory.
3.2.11 South Bay Cities Industry Rankings
The South Bay Cities have higher average wages than the county ($58,594 vs. $53,434) and also
higher average emissions per job (74.06 vs. 35.06 metric tons), resulting in an overall profile of
somewhat greater social sustainability and somewhat less environmental sustainability in its
industry base. The South Bay Cities’ sustainability rankings are shown in Table 3.11.
3.2.11.1 Wage Profile
Average wages in the South Bay are shaped by a higher concentration of knowledge – and
capital‐intensive industries. The industry distribution of the South Bay labor force differs from
the industry distribution of the county labor force in:
Petroleum Refining (wage tier 5) 259 percent larger share
Mining, Petroleum Extraction (wage tier 5) 243 percent larger share
Arch. and Engineering Srv. (wage tier 5) 181 percent larger share
Metal and Other Durable Mfg. (wage tier 5) 180 percent larger share
Travel Agencies (wage tier 2) 61 percent larger share
Warehousing (wage tier 2) 57 percent larger share
Other Prof., Sci., and Tech. Svc. (wage tier 5) 52 percent larger share
Holding Companies (wage tier 5) 49 percent larger share
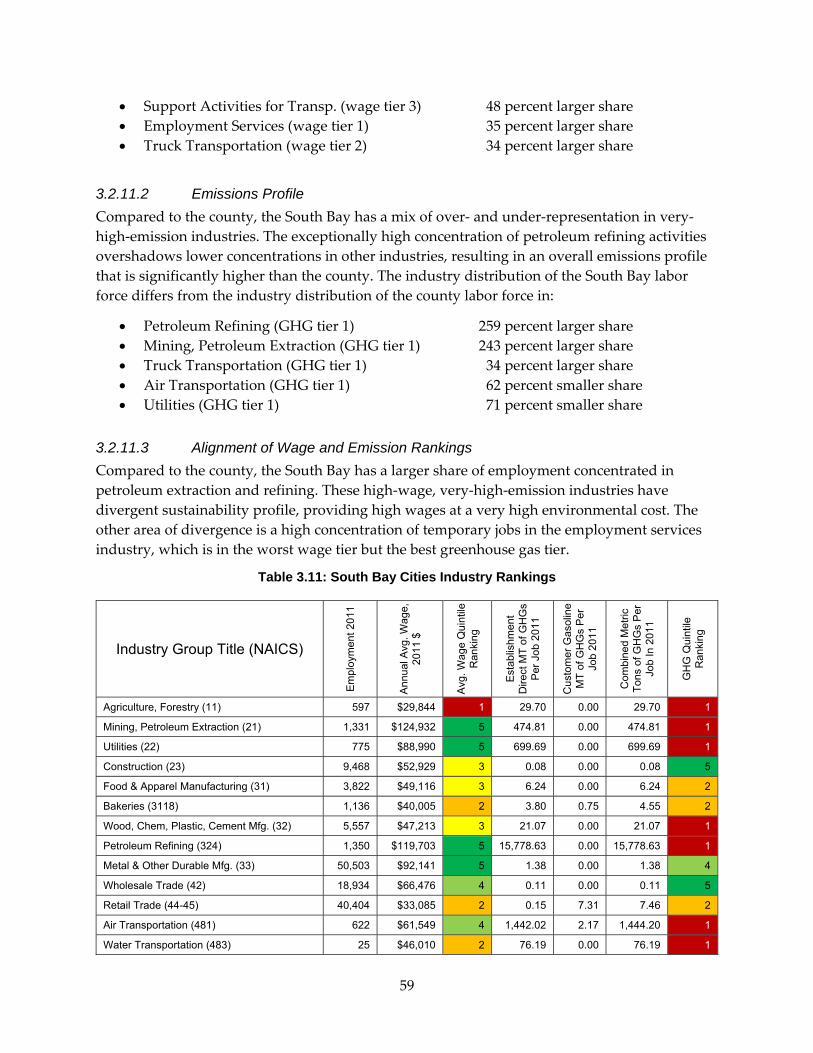
59
Support Activities for Transp. (wage tier 3) 48 percent larger share
Employment Services (wage tier 1) 35 percent larger share
Truck Transportation (wage tier 2) 34 percent larger share
3.2.11.2 Emissions Profile
Compared to the county, the South Bay has a mix of over‐ and under‐representation in very‐
high‐emission industries. The exceptionally high concentration of petroleum refining activities
overshadows lower concentrations in other industries, resulting in an overall emissions profile
that is significantly higher than the county. The industry distribution of the South Bay labor
force differs from the industry distribution of the county labor force in:
Petroleum Refining (GHG tier 1) 259 percent larger share
Mining, Petroleum Extraction (GHG tier 1) 243 percent larger share
Truck Transportation (GHG tier 1) 34 percent larger share
Air Transportation (GHG tier 1) 62 percent smaller share
Utilities (GHG tier 1) 71 percent smaller share
3.2.11.3 Alignment of Wage and Emission Rankings
Compared to the county, the South Bay has a larger share of employment concentrated in
petroleum extraction and refining. These high‐wage, very‐high‐emission industries have
divergent sustainability profile, providing high wages at a very high environmental cost. The
other area of divergence is a high concentration of temporary jobs in the employment services
industry, which is in the worst wage tier but the best greenhouse gas tier.
Table 3.11: South Bay Cities Industry Rankings
Industry Group Title (NAICS)
Em
ploy
men
t 201
1
Ann
ual A
vg. W
age,
20
11 $
Avg
. Wag
e Q
uint
ile
Ran
king
Est
ablis
hmen
t D
irect
MT
of
GH
Gs
Per
Job
201
1
Cus
tom
er G
asol
ine
MT
of G
HG
s P
er
Job
2011
Com
bine
d M
etric
T
ons
of G
HG
s P
er
Job
In 2
011
GH
G Q
uint
ile
Ran
king
Agriculture, Forestry (11) 597 $29,844 1 29.70 0.00 29.70 1
Mining, Petroleum Extraction (21) 1,331 $124,932 5 474.81 0.00 474.81 1
Utilities (22) 775 $88,990 5 699.69 0.00 699.69 1
Construction (23) 9,468 $52,929 3 0.08 0.00 0.08 5
Food & Apparel Manufacturing (31) 3,822 $49,116 3 6.24 0.00 6.24 2
Bakeries (3118) 1,136 $40,005 2 3.80 0.75 4.55 2
Wood, Chem, Plastic, Cement Mfg. (32) 5,557 $47,213 3 21.07 0.00 21.07 1
Petroleum Refining (324) 1,350 $119,703 5 15,778.63 0.00 15,778.63 1
Metal & Other Durable Mfg. (33) 50,503 $92,141 5 1.38 0.00 1.38 4
Wholesale Trade (42) 18,934 $66,476 4 0.11 0.00 0.11 5
Retail Trade (44-45) 40,404 $33,085 2 0.15 7.31 7.46 2
Air Transportation (481) 622 $61,549 4 1,442.02 2.17 1,444.20 1
Water Transportation (483) 25 $46,010 2 76.19 0.00 76.19 1
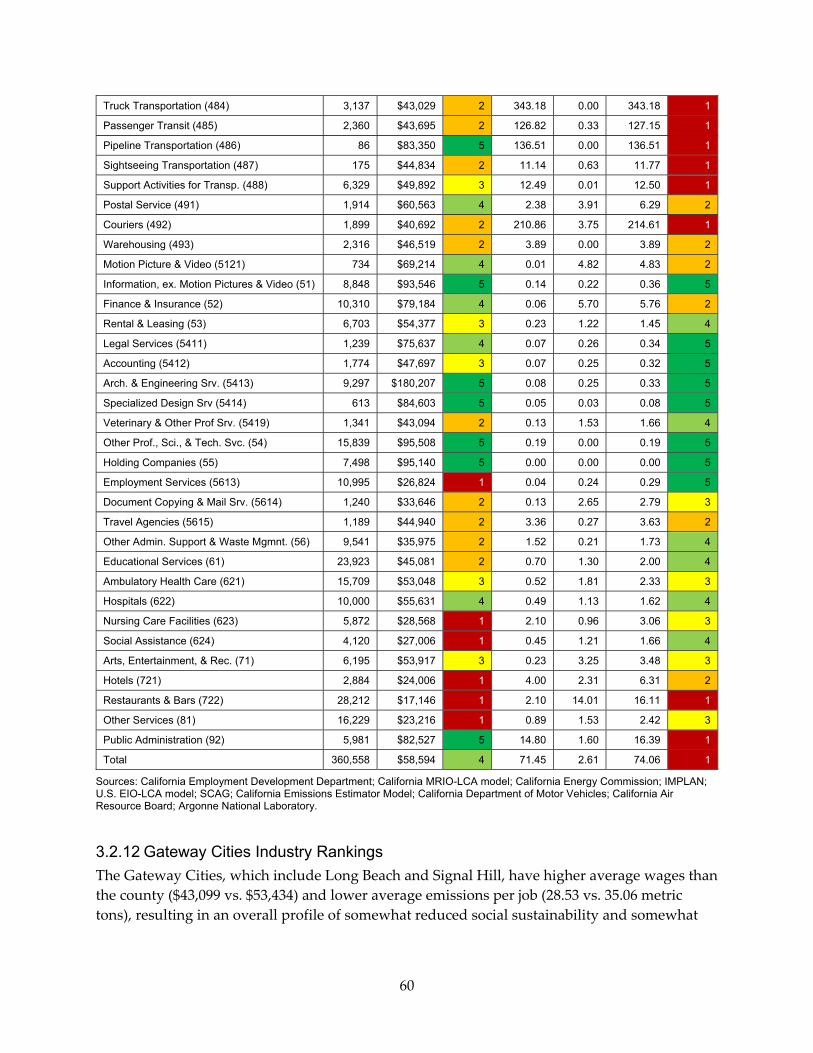
60
Truck Transportation (484) 3,137 $43,029 2 343.18 0.00 343.18 1
Passenger Transit (485) 2,360 $43,695 2 126.82 0.33 127.15 1
Pipeline Transportation (486) 86 $83,350 5 136.51 0.00 136.51 1
Sightseeing Transportation (487) 175 $44,834 2 11.14 0.63 11.77 1
Support Activities for Transp. (488) 6,329 $49,892 3 12.49 0.01 12.50 1
Postal Service (491) 1,914 $60,563 4 2.38 3.91 6.29 2
Couriers (492) 1,899 $40,692 2 210.86 3.75 214.61 1
Warehousing (493) 2,316 $46,519 2 3.89 0.00 3.89 2
Motion Picture & Video (5121) 734 $69,214 4 0.01 4.82 4.83 2
Information, ex. Motion Pictures & Video (51) 8,848 $93,546 5 0.14 0.22 0.36 5
Finance & Insurance (52) 10,310 $79,184 4 0.06 5.70 5.76 2
Rental & Leasing (53) 6,703 $54,377 3 0.23 1.22 1.45 4
Legal Services (5411) 1,239 $75,637 4 0.07 0.26 0.34 5
Accounting (5412) 1,774 $47,697 3 0.07 0.25 0.32 5
Arch. & Engineering Srv. (5413) 9,297 $180,207 5 0.08 0.25 0.33 5
Specialized Design Srv (5414) 613 $84,603 5 0.05 0.03 0.08 5
Veterinary & Other Prof Srv. (5419) 1,341 $43,094 2 0.13 1.53 1.66 4
Other Prof., Sci., & Tech. Svc. (54) 15,839 $95,508 5 0.19 0.00 0.19 5
Holding Companies (55) 7,498 $95,140 5 0.00 0.00 0.00 5
Employment Services (5613) 10,995 $26,824 1 0.04 0.24 0.29 5
Document Copying & Mail Srv. (5614) 1,240 $33,646 2 0.13 2.65 2.79 3
Travel Agencies (5615) 1,189 $44,940 2 3.36 0.27 3.63 2
Other Admin. Support & Waste Mgmnt. (56) 9,541 $35,975 2 1.52 0.21 1.73 4
Educational Services (61) 23,923 $45,081 2 0.70 1.30 2.00 4
Ambulatory Health Care (621) 15,709 $53,048 3 0.52 1.81 2.33 3
Hospitals (622) 10,000 $55,631 4 0.49 1.13 1.62 4
Nursing Care Facilities (623) 5,872 $28,568 1 2.10 0.96 3.06 3
Social Assistance (624) 4,120 $27,006 1 0.45 1.21 1.66 4
Arts, Entertainment, & Rec. (71) 6,195 $53,917 3 0.23 3.25 3.48 3
Hotels (721) 2,884 $24,006 1 4.00 2.31 6.31 2
Restaurants & Bars (722) 28,212 $17,146 1 2.10 14.01 16.11 1
Other Services (81) 16,229 $23,216 1 0.89 1.53 2.42 3
Public Administration (92) 5,981 $82,527 5 14.80 1.60 16.39 1
Total 360,558 $58,594 4 71.45 2.61 74.06 1
Sources: California Employment Development Department; California MRIO-LCA model; California Energy Commission; IMPLAN; U.S. EIO-LCA model; SCAG; California Emissions Estimator Model; California Department of Motor Vehicles; California Air Resource Board; Argonne National Laboratory.
3.2.12 Gateway Cities Industry Rankings
The Gateway Cities, which include Long Beach and Signal Hill, have higher average wages than
the county ($43,099 vs. $53,434) and lower average emissions per job (28.53 vs. 35.06 metric
tons), resulting in an overall profile of somewhat reduced social sustainability and somewhat

61
greater environmental sustainability in its industry base. The Gateway Cities’ sustainability
rankings are shown in Table 3.12.
3.2.12.1 Wage Profile
Average wages in the Gateway Cities are shaped by a higher concentration of jobs in low‐wage
service and distribution industries. The industry distribution of the Gateway Cities labor force
differs from the industry distribution of the county labor force in:
Truck Transportation (wage tier 2) 166 percent larger share
Food and Apparel Manufacturing (wage tier 2) 101 percent larger share
Employment Services (wage tier 1) 78 percent larger share
Wholesale Trade (wage tier 3) 68 percent larger share
Metal and Other Durable Mfg. (wage tier 4) 37 percent larger share
Retail Trade (wage tier 1) 10 percent larger share
3.2.12.2 Emissions Profile
Compared to the county, the Gateway Cities have a significantly larger share of employment
concentrated in four high emission industries, with petroleum refining playing a particularly
large role in skewing average emissions upward, resulting in an overall emissions‐per‐job
profile that is higher than the county. The industry distribution of the Gateway Cities labor
force differs from the industry distribution of the county labor force in:
Truck Transportation (GHG tier 1) 166 percent larger share
Wood, Chem, Plastic, Cement Mfg. (GHG tier 1) 85 percent larger share
Mining, Petroleum Extraction (GHG tier 1) 73 percent larger share
Petroleum Refining (GHG tier 1) 70 percent larger share
3.2.12.3 Alignment of Wage and Emission Rankings
Compared to the county, the Gateway Cities have a larger share of employment concentrated in
petroleum extraction and refining. These high‐wage, very‐high‐emission industries have
divergent sustainability profile, providing high wages at a very high environmental cost. The
other area of divergence is a high concentration of temporary jobs in the Employment Services
industry, which is in the worst wage tier but the best greenhouse gas tier.
Table 3.12: Gateway Cities Industry Rankings
Industry Group Title (NAICS)
Em
ploy
men
t 201
1
Ann
ual A
vg. W
age,
20
11 $
Avg
. Wag
e Q
uint
ile
Ran
king
Est
ablis
hmen
t D
irect
MT
of
GH
Gs
Per
Job
201
1
Cus
tom
er G
asol
ine
MT
of G
HG
s P
er
Job
2011
Com
bine
d M
etric
T
ons
of G
HG
s P
er
Job
In 2
011
GH
G Q
uint
ile
Ran
king
Agriculture, Forestry (11) 755 $26,148 1 38.64 0.00 38.64 1
Mining, Petroleum Extraction (21) 1,264 $90,974 5 167.61 0.00 167.61 1

62
Industry Group Title (NAICS)
Em
ploy
men
t 201
1
Ann
ual A
vg. W
age,
20
11 $
Avg
. W
age
Qui
ntile
R
anki
ng
Est
ablis
hmen
t D
irect
MT
of
GH
Gs
Per
Job
201
1
Cus
tom
er G
asol
ine
MT
of G
HG
s P
er
Job
2011
Com
bine
d M
etric
T
ons
of G
HG
s P
er
Job
In 2
011
GH
G Q
uint
ile
Ran
king
Utilities (22) 3,552 $80,709 5 762.87 0.00 762.87 1
Construction (23) 21,536 $57,713 4 0.07 0.00 0.07 5
Food & Apparel Manufacturing (31) 31,113 $38,181 2 4.84 0.00 4.84 2
Bakeries (3118) 5,151 $39,153 2 3.68 0.62 4.30 2
Wood, Chem, Plastic, Cement Mfg. (32) 20,612 $46,759 2 19.25 0.00 19.25 1
Petroleum Refining (324) 1,212 $88,006 5 6,088.95 0.00 6,088.95 1
Metal & Other Durable Mfg. (33) 46,704 $58,329 4 3.12 0.00 3.12 3
Wholesale Trade (42) 61,044 $55,124 3 0.11 0.00 0.11 5
Retail Trade (44-45) 75,455 $28,636 1 0.14 6.99 7.13 2
Air Transportation (481) 250 $68,219 4 1,442.01 2.25 1,444.26 1
Water Transportation (483) 412 $54,715 3 76.18 0.28 76.46 1
Truck Transportation (484) 11,740 $45,641 2 343.18 0.00 343.18 1
Passenger Transit (485) 3,426 $33,887 2 126.82 0.22 127.04 1
Pipeline Transportation (486) 297 $116,245 5 136.52 0.00 136.52 1
Sightseeing Transportation (487) 139 $30,867 2 4.92 0.63 5.55 2
Support Activities for Transp. (488) 12,519 $68,588 4 12.36 0.01 12.37 1
Postal Service (491) 3,694 $58,648 4 2.38 3.91 6.29 2
Couriers (492) 4,079 $37,236 2 210.86 3.75 214.61 1
Warehousing (493) 6,242 $48,068 3 3.89 0.00 3.89 2
Motion Picture & Video (5121) 1,048 $17,214 1 0.01 10.22 10.23 1
Information, ex. Motion Pictures & Video (51) 6,034 $58,400 4 0.14 0.35 0.49 5
Finance & Insurance (52) 13,479 $52,695 3 0.06 4.38 4.44 2
Rental & Leasing (53) 8,957 $46,188 2 0.18 1.06 1.24 4
Legal Services (5411) 2,890 $71,568 4 0.07 0.26 0.34 5
Accounting (5412) 2,944 $43,822 2 0.07 0.23 0.30 5
Arch. & Engineering Srv. (5413) 5,383 $75,004 4 0.08 0.21 0.28 5
Specialized Design Srv (5414) 1,253 $44,765 2 0.05 0.04 0.09 5
Veterinary & Other Prof Srv. (5419) 2,084 $28,324 1 0.12 1.07 1.19 4
Other Prof., Sci., & Tech. Svc. (54) 9,315 $51,262 3 0.13 0.00 0.13 5
Holding Companies (55) 11,292 $72,471 4 0.00 0.00 0.00 5
Employment Services (5613) 27,462 $18,501 1 0.04 0.23 0.27 5
Document Copying & Mail Srv. (5614) 1,871 $34,934 2 0.13 2.80 2.94 3
Travel Agencies (5615) 671 $40,893 2 3.36 0.27 3.63 2
Other Admin. Support & Waste Mgmnt. (56) 22,873 $36,279 2 8.16 0.09 8.25 2
Educational Services (61) 60,198 $47,879 3 0.78 1.31 2.08 4
Ambulatory Health Care (621) 29,380 $52,492 3 0.45 1.88 2.33 3
Hospitals (622) 24,066 $59,389 4 0.49 1.13 1.62 4
Nursing Care Facilities (623) 12,540 $27,340 1 2.10 1.00 3.10 3

63
Industry Group Title (NAICS)
Em
ploy
men
t 201
1
Ann
ual A
vg. W
age,
20
11 $
Avg
. W
age
Qui
ntile
R
anki
ng
Est
ablis
hmen
t D
irect
MT
of
GH
Gs
Per
Job
201
1
Cus
tom
er G
asol
ine
MT
of G
HG
s P
er
Job
2011
Com
bine
d M
etric
T
ons
of G
HG
s P
er
Job
In 2
011
GH
G Q
uint
ile
Ran
king
Social Assistance (624) 8,985 $27,149 1 0.51 0.97 1.47 4
Arts, Entertainment, & Rec. (71) 10,714 $26,120 1 0.32 4.40 4.72 2
Hotels (721) 4,506 $24,758 1 4.01 2.42 6.43 2
Restaurants & Bars (722) 45,757 $16,340 1 2.10 15.87 17.97 1
Other Services (81) 37,303 $23,213 1 0.87 1.34 2.21 3
Public Administration (92) 17,080 $67,858 4 14.63 1.25 15.87 1
Total 681,367 $43,099 2 26.03 2.50 28.53 1
Sources: California Employment Development Department; California MRIO-LCA model; California Energy Commission; IMPLAN; U.S. EIO-LCA model; SCAG; California Emissions Estimator Model; California Department of Motor Vehicles; California Air Resource Board; Argonne National Laboratory.
3.2.13 Las Virgenes Industry Rankings
Las Virgenes, which is comprised principally of the City of Malibu, has higher average wages
than the county ($64,458 vs. $53,434) and much lower average emissions per job (5.69 vs. 35.06
metric tons), resulting in an overall profile of greater social and environmental sustainability in
its industry base. Las Virgenes’ sustainability rankings are shown in Table 3.13.
3.2.13.1 Wage Profile
Average wages in Las Virgenes are shaped by a service oriented economy with no extractive
industries and very little representation of manufacturing or transportation industries. The
industry distribution of the Las Virgenes labor force differs from the industry distribution of the
county labor force in:
Veterinary and Other Prof Srv. (wage tier 2) 457 percent larger share
Finance and Insurance (wage tier 5) 210 percent larger share
Prof., Sci., and Tech. Services (wage tier 5) 143 percent larger share
Information, ex. Motion Pictures (wage tier 5) 122 percent larger share
Architecture and Engineering (wage tier 4) 105 percent larger share
Admin. Support and Waste Mgmnt. (wage tier 2) 74 percent larger share
Restaurants and Bars (wage tier 1) 59 percent larger share
Rental and Leasing (wage tier 4) 56 percent larger share
Construction (wage tier 2) 47 percent larger share
3.2.13.2 Emissions Profile
Compared to the county, Las Virgenes is significantly under‐represented in tier 1 industries
based on emission levels, except for restaurants and horticultural activities in the agriculture
sector. This results in an overall emissions‐per‐job profile that is much lower than the county.

64
The industry distribution of the Las Virgenes labor force differs from the industry distribution
of the county labor force in:
Agriculture, Forestry (GHG tier 1) 797 percent larger share
Restaurants & Bars (GHG tier 1) 59 percent larger share
Passenger Transit (GHG tier 1) 53 percent smaller share
Truck Transportation (GHG tier 1) 71 percent smaller share
Public Administration (GHG tier 1) 75 percent smaller share
Support Activities for Transportation (GHG tier 1) 83 percent smaller share
3.2.13.3 Alignment of Wage and Emission Rankings
There is little evidence of highly divergent industry rankings in Las Virgenes, either industries
that have high wages but also high emissions, or industries with bottom tier wages but also
minimal emissions.
Table 3.13: Las Virgenes Industry Rankings
Industry Group Title (NAICS)
Em
ploy
men
t 201
1
Ann
ual A
vg. W
age,
20
11 $
Avg
. Wag
e Q
uint
ile
Ran
king
Est
ablis
hmen
t D
irect
MT
of
GH
Gs
Per
Job
201
1
Cus
tom
er G
asol
ine
MT
of G
HG
s P
er
Job
2011
Com
bine
d M
etric
T
ons
of G
HG
s P
er
Job
In 2
011
GH
G Q
uint
ile
Ran
king
Agriculture, Forestry (11) 554 $27,271 1 27.40 0.00 27.40 1
Construction (23) 1,699 $46,634 2 0.08 0.00 0.08 5
Food & Apparel Manufacturing (31) 109 $62,322 4 0.70 0.00 0.70 4
Bakeries (3118) 551 $35,050 2 3.01 0.30 3.31 3
Wood, Chem, Plastic, Cement Mfg. (32) 153 $47,492 3 1.66 0.00 1.66 4
Metal & Other Durable Mfg. (33) 1,451 $124,881 5 0.69 0.00 0.69 4
Wholesale Trade (42) 1,629 $84,436 5 0.11 0.00 0.11 5
Retail Trade (44-45) 3,338 $38,086 2 0.18 8.00 8.17 2
Truck Transportation (484) 79 $33,195 2 343.20 0.00 343.20 1
Passenger Transit (485) 104 $20,681 1 126.82 0.04 126.86 1
Support Activities for Transp. (488) 85 $65,002 4 12.56 0.06 12.63 1
Postal Service (491) 108 $57,983 4 2.38 3.91 6.29 2
Motion Picture & Video (5121) 480 $87,022 5 0.01 5.13 5.14 2
Information, ex. Motion Pictures & Video (51) 1,873 $94,384 5 0.07 0.00 0.07 5
Finance & Insurance (52) 4,717 $104,731 5 0.06 3.52 3.58 2
Rental & Leasing (53) 1,222 $55,747 4 0.39 0.51 0.90 4
Legal Services (5411) 637 $87,331 5 0.07 0.26 0.33 5
Accounting (5412) 347 $63,340 4 0.07 0.26 0.33 5
Arch. & Engineering Srv. (5413) 792 $74,435 4 0.08 0.23 0.31 5
Specialized Design Srv (5414) 172 $136,676 5 0.05 0.06 0.12 5
Veterinary & Other Prof Srv. (5419) 891 $35,319 2 0.12 1.28 1.40 4
Other Prof., Sci., & Tech. Svc. (54) 2,966 $95,746 5 0.12 0.00 0.12 5

65
Industry Group Title (NAICS)
Em
ploy
men
t 201
1
Ann
ual A
vg. W
age,
20
11 $
Avg
. W
age
Qui
ntile
R
anki
ng
Est
ablis
hmen
t D
irect
MT
of
GH
Gs
Per
Job
201
1
Cus
tom
er G
asol
ine
MT
of G
HG
s P
er
Job
2011
Com
bine
d M
etric
T
ons
of G
HG
s P
er
Job
In 2
011
GH
G Q
uint
ile
Ran
king
Holding Companies (55) 532 $145,253 5 0.00 0.00 0.00 5
Employment Services (5613) 520 $64,535 4 0.04 0.14 0.19 5
Document Copying & Mail Srv. (5614) 542 $53,956 3 0.13 1.40 1.54 4
Travel Agencies (5615) 93 $67,124 4 3.36 0.27 3.63 2
Other Admin. Support & Waste Mgmnt. (56) 2,373 $43,628 2 0.53 0.05 0.58 4
Educational Services (61) 3,299 $56,972 4 0.98 1.14 2.12 4
Ambulatory Health Care (621) 1,042 $67,534 4 0.54 2.19 2.73 3
Nursing Care Facilities (623) 451 $35,597 2 2.10 0.90 3.00 3
Social Assistance (624) 388 $29,024 1 0.47 1.11 1.58 4
Arts, Entertainment, & Rec. (71) 1,030 $88,353 5 0.29 1.51 1.81 4
Hotels (721) 536 $25,408 1 3.80 2.20 6.00 2
Restaurants & Bars (722) 5,013 $26,034 1 2.10 9.08 11.18 1
Other Services (81) 1,380 $26,829 1 0.99 1.80 2.79 3
Public Administration (92) 409 $42,872 2 14.08 1.68 15.77 1
Total 42,168 $64,458 4 3.11 2.58 5.69 2
Sources: California Employment Development Department; California MRIO-LCA model; California Energy Commission; IMPLAN; U.S. EIO-LCA model; SCAG; California Emissions Estimator Model; California Department of Motor Vehicles; California Air Resource Board; Argonne National Laboratory.
3.3 Sustainability Summary for Los Angeles Industries
A summary of wage and greenhouse sustainability rankings for Los Angeles industries is
shown in Table 3.14. Only five of the rolled‐up industries shown in the table, representing 26
percent of total employment, both pay at least average wages (wage tiers 3 to 5) and emit less
than 2.2 metric tons of greenhouse gasses per job each year (GHG tiers 4 to 5). Three‐quarters of
the county’s industry base pay less than average wages, have average or higher emissions, or
both.
The very highest levels of greenhouse gas emissions are from cornerstone industries that
provide energy and movement that are essential for the economy: petroleum extraction and
refining, electric power generation and distribution, air transportation, and trucking.
The lowest wages are predominantly in routine service industries – retail, restaurants, hotels
and personal services.
Table 3.14: Summary of Los Angeles County Industry Rankings

66
Industry Employment
2011 Wage Tier
Annual Average
Wage 2011
MT GHG per Job from Establishment
Activities & Customer Trips 2011
GHG Tier
Agriculture 5,720 1 $28,679 35 1 Petroleum Extraction & Refining 6,269 5 $148,884 8,231 1
Electric Power Generation & Distrib 16,560 5 $109,316 1,439 1
Other Utilities 12,684 5 $81,520 6,238 1
Construction 107,683 3 $53,360 0.08 5
Food & Apparel Manufacturing 104,947 2 $38,487 4.52 2
Wood, Chem, Plastic, Cement Mfg. 64,274 3 $47,889 14 1
Metal & Other Durable Mfg. 197,272 4 $69,723 2.18 4
Wholesale Trade 208,856 3 $55,451 0.11 5
Retail Trade 396,780 1 $30,596 8.88 2
Air Transportation 18,033 4 $63,155 1,445 1
Trucking & Couriers 44,029 2 $42,763 290 1
Other Transportation 102,650 3 $52,287 35 1
Information 197,255 5 $94,125 0.60 4
Finance, Insurance, Real Estate 215,407 5 $81,127 4.02 2
Prof., Scientific, & Tech. Srv. 314,693 5 $87,794 0.27 5
Admin. Support & Waste Mgmnt. 239,952 2 $33,574 2.24 3
Education 351,631 3 $49,837 2.50 3
Health Care & Social Assistance 469,446 3 $52,070 2.42 3
Arts, Entertainment, & Recreation 78,751 5 $90,451 2.84 3
Hotels & Restaurants 334,825 1 $19,395 17 1
Personal & Repair Services 256,118 1 $24,849 2.48 3
Public Administration 151,279 4 $75,553 17 1
3.3.1 Policy Implications
This integrated assessment of the environmental balance sheet for employing the region’s labor
force within the envelope of sustainable greenhouse gas emission and the social balance sheet
for providing the region’s labor force with wages that support a basic standard of living
identifies needs in most industries for progress on one or both scales.
In many instances the ranking for environmental sustainability differs from the ranking for
wage sustainability. In the near‐term, these rankings differences identify trade‐offs. In the long‐
term, they identify sustainability weaknesses that need to be improved to increase industry
sustainability and long‐term prospects for viability.
When Los Angeles County industries are rolled up into 23 broad sectors in Table 3.14 and
broken out into quintile rankings based on wage and greenhouse sustainability, only five
sectors representing 26 percent of total employment, both pay at least average wages and emit
less than 2.2 metric tons of greenhouse gasses per job each year. Three‐quarters of the county’s
industry base pays less than average wages, has average or higher emissions, or both.

67
Some industries are both socially and environmentally sustainable when seen individually,
however, all industries are dependent on the energy and transportation sectors of the economy,
which are emission‐intensive. The long‐term sustainability of all industries is dependent on
cleaner sources of energy and higher levels of value added to the economy per unit of energy
consumed.
Progress toward environmental sustainability requires improved technologies and industry
processes for producing electricity and petroleum and for moving people and goods much
more efficiently and with much less dependence on fossil fuels. To become more socially,
economically and environmentally sustainable, Los Angeles County must move its industry
base toward:
1. Higher levels of value added to the economy for each terajoule that is consumed,
preferably achieved through greater energy efficiency for existing industries.
2. Cleaner sources of power that release less greenhouse gas per terajoule consumed.
3. Higher wages so that all workers are paid enough to support the minimum standard of
living necessary for health, efficiency, and general well‐being. Possible approaches for
achieving sustainable wages include incentives for higher‐wage industries and increases
in the minimum wage.

68
GLOSSARY
Term Definition
ARB Air Resource Board
ACS American Community Survey
CDPH California Department of Public Health
CEEM California Emissions Estimator Model California Energy Commission
CEIDARS California Emission Inventory Development and Reporting System
CPUC California Public Utilities Commission
CALSIM California Statewide Integrated Model of Statewide Land Use
CSTDM California Statewide Travel Demand Model
CO Carbon monoxide
CO2 Carbon dioxide
CGE Computable general equilibrium
CH4 Methane
DOE Department of Energy
DOT Department of Transportation
DPSS Department of Public Social Services
eGRID Emissions & Generation Resource Integrated Database
EIO Economic input‐output
EIO‐LCA Economic input‐output life cycle assessment
EDD Employment Development Department
EPA Environmental Protection Agency
EPIC Electric Program Investment Charge
GIS Graphic Information Systems
GHG Greenhouse Gas
GREET1 Greenhouse Gases, Regulated Emissions, and Energy Use in
Transportation

69
IMPLAN Impact Analysis for Planning
ITLEM Integrated Transportation Land Use Economic Models
IOU Investor owned utility
LUT Land use and transportation
LCA Life cycle assessment
MRR Mandatory Reporting Program
MRIO Multi‐region input‐output
MOU Municipally Owned Utility
MWh Megawatt hours of electricity
NTNCWS Nontransient noncommunity water system
NAICS North American Industry Classification System
OPR Office of Planning and Research
OSHPD Office of Statewide Health Planning
OLS Ordinary least squares
N2O Nitrous oxide
NOx Oxides of nitrogen
SO2 Sulfur dioxide
SOx Oxides of sulfur
PM2.5 Particulate matter of 2.5 micrometers
PM10 Particulate matter of 10 micrometers
PECAS Product Exchange and Consumption Allocation System
PUMS Public Use Microdata Sample
RCRA Resource Conservation and Recovery Act
ROG Reactive organic gas
SCAQMD South Coast Air Quality Management District
SDWIS Safe Drinking Water Information System
SPA Service Planning Area
SWIMS Solid Waste Information Management System

70
SCAQMD South Coast Air Quality Management District
SCG Southern California Gas Company
SSI Supplemental Security Income
TJ Terajoules
TPY Tons per Year
TRACI Tools for the Reduction and Assessment of Chemical and other
environmental Impacts
TNCWS Transient noncommunity water system
TREDIS Transportation Economic Development Impact System
UM Urban metabolism

71
REFERENCES
California Assembly Committee on Utilities and Commerce. Briefing Paper for Oversight
Hearing Energy Efficiency – Measuring for Success Coordination, Collaboration, and
Transparency. 2013
CEDP. Microeconomic and Macroeconomic Impact Analysis of Greenhouse Gas Mitigation
Policy Options for the Southern California Climate and Economic Development Project.
Southern California Association of Governments. 2012.
Curran, M.A. (ed.). Environmental Life‐Cycle Assessment. New York, NY: McGraw‐Hill. 1996.
Green Design Initiative (2001). Economic Input‐Output Life‐Cycle Assessment Model. Carnegie
Mellon University. 2001.
Hendrickson, C. T., Lave, L. B., Matthews, H. S. Environmental Life Cycle Assessment of Goods
and Services: An Input‐Output Approach. Resources for the Future Press. 2006.
Kennedy, Christopher, John Cuddihy, and Joshua Engel‐Yan. “The Changing Metabolism of
Cities,” Journal of Industrial Ecology. 2007.
Leontief, W. ʺEnvironmental Repurcussions and Economic Structure ‐ Input‐Output
Approach.ʺ Review of Economics and Statistics. 1970.
Masanet, Eric, H. Scott Matthews, Derrick Carlson., and Arpad Horvath. Retail Climate Change
Mitigation: Life‐Cycle Emission and Energy Efficiency Labels and Standards. California
Air Resources Board and the California Environmental Protection Agency. 2012.
McMichael, A. J., C. D. Butler and Carl Folke. “New Visions for Addressing Sustainability,”
Science, 12 December 2003.
Muller, Nicholas Z., Robert Mendelsohn, and William Nordhaus. ʺEnvironmental Accounting
for Pollution in the United States Economy.ʺ American Economic Review. 2011.
Ngo, N. S. and D. E. Pataki. The Energy and Mass Balance of Los Angeles County. Urban
Ecosyst. 2008.
Rapoport, Elizabeth. Interdisciplinary Perspectives on Urban Metabolism: A Review of the
Literature. UCL Environmental Institute. 2011.
Reid, W.V., D. Chen, L Goldfarb, and H. Hackmann. “Earth System Science for Global
Sustainability: Grand Challenges,” Science. 2010.
Rue du Can, Stephane, Ali Hasanbeigi, Jayant Sathaye. California Energy Balance Update
and Decomposition Analysis for the Industry and Building Sectors. Lawrence Berkeley
National Laboratory. 2010.
Southern California Association of Governments. Climate Change and the Future of Southern
California. 2009.

72
United States Department of Commerce, Economics and Statistics Administration. A User
Handbook for the Regional Input‐Output Modeling System (RIMS II). 1997.

A‐1
APPENDIX A: Methodology for Assessing Industry Sustainability based on both Environmental and Economic Impacts
A.1 Overview
The objective in overlaying greenhouse gas emission on social sustainability data is to provide
an integrated platform for assessing strengths and challenges of Los Angeles County industries
in meeting the region’s overall environmental, economic, and social sustainability needs. Social
sustainability refers specifically to sustaining wages for workers employed in an industry.
Bringing the environmental footprint of industrial activities into an integrated frame of
reference with social impacts provides an inclusive set of benchmarks for assessing trade‐offs
associated with different land use options, as well as for identifying improvements that are
needed in specific industries. Information produced through this analysis identifies:
1. Industry sectors that provide opportunities for a growing green economy with wage
levels that sustain the labor force.
2. Industry sectors that provide significant labor force benefits but are at risk from
increased energy prices and should be targeted for energy efficiency investments to
make them more environmentally sustainable.
3. Industries that are environmentally sustainable but do not pay sustaining wages to their
workers.
4. Industries that have significant carrying costs for both the social safety net and the
environment.
Three data series of environmental impacts were produced:
1. Direct (scope 1) and life cycle (scope 1, 2 and 3)18 energy and emissions by commercial,
industrial, and government establishments.
2. Direct (scope 1) and life cycle (scope 1, 2 and 3) energy and emissions per job by
commercial, industrial, and government establishments.
3. Emissions (scope 1, 2 and 3) from gasoline used by customers on trips to businesses.
18 United States Environmental Protection Agency (2005), “Climate leaders greenhouse gas inventory
protocol,” http://www.epa.gov/climateleadership/documents/resources/design_princ_ch4.pdf, pp.16‐19.
Direct emissions are equivalent to scope 1, life cycle emissions are equivalent to scope 1, 2 and 3
aggregated.

A‐2
A.2 Geographic Aggregation
This analysis used employer data from the California Employment Development Department
(EDD), which provides establishment‐level employment and payroll data for every employer in
Los Angeles County from 1996 through 2011—a total of 1,011,707 employers. This information
is used solely for analyzing workforce employment and job creation opportunities.
Information provided by these time‐series records includes the following information for the
approximately 400,000 employers that are active in Los Angeles County in any given year:
Address
Six‐digit North American Industry Classification System (NAICS)
Monthly employment
Quarterly payroll
This highly disaggregated data was aggregated into the nine Southern California Association of
Governments (SCAG) sub‐regions shown earlier in Figure 22. This level of aggregation
generally provides sufficiently large numbers of establishments in each industry to provide
reliable data while also providing information that is scaled to support sub‐regional land use
planning within the county.
Industry data was aggregated at the three‐digit NAICS level for each of the nine SCAG sub‐
regions, and at the four‐digit NAICS level for Los Angeles city and County. Data was
suppressed in instances when the number of establishments in a given geographic area was not
large enough to protect employer confidentiality.19
A.3 Direct Energy Consumption and Greenhouse Gas Emissions by Industrial, Commercial and Governmental Establishments (Scope 1)
Direct energy consumption and greenhouse emissions were estimated for each
establishment by linking establishment employment data with energy and emission
factors in the California multi‐regional input‐output (MRIO) life‐cycle assessment (LCA)
model developed for the California Air Resources Board and the California
Environmental Protection Agency in to2012. 20These estimates are direct GHG emissions
from sources that are owned or controlled by the establishment – scope 1 emissions.
The MRIO‐LCA factors represent average statewide environmental effects for each
industry in terms of the production and consumption occurring in California. These
19 Data was suppressed if there were fewer than three employers in an industry in a given geographic
area or if any single employer accounted for 80 percent or more of employment in an industry.
20 Masanet, Eric; Matthews, H. Scott and Derrick Carlson (2012), Retail Climate Change Mitigation: Life‐
Cycle Emission and Energy Efficiency Labels and Standards, prepared for the California Air Resources
Board and the California Environmental Protection Agency, Contract UCB 07‐322.

A‐3
state‐level factors are integrated with national factors for each industry for production
and consumption that occurs in the rest of the United States. State‐level factors are
predominant when the model is used to estimate direct (scope 1) greenhouse gas
emissions by establishments in each industry.
Because establishment‐level economic factors are linked to state‐level environmental
factors to estimate direct greenhouse gas emissions, the estimates do not identify precise
quantities of energy/emissions corresponding to establishment‐level or even regional
business activities, but rather to show comparative industry impacts. The
energy/emissions factors for each industry represent average statewide impacts. To
correct for this, the values produced using statewide EIO‐LCA factors were then
aggregated and benchmarked against California Energy Commission data for total
electricity and natural gas used by each industry in Los Angeles County, and corrected
accordingly. Specific establishments within a given sector are likely to deviate from that
average, particularly in small geographic areas where the sample size is small.
The focus of this work is on comparative consumption of energy and production of
emissions among industries rather than on precise quantities. This data is used to assess
comparative impacts and comparative sustainability of industries rather than to
construct precise inventories of environmental impacts.
The computational steps for estimating direct greenhouse gas emissions are shown in
Figure A.1 and described below.
Figure A.1: Estimating Direct Establishment Emissions
Employment data from CA EDD 1996-2011 with NAICS 6-digit coding and addresses for each establishment in LA County used to determine the location, type and scale of industry activity
IMPLAN economic models and 1998-2011 data for LA County used to obtain the amount of value added per employee in each industry, converted to 2002 $
Green Design Institute, Carnegie Mellon University, U.S. Economic Input-Output Life Cycle Assessment (EIO-LCA) used to determine amount of value added per $1 million output in each industry in 2002
Energy and emissions pegged to level of value added activity each year in each industry:(LA Co. VA per job * # jobs at firm)/U.S. EIO-LCA VA per $1 M output =Total EIO-LCA value added per firm
California MRIO-LCA direct impact factors are multiplied by the annual value added per worker factor in each industry to estimate energy and GHG per establishment
Industry benchmark factors are imported into the model and used to adjust energy and GHG estimates for each establishment (petroleum-reliant industries are not adjusted - agriculture, mining, transportation)
Model estimates for energy used by each industry are benchmarked against California Energy Com. data for electricity and natural gas use

A‐4
1. Annual employment data for each establishment provides the foundation for estimating
the quantity of energy consumed and greenhouse gases emitted by each establishment.
2. The number of employees at each establishment in each year is translated into annual
amount of value added activity at each establishment using IMPLAN input‐output
economic models of Los Angeles County for each year. These steps are taken to convert
employment numbers into emission numbers for each establishment in each industry.
These models and county‐level data for use in the models are produced by MIG, Inc.
The annual amount of value added activity is converted to 2002 dollars because both the
U.S. EIO‐LCA model and the California MRIO‐LCA models are derived from the 2002
industry input‐output tables produced by the U.S. Bureau of Economic Analysis.
3. The amount of value added activity that corresponds with $1 million output in each
industry is obtained from the U.S. Economic Input‐Output Life Cycle Assessment (EIO‐
LCA) model developed by Green Design Institute, Carnegie Mellon University, (2008).
This makes it possible to link estimates to value added activity rather than to output,
which closely equates to sales. The MRIO‐LCA model is linked to output rather than
value added, however, as the unit of geography shrinks, an increasing share of goods
and services that are sold are imported from other regions rather than produced locally.
Using the amount of value added activity rather than the value of output to drive the
model prevents estimates of environmental effects from inflating as geography shrinks.
4. The energy consumption and greenhouse gas emissions associated with $1 million in
direct economic output by each industry is scaled proportionate to the amount of value
added activity at each establishment in each year. Therefore, a fraction of the impact
associated with $1 million in output is attributed to a small establishment; many
multiples of the $1 million impact are attributed to a large establishment.
5. The scale of value added activity at each establishment (converted to fractions or
multiples of the impact associated with $1 million in output by the industry) is
multiplied by the California MRIO‐LCA environmental factors for each industry. The
primary factor used in this analysis was Annual Metric Tons of Total GHG. The total list
of factors estimated by the model includes:
Annual Terajoules of Total Energy
Annual Terajoules of Coal
Annual Terajoules of Natural Gas
Annual Terajoules of Petroleum
Annual Terajoules of Waste/Biomass
Annual Terajoules of Nonfossil Electric
Annual Metric Tons of Coal CO2
Annual Metric Tons of Natural Gas CO2
Annual Metric Tons of Petroleum CO2

A‐5
Annual Metric Tons of Biomass/Waste CO2
Annual Metric Tons of Total Energy CO2
Annual Metric Tons of Total GHG
Annual Metric Tons of Energy CO2
Annual Metric Tons of Process CO2
Annual Metric Tons of CH4
Annual Metric Tons of N2O
Annual Metric Tons of HFC/PFCs
6. Data provided by the California Energy Commission showing actual annual
consumption of electricity and natural gas by each industry (typically at the three‐digit
NAICS level) in Los Angeles County was benchmarked against the amount of total
energy that was estimated to have been consumed by each industry in the preceding
step. This was used to create a correction factor which modified estimates produced
using MRIO‐LCA factors so that the estimates corresponded with actual annual
electricity and natural gas consumption in Los Angeles County. These correction factors
were produced by overlaying Energy Commission industry categories on Bureau of
Economic Analysis categories, which resulted in 53 industry categories with correction
factors. The size of the corrections varied by industry and by year, with the size
corrections increasing with each additional year after 2002. Use of CEC data reduced
model estimates by 63 percent in 2008, 70 percent in 2009, 69 percent in 2010, and 75
percent in 2011.
7. Industry benchmark factors from the preceding step were imported into the database
and used to adjust energy consumption and greenhouse gas emission estimates for each
establishment. This step was not carried out for industries that make extensive use of
petroleum rather than obtaining energy primarily through electric and natural gas
utilities. The petroleum‐reliant industry sectors for which petroleum‐based emissions
were not adjusted included:
Agriculture, forestry and fishing
Air transportation
Construction
Bus transportation
Mining
Oil and gas extraction
Petroleum and coal products
Rail transportation
Truck transportation

A‐6
A.4 Life Cycle Energy Consumption and Greenhouse Gas Emissions by Industrial, Commercial and Governmental Establishments (Scope 1, 2, 3)
Life cycle energy consumption and greenhouse gas emission estimates are produced through a
similar series of steps to those for just described for estimating direct impacts. A flow chart
showing these steps is provided in Figure A.2.
1. Annual employment data for each establishment provides the foundation for estimating
the life cycle energy consumed and greenhouse gases emitted as a result of the supplier
chain linked to activities at each establishment as well as on‐site activities (scope 1, 2, 3).
2. The number of employees at each establishment in each year is translated into to annual
amount of value added activity at each establishment using IMPLAN input‐output
economic models of Los Angeles County for each year. These models and county‐level
data for use in the models are produced by MIG, Inc. The annual amount of value added
activity is converted to 2002 dollars because both the U.S. EIO‐LCA model and the
California MRIO‐LCA models are derived from the 2002 industry input‐output tables
produced by the U.S. Bureau of Economic Analysis.
3. The amount of value added activity that corresponds with $1 million output in each
industry is obtained from the U.S. Economic Input‐Output Life Cycle Assessment (EIO‐
LCA) model developed by Green Design Institute, Carnegie Mellon University, (2008).
Figure A.2: Estimating Life Cycle Establishment Emissions
Employment data from CA EDD, 1996-2011, with NAICS 6-digit coding and addresses for each establishment in LA County used to determine the location, type and scale of industry activity
IMPLAN economic models and 1996-2011 data for LA County used to obtain the amount of value added per employee in each industry, converted to 2002 $
Green Design Institute, Carnegie Mellon University, U.S. Economic Input-Output Life Cycle Assessment (2008) used to determine amount of value added per $1 million output in each industry
Emissions pegged to level of value added activity in each industry:U.S. EIO-LCA VA per $1 M output /LA Co. VA per worker =# LA workers to produce emissions linked to $1 M output in each industry
U.S. EIO-LCA total emission factors from CMU multiplied by value added per worker factor for each industry to estimate emissions from each establishment
Annual EIO-LCA energy consumption and emission factors adjusted based on changes since 2002 in the annual ratio of electricity consumption to value added in each industry, using MWh data from CEC and value added data from IMPLAN

A‐7
This makes it possible to link estimates to value added activity rather than to output,
which closely equates to sales. The United States EIO‐LCA model, which is used for life
cycle estimates, includes an economic factor for value added. This factor is preferable to
the economic output factor because as the unit of geography shrinks from nation to state
to county, an increasing share of goods and services that are sold are imported from
other regions rather than produced locally. Using the amount of value added activity
rather than the value of output to drive the model prevents estimates of environmental
effects from inflating as geography shrinks.
4. The value added factor that is associated with $1 million in economic output by each
industry is scaled proportionate to the amount of value added activity at each
establishment in each year. Therefore, a fraction of the impact associated with $1 million
in output is attributed to a small establishment; many multiples of the $1 million impact
being attributed to a large establishment.
5. Annual EIO‐LCA energy consumption and emission factors were adjusted based on
changes since 2002 in the annual ratio of electricity consumption to value added in each
industry, using electricity consumption data from the Energy Commission and value
added data from IMPLAN.
6. The scale of value added activity at each establishment (converted to fractions or
multiples of the impact associated with $1 million in output by the industry) was
multiplied by the United States EIO‐LCA life cycle factors for each industry. This
produced estimates of life cycle environmental impacts for each establishment. The
primary factor used in this analysis was Total Metric Tons CO2 equivalent. The total list
of factors included in the model at the time it was used for this study included:
Total Economic Output ($ Million)
Total Value Added ($ Million)
Employee Compensation Portion of Value Added ($ Million)
Net Taxes Portion of Value Added ($ Million)
Profits Portion of Value Added ($ Million)
Direct Economic Outlays ($ Million)
Direct Economic Outlays as Percent of Total Economic Output
Total Metric Tons CO2 equivalent
CO2 Fossil Metric Tons CO2 equivalent
CO2 Process Metric Tons CO2 equivalent
CH4 Metric Tons CO2 equivalent
N2O Metric Tons CO2 equivalent
HFC/PFCs Equivalent Metric Tons CO2 equivalent
Total Energy Terajoules

A‐8
Coal Terajoules
Natural Gas Terajoules
Petroleum Terajoules
Bio/Waste Terajoules
Non‐Fossil Electricity Terajoules
Hazardous Waste Generated ‐ Short Tons
Carcinogens Milligrams of C2H3Cl equivalent
Non‐carcinogens Milligrams of C2H3Cl equivalent
Respiratory Inorganics ‐ Kilograms of PM2.5 equivalent
Ozone Layer Depletion ‐ Kilograms of CFC‐11 equivalent
Respiratory Organics ‐ Kilograms of C2H4 equivalent
Aquatic Ecotoxicity Gigagrams of TEG water
Terrestrial ecotoxicity Gigagrams of TEG soil
Terrestrial Acid/Nutrification Kilograms of SO2 equivalent
Aquatic Acidification ‐ Kilograms of SO2 equivalent
Aquatic Eutrophication Kilograms of PO4 P‐lim
Water Use ‐ Thousands of Gallons
The actual computation of life cycle energy consumption and greenhouse gas emissions for each
establishment was as follows:
Table A.1: Computations for Life Cycle Energy Consumption and Greenhouse Gas Emissions
Formula for computing life cycle terajoules of energy from all sectors in 2011:
((va_wkr11 / us02va1m) * avgemp11) * (cec2011r * lc_tj_to)
Variable Description
va_wkr11 2011 value added per worker in industry in Los Angeles County, in 2002 dollars
us02va1m Value Added per $1 million of industry output in 2002 in US EIO-LCA Model
AvgEmp11 2011 Annual average employment
cec2011r 2011:2002 ratio of MWh per $1 million value added (constant $) based on California Energy Commission electricity consumption data and IMPLAN value added data
LC_TJ_TO Life cycle Total terajoules of energy from all sectors per $1 million industry output in 2002 - US 2002 EIO-LCA
Formula for computing life cycle metric tons of co2-equivalent emissions in 2011:
((va_wkr11 / us02va1m) * avgemp11) * (cec2011r * lc_co2eq)

A‐9
Variable Description
va_wkr11 2011 value added per worker in industry in Los Angeles County, in 2002 dollars
us02va1m Value Added per $1 million of industry output in 2002 in US EIO-LCA Model
AvgEmp11 2011 Annual average employment
cec2011r 2011:2002 ratio of MWh per $1M value added (constant $) based on California Energy Commission electricity consumption data and IMPLAN value added data
lc_co2eq Life cycle Total terajoules of energy from all sectors per $1 million industry output in 2002 - US 2002 EIO-LCA
A.5 Greenhouse Gas Emissions from Customer Trips to Commercial and Governmental Establishments (Scope 1)
The amount of gasoline consumed and greenhouse gas emissions produced by the customer
trips to each commercial and government establishment that is visited by the public was
estimated through the series of steps shown in Figure A.3 and described below.
Step 1: Estimate the annual gallons of gasoline consumed by light duty vehicles in Los
Angeles County. Source: California Air Resource Board Emissions Inventory for On‐
road Motor Vehicles, CEPAM: 2009 Almanac ‐ Population and Vehicle Trends Tool,
http://www.arb.ca.gov/app/emsinv/trends/ems_trends.php.
Step 2: Estimate and remove the share of the light‐duty vehicle fleet in Los Angeles County
that is commercially registered or operated by government agencies and therefore
was not used by the general public. Source: California Department of Motor Vehicles
Statistics, http://dmv.ca.gov/about/profile/ca_dmv_stats.pdf.
Step 3: Break out private, noncommercial vehicle trips by type: 1) commuting to work, 2)
trips to shop or conduct business, and 3) personal, non‐business trips. Remove all
trips except those to shop or conduct business. Source: SCAG 2001 Travel Survey,
University of Minnesota Metropolitan Travel Survey Archive, Codebook,
http://www.surveyarchive.org/sda/SCAG2000/doc/hcbk.htm, Data:
http://www.surveyarchive.org/archive.html.
Step 4: Estimate the number of trips generated per employee in each commercial and
government industry that is visited by the general public. Source: California
Emissions Estimator Model, Table 4.3 Mobile Trip Rates, South Coast Air Quality
Management District, 2011, http://www.caleemod.com/.
Step 5: Remove all industries that do not sell or provide services to the public.
Step 6: Compute the estimated number of trips generated by each commercial and
government establishment that is visited by the general public based on the industry
classification of the establishment, the trip generation factor for that industry, and
the number of employees at the establishment. Aggregate the total number of

A‐10
estimated annual trips and compute each establishment’s share of total customer
trips in Los Angeles County.
Step 7: Multiply each establishments share of total customer trips generated in the county
by the number of gallons of gasoline consumed by the general public making
customer trips to commercial and government establishments (estimated in step 3) to
estimate the gallons of gasoline consumed by customers making trips to each
establishment.
Step 8: Use the GREET 1 2011 emissions model developed by Argonne National Laboratory,
selecting factors for average light vehicle mileage and fuel mix for California, to
estimate that 19.646179 pounds or 0.008911356955511 metric tons of greenhouse
gas emissions are produced by each gallon of gasoline consumed in vehicle
operation (this excluded life cycle emissions associated with extracting and refining
petroleum, and transporting it to gas stations). Multiply the gallons consumed for
customer trips to each establishment by the emissions produced by each gallon to
estimate direct annual greenhouse gas emissions from customer trips to each
establishment. Source: Argonne National Laboratory, GREET 1 Series (Fuel‐Cycle
Model), http://greet.es.anl.gov/index.php?content=download1x.
Figure A.3: Estimating Emissions Generated by Customer Trips to Establishments
ARB data used to estimate annual gasoline consumption by light-duty vehicles
DMV data used to estimate and remove annual gasoline consumption by vehicles in business and government fleets
California Emissions Estimator Model used to estimate the ratio of trips to number of employees at each type of business
Each establishment’s share of total customer trips in LA County estimated based on industry classification and number of employees
SCAG 2001 travel survey data used to estimate share of trips and county gasoline consumption for customer trips
Establishment shares of customer trips used to estimate shares of county gasoline consumption
Argonne National Laboratory GREET 1 2011 emissions model, with average light vehicle mileage and fuel mix for California, used to estimate used to estimate GHG emissions per gallon of gasoline from vehicle operations related to customer trips
NAICS classifi-cations used to remove industries that do not sell to the public

A‐11
A.6 Discussion of MRIO-LCA and EIO-LCA
Economic input‐output (EIO) models capture the monetary transactions between industry
sectors in mathematical form. EIO models indicate what goods or services (or output of an
industry) are consumed by other industries (or used as input). The Green Design Institute,
Carnegie Mellon University, has appended information on emissions to the environment to the
EIO model. This creates an additional column representing ʺthe environmentʺ sector, and the
value in each row represents the pollutant ʺoutputʺ from an industry sector that is ʺinputʺ to
this sector. This tracks environmental implications through the entire matrix of industry‐to‐
industry and industry‐to‐consumer relationships, enabling quantification of how increased
demand for output from one sector influences the output of pollutants to the environment.
Two key strengths of EIO‐LCA are its comprehensiveness and its consistency: a single
framework of industry relationships is used to produce energy and emissions factors for every
industry, covering the entire economy. Without the use of EIO‐LCA, the research team would
not be able to quantify the embedded energy and emissions associated with economic flows, as
the required number of process‐based LCAs is prohibitively high. However, because these
relationships are California averages for direct impacts estimated using the MRIO‐LCA and
United States averages for life cycle impacts estimated the EIO‐LCA, a degree of uncertainty is
introduced when these models are applied to Los Angeles County.
It was possible to reduce this uncertainty when estimating direct emissions using the MRIO‐
LCA model by benchmarking model results against annual energy consumption data for each
industry in Los Angeles County from the Energy Commission. This benchmarking corrects for
differences between industry processes in Los Angeles County compared to statewide industry
processes as well as for changes in industry technology since the 2002 data that was used to
develop the MRIO‐LCA model.
The uncertainties inherent in the MRIO‐LCA and EIO‐LCA models are also reduced by using
the results to compare and rank industries rather than to estimate the overall inventory of
energy consumption and greenhouse emissions by commercial and government activity in Los
Angeles County.

B‐1
APPENDIX B: Spatial Co-Occurrence of Indicators of Social Well Being and Commercial Energy Consumption and Greenhouse Gas Emissions
B.1 Overview
The connection of individuals and families through geographic proximity or employment to
commercial establishments with high levels of energy consumption and accompanying
greenhouse emissions might be linked to diminished levels of well‐being, including long‐term
unemployment, housing insecurity, unfulfilled educational potential, diminished health and
wellbeing, social isolation, and homelessness. Thirty‐three geographically disaggregated social
indicators for Los Angeles County were used to explore potential relationships between energy‐
intensive stationary commercial activities and human well‐being. These indicators capture a
wide range of information about residents of Los Angeles County, including demographics,
housing, poverty, earnings, access to transportation, health, and child and family wellbeing.
B.2 Description of Social Indicator Data
This assessment was conducted at the level of census tracts, of which there are 2,346 in Los
Angeles County (Figure B.1). The correlation between social indicators and energy consumption
and greenhouse gas emissions was investigated for 2,200 census tracts that had at least 300
residents and 100 jobs in 2010. The other 146 census tracts that did not meet these thresholds
and were excluded from the correlations.
Possible spatial relationships between social indicators and energy consumption were screened
using the coefficient of determination, r‐squared, which is the proportion of variation in the
dependent variable (a social indicator) that is accounted for by variation in the independent
variable (an environmental impact). This statistic can be interpreted as the percent of change in
the dependent variable that is explained by change in the independent variable. It should be
noted that this statistic describes the strength of association between pairs of indices and
demonstrates the extent to which they change together but it does not demonstrate causation.
Strong r‐squared values would be a preliminary indicator of an association that could then be
explored with additional statistical tests.
Using the 2,200 census tracts with the minimum number of residents and workers, 21,252
correlations were produced to explore the strength of association between 33 different social
indicators and 644 different breakouts of energy and environmental impacts.

B‐2
B.2.1 Data Sources
Three data sources were used to develop social indicators that were spatially overlaid on energy
consumption data. Researchers used the following public data sets:
American Community Survey (ACS) 2006‐2010 Five‐Year Estimates from the U.S.
Census Bureau. These are sample‐based estimates of population and housing
characteristics at the level of census tracts.
American Community Survey (ACS) 2006‐2010 Public Use Microdata Sample (PUMS)
from the U.S. Census Bureau.
Longitudinal database of public assistance records for 10 million residents of Los
Angeles County who received public assistance from 2002 through 2010, including
records of homeless episodes.
Figure B.1: Census Tracts in Los Angeles County, 2010

B‐3
These data sources are the strongest (and in many cases, the only) available for the development
of a range of social indicators at the census tract level.
A total of 33 social indicators were used to test associations between energy consumption and
social sustainability. These indicators were selected based upon researchers’ previous work and
familiarity with data sources that are both geographically specific and up‐to‐date.21 The full set
of indicators spans five categories: nativity and social isolation, poverty and earnings, housing,
transportation, and homelessness. The rerationale for including each category, as well as the
indicators developed for each, is described below.
B.2.1.1 Nativity and Social Isolation
Areas with higher numbers of newly arrived residents such as non‐citizens, can experience
higher levels of social isolation and residential instability. Indicators include:
Number of residents 18 years of age and older that are not U.S. citizens.
Percent of residents 18 years of age and older that are not U.S. citizens.
Number of residents under 18 years of age that are not U.S. citizens.
Percent of residents under 18 years of age that are not U.S. citizens.
Total number of residents of all ages that are not U.S. citizens.
Percent of residents of all ages that are not U.S. citizens.
Percent of households with no one 14 and over who speaks English only or speaks
English ʺvery wellʺ.
Number of households in which no one 14 and over who speaks English only or speaks
English ʺvery well.ʺ
21 See, for example:
Economic Roundtable (2007). “Socioeconomic and Health Indicators for Los Angeles County.”
Economic Roundtable (2012). “Affordable Housing Benefit Fee Study: The Nexus between New Market‐
Rate Development and the Subsequent Increase in Demand for Affordable Housing in the City of Los
Angeles.”
Economic Roundtable (2009). “Ebbing Tides in the Golden State.”
Community Indicators Consortium (2012). “CIC Indicator Project Database.”
Urban Institute (2012). “Outcome Indicators Project.”

B‐4
B.2.1.2 Poverty and Earnings
These variables capture the county’s poverty and working poor population, including families
receiving public assistance. Researchers include these social indicators as a primary link to
patterns of energy consumption and emissions.
Percent of household receiving Food Stamps in the past 12 months.
Number of households receiving Food Stamps in the past 12 months.
Percent of households with public assistance income.
Number of households with public assistance income.
Percent of families with children under five years with incomes below the poverty level.
Percent of families with income in the past 12 months below the poverty level.
Number of families with income in the past 12 months below the poverty level.
Ratio of census tract median income to California statewide median income.
B.2.1.3 Housing
The Los Angeles region has a significant housing shortage, which leads to overcrowded
housing units.22 Rent burden is also high among residents, where more than 30 percent of their
income goes towards paying the rent.
Number of households that are rent burdened, paying 30% to 49% of income for rent.23
Number of households that are severely rent burdened, paying 50% + of income for
rent.24
Percent of households that are rent burdened, paying 30% to 49% of income for rent.
Percent of households that are severely rent burdened, paying 50% + of income for rent.
Percent that are rent burdened or severely rent burdened.
Percent of renter‐occupied housing that is over‐crowded, 1.01 ‐ 1.50 occupants per
room.25
22 See Economic Roundtable (2009). “Economic Study of the Rent Stabilization Ordinance and the Los
Angeles Housing Market” and Economic Roundtable (2012). “Affordable Housing Benefit Fee Study: The
Nexus between New Market‐Rate Development and the Subsequent Increase in Demand for Affordable
Housing in the City of Los Angeles.”
23 Between 30 and 50 percent of household income goes to pay rent.
24 More than 50 percent of income goes to pay rent.
25 The standard definition of overcrowding is more than one person per room (including kitchen and
living room, excluding bathrooms). The standard definition of severe overcrowding is more than 1.5
person per room.

B‐5
Percent of renter‐occupied housing that is severely over‐crowded, 1.51 or more
occupants per room.
Percent of renter‐occupied housing units with any level of over‐crowding.
Number of renter‐occupied housing units that are over‐crowded, 1.01 ‐ 1.50 occupants
per room.
Number of renter‐occupied housing units that are severely over‐crowded, 1.51 or more
occupants per room.
Number of renter‐occupied housing units with any level of over‐crowding.
Percent of households with sub‐families (i.e., housing units with families doubled‐up). 26
Number of households with sub‐families.
B.2.1.4 Transportation
A further measure of economic connectedness is access to private vehicles, which is reported by
the US Census Bureau.
Percent of workers 16 years of age and older that are transit dependent.
Number of workers 16 years of age and older that are transit dependent.
B.2.1.5 Homelessness
Data on homelessness and disconnection from the built environment came from the
administrative record system of the Los Angeles County Department of Public Social Services.
The application process for public assistance programs, including cash aid, Medi‐Cal and food
stamps records instances when applicants self‐declared that they were homeless. This indicator
is based on residents who experienced homelessness for 1+ month in 2010
Number of persons homeless for one month or more in 2010 with no prior documented
episodes of homelessness.
Percent of residents in census tract that were homeless for one month or more in 2010
with no prior documented episodes of homelessness.
B.2.1.6 Complete List of Social Indicators
A summary list of the 33 social indicators that were correlated with environmental indicators at
the census‐tract level is as follows:
1. Number of residents 18 years of age and older that are not U.S. citizens.
26 The US Census Bureau defines a sub‐family as “a married couple (with or without children) or a single
parent with one or more never‐married children under the age of 18, residing with and related to the
householder, but not including the householder or the householder’s spouse. When grown children move
back to the parental home with their own children or spouse, they are considered a subfamily.”

B‐6
2. Percent of residents 18 years of age and older that are not U.S. citizens.
3. Number of residents under 18 years of age that are not U.S. citizens.
4. Percent of residents under 18 years of age that are not U.S. citizens.
5. Total number of residents of all ages that are not U.S. citizens.
6. Percent of residents of all ages that are not U.S. citizens.
7. Percent of households with no one 14 and over who speaks English only or speaks
English ʺvery well.ʺ
8. Number of households in which no one 14 and over who speaks English only or speaks
English ʺvery well.ʺ
9. Percent of household receiving Food Stamps in the past 12 months.
10. Number of households receiving Food Stamps in the past 12 months.
11. Percent of households with public assistance income.
12. Number of households with public assistance income.
13. Percent of families with children under 5 years with incomes below the poverty level.
14. Percent of families with income in the past 12 months below the poverty level.
15. Number of families with income in the past 12 months below the poverty level.
16. Ratio of census tract median income to California statewide median income.
17. Number of households that are rent burdened, paying 30 percent to 49 percent of
income for rent.
18. Number of households that are severely rent burdened, paying 50 percent + of income
for rent.
19. Percent of households that are rent burdened, paying 30 percent to 49 percent of
income for rent.
20. Percent of households that are severely rent burdened, paying 50 percent + of income
for rent.
21. Percent that are rent burdened or severely rent burdened.
22. Percent of renter‐occupied housing that is over‐crowded, 1.01 ‐ 1.50 occupants per
room.
23. Percent of renter‐occupied housing that is severely over‐crowded, 1.51 or more
occupants per room.
24. Percent of renter‐occupied housing units with any level of over‐crowding.
25. Number of renter‐occupied housing units that are over‐crowded, 1.01 ‐ 1.50 occupants
per room.
26. Number of renter‐occupied housing units that are severely over‐crowded, 1.51 or more
occupants per room.
27. Number of renter‐occupied housing units with any level of over‐crowding.

B‐7
28. Percent of households with sub‐families (i.e., housing units with families doubled‐up).
29. Number of households with sub‐families.
30. Percent of workers 16 years of age and older that are transit dependent.
31. Number of workers 16 years of age and older that are transit dependent.
32. Number of persons homeless for one month or more in 2010 with no prior documented
episodes of homelessness.
33. Percent of residents in census tract that were homeless for one month or more in 2010
with no prior documented episodes of homelessness.
B.3 Spatial Co-Occurrence of Environmental Indicators and Social Indicators
B.3.1 Purpose
This assessment of the spatial relationship of social indicators to energy consumption and
greenhouse gas emissions by stationary commercial activities in Los Angeles County provides
evidence about whether energy‐intensive commercial activities and greenhouse gas emissions
are a burden borne disproportionately by disadvantaged communities or whether these impacts
are spread across all communities.
Figures B.2 to B.5 help visualize the question investigated through this task. Figures B.2 and B.3
show the spatial distribution of two key social indicators – rates of poverty and of precarious
housing at the census tract level in 2010. Figures B.4 and B.5 show the spatial distribution of two
key environmental indicators – estimated direct energy consumption and greenhouse gas
emissions by stationary commercial activities at the census tract level in 2010. The question
investigated is, are these indicators and impacts spatially co‐occurent or spatially unrelated?
Using the 2,200 census tracts with minimum numbers of residents and workers, 21,252
correlations were produced to explore the strength of association between 33 different social
indicators and 644 different breakouts of energy and environmental impacts.
B.3.2 Findings about Co-Occurrence of Environmental and Social Indicators B.3.2.1 Total Direct Impacts per Census Tract and per Job
Nine measures of total energy consumption and greenhouse gas emissions by establishments
located in each census tract were correlated with the 33 social indicators. Half of the correlations
were for total impacts, the other half for impacts per job.
1. Total terajoules of energy directly consumed in 2010.
2. Total metric tons of total energy CO2 directly generated in 2010.
3. Total metric tons of greenhouse gases directly generated in 2010.
4. Total metric tons of process CO2 directly generated in 2010.

B‐8
Figure B.2: Percent of Families in Poverty by Census Tract - 2010
Figure B.3: Percent of Households that are Rent Burdened by Census Tract - 2010

B‐9
Figure B.4: Terajoules of Energy Directly Consumed by Establishments in Census Tract
B‐10
5. Total metric tons of CH4 directly generated in 2010.
6. Total metric tons of N2O directly generated in 2010.
7. Total metric tons of HFC/PFCs directly generated in 2010.
8. Total metric tons of PM10 directly generated in 2010.
9. Total metric tons of PM2.5 directly generated in 2010.
Results: No noteworthy correlations between the total quantity of environmental impacts and
social indicators were found.
B.3.2.2 Total Direct Impacts per Job in each Census Tract
Nine measures of energy consumption and greenhouse gas emissions per job by establishments
located in each census tract were correlated with the 33 social indicators.
1. Total terajoules of energy directly consumed per job in 2010.
2. Total metric tons of total energy CO2 directly generated per job in 2010.
3. Total metric tons of greenhouse gases directly generated per job in 2010.
4. Total metric tons of process CO2 directly generated per job in 2010.
5. Total metric tons of CH4 directly generated per job in 2010.
6. Total metric tons of N2O directly generated per job in 2010.
7. Total metric tons of HFC/PFCs directly generated per job in 2010.
8. Total metric tons of PM10 directly generated per job in 2010.
9. Total metric tons of PM2.5 directly generated per job in 2010.
Results: No noteworthy correlations between these key measures of environmental impacts and
social indicators were found. The strongest r‐squared value was only 0.03.
B.3.2.3 Total Direct Impacts per Census Tract Ranked by Quintile and Correlated with Social Impacts Ranked by Quintile
Grouping variable values into bracketed categories is a method for identifying more clearly the
relationships between variables. In this instance, census tracts were ranked based on each of the
9 measures of total impacts listed above for Worksheet 1, and assigned to one of five categories
based on the total quantity of each impact. The same thing was done for each of the 33 social
impact variables. Several environmental and social impact variables could not be reclassified for
this method of correlation because over 20 percent of the census tracts had a value of zero for
the variable. Empty cells are seen in the rows and columns for variables where this was the case.

B‐11
Results: This method of correlation produced slightly higher r‐squared values than are shown
for comparable correlations in Worksheet 1, however no noteworthy correlations were
identified. The strongest r‐squared value was only 0.09.
B.3.2.4 Direct Electricity Consumed and Emissions Linked to Delivered Electricity in Census Tracts where Establishments are Located
The Carnegie Mellon Green Design Institute U.S. EIO‐LCA model for 2002 was used to estimate
direct electricity consumption by each industry in each census tract. The California Energy
Commission Power Source Report for 2010 was used to identify the sources of electric power in
each utility district. In addition, the GREET 1 Fuel‐Cycle Model was used to estimate the range
of emissions produced by electricity consumed by stationary commercial establishments in each
census tract. This information yielded the 36 categories of electricity consumption and
emissions listed below. Two types of correlations were conducted for each of these 36
categories, the first based on total quantities per census tract, the second based on quantities per
job in each census tract. This resulted in 72 environmental factors related to direct electricity
consumption being correlated with the 33 social indicators.
1. Terajoules of electricity delivered to establishment in 2010.
2. Metric tons of CO2‐equivalent generation emissions from delivered electricity (after T&D
Losses) CA Power Source Report 2010, emissions from GREET 1 Fuel‐Cycle Model.
3. Kilograms of SO2 generation emissions from delivered electricity (after T&D Losses), CA
Power Source Report 2010, emissions from GREET 1 Fuel‐Cycle Model.
4. Kilograms of CO generation emissions from delivered electricity (after T&D Losses), CA
Power Source Report 2010, emissions from GREET 1 Fuel‐Cycle Model.
5. Kilograms of NOX generation emissions from delivered electricity (after T&D Losses),
CA Power Source Report 2010, emissions from GREET 1 Fuel‐Cycle Model.
6. Kilograms of VOC generation emissions per TJ delivered electricity (after T&D Losses),
CA Power Source Report 2010, emissions from GREET 1 Fuel‐Cycle Model.
7. Kilograms of PM10 generation emissions from delivered electricity (after T&D Losses),
CA Power Source Report 2010, emissions from GREET 1 Fuel‐Cycle Model.
8. Kilograms of PM2.5 generation emissions from delivered electricity (after T&D Losses),
CA Power Source Report 2010, emissions from GREET 1 Fuel‐Cycle Model.
9. Metric tons of CO2‐equivalent precombustion emissions from delivered electricity, CA
Power Source Report 2010, emissions from GREET 1 Fuel‐Cycle Model.
10. Kilograms of SO2 precombustion emissions from delivered electricity, CA Power Source
Report 2010, emissions from GREET 1 Fuel‐Cycle Model.
11. Kilograms of CO precombustion emissions from delivered electricity, CA Power Source
Report 2010, emissions from GREET 1 Fuel‐Cycle Model.
12. Kilograms of NOX precombustion emissions from delivered electricity, CA Power
Source Report 2010, emissions from GREET 1 Fuel‐Cycle Model.

B‐12
13. Kilograms of VOC precombustion emissions from delivered electricity, CA Power
Source Report 2010, emissions from GREET 1 Fuel‐Cycle Model.
14. Kilograms of PM10 precombustion emissions from delivered electricity, CA Power
Source Report 2010, emissions from GREET 1 Fuel‐Cycle Model.
15. Kilograms of PM2.5 precombustion emissions from delivered electricity, CA Power
Source Report 2010, emissions from GREET 1 Fuel‐Cycle Model.
16. Metric tons of CO2‐equivalent electricity transmission and distribution (i.e., losses)
emissions from delivered electricity, CA Power Source Report 2010, emissions from
GREET 1 Fuel‐Cycle Model.
17. Kilograms of SO2 electricity transmission and distribution (i.e., losses) emissions per TJ
delivered electricity CA Power Source Report 2010, emissions from GREET 1 Fuel‐Cycle
Model.
18. Kilograms of CO from electricity transmission and distribution (i.e., losses) emissions
from delivered electricity, CA Power Source Report 2010, emissions from GREET 1 Fuel‐
Cycle Model.
19. Kilograms of NOX from electricity transmission and distribution (i.e., losses) emissions
per TJ delivered electricity, CA Power Source Report 2010, emissions from GREET 1
Fuel‐Cycle Model.
20. Kilograms of VOC from electricity transmission and distribution (i.e., losses) emissions
per TJ delivered electricity, CA Power Source Report 2010, emissions from GREET 1
Fuel‐Cycle Model.
21. Kilograms of PM10 from electricity transmission and distribution (i.e., losses) emissions
from delivered electricity, CA Power Source Report 2010, emissions from GREET 1 Fuel‐
Cycle Model.
22. Kilograms of PM2.5 from electricity transmission and distribution (i.e., losses) emissions
from delivered electricity, CA Power Source Report 2010, emissions from GREET 1 Fuel‐
Cycle Model.
23. Total metric tons of CO2‐equivalent emissions from delivered electricity, CA Power
Source Report 2010, emissions from GREET 1 Fuel‐Cycle Model.
24. Total kilograms of SO2 emissions from delivered electricity, CA Power Source Report
2010, emissions from GREET 1 Fuel‐Cycle Model.
25. Total kilograms of CO emissions from delivered electricity, CA Power Source Report
2010, emissions from GREET 1 Fuel‐Cycle Model.
26. Total kilograms of NOX emissions from delivered electricity, CA Power Source Report
2010, emissions from GREET 1 Fuel‐Cycle Model.
27. Total kilograms of VOC emissions from delivered electricity, CA Power Source Report
2010, emissions from GREET 1 Fuel‐Cycle Model.
28. Total kilograms of PM10 emissions from delivered electricity, CA Power Source Report
2010, emissions from GREET 1 Fuel‐Cycle Model.

B‐13
29. Total kilograms of PM2.5 emissions from delivered electricity, CA Power Source Report
2010, emissions from GREET 1 Fuel‐Cycle Model.
30. Life cycle metric tons of CO2‐equivalent emissions from delivered electricity in 2010.
31. Life cycle kilograms of SO2 emissions from delivered electricity in 2010.
32. Life cycle kilograms of CO emissions from delivered electricity in 2010.
33. Life cycle kilograms of NOX emissions from delivered electricity in 2010.
34. Life cycle kilograms of VOC emissions from delivered electricity in 2010.
35. Life cycle kilograms of PM10 emissions from delivered electricity in 2010.
36. Life cycle kilograms of PM2.5 emissions from delivered electricity in 2010.
Results: No noteworthy correlations between these key measures of environmental impacts and
social indicators were found. The strongest r‐squared value was 0.10 for the association
between residential locations of non‐citizen residents and upstream emissions from generating
electricity.
B.3.2.5 Life Cycle Energy and Greenhouse Gas Impacts from Establishments Located in each Census Tract
The Carnegie Mellon Green Design Institute U.S. EIO‐LCA model for 2002 was used to estimate
life cycle energy consumption and greenhouse gas emissions by each industry in each census
tract. The five life cycle impacts listed below were calculated as totals for each industry in each
census tract, and then recalculated as life cycle impacts per job in each tract, resulting in 10
correlations with the 33 social indicators.
Total Impacts
Metric tons of CO2‐equivalent emissions in 2010, US EIO‐LCA life cycle effect.
Metric tons of CO2‐equivalent CH4 emissions in 2010, US EIO‐LCA life cycle effect.
Metric tons of CO2‐equivalent N20 emissions in 2010, US EIO‐LCA life cycle effect.
Metric tons of CO2‐equivalent HFC/PFC emissions in 2010, US EIO‐LCA life cycle effect.
Total terajoules of energy from all sectors in 2010, US EIO‐LCA life cycle effect.
Impacts per Job
Metric tons of CO2‐equivalent emissions in 2010, US EIO‐LCA life cycle effect.
Metric tons of CO2‐equivalent CH4 emissions in 2010, US EIO‐LCA life cycle effect.
Metric tons of CO2‐equivalent N2O emissions in 2010, US EIO‐LCA life cycle effect.
Metric tons of CO2‐equivalent HFC/PFC emissions in 2010, US EIO‐LCA life cycle effect.

B‐14
Total terajoules of energy from all sectors in 2010, US EIO‐LCA life cycle effect.
Results: No noteworthy correlations between these measures of life cycle environmental impacts
and social indicators were found. The strongest r‐squared value was only 0.03.
B.3.2.6 Emissions from Gasoline Consumed for Customer Trips to Establishments Located in Census Tracts
The California Emissions Estimator Model was used to estimate the number of customer trips
generated by each employee in each industry. This information was used together with the
other methodological steps described in the methods paper to estimate the emissions generated
by customer trips to establishments in each census tract. The two factors below, total emissions
by establishments’ customers and emissions per job were each correlated with the 33 social
indicators. These correlations address the question of whether locations with high levels of
customer traffic are associated with high levels of social impacts.
1. Total pounds per year of greenhouse gases emitted from gasoline consumed by public
customers in light vehicles traveling to establishments in each census tract.
2. Pounds per year per job of greenhouse gases emitted from gasoline consumed by public
customers in light vehicles traveling to establishments in each census tract.
Results: No noteworthy correlations between these measures of life cycle environmental impacts
and social indicators were found. The strongest r‐squared value was only 0.04.
B.3.2.7 Direct Industry Impacts in Census Tracts where Establishments are Located
The following 8 direct environmental impacts were estimated for each industry sector:
1. Total terajoules of energy directly consumed in 2010.
2. Total metric tons of total energy CO2 directly generated in 2010.
3. Total metric tons of greenhouse gases directly generated in 2010.
4. Total metric tons of CH4 directly generated in 2010.
5. Total metric tons of N2O directly generated in 2010.
6. Total metric tons of HFC/PFCs directly generated in 2010.
7. Total metric tons of PM10 directly generated in 2010.
8. Total metric tons of PM2.5 directly generated in 2010.
These impacts were estimated for the following 15 industry sectors in each census tract:
1. Mining, quarrying, and oil and gas extraction

B‐15
2. Utilities
3. Manufacturing
4. Wholesale trade
5. Retail trade
6. Transportation and warehousing
7. Information
8. Finance and insurance
9. Professional, scientific, and technical services
10. Administrative and support and waste management services
11. Educational services
12. Health care and social assistance
13. Arts, entertainment, and recreation
14. Accommodation and food services
15. Other services, except public administration
For each of the 15 industry sectors, the 8 environmental impacts were correlated with the 33
social indicators.
Results: High r‐squared values were obtained in the first two sectors, extractive industries and
utilities. The highest values obtained were 0.78 for the association between PM10 and PM2.5
emissions and the percent of households with public assistance income. However, these
associations may well be circular and produce falsely positive correlations. Only a small
number of census tracts had threshold levels of employment in extractive industries or utilities.
In the case of mining and other extractive industries, only 7 census tracts had 100 or more
workers in the industry as well as 300 residents; in the case of utilities, 42 census tracts met
these criteria. As a result, the high correlation between concentrations of activity in these
industries and high social impacts are not reliable because they may well not represent a
correlation between energy consumption or greenhouse emissions and social indicators. Rather,
they may well represent an association between proximity to inhospitable land uses in a small
number of neighborhoods and adverse social indicators.
B.3.2.8 Direct Environmental Impacts from Workers' Jobs Linked to their Place of Residence
Average energy consumption and greenhouse gas emissions for each job in each industry in Los
Angeles were computed. These averages were linked with census data about industry
employment by census tract to connect environmental impacts from workers’ jobs with the
place where they live rather than the place where they work. A total of 189 residence‐based
impacts were then correlated with the 33 social indicators.

B‐16
These correlations included the following 29 factors linked to the industries in which residents
are employed impacts per job:
1. Number of residents employed in Agriculture, forestry, fishing and hunting
2. Number of residents employed in Mining, quarrying, and oil and gas extraction
3. Number of residents employed in Construction
4. Number of residents employed in Manufacturing
5. Number of residents employed in Wholesale trade
6. Number of residents employed in Retail trade
7. Number of residents employed in Transportation and warehousing
8. Number of residents employed in Utilities
9. Number of residents employed in Information
10. Number of residents employed in Finance and insurance
11. Number of residents employed in Real estate and rental and leasing
12. Number of residents employed in Professional, scientific, and technical services
13. Number of residents employed in Management of companies and enterprises
14. Number of residents employed in Administrative and support and waste management
services
15. Number of residents employed in Educational services
16. Number of residents employed in Health care and social assistance
17. Number of residents employed in Arts, entertainment, and recreation
18. Number of residents employed in Accommodation and food services
19. Number of residents employed in Other services, except public administration
20. Number of residents employed in Public administration
21. Total Employed Residents
22. Terajoules per job directly consumed by establishments that employed residents in 2010
23. Terajoules of gasoline energy per job for commuting
24. Terajoules of gasoline energy per job for customer trips
25. Total terajoules directly consumed per job, including establishment energy
consumption, worker commutes and customer trips in 2010
26. Metric tons of GHG per job
27. Metric tons of GHG emissions from commuting per job
28. Metric tons of GHG per job for customer trips
29. Total metric tons of direct GHG emissions per job, including establishment energy
consumption, worker commutes and customer trips in 2010

B‐17
Eight environmental impacts were investigated for each of 20 industries based on the census
tracts where those workers resided. The 8 environmental factors included:
1. Total terajoules directly consumed by establishments that employ residents in 2010
2. Total terajoules of gasoline energy commuting to work in private vehicles
3. Total terajoules of gasoline energy for customer trips to establishments where residents
work
4. Total terajoules directly consumed by establishments that employ residents, including
worker commutes and customer trips in 2010
5. Total metric tons of GHG emissions by establishments that employed residents in 2010
6. Total metric tons of GHG emissions from residentsʹ work commutes in private vehicles
7. Total metric tons of GHG for customer trips to establishments where residents work
8. Total metric tons of direct GHG emissions by establishments that employ residents,
including worker commutes and customer trips in 2010
The 20 industry sectors for which the 8 environmental factors were investigated included:
1. Agriculture, forestry, fishing and hunting
2. Mining, quarrying, and oil and gas extraction
3. Construction
4. Manufacturing
5. Wholesale trade
6. Retail trade
7. Transportation and warehousing
8. Utilities
9. Information
10. Finance and insurance
11. Real estate and rental and leasing
12. Professional, scientific, and technical services
13. Management of companies and enterprises
14. Administrative and support and waste management services
15. Educational services
16. Health care and social assistance
17. Arts, entertainment, and recreation
18. Accommodation and food services
19. Other services, except public administration
20. Public administration
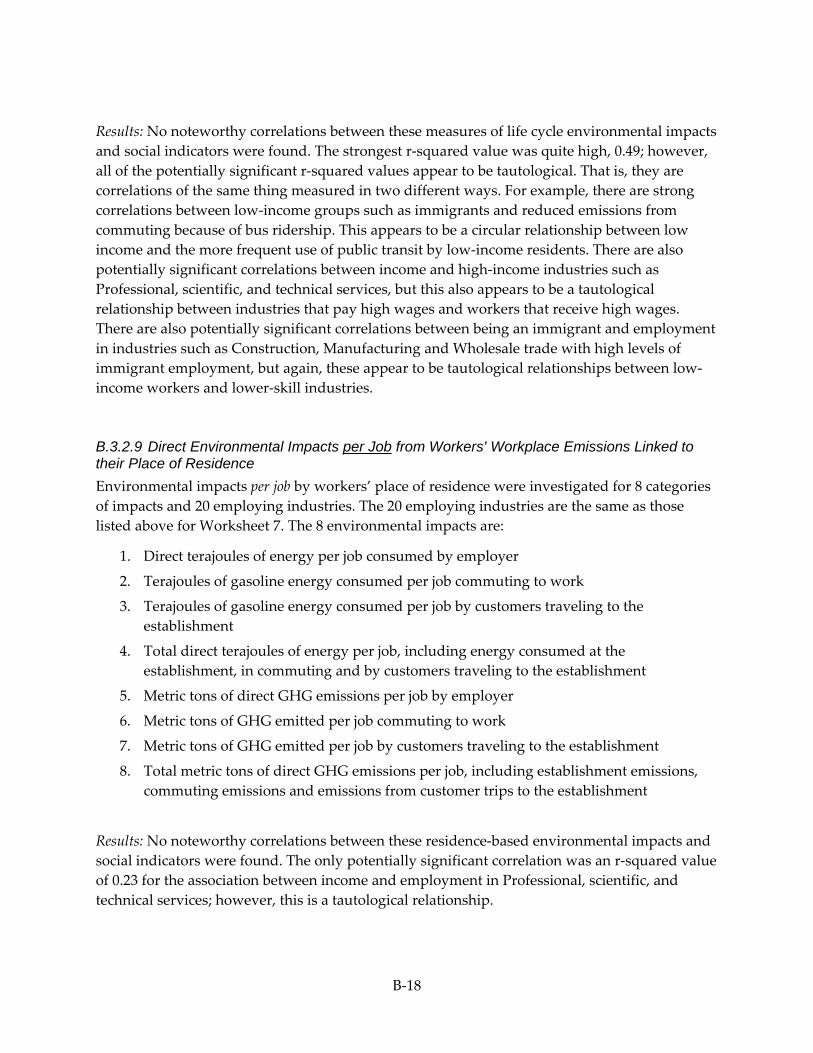
B‐18
Results: No noteworthy correlations between these measures of life cycle environmental impacts
and social indicators were found. The strongest r‐squared value was quite high, 0.49; however,
all of the potentially significant r‐squared values appear to be tautological. That is, they are
correlations of the same thing measured in two different ways. For example, there are strong
correlations between low‐income groups such as immigrants and reduced emissions from
commuting because of bus ridership. This appears to be a circular relationship between low
income and the more frequent use of public transit by low‐income residents. There are also
potentially significant correlations between income and high‐income industries such as
Professional, scientific, and technical services, but this also appears to be a tautological
relationship between industries that pay high wages and workers that receive high wages.
There are also potentially significant correlations between being an immigrant and employment
in industries such as Construction, Manufacturing and Wholesale trade with high levels of
immigrant employment, but again, these appear to be tautological relationships between low‐
income workers and lower‐skill industries.
B.3.2.9 Direct Environmental Impacts per Job from Workers' Workplace Emissions Linked to their Place of Residence
Environmental impacts per job by workers’ place of residence were investigated for 8 categories
of impacts and 20 employing industries. The 20 employing industries are the same as those
listed above for Worksheet 7. The 8 environmental impacts are:
1. Direct terajoules of energy per job consumed by employer
2. Terajoules of gasoline energy consumed per job commuting to work
3. Terajoules of gasoline energy consumed per job by customers traveling to the
establishment
4. Total direct terajoules of energy per job, including energy consumed at the
establishment, in commuting and by customers traveling to the establishment
5. Metric tons of direct GHG emissions per job by employer
6. Metric tons of GHG emitted per job commuting to work
7. Metric tons of GHG emitted per job by customers traveling to the establishment
8. Total metric tons of direct GHG emissions per job, including establishment emissions,
commuting emissions and emissions from customer trips to the establishment
Results: No noteworthy correlations between these residence‐based environmental impacts and
social indicators were found. The only potentially significant correlation was an r‐squared value
of 0.23 for the association between income and employment in Professional, scientific, and
technical services; however, this is a tautological relationship.

B‐19
B.3.3 Implications of Not Finding Spatial Correlation in the Occurrence of Environmental and Social Indicators
A wide net was cast to find associations between social indicators and energy consumed and
greenhouse gases emitted by stationary commercial activities. This investigation did not find a
disproportionate association between energy consumption and greenhouse gas emissions and
adverse social conditions such as poverty, precarious or overcrowded housing or linguistic
isolation. Rather, the environmental externalities associated with intense energy use and release
of greenhouse gases appear to be broadly shared by all neighborhoods in Los Angeles County.
It is important to note that this task investigated stationary commercial activities that are part of
the formal economy. Energy consumption and emission sources not covered by this analysis
include:
1. Residential land uses.
2. Mobile emission sources on the roadways and off‐road sites where those emissions
occur. An essential part of this analysis was that the emissions needed to be in close
proximity to workers’ homes. This narrowed the industry‐specific emissions sources to
stationary sources, i.e., establishment sites.
3. Informal economic activity.
This information about the baseline relationship between energy, greenhouse gases and social
indicators points toward using industry‐specific factors including environmental impacts, wage
levels, and industry viability in assessing trade‐offs between energy, environmental and
socioeconomic policy goals and regulations. These directly linked industry factors constitute the
available tools for addressing the three dimensions of sustainability ‐ environmental, economic
and social equity for stationary commercial activities.

C‐1
APPENDIX C: Energy Consumption, Greenhouse Gas Emissions and Wages, by Geographic Region
C.1 Direct Energy Consumption, GHG Emissions and Wages per Job
Variations in average terajoules, average metric tons of greenhouse gasses and annual average
wage, by 4‐digit NAICS industry, for Los Angeles County and City. Table cells with five or
fewer establishments are suppressed as “(s)”; table cells with no employment are presented
with “‐“.
Table C.1.1: Direct Energy Consumption, Greenhouse Gas Emissions and Wages, for Los Angeles County and City
Industry Title
& 4‐Digit Coding
NAICS 2007 Average Terajoules per
Job 2008
Average Terajoules per
Job 2009
Average Terajoules per
Job 2010
Average Terajoules per
Job 2011
Average Metric Tons of
GHG per Job 2008
Average Metric Tons of
GHG per Job 2009
Average Metric Tons of
GHG per Job 2010
Average Metric Tons of
GHG per Job 2011
Los Angeles County
Annual Average Wage
2011
City of Los Angeles
Annual Average Wage
2011
Oilseed and Grain Farming
(1111) 0.4 0.3 0.2 0.3 133 96 62 94 $59,140 (s)
Vegetable and Melon Farming
(1112) 0.3 0.4 0.5 0.7 30 38 47 56 $26,393 $22,375
Fruit and Tree Nut Farming
(1113) 0.2 0.4 0.5 0.6 15 33 41 47 $24,953 $24,756
Greenhouse, Nursery, and
Floriculture Production (1114) 0.3 0.4 0.6 0.7 13 18 26 30 $27,081 $30,542
Other Crop Farming (1119) 0.4 0.4 0.5 0.4 85 96 108 87 $26,841 $29,755
Cattle Ranching and Farming
(1121) 0.2 0.2 0.3 0.3 94 105 168 158 $43,279 $59,006
Poultry and Egg Production
(1123) 0.8 1.2 1.7 1.8 53 78 111 117 $16,401 (s)
Sheep and Goat Farming (1124) (s) (s) (s) (s) (s) (s) (s) (s) (s) ‐
Aquaculture (1125) 0.1 0.1 0.2 0.2 34 42 57 60 $37,236 (s)
Other Animal Production (1129) 0.1 0.1 0.2 0.2 34 42 57 60 $38,726 $49,675
Forest Nurseries and Gathering
of Forest Products (1132) (s) (s) (s) (s) (s) (s) (s) (s) (s) (s)
Logging (1133) 0.0 0.0 0.0 0.0 0 0 0 0 $15,207 $15,207
Fishing (1141) 0.2 0.4 0.5 0.7 4 9 10 13 $98,243 $135,820
Hunting and Trapping (1142) (s) (s) (s) (s) (s) (s) (s) (s) (s) ‐
Support Activities for Crop
Production (1151) 0.0 0.1 0.0 0.0 1 1 1 0 $33,728 $34,125
Support Activities for Animal
Production (1152) 0.0 0.0 0.0 0.0 0 0 0 0 $25,992 $33,400
Support Activities for Forestry
(1153) 0.0 0.0 0.0 0.0 0 0 0 0 $49,284 (s)

C‐2
Table C.1.1: Direct Energy Consumption, Greenhouse Gas Emissions and Wages, for Los Angeles County and City
Industry Title
& 4‐Digit Coding
NAICS 2007 Average Terajoules per
Job 2008
Average Terajoules per
Job 2009
Average Terajoules per
Job 2010
Average Terajoules per
Job 2011
Average Metric Tons of
GHG per Job 2008
Average Metric Tons of
GHG per Job 2009
Average Metric Tons of
GHG per Job 2010
Average Metric Tons of
GHG per Job 2011
Los Angeles County
Annual Average Wage
2011
City of Los Angeles
Annual Average Wage
2011
Oil and Gas Extraction (2111) 6.7 3.4 3.5 4.3 833 428 444 544 $223,146 $511,071
Coal Mining (2121) (s) (s) (s) (s) (s) (s) (s) (s) (s) (s)
Metal Ore Mining (2122) (s) (s) (s) (s) (s) (s) (s) (s) (s) (s)
Nonmetallic Mineral Mining
and Quarrying (2123) 2.3 1.4 2.1 1.8 5 3 5 4 $73,211 $68,554
Support Activities for Mining
(2131) 1.9 1.6 1.1 0.9 0 0 0 0 $88,622 $127,338
Electric Power Generation,
Transmission and
Distribution (2211)
87.9 74.2 88.7 81.8
1,546
1,305 1,561
1,439 $109,316 $109,356
Natural Gas Distribution (2212) 0.8 1.2 1.0 0.7 451 647 539 394 $83,114 $97,657
Water, Sewage and Other
Systems (2213) 1.9 2.0 2.2 1.3 321 352 373 222 $80,467 $87,091
Residential Building
Construction (2361) 0.3 0.4 0.3 0.4 0 0 0 0 $46,134 $43,877
Nonresidential Building
Construction (2362) 0.4 0.3 0.3 0.3 0 0 0 0 $69,698 $74,425
Utility System Construction
(2371) 0.3 0.3 0.4 0.3 0 0 0 0 $83,012 $71,520
Land Subdivision (2372) 0.3 0.3 0.4 0.3 0 0 0 0 $80,251 $77,390
Highway, Street, and Bridge
Construction (2373) 0.3 0.3 0.4 0.3 0 0 0 0 $71,981 $69,728
Other Heavy and Civil
Engineering Construction
(2379)
0.4 0.3 0.4 0.3 0 0 0 0 $77,175 $76,766
Foundation, Structure, and
Building Exterior Contractors
(2381)
0.4 0.3 0.3 0.3 0 0 0 0 $46,205 $39,889
Building Equipment Contractors
(2382) 0.4 0.4 0.3 0.3 0 0 0 0 $53,755 $48,995
Building Finishing Contractors
(2383) 0.4 0.4 0.3 0.3 0 0 0 0 $38,418 $34,671
Other Specialty Trade
Contractors (2389) 0.3 0.3 0.4 0.3 0 0 0 0 $46,864 $45,231
Animal Food Manufacturing
(3111) 0.6 0.7 0.8 0.7 17 18 22 19 $73,229 $56,337
Grain and Oilseed Milling (3112) 1.3 1.5 1.6 1.4 31 37 40 34 $53,102 $55,099
Sugar and Confectionery
Product Manufacturing (3113) 0.1 0.2 0.2 0.2 3 4 4 4 $44,487 $38,565
Fruit and Vegetable Preserving
and Specialty Food
Manufacturing (3114)
0.3 0.3 0.3 0.3 7 7 7 8 $46,878 $61,262
Dairy Product Manufacturing
(3115) 0.6 0.7 0.5 0.6 15 16 12 15 $75,916 $72,310

C‐3
Table C.1.1: Direct Energy Consumption, Greenhouse Gas Emissions and Wages, for Los Angeles County and City
Industry Title
& 4‐Digit Coding
NAICS 2007 Average Terajoules per
Job 2008
Average Terajoules per
Job 2009
Average Terajoules per
Job 2010
Average Terajoules per
Job 2011
Average Metric Tons of
GHG per Job 2008
Average Metric Tons of
GHG per Job 2009
Average Metric Tons of
GHG per Job 2010
Average Metric Tons of
GHG per Job 2011
Los Angeles County
Annual Average Wage
2011
City of Los Angeles
Annual Average Wage
2011
Animal Slaughtering and
Processing (3116) 0.2 0.2 0.2 0.1 6 5 5 3 $35,126 $35,088
Seafood Product Preparation
and Packaging (3117) 0.3 0.3 0.3 0.2 8 7 7 7 $29,697 $32,669
Bakeries and Tortilla
Manufacturing (3118) 0.1 0.1 0.1 0.1 4 4 4 4 $33,692 $32,090
Other Food Manufacturing
(3119) 0.3 0.2 0.3 0.2 6 6 6 6 $45,478 $44,821
Beverage Manufacturing (3121) 0.5 0.4 0.4 0.4 13 10 11 10 $60,697 $64,927
Tobacco Manufacturing (3122) (s) (s) (s) (s) (s) (s) (s) (s) (s) (s)
Fiber, Yarn, and Thread Mills
(3131) 0.3 0.4 0.3 0.4 4 6 5 6 $27,827 $52,477
Fabric Mills (3132) 0.4 0.3 0.3 0.4 13 11 10 12 $35,636 $40,465
Textile and Fabric Finishing and
Fabric Coating Mills (3133) 0.4 0.4 0.5 0.5 20 19 22 23 $30,919 $34,702
Textile Furnishings Mills (3141) 0.2 0.1 0.2 0.2 3 3 3 3 $38,952 $33,196
Other Textile Product Mills
(3149) 0.1 0.1 0.1 0.2 2 2 2 2 $34,474 $39,526
Apparel Knitting Mills (3151) 0.0 0.0 0.0 0.0 0 0 0 0 $31,527 $28,312
Cut and Sew Apparel
Manufacturing (3152) 0.0 0.0 0.0 0.0 0 0 0 0 $32,727 $30,474
Apparel Accessories and Other
Apparel Manufacturing
(3159)
0.1 0.1 0.1 0.1 0 0 0 1 $36,641 $36,653
Leather and Hide Tanning and
Finishing (3161) 0.1 0.1 0.0 0.1 0 1 0 0 $34,373 $59,510
Footwear Manufacturing (3162) 0.0 0.0 0.0 0.0 0 0 0 0 $28,426 $23,926
Other Leather and Allied
Product Manufacturing (3169) 0.0 0.0 0.0 0.0 0 0 0 0 $32,378 $41,322
Sawmills and Wood
Preservation (3211) 0.1 0.1 0.1 0.1 0 0 0 0 $28,158 $48,648
Veneer, Plywood, and
Engineered Wood Product
Manufacturing (3212)
0.1 0.1 0.1 0.1 0 0 1 1 $36,359 $33,335
Other Wood Product
Manufacturing (3219) 0.0 0.0 0.0 0.0 0 0 0 0 $31,870 $29,966
Pulp, Paper, and Paperboard
Mills (3221) 6.7 6.7 6.4 5.5 66 66 63 54 $41,316 (s)
Converted Paper Product
Manufacturing (3222) 0.4 0.4 0.4 0.4 10 11 11 11 $53,821 $38,686
Printing and Related Support
Activities (3231) 0.1 0.1 0.0 0.0 1 1 1 0 $42,598 $40,767
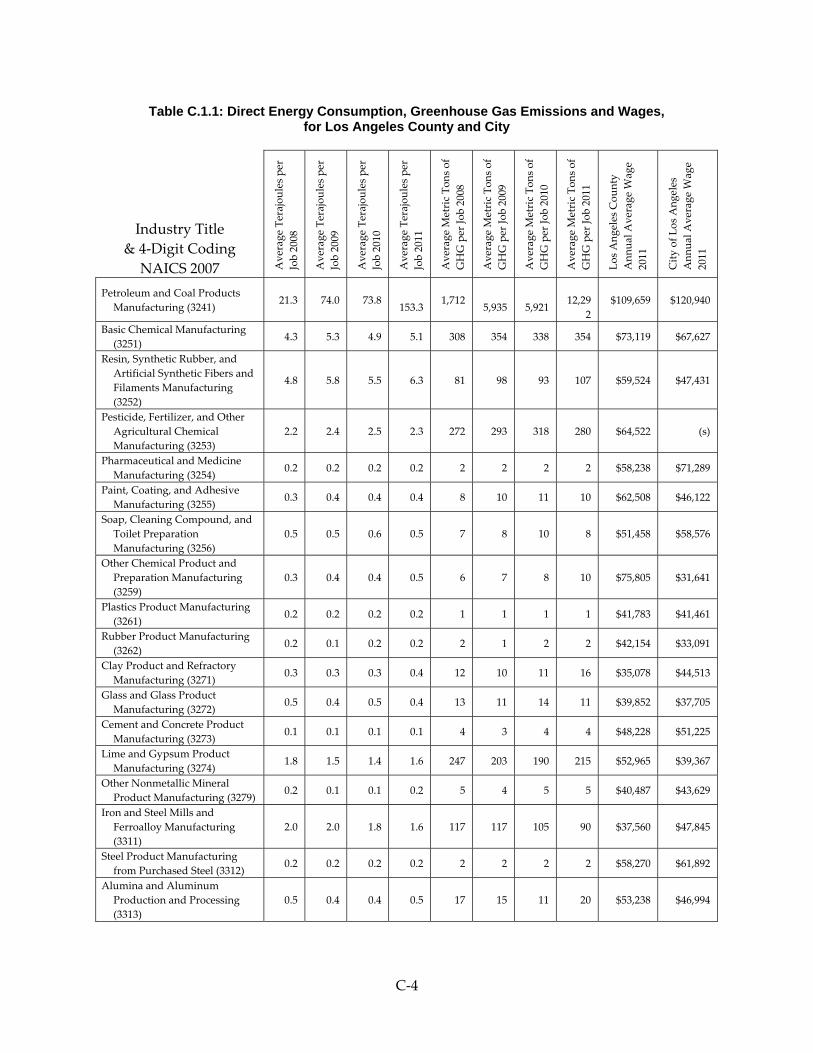
C‐4
Table C.1.1: Direct Energy Consumption, Greenhouse Gas Emissions and Wages, for Los Angeles County and City
Industry Title
& 4‐Digit Coding
NAICS 2007 Average Terajoules per
Job 2008
Average Terajoules per
Job 2009
Average Terajoules per
Job 2010
Average Terajoules per
Job 2011
Average Metric Tons of
GHG per Job 2008
Average Metric Tons of
GHG per Job 2009
Average Metric Tons of
GHG per Job 2010
Average Metric Tons of
GHG per Job 2011
Los Angeles County
Annual Average Wage
2011
City of Los Angeles
Annual Average Wage
2011
Petroleum and Coal Products
Manufacturing (3241) 21.3 74.0 73.8
153.3 1,712
5,935
5,921
12,29
2
$109,659 $120,940
Basic Chemical Manufacturing
(3251) 4.3 5.3 4.9 5.1 308 354 338 354 $73,119 $67,627
Resin, Synthetic Rubber, and
Artificial Synthetic Fibers and
Filaments Manufacturing
(3252)
4.8 5.8 5.5 6.3 81 98 93 107 $59,524 $47,431
Pesticide, Fertilizer, and Other
Agricultural Chemical
Manufacturing (3253)
2.2 2.4 2.5 2.3 272 293 318 280 $64,522 (s)
Pharmaceutical and Medicine
Manufacturing (3254) 0.2 0.2 0.2 0.2 2 2 2 2 $58,238 $71,289
Paint, Coating, and Adhesive
Manufacturing (3255) 0.3 0.4 0.4 0.4 8 10 11 10 $62,508 $46,122
Soap, Cleaning Compound, and
Toilet Preparation
Manufacturing (3256)
0.5 0.5 0.6 0.5 7 8 10 8 $51,458 $58,576
Other Chemical Product and
Preparation Manufacturing
(3259)
0.3 0.4 0.4 0.5 6 7 8 10 $75,805 $31,641
Plastics Product Manufacturing
(3261) 0.2 0.2 0.2 0.2 1 1 1 1 $41,783 $41,461
Rubber Product Manufacturing
(3262) 0.2 0.1 0.2 0.2 2 1 2 2 $42,154 $33,091
Clay Product and Refractory
Manufacturing (3271) 0.3 0.3 0.3 0.4 12 10 11 16 $35,078 $44,513
Glass and Glass Product
Manufacturing (3272) 0.5 0.4 0.5 0.4 13 11 14 11 $39,852 $37,705
Cement and Concrete Product
Manufacturing (3273) 0.1 0.1 0.1 0.1 4 3 4 4 $48,228 $51,225
Lime and Gypsum Product
Manufacturing (3274) 1.8 1.5 1.4 1.6 247 203 190 215 $52,965 $39,367
Other Nonmetallic Mineral
Product Manufacturing (3279) 0.2 0.1 0.1 0.2 5 4 5 5 $40,487 $43,629
Iron and Steel Mills and
Ferroalloy Manufacturing
(3311)
2.0 2.0 1.8 1.6 117 117 105 90 $37,560 $47,845
Steel Product Manufacturing
from Purchased Steel (3312) 0.2 0.2 0.2 0.2 2 2 2 2 $58,270 $61,892
Alumina and Aluminum
Production and Processing
(3313)
0.5 0.4 0.4 0.5 17 15 11 20 $53,238 $46,994

C‐5
Table C.1.1: Direct Energy Consumption, Greenhouse Gas Emissions and Wages, for Los Angeles County and City
Industry Title
& 4‐Digit Coding
NAICS 2007 Average Terajoules per
Job 2008
Average Terajoules per
Job 2009
Average Terajoules per
Job 2010
Average Terajoules per
Job 2011
Average Metric Tons of
GHG per Job 2008
Average Metric Tons of
GHG per Job 2009
Average Metric Tons of
GHG per Job 2010
Average Metric Tons of
GHG per Job 2011
Los Angeles County
Annual Average Wage
2011
City of Los Angeles
Annual Average Wage
2011
Nonferrous Metal (except
Aluminum) Production and
Processing (3314)
0.3 0.4 0.4 0.5 20 26 28 41 $54,540 $53,012
Foundries (3315) 0.1 0.1 0.2 0.1 1 1 1 1 $52,348 $34,238
Forging and Stamping (3321) 0.4 0.4 0.4 0.5 8 7 9 10 $54,890 $44,436
Cutlery and Handtool
Manufacturing (3322) 0.1 0.1 0.1 0.1 1 1 2 1 $40,522 $44,575
Architectural and Structural
Metals Manufacturing (3323) 0.1 0.1 0.1 0.1 1 1 1 1 $42,902 $40,262
Boiler, Tank, and Shipping
Container Manufacturing
(3324)
0.3 0.3 0.4 0.3 4 5 5 4 $66,742 $89,870
Hardware Manufacturing (3325) 0.1 0.1 0.1 0.1 1 1 1 1 $46,373 $28,938
Spring and Wire Product
Manufacturing (3326) 0.1 0.1 0.1 0.1 1 1 2 1 $39,167 $34,108
Machine Shops; Turned Product;
and Screw, Nut, and Bolt
Manufacturing (3327)
0.1 0.1 0.1 0.1 1 1 1 1 $52,942 $51,135
Coating, Engraving, Heat
Treating, and Allied Activities
(3328)
0.3 0.3 0.4 0.4 6 6 6 6 $40,492 $40,252
Other Fabricated Metal Product
Manufacturing (3329) 0.2 0.2 0.2 0.2 2 2 2 3 $58,138 $59,973
Agriculture, Construction, and
Mining Machinery
Manufacturing (3331)
0.1 0.1 0.1 0.1 1 1 1 1 $61,696 $37,713
Industrial Machinery
Manufacturing (3332) 0.1 0.1 0.1 0.1 0 0 0 1 $55,573 $43,287
Commercial and Service
Industry Machinery
Manufacturing (3333)
0.1 0.1 0.1 0.1 0 1 1 1 $77,258 $46,404
Ventilation, Heating, Air‐
Conditioning, and
Commercial Refrigeration
Equipment Manufacturing
(3334)
0.1 0.1 0.1 0.1 0 1 1 1 $49,815 $48,579
Metalworking Machinery
Manufacturing (3335) 0.1 0.1 0.1 0.1 0 0 0 0 $44,792 $40,325
Engine, Turbine, and Power
Transmission Equipment
Manufacturing (3336)
0.2 0.2 0.2 0.2 1 1 1 1 $80,991 $85,257
Other General Purpose
Machinery Manufacturing
(3339)
0.1 0.1 0.1 0.1 1 1 1 1 $61,321 $43,212

C‐6
Table C.1.1: Direct Energy Consumption, Greenhouse Gas Emissions and Wages, for Los Angeles County and City
Industry Title
& 4‐Digit Coding
NAICS 2007 Average Terajoules per
Job 2008
Average Terajoules per
Job 2009
Average Terajoules per
Job 2010
Average Terajoules per
Job 2011
Average Metric Tons of
GHG per Job 2008
Average Metric Tons of
GHG per Job 2009
Average Metric Tons of
GHG per Job 2010
Average Metric Tons of
GHG per Job 2011
Los Angeles County
Annual Average Wage
2011
City of Los Angeles
Annual Average Wage
2011
Computer and Peripheral
Equipment Manufacturing
(3341)
0.1 0.1 0.1 0.1 0 0 0 0 $92,579 $68,460
Communications Equipment
Manufacturing (3342) 0.0 0.0 0.0 0.0 0 0 0 0 $87,459 $48,713
Audio and Video Equipment
Manufacturing (3343) 0.1 0.1 0.1 0.1 0 0 0 0 $90,517 $92,261
Semiconductor and Other
Electronic Component
Manufacturing (3344)
0.1 0.1 0.1 0.1 3 3 3 3 $59,434 $54,551
Navigational, Measuring,
Electromedical, and Control
Instruments Manufacturing
(3345)
0.1 0.1 0.1 0.1 0 0 0 0 $103,797 $88,279
Manufacturing and
Reproducing Magnetic and
Optical Media (3346)
0.1 0.1 0.1 0.1 0 0 1 1 $60,895 $61,257
Electric Lighting Equipment
Manufacturing (3351) 0.0 0.0 0.0 0.0 0 0 0 0 $47,820 $55,478
Household Appliance
Manufacturing (3352) 0.1 0.1 0.1 0.1 0 0 1 1 $40,746 $47,308
Electrical Equipment
Manufacturing (3353) 0.0 0.0 0.1 0.0 0 0 0 0 $48,444 $57,183
Other Electrical Equipment and
Component Manufacturing
(3359)
0.1 0.1 0.1 0.1 1 1 1 1 $70,508 $84,975
Motor Vehicle Manufacturing
(3361) 0.4 0.3 0.5 0.1 6 4 7 2 $74,881 $120,378
Motor Vehicle Body and Trailer
Manufacturing (3362) 0.1 0.1 0.1 0.1 1 2 1 2 $42,877 $33,536
Motor Vehicle Parts
Manufacturing (3363) 0.1 0.1 0.1 0.1 1 1 1 1 $47,028 $58,709
Aerospace Product and Parts
Manufacturing (3364) 0.1 0.1 0.1 0.1 1 1 1 1 $95,609 $93,851
Railroad Rolling Stock
Manufacturing (3365) 0.1 0.1 0.1 0.1 1 2 1 2 $33,652 (s)
Ship and Boat Building (3366) 0.1 0.1 0.1 0.1 1 1 1 1 $45,021 $41,079
Other Transportation
Equipment Manufacturing
(3369)
0.1 0.1 0.1 0.1 1 2 1 1 $48,262 $80,215
Household and Institutional
Furniture and Kitchen
Cabinet Manufacturing (3371)
0.0 0.0 0.0 0.0 0 0 0 0 $32,872 $30,636
Office Furniture (including
Fixtures) Manufacturing
(3372)
0.1 0.1 0.1 0.1 0 0 0 0 $45,830 $44,946

C‐7
Table C.1.1: Direct Energy Consumption, Greenhouse Gas Emissions and Wages, for Los Angeles County and City
Industry Title
& 4‐Digit Coding
NAICS 2007 Average Terajoules per
Job 2008
Average Terajoules per
Job 2009
Average Terajoules per
Job 2010
Average Terajoules per
Job 2011
Average Metric Tons of
GHG per Job 2008
Average Metric Tons of
GHG per Job 2009
Average Metric Tons of
GHG per Job 2010
Average Metric Tons of
GHG per Job 2011
Los Angeles County
Annual Average Wage
2011
City of Los Angeles
Annual Average Wage
2011
Other Furniture Related Product
Manufacturing (3379) 0.0 0.0 0.0 0.0 0 0 0 0 $34,433 $26,620
Medical Equipment and
Supplies Manufacturing
(3391)
0.0 0.0 0.0 0.0 1 1 1 1 $61,874 $73,481
Other Miscellaneous
Manufacturing (3399) 0.1 0.1 0.1 0.1 2 2 2 2 $56,521 $42,909
Motor Vehicle and Motor
Vehicle Parts and Supplies
Merchant Wholesalers (4231)
0.0 0.0 0.0 0.0 0 0 0 0 $51,640 $37,819
Furniture and Home Furnishing
Merchant Wholesalers (4232) 0.0 0.0 0.0 0.0 0 0 0 0 $48,550 $48,353
Lumber and Other Construction
Materials Merchant
Wholesalers (4233)
0.0 0.0 0.0 0.0 0 0 0 0 $47,365 $47,676
Professional and Commercial
Equipment and Supplies
Merchant Wholesalers (4234)
0.0 0.0 0.0 0.0 0 0 0 0 $68,504 $57,340
Metal and Mineral (except
Petroleum) Merchant
Wholesalers (4235)
0.0 0.0 0.0 0.0 0 0 0 0 $65,089 $75,267
Electrical and Electronic Goods
Merchant Wholesalers (4236) 0.0 0.0 0.0 0.0 0 0 0 0 $72,049 $78,177
Hardware, and Plumbing and
Heating Equipment and
Supplies Merchant
Wholesalers (4237)
0.0 0.0 0.0 0.0 0 0 0 0 $50,999 $38,729
Machinery, Equipment, and
Supplies Merchant
Wholesalers (4238)
0.0 0.0 0.0 0.0 0 0 0 0 $61,251 $55,746
Miscellaneous Durable Goods
Merchant Wholesalers (4239) 0.0 0.0 0.0 0.0 0 0 0 0 $57,551 $50,464
Paper and Paper Product
Merchant Wholesalers (4241) 0.0 0.0 0.0 0.0 0 0 0 0 $52,526 $49,151
Drugs and Druggistsʹ Sundries
Merchant Wholesalers (4242) 0.0 0.0 0.0 0.0 0 0 0 0 $69,874 $80,620
Apparel, Piece Goods, and
Notions Merchant
Wholesalers (4243)
0.0 0.0 0.0 0.0 0 0 0 0 $46,549 $44,099
Grocery and Related Product
Merchant Wholesalers (4244) 0.0 0.0 0.0 0.0 0 0 0 0 $48,168 $47,445
Farm Product Raw Material
Merchant Wholesalers (4245) 0.0 0.0 0.0 0.0 0 0 0 0 $56,442 $91,215
Chemical and Allied Products
Merchant Wholesalers (4246) 0.0 0.0 0.0 0.0 0 0 0 0 $61,191 $66,081

C‐8
Table C.1.1: Direct Energy Consumption, Greenhouse Gas Emissions and Wages, for Los Angeles County and City
Industry Title
& 4‐Digit Coding
NAICS 2007 Average Terajoules per
Job 2008
Average Terajoules per
Job 2009
Average Terajoules per
Job 2010
Average Terajoules per
Job 2011
Average Metric Tons of
GHG per Job 2008
Average Metric Tons of
GHG per Job 2009
Average Metric Tons of
GHG per Job 2010
Average Metric Tons of
GHG per Job 2011
Los Angeles County
Annual Average Wage
2011
City of Los Angeles
Annual Average Wage
2011
Petroleum and Petroleum
Products Merchant
Wholesalers (4247)
0.0 0.0 0.0 0.0 0 0 0 0 $75,244 $97,700
Beer, Wine, and Distilled
Alcoholic Beverage Merchant
Wholesalers (4248)
0.0 0.0 0.0 0.0 0 0 0 0 $59,328 $58,127
Miscellaneous Nondurable
Goods Merchant Wholesalers
(4249)
0.0 0.0 0.0 0.0 0 0 0 0 $42,659 $45,040
Wholesale Electronic Markets
and Agents and Brokers
(4251)
0.0 0.0 0.0 0.0 0 0 0 0 $60,496 $60,311
Automobile Dealers (4411) 0.1 0.1 0.1 0.1 0 0 0 0 $54,421 $55,337
Other Motor Vehicle Dealers
(4412) 0.1 0.1 0.1 0.1 0 0 0 0 $42,820 $34,748
Automotive Parts, Accessories,
and Tire Stores (4413) 0.1 0.1 0.1 0.1 0 0 0 0 $30,894 $31,580
Furniture Stores (4421) 0.1 0.1 0.1 0.0 0 0 0 0 $34,074 $32,029
Home Furnishings Stores (4422) 0.1 0.1 0.1 0.0 0 0 0 0 $28,470 $30,773
Electronics and Appliance Stores
(4431) 0.1 0.1 0.1 0.1 0 0 0 0 $56,742 $68,037
Building Material and Supplies
Dealers (4441) 0.1 0.1 0.0 0.0 0 0 0 0 $32,327 $33,082
Lawn and Garden Equipment
and Supplies Stores (4442) 0.1 0.1 0.0 0.0 0 0 0 0 $27,073 $24,318
Grocery Stores (4451) 0.1 0.1 0.1 0.1 0 0 0 0 $27,350 $27,329
Specialty Food Stores (4452) 0.1 0.1 0.1 0.1 0 0 0 0 $25,528 $22,352
Beer, Wine, and Liquor Stores
(4453) 0.1 0.1 0.1 0.1 0 0 0 0 $19,191 $21,152
Health and Personal Care Stores
(4461) 0.1 0.1 0.1 0.1 0 0 0 0 $37,139 $37,754
Gasoline Stations (4471) 0.1 0.1 0.1 0.2 0 0 0 0 $27,890 $19,731
Clothing Stores (4481) 0.0 0.0 0.0 0.0 0 0 0 0 $20,542 $23,140
Shoe Stores (4482) 0.0 0.0 0.0 0.0 0 0 0 0 $23,132 $27,985
Jewelry, Luggage, and Leather
Goods Stores (4483) 0.0 0.0 0.0 0.0 0 0 0 0 $37,747 $34,606
Sporting Goods, Hobby, and
Musical Instrument Stores
(4511)
0.0 0.0 0.0 0.0 0 0 0 0 $22,469 $29,819
Book, Periodical, and Music
Stores (4512) 0.0 0.0 0.0 0.0 0 0 0 0 $18,297 $19,580
Department Stores (4521) 0.0 0.0 0.0 0.0 0 0 0 0 $21,042 $24,020

C‐9
Table C.1.1: Direct Energy Consumption, Greenhouse Gas Emissions and Wages, for Los Angeles County and City
Industry Title
& 4‐Digit Coding
NAICS 2007 Average Terajoules per
Job 2008
Average Terajoules per
Job 2009
Average Terajoules per
Job 2010
Average Terajoules per
Job 2011
Average Metric Tons of
GHG per Job 2008
Average Metric Tons of
GHG per Job 2009
Average Metric Tons of
GHG per Job 2010
Average Metric Tons of
GHG per Job 2011
Los Angeles County
Annual Average Wage
2011
City of Los Angeles
Annual Average Wage
2011
Other General Merchandise
Stores (4529) 0.0 0.0 0.0 0.0 0 0 0 0 $24,708 $24,421
Florists (4531) 0.0 0.0 0.0 0.0 0 0 0 0 $22,805 $27,468
Office Supplies, Stationery, and
Gift Stores (4532) 0.0 0.0 0.0 0.0 0 0 0 0 $32,191 $32,289
Used Merchandise Stores (4533) 0.0 0.0 0.0 0.0 0 0 0 0 $21,313 $23,293
Other Miscellaneous Store
Retailers (4539) 0.0 0.0 0.0 0.0 0 0 0 0 $30,561 $30,972
Electronic Shopping and Mail‐
Order Houses (4541) 0.0 0.0 0.0 0.1 0 0 0 0 $59,063 $71,932
Vending Machine Operators
(4542) 0.0 0.0 0.0 0.1 0 0 0 0 $42,263 $49,960
Direct Selling Establishments
(4543) 0.0 0.0 0.0 0.1 0 0 0 0 $34,970 $36,953
Scheduled Air Transportation
(4811) 5.4 5.6 6.4 6.2
1,237
1,287
1,482
1,442 $61,032 $60,431
Nonscheduled Air
Transportation (4812) 5.4 5.6 6.4 6.2
1,237
1,287
1,482
1,442 $85,679 $85,342
Rail Transportation (4821) 7.7 5.4 4.7 3.7
1,752
1,229 1,061 847 $45,155 (s)
Deep Sea, Coastal, and Great
Lakes Water Transportation
(4831)
0.2 0.2 0.3 0.3 48 57 64 76 $65,682 $60,645
Inland Water Transportation
(4832) 0.2 0.2 0.3 0.3 48 57 64 76 $57,683 $64,867
General Freight Trucking (4841) 1.5 1.4 1.5 1.5 346 312 355 343 $42,233 $38,898
Specialized Freight Trucking
(4842) 1.5 1.4 1.5 1.5 346 312 355 343 $41,276 $37,074
Urban Transit Systems (4851) 0.6 0.6 0.7 0.7 109 105 130 127 $50,941 $51,791
Interurban and Rural Bus
Transportation (4852) 0.6 0.6 0.7 0.7 109 105 130 127 $44,672 $37,081
Taxi and Limousine Service
(4853) 0.6 0.6 0.7 0.7 109 105 130 127 $31,254 $32,196
School and Employee Bus
Transportation (4854) 0.6 0.6 0.7 0.7 109 105 130 127 $27,401 $26,837
Charter Bus Industry (4855) 0.6 0.6 0.7 0.7 109 105 130 127 $34,085 $44,546
Other Transit and Ground
Passenger Transportation
(4859)
0.6 0.6 0.7 0.7 109 105 130 127 $30,124 $30,065
Pipeline Transportation of
Crude Oil (4861) 2.5 2.4 2.6 2.8 123 120 127 137 $119,596 (s)
Pipeline Transportation of
Natural Gas (4862) 2.5 2.4 2.6 2.8 123 120 127 137 $101,868 $102,095

C‐10
Table C.1.1: Direct Energy Consumption, Greenhouse Gas Emissions and Wages, for Los Angeles County and City
Industry Title
& 4‐Digit Coding
NAICS 2007 Average Terajoules per
Job 2008
Average Terajoules per
Job 2009
Average Terajoules per
Job 2010
Average Terajoules per
Job 2011
Average Metric Tons of
GHG per Job 2008
Average Metric Tons of
GHG per Job 2009
Average Metric Tons of
GHG per Job 2010
Average Metric Tons of
GHG per Job 2011
Los Angeles County
Annual Average Wage
2011
City of Los Angeles
Annual Average Wage
2011
Other Pipeline Transportation
(4869) 2.5 2.4 2.6 2.8 123 120 127 137 $94,842 $66,748
Scenic and Sightseeing
Transportation, Land (4871) 0.4 0.3 0.3 0.1 47 35 39 13 $33,941 $26,678
Scenic and Sightseeing
Transportation, Water (4872) 0.0 0.0 0.0 0.0 1 1 1 0 $22,464 $17,938
Scenic and Sightseeing
Transportation, Other (4879) 0.0 0.0 0.0 0.0 1 1 1 0 $125,593 (s)
Support Activities for Air
Transportation (4881) 0.1 0.0 0.1 0.0 7 5 6 2 $45,506 $44,440
Support Activities for Rail
Transportation (4882) 0.4 0.3 0.3 0.1 47 35 39 13 $43,386 (s)
Support Activities for Water
Transportation (4883) 0.4 0.3 0.3 0.1 46 35 39 12 $81,301 $86,487
Support Activities for Road
Transportation (4884) 0.4 0.3 0.3 0.1 47 35 39 13 $34,230 $37,503
Freight Transportation
Arrangement (4885) 0.4 0.3 0.3 0.1 47 35 39 13 $53,262 $53,912
Other Support Activities for
Transportation (4889) 0.4 0.3 0.3 0.1 47 35 39 13 $68,705 $80,667
Postal Service (4911) 0.0 0.0 0.0 0.0 3 2 2 2 $60,054 $60,404
Couriers and Express Delivery
Services (4921) 1.0 1.1 1.3 0.9 225 246 287 211 $47,212 $52,419
Local Messengers and Local
Delivery (4922) 1.0 1.1 1.3 0.9 225 246 287 211 $25,930 $21,437
Warehousing and Storage (4931) 0.0 0.0 0.0 0.0 4 3 4 4 $47,130 $53,182
Newspaper, Periodical, Book,
and Directory Publishers
(5111)
0.0 0.0 0.0 0.0 0 0 0 0 $73,616 $83,916
Software Publishers (5112) 0.0 0.0 0.0 0.0 0 0 0 0 $141,587 $137,905
Motion Picture and Video
Industries (5121) 0.0 0.0 0.0 0.0 0 0 0 0 $95,157 $130,686
Sound Recording Industries
(5122) 0.0 0.1 0.1 0.0 0 0 0 0 $101,075 $82,786
Radio and Television
Broadcasting (5151) 0.1 0.1 0.1 0.1 0 0 0 0 $114,942 $120,260
Cable and Other Subscription
Programming (5152) 0.1 0.1 0.1 0.0 0 0 0 0 $105,087 $95,822
Wired Telecommunications
Carriers (5171) 0.1 0.1 0.1 0.1 0 0 0 0 $87,606 $83,159
Wireless Telecommunications
Carriers (except Satellite)
(5172)
0.1 0.1 0.1 0.1 0 0 0 0 $63,021 $68,423
Satellite Telecommunications
(5174) 0.1 0.1 0.1 0.1 0 0 0 0 $74,652 $74,003

C‐11
Table C.1.1: Direct Energy Consumption, Greenhouse Gas Emissions and Wages, for Los Angeles County and City
Industry Title
& 4‐Digit Coding
NAICS 2007 Average Terajoules per
Job 2008
Average Terajoules per
Job 2009
Average Terajoules per
Job 2010
Average Terajoules per
Job 2011
Average Metric Tons of
GHG per Job 2008
Average Metric Tons of
GHG per Job 2009
Average Metric Tons of
GHG per Job 2010
Average Metric Tons of
GHG per Job 2011
Los Angeles County
Annual Average Wage
2011
City of Los Angeles
Annual Average Wage
2011
Other Telecommunications
(5179) 0.1 0.1 0.1 0.1 0 0 0 0 $86,812 $96,168
Data Processing, Hosting, and
Related Services (5182) 0.0 0.0 0.0 0.0 0 0 0 0 $79,507 $64,022
Other Information Services
(5191) 0.1 0.0 0.1 0.0 0 0 0 0 $79,378 $62,783
Monetary Authorities‐Central
Bank (5211) 0.0 0.0 0.0 0.0 0 0 0 0 $113,332 $90,268
Depository Credit
Intermediation (5221) 0.0 0.0 0.0 0.0 0 0 0 0 $65,480 $75,275
Nondepository Credit
Intermediation (5222) 0.0 0.0 0.0 0.0 0 0 0 0 $70,150 $60,949
Activities Related to Credit
Intermediation (5223) 0.0 0.0 0.0 0.0 0 0 0 0 $64,330 $78,060
Securities and Commodity
Contracts Intermediation and
Brokerage (5231)
0.0 0.0 0.0 0.0 0 0 0 0 $209,470 $258,272
Securities and Commodity
Exchanges (5232) 0.0 0.0 0.0 0.0 0 0 0 0 $68,971 $165,066
Other Financial Investment
Activities (5239) 0.0 0.0 0.0 0.0 0 0 0 0 $236,254 $306,339
Insurance Carriers (5241) 0.0 0.0 0.0 0.0 0 0 0 0 $90,135 $103,135
Agencies, Brokerages, and Other
Insurance Related Activities
(5242)
0.0 0.0 0.0 0.0 0 0 0 0 $72,425 $80,768
Insurance and Employee Benefit
Funds (5251) 0.0 0.0 0.0 0.0 ‐ ‐ ‐ ‐ $53,695 $53,077
Other Investment Pools and
Funds (5259) 0.0 0.0 0.0 0.0 ‐ ‐ ‐ ‐ $101,317 $107,608
Lessors of Real Estate (5311) 0.1 0.1 0.1 0.1 0 0 0 0 $44,843 $40,155
Offices of Real Estate Agents
and Brokers (5312) 0.1 0.1 0.1 0.1 0 0 0 0 $71,281 $78,229
Activities Related to Real Estate
(5313) 0.1 0.1 0.1 0.1 0 0 0 0 $50,090 $53,402
Automotive Equipment Rental
and Leasing (5321) 0.0 0.0 0.0 0.0 0 0 0 0 $46,760 $43,538
Consumer Goods Rental (5322) 0.0 0.0 0.0 0.0 0 0 0 0 $39,634 $48,719
General Rental Centers (5323) 0.0 0.0 0.0 0.0 0 0 0 0 $49,695 $42,189
Commercial and Industrial
Machinery and Equipment
Rental and Leasing (5324)
0.0 0.0 0.0 0.0 0 0 0 0 $65,572 $72,826
Lessors of Nonfinancial
Intangible Assets (except
Copyrighted Works) (5331)
0.3 0.7 0.7 0.7 3 7 7 7 $99,599 $115,163

C‐12
Table C.1.1: Direct Energy Consumption, Greenhouse Gas Emissions and Wages, for Los Angeles County and City
Industry Title
& 4‐Digit Coding
NAICS 2007 Average Terajoules per
Job 2008
Average Terajoules per
Job 2009
Average Terajoules per
Job 2010
Average Terajoules per
Job 2011
Average Metric Tons of
GHG per Job 2008
Average Metric Tons of
GHG per Job 2009
Average Metric Tons of
GHG per Job 2010
Average Metric Tons of
GHG per Job 2011
Los Angeles County
Annual Average Wage
2011
City of Los Angeles
Annual Average Wage
2011
Legal Services (5411) 0.0 0.0 0.0 0.0 0 0 0 0 $105,037 $112,501
Accounting, Tax Preparation,
Bookkeeping, and Payroll
Services (5412)
0.0 0.0 0.0 0.0 0 0 0 0 $67,980 $69,098
Architectural, Engineering, and
Related Services (5413) 0.0 0.0 0.0 0.0 0 0 0 0 $107,556 $84,021
Specialized Design Services
(5414) 0.0 0.0 0.0 0.0 0 0 0 0 $66,666 $66,957
Computer Systems Design and
Related Services (5415) 0.0 0.0 0.0 0.0 0 0 0 0 $92,099 $93,999
Management, Scientific, and
Technical Consulting Services
(5416)
0.0 0.0 0.0 0.0 0 0 0 0 $69,002 $67,802
Scientific Research and
Development Services (5417) 0.1 0.1 0.1 0.1 0 0 0 1 $102,193 $79,242
Advertising, Public Relations,
and Related Services (5418) 0.0 0.0 0.1 0.1 0 0 0 0 $94,510 $110,373
Other Professional, Scientific,
and Technical Services (5419) 0.0 0.0 0.0 0.0 0 0 0 0 $45,972 $55,719
Management of Companies and
Enterprises (5511) 0.1 0.0 0.0 0.0 0 0 0 0 $94,565 $101,948
Office Administrative Services
(5611) 0.0 0.0 0.0 0.0 1 0 0 0 $75,578 $72,478
Facilities Support Services (5612) 0.0 0.0 0.0 0.0 0 0 0 1 $31,859 $30,733
Employment Services (5613) 0.0 0.0 0.0 0.0 0 0 0 0 $27,183 $34,940
Business Support Services (5614) 0.0 0.0 0.0 0.0 0 0 0 0 $37,619 $35,767
Travel Arrangement and
Reservation Services (5615) 0.1 0.1 0.1 0.1 3 2 3 3 $49,583 $58,813
Investigation and Security
Services (5616) 0.0 0.0 0.0 0.0 0 0 0 0 $24,389 $22,805
Services to Buildings and
Dwellings (5617) 0.0 0.0 0.0 0.0 0 0 0 0 $26,356 $26,332
Other Support Services (5619) 0.0 0.0 0.0 0.0 1 1 0 1 $39,789 $37,344
Waste Collection (5621) 0.0 0.0 0.0 0.0 29 31 31 43 $55,572 $49,792
Waste Treatment and Disposal
(5622) 0.0 0.0 0.0 0.0 29 31 31 43 $59,224 $65,091
Remediation and Other Waste
Management Services (5629) 0.0 0.0 0.0 0.0 29 31 31 43 $45,753 $40,984
Elementary and Secondary
Schools (6111) 0.0 0.0 0.0 0.0 1 1 1 1 $47,226 $47,224
Junior Colleges (6112) 0.1 0.1 0.1 0.1 2 2 2 2 $50,890 $53,615
Colleges, Universities, and
Professional Schools (6113) 0.1 0.1 0.1 0.1 2 2 2 2 $62,803 $67,726

C‐13
Table C.1.1: Direct Energy Consumption, Greenhouse Gas Emissions and Wages, for Los Angeles County and City
Industry Title
& 4‐Digit Coding
NAICS 2007 Average Terajoules per
Job 2008
Average Terajoules per
Job 2009
Average Terajoules per
Job 2010
Average Terajoules per
Job 2011
Average Metric Tons of
GHG per Job 2008
Average Metric Tons of
GHG per Job 2009
Average Metric Tons of
GHG per Job 2010
Average Metric Tons of
GHG per Job 2011
Los Angeles County
Annual Average Wage
2011
City of Los Angeles
Annual Average Wage
2011
Business Schools and Computer
and Management Training
(6114)
0.0 0.0 0.0 0.0 0 0 0 0 $42,725 $38,691
Technical and Trade Schools
(6115) 0.0 0.0 0.0 0.0 0 0 0 0 $44,135 $47,086
Other Schools and Instruction
(6116) 0.0 0.0 0.0 0.0 0 0 0 0 $24,333 $29,685
Educational Support Services
(6117) 0.0 0.0 0.0 0.0 0 0 0 0 $34,148 $33,535
Offices of Physicians (6211) 0.0 0.0 0.0 0.0 0 0 0 0 $74,721 $75,243
Offices of Dentists (6212) 0.0 0.0 0.0 0.0 0 0 0 0 $40,371 $40,422
Offices of Other Health
Practitioners (6213) 0.0 0.0 0.0 0.0 0 0 0 0 $35,471 $34,943
Outpatient Care Centers (6214) 0.1 0.0 0.0 0.0 1 1 1 1 $56,530 $55,360
Medical and Diagnostic
Laboratories (6215) 0.1 0.0 0.0 0.0 1 1 1 1 $52,479 $57,672
Home Health Care Services
(6216) 0.0 0.0 0.0 0.0 0 0 0 0 $28,329 $29,463
Other Ambulatory Health Care
Services (6219) 0.1 0.0 0.0 0.0 1 1 1 1 $38,618 $42,949
General Medical and Surgical
Hospitals (6221) 0.1 0.1 0.1 0.1 0 1 1 0 $68,328 $68,034
Psychiatric and Substance Abuse
Hospitals (6222) 0.1 0.1 0.1 0.1 0 1 1 0 $48,810 $47,057
Specialty (except Psychiatric and
Substance Abuse) Hospitals
(6223)
0.1 0.1 0.1 0.1 0 1 1 0 $51,025 $45,263
Nursing Care Facilities (6231) 0.1 0.1 0.1 0.1 2 2 2 2 $30,464 $31,469
Residential Mental Retardation,
Mental Health and Substance
Abuse Facilities (6232)
0.1 0.1 0.1 0.1 2 2 2 2 $32,421 $38,438
Community Care Facilities for
the Elderly (6233) 0.1 0.1 0.1 0.1 2 2 2 2 $25,264 $28,568
Other Residential Care Facilities
(6239) 0.1 0.1 0.1 0.1 2 2 2 2 $31,947 $32,564
Individual and Family Services
(6241) 0.0 0.0 0.0 0.0 1 1 1 1 $36,608 $42,404
Community Food and Housing,
and Emergency and Other
Relief Services (6242)
0.0 0.0 0.0 0.0 0 1 1 1 $36,260 $35,330
Vocational Rehabilitation
Services (6243) 0.0 0.0 0.0 0.0 0 1 1 1 $25,692 $28,629
Child Day Care Services (6244) 0.0 0.0 0.0 0.0 0 0 0 0 $24,700 $24,644

C‐14
Table C.1.1: Direct Energy Consumption, Greenhouse Gas Emissions and Wages, for Los Angeles County and City
Industry Title
& 4‐Digit Coding
NAICS 2007 Average Terajoules per
Job 2008
Average Terajoules per
Job 2009
Average Terajoules per
Job 2010
Average Terajoules per
Job 2011
Average Metric Tons of
GHG per Job 2008
Average Metric Tons of
GHG per Job 2009
Average Metric Tons of
GHG per Job 2010
Average Metric Tons of
GHG per Job 2011
Los Angeles County
Annual Average Wage
2011
City of Los Angeles
Annual Average Wage
2011
Performing Arts Companies
(7111) 0.0 0.0 0.0 0.0 0 0 0 0 $125,220 $63,059
Spectator Sports (7112) 0.0 0.0 0.0 0.0 0 0 0 0 $106,154 $120,051
Promoters of Performing Arts,
Sports, and Similar Events
(7113)
0.0 0.0 0.0 0.0 0 0 0 0 $51,443 $48,041
Agents and Managers for
Artists, Athletes, Entertainers,
and Other Public Figures
(7114)
0.0 0.0 0.0 0.0 0 0 0 0 $131,266 $144,988
Independent Artists, Writers,
and Performers (7115) 0.0 0.0 0.0 0.0 0 0 0 0 $350,545 $367,379
Museums, Historical Sites, and
Similar Institutions (7121) 0.2 0.2 0.1 0.1 2 1 1 1 $44,641 $47,174
Amusement Parks and Arcades
(7131) 0.0 0.0 0.0 0.0 1 1 0 0 $40,845 $23,866
Gambling Industries (7132) 0.0 0.0 0.0 0.0 1 1 0 0 $27,637 $26,495
Other Amusement and
Recreation Industries (7139) 0.0 0.0 0.0 0.0 0 0 0 0 $22,727 $25,460
Traveler Accommodation (7211) 0.2 0.2 0.2 0.2 4 4 4 4 $30,143 $31,479
RV (Recreational Vehicle) Parks
and Recreational Camps
(7212)
0.1 0.1 0.1 0.0 3 3 3 2 $25,916 $32,339
Rooming and Boarding Houses
(7213) 0.1 0.1 0.1 0.1 4 4 5 5 $28,855 $27,998
Full‐Service Restaurants (7221) 0.1 0.1 0.1 ‐ 2 2 2 ‐ ‐ ‐
Limited‐Service Eating Places
(7222) 0.1 0.1 0.1 ‐ 2 2 2 ‐ ‐ ‐
Special Food Services (7223) 0.1 0.1 0.1 0.1 2 2 2 2 $24,559 $25,070
Drinking Places (Alcoholic
Beverages) (7224) 0.1 0.1 0.1 0.1 2 2 2 2 $16,077 $16,203
Other Restaurants and Eating
Places (7225) 0.1 0.1 0.1 0.1 2 2 2 2 $17,530 $18,300
Automotive Repair and
Maintenance (8111) 0.0 0.0 0.0 0.0 2 1 2 1 $29,878 $30,085
Electronic and Precision
Equipment Repair and
Maintenance (8112)
0.0 0.0 0.0 0.0 1 1 1 1 $41,538 $42,360
Commercial and Industrial
Machinery and Equipment
(except Automotive and
Electronic) Repair and
Maintenance (8113)
0.0 0.0 0.0 0.0 2 1 1 1 $54,340 $53,921

C‐15
Table C.1.1: Direct Energy Consumption, Greenhouse Gas Emissions and Wages, for Los Angeles County and City
Industry Title
& 4‐Digit Coding
NAICS 2007 Average Terajoules per
Job 2008
Average Terajoules per
Job 2009
Average Terajoules per
Job 2010
Average Terajoules per
Job 2011
Average Metric Tons of
GHG per Job 2008
Average Metric Tons of
GHG per Job 2009
Average Metric Tons of
GHG per Job 2010
Average Metric Tons of
GHG per Job 2011
Los Angeles County
Annual Average Wage
2011
City of Los Angeles
Annual Average Wage
2011
Personal & Household Goods
Repair & Maintenance (8114) 0.0 0.0 0.0 0.0 2 2 1 1 $32,730 $32,039
Personal Care Services (8121) 0.0 0.0 0.0 0.0 0 0 0 0 $21,399 $21,253
Death Care Services (8122) 0.0 0.1 0.1 0.1 3 5 5 4 $49,169 $49,381
Drycleaning and Laundry
Services (8123) 0.0 0.0 0.0 0.0 1 2 2 1 $26,486 $25,641
Other Personal Services (8129) 0.0 0.0 0.0 0.0 2 2 1 1 $26,399 $26,526
Religious Organizations (8131) 0.0 0.0 0.0 0.0 1 1 1 1 $28,012 $30,778
Grantmaking and Giving
Services (8132) 0.0 0.0 0.0 0.0 1 2 2 2 $51,082 $51,102
Social Advocacy Orgs .(8133) 0.0 0.0 0.0 0.0 1 2 2 2 $41,776 $47,801
Civic & Social Orgs. (8134) 0.0 0.1 0.1 0.1 3 5 5 5 $22,255 $22,183
Business, Professional, Labor,
Political, and Similar
Organizations (8139)
0.0 0.1 0.1 0.1 3 5 5 5 $60,953 $66,367
Private Households (8141) ‐ ‐ ‐ ‐ ‐ ‐ ‐ ‐ $13,470 $13,957
Executive, Legislative, and
Other General Government
Support (9211)
0.2 0.2 0.2 0.3 14 14 15 15 $61,652 $63,569
Justice, Public Order, and Safety
Activities (9221) 0.3 0.3 0.2 0.3 15 15 14 17 $84,945 $86,647
Administration of Human
Resource Programs (9231) 0.3 0.3 0.2 0.3 17 16 13 17 $71,848 $74,241
Administration of
Environmental Quality
Programs (9241)
0.2 0.2 0.2 0.2 10 9 10 10 $64,245 $65,706
Administration of Housing
Programs, Urban Planning,
and Community
Development (9251)
0.2 0.2 0.2 0.3 14 14 15 15 $70,252 $72,637
Administration of Economic
Program (9261) 0.1 0.1 0.2 0.2 8 8 10 10 $73,541 $71,806
Space Research and Technology
(9271) (s) (s) (s) (s) (s) (s) (s) (s) (s) ‐
National Security and
International Affairs (9281) 0.2 0.1 0.1 0.1 8 7 7 6 $85,144 $77,895
Unclassified (9999) 0.3 0.2 0.2 0.3 18 13 9 14 $53,518 $63,559
TOTAL 0.5 0.5 0.6 0.6 21 25 28 33 $53,360 $57,512
Sources: California Employment Development Department; California MRIO-LCA model; California Energy Commission; IMPLAN software and data for Los Angeles County.

C‐16
C.1.2 Annual Wages per Job by SCAG Subregions
Variations in 2011 annual average wages of workers employed in the nine SCAG subreagions,
by 3‐digit NAICS industry. Table cells with five or fewer establishments are suppressed as “(s)”;
table cells with no employment are presented with “‐“.
Table C.1.2: Annual Wages per Job by SCAG Subregions
SCAG Subregions
Industry Title
& 3‐Digit Coding
NAICS 2007 San
Fernan
do
Valley
North L.A.
County
L.A. C
ity
Arroyo
Verdugo
San Gabriel
Valley COG
Westside
Cities
South Bay
Cities COG
Gatew
ay
Cities COG
Las
Virgenes
Malibu
Crop Production (111) $28,322 $27,526 $28,322 ‐ $26,555 $28,434 $27,582 $25,272 $27,630
Animal Production (112) $51,738 $22,638 $51,738 $100,000 $36,971 ‐ $46,909 $36,961 $18,414
Forestry and Logging (113) ‐ ‐ ‐ ‐ $13,271 ‐ ‐ $50,602 (s)
Fishing, Hunting and Trapping (114) ‐ ‐ ‐ ‐ ‐ $19,942 $53,297 $24,420 (s)
Support Activities for Agriculture
and Forestry (115) $30,205 $15,038 $30,205 $10,849 $35,548 $43,444 $52,381 $24,829 $24,409
Oil and Gas Extraction (211) $71,349 ‐ $71,349 ‐ ‐ $128,178 $130,511 $151,947 (s)
Mining (except Oil and Gas) (212) $80,013 $76,511 $80,013 ‐ $76,898 ‐ ‐ ‐ (s)
Support Activities for Mining (213) $113,172 ‐ $113,172 $18,720 $58,390 $51,537 $86,468 $63,806 (s)
Utilities (221) $89,377 $86,104 $89,377 $76,902 $97,428 $77,508 $88,990 $80,709 (s)
Construction of Buildings (236) $50,547 $44,008 $50,547 $36,356 $54,861 $70,408 $55,629 $57,659 $46,804
Heavy and Civil Engineering
Construction (237) $73,713 $60,997 $73,713 $105,249 $92,595 $94,480 $73,062 $75,834 $80,033
Specialty Trade Contractors (238) $43,756 $45,255 $43,756 $36,075 $49,056 $53,714 $47,939 $53,136 $40,511
Food Manufacturing (311) $60,119 $38,828 $60,119 $15,801 $42,340 $25,760 $40,703 $43,731 $35,141
Beverage and Tobacco Product
Manufacturing (312) $82,106 $39,809 $82,106 ‐ $75,057 $27,936 $62,741 $50,794 (s)
Textile Mills (313) $39,186 $21,461 $39,186 ‐ $25,744 $34,575 $43,838 $27,944 (s)
Textile Product Mills (314) $35,375 $19,873 $35,375 ‐ $42,796 $39,822 $34,848 $36,702 (s)
Apparel Manufacturing (315) $44,530 $21,188 $44,530 $18,349 $31,838 $49,865 $62,853 $34,030 $75,598
Leather and Allied Product
Manufacturing (316) $33,372 ‐ $33,372 ‐ $28,612 $23,159 $32,663 $31,980 (s)
Wood Product Manufacturing (321) $35,277 $20,596 $35,277 ‐ $31,730 $10,836 $32,662 $33,786 (s)
Paper Manufacturing (322) $25,848 ‐ $25,848 ‐ $55,020 $77,076 $47,312 $56,980 (s)
Printing and Related Support
Activities (323) $51,053 $32,440 $51,053 $36,907 $37,926 $46,328 $47,551 $37,419 $58,355
Petroleum and Coal Products
Manufacturing (324) $144,482 $94,991 $144,482 ‐ $82,884 $60,717 $119,704 $88,005 (s)
Chemical Manufacturing (325) $54,860 $61,054 $54,860 $109,917 $50,625 $198,491 $56,948 $51,318 $32,203
Plastics and Rubber Products
Manufacturing (326) $40,605 $26,970 $40,605 $8,448 $37,756 $52,515 $44,114 $45,386 (s)
Nonmetallic Mineral Product
Manufacturing (327) $42,015 $42,960 $42,015 ‐ $42,629 $48,412 $41,037 $45,771 $35,997
Primary Metal Manufacturing (331) $42,113 $32,085 $42,113 ‐ $45,608 ‐ $56,890 $57,861 (s)
Fabricated Metal Product
Manufacturing (332) $51,382 $32,338 $51,382 $36,510 $47,663 $41,306 $57,012 $48,615 $51,105
Machinery Manufacturing (333) $71,580 $56,164 $71,580 ‐ $58,641 $45,470 $58,488 $55,254 $87,266

C‐17
Table C.1.2: Annual Wages per Job by SCAG Subregions
SCAG Subregions
Industry Title
& 3‐Digit Coding
NAICS 2007 San
Fernan
do
Valley
North L.A.
County
L.A. C
ity
Arroyo
Verdugo
San Gabriel
Valley COG
Westside
Cities
South Bay
Cities COG
Gatew
ay
Cities COG
Las
Virgenes
Malibu
Computer and Electronic Product
Manufacturing (334) $77,064 $93,712 $77,064 $62,466 $68,995 $116,747 $108,020 $54,733 $150,574
Electrical Equipment, Appliance, and
Component Manufacturing (335) $62,738 $35,980 $62,738 ‐ $49,624 $44,189 $56,854 $50,719 $165,280
Transportation Equipment
Manufacturing (336) $69,995 $98,324 $69,995 $5,400 $77,529 $74,791 $94,621 $86,321 (s)
Furniture and Related Product
Manufacturing (337) $37,747 $34,315 $37,747 ‐ $37,000 $30,341 $40,152 $34,872 $70,185
Miscellaneous Manufacturing (339) $61,463 $29,822 $61,463 $36,026 $52,470 $55,143 $102,164 $46,025 $46,715
Merchant Wholesalers, Durable
Goods (423) $60,878 $35,957 $60,878 $75,223 $49,674 $88,981 $78,670 $58,928 $88,770
Merchant Wholesalers, Nondurable
Goods (424) $52,465 $44,727 $52,465 $53,556 $46,402 $60,600 $48,231 $50,963 $76,852
Wholesale Electronic Markets and
Agents and Brokers (425) $62,404 $41,117 $62,404 $91,884 $53,909 $103,534 $64,792 $53,733 $87,219
Motor Vehicle and Parts Dealers (441) $49,255 $36,333 $49,255 $26,471 $45,714 $61,006 $47,515 $45,386 $66,770
Furniture and Home Furnishings
Stores (442) $26,624 $26,454 $26,624 $15,653 $26,454 $35,287 $33,512 $32,715 $31,602
Electronics and Appliance Stores
(443) $64,433 $20,420 $64,433 $29,623 $41,185 $64,888 $62,840 $37,301 $42,001
Building Material and Garden
Equipment and Supplies Dealers
(444)
$31,650 $27,036 $31,650 $24,598 $29,435 $47,977 $31,811 $32,455 $33,938
Food and Beverage Stores (445) $26,495 $22,843 $26,495 $28,502 $24,776 $27,552 $31,343 $27,740 $29,854
Health and Personal Care Stores (446) $35,592 $34,676 $35,592 $43,929 $36,399 $42,044 $37,777 $35,643 $40,495
Gasoline Stations (447) $19,011 $16,458 $19,011 $21,665 $22,666 $19,620 $70,691 $24,395 $28,846
Clothing and Clothing Accessories
Stores (448) $17,379 $14,485 $17,379 $14,011 $18,695 $35,461 $17,848 $17,964 $30,940
Sporting Goods, Hobby, Book, and
Music Stores (451) $18,222 $13,317 $18,222 $13,835 $18,515 $25,132 $18,090 $18,957 $27,203
General Merchandise Stores (452) $22,758 $21,114 $22,758 $15,143 $20,855 $28,333 $22,545 $21,967 $24,065
Miscellaneous Store Retailers (453) $27,485 $17,457 $27,485 $22,401 $23,917 $41,256 $24,849 $33,224 $26,429
Nonstore Retailers (454) $42,384 $23,620 $42,384 $41,517 $39,655 $73,695 $55,765 $40,700 $86,310
Air Transportation (481) $72,770 ‐ $72,770 ‐ $47,953 $82,640 $61,549 $68,219 (s)
Rail Transportation (482) $44,685 ‐ $44,685 ‐ ‐ ‐ $45,704 ‐ (s)
Water Transportation (483) $72,027 $27,000 $72,027 ‐ $41,811 $24,088 $46,004 $54,715 (s)
Truck Transportation (484) $34,992 $28,914 $34,992 $31,155 $37,640 $35,916 $43,029 $45,641 $33,194
Transit and Ground Passenger
Transportation (485) $38,600 $28,252 $38,600 $24,213 $32,599 $55,370 $43,695 $33,887 $20,682
Pipeline Transportation (486) $102,054 $67,762 $102,054 ‐ $69,480 ‐ $83,353 $116,245 (s)
Scenic and Sightseeing
Transportation (487) $36,412 ‐ $36,412 ‐ $20,031 $25,484 $44,833 $30,866 (s)
Support Activities for Transportation
(488) $50,325 $34,877 $50,325 $87,918 $42,880 $52,607 $49,892 $68,588 $65,000
Postal Service (491) $59,802 $57,019 $59,802 $58,698 $60,824 $62,249 $60,563 $58,648 $57,985
Couriers and Messengers (492) $41,247 $37,953 $41,247 $14,833 $43,839 $41,915 $40,692 $37,236 (s)
Warehousing and Storage (493) $49,250 $42,478 $49,250 ‐ $44,090 $37,885 $46,519 $48,068 (s)

C‐18
Table C.1.2: Annual Wages per Job by SCAG Subregions
SCAG Subregions
Industry Title
& 3‐Digit Coding
NAICS 2007 San
Fernan
do
Valley
North L.A.
County
L.A. C
ity
Arroyo
Verdugo
San Gabriel
Valley COG
Westside
Cities
South Bay
Cities COG
Gatew
ay
Cities COG
Las
Virgenes
Malibu
Publishing Industries (except
Internet) (511) $78,492 $35,040 $78,492 $35,596 $59,905 $164,060 $84,022 $40,326 $93,858
Motion Picture and Sound Recording
Industries (512) $80,922 $16,138 $80,922 $71,661 $39,574 $135,503 $68,651 $19,257 $87,305
Broadcasting (except Internet) (515) $118,852 $47,029 $118,852 $10,893 $50,472 $131,506 $85,317 $49,084 $177,743
Telecommunications (517) $82,048 $61,474 $82,048 $70,928 $70,289 $86,947 $102,167 $61,913 $83,120
Data Processing, Hosting and Related
Services (518) $66,893 $48,197 $66,893 $81,556 $84,720 $119,964 $70,847 $77,304 $31,196
Other Information Services (519) $92,647 $11,957 $92,647 ‐ $74,226 $114,501 $67,611 $38,919 $118,660
Monetary Authorities‐Central Bank
(521) $108,601 ‐ $108,601 ‐ $261,341 ‐ ‐ $63,036 (s)
Credit Intermediation and Related
Activities (522) $56,175 $34,191 $56,175 $52,481 $59,907 $95,218 $73,616 $42,030 $112,009
Securities, Commodity Contracts, and
Other Financial Investments and
Related Activities (523)
$103,913 $50,136 $103,913 $50,501 $117,155 $199,004 $109,119 $90,281 $131,036
Insurance Carriers and Related
Activities (524) $83,911 $40,664 $83,911 $66,849 $59,687 $94,823 $76,898 $62,257 $89,510
Funds, Trusts, and Other Financial
Vehicles (525) $66,094 ‐ $66,094 $153,232 $45,252 $139,427 $93,658 $54,455 $63,017
Real Estate (531) $47,042 $26,480 $47,042 $50,943 $39,195 $69,364 $54,205 $44,991 $55,139
Rental and Leasing Services (532) $46,661 $37,480 $46,661 $8,332 $35,128 $43,385 $54,469 $48,821 $42,189
Lessors of Nonfinancial Intangible
Assets (except Copyrighted Works)
(533)
$98,109 $47,518 $98,109 $56,568 $72,075 $112,643 $62,735 $27,934 $123,817
Professional, Scientific, and Technical
Services (541) $70,800 $41,307 $70,800 $48,638 $72,338 $104,655 $115,476 $55,814 $81,961
Management of Companies and
Enterprises (551) $87,690 $58,879 $87,690 $66,282 $97,871 $118,975 $95,140 $72,471 $145,253
Administrative and Support Services
(561) $34,415 $24,464 $34,415 $46,497 $31,100 $41,442 $31,776 $24,369 $49,002
Waste Management and Remediation
Services (562) $54,288 $53,747 $54,288 ‐ $54,792 $50,366 $43,629 $57,418 $34,772
Educational Services (611) $45,270 $45,175 $45,270 $50,485 $46,471 $44,384 $45,081 $47,879 $56,972
Ambulatory Health Care Services
(621) $53,615 $57,044 $53,615 $62,698 $53,848 $67,055 $53,048 $52,492 $67,533
Hospitals (622) $63,650 $61,304 $63,650 ‐ $62,139 $99,793 $55,631 $59,389 $42,773
Nursing and Residential Care
Facilities (623) $30,729 $28,152 $30,729 $17,497 $28,425 $31,581 $28,568 $27,340 $35,597
Social Assistance (624) $26,406 $25,181 $26,406 $23,199 $26,304 $37,220 $27,006 $27,149 $29,024
Performing Arts, Spectator Sports,
and Related Industries (711) $217,739 $33,816 $217,739 $239,038 $72,610 $270,418 $154,743 $39,508 $203,129
Museums, Historical Sites, and
Similar Institutions (712) $35,719 $26,437 $35,719 $33,902 $29,072 $58,802 $118,825 $30,643 (s)
Amusement, Gambling, and
Recreation Industries (713) $30,804 $14,828 $30,804 $19,761 $18,656 $22,822 $22,117 $24,806 $21,418
Accommodation (721) $26,987 $24,209 $26,987 ‐ $26,274 $36,020 $24,006 $24,758 $25,408
Food Services and Drinking Places
(722) $17,271 $14,996 $17,271 $16,617 $15,804 $21,866 $17,146 $16,340 $26,034
Repair and Maintenance (811) $30,533 $29,329 $30,533 $27,194 $32,964 $30,884 $33,373 $37,235 $32,300

C‐19
Table C.1.2: Annual Wages per Job by SCAG Subregions
SCAG Subregions
Industry Title
& 3‐Digit Coding
NAICS 2007 San
Fernan
do
Valley
North L.A.
County
L.A. C
ity
Arroyo
Verdugo
San Gabriel
Valley COG
Westside
Cities
South Bay
Cities COG
Gatew
ay
Cities COG
Las
Virgenes
Malibu
Personal and Laundry Services (812) $25,985 $18,283 $25,985 $21,425 $24,997 $31,942 $22,904 $24,991 $19,817
Religious, Grantmaking, Civic,
Professional, and Similar
Organizations (813)
$47,053 $20,372 $47,053 $14,391 $38,178 $54,008 $30,229 $33,343 $39,058
Private Households (814) $12,207 $14,090 $12,207 $15,532 $11,406 $20,197 $15,107 $12,952 $22,421
Executive, Legislative, and Other
General Government Support (921) $72,792 $41,125 $72,792 $66,032 $59,405 $73,313 $68,383 $51,933 $44,203
Justice, Public Order, and Safety
Activities (922) $97,265 $45,261 $97,265 ‐ $90,552 $105,857 $91,516 $87,203 (s)
Administration of Human Resource
Programs (923) $71,479 $64,045 $71,479 ‐ $61,945 $75,121 $54,124 $66,289 (s)
Administration of Environmental
Quality Programs (924) $51,730 $42,982 $51,730 ‐ $77,967 $48,631 $76,181 $52,751 (s)
Administration of Housing Programs,
Urban Planning, and Community
Development (925)
$78,744 ‐ $78,744 ‐ $62,920 $93,095 $59,022 ‐ (s)
Administration of Economic
Programs (926) $30,313 $36,545 $30,313 ‐ $48,284 $64,725 $106,454 $49,200 (s)
Space Research and Technology (927) ‐ ‐ ‐ ‐ ‐ ‐ ‐ $118,218 (s)
National Security and International
Affairs (928) ‐ ‐ ‐ ‐ $92,062 ‐ $29,934 $86,465 (s)
Unclassified (999) $59,299 $27,498 $59,299 $47,393 $30,579 $101,311 $46,349 $25,902 $75,194
TOTAL $51,266 $40,241 $51,266 $39,547 $44,434 $72,979 $58,594 $43,099 $64,458
Source: California Employment Development Department Establishment Database for Los Angeles County.

C‐20
C.1.3 Average gallons of gasoline and metric tons of GHG per job for public trips, Los Angeles County
Variations in average gallons of gasoline per job for public trips 2011, and average metric tons
of GHG per job from public trips 2008, by 4‐digit NAICS industry. Table cells with five or fewer
establishments are suppressed as “(s)”; table cells with no employment are presented with “‐“.
Table C.1.3: Average Gallons of Gasoline and Metric Tons of GHG per Job for Public Trips
Industry Title
& 4‐Digit Coding
NAICS 2007 Average gallons of gasoline per
job for public trips 2008
Average gallons of gasoline per
job for public trips 2009
Average gallons of gasoline per
job for public trips 2010
Average gallons of gasoline per
job for public trips 2011
Average metric tons of GHG
per job from public trips 2008
Average metric tons of GHG
per job from public trips 2009
Average metric tons of GHG
per job from public trips 2010
Average metric tons of GHG
per job from public trips 2011
Sheep and Goat Farming (1124) (s) (s) (s) (s) (s) (s) (s) (s)
Coal Mining (2121) (s) (s) (s) (s) (s) (s) (s) (s)
Metal Ore Mining (2122) (s) (s) (s) (s) (s) (s) (s) (s)
Bakeries and Tortilla Manufacturing (3118) 103.92 107.83 111.51 112.50 0.93 0.96 0.99 1.00
Tobacco Manufacturing (3122) (s) (s) (s) (s) (s) (s) (s) (s)
Automobile Dealers (4411) 364.81 376.63 384.31 382.33 3.25 3.36 3.42 3.41
Other Motor Vehicle Dealers (4412) 364.81 376.63 384.31 382.33 3.25 3.36 3.42 3.41
Automotive Parts, Accessories, and Tire Stores (4413) 603.25 622.31 634.49 627.11 5.38 5.55 5.65 5.59
Furniture Stores (4421) 255.89 264.18 269.57 268.19 2.28 2.35 2.40 2.39
Home Furnishings Stores (4422) 216.88 224.44 226.95 223.42 1.93 2.00 2.02 1.99
Electronics and Appliance Stores (4431) 398.26 416.35 425.70 424.40 3.55 3.71 3.79 3.78
Building Material and Supplies Dealers (4441) 477.62 490.41 495.71 491.96 4.26 4.37 4.42 4.38
Lawn and Garden Equipment and Supplies Stores (4442) 382.28 394.58 402.58 400.52 3.41 3.52 3.59 3.57
Grocery Stores (4451) 1634.29 1676.18 1717.78 1734.65 14.56 14.94 15.31 15.46
Specialty Food Stores (4452) 385.86 398.36 406.49 404.40 3.44 3.55 3.62 3.60
Beer, Wine, and Liquor Stores (4453) 385.86 398.36 406.49 404.40 3.44 3.55 3.62 3.60
Health and Personal Care Stores (4461) 757.27 781.83 784.03 771.77 6.75 6.97 6.99 6.88
Gasoline Stations (4471) 2800.41 2880.27 2930.92 2911.43 24.96 25.67 26.12 25.94
Clothing Stores (4481) 387.17 399.71 407.86 405.76 3.45 3.56 3.63 3.62
Shoe Stores (4482) 387.17 399.71 407.86 405.76 3.45 3.56 3.63 3.62
Jewelry, Luggage, and Leather Goods Stores (4483) 387.17 399.71 407.86 405.76 3.45 3.56 3.63 3.62
Sporting Goods, Hobby, and Musical Instr. Stores (4511) 396.73 408.00 417.90 415.59 3.54 3.64 3.72 3.70
Book, Periodical, and Music Stores (4512) 1542.28 1681.49 1772.06 1783.29 13.74 14.98 15.79 15.89
Department Stores (4521) 475.89 494.04 503.77 500.98 4.24 4.40 4.49 4.46
Other General Merchandise Stores (4529) 654.89 678.29 691.58 688.56 5.84 6.04 6.16 6.14
Florists (4531) 330.74 341.45 348.42 346.63 2.95 3.04 3.10 3.09
Office Supplies, Stationery, and Gift Stores (4532) 314.52 324.08 329.98 328.06 2.80 2.89 2.94 2.92
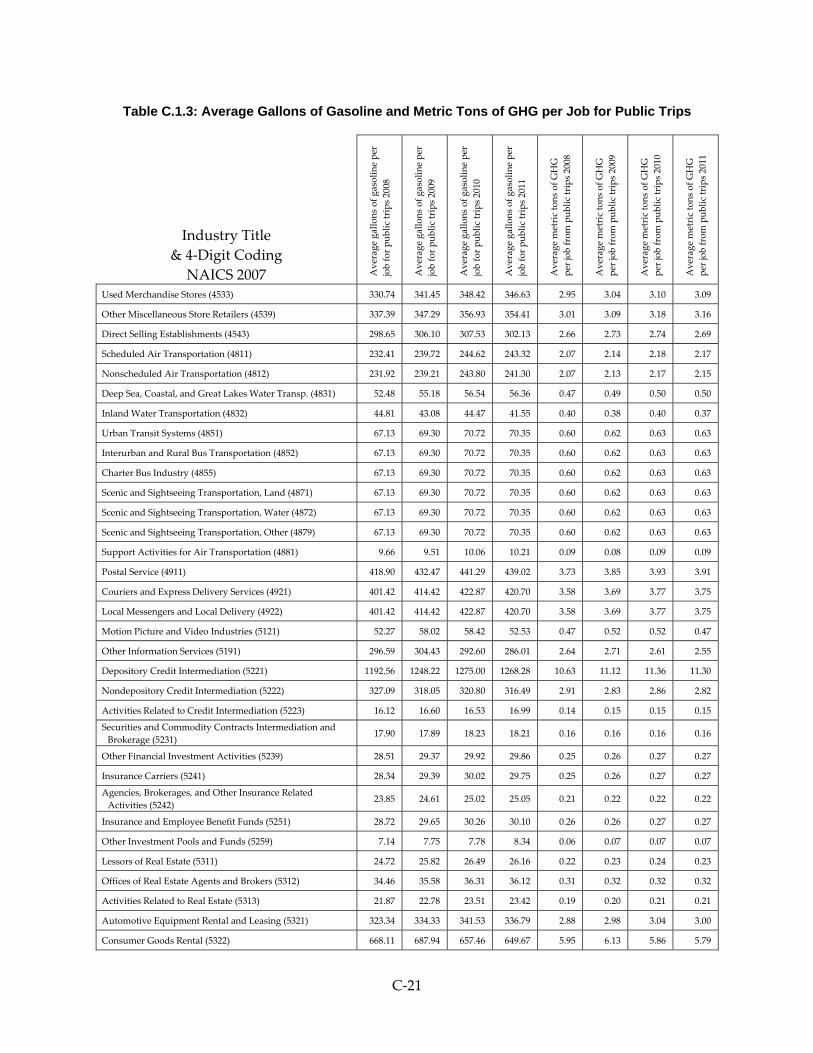
C‐21
Table C.1.3: Average Gallons of Gasoline and Metric Tons of GHG per Job for Public Trips
Industry Title
& 4‐Digit Coding
NAICS 2007 Average gallons of gasoline per
job for public trips 2008
Average gallons of gasoline per
job for public trips 2009
Average gallons of gasoline per
job for public trips 2010
Average gallons of gasoline per
job for public trips 2011
Average metric tons of GHG
per job from public trips 2008
Average metric tons of GHG
per job from public trips 2009
Average metric tons of GHG
per job from public trips 2010
Average metric tons of GHG
per job from public trips 2011
Used Merchandise Stores (4533) 330.74 341.45 348.42 346.63 2.95 3.04 3.10 3.09
Other Miscellaneous Store Retailers (4539) 337.39 347.29 356.93 354.41 3.01 3.09 3.18 3.16
Direct Selling Establishments (4543) 298.65 306.10 307.53 302.13 2.66 2.73 2.74 2.69
Scheduled Air Transportation (4811) 232.41 239.72 244.62 243.32 2.07 2.14 2.18 2.17
Nonscheduled Air Transportation (4812) 231.92 239.21 243.80 241.30 2.07 2.13 2.17 2.15
Deep Sea, Coastal, and Great Lakes Water Transp. (4831) 52.48 55.18 56.54 56.36 0.47 0.49 0.50 0.50
Inland Water Transportation (4832) 44.81 43.08 44.47 41.55 0.40 0.38 0.40 0.37
Urban Transit Systems (4851) 67.13 69.30 70.72 70.35 0.60 0.62 0.63 0.63
Interurban and Rural Bus Transportation (4852) 67.13 69.30 70.72 70.35 0.60 0.62 0.63 0.63
Charter Bus Industry (4855) 67.13 69.30 70.72 70.35 0.60 0.62 0.63 0.63
Scenic and Sightseeing Transportation, Land (4871) 67.13 69.30 70.72 70.35 0.60 0.62 0.63 0.63
Scenic and Sightseeing Transportation, Water (4872) 67.13 69.30 70.72 70.35 0.60 0.62 0.63 0.63
Scenic and Sightseeing Transportation, Other (4879) 67.13 69.30 70.72 70.35 0.60 0.62 0.63 0.63
Support Activities for Air Transportation (4881) 9.66 9.51 10.06 10.21 0.09 0.08 0.09 0.09
Postal Service (4911) 418.90 432.47 441.29 439.02 3.73 3.85 3.93 3.91
Couriers and Express Delivery Services (4921) 401.42 414.42 422.87 420.70 3.58 3.69 3.77 3.75
Local Messengers and Local Delivery (4922) 401.42 414.42 422.87 420.70 3.58 3.69 3.77 3.75
Motion Picture and Video Industries (5121) 52.27 58.02 58.42 52.53 0.47 0.52 0.52 0.47
Other Information Services (5191) 296.59 304.43 292.60 286.01 2.64 2.71 2.61 2.55
Depository Credit Intermediation (5221) 1192.56 1248.22 1275.00 1268.28 10.63 11.12 11.36 11.30
Nondepository Credit Intermediation (5222) 327.09 318.05 320.80 316.49 2.91 2.83 2.86 2.82
Activities Related to Credit Intermediation (5223) 16.12 16.60 16.53 16.99 0.14 0.15 0.15 0.15
Securities and Commodity Contracts Intermediation and
Brokerage (5231) 17.90 17.89 18.23 18.21 0.16 0.16 0.16 0.16
Other Financial Investment Activities (5239) 28.51 29.37 29.92 29.86 0.25 0.26 0.27 0.27
Insurance Carriers (5241) 28.34 29.39 30.02 29.75 0.25 0.26 0.27 0.27
Agencies, Brokerages, and Other Insurance Related
Activities (5242) 23.85 24.61 25.02 25.05 0.21 0.22 0.22 0.22
Insurance and Employee Benefit Funds (5251) 28.72 29.65 30.26 30.10 0.26 0.26 0.27 0.27
Other Investment Pools and Funds (5259) 7.14 7.75 7.78 8.34 0.06 0.07 0.07 0.07
Lessors of Real Estate (5311) 24.72 25.82 26.49 26.16 0.22 0.23 0.24 0.23
Offices of Real Estate Agents and Brokers (5312) 34.46 35.58 36.31 36.12 0.31 0.32 0.32 0.32
Activities Related to Real Estate (5313) 21.87 22.78 23.51 23.42 0.19 0.20 0.21 0.21
Automotive Equipment Rental and Leasing (5321) 323.34 334.33 341.53 336.79 2.88 2.98 3.04 3.00
Consumer Goods Rental (5322) 668.11 687.94 657.46 649.67 5.95 6.13 5.86 5.79

C‐22
Table C.1.3: Average Gallons of Gasoline and Metric Tons of GHG per Job for Public Trips
Industry Title
& 4‐Digit Coding
NAICS 2007 Average gallons of gasoline per
job for public trips 2008
Average gallons of gasoline per
job for public trips 2009
Average gallons of gasoline per
job for public trips 2010
Average gallons of gasoline per
job for public trips 2011
Average metric tons of GHG
per job from public trips 2008
Average metric tons of GHG
per job from public trips 2009
Average metric tons of GHG
per job from public trips 2010
Average metric tons of GHG
per job from public trips 2011
General Rental Centers (5323) 401.42 414.42 422.87 420.70 3.58 3.69 3.77 3.75
Legal Services (5411) 28.14 29.28 29.89 29.70 0.25 0.26 0.27 0.26
Accounting, Tax Preparation, Bookkeeping, and Payroll
Services (5412) 19.30 20.49 20.85 19.58 0.17 0.18 0.19 0.17
Architectural, Engineering, and Related Services (5413) 25.73 26.44 27.02 26.99 0.23 0.24 0.24 0.24
Specialized Design Services (5414) 6.28 6.11 5.74 5.57 0.06 0.05 0.05 0.05
Other Professional, Scientific, and Technical Services (5419) 123.62 131.30 127.63 129.78 1.10 1.17 1.14 1.16
Employment Services (5613) 25.21 25.33 26.28 26.04 0.22 0.23 0.23 0.23
Business Support Services (5614) 237.93 241.63 243.88 260.74 2.12 2.15 2.17 2.32
Travel Arrangement and Reservation Services (5615) 28.72 29.65 30.26 30.10 0.26 0.26 0.27 0.27
Investigation and Security Services (5616) 26.61 26.79 28.37 25.39 0.24 0.24 0.25 0.23
Services to Buildings and Dwellings (5617) 7.04 7.52 7.95 7.75 0.06 0.07 0.07 0.07
Waste Treatment and Disposal (5622) 152.51 156.99 164.19 166.39 1.36 1.40 1.46 1.48
Elementary and Secondary Schools (6111) 144.31 148.98 152.02 151.24 1.29 1.33 1.35 1.35
Junior Colleges (6112) 148.92 153.74 156.88 156.07 1.33 1.37 1.40 1.39
Colleges, Universities, and Professional Schools (6113) 85.88 88.66 90.47 90.00 0.77 0.79 0.81 0.80
Business Schools and Computer and Mgmt Training (6114) 193.65 199.92 204.00 202.95 1.73 1.78 1.82 1.81
Technical and Trade Schools (6115) 193.65 199.92 204.00 202.95 1.73 1.78 1.82 1.81
Other Schools and Instruction (6116) 209.10 216.65 221.15 219.79 1.86 1.93 1.97 1.96
Educational Support Services (6117) 28.72 29.65 30.26 30.10 0.26 0.26 0.27 0.27
Offices of Physicians (6211) 226.25 233.58 238.35 237.12 2.02 2.08 2.12 2.11
Offices of Dentists (6212) 226.25 233.58 238.35 237.12 2.02 2.08 2.12 2.11
Offices of Other Health Practitioners (6213) 271.50 280.30 286.02 284.54 2.42 2.50 2.55 2.54
Outpatient Care Centers (6214) 268.55 277.06 283.27 281.98 2.39 2.47 2.52 2.51
Medical and Diagnostic Laboratories (6215) 226.25 233.58 238.35 237.12 2.02 2.08 2.12 2.11
Other Ambulatory Health Care Services (6219) 10.47 8.97 12.71 12.71 0.09 0.08 0.11 0.11
General Medical and Surgical Hospitals (6221) 120.74 124.65 127.19 126.54 1.08 1.11 1.13 1.13
Psychiatric and Substance Abuse Hospitals (6222) 120.74 124.65 127.19 126.54 1.08 1.11 1.13 1.13
Specialty (except Psychiatric and Substance Abuse)
Hospitals (6223) 120.74 124.65 127.19 126.54 1.08 1.11 1.13 1.13
Nursing Care Facilities (6231) 113.03 116.69 119.07 118.46 1.01 1.04 1.06 1.06
Residential Mental Retardation, Mental Health and
Substance Abuse Facilities (6232) 113.03 116.69 119.07 118.46 1.01 1.04 1.06 1.06
Community Care Facilities for the Elderly (6233) 67.82 70.02 71.44 71.08 0.60 0.62 0.64 0.63
Other Residential Care Facilities (6239) 67.82 70.02 71.44 71.08 0.60 0.62 0.64 0.63
Individual and Family Services (6241) 44.62 46.07 47.01 46.76 0.40 0.41 0.42 0.42

C‐23
Table C.1.3: Average Gallons of Gasoline and Metric Tons of GHG per Job for Public Trips
Industry Title
& 4‐Digit Coding
NAICS 2007 Average gallons of gasoline per
job for public trips 2008
Average gallons of gasoline per
job for public trips 2009
Average gallons of gasoline per
job for public trips 2010
Average gallons of gasoline per
job for public trips 2011
Average metric tons of GHG
per job from public trips 2008
Average metric tons of GHG
per job from public trips 2009
Average metric tons of GHG
per job from public trips 2010
Average metric tons of GHG
per job from public trips 2011
Community Food and Housing, and Emergency and Other
Relief Services (6242) 53.10 54.85 56.21 56.06 0.47 0.49 0.50 0.50
Vocational Rehabilitation Services (6243) 44.62 46.07 47.01 46.76 0.40 0.41 0.42 0.42
Child Day Care Services (6244) 256.58 264.89 270.30 268.91 2.29 2.36 2.41 2.40
Performing Arts Companies (7111) 123.26 127.26 129.85 129.18 1.10 1.13 1.16 1.15
Spectator Sports (7112) 123.26 127.26 129.85 129.18 1.10 1.13 1.16 1.15
Promoters of Perf. Arts, Sports, and Similar Events (7113) 69.32 76.82 76.55 77.29 0.62 0.68 0.68 0.69
Museums, Historical Sites, and Similar Institutions (7121) 97.42 101.13 105.30 104.76 0.87 0.90 0.94 0.93
Amusement Parks and Arcades (7131) 216.81 222.35 227.79 226.03 1.93 1.98 2.03 2.01
Gambling Industries (7132) 656.34 677.60 691.43 687.87 5.85 6.04 6.16 6.13
Other Amusement and Recreation Industries (7139) 308.02 317.99 322.14 319.99 2.74 2.83 2.87 2.85
Traveler Accommodation (7211) 250.48 258.17 262.82 261.31 2.23 2.30 2.34 2.33
RV Parks and Recreational Camps (7212) 221.06 228.22 232.88 231.68 1.97 2.03 2.08 2.06
Full‐Service Restaurants (7221) 403.84 416.92 425.42 ‐ 3.60 3.72 3.79 ‐
Limited‐Service Eating Places (7222) 2823.18 2964.53 2832.90 ‐ 25.16 26.42 25.24 ‐
Special Food Services (7223) 446.83 455.97 500.66 485.56 3.98 4.06 4.46 4.33
Drinking Places (Alcoholic Beverages) (7224) 479.06 494.57 504.67 502.07 4.27 4.41 4.50 4.47
Other Restaurants and Eating Places (7225) 1534.28 1590.04 1631.36 1599.42 13.67 14.17 14.54 14.25
Automotive Repair and Maintenance (8111) 456.39 472.92 476.04 471.15 4.07 4.21 4.24 4.20
Electronic, Precision Equipment Repair and Maint. (8112) 275.62 284.55 290.35 288.86 2.46 2.54 2.59 2.57
Personal and Household Goods Repair and Maint. (8114) 275.62 284.55 290.35 288.86 2.46 2.54 2.59 2.57
Personal Care Services (8121) 237.09 250.41 258.41 260.47 2.11 2.23 2.30 2.32
Death Care Services (8122) 470.55 487.56 500.20 492.75 4.19 4.34 4.46 4.39
Drycleaning and Laundry Services (8123) 174.03 182.48 186.37 194.35 1.55 1.63 1.66 1.73
Other Personal Services (8129) 63.00 63.29 67.70 71.00 0.56 0.56 0.60 0.63
Religious Organizations (8131) 161.83 167.07 170.48 169.60 1.44 1.49 1.52 1.51
Grantmaking and Giving Services (8132) 22.75 23.77 24.04 23.47 0.20 0.21 0.21 0.21
Social Advocacy Organizations (8133) 28.72 29.65 30.26 30.10 0.26 0.26 0.27 0.27
Civic and Social Organizations (8134) 578.10 596.83 609.01 605.87 5.15 5.32 5.43 5.40
Business, Prof., Labor, Political, and Similar Orgs. (8139) 466.97 477.82 489.37 489.58 4.16 4.26 4.36 4.36
Executive, Legislative, and Other Gen. Gov’t Support (9211) 157.19 161.02 163.21 162.28 1.40 1.43 1.45 1.45
Justice, Public Order, and Safety Activities (9221) 173.20 178.98 182.67 181.86 1.54 1.59 1.63 1.62
Administration of Human Resource Programs (9231) 180.09 185.92 189.71 188.74 1.60 1.66 1.69 1.68
Administration of Environmental Quality Programs (9241) 104.61 111.42 114.82 115.90 0.93 0.99 1.02 1.03

C‐24
Table C.1.3: Average Gallons of Gasoline and Metric Tons of GHG per Job for Public Trips
Industry Title
& 4‐Digit Coding
NAICS 2007 Average gallons of gasoline per
job for public trips 2008
Average gallons of gasoline per
job for public trips 2009
Average gallons of gasoline per
job for public trips 2010
Average gallons of gasoline per
job for public trips 2011
Average metric tons of GHG
per job from public trips 2008
Average metric tons of GHG
per job from public trips 2009
Average metric tons of GHG
per job from public trips 2010
Average metric tons of GHG
per job from public trips 2011
Administration of Housing Programs, Urban Planning, and
Community Development (9251) 120.27 122.51 123.62 124.52 1.07 1.09 1.10 1.11
Administration of Economic Program (9261) 98.31 106.42 122.57 104.02 0.88 0.95 1.09 0.93
National Security and International Affairs (9281) 33.56 34.37 33.31 32.26 0.30 0.31 0.30 0.29
Unclassified (9999) 201.73 208.27 212.52 211.42 1.80 1.86 1.89 1.88
TOTAL 257.63 272.91 278.33 279.69 2.30 2.43 2.48 2.49
Source: Economic Roundtable model for estimating GHG emissions from vehicle operations for customer trips. See Appendix A.5. Industries with no data for Los Angeles County are omitted.

C‐25
C.1.4 Life Cycle Terajoules and Metric Tons GHG per Job, LA County
Variations in life cycle terajoules per job and Life cycle metric tons of GHG per job, 2008‐2011,
by 4‐digit NAICS industry, for Los Angeles County. Table cells with five or fewer
establishments are suppressed as “(s)”; table cells with no employment are presented with “‐“.
Table C.1.4: Life Cycle Terajoules and Metric Tons of GHG per Job, Los Angeles County
Industry Title
& 4‐Digit Coding
NAICS 2007 Life cycle terajoules per
job 2008
Life cycle terajoules per
job 2009
Life cycle terajoules per
job 2010
Life cycle terajoules per
job 2011
Life cycle metric tons
of GHG per job 2008
Life cycle metric tons
of GHG per job 2009
Life cycle metric tons
of GHG per job 2010
Life cycle metric tons
of GHG per job 2011
Oilseed and Grain Farming (1111) 1.26 0.93 0.43 0.63 292.89 215.86 100.43 146.39
Vegetable and Melon Farming (1112) 1.48 1.92 1.71 1.98 152.61 197.65 176.25 203.90
Fruit and Tree Nut Farming (1113) 0.68 1.55 1.38 1.53 69.98 158.44 141.35 156.46
Greenhouse, Nursery, and Floriculture Production
(1114) 0.82 1.16 1.23 1.34 68.32 97.03 102.71 112.09
Other Crop Farming (1119) 1.97 2.24 1.82 1.42 286.16 326.14 264.42 206.89
Cattle Ranching and Farming (1121) 0.42 0.27 0.15 0.14 117.68 74.60 42.66 38.45
Poultry and Egg Production (1123) 2.62 2.20 1.12 1.13 320.80 269.29 136.48 138.19
Sheep and Goat Farming (1124) (s) (s) (s) (s) (s) (s) (s) (s)
Aquaculture (1125) 0.17 0.12 0.06 0.06 41.87 29.75 14.45 14.66
Other Animal Production (1129) 0.17 0.12 0.06 0.06 41.87 29.74 14.45 14.66
Forest Nurseries and Gathering of Forest Products
(1132) (s) (s) (s) (s) (s) (s) (s) (s)
Logging (1133) 0.82 0.56 0.73 0.53 87.04 59.69 77.74 56.58
Fishing (1141) 0.21 0.28 0.11 0.14 15.50 20.10 8.00 10.03
Hunting and Trapping (1142) (s) (s) (s) (s) (s) (s) (s) (s)
Support Activities for Crop Production (1151) 0.77 0.91 0.57 0.52 109.83 130.60 82.17 74.11
Support Activities for Animal Production (1152) 0.60 0.67 0.55 0.51 86.70 95.83 79.29 73.92
Support Activities for Forestry (1153) 0.60 0.67 0.55 0.52 86.70 95.83 79.28 73.93
Oil and Gas Extraction (2111) 8.18 6.04 5.76 4.75 1123.00 828.93 790.60 651.47
Coal Mining (2121) (s) (s) (s) (s) (s) (s) (s) (s)
Metal Ore Mining (2122) (s) (s) (s) (s) (s) (s) (s) (s)
Nonmetallic Mineral Mining and Quarrying (2123) 3.48 1.55 4.00 2.74 236.43 104.97 272.25 186.27
Support Activities for Mining (2131) 6.01 7.09 4.68 2.45 514.74 608.62 401.07 209.78
Electric Power Generation, Transmission and
Distribution (2211) 211.91 111.66 149.76 181.55 17888.66 9425.88 12642.27 15325.50
Natural Gas Distribution (2212) 64.18 57.45 53.60 51.54 6869.99 6149.63 5737.53 5517.05
Water, Sewage and Other Systems (2213) 10.04 11.38 20.05 10.45 961.29 1089.18 1918.38 1000.29
Residential Building Construction (2361) 0.87 1.51 1.26 1.56 64.76 111.60 93.63 115.20
Nonresidential Building Construction (2362) 0.81 0.87 0.83 0.85 57.05 61.11 58.68 59.88
Utility System Construction (2371) 0.80 0.94 0.95 0.94 59.52 69.87 70.51 69.93

C‐26
Table C.1.4: Life Cycle Terajoules and Metric Tons of GHG per Job, Los Angeles County
Industry Title
& 4‐Digit Coding
NAICS 2007 Life cycle terajoules per
job 2008
Life cycle terajoules per
job 2009
Life cycle terajoules per
job 2010
Life cycle terajoules per
job 2011
Life cycle metric tons
of GHG per job 2008
Life cycle metric tons
of GHG per job 2009
Life cycle metric tons
of GHG per job 2010
Life cycle metric tons
of GHG per job 2011
Land Subdivision (2372) 0.80 0.94 0.95 0.94 59.52 69.87 70.51 69.93
Highway, Street, and Bridge Construction (2373) 0.80 0.94 0.95 0.94 59.52 69.87 70.51 69.93
Other Heavy and Civil Engineering Construction
(2379) 0.93 0.94 0.95 0.94 68.85 69.39 70.54 69.88
Foundation, Structure, and Building Exterior
Contractors (2381) 0.81 0.86 0.83 0.85 57.06 60.91 58.52 59.78
Building Equipment Contractors (2382) 0.84 0.90 0.86 0.89 59.39 63.77 60.70 62.52
Building Finishing Contractors (2383) 0.84 0.90 0.86 0.89 59.39 63.77 60.70 62.52
Other Specialty Trade Contractors (2389) 0.80 0.94 0.95 0.94 59.52 69.87 70.51 69.93
Animal Food Manufacturing (3111) 13.31 12.22 17.22 12.40 1619.19 1477.38 2073.86 1481.18
Grain and Oilseed Milling (3112) 21.82 22.05 27.13 21.19 2720.22 2757.95 3381.83 2591.25
Sugar and Confectionery Product Manufacturing
(3113) 6.30 6.16 6.81 7.63 454.35 444.03 491.20 550.12
Fruit and Vegetable Preserving and Specialty Food
Manufacturing (3114) 6.34 5.39 6.17 6.64 575.07 498.65 576.97 629.01
Dairy Product Manufacturing (3115) 16.11 15.09 13.54 14.07 2470.85 2325.00 2075.11 2168.08
Animal Slaughtering and Processing (3116) 6.67 4.86 5.45 3.10 1677.91 1217.08 1351.78 748.49
Seafood Product Preparation and Packaging (3117) 4.77 4.00 4.41 3.53 403.23 338.61 372.54 298.87
Bakeries and Tortilla Manufacturing (3118) 2.26 1.87 2.32 1.85 191.15 158.14 196.37 156.47
Other Food Manufacturing (3119) 6.09 5.00 6.07 4.78 518.99 426.35 514.84 405.19
Beverage Manufacturing (3121) 13.05 9.50 11.83 9.41 892.83 646.19 801.57 637.87
Tobacco Manufacturing (3122) (s) (s) (s) (s) (s) (s) (s) (s)
Fiber, Yarn, and Thread Mills (3131) 2.62 4.12 3.63 3.87 184.57 289.96 255.97 272.62
Fabric Mills (3132) 2.53 2.31 2.45 2.48 162.92 147.26 156.86 158.77
Textile and Fabric Finishing and Fabric Coating
Mills (3133) 2.27 2.13 2.68 2.53 146.64 137.40 172.87 163.33
Textile Furnishings Mills (3141) 2.00 1.80 2.06 1.89 128.37 115.72 132.98 121.98
Other Textile Product Mills (3149) 1.18 1.21 1.33 1.35 76.22 78.28 85.91 87.38
Apparel Knitting Mills (3151) 1.15 1.57 1.26 1.53 75.13 102.25 82.24 99.42
Cut and Sew Apparel Manufacturing (3152) 0.58 0.48 0.57 0.60 37.87 31.02 37.24 38.77
Apparel Accessories and Other Apparel
Manufacturing (3159) 1.56 1.72 1.79 3.63 115.16 126.83 131.52 267.78
Leather and Hide Tanning and Finishing (3161) 4.18 7.90 1.26 5.45 749.96 1417.88 225.55 978.28
Footwear Manufacturing (3162) 0.97 1.38 1.21 1.10 86.32 123.59 108.33 98.38
Other Leather and Allied Product Manufacturing
(3169) 1.14 1.27 1.24 1.38 116.22 128.78 126.69 140.78
Sawmills and Wood Preservation (3211) 2.00 1.61 1.76 1.83 111.26 89.76 97.99 102.13
Veneer, Plywood, and Engineered Wood Product
Manufacturing (3212) 1.36 1.41 1.82 2.24 62.43 63.15 82.55 100.15
Other Wood Product Manufacturing (3219) 1.16 1.22 1.16 1.20 65.21 68.82 65.49 67.64

C‐27
Table C.1.4: Life Cycle Terajoules and Metric Tons of GHG per Job, Los Angeles County
Industry Title
& 4‐Digit Coding
NAICS 2007 Life cycle terajoules per
job 2008
Life cycle terajoules per
job 2009
Life cycle terajoules per
job 2010
Life cycle terajoules per
job 2011
Life cycle metric tons
of GHG per job 2008
Life cycle metric tons
of GHG per job 2009
Life cycle metric tons
of GHG per job 2010
Life cycle metric tons
of GHG per job 2011
Pulp, Paper, and Paperboard Mills (3221) 14.39 14.16 21.03 25.86 537.10 532.05 786.80 987.61
Converted Paper Product Manufacturing (3222) 7.61 7.68 8.23 6.80 322.97 325.98 349.28 288.33
Printing and Related Support Activities (3231) 1.68 1.67 1.53 0.87 86.85 86.16 79.30 45.13
Petroleum and Coal Products Manufacturing (3241) 44.70 43.63 43.18 44.70 3900.90 3821.73 3777.25 3915.05
Basic Chemical Manufacturing (3251) 19.13 22.42 16.09 19.25 1610.54 1841.14 1372.50 1607.69
Resin, Synthetic Rubber, and Artificial Synthetic
Fibers and Filaments Manufacturing (3252) 29.21 33.51 23.69 31.91 1748.73 2004.16 1416.31 1908.10
Pesticide, Fertilizer, and Other Agricultural
Chemical Manufacturing (3253) 14.52 15.37 12.18 13.41 1503.58 1567.92 1256.09 1348.10
Pharmaceutical and Medicine Manufacturing (3254) 2.72 2.54 2.34 2.23 170.65 158.73 146.31 139.64
Paint, Coating, and Adhesive Manufacturing (3255) 6.12 7.48 5.69 6.74 403.79 494.20 375.82 444.84
Soap, Cleaning Compound, and Toilet Preparation
Manufacturing (3256) 5.00 5.00 4.97 4.93 322.87 322.82 320.67 318.74
Other Chemical Product and Preparation
Manufacturing (3259) 4.64 5.57 4.72 6.78 311.47 373.69 315.04 450.39
Plastics Product Manufacturing (3261) 2.97 2.83 3.22 3.26 179.23 170.33 193.91 196.79
Rubber Product Manufacturing (3262) 2.16 1.74 2.18 2.36 136.12 109.67 137.84 148.89
Clay Product and Refractory Manufacturing (3271) 1.82 1.83 2.16 2.72 117.05 117.66 138.91 174.76
Glass and Glass Product Manufacturing (3272) 3.87 3.34 4.31 2.96 221.68 192.23 248.39 171.06
Cement and Concrete Product Manufacturing (3273) 6.71 6.19 7.13 7.29 770.59 709.94 818.70 837.69
Lime and Gypsum Product Manufacturing (3274) 11.81 11.56 11.74 11.82 1405.50 1376.37 1397.58 1406.42
Other Nonmetallic Mineral Product Manufacturing
(3279) 2.66 2.53 3.12 3.05 250.65 238.21 290.32 283.05
Iron and Steel Mills and Ferroalloy Manufacturing
(3311) 14.82 18.81 15.81 15.57 1252.55 1590.13 1336.66 1316.31
Steel Product Manufacturing from Purchased Steel
(3312) 8.82 11.25 10.43 11.88 710.49 906.01 839.84 956.99
Alumina and Aluminum Production and Processing
(3313) 8.24 9.99 11.25 9.18 540.55 655.17 733.01 607.91
Nonferrous Metal (except Aluminum) Production
and Processing (3314) 5.32 8.11 8.08 10.28 402.63 620.40 620.71 825.28
Foundries (3315) 2.14 2.29 2.78 2.11 139.24 148.61 180.47 137.71
Forging and Stamping (3321) 4.83 4.47 4.90 5.67 353.63 327.91 358.52 414.30
Cutlery and Handtool Manufacturing (3322) 1.78 1.76 2.10 1.67 125.19 124.15 147.51 117.46
Architectural and Structural Metals Manufacturing
(3323) 2.41 2.38 2.46 2.14 176.75 174.24 180.27 156.19
Boiler, Tank, and Shipping Container Manufacturing
(3324) 6.27 6.40 7.52 5.97 440.99 450.52 528.53 419.99
Hardware Manufacturing (3325) 1.73 1.75 2.26 2.19 120.04 120.97 156.45 151.79
Spring and Wire Product Manufacturing (3326) 1.38 1.45 1.62 1.39 100.49 105.79 118.35 101.22
Machine Shops; Turned Product; and Screw, Nut,
and Bolt Manufacturing (3327) 1.54 1.41 1.47 1.45 107.49 98.32 102.92 100.89
Coating, Engraving, Heat Treating, and Allied
Activities (3328) 2.54 2.51 2.67 2.63 174.17 172.59 183.53 180.65
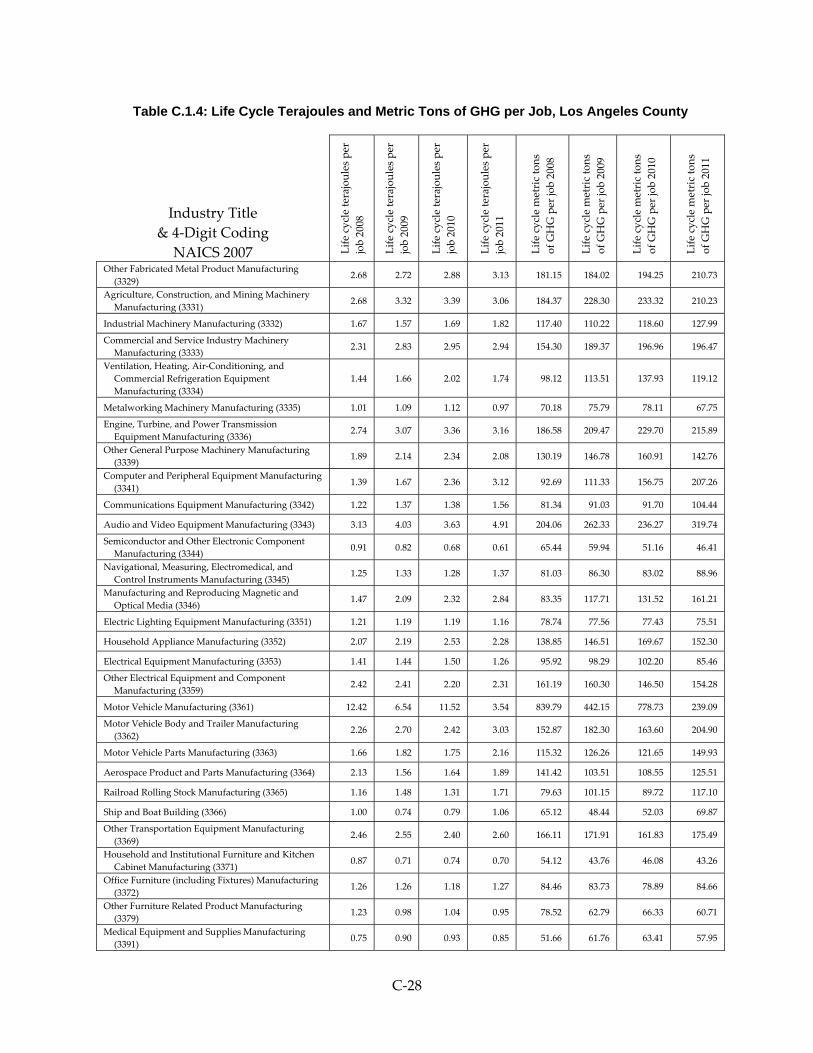
C‐28
Table C.1.4: Life Cycle Terajoules and Metric Tons of GHG per Job, Los Angeles County
Industry Title
& 4‐Digit Coding
NAICS 2007 Life cycle terajoules per
job 2008
Life cycle terajoules per
job 2009
Life cycle terajoules per
job 2010
Life cycle terajoules per
job 2011
Life cycle metric tons
of GHG per job 2008
Life cycle metric tons
of GHG per job 2009
Life cycle metric tons
of GHG per job 2010
Life cycle metric tons
of GHG per job 2011
Other Fabricated Metal Product Manufacturing
(3329) 2.68 2.72 2.88 3.13 181.15 184.02 194.25 210.73
Agriculture, Construction, and Mining Machinery
Manufacturing (3331) 2.68 3.32 3.39 3.06 184.37 228.30 233.32 210.23
Industrial Machinery Manufacturing (3332) 1.67 1.57 1.69 1.82 117.40 110.22 118.60 127.99
Commercial and Service Industry Machinery
Manufacturing (3333) 2.31 2.83 2.95 2.94 154.30 189.37 196.96 196.47
Ventilation, Heating, Air‐Conditioning, and
Commercial Refrigeration Equipment
Manufacturing (3334)
1.44 1.66 2.02 1.74 98.12 113.51 137.93 119.12
Metalworking Machinery Manufacturing (3335) 1.01 1.09 1.12 0.97 70.18 75.79 78.11 67.75
Engine, Turbine, and Power Transmission
Equipment Manufacturing (3336) 2.74 3.07 3.36 3.16 186.58 209.47 229.70 215.89
Other General Purpose Machinery Manufacturing
(3339) 1.89 2.14 2.34 2.08 130.19 146.78 160.91 142.76
Computer and Peripheral Equipment Manufacturing
(3341) 1.39 1.67 2.36 3.12 92.69 111.33 156.75 207.26
Communications Equipment Manufacturing (3342) 1.22 1.37 1.38 1.56 81.34 91.03 91.70 104.44
Audio and Video Equipment Manufacturing (3343) 3.13 4.03 3.63 4.91 204.06 262.33 236.27 319.74
Semiconductor and Other Electronic Component
Manufacturing (3344) 0.91 0.82 0.68 0.61 65.44 59.94 51.16 46.41
Navigational, Measuring, Electromedical, and
Control Instruments Manufacturing (3345) 1.25 1.33 1.28 1.37 81.03 86.30 83.02 88.96
Manufacturing and Reproducing Magnetic and
Optical Media (3346) 1.47 2.09 2.32 2.84 83.35 117.71 131.52 161.21
Electric Lighting Equipment Manufacturing (3351) 1.21 1.19 1.19 1.16 78.74 77.56 77.43 75.51
Household Appliance Manufacturing (3352) 2.07 2.19 2.53 2.28 138.85 146.51 169.67 152.30
Electrical Equipment Manufacturing (3353) 1.41 1.44 1.50 1.26 95.92 98.29 102.20 85.46
Other Electrical Equipment and Component
Manufacturing (3359) 2.42 2.41 2.20 2.31 161.19 160.30 146.50 154.28
Motor Vehicle Manufacturing (3361) 12.42 6.54 11.52 3.54 839.79 442.15 778.73 239.09
Motor Vehicle Body and Trailer Manufacturing
(3362) 2.26 2.70 2.42 3.03 152.87 182.30 163.60 204.90
Motor Vehicle Parts Manufacturing (3363) 1.66 1.82 1.75 2.16 115.32 126.26 121.65 149.93
Aerospace Product and Parts Manufacturing (3364) 2.13 1.56 1.64 1.89 141.42 103.51 108.55 125.51
Railroad Rolling Stock Manufacturing (3365) 1.16 1.48 1.31 1.71 79.63 101.15 89.72 117.10
Ship and Boat Building (3366) 1.00 0.74 0.79 1.06 65.12 48.44 52.03 69.87
Other Transportation Equipment Manufacturing
(3369) 2.46 2.55 2.40 2.60 166.11 171.91 161.83 175.49
Household and Institutional Furniture and Kitchen
Cabinet Manufacturing (3371) 0.87 0.71 0.74 0.70 54.12 43.76 46.08 43.26
Office Furniture (including Fixtures) Manufacturing
(3372) 1.26 1.26 1.18 1.27 84.46 83.73 78.89 84.66
Other Furniture Related Product Manufacturing
(3379) 1.23 0.98 1.04 0.95 78.52 62.79 66.33 60.71
Medical Equipment and Supplies Manufacturing
(3391) 0.75 0.90 0.93 0.85 51.66 61.76 63.41 57.95

C‐29
Table C.1.4: Life Cycle Terajoules and Metric Tons of GHG per Job, Los Angeles County
Industry Title
& 4‐Digit Coding
NAICS 2007 Life cycle terajoules per
job 2008
Life cycle terajoules per
job 2009
Life cycle terajoules per
job 2010
Life cycle terajoules per
job 2011
Life cycle metric tons
of GHG per job 2008
Life cycle metric tons
of GHG per job 2009
Life cycle metric tons
of GHG per job 2010
Life cycle metric tons
of GHG per job 2011
Other Miscellaneous Manufacturing (3399) 1.28 1.29 1.31 1.32 80.35 81.74 84.01 83.64
Motor Vehicle and Motor Vehicle Parts and Supplies
Merchant Wholesalers (4231) 0.45 0.45 0.53 0.50 27.85 27.71 32.84 30.78
Furniture and Home Furnishing Merchant
Wholesalers (4232) 0.45 0.45 0.53 0.50 27.85 27.71 32.84 30.78
Lumber and Other Construction Materials Merchant
Wholesalers (4233) 0.45 0.45 0.53 0.50 27.85 27.71 32.84 30.78
Professional and Commercial Equipment and
Supplies Merchant Wholesalers (4234) 0.45 0.45 0.53 0.50 27.85 27.71 32.84 30.78
Metal and Mineral (except Petroleum) Merchant
Wholesalers (4235) 0.45 0.45 0.53 0.50 27.85 27.71 32.84 30.78
Electrical and Electronic Goods Merchant
Wholesalers (4236) 0.45 0.45 0.53 0.50 27.85 27.71 32.84 30.78
Hardware, and Plumbing and Heating Equipment
and Supplies Merchant Wholesalers (4237) 0.45 0.45 0.53 0.50 27.85 27.71 32.84 30.78
Machinery, Equipment, and Supplies Merchant
Wholesalers (4238) 0.45 0.45 0.53 0.50 27.85 27.71 32.84 30.78
Miscellaneous Durable Goods Merchant Wholesalers
(4239) 0.45 0.45 0.53 0.50 27.85 27.71 32.84 30.78
Paper and Paper Product Merchant Wholesalers
(4241) 0.45 0.45 0.53 0.50 27.85 27.71 32.84 30.78
Drugs and Druggistsʹ Sundries Merchant
Wholesalers (4242) 0.45 0.45 0.53 0.50 27.85 27.71 32.84 30.78
Apparel, Piece Goods, and Notions Merchant
Wholesalers (4243) 0.45 0.45 0.53 0.50 27.85 27.71 32.84 30.78
Grocery and Related Product Merchant Wholesalers
(4244) 0.45 0.45 0.53 0.50 27.85 27.71 32.84 30.78
Farm Product Raw Material Merchant Wholesalers
(4245) 0.45 0.45 0.53 0.50 27.85 27.71 32.84 30.78
Chemical and Allied Products Merchant Wholesalers
(4246) 0.45 0.45 0.53 0.50 27.85 27.71 32.84 30.78
Petroleum and Petroleum Products Merchant
Wholesalers (4247) 0.45 0.45 0.53 0.50 27.85 27.71 32.84 30.78
Beer, Wine, and Distilled Alcoholic Beverage
Merchant Wholesalers (4248) 0.45 0.45 0.53 0.50 27.85 27.71 32.84 30.78
Miscellaneous Nondurable Goods Merchant
Wholesalers (4249) 0.45 0.45 0.53 0.50 27.85 27.71 32.84 30.78
Wholesale Electronic Markets and Agents and
Brokers (4251) 0.45 0.45 0.53 0.50 27.85 27.71 32.84 30.78
Automobile Dealers (4411) 0.31 0.31 0.32 0.32 19.94 20.05 20.83 20.32
Other Motor Vehicle Dealers (4412) 0.31 0.31 0.32 0.32 19.94 20.05 20.83 20.32
Automotive Parts, Accessories, and Tire Stores
(4413) 0.31 0.31 0.32 0.32 19.94 20.05 20.83 20.32
Furniture Stores (4421) 0.31 0.33 0.33 0.23 20.03 21.14 20.98 14.87
Home Furnishings Stores (4422) 0.31 0.33 0.33 0.23 20.03 21.14 20.98 14.87
Electronics and Appliance Stores (4431) 0.32 0.31 0.43 0.35 20.87 20.14 27.57 22.79
Building Material and Supplies Dealers (4441) 0.31 0.30 0.31 0.25 20.16 19.41 19.63 16.01
Lawn and Garden Equipment and Supplies Stores
(4442) 0.31 0.30 0.31 0.25 20.16 19.41 19.63 16.01

C‐30
Table C.1.4: Life Cycle Terajoules and Metric Tons of GHG per Job, Los Angeles County
Industry Title
& 4‐Digit Coding
NAICS 2007 Life cycle terajoules per
job 2008
Life cycle terajoules per
job 2009
Life cycle terajoules per
job 2010
Life cycle terajoules per
job 2011
Life cycle metric tons
of GHG per job 2008
Life cycle metric tons
of GHG per job 2009
Life cycle metric tons
of GHG per job 2010
Life cycle metric tons
of GHG per job 2011
Grocery Stores (4451) 0.31 0.31 0.30 0.30 19.76 19.94 19.42 19.30
Specialty Food Stores (4452) 0.31 0.31 0.30 0.30 19.76 19.94 19.42 19.30
Beer, Wine, and Liquor Stores (4453) 0.31 0.31 0.30 0.30 19.76 19.94 19.42 19.30
Health and Personal Care Stores (4461) 0.36 0.34 0.35 0.32 22.96 22.03 22.70 20.82
Gasoline Stations (4471) 0.72 0.61 0.64 0.81 46.04 38.93 41.43 52.34
Clothing Stores (4481) 0.29 0.27 0.21 0.20 18.54 17.38 13.32 13.07
Shoe Stores (4482) 0.29 0.27 0.21 0.20 18.54 17.38 13.32 13.07
Jewelry, Luggage, and Leather Goods Stores (4483) 0.29 0.27 0.21 0.20 18.54 17.38 13.32 13.07
Sporting Goods, Hobby, and Musical Instrument
Stores (4511) 0.21 0.22 0.21 0.16 13.74 14.07 13.75 10.29
Book, Periodical, and Music Stores (4512) 0.21 0.22 0.21 0.16 13.74 14.07 13.75 10.29
Department Stores (4521) 0.17 0.22 0.23 0.22 11.19 13.97 15.11 14.09
Other General Merchandise Stores (4529) 0.17 0.22 0.23 0.22 11.19 13.97 15.11 14.09
Florists (4531) 0.18 0.17 0.21 0.21 11.44 10.88 13.52 13.60
Office Supplies, Stationery, and Gift Stores (4532) 0.18 0.17 0.21 0.21 11.44 10.88 13.52 13.60
Used Merchandise Stores (4533) 0.18 0.17 0.21 0.21 11.44 10.88 13.52 13.60
Other Miscellaneous Store Retailers (4539) 0.18 0.17 0.21 0.21 11.44 10.88 13.52 13.60
Electronic Shopping and Mail‐Order Houses (4541) 0.27 0.28 0.19 0.41 17.46 18.24 12.47 26.16
Vending Machine Operators (4542) 0.27 0.28 0.19 0.41 17.46 18.24 12.47 26.16
Direct Selling Establishments (4543) 0.27 0.28 0.19 0.41 17.46 18.24 12.47 26.16
Scheduled Air Transportation (4811) 10.35 15.46 14.59 14.11 721.64 1078.07 1017.19 983.67
Nonscheduled Air Transportation (4812) 10.35 15.46 14.59 14.11 721.64 1078.07 1017.19 983.67
Rail Transportation (4821) 21.99 22.37 19.93 15.47 1516.31 1542.79 1374.23 1066.67
Deep Sea, Coastal, and Great Lakes Water
Transportation (4831) 17.66 11.59 11.44 18.27 1139.12 747.65 737.93 1178.16
Inland Water Transportation (4832) 17.66 11.59 11.44 18.27 1139.13 747.66 737.94 1178.16
General Freight Trucking (4841) 1.13 0.76 0.81 1.17 84.22 56.34 60.21 87.38
Specialized Freight Trucking (4842) 1.13 0.76 0.81 1.17 84.22 56.34 60.21 87.38
Urban Transit Systems (4851) 2.08 3.23 2.49 3.77 123.23 191.98 147.54 223.84
Interurban and Rural Bus Transportation (4852) 2.08 3.23 2.49 3.77 123.23 191.98 147.54 223.84
Taxi and Limousine Service (4853) 2.08 3.23 2.49 3.77 123.23 191.98 147.54 223.84
School and Employee Bus Transportation (4854) 2.08 3.23 2.49 3.77 123.23 191.98 147.54 223.84
Charter Bus Industry (4855) 2.08 3.23 2.49 3.77 123.23 191.98 147.54 223.84
Other Transit and Ground Passenger Transportation
(4859) 2.08 3.23 2.49 3.77 123.23 191.98 147.54 223.84
Pipeline Transportation of Crude Oil (4861) 43.87 75.09 36.74 43.92 3690.83 6317.63 3090.83 3695.34
Pipeline Transportation of Natural Gas (4862) 43.87 75.10 36.74 43.93 3690.91 6317.93 3090.90 3695.44

C‐31
Table C.1.4: Life Cycle Terajoules and Metric Tons of GHG per Job, Los Angeles County
Industry Title
& 4‐Digit Coding
NAICS 2007 Life cycle terajoules per
job 2008
Life cycle terajoules per
job 2009
Life cycle terajoules per
job 2010
Life cycle terajoules per
job 2011
Life cycle metric tons
of GHG per job 2008
Life cycle metric tons
of GHG per job 2009
Life cycle metric tons
of GHG per job 2010
Life cycle metric tons
of GHG per job 2011
Other Pipeline Transportation (4869) 43.87 75.10 36.74 43.93 3690.80 6317.80 3090.86 3695.44
Scenic and Sightseeing Transportation, Land (4871) 1.16 1.41 0.97 0.49 82.56 100.42 69.31 34.62
Scenic and Sightseeing Transportation, Water (4872) 1.31 0.64 0.52 0.23 93.54 45.69 36.91 16.10
Scenic and Sightseeing Transportation, Other (4879) 1.31 0.64 0.52 0.23 93.56 45.69 36.88 16.09
Support Activities for Air Transportation (4881) 1.42 0.85 0.73 0.28 100.81 60.79 51.80 20.30
Support Activities for Rail Transportation (4882) 0.65 0.36 0.38 0.18 46.48 25.93 26.94 13.02
Support Activities for Water Transportation (4883) 0.66 0.37 0.38 0.18 46.77 26.07 27.01 13.04
Support Activities for Road Transportation (4884) 0.65 0.36 0.38 0.18 46.48 25.93 26.94 13.02
Freight Transportation Arrangement (4885) 0.65 0.36 0.38 0.18 46.48 25.93 26.94 13.02
Other Support Activities for Transportation (4889) 0.65 0.36 0.38 0.18 46.48 25.93 26.94 13.02
Postal Service (4911) 0.30 0.22 0.20 0.22 19.53 14.35 12.97 13.85
Couriers and Express Delivery Services (4921) 0.72 0.58 0.64 0.70 51.52 41.54 45.61 50.35
Local Messengers and Local Delivery (4922) 0.72 0.58 0.64 0.70 51.52 41.54 45.61 50.35
Warehousing and Storage (4931) 0.73 0.63 0.67 0.72 47.60 41.10 43.78 47.21
Newspaper, Periodical, Book, and Directory
Publishers (5111) 0.93 1.19 1.28 0.74 53.57 68.48 73.70 42.75
Software Publishers (5112) 0.47 0.77 0.93 0.55 29.58 48.51 58.21 34.41
Motion Picture and Video Industries (5121) 0.39 0.57 0.56 0.52 24.81 36.11 35.53 33.00
Sound Recording Industries (5122) 1.85 3.10 3.27 2.23 116.19 194.69 205.51 140.24
Radio and Television Broadcasting (5151) 1.87 1.99 1.62 2.85 121.88 129.84 105.31 185.66
Cable and Other Subscription Programming (5152) 1.83 1.25 1.05 1.12 117.88 80.59 67.85 72.20
Wired Telecommunications Carriers (5171) 0.67 0.79 0.72 0.78 44.47 52.58 47.64 51.53
Wireless Telecommunications Carriers (except
Satellite) (5172) 0.67 0.79 0.72 0.78 44.47 52.58 47.64 51.53
Satellite Telecommunications (5174) 0.67 0.79 0.72 0.78 44.47 52.58 47.64 51.53
Other Telecommunications (5179) 0.67 0.79 0.72 0.78 44.47 52.58 47.64 51.53
Data Processing, Hosting, and Related Services
(5182) 0.34 0.54 0.92 0.89 22.36 36.16 60.80 59.12
Other Information Services (5191) 1.41 0.47 1.48 0.47 94.72 31.75 99.67 31.77
Monetary Authorities‐Central Bank (5211) 0.26 0.20 0.24 0.33 17.39 13.21 15.65 21.79
Depository Credit Intermediation (5221) 0.26 0.20 0.24 0.33 17.39 13.21 15.65 21.79
Nondepository Credit Intermediation (5222) 0.20 0.28 0.12 0.11 12.91 18.24 7.61 7.13
Activities Related to Credit Intermediation (5223) 0.20 0.28 0.12 0.11 12.91 18.24 7.61 7.13
Securities and Commodity Contracts Intermediation
and Brokerage (5231) 0.28 0.17 0.09 0.18 18.57 11.18 5.81 11.80
Securities and Commodity Exchanges (5232) 0.28 0.17 0.09 0.18 18.57 11.18 5.81 11.80
Other Financial Investment Activities (5239) 0.28 0.17 0.09 0.18 18.57 11.18 5.81 11.80

C‐32
Table C.1.4: Life Cycle Terajoules and Metric Tons of GHG per Job, Los Angeles County
Industry Title
& 4‐Digit Coding
NAICS 2007 Life cycle terajoules per
job 2008
Life cycle terajoules per
job 2009
Life cycle terajoules per
job 2010
Life cycle terajoules per
job 2011
Life cycle metric tons
of GHG per job 2008
Life cycle metric tons
of GHG per job 2009
Life cycle metric tons
of GHG per job 2010
Life cycle metric tons
of GHG per job 2011
Insurance Carriers (5241) 0.25 0.35 0.33 0.28 15.44 21.50 20.56 17.28
Agencies, Brokerages, and Other Insurance Related
Activities (5242) 0.21 0.22 0.20 0.20 13.97 14.44 12.89 13.23
Insurance and Employee Benefit Funds (5251) 0.25 0.72 0.81 0.36 16.59 47.60 53.54 23.97
Other Investment Pools and Funds (5259) 0.25 0.72 0.81 0.36 16.59 47.60 53.54 23.97
Lessors of Real Estate (5311) 0.61 0.56 0.60 0.49 43.70 39.93 43.42 35.08
Offices of Real Estate Agents and Brokers (5312) 0.61 0.56 0.60 0.49 43.70 39.93 43.42 35.08
Activities Related to Real Estate (5313) 0.61 0.56 0.60 0.49 43.70 39.93 43.42 35.08
Automotive Equipment Rental and Leasing (5321) 0.07 0.08 0.08 0.09 4.86 5.58 5.14 5.70
Consumer Goods Rental (5322) 0.08 0.11 0.07 0.10 5.51 6.99 4.83 6.25
General Rental Centers (5323) 0.05 0.07 0.05 0.05 3.53 4.46 3.05 3.40
Commercial and Industrial Machinery and
Equipment Rental and Leasing (5324) 0.17 0.19 0.14 0.15 14.08 15.75 11.71 12.59
Lessors of Nonfinancial Intangible Assets (except
Copyrighted Works) (5331) 2.29 4.91 4.60 4.80 141.58 303.82 284.28 296.60
Legal Services (5411) 0.21 0.25 0.24 0.25 13.89 16.35 15.48 16.10
Accounting, Tax Preparation, Bookkeeping, and
Payroll Services (5412) 0.15 0.14 0.18 0.19 9.61 9.09 11.65 12.56
Architectural, Engineering, and Related Services
(5413) 0.31 0.31 0.38 0.37 21.41 21.45 26.10 25.32
Specialized Design Services (5414) 0.27 0.27 0.35 0.28 17.24 17.07 22.01 18.10
Computer Systems Design and Related Services
(5415) 0.28 0.24 0.27 0.30 20.18 17.19 19.16 21.88
Management, Scientific, and Technical Consulting
Services (5416) 0.21 0.16 0.18 0.17 14.12 10.95 11.87 11.64
Scientific Research and Development Services (5417) 0.63 0.62 0.73 0.84 44.17 43.60 51.31 59.54
Advertising, Public Relations, and Related Services
(5418) 1.35 1.42 1.64 2.06 78.06 82.52 95.06 119.46
Other Professional, Scientific, and Technical Services
(5419) 0.41 0.27 0.36 0.38 26.81 17.39 23.81 24.62
Management of Companies and Enterprises (5511) 0.53 0.42 0.37 0.40 33.74 26.71 23.54 25.66
Office Administrative Services (5611) 0.38 0.26 0.22 0.21 24.63 16.92 14.58 13.72
Facilities Support Services (5612) 0.25 0.31 0.29 0.42 19.20 23.64 21.72 31.69
Employment Services (5613) 0.04 0.05 0.04 0.04 2.66 2.88 2.27 2.82
Business Support Services (5614) 0.23 0.16 0.13 0.16 14.49 10.01 8.46 10.25
Travel Arrangement and Reservation Services (5615) 0.56 0.37 0.44 0.56 35.65 23.62 28.21 35.69
Investigation and Security Services (5616) 0.09 0.08 0.07 0.08 6.03 5.31 4.48 4.99
Services to Buildings and Dwellings (5617) 0.34 0.34 0.29 0.30 26.78 26.52 23.17 24.01
Other Support Services (5619) 0.53 0.36 0.29 0.38 34.01 22.67 18.35 23.96
Waste Collection (5621) 0.84 0.89 0.87 1.00 407.44 431.69 420.22 485.13
Waste Treatment and Disposal (5622) 0.84 0.89 0.87 1.00 407.44 431.69 420.22 485.13

C‐33
Table C.1.4: Life Cycle Terajoules and Metric Tons of GHG per Job, Los Angeles County
Industry Title
& 4‐Digit Coding
NAICS 2007 Life cycle terajoules per
job 2008
Life cycle terajoules per
job 2009
Life cycle terajoules per
job 2010
Life cycle terajoules per
job 2011
Life cycle metric tons
of GHG per job 2008
Life cycle metric tons
of GHG per job 2009
Life cycle metric tons
of GHG per job 2010
Life cycle metric tons
of GHG per job 2011
Remediation and Other Waste Management Services
(5629) 0.84 0.89 0.87 1.00 407.44 431.69 420.23 485.13
Elementary and Secondary Schools (6111) 0.36 0.43 0.30 0.28 24.13 29.22 20.29 18.67
Junior Colleges (6112) 1.02 1.00 1.23 1.13 69.77 68.28 84.59 77.38
Colleges, Universities, and Professional Schools
(6113) 1.02 1.00 1.23 1.13 69.77 68.28 84.59 77.38
Business Schools and Computer and Management
Training (6114) 0.13 0.13 0.10 0.11 8.48 8.51 6.59 7.34
Technical and Trade Schools (6115) 0.15 0.17 0.14 0.17 9.92 11.28 9.20 11.50
Other Schools and Instruction (6116) 0.13 0.13 0.10 0.11 8.48 8.51 6.59 7.34
Educational Support Services (6117) 0.13 0.13 0.10 0.11 8.48 8.51 6.59 7.34
Offices of Physicians (6211) 0.26 0.23 0.22 0.22 17.49 15.41 14.69 14.80
Offices of Dentists (6212) 0.26 0.23 0.22 0.22 17.49 15.41 14.69 14.80
Offices of Other Health Practitioners (6213) 0.26 0.23 0.22 0.22 17.49 15.41 14.69 14.80
Outpatient Care Centers (6214) 0.55 0.42 0.43 0.48 37.33 28.38 29.17 32.76
Medical and Diagnostic Laboratories (6215) 0.55 0.42 0.43 0.48 37.33 28.38 29.17 32.76
Home Health Care Services (6216) 0.24 0.20 0.18 0.16 16.78 14.39 12.57 11.55
Other Ambulatory Health Care Services (6219) 0.55 0.42 0.43 0.48 37.33 28.38 29.17 32.76
General Medical and Surgical Hospitals (6221) 0.70 0.79 0.72 0.68 50.27 57.01 52.42 49.53
Psychiatric and Substance Abuse Hospitals (6222) 0.70 0.79 0.72 0.68 50.27 57.01 52.42 49.53
Specialty (except Psychiatric and Substance Abuse)
Hospitals (6223) 0.70 0.79 0.72 0.68 50.27 57.01 52.42 49.53
Nursing Care Facilities (6231) 0.21 0.24 0.23 0.22 15.33 17.73 16.68 15.97
Residential Mental Retardation, Mental Health and
Substance Abuse Facilities (6232) 0.21 0.24 0.23 0.22 15.33 17.73 16.68 15.97
Community Care Facilities for the Elderly (6233) 0.21 0.24 0.23 0.22 15.33 17.73 16.68 15.97
Other Residential Care Facilities (6239) 0.21 0.24 0.23 0.22 15.33 17.73 16.68 15.97
Individual and Family Services (6241) 0.13 0.13 0.13 0.14 9.69 9.24 9.24 9.85
Community Food and Housing, and Emergency and
Other Relief Services (6242) 0.10 0.13 0.13 0.14 7.11 9.29 9.63 10.13
Vocational Rehabilitation Services (6243) 0.10 0.13 0.13 0.14 7.11 9.29 9.63 10.13
Child Day Care Services (6244) 0.18 0.16 0.16 0.13 13.25 11.83 11.87 9.35
Performing Arts Companies (7111) 0.19 0.14 0.14 0.17 12.49 8.93 9.02 10.84
Spectator Sports (7112) 0.13 0.12 0.10 0.11 8.58 7.80 7.02 7.75
Promoters of Performing Arts, Sports, and Similar
Events (7113) 0.39 0.41 0.33 0.35 24.89 26.11 20.75 22.31
Agents and Managers for Artists, Athletes,
Entertainers, and Other Public Figures (7114) 0.39 0.41 0.33 0.35 24.89 26.11 20.75 22.31
Independent Artists, Writers, and Performers (7115) 0.32 0.32 0.27 0.32 20.77 20.68 17.59 20.93
Museums, Historical Sites, and Similar Institutions
(7121) 1.78 1.44 1.23 1.50 116.18 94.01 80.32 98.44

C‐34
Table C.1.4: Life Cycle Terajoules and Metric Tons of GHG per Job, Los Angeles County
Industry Title
& 4‐Digit Coding
NAICS 2007 Life cycle terajoules per
job 2008
Life cycle terajoules per
job 2009
Life cycle terajoules per
job 2010
Life cycle terajoules per
job 2011
Life cycle metric tons
of GHG per job 2008
Life cycle metric tons
of GHG per job 2009
Life cycle metric tons
of GHG per job 2010
Life cycle metric tons
of GHG per job 2011
Amusement Parks and Arcades (7131) 0.65 0.55 0.49 0.53 47.39 39.95 35.69 38.70
Gambling Industries (7132) 0.65 0.55 0.49 0.53 47.39 39.95 35.69 38.70
Other Amusement and Recreation Industries (7139) 0.37 0.32 0.31 0.34 25.45 22.37 21.24 23.13
Traveler Accommodation (7211) 0.55 0.56 0.51 0.52 34.73 35.41 32.35 33.07
RV (Recreational Vehicle) Parks and Recreational
Camps (7212) 0.64 0.57 0.66 0.69 47.02 41.69 48.22 50.53
Rooming and Boarding Houses (7213) 0.38 0.35 0.41 0.41 28.14 25.43 30.02 29.75
Full‐Service Restaurants (7221) 0.35 0.34 0.33 0.33 27.22 26.64 26.02 26.02
Limited‐Service Eating Places (7222) 0.35 0.34 0.33 0.33 27.22 26.64 26.02 26.02
Special Food Services (7223) 0.35 0.34 0.33 0.32 27.22 26.64 26.02 25.28
Drinking Places (Alcoholic Beverages) (7224) 0.35 0.34 0.33 0.32 27.22 26.64 26.02 25.28
Other Restaurants and Eating Places (7225) 0.35 0.34 0.33 0.32 27.22 26.64 26.02 25.28
Automotive Repair and Maintenance (8111) 0.41 0.37 0.35 0.37 27.91 25.15 24.16 25.28
Electronic and Precision Equipment Repair and
Maintenance (8112) 0.40 0.34 0.33 0.48 27.34 23.25 22.42 32.69
Commercial and Industrial Machinery and
Equipment (except Automotive and Electronic)
Repair and Maintenance (8113)
0.56 0.45 0.41 0.51 38.25 30.67 28.38 35.21
Personal and Household Goods Repair and
Maintenance (8114) 0.63 0.66 0.35 0.70 43.48 45.94 24.01 48.54
Personal Care Services (8121) 0.19 0.23 0.20 0.27 12.83 14.96 13.06 18.07
Death Care Services (8122) 0.58 0.93 0.80 1.09 38.03 60.84 52.41 71.29
Drycleaning and Laundry Services (8123) 0.22 0.25 0.23 0.26 14.33 16.51 15.19 16.75
Other Personal Services (8129) 0.46 0.42 0.27 0.38 30.80 28.10 17.87 25.45
Religious Organizations (8131) 0.34 0.16 0.18 0.40 23.29 11.24 12.34 27.62
Grantmaking and Giving Services (8132) 0.17 0.43 0.43 0.39 11.30 28.44 28.37 25.57
Social Advocacy Organizations (8133) 0.17 0.43 0.43 0.39 11.30 28.44 28.37 25.57
Civic and Social Organizations (8134) 0.34 0.62 0.59 0.59 22.90 41.80 40.00 39.78
Business, Professional, Labor, Political, and Similar
Organizations (8139) 0.34 0.62 0.59 0.59 22.90 41.80 40.00 39.78
Private Households (8141) 0.00 0.00 0.00 0.00 0.00 0.00 0.00 0.00
Executive, Legislative, and Other General
Government Support (9211) 1.21 1.14 1.18 1.26 94.40 89.06 92.30 98.38
Justice, Public Order, and Safety Activities (9221) 1.72 1.61 1.36 2.57 134.20 125.94 106.55 200.71
Administration of Human Resource Programs (9231) 1.44 1.30 1.09 1.44 112.66 101.60 85.04 112.82
Administration of Environmental Quality Programs
(9241) 0.81 0.74 0.75 0.78 62.24 57.50 57.78 60.41
Administration of Housing Programs, Urban
Planning, and Community Development (9251) 1.21 1.14 1.18 1.26 94.40 89.06 92.30 98.38
Administration of Economic Program (9261) 0.63 0.62 0.75 0.85 48.36 47.87 58.25 64.68
Space Research and Technology (9271) (s) (s) (s) (s) (s) (s) (s) (s)

C‐35
Table C.1.4: Life Cycle Terajoules and Metric Tons of GHG per Job, Los Angeles County
Industry Title
& 4‐Digit Coding
NAICS 2007 Life cycle terajoules per
job 2008
Life cycle terajoules per
job 2009
Life cycle terajoules per
job 2010
Life cycle terajoules per
job 2011
Life cycle metric tons
of GHG per job 2008
Life cycle metric tons
of GHG per job 2009
Life cycle metric tons
of GHG per job 2010
Life cycle metric tons
of GHG per job 2011
National Security and International Affairs (9281) 0.07 0.07 0.06 0.07 4.90 4.96 4.39 5.03
Unclassified (9999) 0.76 0.76 0.76 0.75 55.01 55.24 55.18 54.23
TOTAL 1.66 1.36 1.54 1.67 134.88 109.08 124.27 135.05
Sources: California Employment Development Department Establishment Database for Los Angeles County; California Energy Commission, Energy Consumption Database and IMPLAN data for Los Angeles County; The U.S. Economic Input-Output Life Cycle Assessment (EIO-LCA) model developed by Green Design Institute, Carnegie Mellon University, which provides life cycle energy consumption and greenhouse gas emissions factors for each industry.

C‐36
C.2.1 Economic and Environmental Ranking Data, LA County
Summary of economic and environemtnal indicators data used to ranks industries in Los
Angeles County, by 4‐digit NAICS industry. Industries with five or fewer establishments are
suppressed as “(s)”; industires with anomalies in the U.S. EIO‐LCA model used to estimate life
cycle impacts are presented as “(r)”; industires with no employment are presented with “‐“.
Table C.2.1: Economic and Environmental Ranking Data, LA County
Industry Title
& 4‐Digit Coding
NAICS 2007 Employment 2011
Chan
ge in Employment
1996‐2011
Average Wage 2011
Direct terajoules per job
2011
Direct metric tons of
greenhouse gases per job
2011
Average gallons of gasoline
per job for public trips 2011
GHG2011 L
ife cycle metric
tons of co2‐equivalent
emissions in 2011
Oilseed and Grain Farming (1111) (s) (s) (s) (s) (s) (s) (s)
Vegetable and Melon Farming (1112) 392 ‐48% $26,393 0.09 7.70 0.00 27.85
Fruit and Tree Nut Farming (1113) 1,095 127% $24,953 0.53 42.88 0.00 141.75
Greenhouse, Nursery, and Floriculture
Production (1114) 2,501 ‐37% $27,081 0.08 3.60 0.00 13.60
Other Crop Farming (1119) 307 ‐32% $26,841 0.05 10.20 0.00 24.24
Cattle Ranching and Farming (1121) 106 117% $43,279 0.14 78.73 0.00 (r)
Poultry and Egg Production (1123) (s) (s) (s) (s) (s) (s) (s)
Sheep and Goat Farming (1124) (s) (s) (s) (s) (s) (s) (s)
Aquaculture (1125) (s) (s) (s) (s) (s) (s) (s)
Other Animal Production (1129) 96 4% $38,726 0.08 26.84 0.00 (r)
Forest Nurseries and Gathering of Forest
Products (1132) (s) (s) (s) (s) (s) (s) (s)
Logging (1133) (s) (s) (s) (s) (s) (s) (s)
Fishing (1141) 53 ‐83% $98,243 0.44 8.55 0.00 (r)
Hunting and Trapping (1142) (s) (s) (s) (s) (s) (s) (s)
Support Activities for Crop Production
(1151) 628 19% $33,728 0.01 0.09 0.00 10.53
Support Activities for Animal Production
(1152) 434 7% $25,992 0.01 0.07 0.00 18.79
Support Activities for Forestry (1153) (s) (s) (s) (s) (s) (s) (s)
Oil and Gas Extraction (2111) 2,167 ‐26% $223,146 1.02 128.02 0.00 153.41
Coal Mining (2121) (s) (s) (s) (s) (s) (s) (s)
Metal Ore Mining (2122) (s) (s) (s) (s) (s) (s) (s)
Nonmetallic Mineral Mining and Quarrying
(2123) 376 ‐25% $73,211 0.84 1.90 0.00 82.69
Support Activities for Mining (2131) 1,700 129% $88,622 0.58 0.02 0.00 147.80
Electric Power Generation, Transmission and
Distribution (2211) 16,560 8% $109,316 45.41 799.06 0.00 8507.50
Natural Gas Distribution (2212) 5,043 ‐3% $83,114 0.30 167.97 0.00 2352.64
Water, Sewage and Other Systems (2213) 7,641 ‐2% $80,467 0.39 66.51 0.00 291.97
Residential Building Construction (2361) 16,032 14% $46,134 0.15 0.03 0.00 45.30

C‐37
Table C.2.1: Economic and Environmental Ranking Data, LA County
Industry Title
& 4‐Digit Coding
NAICS 2007 Employment 2011
Chan
ge in Employment
1996‐2011
Average Wage 2011
Direct terajoules per job
2011
Direct metric tons of
greenhouse gases per job
2011
Average gallons of gasoline
per job for public trips 2011
GHG2011 L
ife cycle metric
tons of co2‐equivalent
emissions in 2011
Nonresidential Building Construction (2362) 10,447 ‐7% $69,698 0.09 0.02 0.00 17.37
Utility System Construction (2371) 5,757 43% $83,012 0.03 0.01 0.00 6.97
Land Subdivision (2372) 1,711 ‐8% $80,251 0.17 0.04 0.00 35.29
Highway, Street, and Bridge Construction
(2373) 4,543 8% $71,981 0.11 0.02 0.00 24.09
Other Heavy and Civil Engineering
Construction (2379) 1,188 ‐84% $77,175 0.08 0.02 0.00 16.23
Foundation, Structure, and Building Exterior
Contractors (2381) 132 ‐98% $46,205 10.01 2.28 0.00 1887.56
Building Equipment Contractors (2382) 365 ‐98% $53,755 9.86 2.25 0.00 1853.44
Building Finishing Contractors (2383) 239 ‐97% $38,418 8.75 1.99 0.00 1645.59
Other Specialty Trade Contractors (2389) 132 ‐97% $46,864 5.62 1.24 0.00 1196.47
Animal Food Manufacturing (3111) 946 ‐46% $73,229 0.21 5.46 0.00 390.86
Grain and Oilseed Milling (3112) 513 ‐54% $53,102 0.19 4.04 0.00 360.24
Sugar and Confectionery Product
Manufacturing (3113) 1,865 ‐9% $44,487 0.07 1.60 0.00 217.79
Fruit and Vegetable Preserving and Specialty
Food Manufacturing (3114) 4,104 ‐22% $46,878 0.10 2.64 0.00 211.30
Dairy Product Manufacturing (3115) 5,082 5% $75,916 0.05 1.19 0.00 128.01
Animal Slaughtering and Processing (3116) 4,928 ‐6% $35,126 0.01 0.30 0.00 58.84
Seafood Product Preparation and Packaging
(3117) 316 ‐80% $29,697 0.19 5.20 0.00 236.08
Bakeries and Tortilla Manufacturing (3118) 15,620 ‐17% $33,692 0.05 1.22 112.50 53.51
Other Food Manufacturing (3119) 6,167 90% $45,478 0.04 1.05 0.00 77.47
Beverage Manufacturing (3121) 5,012 34% $60,697 0.18 4.58 0.00 286.93
Tobacco Manufacturing (3122) (s) (s) (s) (s) (s) (s) (s)
Fiber, Yarn, and Thread Mills (3131) 243 ‐29% $27,827 0.00 0.05 0.00 2.25
Fabric Mills (3132) 1,484 ‐63% $35,636 0.12 3.47 0.00 51.82
Textile and Fabric Finishing and Fabric
Coating Mills (3133) 5,253 ‐28% $30,919 0.20 9.64 0.00 69.62
Textile Furnishings Mills (3141) 2,092 ‐64% $38,952 0.02 0.44 0.00 23.47
Other Textile Product Mills (3149) 1,874 ‐61% $34,474 0.07 0.95 0.00 38.94
Apparel Knitting Mills (3151) 480 ‐77% $31,527 0.01 0.03 0.00 53.60
Cut and Sew Apparel Manufacturing (3152) 45,300 ‐55% $32,727 0.01 0.02 0.00 21.13
Apparel Accessories and Other Apparel
Manufacturing (3159) 1,395 ‐65% $36,641 0.03 0.16 0.00 63.32
Leather and Hide Tanning and Finishing
(3161) 49 ‐88% $34,373 0.02 0.07 0.00 240.37
Footwear Manufacturing (3162) 671 ‐45% $28,426 0.01 0.03 0.00 43.53

C‐38
Table C.2.1: Economic and Environmental Ranking Data, LA County
Industry Title
& 4‐Digit Coding
NAICS 2007 Employment 2011
Chan
ge in Employment
1996‐2011
Average Wage 2011
Direct terajoules per job
2011
Direct metric tons of
greenhouse gases per job
2011
Average gallons of gasoline
per job for public trips 2011
GHG2011 L
ife cycle metric
tons of co2‐equivalent
emissions in 2011
Other Leather and Allied Product
Manufacturing (3169) 1,555 ‐34% $32,378 0.01 0.03 0.00 26.90
Sawmills and Wood Preservation (3211) 75 ‐43% $28,158 0.01 0.02 0.00 7.88
Veneer, Plywood, and Engineered Wood
Product Manufacturing (3212) 370 ‐48% $36,359 0.01 0.07 0.00 11.14
Other Wood Product Manufacturing (3219) 2,720 ‐30% $31,870 0.01 0.05 0.00 20.79
Pulp, Paper, and Paperboard Mills (3221) 270 ‐80% $41,316 0.24 2.38 0.00 47.63
Converted Paper Product Manufacturing
(3222) 7,002 ‐41% $53,821 0.05 1.19 0.00 32.30
Printing and Related Support Activities
(3231) 16,014 ‐49% $42,598 0.01 0.14 0.00 13.01
Petroleum and Coal Products Manufacturing
(3241) 4,102 ‐38% $109,659 64.38 5146.35 0.00 (r)
Basic Chemical Manufacturing (3251) 1,115 ‐44% $73,119 1.24 72.54 0.00 364.38
Resin, Synthetic Rubber, and Artificial
Synthetic Fibers and Filaments
Manufacturing (3252)
1,242 ‐31% $59,524 0.70 11.90 0.00 211.93
Pesticide, Fertilizer, and Other Agricultural
Chemical Manufacturing (3253) 199 ‐45% $64,522 0.07 10.24 0.00 34.68
Pharmaceutical and Medicine Manufacturing
(3254) 6,673 18% $58,238 0.10 0.77 0.00 65.20
Paint, Coating, and Adhesive Manufacturing
(3255) 1,801 ‐52% $62,508 0.12 2.93 0.00 132.02
Soap, Cleaning Compound, and Toilet
Preparation Manufacturing (3256) 6,598 ‐5% $51,458 0.24 3.79 0.00 145.44
Other Chemical Product and Preparation
Manufacturing (3259) 1,394 ‐51% $75,805 0.10 1.75 0.00 82.40
Plastics Product Manufacturing (3261) 11,902 ‐44% $41,783 0.03 0.19 0.00 36.57
Rubber Product Manufacturing (3262) 1,658 ‐47% $42,154 0.03 0.27 0.00 21.77
Clay Product and Refractory Manufacturing
(3271) 620 ‐69% $35,078 0.11 4.21 0.00 48.30
Glass and Glass Product Manufacturing
(3272) 2,004 ‐49% $39,852 0.08 2.34 0.00 63.31
Cement and Concrete Product
Manufacturing (3273) 1,650 ‐18% $48,228 0.03 1.06 0.00 243.72
Lime and Gypsum Product Manufacturing
(3274) 272 ‐71% $52,965 0.29 39.69 0.00 259.67
Other Nonmetallic Mineral Product
Manufacturing (3279) 696 ‐38% $40,487 0.04 1.55 0.00 116.43
Iron and Steel Mills and Ferroalloy
Manufacturing (3311) 765 34% $37,560 0.12 6.98 0.00 102.37
Steel Product Manufacturing from Purchased
Steel (3312) 1,190 ‐35% $58,270 0.03 0.26 0.00 164.45

C‐39
Table C.2.1: Economic and Environmental Ranking Data, LA County
Industry Title
& 4‐Digit Coding
NAICS 2007 Employment 2011
Chan
ge in Employment
1996‐2011
Average Wage 2011
Direct terajoules per job
2011
Direct metric tons of
greenhouse gases per job
2011
Average gallons of gasoline
per job for public trips 2011
GHG2011 L
ife cycle metric
tons of co2‐equivalent
emissions in 2011
Alumina and Aluminum Production and
Processing (3313) 767 ‐51% $53,238 0.07 3.17 0.00 77.86
Nonferrous Metal (except Aluminum)
Production and Processing (3314) 1,441 ‐34% $54,540 0.01 0.03 0.00 8.52
Foundries (3315) 3,019 ‐50% $52,348 0.01 0.08 0.00 15.50
Forging and Stamping (3321) 3,297 ‐11% $54,890 0.06 1.21 0.00 46.87
Cutlery and Handtool Manufacturing (3322) 1,101 ‐30% $40,522 0.02 0.26 0.00 24.35
Architectural and Structural Metals
Manufacturing (3323) 6,794 ‐23% $42,902 0.02 0.28 0.00 39.67
Boiler, Tank, and Shipping Container
Manufacturing (3324) 1,388 ‐50% $66,742 0.11 1.64 0.00 159.96
Hardware Manufacturing (3325) 975 ‐65% $46,373 0.01 0.18 0.00 18.56
Spring and Wire Product Manufacturing
(3326) 948 ‐43% $39,167 0.01 0.09 0.00 6.90
Machine Shops; Turned Product; and Screw,
Nut, and Bolt Manufacturing (3327) 13,708 ‐17% $52,942 0.02 0.24 0.00 23.21
Coating, Engraving, Heat Treating, and
Allied Activities (3328) 6,653 ‐37% $40,492 0.09 1.60 0.00 45.35
Other Fabricated Metal Product
Manufacturing (3329) 7,036 ‐33% $58,138 0.07 0.85 0.00 71.62
Agriculture, Construction, and Mining
Machinery Manufacturing (3331) 722 ‐3% $61,696 0.01 0.10 0.00 19.50
Industrial Machinery Manufacturing (3332) 1,985 ‐26% $55,573 0.01 0.05 0.00 12.44
Commercial and Service Industry Machinery
Manufacturing (3333) 3,240 ‐44% $77,258 0.02 0.10 0.00 31.65
Ventilation, Heating, Air‐Conditioning, and
Commercial Refrigeration Equipment
Manufacturing (3334)
893 ‐52% $49,815 0.01 0.06 0.00 13.88
Metalworking Machinery Manufacturing
(3335) 3,287 ‐48% $44,792 0.01 0.04 0.00 8.64
Engine, Turbine, and Power Transmission
Equipment Manufacturing (3336) 891 ‐29% $80,991 0.03 0.16 0.00 50.70
Other General Purpose Machinery
Manufacturing (3339) 4,923 ‐39% $61,321 0.02 0.14 0.00 26.03
Computer and Peripheral Equipment
Manufacturing (3341) 1,332 ‐69% $92,579 0.01 0.06 0.00 17.75
Communications Equipment Manufacturing
(3342) 3,406 ‐29% $87,459 0.01 0.03 0.00 15.09
Audio and Video Equipment Manufacturing
(3343) 853 ‐79% $90,517 0.03 0.10 0.00 100.42
Semiconductor and Other Electronic
Component Manufacturing (3344) 9,310 ‐33% $59,434 0.03 1.35 0.00 18.64

C‐40
Table C.2.1: Economic and Environmental Ranking Data, LA County
Industry Title
& 4‐Digit Coding
NAICS 2007 Employment 2011
Chan
ge in Employment
1996‐2011
Average Wage 2011
Direct terajoules per job
2011
Direct metric tons of
greenhouse gases per job
2011
Average gallons of gasoline
per job for public trips 2011
GHG2011 L
ife cycle metric
tons of co2‐equivalent
emissions in 2011
Navigational, Measuring, Electromedical,
and Control Instruments Manufacturing
(3345)
28,941 ‐39% $103,797 0.01 0.07 0.00 26.07
Manufacturing and Reproducing Magnetic
and Optical Media (3346) 1,247 ‐53% $60,895 0.05 0.23 0.00 67.57
Electric Lighting Equipment Manufacturing
(3351) 2,505 ‐57% $47,820 0.01 0.07 0.00 19.18
Household Appliance Manufacturing (3352) 808 ‐14% $40,746 0.00 0.03 0.00 10.95
Electrical Equipment Manufacturing (3353) 2,219 ‐29% $48,444 0.01 0.06 0.00 16.05
Other Electrical Equipment and Component
Manufacturing (3359) 3,875 ‐8% $70,508 0.03 0.21 0.00 32.46
Motor Vehicle Manufacturing (3361) 660 ‐44% $74,881 0.05 0.66 0.00 95.81
Motor Vehicle Body and Trailer
Manufacturing (3362) 1,497 ‐35% $42,877 0.02 0.22 0.00 27.95
Motor Vehicle Parts Manufacturing (3363) 4,376 ‐65% $47,028 0.01 0.13 0.00 14.66
Aerospace Product and Parts Manufacturing
(3364) 39,324 ‐38% $95,609 0.02 0.23 0.00 16.39
Railroad Rolling Stock Manufacturing (3365) 89 282% $33,652 0.00 0.05 0.00 3.64
Ship and Boat Building (3366) 155 ‐75% $45,021 0.01 0.18 0.00 17.81
Other Transportation Equipment
Manufacturing (3369) 319 ‐65% $48,262 0.03 0.35 0.00 45.87
Household and Institutional Furniture and
Kitchen Cabinet Manufacturing (3371) 8,707 ‐49% $32,872 0.01 0.04 0.00 12.13
Office Furniture (including Fixtures)
Manufacturing (3372) 2,780 ‐58% $45,830 0.02 0.12 0.00 21.60
Other Furniture Related Product
Manufacturing (3379) 1,669 ‐44% $34,433 0.00 0.01 0.00 5.17
Medical Equipment and Supplies
Manufacturing (3391) 8,143 1% $61,874 0.02 0.43 0.00 17.93
Other Miscellaneous Manufacturing (3399) 10,032 ‐46% $56,521 0.02 0.68 0.00 26.69
Motor Vehicle and Motor Vehicle Parts and
Supplies Merchant Wholesalers (4231) 10,483 ‐21% $51,640 0.01 0.02 0.00 6.26
Furniture and Home Furnishing Merchant
Wholesalers (4232) 7,527 ‐7% $48,550 0.01 0.02 0.00 6.54
Lumber and Other Construction Materials
Merchant Wholesalers (4233) 4,633 ‐7% $47,365 0.01 0.03 0.00 8.30
Professional and Commercial Equipment and
Supplies Merchant Wholesalers (4234) 15,580 ‐26% $68,504 0.01 0.03 0.00 7.73
Metal and Mineral (except Petroleum)
Merchant Wholesalers (4235) 4,594 ‐17% $65,089 0.00 0.01 0.00 3.76
Electrical and Electronic Goods Merchant
Wholesalers (4236) 12,606 ‐23% $72,049 0.01 0.04 0.00 10.04
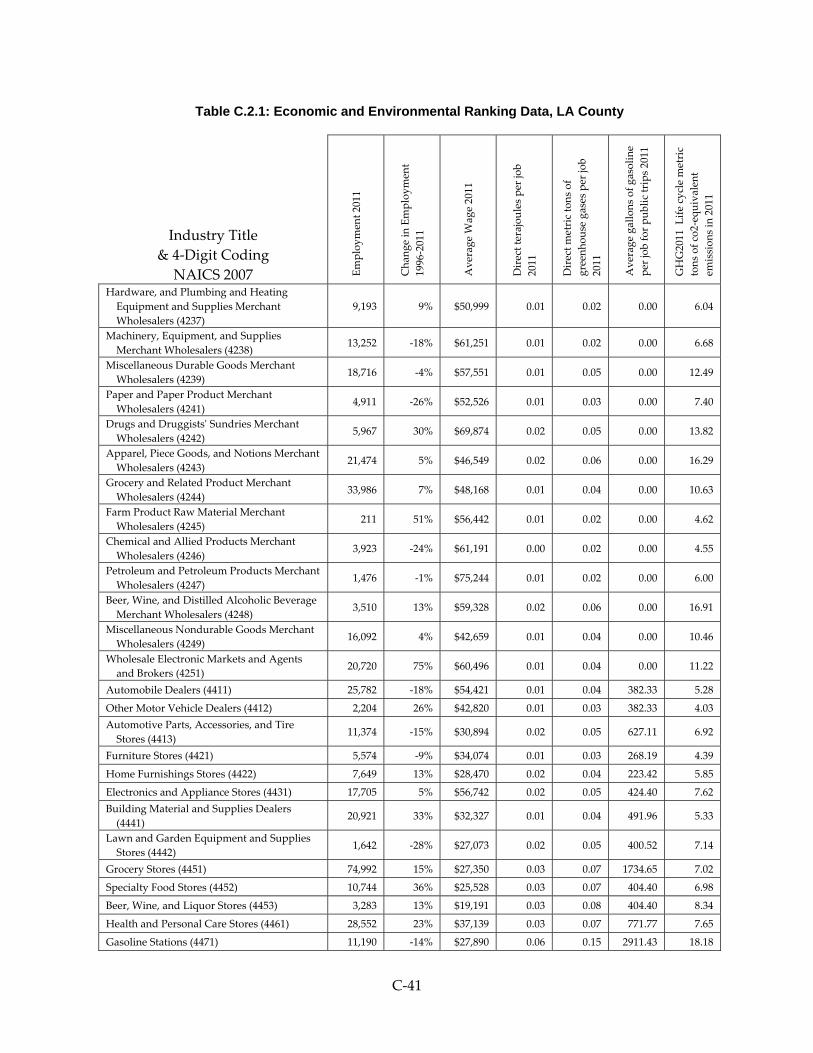
C‐41
Table C.2.1: Economic and Environmental Ranking Data, LA County
Industry Title
& 4‐Digit Coding
NAICS 2007 Employment 2011
Chan
ge in Employment
1996‐2011
Average Wage 2011
Direct terajoules per job
2011
Direct metric tons of
greenhouse gases per job
2011
Average gallons of gasoline
per job for public trips 2011
GHG2011 L
ife cycle metric
tons of co2‐equivalent
emissions in 2011
Hardware, and Plumbing and Heating
Equipment and Supplies Merchant
Wholesalers (4237)
9,193 9% $50,999 0.01 0.02 0.00 6.04
Machinery, Equipment, and Supplies
Merchant Wholesalers (4238) 13,252 ‐18% $61,251 0.01 0.02 0.00 6.68
Miscellaneous Durable Goods Merchant
Wholesalers (4239) 18,716 ‐4% $57,551 0.01 0.05 0.00 12.49
Paper and Paper Product Merchant
Wholesalers (4241) 4,911 ‐26% $52,526 0.01 0.03 0.00 7.40
Drugs and Druggistsʹ Sundries Merchant
Wholesalers (4242) 5,967 30% $69,874 0.02 0.05 0.00 13.82
Apparel, Piece Goods, and Notions Merchant
Wholesalers (4243) 21,474 5% $46,549 0.02 0.06 0.00 16.29
Grocery and Related Product Merchant
Wholesalers (4244) 33,986 7% $48,168 0.01 0.04 0.00 10.63
Farm Product Raw Material Merchant
Wholesalers (4245) 211 51% $56,442 0.01 0.02 0.00 4.62
Chemical and Allied Products Merchant
Wholesalers (4246) 3,923 ‐24% $61,191 0.00 0.02 0.00 4.55
Petroleum and Petroleum Products Merchant
Wholesalers (4247) 1,476 ‐1% $75,244 0.01 0.02 0.00 6.00
Beer, Wine, and Distilled Alcoholic Beverage
Merchant Wholesalers (4248) 3,510 13% $59,328 0.02 0.06 0.00 16.91
Miscellaneous Nondurable Goods Merchant
Wholesalers (4249) 16,092 4% $42,659 0.01 0.04 0.00 10.46
Wholesale Electronic Markets and Agents
and Brokers (4251) 20,720 75% $60,496 0.01 0.04 0.00 11.22
Automobile Dealers (4411) 25,782 ‐18% $54,421 0.01 0.04 382.33 5.28
Other Motor Vehicle Dealers (4412) 2,204 26% $42,820 0.01 0.03 382.33 4.03
Automotive Parts, Accessories, and Tire
Stores (4413) 11,374 ‐15% $30,894 0.02 0.05 627.11 6.92
Furniture Stores (4421) 5,574 ‐9% $34,074 0.01 0.03 268.19 4.39
Home Furnishings Stores (4422) 7,649 13% $28,470 0.02 0.04 223.42 5.85
Electronics and Appliance Stores (4431) 17,705 5% $56,742 0.02 0.05 424.40 7.62
Building Material and Supplies Dealers
(4441) 20,921 33% $32,327 0.01 0.04 491.96 5.33
Lawn and Garden Equipment and Supplies
Stores (4442) 1,642 ‐28% $27,073 0.02 0.05 400.52 7.14
Grocery Stores (4451) 74,992 15% $27,350 0.03 0.07 1734.65 7.02
Specialty Food Stores (4452) 10,744 36% $25,528 0.03 0.07 404.40 6.98
Beer, Wine, and Liquor Stores (4453) 3,283 13% $19,191 0.03 0.08 404.40 8.34
Health and Personal Care Stores (4461) 28,552 23% $37,139 0.03 0.07 771.77 7.65
Gasoline Stations (4471) 11,190 ‐14% $27,890 0.06 0.15 2911.43 18.18

C‐42
Table C.2.1: Economic and Environmental Ranking Data, LA County
Industry Title
& 4‐Digit Coding
NAICS 2007 Employment 2011
Chan
ge in Employment
1996‐2011
Average Wage 2011
Direct terajoules per job
2011
Direct metric tons of
greenhouse gases per job
2011
Average gallons of gasoline
per job for public trips 2011
GHG2011 L
ife cycle metric
tons of co2‐equivalent
emissions in 2011
Clothing Stores (4481) 42,396 67% $20,542 0.01 0.04 405.76 5.12
Shoe Stores (4482) 7,427 23% $23,132 0.01 0.03 405.76 4.51
Jewelry, Luggage, and Leather Goods Stores
(4483) 4,607 ‐9% $37,747 0.02 0.04 405.76 5.76
Sporting Goods, Hobby, and Musical
Instrument Stores (4511) 14,150 23% $22,469 0.01 0.02 415.59 3.14
Book, Periodical, and Music Stores (4512) 3,575 ‐56% $18,297 0.01 0.03 1783.29 3.65
Department Stores (4521) 36,959 ‐18% $21,042 0.01 0.03 500.98 4.07
Other General Merchandise Stores (4529) 31,050 110% $24,708 0.01 0.03 688.56 4.07
Florists (4531) 1,241 ‐55% $22,805 0.01 0.04 346.63 5.55
Office Supplies, Stationery, and Gift Stores
(4532) 12,197 ‐10% $32,191 0.02 0.04 328.06 6.22
Used Merchandise Stores (4533) 3,860 38% $21,313 0.01 0.04 346.63 5.49
Other Miscellaneous Store Retailers (4539) 8,175 27% $30,561 0.01 0.04 354.41 5.53
Electronic Shopping and Mail‐Order Houses
(4541) 6,744 28% $59,063 0.03 0.07 0.00 9.83
Vending Machine Operators (4542) 458 ‐37% $42,263 0.02 0.05 0.00 6.77
Direct Selling Establishments (4543) 2,329 ‐27% $34,970 0.03 0.08 302.13 11.98
Scheduled Air Transportation (4811) 16,480 ‐43% $61,032 5.53 1278.59 243.32 (r)
Nonscheduled Air Transportation (4812) 1,553 6% $85,679 4.69 1084.36 241.30 (r)
Rail Transportation (4821) (s) (s) (s) (s) (s) (s) (s)
Deep Sea, Coastal, and Great Lakes Water
Transportation (4831) 2,756 64% $65,682 0.09 19.99 56.36 309.20
Inland Water Transportation (4832) 252 33% $57,683 0.26 60.49 41.55 935.44
General Freight Trucking (4841) 18,277 ‐13% $42,233 0.26 59.38 0.00 (r)
Specialized Freight Trucking (4842) 7,262 40% $41,276 0.40 91.54 0.00 (r)
Urban Transit Systems (4851) 9,452 35% $50,941 0.37 66.76 70.35 117.83
Interurban and Rural Bus Transportation
(4852) 506 ‐48% $44,672 0.53 95.05 70.35 167.76
Taxi and Limousine Service (4853) 2,258 72% $31,254 0.33 59.66 0.00 105.30
School and Employee Bus Transportation
(4854) 3,441 ‐21% $27,401 0.18 32.86 0.00 57.99
Charter Bus Industry (4855) 692 ‐37% $34,085 0.22 38.39 70.35 67.75
Other Transit and Ground Passenger
Transportation (4859) 4,539 283% $30,124 0.23 40.44 0.00 71.38
Pipeline Transportation of Crude Oil (4861) 123 ‐61% $119,596 0.24 11.89 0.00 321.88
Pipeline Transportation of Natural Gas (4862) 154 ‐40% $101,868 1.88 93.46 0.00 2529.83
Other Pipeline Transportation (4869) 331 63% $94,842 0.48 23.63 0.00 639.65
Scenic and Sightseeing Transportation, Land
(4871) 895 73% $33,941 0.03 3.35 70.35 9.24

C‐43
Table C.2.1: Economic and Environmental Ranking Data, LA County
Industry Title
& 4‐Digit Coding
NAICS 2007 Employment 2011
Chan
ge in Employment
1996‐2011
Average Wage 2011
Direct terajoules per job
2011
Direct metric tons of
greenhouse gases per job
2011
Average gallons of gasoline
per job for public trips 2011
GHG2011 L
ife cycle metric
tons of co2‐equivalent
emissions in 2011
Scenic and Sightseeing Transportation, Water
(4872) 213 ‐32% $22,464 0.00 0.03 70.35 3.41
Scenic and Sightseeing Transportation, Other
(4879) (s) (s) (s) (s) (s) (s) (s)
Support Activities for Air Transportation
(4881) 11,559 52% $45,506 0.01 1.23 10.21 17.15
Support Activities for Rail Transportation
(4882) 561 161% $43,386 0.03 3.77 0.00 3.90
Support Activities for Water Transportation
(4883) 8,425 19% $81,301 0.01 1.57 0.00 1.65
Support Activities for Road Transportation
(4884) 3,613 13% $34,230 0.04 4.93 0.00 5.11
Freight Transportation Arrangement (4885) 15,175 28% $53,262 0.03 3.27 0.00 3.39
Other Support Activities for Transportation
(4889) 2,636 144% $68,705 0.07 8.50 0.00 8.81
Postal Service (4911) 18,873 ‐30% $60,054 0.01 0.86 439.02 5.03
Couriers and Express Delivery Services
(4921) 15,588 ‐14% $47,212 0.50 113.13 420.70 (r)
Local Messengers and Local Delivery (4922) 2,902 ‐41% $25,930 0.45 103.34 420.70 (r)
Warehousing and Storage (4931) 16,180 15% $47,130 0.01 0.48 0.00 5.78
Newspaper, Periodical, Book, and Directory
Publishers (5111) 8,855 ‐57% $73,616 0.01 0.00 0.00 24.52
Software Publishers (5112) 5,148 6% $141,587 0.00 0.00 0.00 13.38
Motion Picture and Video Industries (5121) 118,731 ‐10% $95,157 0.00 0.00 52.53 8.46
Sound Recording Industries (5122) 3,066 ‐14% $101,075 0.02 0.00 0.00 62.73
Radio and Television Broadcasting (5151) 14,281 14% $114,942 0.11 0.15 0.00 139.87
Cable and Other Subscription Programming
(5152) 4,098 ‐16% $105,087 0.02 0.03 0.00 38.44
Wired Telecommunications Carriers (5171) 13,712 260% $87,606 0.05 0.06 0.00 16.69
Wireless Telecommunications Carriers
(except Satellite) (5172) 4,371 11% $63,021 0.03 0.05 0.00 12.32
Satellite Telecommunications (5174) 1,313 ‐52% $74,652 0.01 0.02 0.00 5.23
Other Telecommunications (5179) 6,837 ‐60% $86,812 0.07 0.09 0.00 24.30
Data Processing, Hosting, and Related
Services (5182) 4,556 ‐19% $79,507 0.00 0.00 0.00 13.06
Other Information Services (5191) 12,287 106% $79,378 0.01 0.01 286.01 14.70
Monetary Authorities‐Central Bank (5211) 506 ‐30% $113,332 0.01 0.06 0.00 16.30
Depository Credit Intermediation (5221) 48,119 ‐28% $65,480 0.01 0.03 1268.28 8.57
Nondepository Credit Intermediation (5222) 14,100 1% $70,150 0.00 0.01 316.49 2.64
Activities Related to Credit Intermediation
(5223) 10,448 52% $64,330 0.00 0.01 16.99 2.66
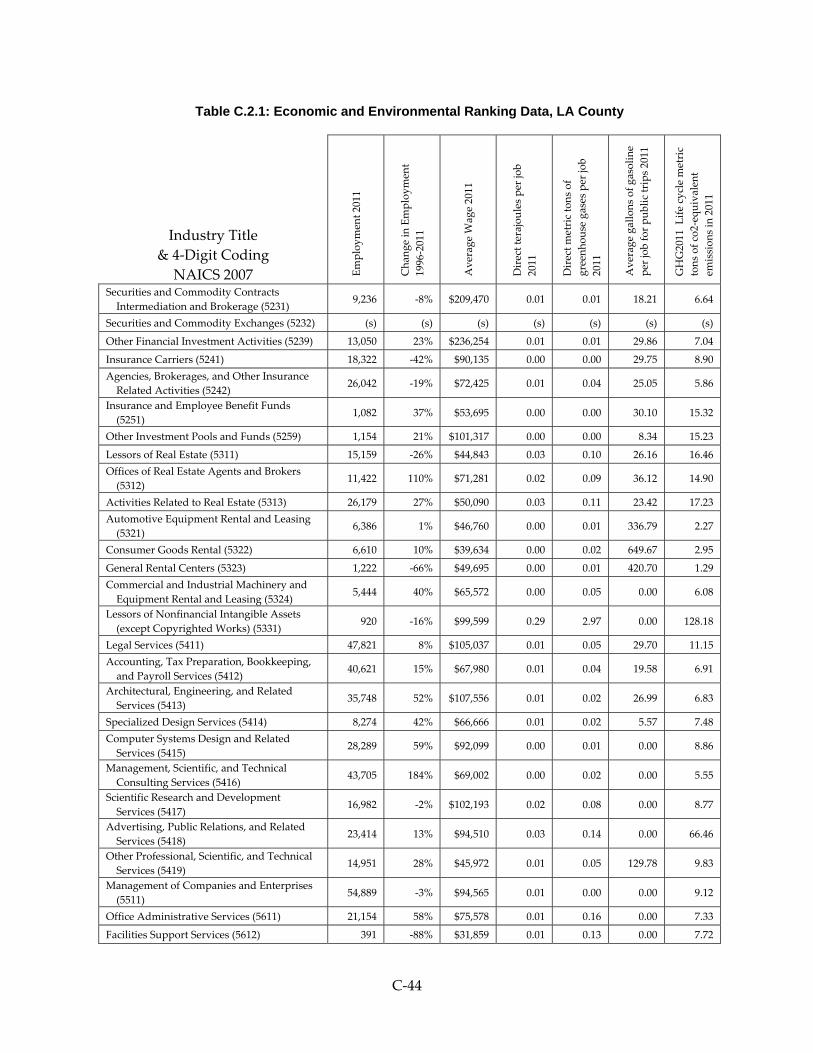
C‐44
Table C.2.1: Economic and Environmental Ranking Data, LA County
Industry Title
& 4‐Digit Coding
NAICS 2007 Employment 2011
Chan
ge in Employment
1996‐2011
Average Wage 2011
Direct terajoules per job
2011
Direct metric tons of
greenhouse gases per job
2011
Average gallons of gasoline
per job for public trips 2011
GHG2011 L
ife cycle metric
tons of co2‐equivalent
emissions in 2011
Securities and Commodity Contracts
Intermediation and Brokerage (5231) 9,236 ‐8% $209,470 0.01 0.01 18.21 6.64
Securities and Commodity Exchanges (5232) (s) (s) (s) (s) (s) (s) (s)
Other Financial Investment Activities (5239) 13,050 23% $236,254 0.01 0.01 29.86 7.04
Insurance Carriers (5241) 18,322 ‐42% $90,135 0.00 0.00 29.75 8.90
Agencies, Brokerages, and Other Insurance
Related Activities (5242) 26,042 ‐19% $72,425 0.01 0.04 25.05 5.86
Insurance and Employee Benefit Funds
(5251) 1,082 37% $53,695 0.00 0.00 30.10 15.32
Other Investment Pools and Funds (5259) 1,154 21% $101,317 0.00 0.00 8.34 15.23
Lessors of Real Estate (5311) 15,159 ‐26% $44,843 0.03 0.10 26.16 16.46
Offices of Real Estate Agents and Brokers
(5312) 11,422 110% $71,281 0.02 0.09 36.12 14.90
Activities Related to Real Estate (5313) 26,179 27% $50,090 0.03 0.11 23.42 17.23
Automotive Equipment Rental and Leasing
(5321) 6,386 1% $46,760 0.00 0.01 336.79 2.27
Consumer Goods Rental (5322) 6,610 10% $39,634 0.00 0.02 649.67 2.95
General Rental Centers (5323) 1,222 ‐66% $49,695 0.00 0.01 420.70 1.29
Commercial and Industrial Machinery and
Equipment Rental and Leasing (5324) 5,444 40% $65,572 0.00 0.05 0.00 6.08
Lessors of Nonfinancial Intangible Assets
(except Copyrighted Works) (5331) 920 ‐16% $99,599 0.29 2.97 0.00 128.18
Legal Services (5411) 47,821 8% $105,037 0.01 0.05 29.70 11.15
Accounting, Tax Preparation, Bookkeeping,
and Payroll Services (5412) 40,621 15% $67,980 0.01 0.04 19.58 6.91
Architectural, Engineering, and Related
Services (5413) 35,748 52% $107,556 0.01 0.02 26.99 6.83
Specialized Design Services (5414) 8,274 42% $66,666 0.01 0.02 5.57 7.48
Computer Systems Design and Related
Services (5415) 28,289 59% $92,099 0.00 0.01 0.00 8.86
Management, Scientific, and Technical
Consulting Services (5416) 43,705 184% $69,002 0.00 0.02 0.00 5.55
Scientific Research and Development
Services (5417) 16,982 ‐2% $102,193 0.02 0.08 0.00 8.77
Advertising, Public Relations, and Related
Services (5418) 23,414 13% $94,510 0.03 0.14 0.00 66.46
Other Professional, Scientific, and Technical
Services (5419) 14,951 28% $45,972 0.01 0.05 129.78 9.83
Management of Companies and Enterprises
(5511) 54,889 ‐3% $94,565 0.01 0.00 0.00 9.12
Office Administrative Services (5611) 21,154 58% $75,578 0.01 0.16 0.00 7.33
Facilities Support Services (5612) 391 ‐88% $31,859 0.01 0.13 0.00 7.72

C‐45
Table C.2.1: Economic and Environmental Ranking Data, LA County
Industry Title
& 4‐Digit Coding
NAICS 2007 Employment 2011
Chan
ge in Employment
1996‐2011
Average Wage 2011
Direct terajoules per job
2011
Direct metric tons of
greenhouse gases per job
2011
Average gallons of gasoline
per job for public trips 2011
GHG2011 L
ife cycle metric
tons of co2‐equivalent
emissions in 2011
Employment Services (5613) 89,407 ‐12% $27,183 0.00 0.01 26.04 0.78
Business Support Services (5614) 15,258 ‐48% $37,619 0.00 0.06 260.74 4.85
Travel Arrangement and Reservation
Services (5615) 8,046 ‐30% $49,583 0.04 1.37 30.10 14.57
Investigation and Security Services (5616) 49,176 36% $24,389 0.00 0.03 25.39 2.41
Services to Buildings and Dwellings (5617) 40,273 15% $26,356 0.01 0.06 7.75 7.68
Other Support Services (5619) 7,107 51% $39,789 0.01 0.21 0.00 8.34
Waste Collection (5621) 4,244 117% $55,572 0.00 6.09 0.00 69.33
Waste Treatment and Disposal (5622) 2,845 ‐42% $59,224 0.01 8.79 166.39 100.14
Remediation and Other Waste Management
Services (5629) 2,051 109% $45,753 0.01 17.72 0.00 201.86
Elementary and Secondary Schools (6111) 214,485 ‐39% $47,226 0.01 0.20 151.24 7.37
Junior Colleges (6112) 25,464 ‐33% $50,890 0.03 0.52 156.07 19.21
Colleges, Universities, and Professional
Schools (6113) 82,332 17% $62,803 0.08 1.45 90.00 53.69
Business Schools and Computer and
Management Training (6114) 1,743 ‐10% $42,725 0.00 0.02 202.95 3.45
Technical and Trade Schools (6115) 6,477 199% $44,135 0.00 0.04 202.95 4.57
Other Schools and Instruction (6116) 15,643 108% $24,333 0.00 0.02 219.79 2.88
Educational Support Services (6117) 5,488 450% $34,148 0.00 0.02 30.10 2.59
Offices of Physicians (6211) 77,670 28% $74,721 0.00 0.11 237.12 5.83
Offices of Dentists (6212) 27,960 31% $40,371 0.00 0.09 237.12 4.68
Offices of Other Health Practitioners (6213) 16,293 49% $35,471 0.00 0.10 284.54 5.42
Outpatient Care Centers (6214) 21,940 131% $56,530 0.02 0.52 281.98 13.27
Medical and Diagnostic Laboratories (6215) 9,286 76% $52,479 0.02 0.52 237.12 13.30
Home Health Care Services (6216) 21,739 69% $28,329 0.00 0.08 0.00 4.78
Other Ambulatory Health Care Services
(6219) 7,056 45% $38,618 0.01 0.34 12.71 8.58
General Medical and Surgical Hospitals
(6221) 139,782 7% $68,328 0.03 0.22 126.54 21.71
Psychiatric and Substance Abuse Hospitals
(6222) 5,947 ‐27% $48,810 0.02 0.10 126.54 9.70
Specialty (except Psychiatric and Substance
Abuse) Hospitals (6223) 2,487 125% $51,025 0.01 0.06 126.54 6.33
Nursing Care Facilities (6231) 39,323 16% $30,464 0.02 0.76 118.46 5.80
Residential Mental Retardation, Mental
Health and Substance Abuse Facilities
(6232)
13,898 141% $32,421 0.03 0.93 118.46 7.06
Community Care Facilities for the Elderly
(6233) 12,985 40% $25,264 0.02 0.80 71.08 6.05
Other Residential Care Facilities (6239) 4,444 50% $31,947 0.02 0.57 71.08 4.35

C‐46
Table C.2.1: Economic and Environmental Ranking Data, LA County
Industry Title
& 4‐Digit Coding
NAICS 2007 Employment 2011
Chan
ge in Employment
1996‐2011
Average Wage 2011
Direct terajoules per job
2011
Direct metric tons of
greenhouse gases per job
2011
Average gallons of gasoline
per job for public trips 2011
GHG2011 L
ife cycle metric
tons of co2‐equivalent
emissions in 2011
Individual and Family Services (6241) 40,330 72% $36,608 0.01 0.35 46.76 5.59
Community Food and Housing, and
Emergency and Other Relief Services
(6242)
4,178 99% $36,260 0.01 0.36 56.06 5.75
Vocational Rehabilitation Services (6243) 7,422 ‐25% $25,692 0.01 0.32 46.76 5.08
Child Day Care Services (6244) 16,708 29% $24,700 0.00 0.07 268.91 3.35
Performing Arts Companies (7111) 5,144 56% $125,220 0.00 0.03 129.18 6.79
Spectator Sports (7112) 5,083 4% $106,154 0.00 0.01 129.18 3.31
Promoters of Performing Arts, Sports, and
Similar Events (7113) 2,113 77% $51,443 0.01 0.04 77.29 11.79
Agents and Managers for Artists, Athletes,
Entertainers, and Other Public Figures
(7114)
6,900 36% $131,266 0.00 0.02 0.00 5.77
Independent Artists, Writers, and Performers
(7115) 10,250 66% $350,545 0.00 0.03 0.00 12.56
Museums, Historical Sites, and Similar
Institutions (7121) 4,692 41% $44,641 0.08 0.69 104.76 68.80
Amusement Parks and Arcades (7131) 4,010 20% $40,845 0.00 0.01 226.03 0.71
Gambling Industries (7132) 7,526 59% $27,637 0.00 0.00 687.87 0.35
Other Amusement and Recreation Industries
(7139) 33,033 9% $22,727 0.01 0.11 319.99 11.42
Traveler Accommodation (7211) 40,009 0% $30,143 0.06 1.68 261.31 13.83
RV (Recreational Vehicle) Parks and
Recreational Camps (7212) 435 52% $25,916 0.01 0.31 231.68 6.89
Rooming and Boarding Houses (7213) 364 7% $28,855 0.03 1.23 0.00 8.10
Full‐Service Restaurants (7221) 5,159 ‐95% ‐ 0.03 0.71 425.42 8.56
Limited‐Service Eating Places (7222) 3,835 ‐89% ‐ 0.03 0.96 2832.90 11.62
Special Food Services (7223) 17,255 162% $24,559 0.04 1.20 485.56 14.49
Drinking Places (Alcoholic Beverages) (7224) 6,409 ‐4% $16,077 0.04 1.06 502.07 12.78
Other Eating and Drinking Places (7225) 270,353 293% $17,530 0.03 0.78 1599.42 9.41
Automotive Repair and Maintenance (8111) 28,319 ‐3% $29,878 0.01 0.40 471.15 9.06
Electronic and Precision Equipment Repair
and Maintenance (8112) 1,932 ‐39% $41,538 0.01 0.31 288.86 11.01
Commercial and Industrial Machinery and
Equipment (except Automotive and
Electronic) Repair and Maintenance (8113)
4,363 ‐16% $54,340 0.00 0.31 0.00 9.34
Personal and Household Goods Repair and
Maintenance (8114) 2,182 ‐18% $32,730 0.01 0.70 288.86 23.99
Personal Care Services (8121) 16,223 42% $21,399 0.00 0.13 260.47 6.07
Death Care Services (8122) 3,156 ‐1% $49,169 0.02 1.36 492.75 22.95
Drycleaning and Laundry Services (8123) 11,215 ‐14% $26,486 0.01 0.41 194.35 6.30

C‐47
Table C.2.1: Economic and Environmental Ranking Data, LA County
Industry Title
& 4‐Digit Coding
NAICS 2007 Employment 2011
Chan
ge in Employment
1996‐2011
Average Wage 2011
Direct terajoules per job
2011
Direct metric tons of
greenhouse gases per job
2011
Average gallons of gasoline
per job for public trips 2011
GHG2011 L
ife cycle metric
tons of co2‐equivalent
emissions in 2011
Other Personal Services (8129) 16,744 26% $26,399 0.01 0.55 71.00 14.13
Religious Organizations (8131) 6,581 ‐68% $28,012 0.01 0.47 169.60 13.46
Grantmaking and Giving Services (8132) 19,973 20% $51,082 0.02 1.23 23.47 20.57
Social Advocacy Organizations (8133) 4,748 160% $41,776 0.01 0.74 30.10 12.37
Civic and Social Organizations (8134) 9,817 14% $22,255 0.03 1.88 605.87 15.92
Business, Professional, Labor, Political, and
Similar Organizations (8139) 10,610 17% $60,953 0.04 2.61 489.58 22.15
Private Households (8141) 120,255 449% $13,470 0.00 0.00 0.00 0.00
Executive, Legislative, and Other General
Government Support (9211) 43,271 ‐54% $61,652 0.13 7.40 162.28 48.57
Justice, Public Order, and Safety Activities
(9221) 73,102 32% $84,945 0.23 13.34 181.86 157.13
Administration of Human Resource
Programs (9231) 14,412 19% $71,848 0.22 13.10 188.74 86.35
Administration of Environmental Quality
Programs (9241) 2,536 ‐15% $64,245 0.00 0.18 115.90 1.35
Administration of Housing Programs, Urban
Planning, and Community Development
(9251)
2,923 ‐29% $70,252 0.18 10.41 124.52 68.35
Administration of Economic Program (9261) 11,509 36% $73,541 0.14 8.14 104.02 56.49
Space Research and Technology (9271) (s) (s) (s) (s) (s) (s) (s)
National Security and International Affairs
(9281) 3,472 9% $85,144 0.03 1.58 32.26 (r)
Unclassified (9999) 88,355 174% $53,518 0.03 1.42 48.70 5.61
Sources: California Employment Development Department Establishment Database for Los Angeles County; California Energy Commission, Energy Consumption Database; IMPLAN economic simulation software and data for Los Angeles County; United States Environmental Protection Agency eGRID2012 Version 1.0 for electricity emissions and Greenhouse Gas Equivalencies Calculator for natural gas emissions; California MRIO-LCA model; The U.S. Economic Input-Output Life Cycle Assessment (EIO-LCA) model developed by Green Design Institute, Carnegie Mellon University; and Economic Roundtable model for estimating GHG emissions from vehicle operations for customer trips. See Appendix A.5.

C‐48
C.2.2 Economic and Environmental Ranking Data, City of LA
Summary of economic and environemtnal indicators data used to ranks industries in the City of
Los Angeles, by 4‐digit NAICS industry. Industries with five or fewer establishments are
suppressed as “(s)”; industires with anomalies in the U.S. EIO‐LCA model used to estimate life
cycle impacts are presented as “(r)”; industires with no employment are presented with “‐“.
Table C.2.2: Economic and Environmental Ranking Data, City of LA
Industry Title
& 4‐Digit Coding
NAICS 2007 Employment 2011
Chan
ge in Employment
1996‐2011
Average Wage 2011
Direct terajoules per job
2011
Direct metric tons of
greenhouse gases per job
2011
Average gallons of gasoline
per job for public trips 2011
GHG2011 L
ife cycle metric
tons of co2‐equivalent
emissions in 2011
Oilseed and Grain Farming (1111) (s) (s) (s) (s) (s) (s) (s)
Vegetable and Melon Farming (1112) 54 ‐78% $22,375 0.65 56.38 0.00 203.90
Fruit and Tree Nut Farming (1113) 979 215% $24,756 0.59 47.96 0.00 158.54
Greenhouse, Nursery, and Floriculture
Production (1114) 303 ‐20% $30,542 0.66 29.66 0.00 112.09
Other Crop Farming (1119) 36 ‐50% $29,755 0.39 87.02 0.00 206.89
Cattle Ranching and Farming (1121) 53 362% $59,006 0.28 158.58 0.00 (r)
Poultry and Egg Production (1123) (s) (s) (s) (s) (s) (s) (s)
Sheep and Goat Farming (1124) (s) (s) (s) (s) (s) (s) (s)
Aquaculture (1125) (s) (s) (s) (s) (s) (s) (s)
Other Animal Production (1129) 43 139% $49,675 0.17 60.18 0.00 (r)
Forest Nurseries and Gathering of Forest
Products (1132) (s) (s) (s) (s) (s) (s) (s)
Logging (1133) (s) (s) $15,207 0.00 0.00 0.00 0.00
Fishing (1141) 35 ‐86% $135,820 0.65 12.83 0.00 (r)
Hunting and Trapping (1142) (s) (s) (s) (s) (s) (s) (s)
Support Activities for Crop Production (1151) 89 ‐69% $34,125 0.04 0.60 0.00 74.22
Support Activities for Animal Production
(1152) 110 ‐45% $33,400 0.02 0.29 0.00 73.92
Support Activities for Forestry (1153) (s) (s) (s) (s) (s) (s) (s)
Oil and Gas Extraction (2111) 510 ‐14% $511,071 4.35 543.67 0.00 651.47
Coal Mining (2121) (s) (s) (s) (s) (s) (s) (s)
Metal Ore Mining (2122) (s) (s) (s) (s) (s) (s) (s)
Nonmetallic Mineral Mining and Quarrying
(2123) 166 28% $68,554 1.90 4.32 0.00 188.03
Support Activities for Mining (2131) 601 2335% $127,338 1.63 0.06 0.00 418.24
Electric Power Generation, Transmission and
Distribution (2211) 9,193 0% $109,356 81.80 1439.43 0.00 15325.50
Natural Gas Distribution (2212) 2,150 0% $97,657 0.71 393.89 0.00 5517.05
Water, Sewage and Other Systems (2213) 2,285 ‐17% $87,091 1.29 222.42 0.00 976.41
Residential Building Construction (2361) 6,325 16% $43,877 0.39 0.09 0.00 114.83

C‐49
Table C.2.2: Economic and Environmental Ranking Data, City of LA
Industry Title
& 4‐Digit Coding
NAICS 2007 Employment 2011
Chan
ge in Employment
1996‐2011
Average Wage 2011
Direct terajoules per job
2011
Direct metric tons of
greenhouse gases per job
2011
Average gallons of gasoline
per job for public trips 2011
GHG2011 L
ife cycle metric
tons of co2‐equivalent
emissions in 2011
Nonresidential Building Construction (2362) 2,934 ‐23% $74,425 0.33 0.07 0.00 61.84
Utility System Construction (2371) 574 ‐7% $71,520 0.33 0.07 0.00 69.93
Land Subdivision (2372) 863 ‐11% $77,390 0.33 0.07 0.00 69.93
Highway, Street, and Bridge Construction
(2373) 1,565 18% $69,728 0.33 0.07 0.00 69.93
Other Heavy and Civil Engineering
Construction (2379) 276 ‐95% $76,766 0.33 0.07 0.00 69.88
Foundation, Structure, and Building Exterior
Contractors (2381) 544 ‐72% $39,889 2.43 0.55 0.00 457.55
Building Equipment Contractors (2382) 1,110 ‐77% $48,995 3.25 0.74 0.00 610.12
Building Finishing Contractors (2383) 797 ‐75% $34,671 2.63 0.60 0.00 493.87
Other Specialty Trade Contractors (2389) 420 ‐58% $45,231 1.77 0.39 0.00 377.40
Animal Food Manufacturing (3111) 232 ‐73% $56,337 0.85 22.29 0.00 1594.78
Grain and Oilseed Milling (3112) 104 ‐43% $55,099 0.94 19.91 0.00 1776.40
Sugar and Confectionery Product
Manufacturing (3113) 739 7% $38,565 0.18 4.05 0.00 549.66
Fruit and Vegetable Preserving and Specialty
Food Manufacturing (3114) 1,384 14% $61,262 0.30 7.83 0.00 626.51
Dairy Product Manufacturing (3115) 424 ‐45% $72,310 0.56 14.21 0.00 1534.71
Animal Slaughtering and Processing (3116) 479 ‐50% $35,088 0.14 3.07 0.00 605.16
Seafood Product Preparation and Packaging
(3117) 249 ‐80% $32,669 0.24 6.59 0.00 298.87
Bakeries and Tortilla Manufacturing (3118) 5,485 ‐17% $32,090 0.13 3.48 126.61 152.39
Other Food Manufacturing (3119) 1,173 113% $44,821 0.23 5.53 0.00 407.45
Beverage Manufacturing (3121) 2,271 4% $64,927 0.39 10.10 0.00 633.29
Tobacco Manufacturing (3122) (s) (s) (s) (s) (s) (s) (s)
Fiber, Yarn, and Thread Mills (3131) (s) (s) (s) (s) (s) (s) (s)
Fabric Mills (3132) 443 ‐59% $40,465 0.39 11.63 0.00 173.65
Textile and Fabric Finishing and Fabric
Coating Mills (3133) 2,205 ‐37% $34,702 0.49 22.97 0.00 165.88
Textile Furnishings Mills (3141) 500 ‐58% $33,196 0.10 1.85 0.00 98.21
Other Textile Product Mills (3149) 835 ‐67% $39,526 0.15 2.14 0.00 87.36
Apparel Knitting Mills (3151) 259 ‐53% $28,312 0.02 0.05 0.00 99.42
Cut and Sew Apparel Manufacturing (3152) 24,623 ‐55% $30,474 0.01 0.04 0.00 38.88
Apparel Accessories and Other Apparel
Manufacturing (3159) 330 ‐83% $36,653 0.11 0.66 0.00 267.78
Leather and Hide Tanning and Finishing
(3161) (s) (s) (s) (s) (s) (s) (s)
Footwear Manufacturing (3162) 297 ‐44% $23,926 0.02 0.07 0.00 98.38

C‐50
Table C.2.2: Economic and Environmental Ranking Data, City of LA
Industry Title
& 4‐Digit Coding
NAICS 2007 Employment 2011
Chan
ge in Employment
1996‐2011
Average Wage 2011
Direct terajoules per job
2011
Direct metric tons of
greenhouse gases per job
2011
Average gallons of gasoline
per job for public trips 2011
GHG2011 L
ife cycle metric
tons of co2‐equivalent
emissions in 2011
Other Leather and Allied Product
Manufacturing (3169) 297 ‐64% $41,322 0.04 0.14 0.00 140.78
Sawmills and Wood Preservation (3211) (s) (s) (s) (s) (s) (s) (s)
Veneer, Plywood, and Engineered Wood
Product Manufacturing (3212) 40 ‐41% $33,335 0.13 0.65 0.00 103.35
Other Wood Product Manufacturing (3219) 842 ‐17% $29,966 0.03 0.16 0.00 67.16
Pulp, Paper, and Paperboard Mills (3221) (s) (s) (s) (s) (s) (s) (s)
Converted Paper Product Manufacturing
(3222) 830 ‐62% $38,686 0.38 10.03 0.00 272.44
Printing and Related Support Activities
(3231) 4,599 ‐55% $40,767 0.02 0.49 0.00 45.29
Petroleum and Coal Products Manufacturing
(3241) 1,397 30% $120,940 189.05 15112.11 0.00 (r)
Basic Chemical Manufacturing (3251) 277 ‐56% $67,627 4.99 292.34 0.00 1468.48
Resin, Synthetic Rubber, and Artificial
Synthetic Fibers and Filaments
Manufacturing (3252)
145 ‐7% $47,431 5.99 102.21 0.00 1820.72
Pesticide, Fertilizer, and Other Agricultural
Chemical Manufacturing (3253) (s) (s) (s) (s) (s) (s) (s)
Pharmaceutical and Medicine Manufacturing
(3254) 2,985 ‐1% $71,289 0.22 1.71 0.00 145.77
Paint, Coating, and Adhesive Manufacturing
(3255) 547 ‐51% $46,122 0.40 9.67 0.00 434.99
Soap, Cleaning Compound, and Toilet
Preparation Manufacturing (3256) 3,284 12% $58,576 0.48 7.62 0.00 292.17
Other Chemical Product and Preparation
Manufacturing (3259) 253 ‐53% $31,641 0.53 9.63 0.00 453.56
Plastics Product Manufacturing (3261) 2,028 ‐35% $41,461 0.18 1.11 0.00 214.64
Rubber Product Manufacturing (3262) 255 ‐53% $33,091 0.17 1.75 0.00 141.50
Clay Product and Refractory Manufacturing
(3271) 181 ‐62% $44,513 0.37 14.42 0.00 165.38
Glass and Glass Product Manufacturing
(3272) 990 ‐24% $37,705 0.17 4.74 0.00 128.20
Cement and Concrete Product
Manufacturing (3273) 486 ‐30% $51,225 0.10 3.60 0.00 826.96
Lime and Gypsum Product Manufacturing
(3274) 50 ‐75% $39,367 1.60 214.97 0.00 1406.44
Other Nonmetallic Mineral Product
Manufacturing (3279) 254 ‐22% $43,629 0.12 4.25 0.00 319.10
Iron and Steel Mills and Ferroalloy
Manufacturing (3311) 60 164% $47,845 1.56 89.76 0.00 1316.32
Steel Product Manufacturing from Purchased
Steel (3312) 205 87% $61,892 0.17 1.53 0.00 956.99

C‐51
Table C.2.2: Economic and Environmental Ranking Data, City of LA
Industry Title
& 4‐Digit Coding
NAICS 2007 Employment 2011
Chan
ge in Employment
1996‐2011
Average Wage 2011
Direct terajoules per job
2011
Direct metric tons of
greenhouse gases per job
2011
Average gallons of gasoline
per job for public trips 2011
GHG2011 L
ife cycle metric
tons of co2‐equivalent
emissions in 2011
Alumina and Aluminum Production and
Processing (3313) 94 ‐26% $46,994 0.59 25.95 0.00 638.13
Nonferrous Metal (except Aluminum)
Production and Processing (3314) 25 ‐96% $53,012 0.30 2.00 0.00 501.16
Foundries (3315) 242 ‐68% $34,238 0.12 0.95 0.00 193.45
Forging and Stamping (3321) 407 ‐37% $44,436 0.52 9.81 0.00 379.40
Cutlery and Handtool Manufacturing (3322) 228 ‐54% $44,575 0.10 1.26 0.00 117.46
Architectural and Structural Metals
Manufacturing (3323) 1,737 ‐21% $40,262 0.07 1.09 0.00 155.17
Boiler, Tank, and Shipping Container
Manufacturing (3324) 418 ‐45% $89,870 0.37 5.44 0.00 531.09
Hardware Manufacturing (3325) 119 ‐71% $28,938 0.10 1.46 0.00 151.79
Spring and Wire Product Manufacturing
(3326) 65 ‐73% $34,108 0.08 1.30 0.00 101.22
Machine Shops; Turned Product; and Screw,
Nut, and Bolt Manufacturing (3327) 3,256 ‐23% $51,135 0.09 1.01 0.00 97.70
Coating, Engraving, Heat Treating, and
Allied Activities (3328) 1,670 ‐48% $40,252 0.37 6.36 0.00 180.65
Other Fabricated Metal Product
Manufacturing (3329) 2,414 ‐33% $59,973 0.19 2.47 0.00 208.77
Agriculture, Construction, and Mining
Machinery Manufacturing (3331) 77 ‐46% $37,713 0.14 0.97 0.00 183.48
Industrial Machinery Manufacturing (3332) 189 ‐59% $43,287 0.08 0.53 0.00 130.91
Commercial and Service Industry Machinery
Manufacturing (3333) 506 ‐13% $46,404 0.13 0.65 0.00 202.56
Ventilation, Heating, Air‐Conditioning, and
Commercial Refrigeration Equipment
Manufacturing (3334)
128 ‐61% $48,579 0.06 0.39 0.00 97.25
Metalworking Machinery Manufacturing
(3335) 416 ‐65% $40,325 0.06 0.32 0.00 68.31
Engine, Turbine, and Power Transmission
Equipment Manufacturing (3336) 220 4% $85,257 0.11 0.66 0.00 205.84
Other General Purpose Machinery
Manufacturing (3339) 945 ‐33% $43,212 0.10 0.71 0.00 135.68
Computer and Peripheral Equipment
Manufacturing (3341) 156 ‐90% $68,460 0.10 0.53 0.00 151.28
Communications Equipment Manufacturing
(3342) 564 ‐57% $48,713 0.03 0.18 0.00 91.22
Audio and Video Equipment Manufacturing
(3343) 268 ‐89% $92,261 0.09 0.31 0.00 319.74
Semiconductor and Other Electronic
Component Manufacturing (3344) 3,948 ‐18% $54,551 0.06 3.19 0.00 43.96

C‐52
Table C.2.2: Economic and Environmental Ranking Data, City of LA
Industry Title
& 4‐Digit Coding
NAICS 2007 Employment 2011
Chan
ge in Employment
1996‐2011
Average Wage 2011
Direct terajoules per job
2011
Direct metric tons of
greenhouse gases per job
2011
Average gallons of gasoline
per job for public trips 2011
GHG2011 L
ife cycle metric
tons of co2‐equivalent
emissions in 2011
Navigational, Measuring, Electromedical,
and Control Instruments Manufacturing
(3345)
8,084 ‐11% $88,279 0.05 0.25 0.00 93.34
Manufacturing and Reproducing Magnetic
and Optical Media (3346) 500 ‐43% $61,257 0.13 0.58 0.00 168.35
Electric Lighting Equipment Manufacturing
(3351) 622 ‐50% $55,478 0.04 0.27 0.00 77.27
Household Appliance Manufacturing (3352) 58 ‐37% $47,308 0.07 0.45 0.00 153.99
Electrical Equipment Manufacturing (3353) 416 ‐41% $57,183 0.05 0.33 0.00 85.56
Other Electrical Equipment and Component
Manufacturing (3359) 769 25% $84,975 0.14 1.04 0.00 163.56
Motor Vehicle Manufacturing (3361) 111 ‐58% $120,378 0.29 3.93 0.00 567.60
Motor Vehicle Body and Trailer
Manufacturing (3362) 175 38% $33,536 0.15 1.91 0.00 238.84
Motor Vehicle Parts Manufacturing (3363) 428 ‐81% $58,709 0.12 1.29 0.00 149.93
Aerospace Product and Parts Manufacturing
(3364) 5,066 ‐34% $93,851 0.15 1.75 0.00 127.20
Railroad Rolling Stock Manufacturing (3365) (s) (s) (s) (s) (s) (s) (s)
Ship and Boat Building (3366) 38 ‐93% $41,079 0.06 0.73 0.00 72.91
Other Transportation Equipment
Manufacturing (3369) 58 ‐66% $80,215 0.17 1.93 0.00 251.92
Household and Institutional Furniture and
Kitchen Cabinet Manufacturing (3371) 2,541 ‐34% $30,636 0.03 0.15 0.00 41.55
Office Furniture (including Fixtures)
Manufacturing (3372) 699 ‐53% $44,946 0.07 0.48 0.00 85.94
Other Furniture Related Product
Manufacturing (3379) 159 ‐75% $26,620 0.03 0.10 0.00 54.17
Medical Equipment and Supplies
Manufacturing (3391) 2,657 29% $73,481 0.05 1.32 0.00 54.94
Other Miscellaneous Manufacturing (3399) 4,000 ‐45% $42,909 0.05 1.70 0.00 66.95
Motor Vehicle and Motor Vehicle Parts and
Supplies Merchant Wholesalers (4231) 2,133 ‐34% $37,819 0.03 0.11 0.00 30.78
Furniture and Home Furnishing Merchant
Wholesalers (4232) 1,599 ‐22% $48,353 0.03 0.11 0.00 30.78
Lumber and Other Construction Materials
Merchant Wholesalers (4233) 1,249 ‐20% $47,676 0.03 0.11 0.00 30.78
Professional and Commercial Equipment and
Supplies Merchant Wholesalers (4234) 3,914 ‐41% $57,340 0.03 0.11 0.00 30.78
Metal and Mineral (except Petroleum)
Merchant Wholesalers (4235) 562 ‐32% $75,267 0.03 0.11 0.00 30.78
Electrical and Electronic Goods Merchant
Wholesalers (4236) 4,113 ‐18% $78,177 0.03 0.11 0.00 30.78

C‐53
Table C.2.2: Economic and Environmental Ranking Data, City of LA
Industry Title
& 4‐Digit Coding
NAICS 2007 Employment 2011
Chan
ge in Employment
1996‐2011
Average Wage 2011
Direct terajoules per job
2011
Direct metric tons of
greenhouse gases per job
2011
Average gallons of gasoline
per job for public trips 2011
GHG2011 L
ife cycle metric
tons of co2‐equivalent
emissions in 2011
Hardware, and Plumbing and Heating
Equipment and Supplies Merchant
Wholesalers (4237)
1,803 3% $38,729 0.03 0.11 0.00 30.78
Machinery, Equipment, and Supplies
Merchant Wholesalers (4238) 2,875 ‐27% $55,746 0.03 0.11 0.00 30.78
Miscellaneous Durable Goods Merchant
Wholesalers (4239) 7,593 ‐9% $50,464 0.03 0.11 0.00 30.78
Paper and Paper Product Merchant
Wholesalers (4241) 1,181 ‐31% $49,151 0.03 0.11 0.00 30.78
Drugs and Druggistsʹ Sundries Merchant
Wholesalers (4242) 2,679 30% $80,620 0.03 0.11 0.00 30.78
Apparel, Piece Goods, and Notions Merchant
Wholesalers (4243) 11,367 14% $44,099 0.03 0.11 0.00 30.78
Grocery and Related Product Merchant
Wholesalers (4244) 11,743 20% $47,445 0.03 0.11 0.00 30.78
Farm Product Raw Material Merchant
Wholesalers (4245) 32 ‐5% $91,215 0.03 0.11 0.00 30.78
Chemical and Allied Products Merchant
Wholesalers (4246) 580 ‐43% $66,081 0.03 0.11 0.00 30.78
Petroleum and Petroleum Products Merchant
Wholesalers (4247) 288 77% $97,700 0.03 0.11 0.00 30.78
Beer, Wine, and Distilled Alcoholic Beverage
Merchant Wholesalers (4248) 1,929 105% $58,127 0.03 0.11 0.00 30.78
Miscellaneous Nondurable Goods Merchant
Wholesalers (4249) 5,467 ‐1% $45,040 0.03 0.11 0.00 30.78
Wholesale Electronic Markets and Agents
and Brokers (4251) 7,556 91% $60,311 0.03 0.11 0.00 30.78
Automobile Dealers (4411) 6,702 ‐11% $55,337 0.05 0.14 382.33 20.32
Other Motor Vehicle Dealers (4412) 437 1% $34,748 0.05 0.14 382.33 20.32
Automotive Parts, Accessories, and Tire
Stores (4413) 3,872 ‐16% $31,580 0.05 0.14 653.63 20.32
Furniture Stores (4421) 1,644 ‐26% $32,029 0.04 0.10 268.19 14.87
Home Furnishings Stores (4422) 3,009 ‐1% $30,773 0.04 0.10 221.06 14.87
Electronics and Appliance Stores (4431) 5,920 ‐5% $68,037 0.06 0.16 424.52 22.79
Building Material and Supplies Dealers
(4441) 6,973 50% $33,082 0.04 0.11 496.04 16.01
Lawn and Garden Equipment and Supplies
Stores (4442) 732 ‐22% $24,318 0.04 0.11 400.51 16.01
Grocery Stores (4451) 27,277 27% $27,329 0.07 0.19 1769.84 19.30
Specialty Food Stores (4452) 3,887 37% $22,352 0.07 0.19 404.40 19.30
Beer, Wine, and Liquor Stores (4453) 1,420 8% $21,152 0.07 0.19 404.40 19.30
Health and Personal Care Stores (4461) 10,495 29% $37,754 0.08 0.20 780.69 20.82
Gasoline Stations (4471) 3,909 ‐11% $19,731 0.16 0.43 2802.85 52.05

C‐54
Table C.2.2: Economic and Environmental Ranking Data, City of LA
Industry Title
& 4‐Digit Coding
NAICS 2007 Employment 2011
Chan
ge in Employment
1996‐2011
Average Wage 2011
Direct terajoules per job
2011
Direct metric tons of
greenhouse gases per job
2011
Average gallons of gasoline
per job for public trips 2011
GHG2011 L
ife cycle metric
tons of co2‐equivalent
emissions in 2011
Clothing Stores (4481) 16,587 51% $23,140 0.03 0.09 405.76 13.07
Shoe Stores (4482) 2,559 30% $27,985 0.03 0.09 405.76 13.07
Jewelry, Luggage, and Leather Goods Stores
(4483) 2,028 20% $34,606 0.03 0.09 405.76 13.07
Sporting Goods, Hobby, and Musical
Instrument Stores (4511) 4,317 11% $29,819 0.03 0.07 400.33 10.29
Book, Periodical, and Music Stores (4512) 1,268 ‐63% $19,580 0.03 0.07 1769.64 10.29
Department Stores (4521) 10,682 ‐12% $24,020 0.04 0.10 497.38 14.09
Other General Merchandise Stores (4529) 8,965 92% $24,421 0.04 0.10 629.75 14.09
Florists (4531) 507 ‐50% $27,468 0.04 0.10 346.63 13.60
Office Supplies, Stationery, and Gift Stores
(4532) 5,580 13% $32,289 0.04 0.10 327.53 13.60
Used Merchandise Stores (4533) 1,559 59% $23,293 0.04 0.10 346.63 13.60
Other Miscellaneous Store Retailers (4539) 3,322 25% $30,972 0.04 0.10 364.31 13.60
Electronic Shopping and Mail‐Order Houses
(4541) 2,535 15% $71,932 0.07 0.18 0.00 26.16
Vending Machine Operators (4542) 119 ‐62% $49,960 0.07 0.18 0.00 26.16
Direct Selling Establishments (4543) 1,067 ‐12% $36,953 0.07 0.18 328.48 26.16
Scheduled Air Transportation (4811) 14,612 ‐44% $60,431 6.24 1442.02 243.01 (r)
Nonscheduled Air Transportation (4812) 1,168 ‐6% $85,342 6.24 1442.02 238.06 (r)
Rail Transportation (4821) (s) (s) (s) (s) (s) (s) (s)
Deep Sea, Coastal, and Great Lakes Water
Transportation (4831) 723 ‐2% $60,645 0.33 76.18 49.71 1178.16
Inland Water Transportation (4832) 200 140% $64,867 0.33 76.18 37.65 1178.16
General Freight Trucking (4841) 3,162 ‐4% $38,898 1.50 343.18 0.00 (r)
Specialized Freight Trucking (4842) 1,937 78% $37,074 1.50 343.18 0.00 (r)
Urban Transit Systems (4851) 4,976 34% $51,791 0.71 126.82 70.35 223.84
Interurban and Rural Bus Transportation
(4852) 379 ‐19% $37,081 0.71 126.82 70.35 223.84
Taxi and Limousine Service (4853) 1,062 56% $32,196 0.71 126.82 0.00 223.84
School and Employee Bus Transportation
(4854) 892 6% $26,837 0.71 126.82 0.00 223.84
Charter Bus Industry (4855) 209 ‐36% $44,546 0.71 126.82 70.35 223.84
Other Transit and Ground Passenger
Transportation (4859) 1,447 390% $30,065 0.71 126.82 0.00 223.84
Pipeline Transportation of Crude Oil (4861) (s) (s) (s) (s) (s) (s) (s)
Pipeline Transportation of Natural Gas (4862) 105 ‐34% $102,095 2.75 136.52 0.00 3695.44
Other Pipeline Transportation (4869) 57 ‐64% $66,748 2.75 136.52 0.00 3695.44
Scenic and Sightseeing Transportation, Land
(4871) 239 85% $26,678 0.11 12.56 70.35 34.62

C‐55
Table C.2.2: Economic and Environmental Ranking Data, City of LA
Industry Title
& 4‐Digit Coding
NAICS 2007 Employment 2011
Chan
ge in Employment
1996‐2011
Average Wage 2011
Direct terajoules per job
2011
Direct metric tons of
greenhouse gases per job
2011
Average gallons of gasoline
per job for public trips 2011
GHG2011 L
ife cycle metric
tons of co2‐equivalent
emissions in 2011
Scenic and Sightseeing Transportation, Water
(4872) 45 ‐39% $17,938 0.00 0.16 70.35 16.10
Scenic and Sightseeing Transportation, Other
(4879) (s) (s) (s) (s) (s) (s) (s)
Support Activities for Air Transportation
(4881) 10,515 82% $44,440 0.01 1.35 6.71 18.86
Support Activities for Rail Transportation
(4882) (s) (s) (s) (s) (s) (s) (s)
Support Activities for Water Transportation
(4883) 1,066 4% $86,487 0.10 12.37 0.00 13.07
Support Activities for Road Transportation
(4884) 1,418 3% $37,503 0.11 12.56 0.00 13.02
Freight Transportation Arrangement (4885) 3,949 7% $53,912 0.11 12.56 0.00 13.02
Other Support Activities for Transportation
(4889) 1,784 316% $80,667 0.11 12.56 0.00 13.02
Postal Service (4911) 6,850 ‐39% $60,404 0.02 2.38 439.02 13.85
Couriers and Express Delivery Services
(4921) 8,363 ‐14% $52,419 0.93 210.86 420.70 (r)
Local Messengers and Local Delivery (4922) 1,422 ‐47% $21,437 0.93 210.86 420.70 (r)
Warehousing and Storage (4931) 1,981 ‐30% $53,182 0.05 3.89 0.00 47.21
Newspaper, Periodical, Book, and Directory
Publishers (5111) 5,080 ‐59% $83,916 0.01 0.00 0.00 42.74
Software Publishers (5112) 2,002 9% $137,905 0.01 0.00 0.00 34.41
Motion Picture and Video Industries (5121) 30,440 ‐43% $130,686 0.02 0.01 74.93 33.00
Sound Recording Industries (5122) 1,372 ‐25% $82,786 0.04 0.01 0.00 140.24
Radio and Television Broadcasting (5151) 10,759 10% $120,260 0.14 0.20 0.00 185.66
Cable and Other Subscription Programming
(5152) 2,182 ‐12% $95,822 0.04 0.06 0.00 72.20
Wired Telecommunications Carriers (5171) 4,442 368% $83,159 0.14 0.20 0.00 51.53
Wireless Telecommunications Carriers
(except Satellite) (5172) 1,045 ‐7% $68,423 0.14 0.20 0.00 51.53
Satellite Telecommunications (5174) 133 ‐70% $74,003 0.14 0.20 0.00 51.53
Other Telecommunications (5179) 3,224 ‐61% $96,168 0.14 0.20 0.00 51.53
Data Processing, Hosting, and Related
Services (5182) 1,007 ‐62% $64,022 0.02 0.01 0.00 59.12
Other Information Services (5191) 5,375 34% $62,783 0.02 0.01 392.67 33.61
Monetary Authorities‐Central Bank (5211) 379 ‐44% $90,268 0.01 0.09 0.00 21.79
Depository Credit Intermediation (5221) 18,916 ‐45% $75,275 0.01 0.09 1271.53 21.79
Nondepository Credit Intermediation (5222) 5,225 ‐1% $60,949 0.01 0.04 293.63 7.13
Activities Related to Credit Intermediation
(5223) 3,900 74% $78,060 0.01 0.04 20.52 7.13

C‐56
Table C.2.2: Economic and Environmental Ranking Data, City of LA
Industry Title
& 4‐Digit Coding
NAICS 2007 Employment 2011
Chan
ge in Employment
1996‐2011
Average Wage 2011
Direct terajoules per job
2011
Direct metric tons of
greenhouse gases per job
2011
Average gallons of gasoline
per job for public trips 2011
GHG2011 L
ife cycle metric
tons of co2‐equivalent
emissions in 2011
Securities and Commodity Contracts
Intermediation and Brokerage (5231) 5,194 ‐14% $258,272 0.01 0.02 17.56 11.80
Securities and Commodity Exchanges (5232) (s) (s) (s) (s) (s) (s) (s)
Other Financial Investment Activities (5239) 7,783 110% $306,339 0.01 0.02 29.83 11.80
Insurance Carriers (5241) 9,436 ‐44% $103,135 0.00 0.00 29.82 17.28
Agencies, Brokerages, and Other Insurance
Related Activities (5242) 11,541 ‐30% $80,768 0.01 0.08 25.39 13.23
Insurance and Employee Benefit Funds (5251) 692 43% $53,077 0.00 0.00 30.10 23.97
Other Investment Pools and Funds (5259) 733 10% $107,608 0.00 0.00 7.46 23.97
Lessors of Real Estate (5311) 7,113 ‐29% $40,155 0.05 0.22 25.94 35.08
Offices of Real Estate Agents and Brokers
(5312) 4,851 95% $78,229 0.05 0.22 36.12 35.08
Activities Related to Real Estate (5313) 12,857 34% $53,402 0.05 0.22 24.25 35.08
Automotive Equipment Rental and Leasing
(5321) 2,542 ‐17% $43,538 0.00 0.02 327.40 5.70
Consumer Goods Rental (5322) 2,929 23% $48,719 0.01 0.04 683.55 6.66
General Rental Centers (5323) 465 ‐60% $42,189 0.00 0.04 420.70 3.40
Commercial and Industrial Machinery and
Equipment Rental and Leasing (5324) 2,628 42% $72,826 0.01 0.10 0.00 12.59
Lessors of Nonfinancial Intangible Assets
(except Copyrighted Works) (5331) 398 ‐15% $115,163 0.67 6.88 0.00 296.60
Legal Services (5411) 33,122 7% $112,501 0.01 0.07 29.97 16.10
Accounting, Tax Preparation, Bookkeeping,
and Payroll Services (5412) 22,352 26% $69,098 0.01 0.07 19.22 12.56
Architectural, Engineering, and Related
Services (5413) 9,642 19% $84,021 0.02 0.08 27.12 25.32
Specialized Design Services (5414) 3,420 34% $66,957 0.01 0.05 6.21 18.10
Computer Systems Design and Related
Services (5415) 10,403 70% $93,999 0.01 0.03 0.00 24.10
Management, Scientific, and Technical
Consulting Services (5416) 20,970 246% $67,802 0.01 0.04 0.00 11.57
Scientific Research and Development Services
(5417) 2,501 ‐18% $79,242 0.11 0.52 0.00 59.54
Advertising, Public Relations, and Related
Services (5418) 13,025 19% $110,373 0.06 0.25 0.00 119.46
Other Professional, Scientific, and Technical
Services (5419) 5,975 28% $55,719 0.02 0.13 111.10 24.58
Management of Companies and Enterprises
(5511) 19,514 ‐10% $101,948 0.04 0.00 0.00 25.66
Office Administrative Services (5611) 11,297 105% $72,478 0.02 0.30 0.00 13.72
Facilities Support Services (5612) 95 ‐97% $30,733 0.03 0.52 0.00 31.69
Employment Services (5613) 24,679 ‐23% $34,940 0.00 0.04 26.18 2.82
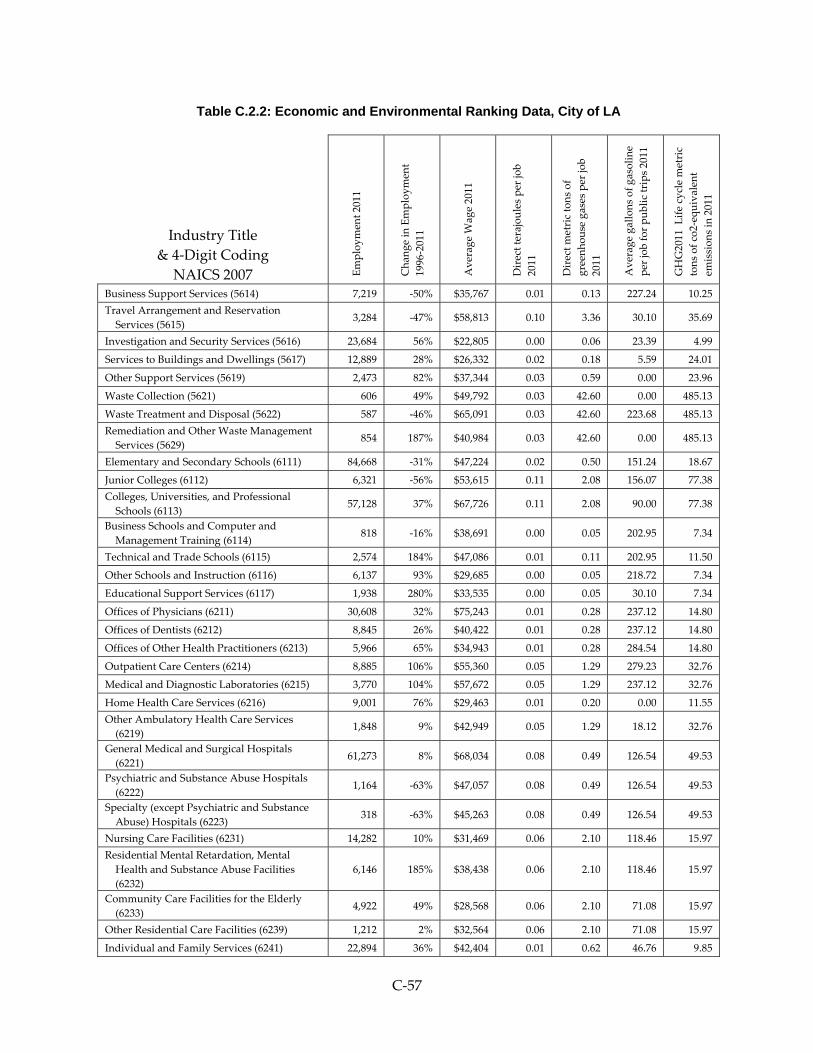
C‐57
Table C.2.2: Economic and Environmental Ranking Data, City of LA
Industry Title
& 4‐Digit Coding
NAICS 2007 Employment 2011
Chan
ge in Employment
1996‐2011
Average Wage 2011
Direct terajoules per job
2011
Direct metric tons of
greenhouse gases per job
2011
Average gallons of gasoline
per job for public trips 2011
GHG2011 L
ife cycle metric
tons of co2‐equivalent
emissions in 2011
Business Support Services (5614) 7,219 ‐50% $35,767 0.01 0.13 227.24 10.25
Travel Arrangement and Reservation
Services (5615) 3,284 ‐47% $58,813 0.10 3.36 30.10 35.69
Investigation and Security Services (5616) 23,684 56% $22,805 0.00 0.06 23.39 4.99
Services to Buildings and Dwellings (5617) 12,889 28% $26,332 0.02 0.18 5.59 24.01
Other Support Services (5619) 2,473 82% $37,344 0.03 0.59 0.00 23.96
Waste Collection (5621) 606 49% $49,792 0.03 42.60 0.00 485.13
Waste Treatment and Disposal (5622) 587 ‐46% $65,091 0.03 42.60 223.68 485.13
Remediation and Other Waste Management
Services (5629) 854 187% $40,984 0.03 42.60 0.00 485.13
Elementary and Secondary Schools (6111) 84,668 ‐31% $47,224 0.02 0.50 151.24 18.67
Junior Colleges (6112) 6,321 ‐56% $53,615 0.11 2.08 156.07 77.38
Colleges, Universities, and Professional
Schools (6113) 57,128 37% $67,726 0.11 2.08 90.00 77.38
Business Schools and Computer and
Management Training (6114) 818 ‐16% $38,691 0.00 0.05 202.95 7.34
Technical and Trade Schools (6115) 2,574 184% $47,086 0.01 0.11 202.95 11.50
Other Schools and Instruction (6116) 6,137 93% $29,685 0.00 0.05 218.72 7.34
Educational Support Services (6117) 1,938 280% $33,535 0.00 0.05 30.10 7.34
Offices of Physicians (6211) 30,608 32% $75,243 0.01 0.28 237.12 14.80
Offices of Dentists (6212) 8,845 26% $40,422 0.01 0.28 237.12 14.80
Offices of Other Health Practitioners (6213) 5,966 65% $34,943 0.01 0.28 284.54 14.80
Outpatient Care Centers (6214) 8,885 106% $55,360 0.05 1.29 279.23 32.76
Medical and Diagnostic Laboratories (6215) 3,770 104% $57,672 0.05 1.29 237.12 32.76
Home Health Care Services (6216) 9,001 76% $29,463 0.01 0.20 0.00 11.55
Other Ambulatory Health Care Services
(6219) 1,848 9% $42,949 0.05 1.29 18.12 32.76
General Medical and Surgical Hospitals
(6221) 61,273 8% $68,034 0.08 0.49 126.54 49.53
Psychiatric and Substance Abuse Hospitals
(6222) 1,164 ‐63% $47,057 0.08 0.49 126.54 49.53
Specialty (except Psychiatric and Substance
Abuse) Hospitals (6223) 318 ‐63% $45,263 0.08 0.49 126.54 49.53
Nursing Care Facilities (6231) 14,282 10% $31,469 0.06 2.10 118.46 15.97
Residential Mental Retardation, Mental
Health and Substance Abuse Facilities
(6232)
6,146 185% $38,438 0.06 2.10 118.46 15.97
Community Care Facilities for the Elderly
(6233) 4,922 49% $28,568 0.06 2.10 71.08 15.97
Other Residential Care Facilities (6239) 1,212 2% $32,564 0.06 2.10 71.08 15.97
Individual and Family Services (6241) 22,894 36% $42,404 0.01 0.62 46.76 9.85

C‐58
Table C.2.2: Economic and Environmental Ranking Data, City of LA
Industry Title
& 4‐Digit Coding
NAICS 2007 Employment 2011
Chan
ge in Employment
1996‐2011
Average Wage 2011
Direct terajoules per job
2011
Direct metric tons of
greenhouse gases per job
2011
Average gallons of gasoline
per job for public trips 2011
GHG2011 L
ife cycle metric
tons of co2‐equivalent
emissions in 2011
Community Food and Housing, and
Emergency and Other Relief Services (6242) 2,373 81% $35,330 0.01 0.64 56.08 10.13
Vocational Rehabilitation Services (6243) 3,724 ‐33% $28,629 0.01 0.64 46.76 10.13
Child Day Care Services (6244) 5,987 44% $24,644 0.01 0.19 268.91 9.35
Performing Arts Companies (7111) 3,221 57% $63,059 0.01 0.04 129.18 10.84
Spectator Sports (7112) 2,169 184% $120,051 0.00 0.02 129.18 7.75
Promoters of Performing Arts, Sports, and
Similar Events (7113) 1,117 46% $48,041 0.01 0.08 71.03 22.31
Agents and Managers for Artists, Athletes,
Entertainers, and Other Public Figures
(7114)
1,786 ‐27% $144,988 0.01 0.08 0.00 22.31
Independent Artists, Writers, and Performers
(7115) 6,148 68% $367,379 0.01 0.05 0.00 20.93
Museums, Historical Sites, and Similar
Institutions (7121) 3,279 56% $47,174 0.12 0.98 58.02 98.44
Amusement Parks and Arcades (7131) 73 ‐17% $23,866 0.02 0.35 687.87 38.70
Gambling Industries (7132) 69 50% $26,495 0.02 0.35 687.87 38.70
Other Amusement and Recreation Industries
(7139) 16,371 10% $25,460 0.02 0.22 334.13 23.04
Traveler Accommodation (7211) 16,733 ‐5% $31,479 0.16 4.02 259.23 33.07
RV (Recreational Vehicle) Parks and
Recreational Camps (7212) 59 ‐39% $32,339 0.05 2.25 231.68 50.53
Rooming and Boarding Houses (7213) 99 ‐47% $27,998 0.10 4.52 0.00 29.75
Full‐Service Restaurants (7221) 1,697 ‐96% $18,300 0.08 2.15 425.42 26.02
Limited‐Service Eating Places (7222) 1,713 ‐86% $18,300 0.08 2.15 2729.99 26.02
Special Food Services (7223) 9,887 187% $25,070 0.07 2.10 509.47 25.28
Drinking Places (Alcoholic Beverages) (7224) 3,240 17% $16,203 0.07 2.10 502.07 25.28
Other Eating and Drinking Places (7225) 100,649 305% $18,300 0.07 2.10 1597.54 25.28
Automotive Repair and Maintenance (8111) 10,170 ‐6% $30,085 0.02 1.12 474.92 25.24
Electronic and Precision Equipment Repair
and Maintenance (8112) 651 ‐36% $42,360 0.02 0.93 288.86 32.69
Commercial and Industrial Machinery and
Equipment (except Automotive and
Electronic) Repair and Maintenance (8113)
1,157 ‐20% $53,921 0.02 1.19 0.00 35.21
Personal and Household Goods Repair and
Maintenance (8114) 1,078 ‐19% $32,039 0.02 1.41 288.86 48.54
Personal Care Services (8121) 5,452 29% $21,253 0.01 0.40 251.21 18.07
Death Care Services (8122) 1,016 91% $49,381 0.06 4.22 541.07 71.29
Drycleaning and Laundry Services (8123) 4,220 ‐11% $25,641 0.02 1.10 237.17 16.75
Other Personal Services (8129) 9,299 22% $26,526 0.02 0.99 60.46 25.45
Religious Organizations (8131) 3,209 ‐61% $30,778 0.01 0.97 169.60 27.62

C‐59
Table C.2.2: Economic and Environmental Ranking Data, City of LA
Industry Title
& 4‐Digit Coding
NAICS 2007 Employment 2011
Chan
ge in Employment
1996‐2011
Average Wage 2011
Direct terajoules per job
2011
Direct metric tons of
greenhouse gases per job
2011
Average gallons of gasoline
per job for public trips 2011
GHG2011 L
ife cycle metric
tons of co2‐equivalent
emissions in 2011
Grantmaking and Giving Services (8132) 16,067 26% $51,102 0.02 1.53 25.84 25.57
Social Advocacy Organizations (8133) 2,297 123% $47,801 0.02 1.53 30.10 25.57
Civic and Social Organizations (8134) 3,929 18% $22,183 0.07 4.69 605.87 39.78
Business, Professional, Labor, Political, and
Similar Organizations (8139) 5,907 36% $66,367 0.07 4.69 477.49 39.78
Private Households (8141) 54,417 389% $13,957 0.00 0.00 0.00 0.00
Executive, Legislative, and Other General
Government Support (9211) 21,364 ‐62% $63,569 0.25 14.99 151.01 98.38
Justice, Public Order, and Safety Activities
(9221) 56,394 25% $86,647 0.29 17.30 186.49 203.68
Administration of Human Resource
Programs (9231) 11,117 29% $74,241 0.29 16.98 188.74 111.95
Administration of Environmental Quality
Programs (9241) 79 3% $65,706 0.11 5.86 157.33 43.59
Administration of Housing Programs, Urban
Planning, and Community Development
(9251)
2,031 ‐8% $72,637 0.25 14.99 143.46 98.38
Administration of Economic Program (9261) 8,352 42% $71,806 0.19 11.21 88.91 77.84
Space Research and Technology (9271) (s) (s) (s) (s) (s) (s) (s)
National Security and International Affairs
(9281) 411 ‐80% $77,895 0.26 13.36 100.12 (r)
Unclassified (9999) 32,600 183% $63,559 0.07 3.85 59.32 15.22
Sources: California Employment Development Department Establishment Database for Los Angeles County; California Energy Commission, Energy Consumption Database; IMPLAN economic simulation software and data for Los Angeles County; United States Environmental Protection Agency eGRID2012 Version 1.0 for electricity emissions and Greenhouse Gas Equivalencies Calculator for natural gas emissions; California MRIO-LCA model; The U.S. Economic Input-Output Life Cycle Assessment (EIO-LCA) model developed by Green Design Institute, Carnegie Mellon University; and Economic Roundtable model for estimating GHG emissions from vehicle operations for customer trips. See Appendix A.5.

C‐60
C.2.3 Economic and Environmental Ranking Data, San Fernando Valley
Summary of economic and environemtnal indicators data used to ranks industries in Los
Angeles County’s SCAG Subregions, by 3‐digit NAICS industry. Industries with five or fewer
establishments are suppressed as “(s)”; industires with anomalies in the U.S. EIO‐LCA model
used to estimate life cycle impacts are presented as “(r)”; industires with no employment are
presented with “‐“.
Table C.2.3: Economic and Environmental Ranking Data, San Fernando Valley
Industry Title
& 4‐Digit Coding
NAICS 2007 Employment 2011
Chan
ge in Employment
1996‐2011
Average Wage 2011
Direct terajoules per job
2011
Direct metric tons of
greenhouse gases per job
2011
Average gallons of
gasoline per job for public
trips 2011
GHG2011 L
ife cycle metric
tons of co2‐equivalent
emissions in 2011
Crop Production (111) 317 ‐52% $28,322 0.62 40.92 0.00 137.52
Animal Production (112) 57 194% $51,738 0.64 135.29 0.00 (r)
Forestry and Logging (113) (s) (s) (s) (s) (s) (s) (s)
Fishing, Hunting and Trapping
(114) (s) (s) (s) (s) (s) (s) (s)
Support Activities for Agriculture
and Forestry (115) 283 98% $30,205 0.03 0.44 0.00 74.07
Oil and Gas Extraction (211) 18 ‐92% $71,349 4.35 543.67 0.00 651.47
Mining (except Oil and Gas) (212) 84 ‐46% $80,013 2.16 5.29 0.00 205.25
Support Activities for Mining (213) 12 943% $113,172 1.74 0.06 0.00 445.54
Utilities (221) 1,915 0% $89,377 35.04 788.12 0.00 8397.05
Construction of Buildings (236) 7,193 1% $50,547 0.36 0.08 0.00 94.74
Heavy and Civil Engineering
Construction (237) 1,413 ‐31% $73,713 0.33 0.07 0.00 69.93
Specialty Trade Contractors (238) 299 ‐97% $43,756 23.05 5.23 0.00 4390.66
Food Manufacturing (311) 5,808 16% $60,119 0.31 7.63 78.44 832.00
Beverage and Tobacco Product
Manufacturing (312) 796 ‐44% $82,106 0.65 18.05 0.00 816.83
Textile Mills (313) 304 ‐46% $39,186 0.50 20.92 0.00 200.08
Textile Product Mills (314) 820 ‐7% $35,375 0.08 1.37 0.00 74.89
Apparel Manufacturing (315) 2,511 ‐73% $44,530 0.01 0.04 0.00 66.22
Leather and Allied Product
Manufacturing (316) 405 ‐61% $33,372 0.02 0.08 0.00 111.92
Wood Product Manufacturing (321) 508 ‐29% $35,277 0.04 0.19 0.00 69.51
Paper Manufacturing (322) 425 ‐39% $25,848 0.54 12.16 0.00 294.34
Printing and Related Support
Activities (323) 3,601 ‐43% $51,053 0.02 0.49 0.00 44.82
Petroleum and Coal Products
Manufacturing (324) 13 ‐90% $144,482 81.75 6911.44 0.00 (r)
Chemical Manufacturing (325) 5,724 9% $54,860 0.82 14.26 0.00 342.81

C‐61
Table C.2.3: Economic and Environmental Ranking Data, San Fernando Valley
Industry Title
& 4‐Digit Coding
NAICS 2007 Employment 2011
Chan
ge in Employment
1996‐2011
Average Wage 2011
Direct terajoules per job
2011
Direct metric tons of
greenhouse gases per job
2011
Average gallons of
gasoline per job for public
trips 2011
GHG2011 L
ife cycle metric
tons of co2‐equivalent
emissions in 2011
Plastics and Rubber Products
Manufacturing (326) 2,385 ‐35% $40,605 0.18 1.14 0.00 212.40
Nonmetallic Mineral Product
Manufacturing (327) 1,701 ‐28% $42,015 0.19 8.54 0.00 304.85
Primary Metal Manufacturing (331) 527 ‐49% $42,113 0.35 19.77 0.00 516.17
Fabricated Metal Product
Manufacturing (332) 10,900 ‐29% $51,382 0.16 2.39 0.00 161.93
Machinery Manufacturing (333) 5,093 ‐12% $71,580 0.12 0.67 0.00 170.26
Computer and Electronic Product
Manufacturing (334) 12,910 ‐28% $77,064 0.06 1.18 0.00 92.82
Electrical Equipment, Appliance,
and Component Manufacturing
(335)
2,168 ‐6% $62,738 0.10 0.70 0.00 133.83
Transportation Equipment
Manufacturing (336) 7,922 ‐28% $69,995 0.16 1.89 0.00 124.86
Furniture and Related Product
Manufacturing (337) 1,159 ‐39% $37,747 0.05 0.26 0.00 55.14
Miscellaneous Manufacturing (339) 5,645 ‐18% $61,463 0.05 1.57 0.00 59.74
Merchant Wholesalers, Durable
Goods (423) 16,954 ‐15% $60,878 0.03 0.11 0.00 30.78
Merchant Wholesalers, Nondurable
Goods (424) 9,302 ‐9% $52,465 0.03 0.11 0.00 30.78
Wholesale Electronic Markets and
Agents and Brokers (425) 3,450 14% $62,404 0.03 0.11 0.00 30.78
Motor Vehicle and Parts Dealers
(441) 9,672 ‐5% $49,255 0.05 0.14 442.61 20.32
Furniture and Home Furnishings
Stores (442) 3,068 ‐6% $26,624 0.04 0.10 244.01 14.87
Electronics and Appliance Stores
(443) 4,564 3% $64,433 0.06 0.16 424.80 22.79
Building Material and Garden
Equipment and Supplies Dealers
(444)
5,880 32% $31,650 0.04 0.11 475.54 16.01
Food and Beverage Stores (445) 18,849 34% $26,495 0.07 0.19 1605.27 19.30
Health and Personal Care Stores
(446) 6,603 46% $35,592 0.08 0.20 763.42 20.82
Gasoline Stations (447) 2,454 ‐7% $19,011 0.16 0.43 2780.60 51.99
Clothing and Clothing Accessories
Stores (448) 10,214 35% $17,379 0.03 0.09 405.76 13.07
Sporting Goods, Hobby, Book, and
Music Stores (451) 3,539 ‐11% $18,222 0.03 0.07 664.39 10.29
General Merchandise Stores (452) 15,746 26% $22,758 0.04 0.10 575.74 14.09
Miscellaneous Store Retailers (453) 5,826 1% $27,485 0.04 0.10 335.63 13.60
Nonstore Retailers (454) 1,858 ‐40% $42,384 0.07 0.18 105.60 26.16

C‐62
Table C.2.3: Economic and Environmental Ranking Data, San Fernando Valley
Industry Title
& 4‐Digit Coding
NAICS 2007 Employment 2011
Chan
ge in Employment
1996‐2011
Average Wage 2011
Direct terajoules per job
2011
Direct metric tons of
greenhouse gases per job
2011
Average gallons of
gasoline per job for public
trips 2011
GHG2011 L
ife cycle metric
tons of co2‐equivalent
emissions in 2011
Air Transportation (481) 1,223 23% $72,770 6.24 1442.02 251.79 (r)
Rail Transportation (482) (s) (s) (s) (s) (s) (s) (s)
Water Transportation (483) (s) (s) (s) (s) (s) (s) (s)
Truck Transportation (484) 2,155 ‐16% $34,992 1.50 343.18 0.00 (r)
Transit and Ground Passenger
Transportation (485) 3,400 67% $38,600 0.71 126.82 28.28 223.84
Pipeline Transportation (486) 84 ‐30% $102,054 2.75 136.52 0.00 3695.44
Scenic and Sightseeing
Transportation (487) 367 81% $36,412 0.10 12.30 70.35 34.23
Support Activities for
Transportation (488) 2,198 11% $50,325 0.09 11.00 25.62 25.08
Postal Service (491) 3,854 5% $59,802 0.02 2.38 439.02 13.85
Couriers and Messengers (492) 2,884 ‐29% $41,247 0.93 210.86 420.70 (r)
Warehousing and Storage (493) 769 48% $49,250 0.05 3.89 0.00 47.21
Publishing Industries (except
Internet) (511) 2,195 ‐55% $78,492 0.01 0.00 0.00 40.03
Motion Picture and Sound
Recording Industries (512) 82,776 0% $80,922 0.02 0.01 12.19 35.01
Broadcasting (except Internet) (515) 5,863 ‐2% $118,852 0.12 0.18 0.00 167.32
Telecommunications (517) 5,145 0% $82,048 0.14 0.20 0.00 51.53
Data Processing, Hosting and
Related Services (518) 831 ‐35% $66,893 0.02 0.01 0.00 59.12
Other Information Services (519) 1,472 349% $92,647 0.02 0.01 144.93 29.40
Monetary Authorities‐Central Bank
(521) 71 999% $108,601 0.01 0.09 0.00 21.79
Credit Intermediation and Related
Activities (522) 13,548 ‐15% $56,175 0.01 0.07 760.20 15.38
Securities, Commodity Contracts,
and Other Financial Investments
and Related Activities (523)
2,457 24% $103,913 0.01 0.02 23.64 11.80
Insurance Carriers and Related
Activities (524) 16,245 ‐24% $83,911 0.01 0.04 27.19 15.27
Funds, Trusts, and Other Financial
Vehicles (525) 848 16% $66,094 0.00 0.00 19.68 23.97
Real Estate (531) 10,442 2% $47,042 0.05 0.22 29.09 35.08
Rental and Leasing Services (532) 6,358 20% $46,661 0.01 0.06 316.53 7.65
Lessors of Nonfinancial Intangible
Assets (except Copyrighted
Works) (533)
336 41% $98,109 0.67 6.88 0.00 296.60
Professional, Scientific, and
Technical Services (541) 47,983 17% $70,800 0.02 0.09 19.79 25.64

C‐63
Table C.2.3: Economic and Environmental Ranking Data, San Fernando Valley
Industry Title
& 4‐Digit Coding
NAICS 2007 Employment 2011
Chan
ge in Employment
1996‐2011
Average Wage 2011
Direct terajoules per job
2011
Direct metric tons of
greenhouse gases per job
2011
Average gallons of
gasoline per job for public
trips 2011
GHG2011 L
ife cycle metric
tons of co2‐equivalent
emissions in 2011
Management of Companies and
Enterprises (551) 6,796 ‐38% $87,690 0.04 0.00 0.00 25.66
Administrative and Support
Services (561) 50,970 0% $34,415 0.01 0.27 35.90 12.06
Waste Management and
Remediation Services (562) 1,624 15% $54,288 0.03 42.60 83.97 485.13
Educational Services (611) 55,079 82% $45,270 0.04 0.80 146.86 30.26
Ambulatory Health Care Services
(621) 48,418 55% $53,615 0.02 0.52 207.51 18.81
Hospitals (622) 20,533 ‐2% $63,650 0.08 0.49 126.54 49.53
Nursing and Residential Care
Facilities (623) 15,334 78% $30,729 0.06 2.10 107.55 15.97
Social Assistance (624) 12,744 103% $26,406 0.01 0.51 107.58 9.76
Performing Arts, Spectator Sports,
and Related Industries (711) 7,659 54% $217,739 0.01 0.06 32.58 19.01
Museums, Historical Sites, and
Similar Institutions (712) 217 363% $35,719 0.12 0.98 155.11 98.44
Amusement, Gambling, and
Recreation Industries (713) 8,310 20% $30,804 0.02 0.27 258.57 29.17
Accommodation (721) 3,739 ‐2% $26,987 0.15 4.00 250.30 33.30
Food Services and Drinking Places
(722) 55,456 24% $17,271 0.07 2.10 1545.61 25.28
Repair and Maintenance (811) 8,070 ‐11% $30,533 0.02 1.19 460.86 27.62
Personal and Laundry Services (812) 8,916 8% $25,985 0.02 1.03 229.15 24.75
Religious, Grantmaking, Civic,
Professional, and Similar
Organizations (813)
6,344 ‐19% $47,053 0.05 3.34 356.35 34.43
Private Households (814) 33,783 816% $12,207 0.00 0.00 0.00 0.00
Executive, Legislative, and Other
General Government Support
(921)
1,752 ‐47% $72,792 0.25 14.99 122.46 98.38
Justice, Public Order, and Safety
Activities (922) 1,093 12% $97,265 0.41 24.05 162.22 283.17
Administration of Human Resource
Programs (923) 1,352 108% $71,479 0.18 10.60 188.74 73.34
Administration of Environmental
Quality Programs (924) 80 18% $51,730 0.18 10.29 109.68 70.21
Administration of Housing
Programs, Urban Planning, and
Community Development (925)
(s) (s) (s) (s) (s) (s) (s)
Administration of Economic
Programs (926) 398 ‐31% $30,313 0.44 25.48 186.09 171.52
Space Research and Technology
(927) (s) (s) (s) (s) (s) (s) (s)

C‐64
Table C.2.3: Economic and Environmental Ranking Data, San Fernando Valley
Industry Title
& 4‐Digit Coding
NAICS 2007 Employment 2011
Chan
ge in Employment
1996‐2011
Average Wage 2011
Direct terajoules per job
2011
Direct metric tons of
greenhouse gases per job
2011
Average gallons of
gasoline per job for public
trips 2011
GHG2011 L
ife cycle metric
tons of co2‐equivalent
emissions in 2011
National Security and International
Affairs (928) (s) (s) (s) (s) (s) (s) (s)
Unclassified (999) 25,397 165% $59,299 0.05 2.47 38.05 9.76
Sources: California Employment Development Department Establishment Database for Los Angeles County; California Energy Commission, Energy Consumption Database; IMPLAN economic simulation software and data for Los Angeles County; United States Environmental Protection Agency eGRID2012 Version 1.0 for electricity emissions and Greenhouse Gas Equivalencies Calculator for natural gas emissions; California MRIO-LCA model; The U.S. Economic Input-Output Life Cycle Assessment (EIO-LCA) model developed by Green Design Institute, Carnegie Mellon University; and Economic Roundtable model for estimating GHG emissions from vehicle operations for customer trips. See Appendix A.5.

C‐65
C.2.4 Economic and Environmental Ranking Data, North L.A. County
Summary of economic and environemtnal indicators data used to ranks industries in Los
Angeles County’s SCAG Subregions, by 3‐digit NAICS industry. Industries with five or fewer
establishments are suppressed as “(s)”; industires with anomalies in the U.S. EIO‐LCA model
used to estimate life cycle impacts are presented as “(r)”; industires with no employment are
presented with “‐“.
Table C.2.4: Economic and Environmental Ranking Data, North L.A. County
Industry Title
& 4‐Digit Coding
NAICS 2007 Employment 2011
Chan
ge in Employment
1996‐2011
Average Wage 2011
Direct terajoules per job
2011
Direct metric tons of
greenhouse gases per job
2011
Average gallons of gasoline
per job for public trips 2011
GHG2011 L
ife cycle metric
tons of co2‐equivalent
emissions in 2011
Crop Production (111) 281 ‐2% $27,526 0.60 60.96 0.00 198.95
Animal Production (112) 56 13% $22,638 0.31 133.95 0.00 (r)
Forestry and Logging (113) (s) (s) (s) (s) (s) (s) (s)
Fishing, Hunting and Trapping (114) (s) (s) (s) (s) (s) (s) (s)
Support Activities for Agriculture
and Forestry (115) 47 ‐53% $15,038 0.03 0.35 0.00 73.98
Oil and Gas Extraction (211) (s) (s) (s) (s) (s) (s) (s)
Mining (except Oil and Gas) (212) (s) (s) (s) (s) (s) (s) (s)
Support Activities for Mining (213) (s) (s) (s) (s) (s) (s) (s)
Utilities (221) 609 48% $86,104 33.19 741.58 0.00 7282.36
Construction of Buildings (236) 563 ‐1% $44,008 0.37 0.08 0.00 100.80
Heavy and Civil Engineering
Construction (237) 209 ‐20% $60,997 0.33 0.07 0.00 69.92
Specialty Trade Contractors (238) . ‐ $45,255 0.00 0.00 0.00 0.00
Food Manufacturing (311) 26 ‐74% $38,828 0.13 3.34 228.82 267.47
Beverage and Tobacco Product
Manufacturing (312) 76 999% $39,809 0.21 4.59 0.00 421.64
Textile Mills (313) (s) (s) (s) (s) (s) (s) (s)
Textile Product Mills (314) (s) (s) (s) (s) (s) (s) (s)
Apparel Manufacturing (315) 23 ‐70% $21,188 0.01 0.03 0.00 83.20
Leather and Allied Product
Manufacturing (316) (s) (s) (s) (s) (s) (s) (s)
Wood Product Manufacturing (321) 27 113% $20,596 0.04 0.16 0.00 69.54
Paper Manufacturing (322) (s) (s) (s) (s) (s) (s) (s)
Printing and Related Support
Activities (323) 355 315% $32,440 0.02 0.52 0.00 47.09
Petroleum and Coal Products
Manufacturing (324) (s) (s) (s) (s) (s) (s) (s)
Chemical Manufacturing (325) 53 2558% $61,054 0.39 5.24 0.00 345.58
Plastics and Rubber Products
Manufacturing (326) (s) (s) (s) (s) (s) (s) (s)

C‐66
Table C.2.4: Economic and Environmental Ranking Data, North L.A. County
Industry Title
& 4‐Digit Coding
NAICS 2007 Employment 2011
Chan
ge in Employment
1996‐2011
Average Wage 2011
Direct terajoules per job
2011
Direct metric tons of
greenhouse gases per job
2011
Average gallons of gasoline
per job for public trips 2011
GHG2011 L
ife cycle metric
tons of co2‐equivalent
emissions in 2011
Nonmetallic Mineral Product
Manufacturing (327) 139 ‐11% $42,960 0.13 4.82 0.00 860.91
Primary Metal Manufacturing (331) (s) (s) (s) (s) (s) (s) (s)
Fabricated Metal Product
Manufacturing (332) 363 ‐50% $32,338 0.26 4.54 0.00 222.88
Machinery Manufacturing (333) 216 139% $56,164 0.13 0.60 0.00 154.42
Computer and Electronic Product
Manufacturing (334) 2,748 451% $93,712 0.08 0.38 0.00 83.96
Electrical Equipment, Appliance, and
Component Manufacturing (335) 175 79% $35,980 0.04 0.29 0.00 84.68
Transportation Equipment
Manufacturing (336) 3,642 ‐59% $98,324 0.10 0.94 0.00 150.62
Furniture and Related Product
Manufacturing (337) 65 118% $34,315 0.03 0.19 0.00 37.42
Miscellaneous Manufacturing (339) 69 18% $29,822 0.04 1.38 0.00 46.77
Merchant Wholesalers, Durable
Goods (423) 605 32% $35,957 0.03 0.11 0.00 30.78
Merchant Wholesalers, Nondurable
Goods (424) 369 30% $44,727 0.03 0.11 0.00 30.78
Wholesale Electronic Markets and
Agents and Brokers (425) 87 30% $41,117 0.03 0.11 0.00 30.78
Motor Vehicle and Parts Dealers
(441) 1,450 ‐8% $36,333 0.05 0.14 444.66 20.32
Furniture and Home Furnishings
Stores (442) 173 ‐38% $26,454 0.04 0.10 246.23 14.87
Electronics and Appliance Stores
(443) 287 ‐12% $20,420 0.06 0.16 424.49 22.79
Building Material and Garden
Equipment and Supplies Dealers
(444)
862 73% $27,036 0.04 0.11 446.11 16.01
Food and Beverage Stores (445) 2,677 48% $22,843 0.07 0.19 1498.98 19.30
Health and Personal Care Stores
(446) 684 22% $34,676 0.08 0.20 762.13 20.82
Gasoline Stations (447) 485 27% $16,458 0.18 0.47 3039.24 52.67
Clothing and Clothing Accessories
Stores (448) 971 62% $14,485 0.03 0.09 405.76 13.07
Sporting Goods, Hobby, Book, and
Music Stores (451) 504 1% $13,317 0.03 0.07 588.42 10.29
General Merchandise Stores (452) 3,720 65% $21,114 0.04 0.10 630.13 14.09
Miscellaneous Store Retailers (453) 444 ‐11% $17,457 0.04 0.10 315.57 13.60
Nonstore Retailers (454) 89 8% $23,620 0.07 0.18 139.30 26.16
Air Transportation (481) (s) (s) (s) (s) (s) (s) (s)
Rail Transportation (482) (s) (s) (s) (s) (s) (s) (s)

C‐67
Table C.2.4: Economic and Environmental Ranking Data, North L.A. County
Industry Title
& 4‐Digit Coding
NAICS 2007 Employment 2011
Chan
ge in Employment
1996‐2011
Average Wage 2011
Direct terajoules per job
2011
Direct metric tons of
greenhouse gases per job
2011
Average gallons of gasoline
per job for public trips 2011
GHG2011 L
ife cycle metric
tons of co2‐equivalent
emissions in 2011
Water Transportation (483) (s) (s) (s) (s) (s) (s) (s)
Truck Transportation (484) 296 25% $28,914 1.50 343.18 0.00 (r)
Transit and Ground Passenger
Transportation (485) 553 ‐7% $28,252 0.71 126.82 27.90 223.84
Pipeline Transportation (486) (s) (s) (s) (s) (s) (s) (s)
Scenic and Sightseeing
Transportation (487) (s) (s) (s) (s) (s) (s) (s)
Support Activities for Transportation
(488) 129 26% $34,877 0.10 11.58 11.90 18.68
Postal Service (491) 303 ‐8% $57,019 0.02 2.38 439.02 13.85
Couriers and Messengers (492) 273 86% $37,953 0.93 210.86 420.70 (r)
Warehousing and Storage (493) 1,140 4718% $42,478 0.05 3.89 0.00 47.21
Publishing Industries (except
Internet) (511) 213 ‐34% $35,040 0.01 0.00 0.00 31.68
Motion Picture and Sound Recording
Industries (512) 180 21% $16,138 0.02 0.01 1231.35 33.59
Broadcasting (except Internet) (515) 83 52% $47,029 0.10 0.14 0.00 135.32
Telecommunications (517) 263 ‐18% $61,474 0.14 0.20 0.00 51.53
Data Processing, Hosting and
Related Services (518) (s) (s) (s) (s) (s) (s) (s)
Other Information Services (519) (s) (s) (s) (s) (s) (s) (s)
Monetary Authorities‐Central Bank
(521) (s) (s) (s) (s) (s) (s) (s)
Credit Intermediation and Related
Activities (522) 2,936 215% $34,191 0.01 0.06 561.27 13.32
Securities, Commodity Contracts,
and Other Financial Investments
and Related Activities (523)
59 34% $50,136 0.01 0.02 24.56 11.80
Insurance Carriers and Related
Activities (524) 587 47% $40,664 0.01 0.08 20.16 13.46
Funds, Trusts, and Other Financial
Vehicles (525) (s) (s) (s) (s) (s) (s) (s)
Real Estate (531) 573 ‐10% $26,480 0.05 0.22 25.75 35.08
Rental and Leasing Services (532) 248 22% $37,480 0.00 0.05 254.51 7.21
Lessors of Nonfinancial Intangible
Assets (except Copyrighted
Works) (533)
(s) (s) (s) (s) (s) (s) (s)
Professional, Scientific, and Technical
Services (541) 1,734 43% $41,307 0.02 0.10 42.56 25.10
Management of Companies and
Enterprises (551) 135 657% $58,879 0.04 0.00 0.00 25.66
Administrative and Support Services
(561) 1,913 49% $24,464 0.02 0.25 65.54 16.56

C‐68
Table C.2.4: Economic and Environmental Ranking Data, North L.A. County
Industry Title
& 4‐Digit Coding
NAICS 2007 Employment 2011
Chan
ge in Employment
1996‐2011
Average Wage 2011
Direct terajoules per job
2011
Direct metric tons of
greenhouse gases per job
2011
Average gallons of gasoline
per job for public trips 2011
GHG2011 L
ife cycle metric
tons of co2‐equivalent
emissions in 2011
Waste Management and Remediation
Services (562) 196 ‐36% $53,747 0.03 42.60 295.22 485.13
Educational Services (611) 9,872 ‐8% $45,175 0.03 0.67 151.42 24.90
Ambulatory Health Care Services
(621) 4,979 76% $57,044 0.02 0.44 215.16 17.45
Hospitals (622) 3,273 22% $61,304 0.08 0.49 126.54 49.53
Nursing and Residential Care
Facilities (623) 1,397 13% $28,152 0.06 2.10 108.71 15.97
Social Assistance (624) 1,403 166% $25,181 0.01 0.54 93.51 9.82
Performing Arts, Spectator Sports,
and Related Industries (711) 213 1% $33,816 0.01 0.05 117.19 15.62
Museums, Historical Sites, and
Similar Institutions (712) 38 61% $26,437 0.12 0.98 370.97 98.44
Amusement, Gambling, and
Recreation Industries (713) 551 24% $14,828 0.02 0.24 348.62 25.65
Accommodation (721) 948 32% $24,209 0.15 3.86 271.18 34.54
Food Services and Drinking Places
(722) 6,672 22% $14,996 0.07 2.10 1939.31 25.28
Repair and Maintenance (811) 708 ‐17% $29,329 0.02 1.02 370.92 27.25
Personal and Laundry Services (812) 581 ‐11% $18,283 0.02 1.16 308.87 25.52
Religious, Grantmaking, Civic,
Professional, and Similar
Organizations (813)
398 ‐58% $20,372 0.04 2.67 309.22 32.15
Private Households (814) 2,964 853% $14,090 0.00 0.00 0.00 0.00
Executive, Legislative, and Other
General Government Support (921) (s) (s) (s) (s) (s) (s) (s)
Justice, Public Order, and Safety
Activities (922) 1,545 38% $45,261 0.22 12.77 24.36 150.44
Administration of Human Resource
Programs (923) (s) (s) (s) (s) (s) (s) (s)
Administration of Environmental
Quality Programs (924) 208 ‐4% $42,982 0.10 5.45 161.66 41.17
Administration of Housing
Programs, Urban Planning, and
Community Development (925)
(s) (s) (s) (s) (s) (s) (s)
Administration of Economic
Programs (926) 131 85% $36,545 0.08 3.89 184.31 34.57
Space Research and Technology (927) (s) (s) (s) (s) (s) (s) (s)
National Security and International
Affairs (928) (s) (s) (s) (s) (s) (s) (s)
Unclassified (999) 2,370 206% $27,498 0.03 1.52 23.49 6.03

C‐69
Sources: California Employment Development Department Establishment Database for Los Angeles County; California Energy Commission, Energy Consumption Database; IMPLAN economic simulation software and data for Los Angeles County; United States Environmental Protection Agency eGRID2012 Version 1.0 for electricity emissions and Greenhouse Gas Equivalencies Calculator for natural gas emissions; California MRIO-LCA model; The U.S. Economic Input-Output Life Cycle Assessment (EIO-LCA) model developed by Green Design Institute, Carnegie Mellon University; and Economic Roundtable model for estimating GHG emissions from vehicle operations for customer trips. See Appendix A.5.

C‐70
C.2.5 Economic and Environmental Ranking Data, L.A. City Metro
Summary of economic and environemtnal indicators data used to ranks industries in Los
Angeles County’s SCAG Subregions, by 3‐digit NAICS industry. Industries with five or fewer
establishments are suppressed as “(s)”; industires with anomalies in the U.S. EIO‐LCA model
used to estimate life cycle impacts are presented as “(r)”; industires with no employment are
presented with “‐“.
Table C.2.5: Economic and Environmental Ranking Data, L.A. City Metro
Industry Title
& 4‐Digit Coding
NAICS 2007 Employment 2011
Chan
ge in Employment
1996‐2011
Average Wage 2011
Direct terajoules per job 2011
Direct metric tons of
greenhouse gases per job
2011
Average gallons of gasoline
per job for public trips 2011
GHG2011 L
ife cycle metric
tons of co2‐equivalent
emissions in 2011
Crop Production (111) 1,088 183% $25,510 0.60 47.07 0.00 155.87
Animal Production (112) 56 346% $45,200 0.20 96.73 0.00 (r)
Forestry and Logging (113) (s) (s) (s) (s) (s) (s) (s)
Fishing, Hunting and Trapping (114) 35 ‐84% $135,820 0.65 12.83 0.00 (r)
Support Activities for Agriculture
and Forestry (115) 167 ‐67% $34,863 0.03 0.45 0.00 74.08
Oil and Gas Extraction (211) 508 22% $512,967 4.35 543.67 0.00 651.47
Mining (except Oil and Gas) (212) 81 ‐ $56,649 1.63 3.31 0.00 170.15
Support Activities for Mining (213) 601 2456% $127,338 1.63 0.06 0.00 418.24
Utilities (221) 13,066 ‐2% $104,758 57.84 1099.88 0.00 11642.83
Construction of Buildings (236) 4,752 6% $60,224 0.37 0.08 0.00 97.73
Heavy and Civil Engineering
Construction (237) 3,469 ‐47% $71,254 0.33 0.07 0.00 69.93
Specialty Trade Contractors (238) ‐ ‐ $46,814 0.00 0.00 0.00 0.00
Food Manufacturing (311) 7,369 ‐31% $37,531 0.20 4.95 78.19 360.95
Beverage and Tobacco Product
Manufacturing (312) 1,478 85% $55,539 0.26 5.80 0.00 533.25
Textile Mills (313) 2,414 ‐43% $35,272 0.46 20.86 0.00 161.96
Textile Product Mills (314) 770 ‐73% $35,388 0.16 2.40 0.00 98.69
Apparel Manufacturing (315) 23,347 ‐55% $29,092 0.01 0.05 0.00 39.96
Leather and Allied Product
Manufacturing (316) 239 ‐66% $33,346 0.04 0.14 0.00 172.32
Wood Product Manufacturing (321) 457 ‐22% $26,425 0.03 0.17 0.00 68.34
Paper Manufacturing (322) 474 ‐73% $49,029 0.37 9.48 0.00 267.27
Printing and Related Support
Activities (323) 2,876 ‐56% $41,839 0.02 0.51 0.00 46.25
Petroleum and Coal Products
Manufacturing (324) 1,387 35% $121,182 190.11 15193.21 0.00 (r)
Chemical Manufacturing (325) 3,823 ‐28% $68,513 0.71 26.32 0.00 365.18
Plastics and Rubber Products
Manufacturing (326) 579 ‐69% $39,090 0.18 1.55 0.00 181.21

C‐71
Table C.2.5: Economic and Environmental Ranking Data, L.A. City Metro
Industry Title
& 4‐Digit Coding
NAICS 2007 Employment 2011
Chan
ge in Employment
1996‐2011
Average Wage 2011
Direct terajoules per job 2011
Direct metric tons of
greenhouse gases per job
2011
Average gallons of gasoline
per job for public trips 2011
GHG2011 L
ife cycle metric
tons of co2‐equivalent
emissions in 2011
Nonmetallic Mineral Product
Manufacturing (327) 749 ‐39% $37,847 0.21 13.23 0.00 397.60
Primary Metal Manufacturing (331) 339 ‐70% $52,734 0.28 8.16 0.00 728.79
Fabricated Metal Product
Manufacturing (332) 3,867 ‐43% $46,326 0.21 3.28 0.00 194.31
Machinery Manufacturing (333) 653 ‐53% $45,363 0.08 0.50 0.00 113.78
Computer and Electronic Product
Manufacturing (334) 2,614 ‐41% $66,664 0.07 1.31 0.00 83.64
Electrical Equipment, Appliance, and
Component Manufacturing (335) 1,084 ‐39% $77,733 0.06 0.37 0.00 115.94
Transportation Equipment
Manufacturing (336) 1,422 ‐43% $130,388 0.17 2.00 0.00 173.75
Furniture and Related Product
Manufacturing (337) 2,300 ‐50% $31,116 0.04 0.19 0.00 49.04
Miscellaneous Manufacturing (339) 2,462 ‐50% $36,498 0.04 1.36 0.00 65.07
Merchant Wholesalers, Durable
Goods (423) 14,547 ‐25% $52,547 0.03 0.11 0.00 30.78
Merchant Wholesalers, Nondurable
Goods (424) 28,442 16% $49,073 0.03 0.11 0.00 30.78
Wholesale Electronic Markets and
Agents and Brokers (425) 5,484 194% $58,786 0.03 0.11 0.00 30.78
Motor Vehicle and Parts Dealers (441) 4,504 ‐41% $41,000 0.05 0.14 525.99 20.32
Furniture and Home Furnishings
Stores (442) 2,738 ‐9% $34,367 0.04 0.10 235.30 14.87
Electronics and Appliance Stores
(443) 3,194 3% $71,454 0.06 0.16 424.40 22.79
Building Material and Garden
Equipment and Supplies Dealers
(444)
3,527 52% $32,529 0.04 0.11 499.02 16.01
Food and Beverage Stores (445) 19,630 25% $26,481 0.07 0.19 1517.07 19.30
Health and Personal Care Stores (446) 6,124 15% $39,032 0.08 0.20 786.65 20.82
Gasoline Stations (447) 2,186 ‐15% $21,097 0.16 0.42 2742.36 51.89
Clothing and Clothing Accessories
Stores (448) 15,293 66% $27,149 0.03 0.09 405.76 13.07
Sporting Goods, Hobby, Book, and
Music Stores (451) 3,562 ‐21% $32,843 0.03 0.07 749.46 10.29
General Merchandise Stores (452) 10,095 16% $24,905 0.04 0.10 532.16 14.09
Miscellaneous Store Retailers (453) 6,504 17% $31,290 0.04 0.10 345.58 13.60
Nonstore Retailers (454) 2,412 75% $69,845 0.07 0.18 81.54 26.16
Air Transportation (481) 15,157 ‐43% $61,467 6.24 1442.02 242.23 (r)
Rail Transportation (482) (s) (s) (s) (s) (s) (s) (s)
Water Transportation (483) 923 52% $61,560 0.33 76.18 47.10 1178.16
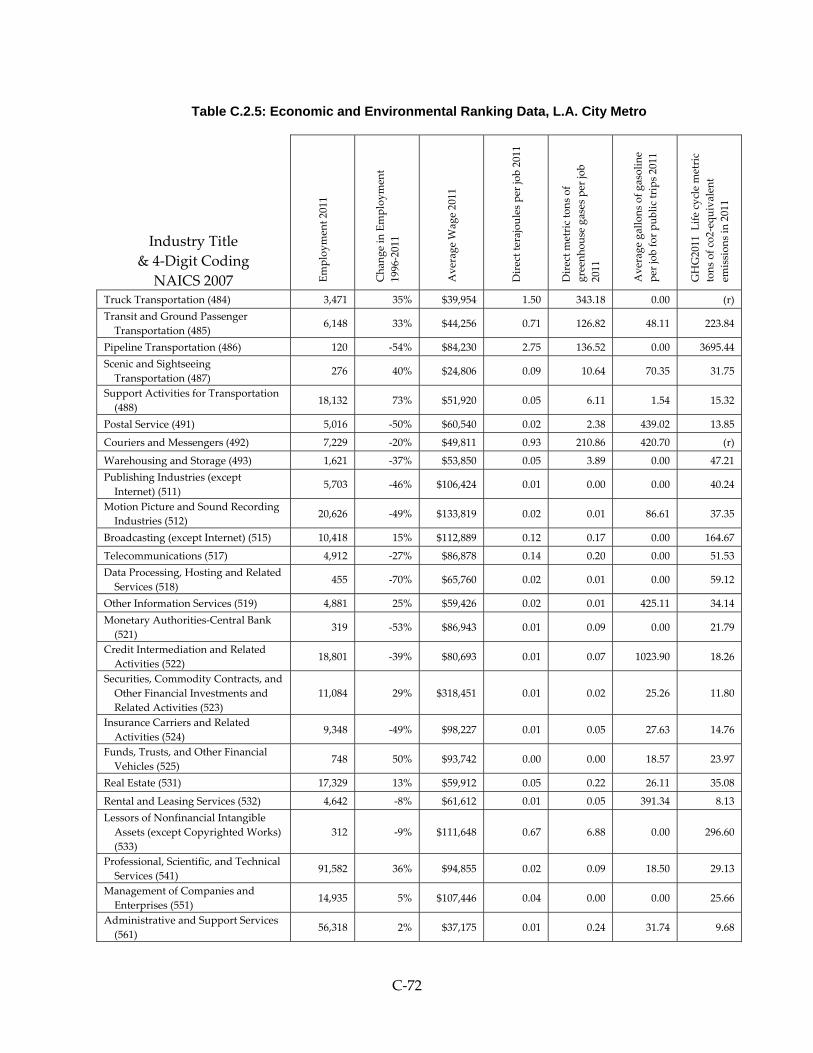
C‐72
Table C.2.5: Economic and Environmental Ranking Data, L.A. City Metro
Industry Title
& 4‐Digit Coding
NAICS 2007 Employment 2011
Chan
ge in Employment
1996‐2011
Average Wage 2011
Direct terajoules per job 2011
Direct metric tons of
greenhouse gases per job
2011
Average gallons of gasoline
per job for public trips 2011
GHG2011 L
ife cycle metric
tons of co2‐equivalent
emissions in 2011
Truck Transportation (484) 3,471 35% $39,954 1.50 343.18 0.00 (r)
Transit and Ground Passenger
Transportation (485) 6,148 33% $44,256 0.71 126.82 48.11 223.84
Pipeline Transportation (486) 120 ‐54% $84,230 2.75 136.52 0.00 3695.44
Scenic and Sightseeing
Transportation (487) 276 40% $24,806 0.09 10.64 70.35 31.75
Support Activities for Transportation
(488) 18,132 73% $51,920 0.05 6.11 1.54 15.32
Postal Service (491) 5,016 ‐50% $60,540 0.02 2.38 439.02 13.85
Couriers and Messengers (492) 7,229 ‐20% $49,811 0.93 210.86 420.70 (r)
Warehousing and Storage (493) 1,621 ‐37% $53,850 0.05 3.89 0.00 47.21
Publishing Industries (except
Internet) (511) 5,703 ‐46% $106,424 0.01 0.00 0.00 40.24
Motion Picture and Sound Recording
Industries (512) 20,626 ‐49% $133,819 0.02 0.01 86.61 37.35
Broadcasting (except Internet) (515) 10,418 15% $112,889 0.12 0.17 0.00 164.67
Telecommunications (517) 4,912 ‐27% $86,878 0.14 0.20 0.00 51.53
Data Processing, Hosting and Related
Services (518) 455 ‐70% $65,760 0.02 0.01 0.00 59.12
Other Information Services (519) 4,881 25% $59,426 0.02 0.01 425.11 34.14
Monetary Authorities‐Central Bank
(521) 319 ‐53% $86,943 0.01 0.09 0.00 21.79
Credit Intermediation and Related
Activities (522) 18,801 ‐39% $80,693 0.01 0.07 1023.90 18.26
Securities, Commodity Contracts, and
Other Financial Investments and
Related Activities (523)
11,084 29% $318,451 0.01 0.02 25.26 11.80
Insurance Carriers and Related
Activities (524) 9,348 ‐49% $98,227 0.01 0.05 27.63 14.76
Funds, Trusts, and Other Financial
Vehicles (525) 748 50% $93,742 0.00 0.00 18.57 23.97
Real Estate (531) 17,329 13% $59,912 0.05 0.22 26.11 35.08
Rental and Leasing Services (532) 4,642 ‐8% $61,612 0.01 0.05 391.34 8.13
Lessors of Nonfinancial Intangible
Assets (except Copyrighted Works)
(533)
312 ‐9% $111,648 0.67 6.88 0.00 296.60
Professional, Scientific, and Technical
Services (541) 91,582 36% $94,855 0.02 0.09 18.50 29.13
Management of Companies and
Enterprises (551) 14,935 5% $107,446 0.04 0.00 0.00 25.66
Administrative and Support Services
(561) 56,318 2% $37,175 0.01 0.24 31.74 9.68

C‐73
Table C.2.5: Economic and Environmental Ranking Data, L.A. City Metro
Industry Title
& 4‐Digit Coding
NAICS 2007 Employment 2011
Chan
ge in Employment
1996‐2011
Average Wage 2011
Direct terajoules per job 2011
Direct metric tons of
greenhouse gases per job
2011
Average gallons of gasoline
per job for public trips 2011
GHG2011 L
ife cycle metric
tons of co2‐equivalent
emissions in 2011
Waste Management and Remediation
Services (562) 657 0% $41,295 0.03 42.60 9.72 485.13
Educational Services (611) 122,717 ‐30% $56,204 0.06 1.19 127.62 44.38
Ambulatory Health Care Services
(621) 36,913 43% $59,361 0.02 0.48 216.62 18.12
Hospitals (622) 50,973 14% $68,035 0.08 0.49 126.54 49.53
Nursing and Residential Care
Facilities (623) 14,667 8% $33,485 0.06 2.10 106.83 15.97
Social Assistance (624) 25,678 7% $41,152 0.01 0.56 82.25 9.83
Performing Arts, Spectator Sports,
and Related Industries (711) 11,081 69% $192,906 0.01 0.05 61.12 16.31
Museums, Historical Sites, and
Similar Institutions (712) 3,142 53% $47,715 0.12 0.98 56.84 98.44
Amusement, Gambling, and
Recreation Industries (713) 13,579 11% $26,808 0.02 0.22 343.01 23.03
Accommodation (721) 14,703 ‐6% $31,775 0.15 4.01 257.52 33.11
Food Services and Drinking Places
(722) 79,791 47% $19,470 0.07 2.10 1410.42 25.28
Repair and Maintenance (811) 8,036 ‐8% $34,465 0.02 1.13 396.16 28.62
Personal and Laundry Services (812) 14,447 25% $27,003 0.02 1.04 154.07 24.16
Religious, Grantmaking, Civic,
Professional, and Similar
Organizations (813)
26,966 9% $47,548 0.03 2.36 179.23 29.70
Private Households (814) 35,689 322% $14,417 0.00 0.00 0.00 0.00
Executive, Legislative, and Other
General Government Support (921) 21,310 ‐62% $63,609 0.25 14.99 151.36 98.38
Justice, Public Order, and Safety
Activities (922) 62,013 37% $84,749 0.28 16.57 186.70 195.12
Administration of Human Resource
Programs (923) 10,126 21% $74,110 0.30 17.94 188.74 117.79
Administration of Environmental
Quality Programs (924) 47 ‐38% $96,814 0.14 7.79 136.63 55.15
Administration of Housing Programs,
Urban Planning, and Community
Development (925)
2,031 ‐8% $72,637 0.25 14.99 143.46 98.38
Administration of Economic
Programs (926) 8,012 44% $73,687 0.18 10.52 84.66 73.33
Space Research and Technology (927) (s) (s) (s) (s) (s) (s) (s)
National Security and International
Affairs (928) 411 ‐80% $77,895 0.26 13.36 100.12 (r)
Unclassified (999) 15,075 228% $61,838 0.10 5.51 84.87 21.77

C‐74
Sources: California Employment Development Department Establishment Database for Los Angeles County; California Energy Commission, Energy Consumption Database; IMPLAN economic simulation software and data for Los Angeles County; United States Environmental Protection Agency eGRID2012 Version 1.0 for electricity emissions and Greenhouse Gas Equivalencies Calculator for natural gas emissions; California MRIO-LCA model; The U.S. Economic Input-Output Life Cycle Assessment (EIO-LCA) model developed by Green Design Institute, Carnegie Mellon University; and Economic Roundtable model for estimating GHG emissions from vehicle operations for customer trips. See Appendix A.5.

C‐75
C.2.6 Economic and Environmental Ranking Data, Arroyo Verdugo
Summary of economic and environemtnal indicators data used to ranks industries in Los
Angeles County’s SCAG Subregions, by 3‐digit NAICS industry. Industries with five or fewer
establishments are suppressed as “(s)”; industires with anomalies in the U.S. EIO‐LCA model
used to estimate life cycle impacts are presented as “(r)”; industires with no employment are
presented with “‐“.
Table C.2.6: Economic and Environmental Ranking Data, Arroyo Verdugo
Industry Title
& 4‐Digit Coding
NAICS 2007 Employment 2011
Chan
ge in Employment
1996‐2011
Average Wage 2011
Direct terajoules per job
2011
Direct metric tons of
greenhouse gases per job
2011
Average gallons of gasoline
per job for public trips 2011
GHG2011 L
ife cycle metric
tons of co2‐equivalent
emissions in 2011
Crop Production (111) (s) (s) (s) (s) (s) (s) (s)
Animal Production (112) (s) (s) (s) (s) (s) (s) (s)
Forestry and Logging (113) (s) (s) (s) (s) (s) (s) (s)
Fishing, Hunting and Trapping
(114) (s) (s) (s) (s) (s) (s) (s)
Support Activities for Agriculture
and Forestry (115) (s) (s) (s) (s) (s) (s) (s)
Oil and Gas Extraction (211) (s) (s) (s) (s) (s) (s) (s)
Mining (except Oil and Gas) (212) (s) (s) (s) (s) (s) (s) (s)
Support Activities for Mining (213) (s) (s) (s) (s) (s) (s) (s)
Utilities (221) 63 14% $76,902 1.50 258.59 0.00 1177.19
Construction of Buildings (236) 161 34% $36,356 0.38 0.08 0.00 107.15
Heavy and Civil Engineering
Construction (237) 28 ‐41% $105,249 0.33 0.07 0.00 69.93
Specialty Trade Contractors (238) . ‐ $36,075 0.00 0.00 0.00 0.00
Food Manufacturing (311) (s) (s) (s) (s) (s) (s) (s)
Beverage and Tobacco Product
Manufacturing (312) (s) (s) (s) (s) (s) (s) (s)
Textile Mills (313) (s) (s) (s) (s) (s) (s) (s)
Textile Product Mills (314) (s) (s) (s) (s) (s) (s) (s)
Apparel Manufacturing (315) 32 ‐54% $18,349 0.01 0.04 0.00 31.65
Leather and Allied Product
Manufacturing (316) (s) (s) (s) (s) (s) (s) (s)
Wood Product Manufacturing (321) (s) (s) (s) (s) (s) (s) (s)
Paper Manufacturing (322) (s) (s) (s) (s) (s) (s) (s)
Printing and Related Support
Activities (323) (s) (s) (s) (s) (s) (s) (s)
Petroleum and Coal Products
Manufacturing (324) (s) (s) (s) (s) (s) (s) (s)
Chemical Manufacturing (325) (s) (s) (s) (s) (s) (s) (s)

C‐76
Table C.2.6: Economic and Environmental Ranking Data, Arroyo Verdugo
Industry Title
& 4‐Digit Coding
NAICS 2007 Employment 2011
Chan
ge in Employment
1996‐2011
Average Wage 2011
Direct terajoules per job
2011
Direct metric tons of
greenhouse gases per job
2011
Average gallons of gasoline
per job for public trips 2011
GHG2011 L
ife cycle metric
tons of co2‐equivalent
emissions in 2011
Plastics and Rubber Products
Manufacturing (326) (s) (s) (s) (s) (s) (s) (s)
Nonmetallic Mineral Product
Manufacturing (327) (s) (s) (s) (s) (s) (s) (s)
Primary Metal Manufacturing (331) (s) (s) (s) (s) (s) (s) (s)
Fabricated Metal Product
Manufacturing (332) (s) (s) (s) (s) (s) (s) (s)
Machinery Manufacturing (333) (s) (s) (s) (s) (s) (s) (s)
Computer and Electronic Product
Manufacturing (334) (s) (s) (s) (s) (s) (s) (s)
Electrical Equipment, Appliance,
and Component Manufacturing
(335)
(s) (s) (s) (s) (s) (s) (s)
Transportation Equipment
Manufacturing (336) (s) (s) (s) (s) (s) (s) (s)
Furniture and Related Product
Manufacturing (337) (s) (s) (s) (s) (s) (s) (s)
Miscellaneous Manufacturing (339) 18 542% $36,026 0.04 1.11 0.00 36.60
Merchant Wholesalers, Durable
Goods (423) 53 ‐64% $75,223 0.03 0.11 0.00 30.78
Merchant Wholesalers, Nondurable
Goods (424) 98 137% $53,556 0.03 0.11 0.00 30.78
Wholesale Electronic Markets and
Agents and Brokers (425) 38 ‐8% $91,884 0.03 0.11 0.00 30.78
Motor Vehicle and Parts Dealers
(441) 40 ‐17% $26,471 0.05 0.14 546.40 20.32
Furniture and Home Furnishings
Stores (442) 82 321% $15,653 0.04 0.10 210.58 14.87
Electronics and Appliance Stores
(443) (s) (s) (s) (s) (s) (s) (s)
Building Material and Garden
Equipment and Supplies Dealers
(444)
262 ‐29% $24,598 0.04 0.11 417.97 16.01
Food and Beverage Stores (445) 390 29% $28,502 0.07 0.19 1192.50 19.30
Health and Personal Care Stores
(446) 88 ‐9% $43,929 0.08 0.20 890.16 20.82
Gasoline Stations (447) 33 ‐34% $21,665 0.20 0.52 3345.69 53.47
Clothing and Clothing Accessories
Stores (448) 78 ‐8% $14,011 0.03 0.09 405.76 13.07
Sporting Goods, Hobby, Book, and
Music Stores (451) 150 ‐39% $13,835 0.03 0.07 577.15 10.29
General Merchandise Stores (452) (s) (s) (s) (s) (s) (s) (s)
Miscellaneous Store Retailers (453) 85 ‐29% $22,401 0.04 0.10 315.89 13.60

C‐77
Table C.2.6: Economic and Environmental Ranking Data, Arroyo Verdugo
Industry Title
& 4‐Digit Coding
NAICS 2007 Employment 2011
Chan
ge in Employment
1996‐2011
Average Wage 2011
Direct terajoules per job
2011
Direct metric tons of
greenhouse gases per job
2011
Average gallons of gasoline
per job for public trips 2011
GHG2011 L
ife cycle metric
tons of co2‐equivalent
emissions in 2011
Nonstore Retailers (454) (s) (s) (s) (s) (s) (s) (s)
Air Transportation (481) (s) (s) (s) (s) (s) (s) (s)
Rail Transportation (482) (s) (s) (s) (s) (s) (s) (s)
Water Transportation (483) (s) (s) (s) (s) (s) (s) (s)
Truck Transportation (484) 11 ‐7% $31,155 1.50 343.18 0.00 (r)
Transit and Ground Passenger
Transportation (485) (s) (s) (s) (s) (s) (s) (s)
Pipeline Transportation (486) (s) (s) (s) (s) (s) (s) (s)
Scenic and Sightseeing
Transportation (487) (s) (s) (s) (s) (s) (s) (s)
Support Activities for
Transportation (488) 105 60% $87,918 0.11 12.56 0.00 13.02
Postal Service (491) (s) (s) (s) (s) (s) (s) (s)
Couriers and Messengers (492) (s) (s) (s) (s) (s) (s) (s)
Warehousing and Storage (493) (s) (s) (s) (s) (s) (s) (s)
Publishing Industries (except
Internet) (511) 55 46% $35,596 0.01 0.00 0.00 31.88
Motion Picture and Sound
Recording Industries (512) 41 ‐52% $71,661 0.02 0.01 856.05 33.00
Broadcasting (except Internet) (515) (s) (s) (s) (s) (s) (s) (s)
Telecommunications (517) 71 ‐63% $70,928 0.14 0.20 0.00 51.53
Data Processing, Hosting and
Related Services (518) (s) (s) (s) (s) (s) (s) (s)
Other Information Services (519) (s) (s) (s) (s) (s) (s) (s)
Monetary Authorities‐Central Bank
(521) (s) (s) (s) (s) (s) (s) (s)
Credit Intermediation and Related
Activities (522) 192 ‐1% $52,481 0.01 0.08 1190.74 20.84
Securities, Commodity Contracts,
and Other Financial Investments
and Related Activities (523)
22 798% $50,501 0.01 0.02 28.76 11.80
Insurance Carriers and Related
Activities (524) 109 ‐31% $66,849 0.01 0.05 27.48 14.83
Funds, Trusts, and Other Financial
Vehicles (525) (s) (s) (s) (s) (s) (s) (s)
Real Estate (531) 171 11% $50,943 0.05 0.22 32.32 35.08
Rental and Leasing Services (532) 25 ‐57% $8,332 0.01 0.06 1111.53 12.93
Lessors of Nonfinancial Intangible
Assets (except Copyrighted
Works) (533)
(s) (s) (s) (s) (s) (s) (s)
Professional, Scientific, and
Technical Services (541) 481 53% $48,638 0.02 0.11 34.02 26.36

C‐78
Table C.2.6: Economic and Environmental Ranking Data, Arroyo Verdugo
Industry Title
& 4‐Digit Coding
NAICS 2007 Employment 2011
Chan
ge in Employment
1996‐2011
Average Wage 2011
Direct terajoules per job
2011
Direct metric tons of
greenhouse gases per job
2011
Average gallons of gasoline
per job for public trips 2011
GHG2011 L
ife cycle metric
tons of co2‐equivalent
emissions in 2011
Management of Companies and
Enterprises (551) (s) (s) (s) (s) (s) (s) (s)
Administrative and Support
Services (561) 233 ‐44% $46,497 0.03 0.81 43.67 19.13
Waste Management and
Remediation Services (562) (s) (s) (s) (s) (s) (s) (s)
Educational Services (611) 1,733 69% $50,485 0.02 0.45 152.28 17.20
Ambulatory Health Care Services
(621) 454 16% $62,698 0.01 0.37 226.65 16.18
Hospitals (622) (s) (s) (s) (s) (s) (s) (s)
Nursing and Residential Care
Facilities (623) 64 ‐92% $17,497 0.06 2.10 71.08 15.97
Social Assistance (624) 319 305% $23,199 0.01 0.34 192.48 9.52
Performing Arts, Spectator Sports,
and Related Industries (711) 32 219% $239,038 0.01 0.06 25.52 20.41
Museums, Historical Sites, and
Similar Institutions (712) (s) (s) (s) (s) (s) (s) (s)
Amusement, Gambling, and
Recreation Industries (713) 173 23% $19,761 0.02 0.22 321.06 22.50
Accommodation (721) (s) (s) (s) (s) (s) (s) (s)
Food Services and Drinking Places
(722) 1,301 23% $16,617 0.07 2.10 2409.13 25.28
Repair and Maintenance (811) 107 ‐29% $27,194 0.02 1.57 757.97 25.92
Personal and Laundry Services
(812) 130 ‐35% $21,425 0.02 0.68 278.92 19.36
Religious, Grantmaking, Civic,
Professional, and Similar
Organizations (813)
276 ‐16% $14,391 0.07 4.39 563.75 38.68
Private Households (814) 373 88% $15,532 0.00 0.00 0.00 0.00
Executive, Legislative, and Other
General Government Support
(921)
(s) (s) (s) (s) (s) (s) (s)
Justice, Public Order, and Safety
Activities (922) (s) (s) (s) (s) (s) (s) (s)
Administration of Human Resource
Programs (923) (s) (s) (s) (s) (s) (s) (s)
Administration of Environmental
Quality Programs (924) (s) (s) (s) (s) (s) (s) (s)
Administration of Housing
Programs, Urban Planning, and
Community Development (925)
(s) (s) (s) (s) (s) (s) (s)
Administration of Economic
Programs (926) (s) (s) (s) (s) (s) (s) (s)

C‐79
Table C.2.6: Economic and Environmental Ranking Data, Arroyo Verdugo
Industry Title
& 4‐Digit Coding
NAICS 2007 Employment 2011
Chan
ge in Employment
1996‐2011
Average Wage 2011
Direct terajoules per job
2011
Direct metric tons of
greenhouse gases per job
2011
Average gallons of gasoline
per job for public trips 2011
GHG2011 L
ife cycle metric
tons of co2‐equivalent
emissions in 2011
Space Research and Technology
(927) (s) (s) (s) (s) (s) (s) (s)
National Security and International
Affairs (928) (s) (s) (s) (s) (s) (s) (s)
Unclassified (999) 315 119% $47,393 0.08 4.14 63.78 16.36
Sources: California Employment Development Department Establishment Database for Los Angeles County; California Energy Commission, Energy Consumption Database; IMPLAN economic simulation software and data for Los Angeles County; United States Environmental Protection Agency eGRID2012 Version 1.0 for electricity emissions and Greenhouse Gas Equivalencies Calculator for natural gas emissions; California MRIO-LCA model; The U.S. Economic Input-Output Life Cycle Assessment (EIO-LCA) model developed by Green Design Institute, Carnegie Mellon University; and Economic Roundtable model for estimating GHG emissions from vehicle operations for customer trips. See Appendix A.5.
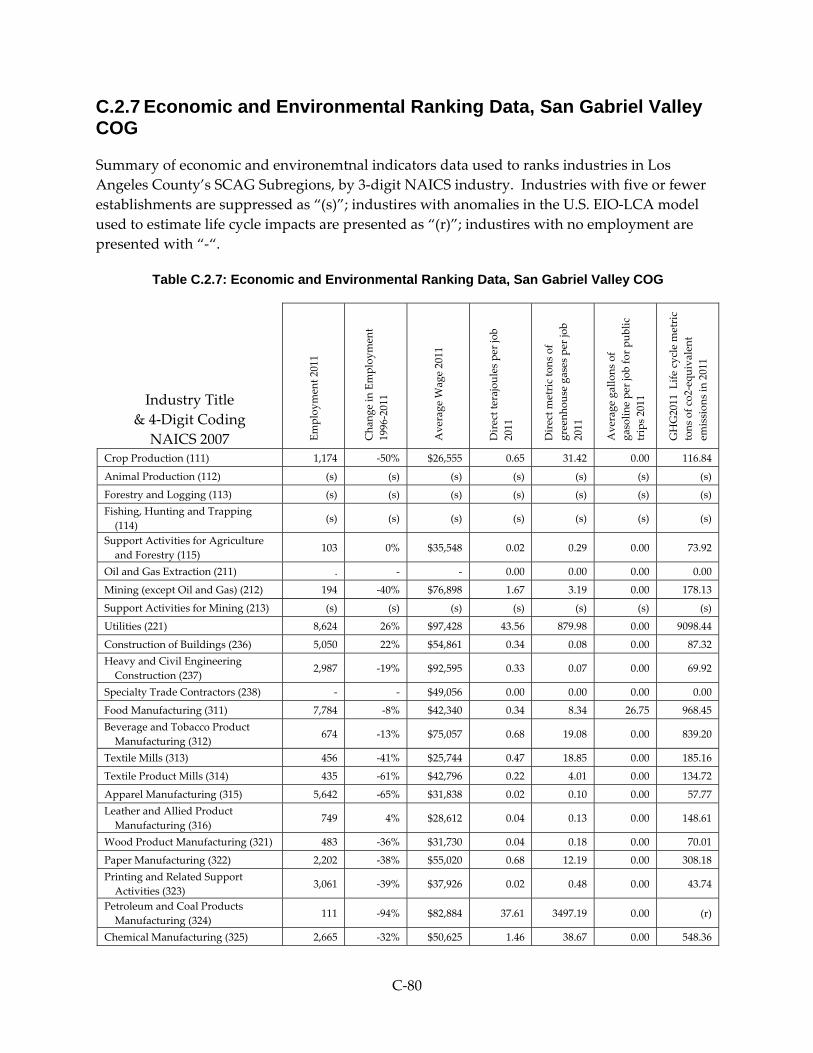
C‐80
C.2.7 Economic and Environmental Ranking Data, San Gabriel Valley COG
Summary of economic and environemtnal indicators data used to ranks industries in Los
Angeles County’s SCAG Subregions, by 3‐digit NAICS industry. Industries with five or fewer
establishments are suppressed as “(s)”; industires with anomalies in the U.S. EIO‐LCA model
used to estimate life cycle impacts are presented as “(r)”; industires with no employment are
presented with “‐“.
Table C.2.7: Economic and Environmental Ranking Data, San Gabriel Valley COG
Industry Title
& 4‐Digit Coding
NAICS 2007 Employment 2011
Chan
ge in Employment
1996‐2011
Average Wage 2011
Direct terajoules per job
2011
Direct metric tons of
greenhouse gases per job
2011
Average gallons of
gasoline per job for public
trips 2011
GHG2011 L
ife cycle metric
tons of co2‐equivalent
emissions in 2011
Crop Production (111) 1,174 ‐50% $26,555 0.65 31.42 0.00 116.84
Animal Production (112) (s) (s) (s) (s) (s) (s) (s)
Forestry and Logging (113) (s) (s) (s) (s) (s) (s) (s)
Fishing, Hunting and Trapping
(114) (s) (s) (s) (s) (s) (s) (s)
Support Activities for Agriculture
and Forestry (115) 103 0% $35,548 0.02 0.29 0.00 73.92
Oil and Gas Extraction (211) . ‐ ‐ 0.00 0.00 0.00 0.00
Mining (except Oil and Gas) (212) 194 ‐40% $76,898 1.67 3.19 0.00 178.13
Support Activities for Mining (213) (s) (s) (s) (s) (s) (s) (s)
Utilities (221) 8,624 26% $97,428 43.56 879.98 0.00 9098.44
Construction of Buildings (236) 5,050 22% $54,861 0.34 0.08 0.00 87.32
Heavy and Civil Engineering
Construction (237) 2,987 ‐19% $92,595 0.33 0.07 0.00 69.92
Specialty Trade Contractors (238) ‐ ‐ $49,056 0.00 0.00 0.00 0.00
Food Manufacturing (311) 7,784 ‐8% $42,340 0.34 8.34 26.75 968.45
Beverage and Tobacco Product
Manufacturing (312) 674 ‐13% $75,057 0.68 19.08 0.00 839.20
Textile Mills (313) 456 ‐41% $25,744 0.47 18.85 0.00 185.16
Textile Product Mills (314) 435 ‐61% $42,796 0.22 4.01 0.00 134.72
Apparel Manufacturing (315) 5,642 ‐65% $31,838 0.02 0.10 0.00 57.77
Leather and Allied Product
Manufacturing (316) 749 4% $28,612 0.04 0.13 0.00 148.61
Wood Product Manufacturing (321) 483 ‐36% $31,730 0.04 0.18 0.00 70.01
Paper Manufacturing (322) 2,202 ‐38% $55,020 0.68 12.19 0.00 308.18
Printing and Related Support
Activities (323) 3,061 ‐39% $37,926 0.02 0.48 0.00 43.74
Petroleum and Coal Products
Manufacturing (324) 111 ‐94% $82,884 37.61 3497.19 0.00 (r)
Chemical Manufacturing (325) 2,665 ‐32% $50,625 1.46 38.67 0.00 548.36

C‐81
Table C.2.7: Economic and Environmental Ranking Data, San Gabriel Valley COG
Industry Title
& 4‐Digit Coding
NAICS 2007 Employment 2011
Chan
ge in Employment
1996‐2011
Average Wage 2011
Direct terajoules per job
2011
Direct metric tons of
greenhouse gases per job
2011
Average gallons of
gasoline per job for public
trips 2011
GHG2011 L
ife cycle metric
tons of co2‐equivalent
emissions in 2011
Plastics and Rubber Products
Manufacturing (326) 4,172 ‐47% $37,756 0.18 1.48 0.00 176.91
Nonmetallic Mineral Product
Manufacturing (327) 638 ‐74% $42,629 0.27 12.73 0.00 501.93
Primary Metal Manufacturing (331) 2,392 ‐39% $45,608 0.50 25.50 0.00 615.64
Fabricated Metal Product
Manufacturing (332) 6,977 ‐35% $47,663 0.18 2.89 0.00 186.95
Machinery Manufacturing (333) 2,706 ‐46% $58,641 0.09 0.51 0.00 113.02
Computer and Electronic Product
Manufacturing (334) 4,199 ‐62% $68,995 0.05 0.51 0.00 80.69
Electrical Equipment, Appliance,
and Component Manufacturing
(335)
2,597 ‐49% $49,624 0.05 0.34 0.00 103.39
Transportation Equipment
Manufacturing (336) 3,235 15% $77,529 0.14 1.60 0.00 154.21
Furniture and Related Product
Manufacturing (337) 2,488 ‐56% $37,000 0.04 0.19 0.00 46.67
Miscellaneous Manufacturing (339) 3,950 ‐29% $52,470 0.05 1.49 0.00 72.28
Merchant Wholesalers, Durable
Goods (423) 19,822 0% $49,674 0.03 0.11 0.00 30.78
Merchant Wholesalers, Nondurable
Goods (424) 17,045 18% $46,402 0.03 0.11 0.00 30.78
Wholesale Electronic Markets and
Agents and Brokers (425) 3,991 36% $53,909 0.03 0.11 0.00 30.78
Motor Vehicle and Parts Dealers
(441) 8,684 ‐11% $45,714 0.05 0.14 443.65 20.32
Furniture and Home Furnishings
Stores (442) 2,043 9% $26,454 0.04 0.10 242.65 14.87
Electronics and Appliance Stores
(443) 3,199 ‐3% $41,185 0.06 0.16 424.87 22.79
Building Material and Garden
Equipment and Supplies Dealers
(444)
4,086 ‐2% $29,435 0.04 0.11 491.22 16.01
Food and Beverage Stores (445) 17,618 19% $24,776 0.07 0.19 1426.78 19.30
Health and Personal Care Stores
(446) 5,441 26% $36,399 0.08 0.20 766.21 20.82
Gasoline Stations (447) 2,312 ‐10% $22,666 0.17 0.45 2925.49 52.37
Clothing and Clothing Accessories
Stores (448) 6,494 30% $18,695 0.03 0.09 405.76 13.07
Sporting Goods, Hobby, Book, and
Music Stores (451) 3,082 1% $18,515 0.03 0.07 671.93 10.29
General Merchandise Stores (452) 12,951 18% $20,855 0.04 0.10 592.94 14.09
Miscellaneous Store Retailers (453) 3,800 ‐4% $23,917 0.04 0.10 349.08 13.60
Nonstore Retailers (454) 1,434 41% $39,655 0.07 0.18 33.24 26.16

C‐82
Table C.2.7: Economic and Environmental Ranking Data, San Gabriel Valley COG
Industry Title
& 4‐Digit Coding
NAICS 2007 Employment 2011
Chan
ge in Employment
1996‐2011
Average Wage 2011
Direct terajoules per job
2011
Direct metric tons of
greenhouse gases per job
2011
Average gallons of
gasoline per job for public
trips 2011
GHG2011 L
ife cycle metric
tons of co2‐equivalent
emissions in 2011
Air Transportation (481) 48 56% $47,953 6.24 1442.02 249.34 (r)
Rail Transportation (482) (s) (s) (s) (s) (s) (s) (s)
Water Transportation (483) 97 1564% $41,811 0.33 76.18 3.26 1178.16
Truck Transportation (484) 4,615 ‐5% $37,640 1.50 343.18 0.00 (r)
Transit and Ground Passenger
Transportation (485) 3,599 51% $32,599 0.71 126.82 28.18 223.84
Pipeline Transportation (486) (s) (s) (s) (s) (s) (s) (s)
Scenic and Sightseeing
Transportation (487) 90 ‐ $20,031 0.11 12.56 70.35 34.62
Support Activities for
Transportation (488) 2,359 65% $42,880 0.11 12.56 4.08 14.88
Postal Service (491) 3,288 ‐16% $60,824 0.02 2.38 439.02 13.85
Couriers and Messengers (492) 1,739 ‐18% $43,839 0.93 210.86 420.70 (r)
Warehousing and Storage (493) 4,029 17% $44,090 0.05 3.89 0.00 47.21
Publishing Industries (except
Internet) (511) 1,104 ‐58% $59,905 0.01 0.00 0.00 34.63
Motion Picture and Sound
Recording Industries (512) 1,229 19% $39,574 0.02 0.01 750.12 38.55
Broadcasting (except Internet) (515) 435 4% $50,472 0.11 0.15 0.00 147.15
Telecommunications (517) 3,889 ‐17% $70,289 0.14 0.20 0.00 51.53
Data Processing, Hosting and
Related Services (518) 1,592 23% $84,720 0.02 0.01 0.00 59.12
Other Information Services (519) 1,660 167% $74,226 0.02 0.01 289.36 31.63
Monetary Authorities‐Central Bank
(521) (s) (s) (s) (s) (s) (s) (s)
Credit Intermediation and Related
Activities (522) 17,732 ‐7% $59,907 0.01 0.07 974.15 17.53
Securities, Commodity Contracts,
and Other Financial Investments
and Related Activities (523)
3,259 62% $117,155 0.01 0.02 26.22 11.80
Insurance Carriers and Related
Activities (524) 7,801 ‐13% $59,687 0.01 0.05 24.71 14.86
Funds, Trusts, and Other Financial
Vehicles (525) 253 ‐2% $45,252 0.00 0.00 22.05 23.97
Real Estate (531) 6,635 36% $39,195 0.05 0.22 28.27 35.08
Rental and Leasing Services (532) 2,167 1% $35,128 0.00 0.04 412.94 7.06
Lessors of Nonfinancial Intangible
Assets (except Copyrighted
Works) (533)
43 ‐61% $72,075 0.67 6.88 0.00 296.60
Professional, Scientific, and
Technical Services (541) 34,808 26% $72,338 0.03 0.16 21.18 30.08

C‐83
Table C.2.7: Economic and Environmental Ranking Data, San Gabriel Valley COG
Industry Title
& 4‐Digit Coding
NAICS 2007 Employment 2011
Chan
ge in Employment
1996‐2011
Average Wage 2011
Direct terajoules per job
2011
Direct metric tons of
greenhouse gases per job
2011
Average gallons of
gasoline per job for public
trips 2011
GHG2011 L
ife cycle metric
tons of co2‐equivalent
emissions in 2011
Management of Companies and
Enterprises (551) 11,732 19% $97,871 0.04 0.00 0.00 25.66
Administrative and Support
Services (561) 34,185 ‐2% $31,100 0.01 0.26 43.61 11.25
Waste Management and
Remediation Services (562) 1,992 57% $54,792 0.03 42.60 85.38 485.13
Educational Services (611) 62,695 ‐27% $46,471 0.05 0.98 141.28 36.99
Ambulatory Health Care Services
(621) 33,354 66% $53,848 0.02 0.49 202.05 18.24
Hospitals (622) 24,453 25% $62,139 0.08 0.49 126.54 49.53
Nursing and Residential Care
Facilities (623) 17,497 34% $28,425 0.06 2.10 102.14 15.97
Social Assistance (624) 11,877 77% $26,304 0.01 0.49 114.73 9.75
Performing Arts, Spectator Sports,
and Related Industries (711) 2,565 ‐18% $72,610 0.01 0.03 110.51 11.30
Museums, Historical Sites, and
Similar Institutions (712) 293 81% $29,072 0.12 0.98 63.65 98.44
Amusement, Gambling, and
Recreation Industries (713) 5,908 58% $18,656 0.02 0.24 288.76 24.04
Accommodation (721) 4,478 13% $26,274 0.15 4.00 257.97 33.25
Food Services and Drinking Places
(722) 49,582 31% $15,804 0.07 2.10 1531.73 25.28
Repair and Maintenance (811) 6,608 1% $32,964 0.02 1.07 357.61 28.02
Personal and Laundry Services
(812) 5,507 26% $24,997 0.02 0.97 224.22 22.97
Religious, Grantmaking, Civic,
Professional, and Similar
Organizations (813)
7,937 ‐17% $38,178 0.04 2.88 307.78 32.47
Private Households (814) 18,182 604% $11,406 0.00 0.00 0.00 0.00
Executive, Legislative, and Other
General Government Support
(921)
6,766 ‐50% $59,405 0.25 14.99 177.26 98.38
Justice, Public Order, and Safety
Activities (922) 1,364 3% $90,552 0.27 16.04 188.74 188.89
Administration of Human Resource
Programs (923) 923 ‐2% $61,945 0.33 19.29 188.74 126.61
Administration of Environmental
Quality Programs (924) 1,086 ‐38% $77,967 0.20 11.64 95.24 78.28
Administration of Housing
Programs, Urban Planning, and
Community Development (925)
740 ‐59% $62,920 0.25 14.99 59.25 98.38
Administration of Economic
Programs (926) 372 ‐9% $48,284 0.33 19.34 127.75 130.50

C‐84
Table C.2.7: Economic and Environmental Ranking Data, San Gabriel Valley COG
Industry Title
& 4‐Digit Coding
NAICS 2007 Employment 2011
Chan
ge in Employment
1996‐2011
Average Wage 2011
Direct terajoules per job
2011
Direct metric tons of
greenhouse gases per job
2011
Average gallons of
gasoline per job for public
trips 2011
GHG2011 L
ife cycle metric
tons of co2‐equivalent
emissions in 2011
Space Research and Technology
(927) (s) (s) (s) (s) (s) (s) (s)
National Security and International
Affairs (928) (s) (s) (s) (s) (s) (s) (s)
Unclassified (999) 17,700 185% $30,579 0.05 2.93 45.12 11.57
Sources: California Employment Development Department Establishment Database for Los Angeles County; California Energy Commission, Energy Consumption Database; IMPLAN economic simulation software and data for Los Angeles County; United States Environmental Protection Agency eGRID2012 Version 1.0 for electricity emissions and Greenhouse Gas Equivalencies Calculator for natural gas emissions; California MRIO-LCA model; The U.S. Economic Input-Output Life Cycle Assessment (EIO-LCA) model developed by Green Design Institute, Carnegie Mellon University; and Economic Roundtable model for estimating GHG emissions from vehicle operations for customer trips. See Appendix A.5.

C‐85
C.2.8 Economic and Environmental Ranking Data, Westside Cities
Summary of economic and environemtnal indicators data used to ranks industries in Los
Angeles County’s SCAG Subregions, by 3‐digit NAICS industry. Industries with five or fewer
establishments are suppressed as “(s)”; industires with anomalies in the U.S. EIO‐LCA model
used to estimate life cycle impacts are presented as “(r)”; industires with no employment are
presented with “‐“.
Table C.2.8: Economic and Environmental Ranking Data, Westside Cities
Industry Title
& 4‐Digit Coding
NAICS 2007 Employment 2011
Chan
ge in Employment
1996‐2011
Average Wage 2011
Direct terajoules per job
2011
Direct metric tons of
greenhouse gases per job
2011
Average gallons of gasoline
per job for public trips 2011
GHG2011 L
ife cycle metric
tons of co2‐equivalent
emissions in 2011
Crop Production (111) (s) (s) (s) (s) (s) (s) (s)
Animal Production (112) . ‐ ‐ 0.00 0.00 0.00 0.00
Forestry and Logging (113) (s) (s) (s) (s) (s) (s) (s)
Fishing, Hunting and Trapping
(114) (s) (s) (s) (s) (s) (s) (s)
Support Activities for Agriculture
and Forestry (115) 87 607% $43,444 0.04 0.61 0.00 74.23
Oil and Gas Extraction (211) 77 ‐5% $128,178 4.35 543.67 0.00 651.47
Mining (except Oil and Gas) (212) (s) (s) (s) (s) (s) (s) (s)
Support Activities for Mining (213) 22 979% $51,537 1.35 0.06 0.00 342.50
Utilities (221) 527 2% $77,508 19.80 571.19 0.00 6311.56
Construction of Buildings (236) 1,341 ‐19% $70,408 0.37 0.08 0.00 103.89
Heavy and Civil Engineering
Construction (237) 343 4% $94,480 0.33 0.07 0.00 69.93
Specialty Trade Contractors (238) . ‐ $53,714 0.00 0.00 0.00 0.00
Food Manufacturing (311) 261 ‐77% $25,760 0.13 3.30 137.55 206.98
Beverage and Tobacco Product
Manufacturing (312) (s) (s) (s) (s) (s) (s) (s)
Textile Mills (313) 36 ‐65% $34,575 0.49 20.20 0.00 176.23
Textile Product Mills (314) 18 ‐38% $39,822 0.12 2.19 0.00 104.94
Apparel Manufacturing (315) 597 ‐34% $49,865 0.01 0.05 0.00 43.72
Leather and Allied Product
Manufacturing (316) (s) (s) (s) (s) (s) (s) (s)
Wood Product Manufacturing (321) (s) (s) (s) (s) (s) (s) (s)
Paper Manufacturing (322) (s) (s) (s) (s) (s) (s) (s)
Printing and Related Support
Activities (323) 369 ‐25% $46,328 0.02 0.42 0.00 39.51
Petroleum and Coal Products
Manufacturing (324) (s) (s) (s) (s) (s) (s) (s)
Chemical Manufacturing (325) 260 47% $198,491 1.27 33.21 0.00 499.31

C‐86
Table C.2.8: Economic and Environmental Ranking Data, Westside Cities
Industry Title
& 4‐Digit Coding
NAICS 2007 Employment 2011
Chan
ge in Employment
1996‐2011
Average Wage 2011
Direct terajoules per job
2011
Direct metric tons of
greenhouse gases per job
2011
Average gallons of gasoline
per job for public trips 2011
GHG2011 L
ife cycle metric
tons of co2‐equivalent
emissions in 2011
Plastics and Rubber Products
Manufacturing (326) 35 ‐71% $52,515 0.13 0.83 0.00 138.00
Nonmetallic Mineral Product
Manufacturing (327) 49 13% $48,412 0.11 4.01 0.00 769.77
Primary Metal Manufacturing (331) (s) (s) (s) (s) (s) (s) (s)
Fabricated Metal Product
Manufacturing (332) 127 ‐32% $41,306 0.17 2.80 0.00 169.74
Machinery Manufacturing (333) 34 ‐83% $45,470 0.12 0.67 0.00 167.53
Computer and Electronic Product
Manufacturing (334) 531 ‐63% $116,747 0.05 0.29 0.00 121.02
Electrical Equipment, Appliance,
and Component Manufacturing
(335)
135 ‐57% $44,189 0.03 0.20 0.00 70.67
Transportation Equipment
Manufacturing (336) 108 ‐13% $74,791 0.10 1.10 0.00 124.71
Furniture and Related Product
Manufacturing (337) 178 ‐53% $30,341 0.03 0.12 0.00 38.17
Miscellaneous Manufacturing (339) 574 ‐60% $55,143 0.08 2.34 0.00 95.04
Merchant Wholesalers, Durable
Goods (423) 3,100 ‐19% $88,981 0.03 0.11 0.00 30.78
Merchant Wholesalers, Nondurable
Goods (424) 2,827 48% $60,600 0.03 0.11 0.00 30.78
Wholesale Electronic Markets and
Agents and Brokers (425) 1,138 159% $103,534 0.03 0.11 0.00 30.78
Motor Vehicle and Parts Dealers
(441) 2,382 ‐10% $61,006 0.05 0.14 413.58 20.32
Furniture and Home Furnishings
Stores (442) 1,230 16% $35,287 0.04 0.10 231.25 14.87
Electronics and Appliance Stores
(443) 1,927 93% $64,888 0.06 0.16 423.67 22.79
Building Material and Garden
Equipment and Supplies Dealers
(444)
859 23% $47,977 0.04 0.11 567.14 16.01
Food and Beverage Stores (445) 4,192 17% $27,552 0.07 0.19 1433.38 19.30
Health and Personal Care Stores
(446) 1,785 17% $42,044 0.08 0.20 700.95 20.82
Gasoline Stations (447) 290 ‐31% $19,620 0.17 0.44 2843.76 52.15
Clothing and Clothing Accessories
Stores (448) 5,592 24% $35,461 0.03 0.09 405.76 13.07
Sporting Goods, Hobby, Book, and
Music Stores (451) 1,051 ‐35% $25,132 0.03 0.07 650.38 10.29
General Merchandise Stores (452) 3,610 24% $28,333 0.04 0.10 598.77 14.09
Miscellaneous Store Retailers (453) 1,352 ‐8% $41,256 0.04 0.10 341.32 13.60

C‐87
Table C.2.8: Economic and Environmental Ranking Data, Westside Cities
Industry Title
& 4‐Digit Coding
NAICS 2007 Employment 2011
Chan
ge in Employment
1996‐2011
Average Wage 2011
Direct terajoules per job
2011
Direct metric tons of
greenhouse gases per job
2011
Average gallons of gasoline
per job for public trips 2011
GHG2011 L
ife cycle metric
tons of co2‐equivalent
emissions in 2011
Nonstore Retailers (454) 462 8% $73,695 0.07 0.18 10.70 26.16
Air Transportation (481) 733 ‐43% $82,640 6.24 1442.02 243.37 (r)
Rail Transportation (482) (s) (s) (s) (s) (s) (s) (s)
Water Transportation (483) (s) (s) (s) (s) (s) (s) (s)
Truck Transportation (484) 42 ‐3% $35,916 1.50 343.18 0.00 (r)
Transit and Ground Passenger
Transportation (485) 1,291 71% $55,370 0.71 126.82 54.24 223.84
Pipeline Transportation (486) (s) (s) (s) (s) (s) (s) (s)
Scenic and Sightseeing
Transportation (487) 65 ‐45% $25,484 0.01 0.92 70.35 17.23
Support Activities for
Transportation (488) 228 19% $52,607 0.10 11.65 8.17 16.96
Postal Service (491) 650 ‐6% $62,249 0.02 2.38 439.02 13.85
Couriers and Messengers (492) 399 ‐17% $41,915 0.93 210.86 420.70 (r)
Warehousing and Storage (493) 39 32% $37,885 0.05 3.89 0.00 47.21
Publishing Industries (except
Internet) (511) 1,910 2% $164,060 0.01 0.00 0.00 38.63
Motion Picture and Sound
Recording Industries (512) 14,576 78% $135,503 0.02 0.01 26.58 36.70
Broadcasting (except Internet) (515) 1,065 407% $131,506 0.08 0.11 0.00 115.53
Telecommunications (517) 1,316 ‐13% $86,947 0.14 0.20 0.00 51.53
Data Processing, Hosting and
Related Services (518) 421 18% $119,964 0.02 0.01 0.00 59.12
Other Information Services (519) 2,843 739% $114,501 0.02 0.01 102.79 28.76
Monetary Authorities‐Central Bank
(521) (s) (s) (s) (s) (s) (s) (s)
Credit Intermediation and Related
Activities (522) 2,871 ‐18% $95,218 0.01 0.07 781.76 15.59
Securities, Commodity Contracts,
and Other Financial Investments
and Related Activities (523)
2,950 14% $199,004 0.01 0.02 25.31 11.80
Insurance Carriers and Related
Activities (524) 1,183 ‐41% $94,823 0.01 0.05 27.98 14.70
Funds, Trusts, and Other Financial
Vehicles (525) 127 193% $139,427 0.00 0.00 4.24 23.97
Real Estate (531) 6,075 14% $69,364 0.05 0.22 22.68 35.08
Rental and Leasing Services (532) 999 10% $43,385 0.00 0.04 408.42 6.96
Lessors of Nonfinancial Intangible
Assets (except Copyrighted
Works) (533)
103 ‐57% $112,643 0.67 6.88 0.00 296.60
Professional, Scientific, and
Technical Services (541) 23,519 45% $104,655 0.03 0.12 16.77 35.48

C‐88
Table C.2.8: Economic and Environmental Ranking Data, Westside Cities
Industry Title
& 4‐Digit Coding
NAICS 2007 Employment 2011
Chan
ge in Employment
1996‐2011
Average Wage 2011
Direct terajoules per job
2011
Direct metric tons of
greenhouse gases per job
2011
Average gallons of gasoline
per job for public trips 2011
GHG2011 L
ife cycle metric
tons of co2‐equivalent
emissions in 2011
Management of Companies and
Enterprises (551) 1,826 ‐3% $118,975 0.04 0.00 0.00 25.66
Administrative and Support
Services (561) 12,552 ‐19% $41,442 0.01 0.26 30.97 10.44
Waste Management and
Remediation Services (562) 47 63% $50,366 0.03 42.60 0.00 485.13
Educational Services (611) 12,120 8% $44,384 0.04 0.75 164.29 29.90
Ambulatory Health Care Services
(621) 11,706 31% $67,055 0.02 0.40 218.83 16.81
Hospitals (622) 14,903 ‐6% $99,793 0.08 0.49 126.54 49.53
Nursing and Residential Care
Facilities (623) 2,986 59% $31,581 0.06 2.10 107.43 15.97
Social Assistance (624) 3,132 107% $37,220 0.01 0.50 109.55 9.76
Performing Arts, Spectator Sports,
and Related Industries (711) 5,395 59% $270,418 0.01 0.07 9.41 21.20
Museums, Historical Sites, and
Similar Institutions (712) 168 ‐75% $58,802 0.12 0.98 211.44 98.44
Amusement, Gambling, and
Recreation Industries (713) 1,457 ‐14% $22,822 0.02 0.26 386.42 27.06
Accommodation (721) 8,899 23% $36,020 0.15 4.01 257.16 33.16
Food Services and Drinking Places
(722) 22,586 32% $21,866 0.07 2.10 1018.83 25.28
Repair and Maintenance (811) 1,679 1% $30,884 0.02 1.32 578.68 27.14
Personal and Laundry Services
(812) 5,255 14% $31,942 0.02 0.79 186.11 22.13
Religious, Grantmaking, Civic,
Professional, and Similar
Organizations (813)
2,473 9% $54,008 0.05 3.37 325.56 34.42
Private Households (814) 5,825 100% $20,197 0.00 0.00 0.00 0.00
Executive, Legislative, and Other
General Government Support
(921)
2,555 ‐26% $73,313 0.25 14.99 183.63 98.38
Justice, Public Order, and Safety
Activities (922) 1,643 23% $105,857 0.29 17.25 188.74 203.20
Administration of Human Resource
Programs (923) 238 ‐53% $75,121 0.06 2.93 188.74 26.04
Administration of Environmental
Quality Programs (924) (s) (s) (s) (s) (s) (s) (s)
Administration of Housing
Programs, Urban Planning, and
Community Development (925)
(s) (s) (s) (s) (s) (s) (s)
Administration of Economic
Programs (926) 330 4% $64,725 0.29 17.26 58.93 114.88

C‐89
Table C.2.8: Economic and Environmental Ranking Data, Westside Cities
Industry Title
& 4‐Digit Coding
NAICS 2007 Employment 2011
Chan
ge in Employment
1996‐2011
Average Wage 2011
Direct terajoules per job
2011
Direct metric tons of
greenhouse gases per job
2011
Average gallons of gasoline
per job for public trips 2011
GHG2011 L
ife cycle metric
tons of co2‐equivalent
emissions in 2011
Space Research and Technology
(927) (s) (s) (s) (s) (s) (s) (s)
National Security and International
Affairs (928) (s) (s) (s) (s) (s) (s) (s)
Unclassified (999) 2,987 341% $101,311 0.13 7.27 111.99 28.73
Sources: California Employment Development Department Establishment Database for Los Angeles County; California Energy Commission, Energy Consumption Database; IMPLAN economic simulation software and data for Los Angeles County; United States Environmental Protection Agency eGRID2012 Version 1.0 for electricity emissions and Greenhouse Gas Equivalencies Calculator for natural gas emissions; California MRIO-LCA model; The U.S. Economic Input-Output Life Cycle Assessment (EIO-LCA) model developed by Green Design Institute, Carnegie Mellon University; and Economic Roundtable model for estimating GHG emissions from vehicle operations for customer trips. See Appendix A.5.

C‐90
C.2.9 Economic and Environmental Ranking Data, South Bay Cities COG
Summary of economic and environemtnal indicators data used to ranks industries in Los
Angeles County’s SCAG Subregions, by 3‐digit NAICS industry. Industries with five or fewer
establishments are suppressed as “(s)”; industires with anomalies in the U.S. EIO‐LCA model
used to estimate life cycle impacts are presented as “(r)”; industires with no employment are
presented with “‐“.
Table C.2.9: Economic and Environmental Ranking Data, South Bay Cities COG
Industry Title
& 4‐Digit Coding
NAICS 2007 Employment 2011
Chan
ge in Employment
1996‐2011
Average Wage 2011
Direct terajoules per job
2011
Direct metric tons of
greenhouse gases per job
2011
Average gallons of gasoline
per job for public trips 2011
GHG2011 L
ife cycle metric
tons of co2‐equivalent
emissions in 2011
Crop Production (111) 542 ‐14% $27,582 0.64 31.77 0.00 113.98
Animal Production (112) (s) (s) (s) (s) (s) (s) (s)
Forestry and Logging (113) (s) (s) (s) (s) (s) (s) (s)
Fishing, Hunting and Trapping
(114) (s) (s) (s) (s) (s) (s) (s)
Support Activities for Agriculture
and Forestry (115) 50 1575% $52,381 0.02 0.29 0.00 73.92
Oil and Gas Extraction (211) 1,162 3159% $130,511 4.35 543.67 0.00 651.47
Mining (except Oil and Gas) (212) (s) (s) (s) (s) (s) (s) (s)
Support Activities for Mining (213) 169 53% $86,468 0.36 0.05 0.00 74.90
Utilities (221) 775 ‐30% $88,990 28.67 699.69 0.00 7250.34
Construction of Buildings (236) 2,633 17% $55,629 0.36 0.08 0.00 94.94
Heavy and Civil Engineering
Construction (237) 1,075 1% $73,062 0.33 0.07 0.00 69.92
Specialty Trade Contractors (238) ‐ ‐ $47,939 0.00 0.00 0.00 0.00
Food Manufacturing (311) 2,739 ‐11% $40,703 0.27 6.72 35.00 655.54
Beverage and Tobacco Product
Manufacturing (312) 303 314% $62,741 0.28 6.45 0.00 597.74
Textile Mills (313) 420 ‐67% $43,838 0.38 16.66 0.00 139.25
Textile Product Mills (314) 257 ‐61% $34,848 0.19 2.65 0.00 104.79
Apparel Manufacturing (315) 1,154 ‐56% $62,853 0.03 0.12 0.00 77.44
Leather and Allied Product
Manufacturing (316) 85 ‐37% $32,663 0.02 0.07 0.00 103.53
Wood Product Manufacturing (321) 630 ‐25% $32,662 0.04 0.18 0.00 71.03
Paper Manufacturing (322) 401 ‐1% $47,312 1.15 17.58 0.00 375.60
Printing and Related Support
Activities (323) 1,585 ‐58% $47,551 0.02 0.51 0.00 46.48
Petroleum and Coal Products
Manufacturing (324) 1,350 32% $119,704 197.52 15778.67 0.00 (r)
Chemical Manufacturing (325) 1,453 ‐24% $56,948 1.80 66.15 0.00 691.08

C‐91
Table C.2.9: Economic and Environmental Ranking Data, South Bay Cities COG
Industry Title
& 4‐Digit Coding
NAICS 2007 Employment 2011
Chan
ge in Employment
1996‐2011
Average Wage 2011
Direct terajoules per job
2011
Direct metric tons of
greenhouse gases per job
2011
Average gallons of gasoline
per job for public trips 2011
GHG2011 L
ife cycle metric
tons of co2‐equivalent
emissions in 2011
Plastics and Rubber Products
Manufacturing (326) 1,182 ‐29% $44,114 0.17 1.24 0.00 174.75
Nonmetallic Mineral Product
Manufacturing (327) 306 ‐49% $41,037 0.48 37.80 0.00 479.52
Primary Metal Manufacturing (331) 425 ‐56% $56,890 0.34 12.22 0.00 744.66
Fabricated Metal Product
Manufacturing (332) 6,130 ‐7% $57,012 0.15 2.18 0.00 160.10
Machinery Manufacturing (333) 1,275 ‐73% $58,488 0.09 0.44 0.00 117.50
Computer and Electronic Product
Manufacturing (334) 19,594 ‐41% $108,020 0.08 1.07 0.00 90.39
Electrical Equipment, Appliance,
and Component Manufacturing
(335)
1,148 ‐33% $56,854 0.07 0.43 0.00 119.88
Transportation Equipment
Manufacturing (336) 18,118 23% $94,621 0.11 1.15 0.00 115.48
Furniture and Related Product
Manufacturing (337) 1,299 ‐49% $40,152 0.06 0.36 0.00 75.09
Miscellaneous Manufacturing (339) 2,514 ‐21% $102,164 0.11 3.26 0.00 117.62
Merchant Wholesalers, Durable
Goods (423) 10,400 ‐26% $78,670 0.03 0.11 0.00 30.78
Merchant Wholesalers, Nondurable
Goods (424) 6,790 21% $48,231 0.03 0.11 0.00 30.78
Wholesale Electronic Markets and
Agents and Brokers (425) 1,743 100% $64,792 0.03 0.11 0.00 30.78
Motor Vehicle and Parts Dealers
(441) 4,016 ‐9% $47,515 0.05 0.14 446.61 20.32
Furniture and Home Furnishings
Stores (442) 1,943 34% $33,512 0.04 0.10 243.80 14.87
Electronics and Appliance Stores
(443) 1,948 ‐23% $62,840 0.06 0.16 424.92 22.79
Building Material and Garden
Equipment and Supplies Dealers
(444)
2,462 40% $31,811 0.04 0.11 482.47 16.01
Food and Beverage Stores (445) 8,629 26% $31,343 0.07 0.19 1614.23 19.30
Health and Personal Care Stores
(446) 2,427 4% $37,777 0.08 0.20 792.92 20.82
Gasoline Stations (447) 1,458 6% $70,691 0.19 0.50 3220.67 53.14
Clothing and Clothing Accessories
Stores (448) 4,604 34% $17,848 0.03 0.09 405.76 13.07
Sporting Goods, Hobby, Book, and
Music Stores (451) 2,632 19% $18,090 0.03 0.07 538.30 10.29
General Merchandise Stores (452) 7,126 ‐13% $22,545 0.04 0.10 620.01 14.09
Miscellaneous Store Retailers (453) 1,674 ‐45% $24,849 0.04 0.10 331.38 13.60
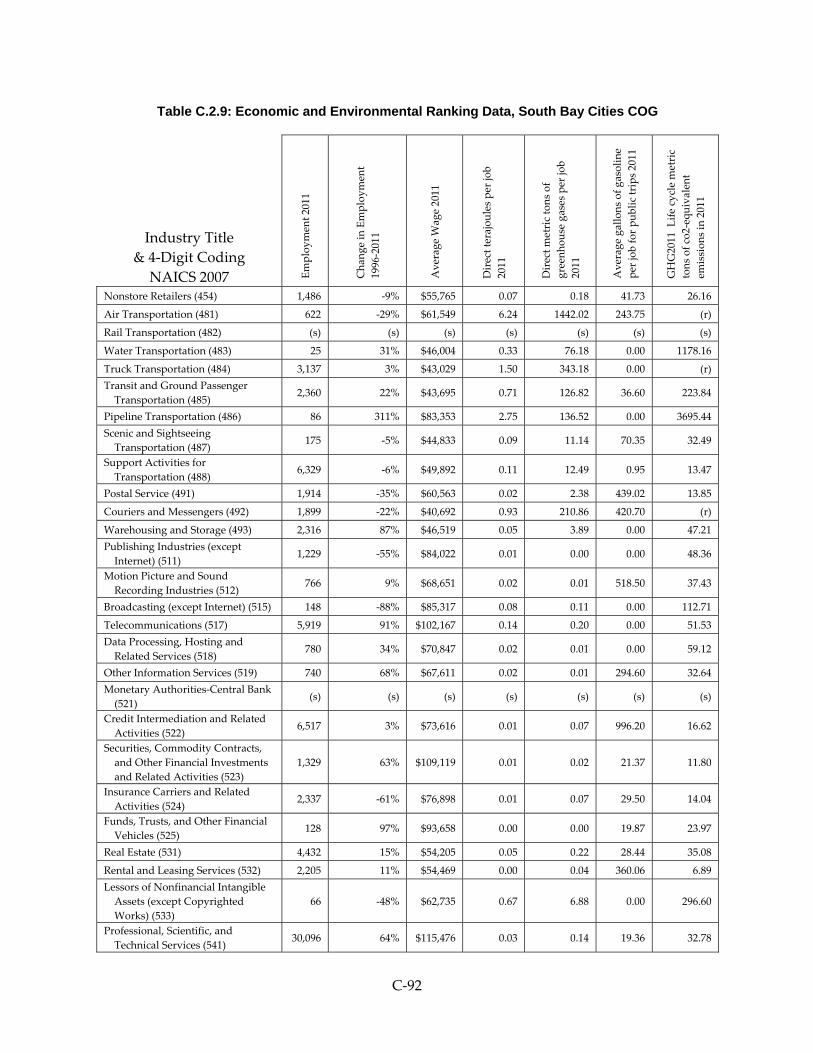
C‐92
Table C.2.9: Economic and Environmental Ranking Data, South Bay Cities COG
Industry Title
& 4‐Digit Coding
NAICS 2007 Employment 2011
Chan
ge in Employment
1996‐2011
Average Wage 2011
Direct terajoules per job
2011
Direct metric tons of
greenhouse gases per job
2011
Average gallons of gasoline
per job for public trips 2011
GHG2011 L
ife cycle metric
tons of co2‐equivalent
emissions in 2011
Nonstore Retailers (454) 1,486 ‐9% $55,765 0.07 0.18 41.73 26.16
Air Transportation (481) 622 ‐29% $61,549 6.24 1442.02 243.75 (r)
Rail Transportation (482) (s) (s) (s) (s) (s) (s) (s)
Water Transportation (483) 25 31% $46,004 0.33 76.18 0.00 1178.16
Truck Transportation (484) 3,137 3% $43,029 1.50 343.18 0.00 (r)
Transit and Ground Passenger
Transportation (485) 2,360 22% $43,695 0.71 126.82 36.60 223.84
Pipeline Transportation (486) 86 311% $83,353 2.75 136.52 0.00 3695.44
Scenic and Sightseeing
Transportation (487) 175 ‐5% $44,833 0.09 11.14 70.35 32.49
Support Activities for
Transportation (488) 6,329 ‐6% $49,892 0.11 12.49 0.95 13.47
Postal Service (491) 1,914 ‐35% $60,563 0.02 2.38 439.02 13.85
Couriers and Messengers (492) 1,899 ‐22% $40,692 0.93 210.86 420.70 (r)
Warehousing and Storage (493) 2,316 87% $46,519 0.05 3.89 0.00 47.21
Publishing Industries (except
Internet) (511) 1,229 ‐55% $84,022 0.01 0.00 0.00 48.36
Motion Picture and Sound
Recording Industries (512) 766 9% $68,651 0.02 0.01 518.50 37.43
Broadcasting (except Internet) (515) 148 ‐88% $85,317 0.08 0.11 0.00 112.71
Telecommunications (517) 5,919 91% $102,167 0.14 0.20 0.00 51.53
Data Processing, Hosting and
Related Services (518) 780 34% $70,847 0.02 0.01 0.00 59.12
Other Information Services (519) 740 68% $67,611 0.02 0.01 294.60 32.64
Monetary Authorities‐Central Bank
(521) (s) (s) (s) (s) (s) (s) (s)
Credit Intermediation and Related
Activities (522) 6,517 3% $73,616 0.01 0.07 996.20 16.62
Securities, Commodity Contracts,
and Other Financial Investments
and Related Activities (523)
1,329 63% $109,119 0.01 0.02 21.37 11.80
Insurance Carriers and Related
Activities (524) 2,337 ‐61% $76,898 0.01 0.07 29.50 14.04
Funds, Trusts, and Other Financial
Vehicles (525) 128 97% $93,658 0.00 0.00 19.87 23.97
Real Estate (531) 4,432 15% $54,205 0.05 0.22 28.44 35.08
Rental and Leasing Services (532) 2,205 11% $54,469 0.00 0.04 360.06 6.89
Lessors of Nonfinancial Intangible
Assets (except Copyrighted
Works) (533)
66 ‐48% $62,735 0.67 6.88 0.00 296.60
Professional, Scientific, and
Technical Services (541) 30,096 64% $115,476 0.03 0.14 19.36 32.78

C‐93
Table C.2.9: Economic and Environmental Ranking Data, South Bay Cities COG
Industry Title
& 4‐Digit Coding
NAICS 2007 Employment 2011
Chan
ge in Employment
1996‐2011
Average Wage 2011
Direct terajoules per job
2011
Direct metric tons of
greenhouse gases per job
2011
Average gallons of gasoline
per job for public trips 2011
GHG2011 L
ife cycle metric
tons of co2‐equivalent
emissions in 2011
Management of Companies and
Enterprises (551) 7,498 ‐20% $95,140 0.04 0.00 0.00 25.66
Administrative and Support
Services (561) 22,662 ‐12% $31,776 0.01 0.27 40.81 9.54
Waste Management and
Remediation Services (562) 303 ‐66% $43,629 0.03 42.60 5.21 485.13
Educational Services (611) 23,923 ‐15% $45,081 0.04 0.70 145.74 26.88
Ambulatory Health Care Services
(621) 15,709 35% $53,048 0.02 0.52 202.74 18.88
Hospitals (622) 10,000 9% $55,631 0.08 0.49 126.54 49.53
Nursing and Residential Care
Facilities (623) 5,872 17% $28,568 0.06 2.10 107.91 15.97
Social Assistance (624) 4,120 7% $27,006 0.01 0.45 135.58 9.69
Performing Arts, Spectator Sports,
and Related Industries (711) 1,446 ‐22% $154,743 0.01 0.03 100.63 11.88
Museums, Historical Sites, and
Similar Institutions (712) 54 ‐ $118,825 0.12 0.98 349.59 98.44
Amusement, Gambling, and
Recreation Industries (713) 4,695 ‐3% $22,117 0.02 0.28 446.72 29.39
Accommodation (721) 2,884 0% $24,006 0.15 4.00 258.69 33.17
Food Services and Drinking Places
(722) 28,212 32% $17,146 0.07 2.10 1572.51 25.28
Repair and Maintenance (811) 3,306 ‐21% $33,373 0.02 1.05 369.98 27.99
Personal and Laundry Services
(812) 4,390 41% $22,904 0.02 1.02 218.71 22.87
Religious, Grantmaking, Civic,
Professional, and Similar
Organizations (813)
2,447 ‐35% $30,229 0.04 2.68 245.97 31.66
Private Households (814) 6,087 373% $15,107 0.00 0.00 0.00 0.00
Executive, Legislative, and Other
General Government Support
(921)
2,574 ‐59% $68,383 0.25 14.99 172.04 98.38
Justice, Public Order, and Safety
Activities (922) 1,328 ‐25% $91,516 0.45 26.38 188.74 310.66
Administration of Human Resource
Programs (923) 329 10% $54,124 0.34 19.99 188.74 131.18
Administration of Environmental
Quality Programs (924) 134 ‐27% $76,181 0.18 10.36 108.98 70.60
Administration of Housing
Programs, Urban Planning, and
Community Development (925)
(s) (s) (s) (s) (s) (s) (s)
Administration of Economic
Programs (926) 1,543 64% $106,454 0.08 3.89 188.74 34.57

C‐94
Table C.2.9: Economic and Environmental Ranking Data, South Bay Cities COG
Industry Title
& 4‐Digit Coding
NAICS 2007 Employment 2011
Chan
ge in Employment
1996‐2011
Average Wage 2011
Direct terajoules per job
2011
Direct metric tons of
greenhouse gases per job
2011
Average gallons of gasoline
per job for public trips 2011
GHG2011 L
ife cycle metric
tons of co2‐equivalent
emissions in 2011
Space Research and Technology
(927) (s) (s) (s) (s) (s) (s) (s)
National Security and International
Affairs (928) (s) (s) (s) (s) (s) (s) (s)
Unclassified (999) 7,298 195% $46,349 0.05 2.89 44.54 11.42
Sources: California Employment Development Department Establishment Database for Los Angeles County; California Energy Commission, Energy Consumption Database; IMPLAN economic simulation software and data for Los Angeles County; United States Environmental Protection Agency eGRID2012 Version 1.0 for electricity emissions and Greenhouse Gas Equivalencies Calculator for natural gas emissions; California MRIO-LCA model; The U.S. Economic Input-Output Life Cycle Assessment (EIO-LCA) model developed by Green Design Institute, Carnegie Mellon University; and Economic Roundtable model for estimating GHG emissions from vehicle operations for customer trips. See Appendix A.5.

C‐95
C.2.10 Economic and Environmental Ranking Data, Gateway Cities COG
Summary of economic and environemtnal indicators data used to ranks industries in Los
Angeles County’s SCAG Subregions, by 3‐digit NAICS industry. Industries with five or fewer
establishments are suppressed as “(s)”; industires with anomalies in the U.S. EIO‐LCA model
used to estimate life cycle impacts are presented as “(r)”; industires with no employment are
presented with “‐“.
Table C.2.10: Economic and Environmental Ranking Data, Gateway Cities COG
Industry Title
& 4‐Digit Coding
NAICS 2007 Employment 2011
Chan
ge in Employment
1996‐2011
Average Wage 2011
Direct terajoules per job
2011
Direct metric tons of
greenhouse gases per job
2011
Average gallons of gasoline
per job for public trips 2011
GHG2011 L
ife cycle metric
tons of co2‐equivalent
emissions in 2011
Crop Production (111) 395 ‐54% $25,272 0.52 65.46 0.00 181.81
Animal Production (112) 54 ‐6% $36,961 0.17 60.18 0.00 (r)
Forestry and Logging (113) (s) (s) (s) (s) (s) (s) (s)
Fishing, Hunting and Trapping
(114) (s) (s) (s) (s) (s) (s) (s)
Support Activities for Agriculture
and Forestry (115) 299 153% $24,829 0.03 0.37 0.00 74.00
Oil and Gas Extraction (211) 390 ‐57% $151,947 4.35 543.67 0.00 651.47
Mining (except Oil and Gas) (212) . ‐ ‐ 0.00 0.00 0.00 0.00
Support Activities for Mining (213) 875 48% $63,806 0.41 0.05 0.00 88.85
Utilities (221) 3,552 ‐13% $80,709 32.79 762.87 0.00 8,163.52
Construction of Buildings (236) 4,105 0% $57,659 0.35 0.08 0.00 85.54
Heavy and Civil Engineering
Construction (237) 3,525 6% $75,834 0.33 0.07 0.00 69.93
Specialty Trade Contractors (238) . ‐ $53,136 0.00 0.00 0.00 0.00
Food Manufacturing (311) 15,004 0% $43,731 0.23 5.85 23.86 606.22
Beverage and Tobacco Product
Manufacturing (312) 1,644 148% $50,794 0.28 6.39 0.00 591.72
Textile Mills (313) 3,349 ‐28% $27,944 0.45 19.58 0.00 166.76
Textile Product Mills (314) 1,658 ‐67% $36,702 0.17 2.98 0.00 116.56
Apparel Manufacturing (315) 13,821 ‐48% $34,030 0.01 0.06 0.00 45.67
Leather and Allied Product
Manufacturing (316) 788 ‐40% $31,980 0.03 0.13 0.00 158.09
Wood Product Manufacturing
(321) 1,059 ‐41% $33,786 0.06 0.29 0.00 77.09
Paper Manufacturing (322) 3,728 ‐45% $56,980 0.53 12.55 0.00 319.82
Printing and Related Support
Activities (323) 4,065 ‐53% $37,419 0.02 0.50 0.00 45.44
Petroleum and Coal Products
Manufacturing (324) 1,212 ‐53% $88,005 75.31 6088.93 0.00 (r)

C‐96
Table C.2.10: Economic and Environmental Ranking Data, Gateway Cities COG
Industry Title
& 4‐Digit Coding
NAICS 2007 Employment 2011
Chan
ge in Employment
1996‐2011
Average Wage 2011
Direct terajoules per job
2011
Direct metric tons of
greenhouse gases per job
2011
Average gallons of gasoline
per job for public trips 2011
GHG2011 L
ife cycle metric
tons of co2‐equivalent
emissions in 2011
Chemical Manufacturing (325) 4,911 ‐28% $51,318 1.18 58.08 0.00 574.23
Plastics and Rubber Products
Manufacturing (326) 5,202 ‐43% $45,386 0.19 1.62 0.00 197.82
Nonmetallic Mineral Product
Manufacturing (327) 1,648 ‐47% $45,771 0.55 32.82 0.00 587.20
Primary Metal Manufacturing (331) 3,484 ‐31% $57,861 0.32 19.39 0.00 543.09
Fabricated Metal Product
Manufacturing (332) 13,517 ‐28% $48,615 0.23 3.76 0.00 188.19
Machinery Manufacturing (333) 5,956 ‐37% $55,254 0.10 0.59 0.00 139.31
Computer and Electronic Product
Manufacturing (334) 1,436 ‐71% $54,733 0.05 1.09 0.00 91.07
Electrical Equipment, Appliance,
and Component Manufacturing
(335)
2,100 ‐23% $50,719 0.08 0.52 0.00 120.73
Transportation Equipment
Manufacturing (336) 11,969 ‐70% $86,321 0.12 1.30 0.00 146.93
Furniture and Related Product
Manufacturing (337) 5,489 ‐52% $34,872 0.04 0.21 0.00 54.22
Miscellaneous Manufacturing (339) 2,752 ‐37% $46,025 0.05 1.56 0.00 54.78
Merchant Wholesalers, Durable
Goods (423) 30,282 ‐14% $58,928 0.03 0.11 0.00 30.78
Merchant Wholesalers,
Nondurable Goods (424) 26,138 ‐17% $50,963 0.03 0.11 0.00 30.78
Wholesale Electronic Markets and
Agents and Brokers (425) 4,624 87% $53,733 0.03 0.11 0.00 30.78
Motor Vehicle and Parts Dealers
(441) 8,132 ‐18% $45,386 0.05 0.14 453.57 20.32
Furniture and Home Furnishings
Stores (442) 1,793 ‐4% $32,715 0.04 0.10 255.20 14.87
Electronics and Appliance Stores
(443) 2,388 23% $37,301 0.06 0.16 424.20 22.79
Building Material and Garden
Equipment and Supplies Dealers
(444)
4,435 31% $32,455 0.04 0.11 480.07 16.01
Food and Beverage Stores (445) 16,170 ‐11% $27,740 0.07 0.19 1,554.59 19.30
Health and Personal Care Stores
(446) 5,077 15% $35,643 0.08 0.20 789.87 20.82
Gasoline Stations (447) 1,672 ‐41% $24,395 0.17 0.46 2,951.18 52.44
Clothing and Clothing Accessories
Stores (448) 10,729 80% $17,964 0.03 0.09 405.76 13.07
Sporting Goods, Hobby, Book, and
Music Stores (451) 3,053 ‐5% $18,957 0.03 0.07 833.33 10.29
General Merchandise Stores (452) 14,647 3% $21,967 0.04 0.10 600.60 14.09

C‐97
Table C.2.10: Economic and Environmental Ranking Data, Gateway Cities COG
Industry Title
& 4‐Digit Coding
NAICS 2007 Employment 2011
Chan
ge in Employment
1996‐2011
Average Wage 2011
Direct terajoules per job
2011
Direct metric tons of
greenhouse gases per job
2011
Average gallons of gasoline
per job for public trips 2011
GHG2011 L
ife cycle metric
tons of co2‐equivalent
emissions in 2011
Miscellaneous Store Retailers (453) 5,644 17% $33,224 0.04 0.10 336.88 13.60
Nonstore Retailers (454) 1,716 22% $40,700 0.07 0.18 106.61 26.16
Air Transportation (481) 250 0% $68,219 6.24 1442.02 253.02 (r)
Rail Transportation (482) (s) (s) (s) (s) (s) (s) (s)
Water Transportation (483) 412 ‐67% $54,715 0.33 76.18 31.49 1178.16
Truck Transportation (484) 11,740 ‐7% $45,641 1.50 343.18 0.00 (r)
Transit and Ground Passenger
Transportation (485) 3,426 ‐6% $33,887 0.71 126.82 24.44 223.84
Pipeline Transportation (486) 297 ‐21% $116,245 2.75 136.52 0.00 3695.44
Scenic and Sightseeing
Transportation (487) 139 8% $30,866 0.04 4.92 70.35 23.20
Support Activities for
Transportation (488) 12,519 25% $68,588 0.10 12.36 1.12 13.58
Postal Service (491) 3,694 ‐27% $58,648 0.02 2.38 439.02 13.85
Couriers and Messengers (492) 4,079 ‐14% $37,236 0.93 210.86 420.70 (r)
Warehousing and Storage (493) 6,242 1% $48,068 0.05 3.89 0.00 47.21
Publishing Industries (except
Internet) (511) 747 ‐53% $40,326 0.01 0.00 0.00 34.91
Motion Picture and Sound
Recording Industries (512) 1,066 27% $19,257 0.02 0.01 1127.34 34.80
Broadcasting (except Internet) (515) 344 ‐16% $49,084 0.06 0.08 0.00 91.93
Telecommunications (517) 4,077 ‐27% $61,913 0.14 0.20 0.00 51.53
Data Processing, Hosting and
Related Services (518) 455 14% $77,304 0.02 0.01 0.00 59.12
Other Information Services (519) 393 23% $38,919 0.02 0.01 598.59 36.36
Monetary Authorities‐Central Bank
(521) (s) (s) (s) (s) (s) (s) (s)
Credit Intermediation and Related
Activities (522) 7,470 ‐8% $42,030 0.01 0.07 864.12 17.00
Securities, Commodity Contracts,
and Other Financial Investments
and Related Activities (523)
821 ‐82% $90,281 0.01 0.02 24.71 11.80
Insurance Carriers and Related
Activities (524) 5,040 5% $62,257 0.01 0.05 28.71 14.95
Funds, Trusts, and Other Financial
Vehicles (525) 105 14% $54,455 0.00 0.00 26.42 23.97
Real Estate (531) 6,043 14% $44,991 0.05 0.22 27.86 35.08
Rental and Leasing Services (532) 2,893 ‐28% $48,821 0.01 0.05 310.23 8.15
Lessors of Nonfinancial Intangible
Assets (except Copyrighted
Works) (533)
(s) (s) (s) (s) (s) (s) (s)

C‐98
Table C.2.10: Economic and Environmental Ranking Data, Gateway Cities COG
Industry Title
& 4‐Digit Coding
NAICS 2007 Employment 2011
Chan
ge in Employment
1996‐2011
Average Wage 2011
Direct terajoules per job
2011
Direct metric tons of
greenhouse gases per job
2011
Average gallons of gasoline
per job for public trips 2011
GHG2011 L
ife cycle metric
tons of co2‐equivalent
emissions in 2011
Professional, Scientific, and
Technical Services (541) 23,867 44% $55,814 0.02 0.10 22.68 28.18
Management of Companies and
Enterprises (551) 11,292 21% $72,471 0.04 0.00 0.00 25.66
Administrative and Support
Services (561) 48,577 1% $24,369 0.01 0.15 29.78 8.54
Waste Management and
Remediation Services (562) 4,300 32% $57,418 0.03 42.60 23.53 485.13
Educational Services (611) 60,198 ‐53% $47,879 0.04 0.78 146.67 29.12
Ambulatory Health Care Services
(621) 29,380 25% $52,492 0.02 0.45 211.18 17.50
Hospitals (622) 24,066 ‐10% $59,389 0.08 0.49 126.54 49.53
Nursing and Residential Care
Facilities (623) 12,540 63% $27,340 0.06 2.10 111.84 15.97
Social Assistance (624) 8,985 78% $27,149 0.01 0.51 108.43 9.76
Performing Arts, Spectator Sports,
and Related Industries (711) 739 82% $39,508 0.01 0.06 56.12 17.83
Museums, Historical Sites, and
Similar Institutions (712) 550 631% $30,643 0.12 0.98 295.51 98.44
Amusement, Gambling, and
Recreation Industries (713) 9,424 18% $24,806 0.02 0.30 539.69 32.63
Accommodation (721) 4,506 ‐26% $24,758 0.15 4.01 271.71 33.16
Food Services and Drinking Places
(722) 45,757 30% $16,340 0.07 2.10 1780.85 25.28
Repair and Maintenance (811) 8,147 ‐8% $37,235 0.02 1.08 325.38 29.08
Personal and Laundry Services
(812) 7,666 ‐2% $24,991 0.02 1.22 179.23 25.21
Religious, Grantmaking, Civic,
Professional, and Similar
Organizations (813)
4,543 ‐33% $33,343 0.05 3.17 347.76 33.66
Private Households (814) 16,947 695% $12,952 0.00 0.00 0.00 0.00
Executive, Legislative, and Other
General Government Support
(921)
6,975 ‐39% $51,933 0.25 14.99 174.61 98.38
Justice, Public Order, and Safety
Activities (922) 4,117 7% $87,203 0.38 22.41 166.07 263.92
Administration of Human
Resource Programs (923) 1,358 3% $66,289 0.30 17.52 188.74 115.03
Administration of Environmental
Quality Programs (924) 814 42% $52,751 0.16 9.35 119.81 64.55
Administration of Housing
Programs, Urban Planning, and
Community Development (925)
(s) (s) (s) (s) (s) (s) (s)

C‐99
Table C.2.10: Economic and Environmental Ranking Data, Gateway Cities COG
Industry Title
& 4‐Digit Coding
NAICS 2007 Employment 2011
Chan
ge in Employment
1996‐2011
Average Wage 2011
Direct terajoules per job
2011
Direct metric tons of
greenhouse gases per job
2011
Average gallons of gasoline
per job for public trips 2011
GHG2011 L
ife cycle metric
tons of co2‐equivalent
emissions in 2011
Administration of Economic
Programs (926) 722 4% $49,200 0.12 6.36 86.25 49.14
Space Research and Technology
(927) (s) (s) (s) (s) (s) (s) (s)
National Security and International
Affairs (928) 3,040 165% $86,465 0.11 5.43 23.12 (r)
Unclassified (999) 15,995 119% $25,902 0.03 1.79 27.60 7.08
Sources: California Employment Development Department Establishment Database for Los Angeles County; California Energy Commission, Energy Consumption Database; IMPLAN economic simulation software and data for Los Angeles County; United States Environmental Protection Agency eGRID2012 Version 1.0 for electricity emissions and Greenhouse Gas Equivalencies Calculator for natural gas emissions; California MRIO-LCA model; The U.S. Economic Input-Output Life Cycle Assessment (EIO-LCA) model developed by Green Design Institute, Carnegie Mellon University; and Economic Roundtable model for estimating GHG emissions from vehicle operations for customer trips. See Appendix A.5.

C‐100
C.2.11 Economic and Environmental Ranking Data, Las Virgenes Malibu COG
Summary of economic and environemtnal indicators data used to ranks industries in Los
Angeles County’s SCAG Subregions, by 3‐digit NAICS industry. Industries with five or fewer
establishments are suppressed as “(s)”; industires with anomalies in the U.S. EIO‐LCA model
used to estimate life cycle impacts are presented as “(r)”; industires with no employment are
presented with “‐“.
Table C.2.11: Economic and Environmental Ranking Data, Las Virgenes Malibu COG
Industry Title
& 4‐Digit Coding
NAICS 2007 Employment 2011
Chan
ge in Employment
1996‐2011
Average Wage 2011
Direct terajoules per job
2011
Direct metric tons of
greenhouse gases per job
2011
Average gallons of
gasoline per job for public
trips 2011
GHG2011 L
ife cycle metric
tons of co2‐equivalent
emissions in 2011
Crop Production (111) 502 ‐1% $27,630 0.64 29.54 0.00 110.86
Animal Production (112) (s) (s) (s) (s) (s) (s) (s)
Forestry and Logging (113) (s) (s) (s) (s) (s) (s) (s)
Fishing, Hunting and Trapping
(114) (s) (s) (s) (s) (s) (s) (s)
Support Activities for Agriculture
and Forestry (115) 46 109% $24,409 0.02 0.29 0.00 73.92
Oil and Gas Extraction (211) (s) (s) (s) (s) (s) (s) (s)
Mining (except Oil and Gas) (212) (s) (s) (s) (s) (s) (s) (s)
Support Activities for Mining (213) (s) (s) (s) (s) (s) (s) (s)
Utilities (221) (s) (s) (s) (s) (s) (s) (s)
Construction of Buildings (236) 704 ‐18% $46,804 0.38 0.08 0.00 105.22
Heavy and Civil Engineering
Construction (237) 151 32% $80,033 0.33 0.07 0.00 69.93
Specialty Trade Contractors (238) $40,511 0.00 0.00 0.00 0.00
Food Manufacturing (311) 554 8% $35,141 0.11 3.02 33.89 120.61
Beverage and Tobacco Product
Manufacturing (312) (s) (s) (s) (s) (s) (s) (s)
Textile Mills (313) (s) (s) (s) (s) (s) (s) (s)
Textile Product Mills (314) (s) (s) (s) (s) (s) (s) (s)
Apparel Manufacturing (315) 77 61% $75,598 0.02 0.08 0.00 48.53
Leather and Allied Product
Manufacturing (316) (s) (s) (s) (s) (s) (s) (s)
Wood Product Manufacturing (321) (s) (s) (s) (s) (s) (s) (s)
Paper Manufacturing (322) (s) (s) (s) (s) (s) (s) (s)
Printing and Related Support
Activities (323) 95 ‐55% $58,355 0.02 0.52 0.00 47.09
Petroleum and Coal Products
Manufacturing (324) (s) (s) (s) (s) (s) (s) (s)
Chemical Manufacturing (325) (s) (s) (s) (s) (s) (s) (s)

C‐101
Table C.2.11: Economic and Environmental Ranking Data, Las Virgenes Malibu COG
Industry Title
& 4‐Digit Coding
NAICS 2007 Employment 2011
Chan
ge in Employment
1996‐2011
Average Wage 2011
Direct terajoules per job
2011
Direct metric tons of
greenhouse gases per job
2011
Average gallons of
gasoline per job for public
trips 2011
GHG2011 L
ife cycle metric
tons of co2‐equivalent
emissions in 2011
Plastics and Rubber Products
Manufacturing (326) (s) (s) (s) (s) (s) (s) (s)
Nonmetallic Mineral Product
Manufacturing (327) (s) (s) (s) (s) (s) (s) (s)
Primary Metal Manufacturing (331) (s) (s) (s) (s) (s) (s) (s)
Fabricated Metal Product
Manufacturing (332) (s) (s) (s) (s) (s) (s) (s)
Machinery Manufacturing (333) (s) (s) (s) (s) (s) (s) (s)
Computer and Electronic Product
Manufacturing (334) 1,045 ‐70% $150,574 0.07 0.52 0.00 151.45
Electrical Equipment, Appliance,
and Component Manufacturing
(335)
(s) (s) (s) (s) (s) (s) (s)
Transportation Equipment
Manufacturing (336) (s) (s) (s) (s) (s) (s) (s)
Furniture and Related Product
Manufacturing (337) 179 11% $70,185 0.08 0.51 0.00 90.79
Miscellaneous Manufacturing (339) 192 10% $46,715 0.06 1.68 0.00 114.32
Merchant Wholesalers, Durable
Goods (423) 829 ‐10% $88,770 0.03 0.11 0.00 30.78
Merchant Wholesalers, Nondurable
Goods (424) 561 ‐1% $76,852 0.03 0.11 0.00 30.78
Wholesale Electronic Markets and
Agents and Brokers (425) 239 41% $87,219 0.03 0.11 0.00 30.78
Motor Vehicle and Parts Dealers
(441) 474 127% $66,770 0.05 0.14 404.78 20.32
Furniture and Home Furnishings
Stores (442) 152 136% $31,602 0.04 0.10 258.87 14.87
Electronics and Appliance Stores
(443) 189 34% $42,001 0.06 0.16 410.92 22.79
Building Material and Garden
Equipment and Supplies Dealers
(444)
191 ‐39% $33,938 0.04 0.11 465.32 16.01
Food and Beverage Stores (445) 869 75% $29,854 0.07 0.19 1188.59 19.30
Health and Personal Care Stores
(446) 325 66% $40,495 0.08 0.20 691.02 20.82
Gasoline Stations (447) 301 50% $28,846 0.19 0.50 3190.69 53.07
Clothing and Clothing Accessories
Stores (448) 458 229% $30,940 0.03 0.09 405.76 13.07
Sporting Goods, Hobby, Book, and
Music Stores (451) 151 ‐34% $27,203 0.03 0.07 901.68 10.29
General Merchandise Stores (452) (s) (s) (s) (s) (s) (s) (s)
Miscellaneous Store Retailers (453) 153 ‐26% $26,429 0.04 0.10 364.87 13.60
Nonstore Retailers (454) 70 ‐54% $86,310 0.07 0.18 13.22 26.16

C‐102
Table C.2.11: Economic and Environmental Ranking Data, Las Virgenes Malibu COG
Industry Title
& 4‐Digit Coding
NAICS 2007 Employment 2011
Chan
ge in Employment
1996‐2011
Average Wage 2011
Direct terajoules per job
2011
Direct metric tons of
greenhouse gases per job
2011
Average gallons of
gasoline per job for public
trips 2011
GHG2011 L
ife cycle metric
tons of co2‐equivalent
emissions in 2011
Air Transportation (481) (s) (s) (s) (s) (s) (s) (s)
Rail Transportation (482) (s) (s) (s) (s) (s) (s) (s)
Water Transportation (483) (s) (s) (s) (s) (s) (s) (s)
Truck Transportation (484) 79 ‐74% $33,194 1.50 343.18 0.00 (r)
Transit and Ground Passenger
Transportation (485) 104 646% $20,682 0.71 126.82 3.97 223.84
Pipeline Transportation (486) (s) (s) (s) (s) (s) (s) (s)
Scenic and Sightseeing
Transportation (487) (s) (s) (s) (s) (s) (s) (s)
Support Activities for
Transportation (488) 85 11% $65,000 0.11 12.56 7.03 16.22
Postal Service (491) 108 ‐28% $57,985 0.02 2.38 439.02 13.85
Couriers and Messengers (492) (s) (s) (s) (s) (s) (s) (s)
Warehousing and Storage (493) (s) (s) (s) (s) (s) (s) (s)
Publishing Industries (except
Internet) (511) 844 26% $93,858 0.01 0.00 0.00 37.32
Motion Picture and Sound
Recording Industries (512) 539 81% $87,305 0.02 0.01 512.61 44.73
Broadcasting (except Internet) (515) 21 196% $177,743 0.14 0.20 0.00 185.66
Telecommunications (517) 643 180% $83,120 0.14 0.20 0.00 51.53
Data Processing, Hosting and
Related Services (518) (s) (s) (s) (s) (s) (s) (s)
Other Information Services (519) 293 29167% $118,660 0.02 0.01 0.00 27.14
Monetary Authorities‐Central Bank
(521) (s) (s) (s) (s) (s) (s) (s)
Credit Intermediation and Related
Activities (522) 2,631 5% $112,009 0.01 0.06 688.22 14.75
Securities, Commodity Contracts,
and Other Financial Investments
and Related Activities (523)
319 190% $131,036 0.01 0.02 28.05 11.80
Insurance Carriers and Related
Activities (524) 1,742 ‐16% $89,510 0.01 0.07 25.35 14.05
Funds, Trusts, and Other Financial
Vehicles (525) 24 788% $63,017 0.00 0.00 7.46 23.97
Real Estate (531) 1,064 46% $55,139 0.05 0.22 24.42 35.08
Rental and Leasing Services (532) 124 ‐20% $42,189 0.00 0.05 358.42 7.57
Lessors of Nonfinancial Intangible
Assets (except Copyrighted
Works) (533)
34 78% $123,817 0.67 6.88 0.00 296.60
Professional, Scientific, and
Technical Services (541) 5,805 84% $81,961 0.02 0.11 30.71 24.80

C‐103
Table C.2.11: Economic and Environmental Ranking Data, Las Virgenes Malibu COG
Industry Title
& 4‐Digit Coding
NAICS 2007 Employment 2011
Chan
ge in Employment
1996‐2011
Average Wage 2011
Direct terajoules per job
2011
Direct metric tons of
greenhouse gases per job
2011
Average gallons of
gasoline per job for public
trips 2011
GHG2011 L
ife cycle metric
tons of co2‐equivalent
emissions in 2011
Management of Companies and
Enterprises (551) 532 ‐36% $145,253 0.04 0.00 0.00 25.66
Administrative and Support
Services (561) 3,506 23% $49,002 0.01 0.21 31.43 11.48
Waste Management and
Remediation Services (562) (s) (s) (s) (s) (s) (s) (s)
Educational Services (611) 3,299 ‐4% $56,972 0.05 0.98 127.84 37.08
Ambulatory Health Care Services
(621) 1,042 17% $67,533 0.02 0.54 246.17 19.32
Hospitals (622) (s) (s) (s) (s) (s) (s) (s)
Nursing and Residential Care
Facilities (623) 451 459% $35,597 0.06 2.10 100.97 15.97
Social Assistance (624) 388 ‐2% $29,024 0.01 0.47 124.91 9.70
Performing Arts, Spectator Sports,
and Related Industries (711) 360 121% $203,129 0.01 0.05 29.76 18.83
Museums, Historical Sites, and
Similar Institutions (712) (s) (s) (s) (s) (s) (s) (s)
Amusement, Gambling, and
Recreation Industries (713) 494 18% $21,418 0.02 0.23 312.34 22.48
Accommodation (721) 536 132% $25,408 0.14 3.80 246.91 35.27
Food Services and Drinking Places
(722) 5,013 17% $26,034 0.07 2.10 1019.20 25.28
Repair and Maintenance (811) 138 23% $32,300 0.02 1.19 550.20 26.54
Personal and Laundry Services
(812) 459 52% $19,817 0.02 0.79 280.35 21.11
Religious, Grantmaking, Civic,
Professional, and Similar
Organizations (813)
356 28% $39,058 0.03 2.38 208.57 30.87
Private Households (814) 428 28% $22,421 0.00 0.00 0.00 0.00
Executive, Legislative, and Other
General Government Support
(921)
378 131% $44,203 0.25 14.99 188.74 98.38
Justice, Public Order, and Safety
Activities (922) (s) (s) (s) (s) (s) (s) (s)
Administration of Human Resource
Programs (923) (s) (s) (s) (s) (s) (s) (s)
Administration of Environmental
Quality Programs (924) (s) (s) (s) (s) (s) (s) (s)
Administration of Housing
Programs, Urban Planning, and
Community Development (925)
(s) (s) (s) (s) (s) (s) (s)
Administration of Economic
Programs (926) (s) (s) (s) (s) (s) (s) (s)

C‐104
Table C.2.11: Economic and Environmental Ranking Data, Las Virgenes Malibu COG
Industry Title
& 4‐Digit Coding
NAICS 2007 Employment 2011
Chan
ge in Employment
1996‐2011
Average Wage 2011
Direct terajoules per job
2011
Direct metric tons of
greenhouse gases per job
2011
Average gallons of
gasoline per job for public
trips 2011
GHG2011 L
ife cycle metric
tons of co2‐equivalent
emissions in 2011
Space Research and Technology
(927) (s) (s) (s) (s) (s) (s) (s)
National Security and International
Affairs (928) (s) (s) (s) (s) (s) (s) (s)
Unclassified (999) 1,273 165% $75,194 0.08 4.62 71.25 18.28
Sources: California Employment Development Department Establishment Database for Los Angeles County; California Energy Commission, Energy Consumption Database; IMPLAN economic simulation software and data for Los Angeles County; United States Environmental Protection Agency eGRID2012 Version 1.0 for electricity emissions and Greenhouse Gas Equivalencies Calculator for natural gas emissions; California MRIO-LCA model; The U.S. Economic Input-Output Life Cycle Assessment (EIO-LCA) model developed by Green Design Institute, Carnegie Mellon University; and Economic Roundtable model for estimating GHG emissions from vehicle operations for customer trips. See Appendix A.5.