industry cluster snapshot - cmap.illinois.gov
TRANSCRIPT

CMAP Regional Snapshot
IndustryClusters

2
Industry Clusters
The changing economy of the Chicago metropolitan region provides both opportunities and challenges. Declining manufacturing employment has left many cities and neighborhoods in transition. With fortunes tied to the former heavy industries, the region has felt the impact enormously. While the new economy — finance, health care, and other service-based fields — has helped the region to recover, a tremendous challenge remains: identifying the region’s strong revenue generators in this new economic climate. This Regional Snapshot examines an identified group of industries, referred to as “industry clusters,” that contribute to prosperity in northeastern Illinois. Please note that industry clusters are different than industry sectors, which are the broad categories used to define business types.
An industry cluster analysis identifies industries that are geographically concentrated or of a similar nature, and that make use of related buyers, suppliers, infrastructure and workforce. By identifying industry clusters, business recruitment, attraction and development efforts will be able to focus on companies that complement existing businesses. This report identifies several industry clusters that have a strong presence in the region and potential for future development.
This Regional Snapshot is not designed to make specific, implementable recommendations, but rather to highlight important data about the region’s economy and identify some prominent industry clusters in the region. As with all Regional Snapshots, it is also meant to inspire discussion between CMAP, its partners, and other stakeholders concerning the most effective approaches to addressing economic development in the region. This document is a summary of a more detailed technical report that is available online at http://www.cmap.illinois.gov/snapshot.aspx#Industry.
With its go to 2040 regional comprehensive plan to be issued in 2010, the Chicago Metropolitan Agency for Planning (CMAP) will articulate a vision of regional prosperity looking toward 2040 and beyond, with clear strategies to implement that vision. CMAP is publishing a series of Regional Snapshot reports that cover major topics that need to be addressed in the go to 2040 plan. These reports are designed to establish links between CMAP’s policy areas, to gather background data, and to initiate discussion on major regional issues early in the planning process.
About this Snapshot…

3
Regional Snapshot
Regional ProfileThe northeastern Illinois region is the economic engine of the state. Employment figures from the Illinois Department of Employment Security shows that northeastern Illinois contains approximately two thirds of all jobs in the state. Over a seven year period the region gained jobs with Kane, Kendall, McHenry, and Will counties reporting gains over 20 percent.
Northeast Illinois Job GrowthArea 2000 2007 % Change
Cook 2,344,422 2,506,529 6.9%
DuPage 524,025 589,545 12.5%
Kane 165,760 206,450 24.5%
Kendall 13,110 21,673 65.3%
Lake 264,402 323,999 22.5%
McHenry 74,530 99,986 34.2%
Will 118,186 185,672 57.1%
Region-wide 3,504,435 3,933,854 12.3%
Sources: Illinois Department of Employment Security, Illinois at Work
Overall the economy is diverse, though trends indicate an economy that is increasingly service oriented, particularly in professional and financial services. The region is constantly touted as the nation’s freight hub, with six Class I railroads converging to eighteen intermodal yards, two international airports and several interstate highways.
Despite its strengths, the region faces many challenges which include developing a skilled workforce that can adapt to the changes demanded by today’s integrated global economy; modernizing and increasing the capacity of the transportation network in order to efficiently move and process the increasing number of trucks, trains, and people across the region; fostering an overall climate of innovation; driving stronger collaboration across all sectors through public/private partnership; and discovering a unique economic identity to drive its global competitive advantage.

4
Industry Clusters
The following graph shows the composition of the region’s economic base in 2007 in terms of industry sectors, which represent general categories of economic activity. A sector is comprised of industries and firms that do similar work, make similar products, or provide similar services. Based on traditional industry sector definitions, the Professional and Business Services sector provides the most jobs. Health and Education, Retail Trade, Government, and Manufacturing round out the top five leading industry sectors. Overall the region’s economy has a fairly balanced spread across industry sectors. This reflects the diverse character of the region and can help provide resilience during national economic downturns.
The ongoing recession has had serious negative economic impacts for the region, and the unemployment rate rose to over 9 percent by 2009. Over the last year the majority of job losses have been within Construction (9,000 jobs lost), Financial Services (4,500), Manufacturing (4,000), and Professional and Business Services (3,000). go to 2040, as a long-range plan, can provide little in the way of immediate relief to these dire economic conditions. However, from a long-range perspective, it is essential to plan for future economic prosperity by identifying growth industries and providing support and solutions in the regional planning process that sustain and retain them.
Northeastern Illinois Economic Base, 2007
Manufacturing
11%
Other Services
4%
Health & Education
13%
Professional Services
17%
FIRE
8%
Transportation/Warehousing
4%
Retail
11% Wholesale Trade
5%
Construction 4%
Source: Illinois Department of Energy Security, 2007
Leisure &Hospitality
9%
Government
12%
NaturalResources
.4%Information
2%

5
Regional Snapshot
Gross regional product in 2008 for northeastern Illinois was $372 billion dollars in 2008 (chained 2000 dollars) according to estimates in the beginning of the year. Over 50 percent of the value of goods and services produced and used locally and exported from the region are derived through three major sectors — Finance, Insurance, Real Estate (FIRE), Professional and Business Services and Manufacturing.
Northeast Illinois Gross Regional Product, 2008Industry GRP (2000) Share of Total
Finance, Insurance, Real Estate (FIRE) $93,992,662,087 25.30%
Professional and Business Services $62,708,030,612 16.88%
Manufacturing $44,452,904,279 11.96%
Wholesale Trade $27,997,948,424 7.54%
Retail $23,257,139,410 6.26%
Government $22,247,413,343 5.99%
Information $22,272,759,898 5.99%
Health Services $21,667,870,753 5.83%
Transportation and Warehousing $14,425,816,677 3.88%
Leisure and Hospitality $11,356,050,414 3.06%
Construction $9,801,431,569 2.64%
Other Services $7,608,998,178 2.05%
Natural Resources $5,966,256,951 1.61%
Education $3,806,610,529 1.02%
Total $371,561,893,125 100.00%
Source: Moody’s Economy.com
According to the U.S. Department of Commerce, in 2007, the Chicago region was the sixth largest export market in the U.S. with export sales totaling over $30 billion dollars of goods. The leading products exported were heavily from the manufacturing industry — chemicals was the largest good at 21 percent of the total, while other major exports included computer and electronics products, machinery (except electrical) and transportation equipment.
6
Industry Clusters
A comparative analysis was conducted to identify how the region’s sectors and industry clusters have performed over a seven year period when compared to the United States. Three benchmarks are used to identify sectors and clusters in this report that may have a competitive advantage: a high employment concentration (referred to as a location quotient); high wage levels; and fast employment growth in the region. A detailed analysis of sectors, industries and clusters can be found in the technical document available online at http://www.cmap.illinois.gov/snapshot.aspx#Industry.
Sector AnalysisThe bubble chart to the right provides information on the region’s sector growth and concentration during the study period. Conclusions include:
Compared to the nation, the region has a strong concentration in Professional and Business Services, Finance, Insurance and Real Estate (FIRE), Wholesale Trade, and Transportation and Warehousing.
As described on the previous page, Professional and Business Services, Manufacturing, Health Care, and Leisure and Accommodation are the sectors employing the most people within the region. The fastest growing sectors in the region are Leisure and Accommodation, Health Care, and Education. Each of these sectors employs a fairly large number of people, and their growth is expected to continue.
Manufacturing, Information, and Natural Resources shed a combined total of 141,725 jobs over the study period. The Manufacturing sector continues to employ many people, and the regional economy continues to adjust to job losses in this sector. It should be noted that regional GRP from manufacturing remains high, as described on the previous page; this is due to high productivity per worker and technological improvements. Employment decline in manufacturing is in line with national and international trends. It remains to be seen how these jobs and this sector will re-emerge with a renewed focus on green energy and specialized manufacturing.
Comparative Analysis

7
Regional Snapshot
Interpreting the chart:
The size of the bubble indicates the employment size (number of jobs).
The horizontal axis indicates the employment change over the seven year period. Growth to the right of the graph is positive.
The vertical axis indicates the concentration of that industry relative to the nation. A concentration of 1.25 or higher indicates that the industry is much more heavily concentrated in the region than in the nation.
The retail trade sector is not included in the bubble chart, as this sector is highly localized and not generally a subject of cluster analyses.
Regional Sector Growth and ConcentrationProfessional
Health Care
Leisure/Accommodation
Education
FIRE
Wholesale Trade
Construction
Natural Resources
1.2
Conc
entra
tion
Employment Growth0%
0
.4
.8
1.2
1.6
1% 2% 3% 4%-4% -3% -2% -1%
Sources: Chicago Metropolitan Agency for Planning and Illinois Department of Employment, 2007
Regional Sector Growth and Concentration
ConstructConstruction
AccoAccoioon
Manufacturing
InformationEEdduduc
FI
dEd
Transportation/Warehousing
BENCHMARK

8
Industry Clusters
Industry clusters are different than the traditional industry sectors that were detailed above. Clusters are interdependent firms that are linked through the buyer-supplier relationship, share common resources and technologies, depend on similar labor pool and institutions, and rely on special infrastructure. Industries and firms in clusters draw a productive advantage in being geographically located near these resources — and each other — because it can help develop innovative products, build knowledge creation, and enhance cooperation and competition among firms. Cluster studies have been a focus in economic development efforts throughout the United States because of their ability to help a region understand its economy, build relationships among firms and identify strategies that can develop clusters as part of a long-term planning effort.
Clusters can differ depending on policy or development efforts. One example is North Carolina’s “Research Triangle,” where three educational institutions became the pillars of a planned science park that is home to scientists, researchers, and technicians. A second example, “Silicon Valley” in California, is home to a cluster of high-tech firms, manufacturers, and engineers, and has long been a leader in technological innovation. Finally, a recent strategic plan for the state of Florida targeted several clusters ranging from life sciences to clean energy in efforts to diversify its economic base.
A wide variety of methodologies can be used to identify clusters. For the purpose of this analysis efforts were made to use a methodology that encompasses a broad value-chain of interconnected industries otherwise known as “benchmark” clusters. These clusters can reveal important trends about the structure of the region’s economy and serve as a tool to develop a more in-depth cluster based economic development strategy. The seventeen clusters used for this analysis were developed by the Center for Regional Development at Purdue University under the auspices of the Economic Development Administration and cover a diverse range of specializations. An explanation of the methodology and supporting documents can be found in the technical document.
The top figure on the following page highlights the seventeen clusters and their employment levels in 2007. The top employing clusters include Business and Financial Services and Biomedical/Biotechnical (Life Sciences), which lead the group with employment over 350,000, while both Manufacturing and Advanced Materials have employment over 190,000.
Cluster analysis

9
Regional Snapshot
The figure below highlights the average wages of the top six clusters and shows how they compare to the average wage in those clusters for the United States. Five of the clusters offer a higher annual wage when compared to the average annual wage for these clusters in the nation. The manufacturing cluster in the region falls short of the national average by roughly $5,000.
Mining
Glass & Ceramics
Apparel & Textiles
Forest & Wood Products
Agribusiness FoodProcessing & Technology
Energy (Fossil & Renewable)
Chemicals &Chemical Based Products
Printing & Publishing
Defense & Security
Arts EntertainmentRecreation & Visitor
Information Technology &Telecommunications
Education & Knowledge Creation
Transportation & Logistics
Advanced Materials
Manufacturing Supercluster
Biomedical/Biotechnical(Life Sciences)
Business & Financial Services
0 100,000 200,000 300,000 400,000Employment
= 10,000
Sources: Chicago Metropolitan Agency for Planning, Illinois Department of Employment Security, Purdue Center for Regional Development.
Industry Cluster Employment Levels, 2007Cluster
$10,000 $30,000 $50,000 $70,000 $90,000
Manufacturing Supercluster
Transportation & Logistics
Biomedical/Biotechnical(Life Sciences)
Advanced Materials
Business &Financial Services
Sources: Chicago Metropolitan Agency for Planning, Illinois Department of Employment Security, Purdue Center for Regional Development.
Earnings Comparison of Industry ClustersCluster
U.S.
NortheasternIllinois

10
Industry Clusters
Concentration and Employment Growth of Clusters
Interpreting the chart:
The size of the bubble indicates the employment size (number of jobs).
The horizontal axis indicates the employment change over the seven-year period. Growth to the right of the graph is positive.
The vertical axis indicates the concentration of that industry relative to the nation. A concentration of 1.25 or higher indicates that the industry is much more heavily concentrated in the region than in the nation.
Conc
entra
tion
Employment Growth
BENCHMARK
0% 1% 2% 3% 4%-4%-5%-6% -3% -2% -1%0
.25
.75
1.0
1.25
1.75
1.5
.5
Sources: Chicago Metropolitan Agency for Planning, Illinois Department of Employment Security, Purdue Center for Regional Development 2007
Concentration and Employment Growth of Clusters
Business & Financial
Biomed/Biotech
Manufacturing Supercluster
Advanced Materials
Transportation &Logistics
Education
Info Tech &Telecom
Arts &Entertainment
Defense & Security
Printing &Publishing
Chemicals
Energy Agribusiness
Forest &Wood
Apparel &Textiles

11
Regional Snapshot
Conc
entra
tion
Employment Growth
BENCHMARK
0% 1% 2% 3% 4%-4%-5%-6% -3% -2% -1%0
.25
.75
1.0
1.25
1.75
1.5
.5
Sources: Chicago Metropolitan Agency for Planning, Illinois Department of Employment Security, Purdue Center for Regional Development 2007
Concentration and Employment Growth of Clusters
Business & Financial
Biomed/Biotech
Manufacturing Supercluster
Advanced Materials
Transportation &Logistics
Education
Info Tech &Telecom
Arts &Entertainment
Defense & Security
Printing &Publishing
Chemicals
Energy Agribusiness
Forest &Wood
Apparel &Textiles

12
Industry Clusters
The chart on the previous page provides information on the region’s cluster growth and concentration during the study period. Some further discussion of clusters with relatively high concentrations, growth rates, or size is below.
The Business and Financial Cluster is strongly concentrated in the region (1.32), is the largest cluster in terms of employment (450,709) and offers the highest average wage ($93,680). The recent consolidation of the commodities markets and the growth of financial and professional services have made the region a hub for highly skilled knowledge workers. Furthermore, the strength of this and other clusters (i.e., Biomedical/Biotechnical) has led to a growth in software and computer related companies in this region that develop software and electronics that help businesses run more efficiently.
The Biomedical/Biotechnical Cluster (Life Sciences) cluster is the second largest in terms of employment (361,732) and offers a competitive wage ($63,000). Although the cluster is not heavily concentrated, it has grown in recent years. The region is home to six research and technology parks, world renowned research hospitals, as well as medical and pharmaceutical companies. As an example of the health and life sciences aspect of this cluster, the Workforce Boards of Metropolitan Chicago highlighted the growing need for trained nurses and medical technicians in the report Health Care Workforce — Turning Crisis into Opportunity as part of an approach to workforce development.
The Advanced Materials Cluster has seen average employment decline over the study period, but it is heavily concentrated in the region (1.36) and is the fourth largest cluster (190,315). Further, it is composed of industries that pay a competitive wage ($66,000) above the national average. Research indicates that there has been a shift to niche manufacturing as well as a focus on the “green” economy. Agencies and companies are developing and discovering how the existing industrial base can adapted to green technology, green manufacturing, and renewable energy products, such as parts for wind or solar energy production, using advanced manufacturing. Many companies have moved away from traditional production line manufacturing and use more innovative design and engineering for specialized products that fit specific demands. Overall, manufacturing is adapting to an evolving supply chain, and global market and will have an effect on Advanced Materials and Manufacturing Clusters.
13
Regional Snapshot
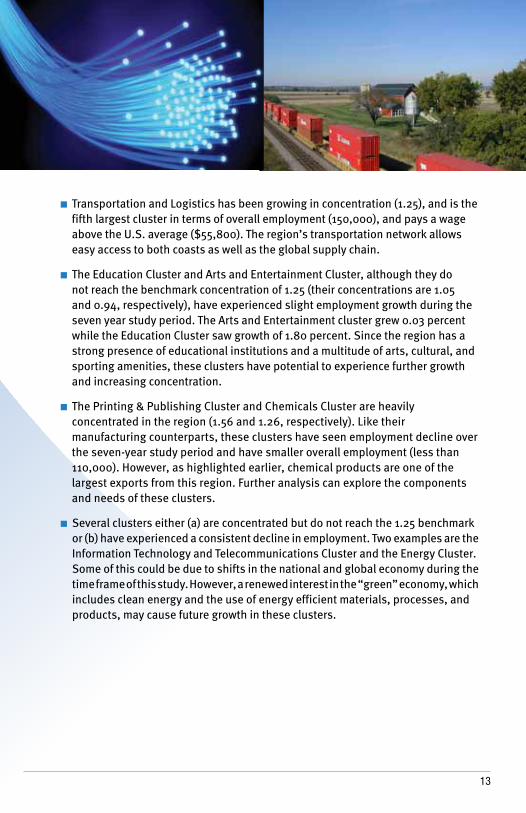
Transportation and Logistics has been growing in concentration (1.25), and is the fifth largest cluster in terms of overall employment (150,000), and pays a wage above the U.S. average ($55,800). The region’s transportation network allows easy access to both coasts as well as the global supply chain.
The Education Cluster and Arts and Entertainment Cluster, although they do not reach the benchmark concentration of 1.25 (their concentrations are 1.05 and 0.94, respectively), have experienced slight employment growth during the seven year study period. The Arts and Entertainment cluster grew 0.03 percent while the Education Cluster saw growth of 1.80 percent. Since the region has a strong presence of educational institutions and a multitude of arts, cultural, and sporting amenities, these clusters have potential to experience further growth and increasing concentration.
The Printing & Publishing Cluster and Chemicals Cluster are heavily concentrated in the region (1.56 and 1.26, respectively). Like their manufacturing counterparts, these clusters have seen employment decline over the seven-year study period and have smaller overall employment (less than 110,000). However, as highlighted earlier, chemical products are one of the largest exports from this region. Further analysis can explore the components and needs of these clusters.
Several clusters either (a) are concentrated but do not reach the 1.25 benchmark or (b) have experienced a consistent decline in employment. Two examples are the Information Technology and Telecommunications Cluster and the Energy Cluster. Some of this could be due to shifts in the national and global economy during the time frame of this study. However, a renewed interest in the “green” economy, which includes clean energy and the use of energy efficient materials, processes, and products, may cause future growth in these clusters.

14
Industry Clusters
The clusters identified in this preliminary analysis can be used as a basic foundation for the economic approach of the go to 2040 plan. Clusters depend on interaction and collaboration between companies, education and research institutions, and all levels of government. Based on size and concentration, likely clusters for regional focus include Professional and Business Services, Advanced Materials, and Transportation & Logistics. Others that may be relevant clusters as a result of growing concentration and employment growth include Biomedical/Biotech Cluster, Education Cluster, and Arts and Entertainment Cluster. Further research and analysis into these benchmark clusters can help clarify and contribute to the development of unique clusters in this region.
This report provides a basic analysis of clusters within the region, but additional work is needed before individual clusters can be selected for further focus. The next steps in this work are described on the following page.
The go to 2040 plan includes a scenario evaluation process that will guide the plan’s recommendations. Each scenario describes a specific economic future for the region, as well as policies and investments that support that future. The scenario evaluation process will include technical analysis and public involvement, and is meant to explore the positives and negatives of these alternative futures. The results of this evaluation are expected to assist in identifying industry clusters that should be the focus of the region’s efforts.
Further Discussion

15
Regional Snapshot
Next StepsSeveral next steps in this analysis are proposed below. The first step is to develop a methodology to identify and target detailed clusters, track them over time, and forecast future growth. Targeting specific clusters and tracking them can help determine if they are emerging clusters, established or maturing clusters or declining clusters. Such an analysis can assist to identify the most appropriate clusters for a regional focus and develop an effective approach to support their growth and development.
A second step involves addressing clusters at smaller geographies. Different parts of the region have specialized in different types of industries, leading to the formation of a variety of clusters. Identifying clusters at the county level or at even smaller geographies can help to understand what the needs of each cluster are, informing the development of strategies to support them.
Another helpful tool in the cluster development strategy is an asset map. An asset map can provide an inventory of firms connected to a particular cluster and identify its educational, research, and workforce requirements as well as possible infrastructure needs. It can also highlight networks and partnerships that foster and encourage cluster development in the region, helping to develop an economic development strategy. CMAP will then be able to target clusters, project future growth and recognize cluster life cycles which in turn will contribute to policy and investment strategies designed to build the region’s workforce and diverse economic base.
The Chicago Metropolitan Agency for Planning (CMAP) was created to integrate planning for land use and transportation in the seven counties of northeastern Illinois: Cook, DuPage, Kane, Kendall, Lake, McHenry, and Will. By state and federal law, CMAP is responsible for producing the region’s official, integrated plan for land use and transportation. The go to 2040 planning campaign will develop and implement strategies to address projected growth in population and employment and their serious implications for transportation, housing, economic development, open space, the environment, natural resources and other quality-of-life factors. See www.cmap.illinois.gov for more information.
About CMAP

FY09-0196