industry agenda global energy architecture performance
TRANSCRIPT
Industry Agenda
Global Energy Architecture Performance Index Report 2015
December 2014
Prepared in collaboration with Accenture

2 Global Energy Architecture Performance Index Report 2015
World Economic Forum91-93 route de la CapiteCH-1223 Cologny/GenevaSwitzerlandTel.: +41 (0)22 869 1212Fax: +41 (0)22 786 2744Email: [email protected]
World Economic Forum® © 2014 – All rights reserved.No part of this publication may be reproduced orTransmitted in any form or by any means, includingPhotocopying and recording, or by any informationStorage and retrieval system.
REF 261114

3Global Energy Architecture Performance Index Report 2015
Contents
4 Executive summary
5 Acknowledgements
6 The year in energy
7 The Energy Architecture Performance Index 2015
7 Methodology
8 Table of rankings
9 Key findings
10 Top performers
11 Major economies
13 Energy reform in major emerging economies: new models for sustained growth
13 Building long-term resilience
17 Enacting sound policies in solid institutions
19 Case study I - The mixed success of India’s Electricity Act
20 Case study II - Resource management in Brazil’s oil and gas sector
21 Signalling market readiness
22 Case study III - Attracting investment into Colombia’s oil and gas sector
23 Case study IV - Power sector reform in Nigeria
24 Mastering public engagement
25 Case study V - China’s air pollution policies
26 Case study VI - Subsidy reform in Indonesia
27 Architecting competitive energy systems
28 Conclusions
29 Weights, measures and abbreviations
30 Endnotes

4 Global Energy Architecture Performance Index Report 2015
A turbulent year for the energy sector, 2014 has been marked by geopolitical crises, stagnating global economic growth, and slow progress in lowering greenhouse gas emissions. Oil prices have displayed significant volatility and declined to levels last seen in 2010. Uncertainty exists in some producing regions, as tensions between the Russian Federation and Ukraine simmer, and the Islamic State of Iraq and Syria (ISIS)1 unleashes turmoil in the Middle East.
Policy-makers and businesses are coming to terms with these new dynamics as they seek to adapt energy systems to meet the needs of today and tomorrow, and significant energy reforms are under way in many countries in response to these new imperatives and opportunities. Economic growth and development, sustainability and energy security, and access remain the key pillars of any energy system, and decision-makers require credible information to make complex decisions across these three dimensions.
The Energy Architecture Performance Index (EAPI), developed by the World Economic Forum in collaboration with Accenture, aims to provide an additional set of data to help leaders benchmark the current performance of national energy systems, and inform decision-making in the context of the changes under way in the global energy landscape. Launched in 2013, the 2015 index has evolved to include the latest available energy data from 125 countries. Like any index, the EAPI cannot fully mirror the complexity of energy systems or of managing energy transition. It can, however, provide a better basis for comparison across nations and highlight strengths as well as areas of improvements to target.
Executive Summary
EAPI 2015 highlights
Switzerland topped the EAPI this year, scoring highly across all three dimensions of the energy triangle (economic growth and development, environmental sustainability and energy access and security). Most of the top 10 performers on the list are European and/or advanced economies, but the data reveals there is no common path to the top; resource endowment, geographic circumstances, boundary constraints and political decisions all play a role in performance. The findings from analysing the latest data from the EAPI give reason to pause for reflection on the direction the global energy system is taking:
– Despite substantial policy efforts worldwide, progress with improving the energy intensity of economies is lagging, especially in emerging and developing economies – the cluster as a whole achieves a score of 0.39 compared to 0.61 for advanced economies.
– Transition to a less carbon-intensive energy system is happening, but slowly – over one-third of countries on the EAPI have a percentage of non-carbon sources in total primary energy supply lower than 10%.
– Import dependence is growing across many energy systems (although this is being addressed through increased supply diversity, with an average score of 0.69 for this indicator across all countries on the EAPI).
– Energy access remains a challenge for a significant number of less advanced economies.
The pace of change within the energy system is challenging policy-makers and regulators to keep up and deploy regulation that facilitates the management of their energy sectors. With decisions underpinned by the scores of interconnections between every aspect of the energy system, this is no easy feat.
Energy reform in major emerging economies
This report also features a specific thematic focus on energy reform in major emerging economies. These economies will be responsible for the majority share of future energy consumption and are critical for the development of global energy markets and solving the sustainability challenges facing the world. Their success is critical not only for their own citizens, but for the entire energy system.
The EAPI is used to explore the energy transitions under way in different major emerging economies, and governments’ response to these via structural reforms of the energy sector.
Arthur HannaSenior Managing Director,Accenture Strategy,Energy Industry
Roberto BoccaSenior Director,Head of Energy Industries,World Economic Forum

5Global Energy Architecture Performance Index Report 2015
Acknowledgements
The World Economic Forum is pleased to acknowledge and thank the individuals and partners below, without whom the realization of the Energy Architecture Performance Index 2015 would not have been feasible.
World Economic ForumRoberto Bocca, Senior Director, Head of Energy IndustriesEspen Mehlum, Director, Head of Knowledge Management and Integration, Energy IndustriesThierry Geiger, Associate Director, Competitiveness TeamDavid Bustamante, Senior Manager, Design and Production
Project Adviser: AccentureArthur Hanna, Senior Managing Director, Accenture Strategy, Energy IndustryJames Collins, Managing Director, Accenture Strategy, Energy IndustryMike Moore, Project Adviser, New Energy ArchitectureTessa Lennartz-Walker, Lead AuthorAdditional acknowledgements: Herman Adrian, Michael Ding, Yuelong Fan, Oscar Granados, Wildy Gunawan, Bobby James, Shane Murphy, Raghav Narsalay, Abayomi Olarinmoye, Eduardo Plastino, Ololade Raji, Thea Ke Hui Tan
Chief Expert AdvisersMorgan Bazilian, Lead Energy Specialist, World BankDavid Victor, Professor of International Relations and Director, Laboratory on International Law, University of California, San Diego and Chair of the World Economic Forum’s Global Agenda Council on Governance of SustainabilityEirik Wærness, Chief Economist, Statoil
Data PartnersInternational Energy Agency (IEA)Gesellschaft für Internationale Zusammenarbeit (GIZ), the German Development AgencyWorld Bank (WB)World Trade Organization (WTO)United Nations Conference on Trade and Development (UNCTAD)
EditingFabienne Stassen, Director, EditOr Proof
Key messages that emerged from this analysis were:
Energy reform is required to build future resilience and enable sustained growth.
– The slowdown in global economic growth is a vivid reminder of the need for structural reforms across many emerging economies, and energy reform is a critical component of this agenda.
– Effective energy reform should reach beyond immediate imperatives to build capacity for future resilience. This capacity will be tested during times of crisis, and those with the ability to withstand stress will be most prepared to adapt to changing conditions.
– There is no universally applicable formula for energy reform; each country must develop and implement policies that address its own unique circumstances. Despite this, there are lessons to be learned from successes and failures of other countries to avoid some of the pitfalls of “learning by doing”.
Effective energy policy design is not sufficient; pragmatic implementation is critical for long-term success.
– Energy policy has to be built on strong governance, as well as solid institutions and macroeconomic policies, in order to create sustainable outcomes. This includes creating institutions that transcend political cycles to create the confidence and visibility needed to succeed in reforms, and modernizing and reforming state-owned enterprises (SOEs) to increase their effectiveness.
– Reforms that send clear signals to energy markets will pay real dividends, by increasing inward flows of investment into an energy sector and making these more competitive. At the same time, the role governments play in regulating markets remains paramount to address imperatives in the most effective way.
– Public engagement will be required to ensure buy-in to proposed reforms. To be effective, reformers need to master the art of consensus-building and communication to build and sustain public trust.
Energy reformers have an opportunity to architect the future energy system in a way that is more affordable, more sustainable and more secure. This is a long-term endeavour with significant challenges, but the prize for success is great. Effective reforms have the potential to put competitiveness back on track and contribute to sustained growth across a country’s economy.

6 Global Energy Architecture Performance Index Report 2015
The year in energy
A number of trends have shaped the global energy system over the past 12 months. The stagnation of the global economic recovery has had profound impacts across all sides of the energy triangle, with a refocusing on the ways that energy systems support national competitiveness and affect human welfare.
For economic growth and development, oil prices at a four-year low raise many uncertainties for energy systems across the world. Stagnant growth means lower demand for energy products. At the same time, global production has surged, driven by the shale revolution in the United States, and the re-emergence of some markets in the Middle East and North Africa. Lower energy prices will have uneven impacts on exporter and importer nations. Exporters reliant on high prices may find it difficult to meet their budgets. Importers may be able to harness the boost to their balance of payments and reduce fuel subsidies, which currently account for a substantial share of many governments’ budgets. Policy-makers are recognizing the need to tackle the corrosive effects of subsidies, but much more is needed to reduce the distortions that they create across energy markets.
For environmental sustainability, a few countries have made ambitious pledges, but global emissions trends continue to move in the wrong direction. Advanced economies have made promises to reduce greenhouse gas emissions,2 and some emerging economies used the United Nations (UN) Climate Summit to pledge to increase the share of renewables in their fuel mix (e.g. India, Mexico) and target emissions (e.g. Indonesia, Malaysia).3 More recently, the presidents of the United States and China agreed upon a landmark deal to further curb emissions, with the United States increasing its pledge to cut emissions by 2025, and China announcing that it will peak its emissions by or before 2030. Despite these promises, the current landscape still falls short of these targets, and emissions remain on the rise. One unexpected development may prove to have a significant impact on reducing emissions: popular concerns about air quality in major Chinese cities have prompted the government to address air pollution with an array of mitigation measures, at the core of which is a gradual diversification away from coal. While investment in clean energy has grown, much of it relies on subsidies. Their withdrawal, as was the case in Italy, Spain, Greece and the United Kingdom this year, can have a dramatically negative effect; investment has fallen by 74% in Italy and the United Kingdom as a result.4
For energy access and security, the simultaneous emergence of geopolitical tensions in several producing regions is testing assumptions about the existing energy world order. Sanctions from the United States and the European Union (EU) – banning Russian oil companies from raising investments in European markets, and Western firms from
supporting exploration or production activities – have put key Russian oil and gas projects at risk. Shell suspended its work on a joint venture with Gazprom Neft in October, with ExxonMobil and Total following suit. The impact of the recent round of sanctions on the Russian Federation has undoubtedly helped accelerate the signing of a $400 billion-worth deal to supply China with 38 billion cubic metres of gas annually (representing 20% of Gazprom’s sales in Europe), in a move described as Russia’s “tilt to the East”.5 In the Middle East, during the summer ISIS seized a number of oil assets, controlling large swathes of Syrian oil fields, as well as several Iraqi pumping stations, fields and refineries, leading some to refer to ISIS as a “new petro-state”.6
Now, more than ever, “sustained political efforts will be essential to change energy trends for the better”, and policy-makers and businesses are challenged to evolve their energy systems to meet the needs of today and the future.7 In so doing, they will need to ensure continued investments, and focus on balancing the triple energy goals: the requirements for energy security and access, sustainability and economic growth.

7Global Energy Architecture Performance Index Report 2015
The Energy Architecture Performance Index 2015
Methodology
In the context of recent trends and the broader energy transition under way, the Energy Architecture Performance Index (EAPI) provides a tool for decision-makers to holistically benchmark nations’ energy systems. The EAPI aims to support governments and other stakeholders along the energy value chain in identifying the relative performance of elements of their energy systems, in order for best practices to be diffused more widely and poor practices targeted. First launched in 2013, the EAPI has since been used to benchmark the performance of energy systems globally, as well as to assess the current energy architecture performance of individual nations.
The EAPI is a composite index that focuses on tracking specific indicators to measure the energy system performance of 125 countries.8 At its core are 18 indicators defined across each side of the energy triangle: economic growth and development, environmental sustainability, and energy access and security (Figure 1). Scores (on a scale of 0 to 1) and rankings are calculated for each of these indicators. These are then aggregated based on defined weightings to calculate a score and ranking for each sub-index, and for the EAPI overall.
The EAPI provides a transparent and easily comparable set of measures that can help track progress, and open new perspectives on the specific challenges faced by individual countries in each region. There are six key principles at the core of the index:
1. Output data only – use of output-oriented observational data (with a specific, definable relationship to the sub-index in question) or a best available proxy, rather than estimates
2. Reliability – use of reliable source data from renowned institutions
3. Reusability – data sourced from providers with which the EAPI can work on an annual basis, and that can therefore be updated with ease
4. Quality – selected data that represents the best measure available, given existing constraints
5. Completeness – use of data of adequate global and temporal coverage, and consistently treated and checked for periodicity to ensure the EAPI’s future sustainability
6. Review – the methodology is reviewed annually to ensure accuracy and policy relevance.9
The full methodology behind the EAPI is available online at http://wef.ch/eapimethodology.
Figure 1: The Energy Architecture Performance Index
f
Economic growth and developmentThis sub-index measures the extent to which a country’s energy architecture adds or detracts from economic growth
ation
ssions
This sub-index measures the environmental impact of energy supply and consumption
Environmental sustainability
ct
This sub-index measures the extent to which an energy supply is secure, accessible and diversified
Energy access and security
Fuel exports(% GDP)
Super gasoline -
level of price
distortion through
subsidy or tax
level of price
distortion through
subsidy or tax
Fuel imports(% GDP)
per unit ofGDP produced
energy use
Supp
orts
/det
ract
sfro
m g
row
thIn
tens
ity
Affordability
Diesel -for industryElectricity prices
Alternative andnuclear energy
N 2O emissions
in energy sector/
total population
CO2 emissionsfrom electricity
production
CH 4 em
ission
s
from en
ergy s
ector/
total popula
tionemiss
ions
PM10
Aver
age
fuel
econ
omy
for
pass
enge
r car
s
Ratio
of l
owca
rbon
fuel
sin
the
ener
gym
ix
Emissions impact
Diversif
ication
of import
Quality of
electricity supply
rate
Electrification
Population using
solid fuels forcooking
Ener
gy im
ports
(% o
f ene
rgy
use)
Dive
rsity
of t
otal
prim
ary
ener
gy s
uppl
y
coun
terpart
s
Self-sufficiencyDiversityof supply
Level and quality of a
cces
s
Energy Architecture Performance
Index

8 Global Energy Architecture Performance Index Report 2015
Figure 2: Table of rankings
Table of rankings
The rankings and scores for this year’s EAPI are shown in Figure 2.10
v Note on countries with the same scores but different rankings: country scores are reported here with a precision of two decimal points, although exact figures are used to determine rankings. This explains why countries with the same EAPI score on this Table display different overall rankings.
1
2
3
4
5
6
7
8
9
10
1112
13
14
15
16
17
18
19
20
21
22
23
24
25
26
27
28
29
30
31
32
33
34
35
36
37
3839
40
41
42
43
44
45
46
47
48
49
50
51
52
53
54
55
56
57
58
59
60
61
62
63
64
65
66
67
68
69
70
71
72
73
7475
76
77
78
79
80
81
82
83
84
85
86
87
88
89
90
91
92
93
94
95
96
97
98
99
100
101102
103
104
105
106
107
108
109
110
111
112
113
114
115
116
117
118
119
120
121
122
123
124
125
Czech RepublicUnited StatesAustraliaRussian FederationLithuaniaGreece
GuatemalaUkraineBrunei DarussalamRepublic of MoldovaIndonesiaVietnamUzbekistan
Malaysia
NicaraguaMacedonia, FYRBoliviaVenezuelaBelarusKyrgyz RepublicZambiaChina, People's Rep.Trinidad and TobagoGhana
Turkmenistan
Syrian Arab RepublicJamaicaHondurasBotswanaUnited Arab EmiratesOmanBosnia and HerzegovinaMozambiqueSenegalKenyaEgypt, Arab Rep.KuwaitJordan
NigeriaLebanonBangladeshNepalIran, Islamic Rep.
BeninCambodiaEthiopiaTanzaniaMongoliaYemen
Eritrea
PakistanSaudi ArabiaBahrain
Cote d’Ivoire
Qatar
Iraq
LibyaIndia
Haiti
Togo
SwitzerlandCountry
NorwayFranceNew ZealandSpainSwedenDenmarkAustriaColombiaPortugalCosta RicaUnited KingdomAlbaniaSloveniaUruguayIrelandFinlandHungaryGermanyLatviaCroatiaParaguayBrazilBelgiumCanadaNetherlandsRomaniaIcelandLuxembourgSlovak RepublicPeruJapanAzerbaijanChileCongo. Rep.
PolandItalySingaporeIsraelEl SalvaorArgentinaGeorgiaTajikistanArmeniaPanamaBulgariaKorea, Rep.TurkeyMexicoEstoniaEcuadorKazakhstanPhilippinesThailandTunisiaDominican RepublicNamibia
CountryCyprusAlgeriaSouth AfricaMaltaSri LankaMoroccoCameroonSerbia
EAPI0.80 0.71 0.79 0.890.79 0.68 0.74 0.960.77 0.62 0.81 0.880.76 0.62 0.77 0.900.76 0.70 0.72 0.870.76 0.59 0.79 0.890.75 0.71 0.67 0.880.75 0.64 0.73 0.890.74 0.75 0.61 0.840.73 0.61 0.71 0.860.72 0.69 0.69 0.770.72 0.60 0.66 0.890.72 0.71 0.74 0.700.71 0.56 0.70 0.880.71 0.68 0.67 0.800.71 0.66 0.66 0.810.71 0.54 0.70 0.870.71 0.57 0.71 0.830.71 0.60 0.65 0.870.70 0.60 0.69 0.820.70 0.64 0.63 0.830.70 0.67 0.79 0.630.70 0.56 0.71 0.820.69 0.50 0.74 0.850.69 0.59 0.61 0.890.69 0.53 0.66 0.880.69 0.65 0.63 0.790.69 0.38 0.90 0.790.69 0.70 0.62 0.750.69 0.50 0.73 0.830.68 0.79 0.55 0.710.67 0.58 0.60 0.830.67 0.59 0.62 0.800.67 0.65 0.55 0.820.67 0.71 0.74 0.55
0.65 0.64 0.52 0.790.65 0.46 0.65 0.840.65 0.59 0.56 0.790.65 0.61 0.53 0.800.64 0.54 0.66 0.730.64 0.64 0.55 0.730.64 0.48 0.72 0.710.64 0.42 0.87 0.640.64 0.44 0.76 0.720.63 0.66 0.57 0.670.63 0.54 0.61 0.750.63 0.56 0.51 0.820.63 0.54 0.53 0.810.62 0.57 0.54 0.750.62 0.53 0.54 0.780.61 0.56 0.59 0.690.61 0.56 0.50 0.790.60 0.55 0.60 0.650.60 0.49 0.52 0.780.59 0.47 0.50 0.800.59 0.61 0.51 0.650.59 0.58 0.66 0.53
0.67 0.52 0.60 0.880.66 0.59 0.51 0.890.66 0.67 0.45 0.870.66 0.60 0.59 0.800.65 0.58 0.66 0.720.65 0.57 0.57 0.81
Score
0.59 0.58 0.53 0.650.59 0.43 0.56 0.760.58 0.59 0.51 0.650.58 0.62 0.51 0.620.58 0.58 0.56 0.580.57 0.49 0.48 0.760.56 0.46 0.82 0.410.56 0.48 0.47 0.740.56 0.46 0.61 0.61
EAPIScore
0.56 0.33 0.56 0.790.56 0.48 0.42 0.780.55 0.41 0.54 0.690.54 0.45 0.54 0.640.54 0.43 0.52 0.680.54 0.37 0.57 0.670.54 0.40 0.78 0.440.54 0.33 0.45 0.830.54 0.46 0.35 0.800.54 0.46 0.61 0.540.54 0.52 0.36 0.740.53 0.44 0.47 0.700.53 0.32 0.58 0.700.53 0.32 0.60 0.680.53 0.25 0.72 0.630.53 0.44 0.84 0.320.53 0.46 0.40 0.710.52 0.41 0.46 0.690.52 0.45 0.64 0.480.52 0.47 0.36 0.740.52 0.32 0.46 0.770.51 0.44 0.41 0.680.51 0.50 0.42 0.610.50 0.35 0.45 0.690.50 0.34 0.52 0.640.50 0.41 0.53 0.550.50 0.64 0.37 0.480.49 0.47 0.21 0.800.49 0.37 0.30 0.810.49 0.46 0.29 0.720.49 0.33 0.87 0.270.49 0.48 0.50 0.500.49 0.39 0.71 0.360.48 0.33 0.43 0.690.48 0.44 0.16 0.820.47 0.34 0.42 0.66
0.46 0.44 0.60 0.340.46 0.46 0.40 0.520.45 0.52 0.39 0.440.45 0.40 0.62 0.330.44 0.31 0.25 0.770.44 0.44 0.67 0.220.44 0.43 0.57 0.320.43 0.47 0.49 0.320.42 0.34 0.75 0.190.42 0.31 0.73 0.220.41 0.36 0.27 0.600.40 0.48 0.32 0.39
0.47 0.46 0.57 0.380.47 0.32 0.81 0.280.47 0.44 0.44 0.520.47 0.39 0.19 0.820.46 0.23 0.41 0.75
Economic growth and development Global EAPI ranking EAPI scoreEnergy access and securityEnvironmental sustainability 0.80
Emerging and developing Europe
Latin America and the Caribbean
Advanced economies
Commonwealth of Independent States
Emerging and developing Asia
Sub-Saharan Africa Middle East, North Africa and Pakistan
9Global Energy Architecture Performance Index Report 2015
Key findings
The EAPI cannot provide all of the answers to what creates a high performing energy system, but it can effectively be used to make fact-based and data-driven comparisons to inform energy transition decisions. The following sections explore the key findings from this year’s EAPI, with a focus on insights derived from the analysis of top performers and major economies.
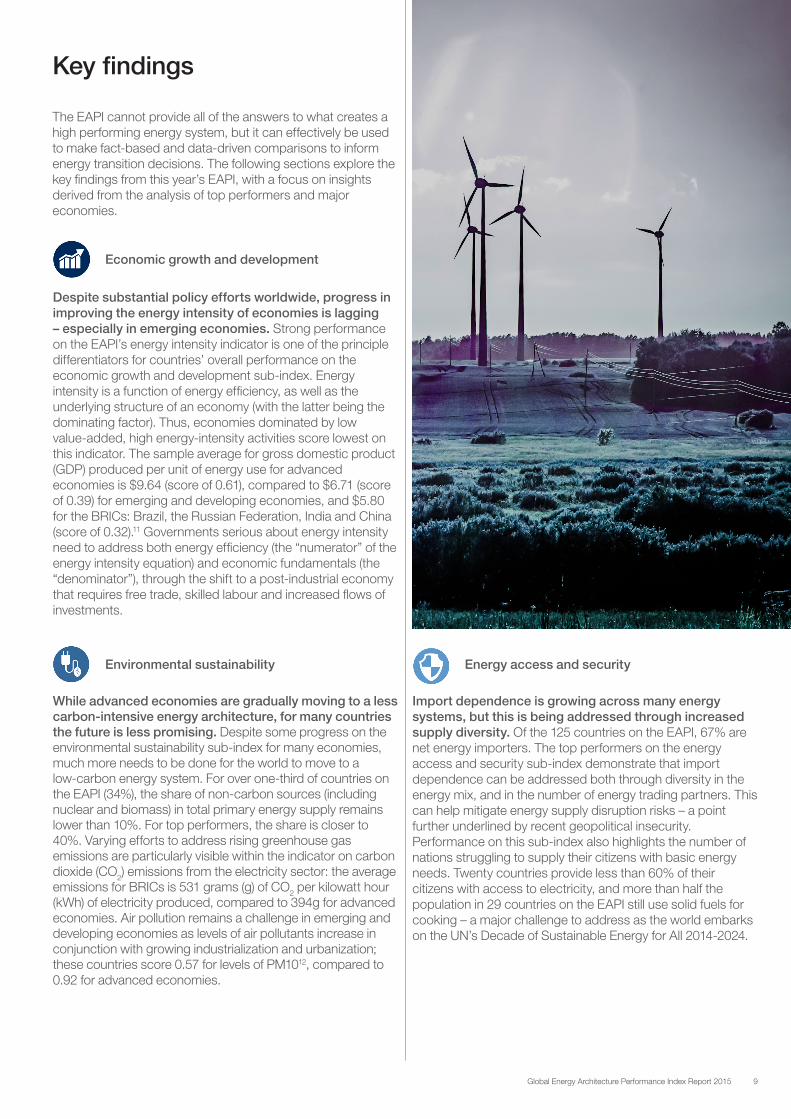
Despite substantial policy efforts worldwide, progress in improving the energy intensity of economies is lagging – especially in emerging economies. Strong performance on the EAPI’s energy intensity indicator is one of the principle differentiators for countries’ overall performance on the economic growth and development sub-index. Energy intensity is a function of energy efficiency, as well as the underlying structure of an economy (with the latter being the dominating factor). Thus, economies dominated by low value-added, high energy-intensity activities score lowest on this indicator. The sample average for gross domestic product (GDP) produced per unit of energy use for advanced economies is $9.64 (score of 0.61), compared to $6.71 (score of 0.39) for emerging and developing economies, and $5.80 for the BRICs: Brazil, the Russian Federation, India and China (score of 0.32).11 Governments serious about energy intensity need to address both energy efficiency (the “numerator” of the energy intensity equation) and economic fundamentals (the “denominator”), through the shift to a post-industrial economy that requires free trade, skilled labour and increased flows of investments.
Import dependence is growing across many energy systems, but this is being addressed through increased supply diversity. Of the 125 countries on the EAPI, 67% are net energy importers. The top performers on the energy access and security sub-index demonstrate that import dependence can be addressed both through diversity in the energy mix, and in the number of energy trading partners. This can help mitigate energy supply disruption risks – a point further underlined by recent geopolitical insecurity. Performance on this sub-index also highlights the number of nations struggling to supply their citizens with basic energy needs. Twenty countries provide less than 60% of their citizens with access to electricity, and more than half the population in 29 countries on the EAPI still use solid fuels for cooking – a major challenge to address as the world embarks on the UN’s Decade of Sustainable Energy for All 2014-2024.
While advanced economies are gradually moving to a less carbon-intensive energy architecture, for many countries the future is less promising. Despite some progress on the environmental sustainability sub-index for many economies, much more needs to be done for the world to move to a low-carbon energy system. For over one-third of countries on the EAPI (34%), the share of non-carbon sources (including nuclear and biomass) in total primary energy supply remains lower than 10%. For top performers, the share is closer to 40%. Varying efforts to address rising greenhouse gas emissions are particularly visible within the indicator on carbon dioxide (CO2) emissions from the electricity sector: the average emissions for BRICs is 531 grams (g) of CO2 per kilowatt hour (kWh) of electricity produced, compared to 394g for advanced economies. Air pollution remains a challenge in emerging and developing economies as levels of air pollutants increase in conjunction with growing industrialization and urbanization; these countries score 0.57 for levels of PM1012, compared to 0.92 for advanced economies.
Economic growth and development
Environmental sustainability Energy access and security

10 Global Energy Architecture Performance Index Report 2015
Top performers
The EAPI provides a window into the progress countries are making with energy transition, and nations performing well offer insights into best practice and different ways to manage the trade-offs between the dimensions of the energy triangle.
While the top 10 performers across the 2015 EAPI are all European and/or advanced economies – the exception is Colombia, which ranks 9th – their diverse energy systems demonstrate that there is no single transition pathway to a more affordable, sustainable and secure energy system
(Figure 3). Instead, each country’s performance is shaped by specific policies and investments over time and also, of course, by natural resource endowment, geographic circumstances and other boundary constraints.
What these countries do have in common is that they score well on several dimensions of the index. Many of the top 10 countries have undertaken successful reforms in past years and decades, underlining the potential for improving performance for all countries. But no country is perfect; these top performing countries also show room for improvement.
Figure 3: Top performers
With a score of 0.80, Switzerland tops the rankings for the EAPI 2015. Despite being dependent on energy imports, its energy system supports overall economic growth through low energy intensity (ranks 1st on this indicator), a diverse supply mix, and diversity of import counterparts. Switzerland also tops the World Economic Forum’s Global Competitiveness Index (GCI), which assesses the competitiveness landscape of 144 economies, highlighting some of the links between energy system performance and competitiveness.
These top performers demonstrate how a balanced approach to energy policy across energy efficiency, renewable energy, and security of supply can pay dividends. Norway (2nd) has an energy system characterized by a vast resource endowment, considerable energy export revenues, and a focus on developing renewable energies. With a score of 0.96 for energy access and security, it ranks first on this sub-index and highlights the extent to which its energy sector is safe from supply disruptions globally. Denmark (7th) aims to
become independent of fossil fuel consumption by 2050. This is being pursued through renewable energy, energy efficiency and climate change mitigation policies. Sweden (6th) has a high share of low carbon fuels in its energy mix, and has further increased its focus on renewable energy. This is reflected in strong performance across environmental sustainability, and energy access and security. However, it scores lower on the dimension of economic growth, with the lowest score (0.59) for this side of the energy triangle across top performers.
Many of these high performers have effectively implemented reforms in past years and decades, underlining the potential for all countries to improve performance. In Portugal (10th), the restructuring and privatization of former state energy utilities has created a grid better suited to the intermittency of renewable energy sources. Austria (8th) has been praised by the International Energy Agency (IEA) for the extent of its public funding dedicated to energy research, development

11Global Energy Architecture Performance Index Report 2015
and demonstration, which has tripled since 2007.13 As the sole emerging economy in the list of top performers, Colombia (9th) achieves high scores on energy access and security (0.84) and economic growth and development (0.75). While a direct link between energy reforms implemented in 2003 cannot be inferred, these policies have undoubtedly supported aspects of this performance on the EAPI.
Despite their high performance, these countries also face evolving challenges. Spain’s performance (5th) is based on the high diversity of its fuel mix and import counterparts (4th for this indicator), as well as fuel efficiency (1st for this indicator). However, government support for renewables through subsidies has led to an “electricity deficit” – the difference between the sum paid by utilities to power generators and the amount utilities gain from customers – which the government is now tackling.14 France (3rd), the highest performer among EU countries, achieves high scores across environmental sustainability and energy access and security (0.81 and 0.88 respectively). This is largely explained by the dominance of nuclear in its fuel mix; the government is now targeting this reliance through proposals to invest heavily in renewables. This could reduce the share of nuclear in electricity generation from 73.7% to 50%, with proposals to shut down 25 of its plants.15
Major economies
Given the key role the world’s major economies play in global patterns of production and consumption, it is valuable to understand the chokepoints facing their energy systems. With this in mind, this section examines the EAPI performance of the four largest advanced and four largest emerging economies by GDP (2013): the United States, China, Japan, Germany, France, Brazil, the Russian Federation and India (Figure 4).16
With the exception of France, none of these nations are in the group of top 10 performers on the EAPI. Previous work by the World Economic Forum on energy transitions highlighted the fact that faster resource transitions tend to be the preserve of small economies with suitable resources and policies.17 Large nations with complex energy systems tend to perform less well on the EAPI.
Figure 4: Major economies (comparison for select indicators)
Energy intensityHigher intensity = Lower score
Diversity of supplyHigher diversity = Higher score
CO2 emissions from electricity productionHigher emissions = Lower score
EAPI score (ranking)
China, P. Republic
Brazil Russian Fed.
India
Import dependenceHigher dependence = Lower score
Alt. & nuclear energy as % energy supplyHigher percentage = Higher score
0.70 (23rd) 0.66 (39th) 0.53 (89th) 0.51 (95th)
Germany
0.71 (19th)
USA
0.66 (37th)
Japan
0.67 (32nd)0.77 (3rd)
France
0.12 0.23 0.24 0.17
6.25 4.00 2.38 4.76
68 437 764 856
8% -80% 11% 28%
43% 9% 12% 26%
0.09
20%
477
8.33
60%
0.13
6.67
503
15%
16%
0.10
5%
497
4.17
94%
0.11
5.00
61
47%
52%
Notes on units and sources:• Energy intensity: GDP per unit of energy use (PPP $ per kg of oil equivalent) (Source: World Bank). For the purpose of this chart, the value of the data was inverted so
higher energy intensity corresponds to a larger symbol.• Diversity of supply: Level of diversity of total primary energy supply (TPES), Herfindahl index (Source: EAPI 2015). For the purpose of this chart, the value of the data
was inverted so more diversity corresponds to a larger symbol.• Alternative and nuclear as percentage of total primary energy supply: Alternative (incl. biomass) and nuclear energy as percentage of TPES (Source: IEA)• CO2 emissions from electricity production: CO2 emissions (grams CO2) from electricity generation in kilowatt hour (kWh) (Source: IEA)• Import dependence: Energy imports (net) as percentage of energy use (Source: World Bank)

12 Global Energy Architecture Performance Index Report 2015
Performance of these countries on the EAPI reflects policy choices and investments over time, as well as varying resource endowments, geographical conditions and other boundary constraints that also have influence. Brazil (23rd) for example is the highest performing of the BRICs nations, reflecting its diversified energy mix and rapidly growing domestic oil and gas sector. With an electricity supply dominated by hydropower, Brazil achieves a comparatively high score for environmental sustainability. The Russian Federation’s scores (39th) on the EAPI reflect the prevalence of domestic oil and gas in its energy sector which, while supporting economic growth through export revenues and affordable energy, comes at the cost of environmental sustainability. Only 9% of Russia’s Total Primary Energy Supply is from alternative energy (compared to 26% for India and 12% for China). In contrast to these resource-rich nations, the third largest economy globally, Japan (32nd), depends heavily on energy imports (94% of net energy use). The country has some of the highest electricity prices among Organisation for Economic Co-operation and Development nations. It ranks among the lowest of the major economies on environmental sustainability, with only 5% of its total energy supply coming from non-carbon sources. Japan’s fuel imports as a percentage of GDP, the costs of energy and the energy-related CO2 emissions have risen following the Fukushima accident, due to Japan’s increasing energy imports to compensate for the lack of nuclear energy capacity.
These nations provide some compelling illustrations of the scale and extent of the energy transitions under way. Germany’s (19th) Energiewende clearly highlights the benefits and risks associated with energy transition. Having decided to phase out nuclear energy production by 2022, and aiming to reduce emissions by 80% by 2050, Germany has built impressive capabilities across the renewables value chain. During the first half of 2014, 31% of electricity production in Germany came from renewable sources.18 But this has come at a cost: the EAPI highlights increased electricity prices for industry, and German households pay the second highest prices in Europe. Given low carbon prices, the interconnectedness of Europe’s markets and Germany’s phase-out of nuclear energy, the increased production from Germany’s carbon-intensive lignite plants has led to an increase in the country’s CO2 emissions and has influenced the overall energy mix in Europe. While Germany scores the highest on energy intensity of its economy, there is still room for progress on this indicator when compared to the top 10 performing nations.
In the US (37th), the surge in shale gas production has made it the largest natural gas producer in the world. Increased domestic production decreased net oil imports by 56% between 2005 and 2014. This is reflected in the share of fossil fuel imports as a percentage of GDP, which dropped to 1.3% of GDP from 2.8% in 2008. This is having a profound impact on national competitiveness; a 10% reduction in the relative price of natural gas in the United States led to an improvement in US industrial production (relative to that of the Euro area) of roughly 0.7% after one and a half years.19 Despite significant improvement on the CO2 intensity of its electricity sector, due to fuel switching from coal to electricity in recent years, more efforts are required to address the intensity of its electricity sector; the US gets a low score (0.50) for this indicator, with some of the highest levels of emissions among major
advanced economies.20 The recent deal announced with the government of China on cutting emissions is a step in the right direction.
While major economies face some similar challenges, a number of chokepoints stand out for emerging economies in particular. Scores on carbon emissions and energy intensity reflect the scale of the challenge of transitioning to a low-carbon and efficient energy architecture. Russia’s lowest scores overall are for these two indicators, and China and India – the two largest emitters of CO2 emissions per kWh in the electricity sector – also perform poorly on these indicators. For India (95th), the EAPI highlights the urgent set of challenges Narendra Modi faces in turning the country’s energy system around. India scores the lowest for energy access and energy security when compared to other BRICs nations (0.61 compared to an average of 0.72 for the BRIC cluster). One quarter of Indians lack access to electricity, and more than half still use solid fuels for cooking. In response, Modi has set ambitious targets for energy access (providing electricity to 300 million Indians currently without electricity) and renewables. This will likely help address the CO2 emissions intensity of India’s electricity sector, which is one of the highest among major economies. However, an already high dependence on imports is increasing, with imports of coal close to exceeding those of China.21 Addressing the growing gap between domestic demand and production to limit the increase in energy import bills will certainly be a core challenge for India in coming years.
China (89th) faces perhaps the most challenging energy transition of all. Energy use has nearly tripled since 2000, mostly due to the use of coal. While strong economic growth has accompanied this phenomenal increase, it has also resulted in a highly energy-intensive economy, high levels of air pollution, and an increasing need to import energy. Changing direction is a significant challenge, closely connected to efforts to restructure the economy overall. The government has already taken significant steps, and China is the world leader in many aspects of the transition. For example, in 2013, China accounted for 21% of all global renewable investment, adding more than five times the amount of wind and nearly twice as much solar as any other country.22 It has the world’s largest installed capacity of wind farms, is the world’s leading manufacturer of solar photovoltaic (PV) modules, and produces more hydroelectricity than any other country.23 The Action Plan for Controlling Atmospheric Pollution includes 10 measures to improve air pollution management, many of which are directly linked to the energy sector.
The need to become more energy efficient, more diverse and less carbon-intensive is especially acute for major emerging economies. Governments’ responses to these pressures through energy reforms are the focus of the next section.

13Global Energy Architecture Performance Index Report 2015
Energy reform in major emerging economies: new models for sustained growth
Building long-term resilience
Major emerging economies in the global energy system
Over the last two decades, the rise of emerging markets and developing economies has transformed the global economy, and in the process, reshaped the world’s energy system.24 With annual growth rates reaching 7.6% during the 2000s,25 emerging economies grew nine times faster than advanced economies between 2007 and 2014; today, they account for 57% of global output.26 With 90% of net energy demand growth until 2035 expected to come from emerging economies, understanding the key trends shaping the energy landscape of these economies offers valuable insights for the future of the global energy system.27
This section focuses on seven of the largest emerging economies when measured at GDP (2013) at purchasing power parity (PPP): Brazil, the Russian Federation, India, China – the BRICs – as well as Mexico, Indonesia and Turkey.28 These countries have a higher combined GDP (at PPP) than the current G7; this report refers to this cluster of countries as the “E7”.29 The economic power of the E7 economies is reflected in the energy sector today, with these seven countries accounting for close to 40% of total primary energy consumption (Figure 5) and 43% of total CO2 emissions (Figure 6).30
Figure 5: Countries’ share of global primary energy consumption (2013)
Figure 6: E7 countries’ share of global Carbon Dioxide emissions (2013)
Source: BP Statistical Review of World Energy June 2014 Source: BP Statistical Review of World Energy June 2014
14 Global Energy Architecture Performance Index Report 2015
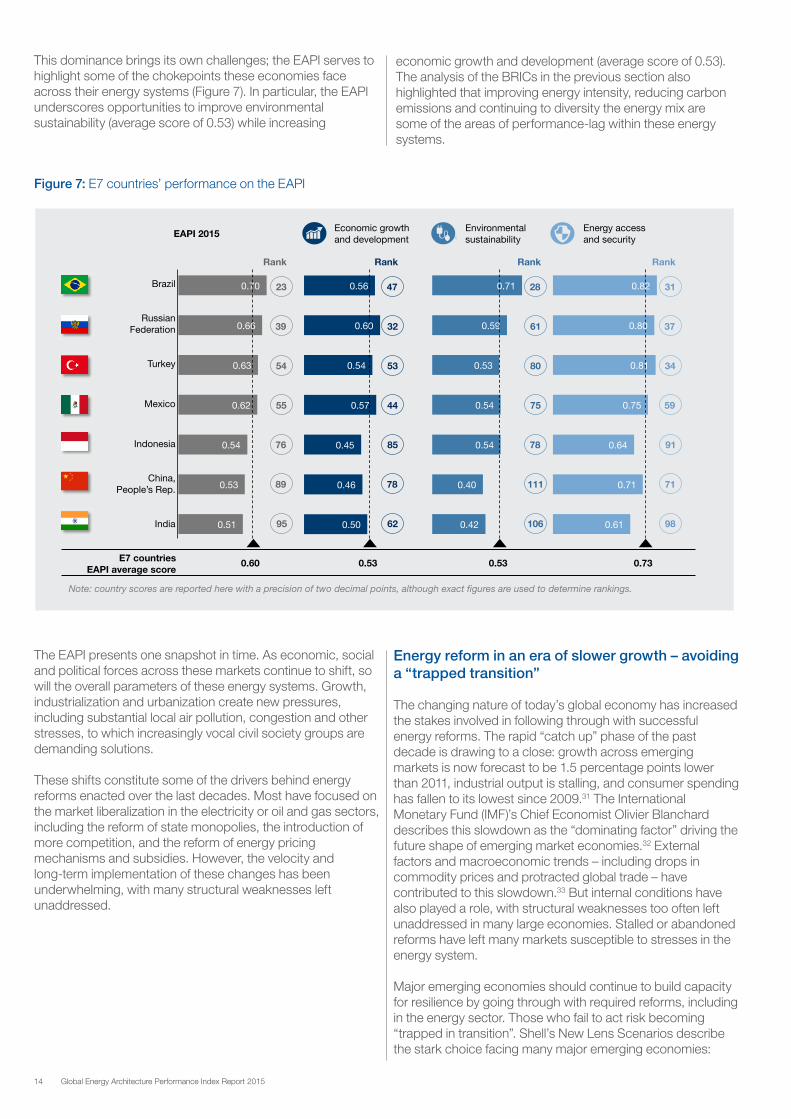
This dominance brings its own challenges; the EAPI serves to highlight some of the chokepoints these economies face across their energy systems (Figure 7). In particular, the EAPI underscores opportunities to improve environmental sustainability (average score of 0.53) while increasing
economic growth and development (average score of 0.53). The analysis of the BRICs in the previous section also highlighted that improving energy intensity, reducing carbon emissions and continuing to diversity the energy mix are some of the areas of performance-lag within these energy systems.
Figure 7: E7 countries’ performance on the EAPI
The EAPI presents one snapshot in time. As economic, social and political forces across these markets continue to shift, so will the overall parameters of these energy systems. Growth, industrialization and urbanization create new pressures, including substantial local air pollution, congestion and other stresses, to which increasingly vocal civil society groups are demanding solutions.
These shifts constitute some of the drivers behind energy reforms enacted over the last decades. Most have focused on the market liberalization in the electricity or oil and gas sectors, including the reform of state monopolies, the introduction of more competition, and the reform of energy pricing mechanisms and subsidies. However, the velocity and long-term implementation of these changes has been underwhelming, with many structural weaknesses left unaddressed.
Energy reform in an era of slower growth – avoiding a “trapped transition”
The changing nature of today’s global economy has increased the stakes involved in following through with successful energy reforms. The rapid “catch up” phase of the past decade is drawing to a close: growth across emerging markets is now forecast to be 1.5 percentage points lower than 2011, industrial output is stalling, and consumer spending has fallen to its lowest since 2009.31 The International Monetary Fund (IMF)’s Chief Economist Olivier Blanchard describes this slowdown as the “dominating factor” driving the future shape of emerging market economies.32 External factors and macroeconomic trends – including drops in commodity prices and protracted global trade – have contributed to this slowdown.33 But internal conditions have also played a role, with structural weaknesses too often left unaddressed in many large economies. Stalled or abandoned reforms have left many markets susceptible to stresses in the energy system.
Major emerging economies should continue to build capacity for resilience by going through with required reforms, including in the energy sector. Those who fail to act risk becoming “trapped in transition”. Shell’s New Lens Scenarios describe the stark choice facing many major emerging economies:

15Global Energy Architecture Performance Index Report 2015
build financial, technological, social and political capital through effective reforms to better withstand crises in the long term by adapting to changing conditions (through “room for manoeuvre”), or continue along the path of business as usual by postponing change, and risk having to passively react to changes within a trapped transition scenario.34 Ultimately, the latter option – reflecting “decision-making for the short term” – is not a valuable path forward; instead, those with the foresight to opt for the former will reap the greatest rewards.
Business as usual is no longer sufficient to regain the fast growth of the 2000s into the next decades, or to avoid growth from slowing down too much. In the “Report on the Work of the Government”, delivered at the Fifth Session of the Eleventh National People’s Congress in March 2012, former Chinese Premier Wen Jiabao remarked that the country’s economic model is likely to prove “unbalanced, uncoordinated and unsustainable”.35 Deep reforms of the energy sector are central to China’s broader structural reforms of the economy. Likewise, the ambitious energy reforms on which Mexico has embarked provide a strong example of the importance that energy reforms can play in a broader set of economic restructuring and modernization.
The prize: architecting a competitive energy system for the long term
Avoiding this trap will require new approaches. There is no simple reform formula; countries will need to find their own right path, drawing on the successes and failures of others, and balancing the trade-offs across the energy triangle. Addressing areas of value lag and identifying new sources of value are possible starting points to enable sustained growth. Ultimately, the right energy reforms have huge potential to positively impact a country’s economy, and put competitiveness back on track.
To address areas of value lag, governments will need to push forward existing reforms, with a particular focus on removing energy subsidies, improving the energy intensity of their economies, and making progress with market reform. Energy subsidies divert government revenues that could be utilized more productively within the energy sector or in other parts of the economy. For example, in Indonesia – which this year overtook the United Kingdom to join the ranks of top 10 economies by GDP at PPP36 – energy subsidies represented 18.8% of government spend in 2013 (up from 15% in 2006), the near equivalent of the UK government’s spend on the National Health Service.37 This is a huge political challenge for many emerging economies, so the removal of these needs to be carefully managed and synchronized with other reforms of the public sector to facilitate change while avoiding stirring protest movements. Energy intensity can be addressed through energy efficiency measures and economic fundamentals – the shift to a post-industrial economy that requires free trade, skilled labour and increased flows of investments. Market reforms involve both deregulation and/or increased regulation, to support decarbonization and diversification (e.g. through renewable targets or carbon prices) for example.
New imperatives also present an opportunity to better prepare for the future by creating new sources of value. This will include increased technological innovation and support for the development of new sources of supply, with emerging economies playing a key role – two-thirds of energy supply investment is expected to take place in these countries by 2035.38 China, for example, is successfully building new value chains in clean energy. It has become a market leader in solar power through a combination of government policies and market guidance, with the Golden Sun Programme, the Building Integrated PV subsidy programme and the Feed-in Tariffs for solar projects playing an instrumental role.39 China is now the largest solar PV market, doubling in 2013 and expected to grow by 30% in 2014.40 Transitioning to an energy system that provides more opportunities, as China’s solar programme shows, requires considerable investment and policies supporting the research and development of new technologies (including digital).
A number of governments are already exploring these opportunities. Most notably, in December last year, Mexico’s President Enrique Peña Nieto announced a number of far-reaching energy reforms across two main areas. First, private investment will be permitted throughout the entire oil, gas and power value chains. Second, the energy sector’s public entities – Pemex and CFE – will be transformed to improve their efficiency and profitability.
Other countries may soon follow suit. With growth in India falling below 5% for two consecutive years,41 the new government has a strong mandate to accelerate development and strengthen public service delivery. Prime Minister Modi has called for a “saffron revolution” to address India’s growing energy demand with renewable energy sources, primarily solar.42 The power sector is also changing, with new policies paving the way for the coal industry to gradually open up to private players.
These reform architects should bear in mind that effective energy policy design is not sufficient; pragmatic implementation is critical for long-term success. The energy reforms implemented under their watch will survive their time in office; effective reform in this context will be based on maintaining the long-sightedness required to think beyond the immediate future.
The next sections offer today’s reformers in emerging economies a number of insights gleaned from past energy reforms across three key areas: strengthening institutional capacity (“enacting sound policies in solid institutions”); attracting inward investment (“signalling market readiness”) and engaging with the public (“mastering public engagement”). This analysis is based on case studies spanning different types of energy policies (energy subsidies, changes to fiscal regime, air pollution regulations, etc.) across a portfolio of energy sectors (electricity, oil and gas) with six emerging economies: India, Brazil, Colombia, Nigeria, China and Indonesia. The overview of all case studies is shown in Figure 8.

16 Global Energy Architecture Performance Index Report 2015
Figure 8: Overview of case studies
I - The mixed success of India’s Electricity ActThis case study looks at how India implemented ambitious reforms in the electricity sector following the landmark Electricity Act of 2003, with mixed success across di erent states. It highlights how challenges in implementation resulted from fragmented lines of authority and a failure to instil a culture of performance in a number of state electricity boards.
II - Resource management in Brazil’s oil and gas sectorThis case study explores changes in Brazil’s oil and gas regulatory landscape in the second half of the 1990s, with market liberalization ending the state-owned incumbent’s long-term monopoly. It examines the ingredients for successful reform of state-owned enterprises, and concludes by highlighting the need for policies to be flexible and responsive to an ever-changing energy landscape.
III - Colombia’s 2003 oil and gas reformsThis case study reviews changes to Colombia’s oil and gas taxation regime following reforms implemented in 2003. It focuses on the impact of new and transparent incentive structures on Colombia’s exploration and production landscape.
IV - Power sector reform in NigeriaThis case study examines the ambitious power sector reforms being pushed through by the Federal Government of Nigeria. In contrast to past reforms, continued leadership from the head of government and ownership of a detailed road map of reform have so far signalled to investors that this government is committed to reform in the long run.
V - Public scrutiny and air pollution policies in the People’s Republic of China This case study looks at one of the factors behind the Chinese government’s increasing regulation of air pollution in major cities, namely increasing calls by the public – including on social media – to address levels of PM2.5 and PM10. This has resulted in the 2013-2017 Action Plan on Prevention and Control of Air Pollution and policies to limit coal use near large cities.
VI - Public engagement and subsidy reform in Indonesia This case study reviews the mixed success of fuel subsidy reform in Indonesia over the last two decades, highlighting the importance of public engagement in the success – or not – of these policy changes. It demonstrates how e ectively communicating the benefits that reforms can lead to will be essential to public buy-in to the reform programme.
Enacting sound
policies in solid
institutions
Signalling market
readiness
Mastering public
engagement

17Global Energy Architecture Performance Index Report 2015
Enacting sound policies in solid institutions
An essential element of successful energy sector reform is appropriate regulatory and governance structures. These underpinning frameworks need to be flexible and able to address fast-changing conditions, while providing long-term visibility and confidence to investors. They must be responsive to greater demand, not just increased supply, as well as support the next wave of investment and innovation, and be grounded in economic realities. Nations with responsive policy frameworks will be better placed to manage change and create competitive energy architectures. As energy reforms and transition will take several years to design - and decades to implement - the importance ofa conducive and strong institutional and regulatory framework that transcends shorter political cycles is critical.
Many countries are likely to face a gap between the desirable and the practicable. Their focus, therefore, must be on pragmatic, cost-effective solutions that produce results. Taking a step-by-step approach, by incorporating “second-best” strategies that cut a path through political-economic obstacles, will enable emerging economies to discover a suitable combination of policy instruments for their specific contexts.43 For the last three decades, economic transformation in China has followed this process of experimentation. The central government has encouraged local governments and state enterprises to innovate, selected successful solutions, and fed these back into policy-making – avoiding policy deadlock in the process.44
While pragmatism helps breed success, experience also shows that policy reforms tend not to produce lasting effects if background institutional conditions are poor. In fact, success appears to have as much to do with the ability of governments to manage the reform process effectively as with the form intervention takes; sound policies need to be embedded in solid institutions.45 The importance of a sound and fair institutional environment has become all the more apparent during the recent economic and financial crisis, and is especially crucial for further solidifying the fragile recovery.
Figure 9 highlights the scores of the E7 and leading three countries on the EAPI, and contrasts these with the institutions pillar of the World Economic Forum’s GCI46 and the WB’s measure of government effectiveness.47 Switzerland and Norway – top performers on the EAPI – score highly across all four metrics, and are among the top 10% (approximately) of nations in terms of government effectiveness. In contrast, the E7 are quite consistently below average performers. While the correlation is not direct – poor government effectiveness is not necessarily the result of poor institutional capacity – it is clear that building improved institutional capabilities will be an important area of focus if large emerging economies are to deliver effective energy reforms.
Examples of low levels of institutional capacity in the energy sectors of emerging economies abound. For example, advocacy groups have long highlighted a lack of regulatory oversight in China’s power sector.48 But attempts to address this have been scuppered by a lack of institutional capability. One such example is the short-lived State Electricity Regulatory Commission, which had the responsibility, though little authority, to approve market entry, set service obligations and standards, enforce laws, establish balancing areas and regulate safety. Another is the government’s pilot reforms to encourage more efficient electricity dispatch49, by which priority would be given to electricity supplied by more efficient and green producers. Despite the directive, grid operators continued to prioritize coal-fired plants run by SOEs.50 The electricity sector reforms under way may address some of these challenges.

18 Global Energy Architecture Performance Index Report 2015
Figure 9: Energy sector performance relative to institutional capabilities
As SOEs in both the oil and gas and utilities sectors play a prevalent role across the E7, they will be central to the reform process. In many cases, SOEs have successfully harnessed benefits from the energy sector and driven broader development. In other cases, however, SOEs are inefficient managers of national resources, obstacles to private investment, drains on public coffers, or sources of patronage and corruption. Their reform, therefore, lies at or near the top of the policy agenda of many emerging economies.
But what makes for good governance of enterprises in the energy sector? According to Chatham House, five principles are key:51
1. Clarity of goals, roles and responsibilities: Overlaps in political and commercial decision-making can lead to a lack of clarity, duplication of effort and policy paralysis. Effective governance systems set clearly defined lines of authority, separating policy-maker, regulator and operator responsibilities.52
2. Sustainable development for the benefit of future generations: Sustainable development policies aim to meet the needs of the present, without compromising future generations, by considering the sector’s long-term social and environmental impacts.
3. Enablement to carry out the role assigned: For optimum performance, SOEs and their oversight bodies must have access to the capabilities necessary to meet their objectives and responsibilities. This includes financial resources, human capacity and supporting processes.
4. Accountability of decision-making and performance: To avoid malpractice, accountability requires clear delegation, capable institutions and mechanisms of enforcement. The choice and empowerment of regulators are important parts of this process.
5. Transparency and accuracy of information: The effectiveness of governance mechanisms depends on reliable and timely information, which is, in turn, an important means of increasing trust between society and the sector.
The two case studies that follow show how adhering to these principles may help breed success, and conversely, failure when flouted. The mixed success of the 2003 Electricity Act in India was a consequence of fragmented lines of authority and a failure to instil a culture of performance in a number of state electricity boards. In contrast, the successful growth of the oil and gas sector in Brazil was supported by the creation of an authoritative independent regulator, and the effective enablement of the National Oil Company (NOC), Petrobras.
Source: World Economic Forum, Energy Architecture Performance Index 2015 (‘EAPI’ column); World Economic Forum, Global Competitiveness Index 2014/15 (‘Public institutions’ and ‘Private institutions’ columns); World Bank, Worldwide Governance Indicators (‘Gov. effectiveness’ column)

19Global Energy Architecture Performance Index Report 2015
This case study looks at how India implemented ambitious reforms in the electricity sector following the landmark Electricity Act of 2003, with mixed success across different states. It highlights how challenges in implementation resulted from fragmented lines of authority, and a failure to instil a culture of performance in a number of state electricity boards.
In 1991, the amendment to the 1948 Electricity Supply Act opened India’s power sector to private participation in power generation. This aimed to address power shortages and financial losses, and was part of a broader programme of economic reforms designed to address India’s balance-of-payments crisis. In the face of crippling power shortages, states restructured their vertically integrated state electricity boards (SEBs) and established state electricity regulatory commissions (SERCs) to improve performance. But state utilities’ commercial performance continued to deteriorate and, by 2002, total SEB debt had risen to $8.5 billion, threatening their financial solvency.53 In response, the Electricity Act (EA) of 2003 was designed to create a new framework for the power sector. It delicensed thermal generation, introduced open access in transmission and distribution, and mandated the unbundling and corporatization of SEBs, with the aim of creating a more commercial culture.
Despite the EA’s considerable achievements in boosting installed capacity, expanding the role of renewables, and creating an integrated transmission system, some have described the power sector as in a state of “crisis”, with fuel shortages, a non-remunerative retail tariff regime, and high aggregate technical and commercial losses defined as the root causes.54 Power sector losses, excluding state government support (subsidies) to the sector, amounted to $11.6 billion in 2013-2014,55 equivalent to nearly 14% of India’s gross fiscal deficit, and around 0.6% of GDP.56 India is the worst performing of the E7 nations on the EAPI, ranking 95th, and the poor performance of its power sector is a key contributing factor – it ranks in the bottom quartile (93rd) for the quality of its electricity supply. The lack of reliable power is a leading concern for industry and a constraint to growth.
The challenges in India’s power sector are seen not as a failure of the EA’s design, but of its implementation. While the potential of the sector overall remains unrealized, several states and utilities have made significant progress. With all states operating under the terms of the same regulatory framework, the differentiating factor in their performance has been the extent of adherence to the EA’s terms. A number of common challenges have been highlighted:57
– While unbundling the SEBs has progressed quite well on paper, their actual separation and functional independence is considerably less than it appears.
– Boards remain state dominated, lack sufficient decision-making authority, and are rarely evaluated on performance. Utility boards tend to have more
government and executive directors, and fewer independent directors, than recommended under the corporate governance guidelines issued by the Department of Public Enterprises. Only 16% of the 69 utilities studied have the recommended share of independent directors, and several lack them altogether.
– A lack of accountability, limited autonomy, and constrained technical capacity have restricted the ability of SERCs to create an independent, transparent and unbiased governance framework for the sector that balances consumer and investor interests. SERCs have been established in all states but have generally struggled to achieve true autonomy from state governments
In 2000 the Gujarat Electricity Board (GEB) was one of India’s worst-performing power utilities—a drag on the government’s finances and the state’s development. A decade later, the Gujarat Urja Vikas Nigam Ltd. (GUVNL) the holding company, comprising six interlocked companies, is a model public utility, winning innovation and customer service awards. It is efficient, agile, and profitable. State leaders gave full support to the turn-around. While power purchase remained centralized even after the GEB was unbundled, authority and decision-making were decentralized to constituent companies, each with its own corporate office and a professional board. Politicians were replaced by bureaucrats and professionals on the board of GUVNL, the holding company, as well as the boards of its constituent units, while the very best generalist administrators were appointed to the top management of the unbundled utilities. Strong political backing was given to the staff of the power distribution companies (discoms). Competition among discoms contributed to galvanizing employees around corporate goals. And a culture of performance management around key performance indicators (KPIs) further enhanced staff participation.58
This case study provides some insights into how ineffective state governments can serve to obstruct the reform process and lead to unintended consequences of reform. On the other hand, political will and leadership has the potential to drive through reforms in a substantive manner, as shown through the success story of Gujarat. With the past chief minister for Gujarat state now prime minister of India, there is hope that these lessons will be heeded for today’s ongoing regulatory changes to India’s electricity sector.
India on the EAPI 2015:
Score
0.51Ranking
95th
Case study I The mixed success of India’s Electricity Act: lessons learned from successful implementation in Gujarat

20 Global Energy Architecture Performance Index Report 2015
This case study explores changes in Brazil’s oil and gas regulatory landscape in the second half of the 1990s. Successful growth in the oil and gas sector was supported by the creation of an authoritative independent regulator, and the effective enablement of the NOC Petrobras. It also highlights the need for policies to be flexible and responsive to an ever-changing energy landscape.
In the second-half of the 1990s, Brazil’s oil and gas sector regulatory regime was comprehensively overhauled. Petrobras’ monopoly came to an end, and upstream exploration and production was opened to international investment. The 1997 Act 9.478 also created the National Council for Energy Policy (CNPE) to set policy for the energy industry, as well as an independent regulator, the Agência Nacional do Petróleo, Gás Natural e Biocombustíveis (ANP).
ANP is the principle government agency charged with monitoring the oil sector’s development. It is responsible for implementing CNPE’s resolutions, setting guidelines for licensing rounds and local content requirements, promoting the continuity of exploration and production in mature areas, monitoring compliance, and enforcing penalties when targets are not achieved. Local content requirements form part of ANP’s responsibility for contracting and mandating in order to promote the participation of small companies in the sector. As such, ANP breaks down engineering procurement and construction contracts into smaller, standardized orders that local firms can realistically fulfil, as well as promotes awareness of opportunities. These efforts are further supported by the Programme for the Mobilization of the National Oil and Natural Gas Industry, a programme coordinated by Petrobras and the Ministry for Mines and Energy to help develop local professionals and supply chains.59
The steps taken to liberalize the oil and gas sector have contributed to a substantial strengthening of both Petrobras’ and Brazil’s energy sector’s governance, productivity and financial performance. After many years of production lagging behind domestic consumption, Brazil is now recognized as a major hydrocarbons resource-holder and producer, attracting major international upstream investment. Indeed, of the Latin American nations involved in oil and gas production, only Brazil and Colombia (which also went through the process of introducing an independent regulator, improving fiscal terms and restructuring its national oil company, Ecopetrol) have seen production growth over the past 15 years, unlike Mexico, Venezuela and Argentina.60
This achievement is reflected in the EAPI, where Brazil is one of the highest scoring emerging economies, placing 23rd (alongside Colombia, which is the highest performing emerging economy overall, placing 9th), making it the highest placed of the E7. The oil and gas sector contributes significantly to Brazil’s ranking and the nation’s coffers; its transparent competitive bidding process, through a series of 10 licensing rounds, saw acreage awarded to 78 companies (Brazilian and international), while its local content policies have served to create a vibrant services sector (by 2007,
70% of exploration and production relied on local content, up from 25% in 1999).61
From a governance perspective, the pendulum is now swinging back – towards a larger state role and more interference with Petrobras as a state enterprise. The operating environment that was developed during the 1990s and into the 2000s has now evolved significantly. The scale of discovered ‘pre-salt’ reserves, which are expected to help Brazil triple its oil production,62 led the Brazilian authorities to conclude that, for these resources, the concession-based system had to change. As a result, in a designated geographical area that covers the parts of the Campos and Santos basins with pre-salt potential, the pendulum has swung back towards a guaranteed role for Petrobras and a different system of resource management, involving a higher government take. The new regulatory framework includes a number of notable attributes, the key of which is that the concession based framework previously used was replaced by a production sharing agreement, requiring Petrobras to be the sole operator of each production-sharing agreement (PSA) and hold a 30% minimum stake in all pre-salt projects.63
Industry commentators have emphasized the pressure that the new regulatory regime places on Petrobras, whose annual upstream spend to 2017 of $30 billion represents 5% of the anticipated global total. This pressure is amplified by the fact that as a national oil company, it also has a responsibility to maintain a large and diverse portfolio of activities across the oil and gas value chain.64 Local content requirements have been criticized for making production in Brazil even more expensive, so in less favourable times (e.g. in the context of reforms in Mexico and cheaper oil prices), these policies could prove unproductive. In addition to these factors, slow development, lack of competence and high costs are hampering the growth of oil production in Brazil. And there are concerns that pre-salt fields in the country (considering local content requirements, the mandatory role for Petrobras, etc.) could become less attractive to foreign investors because of new competition from Mexico, which enjoys a reputation as an investor-friendly country.
This case study shows how governance changes helped reform Brazil’s oil and gas sector from the mid-1990s. It also underscores the need for institutions to be flexible and adaptive to change. If developments go well for Petrobras in the medium term, the company will emerge from the pre-salt process with greatly increased production. This will help support its financial situation (contingent upon government policies on fuel prices, oil prices in the international markets and the evolution of the company’s refining capacity). For the time being, the impact of the sector on Brazil’s finances may be less clear.
Brazil on the EAPI 2015:Case study II Resource management in Brazil’s oil and gas sector: the swinging pendulum
Score
0.70Ranking
23rd

21Global Energy Architecture Performance Index Report 2015
Signalling market readiness
The transition to an energy system that is more secure, more affordable and more sustainable will require adequate levels of investment across the entire energy value chain. Energy systems need to keep up with growing energy demand by ensuring continuous sources of supply, increasing efficiency and enabling the transition to a low-carbon energy architecture while supporting economic growth.
Over the last three years, annual investment in global energy supply surpassed $1.6 trillion, supported by investment in renewables, the increase in global demand, and higher prices in many countries.65 This represents a substantial increase historically (50% since 2000). However, more capital is required to continue generating sufficient levels of energy to keep up with demand. In its New Policies Scenario, the 2014 World Energy Investment Outlook estimates that 25% more investment is required per year by the 2030s ($2 trillion annually), totalling $48 trillion between 2014 and 2035.66
Emerging economies are expected to account for nearly two thirds of this energy-supply investment ($25.2 trillion)67 – and 15% of global investment will take place in China. Investment in electricity in particular will need to be substantial in order to keep up with demand.68 This capital is likely to come from a variety of sources including state funding, energy investors, banks and capital markets.
Despite the promise of growing markets, the barriers to investment into emerging economies’ energy sectors are many, including weak institutions, political instability and deep-rooted market inefficiencies. Subsidies, in particular, create substantial price distortion – for both gasoline and diesel. Investors are looking to policy-makers to address these as
“decisions to commit capital to the energy sector are increasingly shaped by government policy measures and incentives, rather than by signals coming from competitive markets”.69 Governments need to demonstrate to investors that their institutional frameworks are strong and stable, and that their energy policies are credible and consistent.
This is no easy task. On the one hand, governments in emerging markets are focused on deregulating and opening up markets by signalling market readiness to potential investors. This can take a number of forms, including rebalancing the risk-reward ratio of investments, and signalling commitment to long-term changes. Foreign Direct Investment (FDI) is attracted by working institutions, with inclusive institutions enabling smart policies.70 On the other hand, energy markets are imperfect, and have to be regulated to work for the public interest (e.g. internalization of externalities). Thus, governments need to implement the right signals to respond to challenges in the sector.
This section explores two case studies of reforms that have rebalanced the risk/reward ratio and signalled market readiness – one in the oil and gas sector, and one in power. The first case study is focused on changing incentives for oil and gas investors through amendments to the fiscal regime in Colombia. Reforms initiated more than a decade ago have yielded impressive results for its oil and gas sector, including increased flows of FDI into the sector. The second case study turns to Nigeria, where $10 billion in investment is required in the power sector for the government to meet its growth targets. So far, reforms have benefited from real momentum supported by a clear and consistent road map, as well as visible leadership from the Head of Government.

22 Global Energy Architecture Performance Index Report 2015
This case study reviews changes to Colombia’s oil and gas taxation regime following reforms implemented in 2003. It focuses on the impact of new and transparent incentive structures on Colombia’s exploration and production landscape.
At end of the 1990s and the beginning of the 2000s, the Colombian oil sector was in steady decline. Production was falling rapidly, from a 1999 peak of 800,000 barrels per day to 541,000 barrels per day in 2003. The oil and gas market was stagnating, with few new discoveries made. To make this situation worse, guerrilla attacks on oil assets imperilled security. Investment began falling, with FDI declining from a peak of $1.4 billion in 2000 to $300 million in 2003. Colombia’s future energy self-sufficiency was in doubt.
To address this situation, President Alvaro Uribe, elected in 2002, pushed through a series of reforms in the oil and gas sector starting with Decree 1760 of 2003. An overall energy regime overhaul, including a number of innovative policy measures, led to a 50% increase in contracts signed,71 an eight-fold increase in exploration area,72 as well as a 61% increase in production between 2009 and 2012.
More significantly, the oil sector received $5.39 billion of FDI in 2012, accounting for 34% of total FDI in Colombia.73 As well as establishing Colombia as “one of Latin America’s foremost destinations for investment into the oil and gas sector”,74 these successes produced a number of additional benefits, including increased infrastructure expansion.75
This success is reflected in Colombia’s EAPI performance, with the country achieving 9th place and leading other Latin American and Caribbean countries by a wide margin. It scores particularly high for economic growth and development (0.75), where it takes the second place in the index, and for energy access and security (0.84). As a net oil exporter, Colombia has successfully exploited its natural resources for economic purposes, as is highlighted by its high score on the fuel imports per GDP (0.89). Thus it is useful to examine the lessons learned from the 2003 reform programme – in particular how changes in policies led to heightened levels of investment into the sector.
A number of regulatory changes played a role in turning the Colombian oil and gas sector around and attracting increased investment. Reforms included Ecopetrol’s transition from a fully-owned state company to an independent and integrated entity, the set-up of an independent regulator, the Agencia Nacional de Hidrocarburos or ANH (National Agency of Hydrocarbons) in 2003 to manage exploration and production activities, and overall improvements in regulatory stability and internal security. In 2007, Ecopetrol sold 11.5% of its shares to the Colombian people, retirement funds and other local and international companies. This change in ownership led to a change in mindset. Ecopetrol now had to compete with the global oil and gas sector, no longer just within its own borders.
These changes notwithstanding, one of the most significant reforms for prospective oil investors was the shift of the fiscal regime from being based on production sharing contracts (PSCs), to being a concession-based regime founded on royalties and taxes.
The pre-2003 tax regime under the so-called “association contract” was heavily biased towards the state-owned Ecopetrol.76 Until 2003, private players could only operate through PSAs with Ecopetrol. This led to a situation whereby the risk balance was heavily weighted against potential investors, who had to take on all of the risk themselves. Until the introduction of a sliding scale, a foreign company paid 100% of the costs of exploration to the NOC. At the point of discovery, 20% in royalties had to be paid to Ecopetrol with 50% of production assumed by the NOC at the start of exploitation.77 Then a sliding scale was introduced, with which Ecopetrol’s stake increased.78
These PSCs ended in 2003 through Decree 1760 and were replaced by an exploration and production contract.79 Since then, the fiscal regime in Colombia has been based on a combination of royalties, corporate income tax and further special oil taxes paid to ANH.80 This is a great improvement for foreign investors, who now enjoy a more equitable share of rewards from increased production. For new oil discoveries, royalties are on a sliding scale from 8 to 25% based on average field production (monthly average in barrels of crude per day).81 For gas exploitation, 80% is applied to oil royalties for onshore and offshore.82 This new system allowed international oil companies to own a 100% stake in oil ventures – a substantial improvement on the old regime. Beyond royalties, the government take on profits is transparent, with various economic rights paid to the ANH for rights to use the subsoil, participation and technology transfer rights. Additionally, overall improvements in the security landscape across Colombia made the country more attractive to foreign investors.
This case study highlights how the right market incentives have significant potential to turn an energy sector around. In particular, shifting the risk/reward balance to a more equitable middle ground supports wider deployment of capital into the market. Today, the big bet for the Colombian oil and gas industry is related to unconventional reservoirs – some estimates show Colombia holding some of the largest deposits of unconventional crude in Latin America, after Argentina.
Case study III Attracting investment into Colombia’s oil and gas sector: redressing the incentive balance through fiscal reforms
Colombia on the EAPI 2015:
Score
0.74Ranking
9th

23Global Energy Architecture Performance Index Report 2015
This case study examines the ambitious power sector reforms being pushed through by the Federal Government of Nigeria. In contrast to past reforms, continued leadership from the head of government and ownership of a detailed road map of reform have so far signalled to investors that this government is committed to reform in the long run. But only the future will tell whether these reformers have truly learned from past mistakes.
As the largest country in Africa, with a population of 160 million growing at 6% per annum, Nigeria faces a number of challenges across the energy triangle. Above all, it needs to address an acute energy deficit. Ranking 116th on the energy access and security sub-index, only half of the Nigerian population has access to electricity (only 10% in rural areas), with power shortages affecting the quality of electricity for those who do receive it (Nigeria ranks116th for this indicator).83
Nigeria has plentiful natural resources. It has one of the largest natural gas reserves globally, with an estimated 182 trillion cubic feet (Tcf) of proven reserves.84 And with abundant levels of daily solar radiation, estimates suggest that the country could generate approximately the daily energy equivalent of the energy from a 192,000 megawatt (MW) gas power plant working at full capacity for 24 hours a day.85 However, consistent under-investment in capacity, sub-standard maintenance of power assets and poor management of resources mean that power consumption per capita is one of the lowest in the world. As a consequence, individuals and businesses pay huge amounts to access energy, adding up to 40% of the cost of doing business.86 This has a serious impact on Nigeria’s competitiveness.
The Federal Government of Nigeria estimates that the country requires 40,000 MW of additional capacity to address these constraints and support wider economic development.87 With current installed generating capacity at 7,500 MW, plugging this gap will require $10 billion of investment across the electricity supply chain to 2020.88 The government plans to increase the supply and use of gas across the country, with a total investment of about $25 billion. Nigeria also hopes to start exporting power beyond the West African region to Central and South African countries – but this hinges on the delivery of Nigeria’s electricity transmission super grid, estimated to cost about $5 billion.89 Overall, the levels of investment required to enable energy transition are significant.
Past attempts to reform the power sector offer a vivid reminder of the scale of these ambitions. Sadly, most have failed to live up to expectations – the National Electric Power Policy was launched in 2001, but stalled during the transfer of assets and liabilities to private partners; the Nigeria Electricity Regulatory Commission was created but later suspended; a multi-billion dollar National Integrated Power Projects was started but then stalled.90 These attempts resulted in “$40 billion spent with little improvement”.91
There are signs, however, that this time, the reform story could unfold differently. In 2005, the government’s Electric Power Sector Reform Act initiated a process of privatization of the power sector to address these challenges and improve access to electricity
across the country. This started with the unbundling of the single generation and distribution body in Nigeria, the National Electric Power Authority, into 18 different assets for sale to private investors – remaining functions and assets were incorporated into the newly formed Power Holding Company of Nigeria Plc (PHCN). Last year, licenses and share certifications for all PHCN assets were sold, including generation and distribution companies. And earlier this year, the successful bidders for seven of Nigeria’s gas power plants with investments worth $5.8 billion were announced. A number of memorandums of understanding have been signed with foreign companies, including General Electric, Siemens AG and Daewoo E&C.92
Among the different factors contributing to the current positive direction of the reforms, two stand out. The first is the continued leadership of the reform programme by Nigerian President Goodluck Jonathan. Having assumed office in May 2010, Jonathan identified reform of the power sector as one of the “cardinal” priorities for his government.93 Since then, the President has set up a Presidential Task Force on Power and a Presidential Action Committee on Power. To date, this ownership of the reforms by the Head of Government appears to have broader buy-in by incumbents with potentially opposite priorities. The second factor is the government’s Roadmap to Power Sector Reform of August 2010, which lays out the key timelines the reforms need to meet in order to stay on track. These include the successful review of the Multi-Year Tariff Order II and the successful bidding of the different assets. Along with continued leadership from the government, following this road map truly sustained the momentum throughout the process and signalled to investors that the government was committed to reform in the long term.
Nevertheless, a number of challenges still need to be addressed before the government’s long-term goals become a near-term reality. Although a $213 billion intervention fund has been provided to offset legacy debt in the power industry, and the human capital and asset optimization efforts of the investors have also been deemed successful, many of the investors are still cash-strapped, and are seeking funds to carry out the significant upgrade the assets require. Another challenge is the pricing regime, with subsidies continuing to distort the market and undermine the effectiveness of the reforms under way. Legal objections raised by Ethiope Energy concerning the sale of three of the gas power plants and non-completion of some of the National Integrated Power Projects also cause some concern. Ethiope Energy has accused the Bureau of Public Enterprise of “bias, prejudice and conflict of interest”.94 Finally, persisting delays in declaring the Transitional Electricity Market State (originally due to begin in October 2013), risk undermining the success achieved so far.
This case study illustrates how visible leadership with reform backed at the highest levels, as well as commitment to a clear implementation plan along a defined road map, can support progress with reform at an acceptable speed. Although many other factors will play a role in defining investment decisions, the local regulatory and institutional landscape constitute some of the most important.
Case study IV Power sector reform in Nigeria: attracting $10 billion in annual investment
Nigeria on the EAPI 2015:
Score
0.46Ranking
114th

24 Global Energy Architecture Performance Index Report 2015
Mastering public engagement
Governments are all too aware of the need for public support for their policies. Lack of buy-in by the public can derail proposed changes in energy policies put forward by reforming governments, particularly against a backdrop of slower economic growth. There is no clearer example of this than the development of shale gas, with public opposition, often based on misconceptions, impeding progress in a number of nations.
The vast majority of people rely on energy every day for heat, light and mobility – but despite the fundamental role it plays in everyone’s lives, the importance of energy reform often fails to register with consumers. In Mexico, for example, only 10% of respondents to a recent poll felt that energy reform is the most important reform, compared to 39% for education.95 At the very least, governments must find ways to engage the public to secure awareness of the importance of reform if they are to achieve any meaningful impact. The tide is changing though, as the burgeoning middle classes with access to social media find new ways to make their views known.
An expanded middle class in the emerging economies means higher demand for energy and heightened expectations of energy services, including access to affordable energy to sustain their needs, and stronger calls for environmental protection. The rise of social media is going hand-in-hand with rising demands for greater transparency in policy, including that of energy. Global environmental coalitions are spearheading calls for greater care for the environment using digital platforms. In China, public discontent surrounding levels of air pollution in major cities has stirred policy-makers into tackling this.
The complexity of the energy sector, and its central role in the wider economy, mean that serious reform involves negotiation and interplay between numerous interlocking institutions and political forces. Progress is therefore often slow – but the slow pace of change should not be a barrier. Engaging stakeholders across the energy value chain will be essential to build and sustain momentum for reforms, and constant communication is required to do this. Some form of opposition is inevitable, but experience has shown that public acceptance can be increased with the right engagement strategy and policy mechanisms. These include energy literacy initiatives, “nudge” techniques inspired by the fundamentals of behavioural economics, and broader consensus-building and targeted communication.
Public engagement takes different forms in different countries – vibrant democracies have long had more vocal populations, so their experience offers some insight for other nations. In the United Kingdom, Swiss-based chemicals group Ineos (which recently acquired a stake in a shale oil and gas license in Scotland) announced that it planned to pay 6% of revenues from any production to local landowners and communities.96 Through public engagement, reforming governments can ensure effective and transparent information-sharing, build public consensus for reforms and sustain public trust – both in the new policies and in the implementing institutions.
Opposition to reforms that are in the public interest can occur because of a belief that the benefits will not reach citizens; this is often the case for subsidy reform. Institutions can align expectations by sending clear and credible policy signals on the direction of change. Given government timeframes vis-à-vis those of the energy transition, it is important to consider how long-term commitments can be made credible – novel institutional and legal structures can provide this credibility. The United Kingdom’s statutory climate adviser, the Climate Change Committee, exists independently of governments; Mexico’s Climate Change Act legally ties hands of future governments, requiring them to accede to, amend or repeal legislation if they go back on targets.
Institutions that are trusted by citizens to execute policies in the public interest will perform better, as they guide public expectations, and will be held accountable for their successes and failures. Governments in Scandinavia have long been expected to invest in long-run issues related to the environment, and will be electorally liable if they do not. In Germany, despite electricity prices increasing over the past five years because of the Energiewende, 70% of the population still back the transition plans because of the public’s broad “trust in the state”.97 By contrast, institutions that are not trusted – for example because they are subject to corruption or are not responsive to changing societal demands – will not be trusted to deliver policies in the public interest.
The next two case studies explore how public scrutiny can galvanize reform and, conversely, how support is required for reforms to have a long-lasting impact. Continuing public support and trust are fundamental to sustain long-term change. Reformers need to master the art of consensus-building and communication to continually sustain public trust.

25Global Energy Architecture Performance Index Report 2015
This case study looks at one of the factors behind the Chinese government’s increasing regulation of air pollution in major cities, namely increasing calls by the public – including on social media – to address levels of PM2.598 and PM10. This has resulted in the 2013-2017 Action Plan on Prevention and Control of Air Pollution and policies to limit coal use near large cities.
Levels of air pollution in China have been rising over the last few decades, in conjunction with industrialization and urbanization, and subsequent growing emissions from motor vehicles, coal-fired plants, industrial production and construction. This is reflected in China’s ranking on the environmental sustainability sub-index of the EAPI (111th). Levels of PM10 are particularly high (108th for this indicator), while CO2 emissions from electricity production are some of the highest in the world (109th).
The Chinese government was initially relatively slow in responding to rising air pollution, until growing public awareness and pressure on social media led it to update the decade-old National Ambient Air Quality Standards (NAAQS) in 2012 with the inclusion of PM2.5 and ozone standards.99
Public scrutiny of the government’s response to air pollution has increased in conjunction with a number of trigger events, including the publication of PM2.5 levels by the US Embassy in 2011, and northern China’s so-called “airpocalypse” in January 2013, when it suffered from one of the worst smog episodes of air pollution in local history. These high levels of air pollution sparked public attention and pressure to tackle the issue, putting reduction of local air pollution at the top of the government’s agenda, and prompting a 10-point plan to tackle the problem.
Social media allows the Chinese public to access air pollution information online on the so-called “green public sphere”.100 Online information travels at high speed – when the US Embassy in Beijing started to publicize city levels of PM2.5 on Weibo (the Chinese equivalent of Twitter) in 2011, the attention of a few individuals quickly became a “public obsession”. Sales of masks and filters soared. With the new NAAQS being implemented in more than 160 cities across China, national air quality data was officially disclosed and routinely recorded on Weibo and through smart phone apps.101 Additionally, a number of influential micro-bloggers – the so-called “Big Vs” – started discussing the issue via their social media feeds.102 As a result, air pollution challenges are now truly on the public radar; 47% of Chinese say air pollution is a “very big” problem in their country, and public scrutiny of the government’s response has intensified.103
The government has responded swiftly to this public pressure, announcing a range of measures both at local and national levels. In 2011, the government began providing more accurate data on air quality. At the local level, it has set up a number of air quality monitoring stations across the largest cities. At the national level, in September 2013 the government launched the Action Plan on Prevention and Control of Air Pollution, as well as regulations to limit new coal projects in smoggy areas in North China, Shanghai and Guangdong. Finally, the Ministry of Environmental Protection – historically relatively weak in its administrative powers compared to other ministries – has recently been given more authority to act on air pollution, given the changing situation.
In addition to sustaining public trust in this issue, the government needs to build administrative capacity to understand the sources of pollution and the mitigation remedies required and, crucially, to implement them. The recent climate deal reached between the United States and China has been touted as a “historic agreement” that commits both countries to cuts in their nations’ carbon emissions, and fundamentally shifted the global politics of climate change. But looking back on history, the people-led change in air pollution policies may be credited with having a far greater impact on China’s carbon emissions than external pressures to address climate change.104
Case study V China’s air pollution policies: public scrutiny and social media
China on the EAPI 2015:
Score
0.53Ranking
89th

26 Global Energy Architecture Performance Index Report 2015
This case study reviews the mixed success of fuel subsidy reform in Indonesia over the last two decades, highlighting the importance of public engagement in the success – or not – of these policy changes. It demonstrates how effectively communicating the benefits that reforms can lead to will be essential to public buy-in to the reform programme.
One of the greatest barriers to energy reform are fossil fuel subsidies – government measures that keep prices below market levels for consumers, or above market levels for producers. Well meaning, but ineffective, energy subsidies were originally put in place to improve energy access for the poorest, but have left governments stuck with expensive measures that predominantly middle class consumers have grown used to. Recognized as bad policy, in 2009 the G20 countries got together and pledged to eliminate fossil fuel subsidies. But since then global energy subsidies have doubled, with the IMF putting the total figure at $2 trillion per year.105
One of the most visible outputs of energy reform for ordinary citizens in emerging economies is likely to be a rise in fuel prices, particularly in the context of subsidy reform. In countries without properly functioning tax and transfer systems, raising the cost of gas and electricity foments public discontent, which has stymied previous governments’ attempts at change – despite the boost to competitiveness this change would bring.
For the two EAPI indicators on price distortion of fossil fuels, Indonesia displays poor performance relative to other major emerging economies, placing 111th for super gasoline and 109th for diesel compared to other countries on the EAPI. Subsidies represent a significant portion of the federal budget (20%), amounting to $20 billion annually.106 Thus, budgetary pressures constitute important drivers of reform, as the government needs to reduce levels of subsidies to lessen the slowdown in growth and keep the fiscal deficit low.107 This has become even more pressing since Indonesia became a net importer in 2004, underlining its dependence on imports of expensive fuels. As such, it comes as no surprise that the new government has identified subsidy reform as one of its priorities – less than one month after assuming office, President Joko Widodo announced cuts to fuel subsidies commenting that “the decision to transfer the fuel subsidies to a number of productive sectors is aimed at creating a budget that is more useful for the Indonesian people overall”.108
Although the recent fall in oil prices may help, successive Indonesian governments’ records in this area of energy reform highlight how challenging this can be. Addressing Indonesia’s high subsidies has been attempted numerous times, and in most cases, with limited success. The key barrier to effective removal of subsidies has been in the form of public opposition. Given this shaky history, politicians are only too aware of the political minefield this poses: in 1998, President Suharto’s regime collapsed during the Asian financial crisis after raising fuel prices under pressure from the IMF; in 2008, protests took place; in
2013, violent clashes occurred after the parliament raised the price of subsidized gas and diesel fuel by 44%.109
A number of considerations should be kept in mind when embarking on the reforms the country needs. The IMF concluded that six elements are required for successful reform of subsidies in the energy sector, many of which are linked to engagement with the public to heighten trust on the nature and purpose of reform.110 These elements include a comprehensive sector reform plan, an extensive communications strategy, appropriately phased price increases, targeted measures to protect the poor, and institutional reforms that depoliticize energy pricing. Various solutions have been proposed in the past, including the concept of Sunset Credits, where subsidies are replaced with credits, put into the hands of the consumer to be redeemed for a range of products or services.111 As part of his announcement to cut subsidies, President Jokowi promised that the government would provide low-income families with several social protection cards, including the Indonesian Health Card (KIS), the Indonesian Smart Card (KIP) and the Prosperous Family Card (KKS) which is a step in the right direction.112
The removal of such subsidies needs to be synchronized with other reforms of the public sector. A successful solution will be one that provides meaningful, feasible choices for consumers who work in the local market, securing the public support needed to enact energy reform.
Case study VI Subsidy reform in Indonesia: public engagement and trust
Indonesia on the EAPI 2015:
Score
0.54Ranking
76th

27Global Energy Architecture Performance Index Report 2015
Architecting competitive energy systems
This section of the report explores the topic of energy reform in major emerging economies, focusing on seven of the largest emerging economies.
The analysis highlighted a number of findings, including:
Governments across major emerging economies should continue to architect the future energy transition through reforms in the energy sector. These are required to continue to adapt to a changing global energy landscape, particularly in the context of the gyrations of the global economy. Above all, reforms should aim to increase energy systems’ capacity for resilience; carrying on with business as usual will leave governments with insufficient capacity to withstand stress and will force them instead to react to changes, leaving them with little “room for manoeuvre”.
There is no universally applicable formula for energy reform. Each country must develop and implement policies that address its own unique circumstances. Successful energy reform cannot be defined against some ideal outcome, and there is no one-size-fits-all approach. Despite this, there are lessons to be learned from energy reforms implemented in other emerging economies with similar challenges over the last decades.
Reform is a long-term undertaking, with progress likely to be measured in decades rather than years. The closest definition of success will consist in a longer-term vision energy systems are moving towards, a process exercised with diligence and at a politically acceptable speed. Successful
reform is as much about implementation as it is about the nature of the reform itself. The case studies explored in this report underlined that policy-makers should keep this in mind by:
– Enacting sound policies in solid institutions. Policy changes must go together with the ability and will to implement, which require solid institutions and strong governance. Effective reforms will require modernizing and reforming SOEs to increase their effectiveness.
– Signalling market readiness. Energy reforms should provide the right signals to markets to respond to emerging challenges in the energy system in the most effective way, and to attract the levels of inward investment required to facilitate the energy transition.
– Sustaining public engagement. Engaging stakeholders across the energy value chain will be essential to build and sustain momentum for reforms; this requires constant communication.
The complexity of the energy sector and its central role in the wider economy mean that serious reform will involve negotiation and interplay between numerous interlocking interests. Progress can appear slow-paced, but this should not be a barrier to serious reform. Although some degree of failure is perhaps inevitable, the benefits that will arise from success will dwarf any setbacks along the way. Ultimately, effective reforms have the potential to put competitiveness back on track and contribute to sustained growth in the long term.
28 Global Energy Architecture Performance Index Report 2015
Conclusions
Continued uncertainty and volatility – geopolitical, economic and social – will continue to impact energy systems around the world, and influence the decisions governments face in architecting the future energy system. The EAPI can support decision-makers by providing a framework and factual basis for the evaluation of energy challenges.
This year’s EAPI demonstrates that there is no well-trodden path to an energy system that performs well across all three sides of the energy triangle. All economies must confront, to a greater or lesser extent, similar challenges. All countries – regardless of their stage of development – need to understand the influence of each side of the energy triangle in their unique context, and formulate policies accordingly. But emerging economies face some of the most pressing challenges in building an energy system that is more affordable, sustainable and secure.
The global economic slowdown is reshaping the environment in which the transition is taking place, heightening the need for energy reform to secure economic growth and better prepare for the future. Business as usual is not an option to secure the transition to a high-performing energy system. Choosing inaction today is likely to result in deeper challenges in the future.
Successful energy reform is as much about implementation as it is about effective design – strong governance, market effectiveness and public engagement are fundamental. Governments architecting the future energy transition along these principles will reap the rewards in the long term.

29Global Energy Architecture Performance Index Report 2015
Appendices
Weights, measures and abbreviations
$ All $ in US$ unless otherwise noted
ANH Colombia’s National Agency for Hydrocarbons
ANP Brazil’s National Agency of Petroleum, Natural Gas and Biofuels
BRICs Brazil, Russia, India, China
CNPE Brazil’s National Council for Energy Policy
CO2 carbon dioxide
discoms Power distribution companies
E7 Used in this report to describe seven of the largest emerging markets by GDP PPP (2013)
EA Electricity Act
EAPI Energy Architecture Performance Index
EC European Commission
EU European Union
FDI Foreign Direct Investment
g gram
G7 The Group of 7 major advanced economies as reported by the IMF: Canada, France, Germany, Italy, Japan, the United
Kingdom and the United States
GCI Global Competitiveness Index
GDP Gross Domestic Product
GEB Gujarat Electricity Board
GIZ German Federal Enterprise for International Cooperation
GUVNL Gujarat Urja Vikas Nigam Ltd
IEA International Energy Agency
IMF International Monetary Fund
ISIS Islamic State of Iraq and Syria
kWh kilowatt hour
MW Megawatt
NAAQS National Ambient Air Quality Standards
NOC National Oil Company
PHCN Power Holding Company of Nigeria
PM10 Particulate matter less than 10 micrometres in diameter
PM2.5 Particulate matter less than 2.5 micrometres in diameter (also called “fine particles”)
PPP Purchasing power parity
PSA Production-sharing agreements
PV Photovoltaic
SEB State Electricity Board
SERC State Electricity Regulatory Commission
SOE State-owned enterprise
Tcf Trillion cubic feet
tr trillion
UN United Nations
UNCTAD United Nations Conference on Trade and Development
WB World Bank
WTO World Trade Organization

30 Global Energy Architecture Performance Index Report 2015
Endnotes
1 This is also translated as the Islamic State of Iraq and the Levant (ISIL), and sometimes referred to as Islamic State (IS).2 The European Union pledged to reduce emissions from 40% by 2030 (from 1990 levels) and the United States promised a reduction of 30% by 2030 (from 2005 levels) for carbon emissions from the power sector (US EPA Fact Sheet: Clean Power Plan Framework; European Commission (2014) 2030 framework for climate and energy policies).3 Carbon Brief (2014) All the significant announcements from the UN climate summit, and whether they’re new, 24 September 2014 4 Financial Times (2014) Investment in clean energy rising after two years of declining growth, 2 October 20145 QCM (2014) Business as Continuation of Politics by Other Means: The Sino-Russian Gazprom Deal, 1st August 20146 Foreign Policy (2014) Islamic State Is the Newest Petro State, 28 July 20147 IEA (2014) World Energy Outlook 20148 Serbia was added to the full list of countries in the EAPI 2015 (it was not included in the EAPI 2014) as it now meets the requirements for inclusion.9 As part of the updates to this year’s EAPI, the model has been recalibrated, and the normalization approach for PM10 and weightings for some of the indicators have been revised. This recalibration represents an improvement to the EAPI model. It does not impact the key messages from last year’s report. Due to this recalibration, comparisons with previous editions of the EAPI are not presented.10 Note on countries with the same scores but different rankings: country scores are reported here with a precision of two decimal points, although exact figures are used to determine rankings. This explains why countries with the same EAPI score on this Table display different overall rankings.11 In this report, advanced economies are defined based on the IMF’s classification (2013).12 PM10 is particulate matter less than 10 micrometres in diameter.13 IEA (2014) IEA praises Austria for well-balanced energy policy, but sees areas for further improvement, 9 April 2014 14 Kelly-Detwiler, P. (2013) Renewable Energy in Spain: the Good, and the downright ugly, 8 May 201315 Financial Times (2014) Special Report – European Energy, 23 October 201416 Based on the World Bank’s (2014) GDP ranking, 2013, the four largest advanced economies are the United States, Japan, Germany and France and the four largest emerging economies are China, Brazil, the Russian Federation and India.17 World Economic Forum (2013) Energy Vision 2013 – Energy transitions: Past and future, 201318 Bloomberg Businessweek (2014) Germany Reaches New Levels of Greendom, Gets 31 Percent of Its Electricity From Renewables, 14 August 201419 IMF (2014) World Economic Outlook, October 201420 It should be noted that this score is based on 2011 data on CO2 emissions from the electricity sector in the EAPI 2015.21 Financial Times (2014) Indian coal import growth outstrips China, 6 October 2014 22 World Resources Institute (2013) Renewable Energy in China: A Graphical Overview of 2013, China FAQs, The Network for Climate and Energy Information, 201323 World Resources Institute (2013) Renewable Energy in China: A Graphical Overview of 2013, China FAQs, The Network for Climate and Energy Information, 201324 This report follows the World Energy Outlook (WEO) categorization of advanced versus emerging market and developing economies. The main criteria used by the WEO to classify the world into advanced economies and emerging market and developing economies are (1) per capita income level; (2) export diversification – so oil exporters that have high per capita GDP would not make the advanced classification because around 70% of its exports are oil; and (3) degree of integration into the global financial system (World Economic Outlook, Frequently Asked Questions, October 2014).25 The Economist (2014) The headwinds return, 13 September 2014 26 Financial Times (2014) The new world economy in four charts, 7 October 201427 IEA (2013) World Energy Outlook 2013 Factsheet – How will global energy markets evolve to 2035?28 This is based on the GDP (2013) ranking, PPP data published by the World Bank (2014). The list excludes Saudi Arabia for the purpose of this analysis.29 Total GDP 2013 PPP for the G7 countries amounted to $33.2 million, compared with $35.2 million for the E7 countries.30 BP (2014) Statistical Review of World Energy, June 201431 Blanchard, O. (2014) Legacies, Clouds and Uncertainties, 7 October 201432 Blanchard, O. (2014) Legacies, Clouds and Uncertainties, 7 October 2014 33 The Economist (2014) The headwinds return, 13 September 2014

31Global Energy Architecture Performance Index Report 2015
34 Shell (2014) New Lens Scenario – A Shift In Perspective For A World In Transition, 201435 CNBC (2013) Has China’s Economy Hit a ‘Dead End’?, 15 April 201336 Financial Times (2014) 8 October 201437 Annual Government of Indonesia Financial Report 2013 and Annual Government of Indonesia Financial Report 200638 IEA (2014) World Energy Investment Outlook39 Global Data (2014) China’s Rapid Renewable Energy Growth Driven by Ambitious Government Policies, 26 June 201440 IHS Technology (2014) Solar Installations to Rise 20 Percent in 2014, Thanks to Strong Fourth Quarter, 8 October 201441 OECD Economic Outlook, Vol. 2014/142 RTCC (2014) India PM Modi targets ‘saffron’ revolution for solar energy, 9 June 2014 43 Dani Rodrik, The Past, Present and Future of Economic Growth, Global Citizen Foundation, Working Paper 1, June 201344 S. Heilmann, Experimentation under hierarchy: Policy experiments in the reorganization of China’s state sector, 1978-2008, Centre for International Development, Harvard University, 200845 Rob Bailey and Felix Preston, Stuck in transition: Managing the political economy of low-carbon development, Briefing Paper, Chatham House, February 201446 The institutions pillar of the GCI is split into public and private institutions. Indicators for the performance of public institutions cover property rights, ethics and corruption, undue influence, government efficiency and security. Indicators for the performance of private institutions cover corporate ethics and accountability.47 The WB’s measure of government effectiveness reflects perceptions of the quality of public services, the quality of the civil service and the degree of its independence from political pressures, the quality of policy formulation and implementation, and the credibility of the government’s commitment to such policies.48 WWF/ENTRI, China’s future generation: Assessing the maximum potential for renewable power sources in China to 2050, 201449 Dispatch is the act of determining which power sources will supply electricity to the grid at a given time.50 The Economist (2014) Generational shift, 25 October 201451 While these principles were developed for the oil and gas sector, they remain equally relevant to the utilities sector. See Lahn et al., Good governance of the national petroleum sector, Chatham House, 200752 See Victor, Hults and Thurber, Oil and governance: State-owned enterprises and the world energy supply, 2011, and Sheoli Pargal and Sudeshna Ghosh Banerjee, More power to India: The challenge of electricity distribution, The World Bank, 201453 Sheoli Pargal and Sudeshna Ghosh Banerjee, More power to India: The challenge of electricity distribution, The World Bank, 201454 Planning Commission (now disbanded)55 Planning Commission, Annual report (2013-14) on the working of state power utilities and electricity departments, 201456 Reserve Bank of India (2014) Handbook of Statistics On Indian Economy2013-2014 57 Sheoli Pargal and Sudeshna Ghosh Banerjee, More power to India: The challenge of electricity distribution, The World Bank, 201458 Tushaar Shah et al. (2012) Organizational reform in Gujarat’s electricity utility: Lessons for revitalising a bureaucratic service delivery agency, IWMI-TATA Water Policy Program, Research Highlight-6, 201259 Nelson Narcisco Filho, The oil and gas industry in Brazil: The role of the regulator, May 200960 Credit Suisse (2014) Latin America: The long road, 201461 International Energy Agency, World Energy Outlook 2013; Nelson Narcisco Filho, The oil and gas industry in Brazil: The role of the regulator, May 2009
62 IEA (2013) World Energy Outlook 201363 Other changes include the creation of a new agency, Pre-Sal Petroleo SA, to administer new pre-salt production and trading contracts; the government granting Petrobras 5 billion barrels of unlicensed pre-salt oil reserves in exchange for a larger ownership share; and the establishment of a new development fund was established to manage government revenues from pre-salt oil.64 IEA (2013) World Energy Outlook 201365 IEA (2014) World Energy Investment Outlook 201466 IEA (2014) World Energy Investment Outlook 201467 IEA (2014) World Energy Investment Outlook 201468 IEA (2014) World Energy Investment Outlook 201469 IEA (2014) World Energy Investment Outlook 201470 Acemoglu, D. and Robinson, J. (2012) Why Nations Fail71 Americas Society/Council of the Americas Energy Action Group (2010) Colombia’s Energy Renaissance, December 2010
32 Global Energy Architecture Performance Index Report 2015
72 Investor Place (2012) Ecopetrol, Colombia’s Quiet Energy Giant, 21 January 201273 EIA (2014) Colombia74 Americas Society/Council of the Americas Energy Action Group (2010) Colombia’s Energy Renaissance, December 201075 Tye, A. (2011) The rebirth of the Colombian oil industry76 Tye, A. (2011) The rebirth of the Colombian oil industry77 Tye, A. (2011) The rebirth of the Colombian oil industry78 Offshore Technology (2011) Snapshot Colombia: An Emerging Destination for Oil and Gas Investment, 4 August 201179 EY (2014) Global oil and gas tax guide 201480 EY (2014) Global oil and gas tax guide 201481 EY (2014) Global oil and gas tax guide 201482 EY (2014) Global oil and gas tax guide 201483 Federal Republic of Nigeria, Investment Opportunities in the Nigerian Power Sector84 EIA (2013) Nigeria overview 85 Nnaemeka Vincent, E. and Yusuf, S. (2014) Integrating renewable energy and smart grid technology into the Nigeria electricity grid system, 30 June 201486 Financial Times (2014) Nigeria ramps up power reform, 10 February 201487 Federal Republic of Nigeria, Investment Opportunities in the Nigerian Power Sector88 PWC (2012) Privatization in the power sector: Navigating the transition89 Bada, A.S.A. The Future of TCN: Ensuring Professional Management of and Investment in the Transmission Network90 Federal Republic of Nigeria, Investment Opportunities in the Nigerian Power Sector91 Financial Times (2012) Privatisation raises hopes for Nigeria power, 26 September 2012 92 Federal Republic of Nigeria, Investment Opportunities in the Nigerian Power Sector93 Federal Republic of Nigeria, Investment Opportunities in the Nigerian Power Sector94 This Day Live (2014) NIPP Privatisation: Ethiope Energy, BPE to Settle out of court, 26 March 201495 GEA & Investigaciones (2014) Mexico: Politica, Sociedad y Cambio – Escenarios, June 2014 96 Reuters (2014) Ineos takes position in UK shale, plans local pay-outs, 28 September 201497 The Guardian (2014) Energiewende: energy transition in Germany, 21 August 2014; BCG (2014) Germany’s Energiewende: The End of Power Market Liberalization?98 PM2.5 is particulate matter measuring less than 2.5 micrometres in diameter.99 You, M. (2014) Addition of PM2.5 into the National Ambient Air Quality Standards of China and the Contribution to Air Pollution Control: The Case Study of Wuhan, China. Hindawi, The Scientific World Journal100 IIED (2012) Growth of China’s ‘green public sphere’ brings hope and opportunity. 26 March 2012101 Financial Times (2014) China pollution: Trouble in the air, 26 February 2014102 Van de Ven, J. (2014) Air pollution policy making and social media in Beijing, 2011-2013 103 Pew Research Center (2013) As China coughs and chokes, public concern about air pollution rises, 22 October 2013104 Levi, M. (2014) How will China clean its air? 30 May 2014. Council on Foreign Relations105 IMF (2013) Energy subsidy reform: Lessons and Implications, 28 January 2013106 Wall Street Journal (2014) New Indonesia Leader Widodo Looks to Tackle Fuel Subsidies, 20 October 2014107 IISD and GSI (2012) Indonesia’s Fuel Subsidies: Action plan for reform, March 2012108 Jakarta Post (2014) Govt announces new fuel prices, 17 November 2014109 CNN (2014) After protests, Indonesia’s parliament boosts fuel prices by as much as 44%, 17 June 2013 110 IMF (2013) Energy subsidy reform: lessons and implications, 28 January 2013111 Bloomberg New Energy Finance (2012) Sunset Credits - A Tool for Removing Fossil Fuel Subsidies, 19 June 2012112 Jakarta Post (2014) Govt announces new fuel prices, 17 November 2014

33Global Energy Architecture Performance Index Report 2015

34 Global Energy Architecture Performance Index Report 2015


World Economic Forum91–93 route de la CapiteCH-1223 Cologny/GenevaSwitzerland
Tel.: +41 (0) 22 869 1212Fax: +41 (0) 22 786 2744
The World Economic Forum is an international institution committed to improving the state of the world through public-private cooperation in the spirit of global citizenship. It engages with business, political, academic and other leaders of society to shape global, regional and industry agendas. Incorporated as a not-for-profit foundation in 1971 and headquartered in Geneva, Switzerland, the Forum is independent, impartial and not tied to any interests. It cooperates closely with all leading international organizations.