industrial waste management session -i · pdf fileindustrial waste management session -i. ......
TRANSCRIPT

Mr. John Thomas
USAID Low Emissions Asian Development (LEAD) Program
Date : 28 January 2015
Industrial Waste Management
Session -I

Session # 1
Understanding What’s Waste
Waste & Productivity linkages
Reasons of Waste generation
Classification of Wastes
Classification of industries by polluting potential
Why manage waste?

What’s WASTE ?

Circle of Life
“WASTE” can be regarded
as a human concept as there
appears to be NO such thing
as waste in nature.
The waste products created by a natural process or organism quickly become the raw products used by other processes and organisms.

What’s the problem then?
Man-made systems emphasizes on economic
value of materials and energy, and where
production and consumption are the
dominant economic activities.
The capacity of the natural environment to absorb and process these materials is also under stress.
The end product (WASTE) returned to the environment in a form that damages the environment and require more natural capital be consumed in order to feed the system; which is ultimately NOTsustainable.

What’s WASTE then?
The presence of waste is an indication of overconsumptionand that materials are NOTbeing used efficiently.
“WASTE is a RESOURCEat a Wrong Place
at the Wrong Timein Wrong Quantity.”

WASTE: The definition…………
Produced by the United Nations Statistics Division (U.N.S.D.):
"Wastes are materials that are not prime products (that isproducts produced for the market) for which the generatorhas no further use in terms of his/her own purposes ofproduction, transformation or consumption, and of whichhe/she wants to dispose. Wastes may be generated during theextraction of raw materials, the processing of raw materialsinto intermediate and final products, the consumption of finalproducts, and other human activities. Residuals recycled orreused at the place of generation are excluded."

Legal Definition: EU Framework
What is Waste?
The legal definition of waste in the UK is derived from
the EU Waste Framework Directive. In basic terms
“A waste is anything which you decide to, or are
required to, throw away. Even if the substance or article
is given to someone else to be reused or recycled, it is
still legally considered to be waste if it is no longer
required by the person who produced it.”
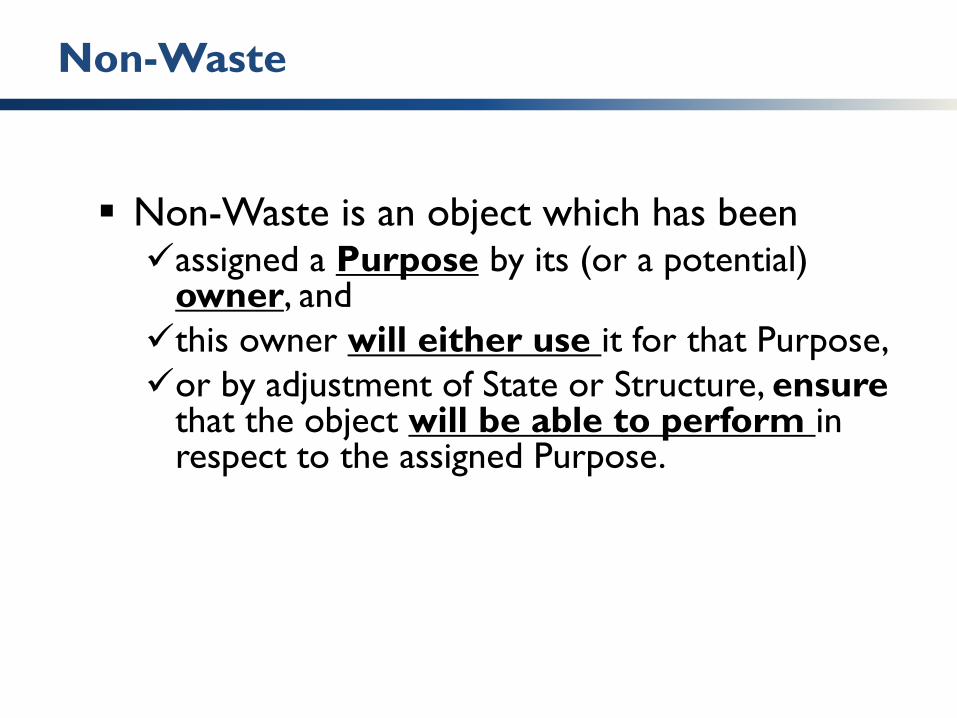
Non-Waste
Non-Waste is an object which has been assigned a Purpose by its (or a potential)
owner, and
this owner will either use it for that Purpose,
or by adjustment of State or Structure, ensure that the object will be able to perform in respect to the assigned Purpose.

Waste & Causes: Productivity Perspective

Lean and 7 Wastes – What does it mean?
Transportation
Procedure and Guidance Notes:
Motion
Waiting
Over production
Inventory
Over processing
Defects
OVER PRODUCTION is considered the "Mother Of All Wastes" since it can lead to increases in all the
other forms of waste.
Production of items sooner or in greater quantities than required for customer demand
Often caused by poor planning or incorrect bottleneck assumptions
Overproduction discourages a smooth flow of production and leads to excessive work in process inventory. This increases overall delivery times and reduces ROCE.
Any raw material, Work in Process (WIP) or finished goods which are being stored i.e. no longer having value added to them
Caused by overproduction – inventory builds up between processes
Adds cost, requires space, hides process defects, can encourage damage. Reduces ROCE.
Adds time & cost and can be a safety issue.
Unnecessary worker movement within a Process
Caused by poor workplace layout, poor process planning, poor housekeeping, no Standard Operating Procedures.
People or Parts that are waiting for a work cycle to be completed
Caused by unreliable Supply Chain, bottlenecks, down time
Creates excessive lead time, causes bottlenecks, causes additional time & cost.
Unnecessary movement of items between processes and inventory
Caused, by poor layout and / or process design and planning, unstructured or not understood Value Stream, complex material flow...
Leads to increased time & cost to transport & search, and increased Defects due to accidents.
A defect is when the Customer believes they did not get what they paid for. Can have many causes including process variation, customer requirements not understood correctly, mistakes ...
Defects can lead to additional time and cost, and more critically it can reduce customer confidence.
Processing beyond the value required by the Customer
Caused by lack of customer focus, “Always done it this way” attitude, lack of understanding
Can result in scheduled work time being longer than needed, Parkinson’s Law in project task execution, increases in time & cost.

Lean and 7 Wastes - Example
What is the problem for the
customer – time, cost,
quality?
1. Clarify the problem
4. Eliminate waste
Plan and execute actions
to eliminate the waste
steps
Study the
process where
the problem
occurs
2. Map the Process
Steps
3. Analyse the process steps
Decide what is value
adding, value enabling and
waste in the process
5. Reduce Value Enabling
Once waste is eliminated,
look to reduce the value
enabling content where
possible
5. Formalise new process
Confirm new process,
measure and monitor, and
create new process map,
SOP’s etc
15 July 2010,, Slide 12

For more than 75 years, GDP
(Gross Domestic Product)
has been used to measure the
success and prosperity of
nations.
“The welfare of a nation can, therefore, scarcely be inferred from a measurement of national income.”
- Simon KuznetsEconomist who developed GDP to US Congress
Measures of Prosperity

Well-being and sustainability …
“…the time is ripe for our measurement system to shift emphasis from measuring economic production to measuring people’s well-being. And measures of well-being should be put in the context of sustainability”
- Stiglitz Commission, 2009
Measures of Prosperity

Prosperity Indicators & Ranking

Measures of Prosperity
Prosperity without Growth
“Anyone who believes exponential growth can go on forever in a finite world is either a madman or an economist”
(Attributed to Kenneth Boulding - economist)
“Prosperity for the few founded on ecological destruction and persistent inequality is no foundation for a civilised society … For the advanced economies of the western world, prosperity without growth is no longer a utopian dream. It is a financial and ecological necessity.”
(Tim Jackson for SDC, 2009)

Insatiable Consumption: The Root Cause of Climate Change
Technology is part of the solution to climate change. But only part.
Merely swapping technologies; without being accompanied by drastic reductions in our consumption; fails to address the root causes of climate change.
Radical Economic And Social Transformation required.
http://revista-amauta.org/2009/07/consumption-the-root-cause-of-climate-change/

Classification of Wastes

Waste Classification: By its Physical State
Solid wastes: wastes in solid forms, domestic, commercial and industrial wastes
Examples: plastics, styrofoam containers, bottles, cans, papers, scrap iron, and other trash
Liquid Wastes: wastes in liquid form
Examples: domestic washings, chemicals, oils, waste water from ponds, manufacturing industries and other sources
Gaseous Wastes: wastes in gaseous form
Examples: emissions from domestic stoves, boilers, manufacturing industries, furnaces, crushers,
automobiles, incineration, open burning and other sources

Bio-degradable
can be degraded (paper, wood, fruits and others)
Non-biodegradable
cannot be easily degraded (plastics, bottles, old
machines, cans, styrofoam containers and
others)
Classification of Wastes: as per their Properties

Classification of Wastes:
As per their Effects on Human Health and the Environment
Hazardous wastesSubstances unsafe to use commercially, industrially,
agriculturally, or economically and have any of thefollowing properties- ignitability, corrosivity, reactivity &toxicity.
Non-hazardous Substances safe to use commercially, industrially,
agriculturally, or economically and do not have any ofthose properties mentioned above. These substancesusually create disposal problems.

Classification of wastes: as per their origin and type
Municipal Solid wastes: Solid wastes that include household garbage, rubbish,construction & demolition debris, sanitation residues, packaging materials, trade refuges etc. aremanaged by any municipality.
Bio-medical wastes: Solid or liquid wastes including containers, intermediate or endproducts generated during diagnosis, treatment & research activities of medical sciences.
Industrial wastes: Liquid and solid wastes that are generated by manufacturing &processing units of various industries like chemical, petroleum, coal, metal gas, sanitary & paper etc.
E-wastes: Electronic wastes generated from any modern establishments. They may bedescribed as discarded electrical or electronic devices. Some electronic scrap components, such asCRTs, may contain contaminants such as Pb, Cd, Be or brominated flame retardants.
Agricultural wastes: Wastes generated from farming activities. These substances aremostly biodegradable
Fishery wastes: Wastes generated due to fishery activities. These are extensively found incoastal & estuarine areas.
Radioactive wastes: Waste containing radioactive materials. Usually these arebyproducts of nuclear processes. Sometimes industries that are not directly involved in nuclearactivities, may also produce some radioactive wastes, e.g. radio-isotopes, chemical sludge etc.

WAS
TE
CLAS
SIFI
CATI
ON

Waste Classification: Overlapping definitions
Waste Classification

Waste Classification & Management Objectives
Mgmt Objective Classification Type
Treatment / disposal Treatability based
Safe Transport UN Hazard Classification
Waste Minimization Process Origin/ Waste
Stream based
Segregation of Hazardous/
Non Hazardous Waste
Listing

Classes of waste (Pongráz & Pohjola 1997)
1. Non-wanted Objects, Created Not Intended, Or Not Avoided, With No Purpose
Into this group belong outputs with negative market value, non-useful by-products, emissions, processing and process wastes, cleaning wastes, etc.
2. Objects that were given a finite purpose, thus destined to become useless after fulfilling it
This is the group of single-use products: most packaging, single-use cameras, disposable diapers, etc
3. Objects with well-defined purpose, but their performance ceased being acceptable
Obsolete products, old furniture, discarded household appliances, non-rechargeable batteries, demolition wastes, etc
4. Objects with well-defined purpose, and acceptable performance, but their users failed to use them for the intended purpose
Spoiled products, products used in excess, products that go beyond their target, or simply products that the owners do not wish to own anymore. They could be perfectly useful, they are waste solely due to the holder’s wrongful action, and often are non-retrievable. This class embodies the essence of wastefulness.

Categorization of Industries

Categorization of Industries
Industries or Projects are categorized into three broad
categories viz. Red, Orange and Green in decreasing order
of severity of pollution.
HIGHLY POLLUTINGMODERATELY POLLUTING
MARGINALLYPOLLUTING
NON-POLLUTING INDUSTRIAL ACTIVITIES
[Exemption from Consent]
As the ecological configuration and sensitivity together with geo-
meteorological parameters widely from place to place there cannot be a
uniform classification through out the country.

Highly Polluting Industries: 17 Industrial Sectors
A Industries identified by Ministry of Environment & Forests, Government of
India as heavily polluting and covered under Central Action Plan. Viz;
1. Aluminium smelter
2. Cement
3. Chlor alkali
4. Copper smelter.
5. Distillery including Fermentation industry
6. Dyes and Dye-intermediates.
7. Fertilizer (Basic) (excluding formulation)
8. Iron and Steel (Involving processing from ore/scrap/Integrated steel plants.)
9. Oil refinery (Mineral oil or Petro refineries).
10. Pesticides (Technical) (excluding formulation).
11. Petrochemicals (Manufacture of and not merely use of as raw material)
12. Pharmaceuticals (excluding formulation).
13. Pulp and Paper (Paper manufacturing with or without pulping).
14. Sugar (excluding Khandsari)
15. Tanneries.
16. Thermal power plants.
17. Zinc smelter.

GROSSLY POLLUTING
INDUSTRIES
Industries discharging effluent directly or indirectly into a water course (including rivers and lakes)
AND(a) Industries handling hazardous substances
OR(b) Effluent having a BOD load of 100kgs per day or more
AND
2.A Combination of both (a)and (b)

Waste Generation Trends- India
2025 Projections
Indian Waste management market: worth US$ 13.62 billion
Waste Management Market Growth projections:
by 2025
• Municipal solid waste(MSW): CAGR of 7.14%
• e-waste : CAGR of 10.03%
• Bio medical waste : CAGR of 8.41%.
India has planned to achieve a capacity of 2.9 million hospital
beds by 2025
Source: http://www.novonous.com/waste-management-market-india-2014-2025

Why Manage Waste?


Why Manage Waste?
1. Affect human health and environment
2. Affects socio-economic conditions
3. Affects climate and the cascading impact on livelihood, survival
4. Statutory requirements & Associated Liabilities
5. Impacts Corporate Image
6. Concerns Business Sustainability/ Continuity Risks
7. Improve Productivity levels
8. Conserve Natural Resources
9. Potential product/ by-product recovery

Cost of Waste Management
• Disposal cost
• Inefficient energy use cost
• Purchase cost of wasted
raw material
• Production cost for the
waste material
• Management time spent on
waste material
• Lost revenue for what
could have been a product
instead of waste
• Potential liabilities due to
waste.

Recycling and GHG Emissions
“By recycling almost
8 million tons of metals
(which includes aluminum,
steel, and mixed metals),
eliminated greenhouse
gas (GHG) emissions
totaling
> 26 million metric tons
of carbon dioxide
equivalent (MMTCO2E).”

Why manage Waste?
High Resource Recovery Potential – makes economic sense
Source: Adapted from ADB and IGES (2008). Toward Resource-Efficient Economics in Asia and the Pacific: Reduce Reuse Recycle, Asian Development Bank, Manila
Type of
waste
Recycled
products
Recycling potential
Biomass Composts Future of compost depends on its environmental and
agronomic quality and the dynamism of its market.
Paper and cardboard Recovered paper
(recycled paper)
Increasing demand in Asia, particularly in PRC.
Plastics Recovered plastics Increasingly stringent regulations and growing demand for
recovered plastics in Asia, favoring development and
internationalization of this market.
Cost of collection system and volatile prices are limiting
factors.
Ferrous
Metals
Steel In 2004, world production of scrap metal rose to 450Mt and consumption reached 405.5Mt. Can be recovered from MSW, construction waste, etc.
E-wastes Recoverable
materials
Estimated that 10 million computers contain 135,000 metric
tons of recoverable materials, such as base metals, silicon,
glass, plastic, and precious metals.

eWaste:
Valuable Metals That Could be Recovered from a Mobile Phone
ferrite
Nd
Ag, Pd, Ti, Ba, Pb, Ni, Zr
Fe, Ag, Ni, Cu, Zn, Pb
Cu
In, Sn
Cu, Ni,Au
Cu, SiO2, (Br)
Pb, Sn
Si, Cu, Ni
Ta, Ag, Mn
Au, Ag, Cu, Si
Sb
Ag
Au
Fe, Ni, Cr, Au
Source: http://www.coden.jp/rare-metal/use.html
Quantity of Non-ferrous Metals Included in One Mobile Phone
Gold 0.028 gSilver 0.189 gCopper 13.71 gPalladium 0.014 g
Source: http://www.rieti.go.jp/jp/events/bbl/05060701.html
Why manage Waste?
Way Ahead & Evolving Concepts

Professor Michael PorterHarvard Business School
Author of Competitive Advantage of Nations
“Our central message is that… managers must start to recognise environmental improvement as an economic and competitive opportunity.. it is time to build on the underlying economic logic that links the environment, resource productivity, innovation, and competitiveness”.

A sustainable company:
Is restorative of all forms of capital: human and natural as well as financial and manufactured
Enhances shareholder value by using resources efficiently, striving for zero waste
Conducts business in accordance with natural principles - biomimicry
Operates in partnership with the stakeholders impacted by its activities

Need for fundamental change in our mindset and attitudes
Resource efficiency and circular economy
The Closed Loop EconomyBy reducing production of wastes, and by maximising the use of reusable and
recyclable materials, a city can achieve greater resource efficiency
Source: ADB and IGES (2008). Toward Resource-Efficient Economics in Asia and the Pacific: Reduce Reuse Recycle. Asian Development Bank, Manila
• Closed-Loop Economy
• Recycle Based Society
• Sound Material-Cycle Society
• Green Growth and Circular Economy

Path to Sustainability: Frameworks vs. Tools
Frameworks Tools
Natural Capitalism
Natural Step
Ecological Economics
Cradle to Cradle
Holistic Management
Dream team EMS/ ISO/ clean production DFE/ green design Life cycle accounting Lean manufacturing Ecological Footprinting Factor 4, Factor 10 Incentives/ regulations Industrial ecology Climate neutral - CCX

The creation and use of services and related products, which respond to basic needs and bring a better quality of life while minimizing the use of natural resources and toxic materials as well as the emissions of waste and pollutants over the life cycle of the service or product so as not to jeopardize the needs of future generation
SUSTAINABLE CONSUMPTION & PRODUCTION

Product stewardship means looking at the impact of a product:
from the time it is raw materials
until it is discarded
Raw Materials
Manufacturing Transportation
Retail Use Disposal/Recycling

everyone has a role to play
from those who make it
to those who sell it to
thosewho buy it
Producers
Distributers
Retailers
Consumers
Waste Management
Responsibility:To produce goods that are safe for their customers & the environment


CONTACT
NAME
Mr. John Thomas
USAID LEAD Program
(USAID Contractor)
Email: [email protected]
Tel: + 91-9958176767