industrial policy 15yr review prepared in 2008.pdf - tips
TRANSCRIPT

A Review of Industrial Policy, Instruments and Support Programmes: 1994-2008
Zavareh Rustomjee and Stephen Hanival
A Contribution to the Presidency's 15-year Review of Government
Performance
Released June 2010
Prepared March 2008
indigenous growth

A Review of Industry Policy, Instruments and Support Programmes: 1994-2008
A Contribution to the Presidency’s 15-year Review of Government Performance1
Prepared March 2008
Released June 2010
1 Report prepared by Zavareh Rustomjee and by Stephen Hanival

A Review of Industry Policy, Instruments and Support Programmes: 1994-2008
2
Contents
TABLES....................................................................................................................................................................... 3 FIGURES..................................................................................................................................................................... 4 ABBREVIATIONS AND ACRONYMS ................................................................................................................... 5 ABBREVIATIONS AND ACRONYMS ................................................................................................................... 5 1. INTRODUCTION.............................................................................................................................................. 6 2. TEN-YEAR REVIEW: TRADE AND INDUSTRY POLICY ISSUES AND CONCLUSIONS ................. 7
2.1 MACRO-ECONOMIC STABILITY ..................................................................................................................... 7 2.2 TRADE POLICY, TRADE REFORM AND ACCESS ............................................................................................... 8 2.3 INDUSTRIAL POLICIES, COMPETITIVENESS & INDUSTRIAL PROMOTION......................................................... 8 2.4 COMPETITION POLICY AND REGULATION...................................................................................................... 9 2.5 SMALL, MEDIUM AND MICRO-ENTERPRISE SUPPORT..................................................................................... 9 2.6 BROAD-BASED BLACK ECONOMIC EMPOWERMENT....................................................................................... 9 2.7 RESEARCH AND DEVELOPMENT (R&D)........................................................................................................ 9 2.8 HUMAN RESOURCE DEVELOPMENT (HRD)................................................................................................. 10 2.9 INSTITUTION BUILDING............................................................................................................................... 10
3. TERMS OF REFERENCE AND PROPOSED METHODOLOGY............................................................ 11 3.1 TIMELINE ................................................................................................................................................... 11 3.2 METHODOLOGY.......................................................................................................................................... 11 3.3 DATA.......................................................................................................................................................... 12 3.4 INTERVIEWS ............................................................................................................................................... 12
4. REVIEW OF SOUTH AFRICA’S ECONOMIC PERFORMANCE 1994-2002 AND 2003-2007............ 13 4.1 INTRODUCTION........................................................................................................................................... 13 4.2 REVIEW OF SOUTH AFRICA’S ECONOMIC PERFORMANCE 1994-2007 ......................................................... 13
4.2.1 Domestic performance .......................................................................................................................... 13 4.3 CONCLUDING REMARKS ............................................................................................................................. 24
5. ASSESSMENT OF THE EFFECTIVENESS OF KEY INDUSTRIAL POLICIES, PROGRAMMES AND PROJECTS ...................................................................................................................................................... 26
5.1 INTRODUCTION – THE EVOLUTION OF DTI INCENTIVE PROGRAMMES: 1994-2005 ....................................... 26 5.2 THE CHANGING STRUCTURE AND APPLICATION OF DTI INCENTIVES: 1994-2005 ........................................ 27 5.3 BREADTH AND DEPTH OF TARGETS COVERED BY DTI FAMILY INCENTIVES ................................................. 29 5.4 VALUE OF DTI INCENTIVES : 2001-2005 ..................................................................................................... 31 5.5 THE PERFORMANCE OF INCENTIVE INSTRUMENTS: INCENTIVE PROGRAMME REVIEWS ............................... 31 5.6 THE PERFORMANCE OF COMPETITIVENESS PROGRAMMES.......................................................................... 32
5.6.1 Sector Partnership Fund (SPF)............................................................................................................. 32 5.6.2 Competitiveness Fund (CF) and Sector Partnership Fund (SPF)......................................................... 33 5.6.3 Technology and Human Resourced for Industry Programme (THRIP) ................................................ 34 5.6.4 Support Programme for Industrial Innovation (SPII)........................................................................... 34 5.6.5 Conclusions – competitiveness programmes......................................................................................... 35
5.7 EXPORT MARKETING AND INVESTMENT ASSISTANCE PROGRAMME (EMIA)............................................. 35 5.8 BROAD-BASED BLACK ECONOMIC EMPOWERMENT..................................................................................... 36
5.8.1 Assessment of Incentive Programme impact on MSME targets – World Bank (2006).......................... 37 5.9 ASSESSMENT OF IMPACT OF SMEDP INCENTIVE ON MEAN EFFECTIVE TAX RATES OF RECIPIENT FIRMS – FIAS (2005) REVIEW............................................................................................................................................... 38 5.10 SPATIAL DEVELOPMENT PROGRAMMES ...................................................................................................... 41
5.10.1 Spatial Development Initiatives (SDI) .............................................................................................. 41 5.10.2 Industrial Development Zones (IDZ) ................................................................................................ 41 5.10.3 Critical Infrastructure Fund (CIF) ................................................................................................... 43

5.10.4 2006 Regional Industrial Development Strategy (RIDS) and associated Spatial Industrial Development Strategy ........................................................................................................................................ 44 5.10.6 Conclusion – RIDS Proposals .......................................................................................................... 45
6. ESTIMATED VALUE, SECTORAL SPREAD AND IMPACT ON GFCF 2000-2005 OF DTI INCENTIVES............................................................................................................................................................ 47
6.1 TAX-BASED INCENTIVES............................................................................................................................. 47 6.2 GRANT-BASED INCENTIVES ........................................................................................................................ 49 6.3 MOTOR INDUSTRY DEVELOPMENT PROGRAMME (MIDP) ........................................................................... 51 6.4 DUTY CREDIT CERTIFICATE SCHEME (DCCS)............................................................................................. 52 6.5 INDUSTRIAL PARTICIPATION PROGRAMME (NIP)....................................................................................... 55 6.6 ROLE OF DEVELOPMENT FINANCE INSTITUTIONS AND ENTERPRISE DEVELOPMENT AGENCIES ................. 56 6.7 INCENTIVES – IDC CONCESSIONARY FINANCING PROGRAMMES 1994-2004 ............................................. 58 6.8 THE IDC’S APPROACH TO FINANCING PROJECTS ....................................................................................... 59 6.9 POST 2006 - NATIONAL INDUSTRIAL POLICY FRAMEWORK (NIPF) AND THE INDUSTRIAL POLICY ACTION PLAN (IPAP) ........................................................................................................................................................... 62 6.10 CONCLUSIONS – IMPACT OF THE DTI’S PAST INCENTIVES ON INDUSTRY ..................................................... 64
7 WHAT PROGRESS SINCE 2003?................................................................................................................. 68 7.1 MACROECONOMIC STABILITY .................................................................................................................... 68 7.2 TRADE POLICY, TRADE REFORM AND ACCESS ............................................................................................. 68 7.3 INDUSTRIAL POLICIES, COMPETITIVENESS AND INDUSTRIAL PROMOTION ................................................... 69 7.4 COMPETITION POLICY AND REGULATION.................................................................................................... 71 7.5 SMALL, MEDIUM AND MICRO-ENTERPRISE SUPPORT................................................................................... 73 7.6 BROAD-BASED BLACK ECONOMIC EMPOWERMENT..................................................................................... 74 7.7 RESEARCH AND DEVELOPMENT (R&D)...................................................................................................... 74 7.8 HUMAN RESOURCE DEVELOPMENT (HRD)................................................................................................. 74 7.9 INSTITUTION BUILDING............................................................................................................................... 75
REFERENCES.......................................................................................................................................................... 76
Tables Table 1: Structure of South Africa’s economy.......................................................................................................................15 Table 2: Structure of South Africa’s economy: primary sector ...........................................................................................16 Table 3: Structure of South Africa’s economy: secondary sector .......................................................................................16 Table 4: Growth trends: manufacturing sectors, 2004-2006 ...............................................................................................18 Table 5: Growth trends: manufacturing sectors, 2000-2003 ...............................................................................................19 Table 6: 1994-2006: changes in incentive structure and application...................................................................................28 Table 7: dti family investment incentives...............................................................................................................................29 Table 8: dti trade facilitation incentive programmes ............................................................................................................30 Table 9: dti competitiveness programmes .............................................................................................................................30 Table 10: Historic value of dti incentives (Rm) ....................................................................................................................31 Table 11: dti budget analysis....................................................................................................................................................31 Table 12: Programmes that have been reviewed since 1994 ...............................................................................................32 Table 13: Summary of key FIAS (2005) issues and recommendations ..............................................................................39 Table 14: Impact of incentives on recipient mean effective tax rate (METR) ..................................................................40 Table 15: SDI initiatives ...........................................................................................................................................................41 Table 16: SIP tax incentive impact as %GFCF.....................................................................................................................47 Table 17: SMEDP grant incentive impact on % GFCF ......................................................................................................50 Table 18: NIP investment impact on % GFCF ....................................................................................................................56 Table 19: IDC Financing Instruments 1988 - 2000 ..............................................................................................................60
3

A Review of Industry Policy, Instruments and Support Programmes: 1994-2008
4
Table 20: NIPF Strategic Programmes...................................................................................................................................63 Table 21: Proposed NIPF Sector Clusters .............................................................................................................................63
Figures Figure 1: Ten-year review: Trade and industrial policy components.................................................................................... 7 Figure 2: GDP year-on-year growth rate................................................................................................................................14 Figure 3: Structure of South Africa’s economy ....................................................................................................................14 Figure 4: Year-on-year growth of total economy and manufacturing................................................................................17 Figure 5: Manufacturing performance by sector (weighted annual % change).................................................................18 Figure 6: Underperformance of the South African economy in creating jobs..................................................................20 Figure 7: Key manufacturing sectors’ employment performance.......................................................................................21 Figure 8: Manufacturing employment sorted by year: 2000-2003.......................................................................................21 Figure 9: GDFI, 2000-2003 and 2004-2006...........................................................................................................................22 Figure 10: Growth in manufacturing sector capacity utilisation .........................................................................................23 Figure 11: Manufacturing GDFI, 2000-2003 and 2004-2006..............................................................................................23 Figure 12: Manufacturing GDFI: shares ................................................................................................................................24 Figure 15: CIP payments – key sector investments supported 2003-2006 ........................................................................43 Figure 16: SIP tax incentive impact as %GFCF....................................................................................................................48 Figure 17: SMEDP grant incentive impact as %GFCF .......................................................................................................50 Figure 18: DCCS incentive benefit as % Textile GFCF ......................................................................................................53 Figure 19: DCCS incentive benefit as % Textile exports.....................................................................................................53 Figure 20: DCCS incentive benefit as % Apparel GFCF ....................................................................................................54 Figure 21: DCCS incentive benefit as % Apparel Exports..................................................................................................54 Figure 22: NIP investment value by sector – 2001-2005 .....................................................................................................55 Figure 23: IDC Financing as % Total National GFCF ........................................................................................................59 Figure 24: IDC Project Value by Beneficiation Stage – Metals & Chemicals 1994-2004................................................60 Figure 25: IDC Project Value by Beneficiation Stage – Metals and Chemicals 2000-2004.............................................61 Figure 26: IDC Financing as % GFCF in Chemicals 1994-2004........................................................................................61 Figure 27: IDC Financing as % GFCF in Metals 1994-2004 ..............................................................................................62 Figure 28: All dti investment incentives as %GFCF 2001-2005 ........................................................................................66 Figure 18: Metal Industry Value Chain Linkages (% of Input Values) ..............................................................................72

Abbreviations and acronyms ASGISA Accelerated and Shared Growth Initiative for South Africa BBSDP Black Business Supplier Development Programme BOSME Black-Owned Small and Medium Enterprises BPO Business Process Outsourcing CF Competitiveness Fund CIF Critical Infrastructure Fund CIP Critical Infrastructure Programme CPPP The Community Public Private Partnership Programme CSA Customs Secured Areas CSIR Council for scientific and industrial research CSP Customised Sector Programme DCCS Duty Credit Certificate Scheme the dti Department of Trade and Industry ECDC Eastern Cape Development Corporation EIG Empowerment Investment Grant EMIA Export Marketing and Investment Assistance FIAS Foreign Investment Advisory Service GAP Geospatial Analysis Platform GDFI Gross Domestic Fixed Investment GDP Gross Domestic Product GFCF Gross Fixed Capital Formation GFCF Gross fixed capital formation HDI H istorically disadvantaged individual IDZ Industrial Development Zone IRCC Import Rebate Credit Certificates ISRDP Integrated Sustainable Rural Development Programme LED Local Economic Development METR Mean effective tax rate MIDP Motor Industry Development Programme MSME Micro, small and medium enterprises MTEF Medium term expenditure framework NIP National Industrial Participation Programme NIPF National Industrial Policy Framework NSDP National Spatial Development Perspective RIDS Regional Industrial Development Strategy SDI Spatial Development Initiatives SETI Sector education and training institute SIDS Spatial Industrial Development Strategy SIP Strategic Investment Programme SMEDP Small and Medium Enterprise Development Programme SMMDP Small and Medium Manufacturing Development Programme SOE State-owned Enterprises SPF Sector Partnership Fund SPII Support Programme for Industrial Innovation THRIP Technology and Human Resources for Industry Programme TWIB Technology for Women in Business URP Urban Renewal Programme
5

A Review of Industry Policy, Instruments and Support Programmes: 1994-2008
6
1. Introduction
In 2003, as part of the Presidency’s review of the ten-year period 1994-2003, the impact of trade and industry policy was assessed. The review came to a generally positive conclusion, recording that while some progress had been made. However, certain adjustments and prioritisation were needed. The details of this trade and industry policy analysis are contained in Section two below.
Section three records the terms of reference (TOR) for this study and outlines the methodology utilised in conducting this study. The methodology essentially builds on the policy analysis, themes and priorities that were recognised during the 2003 review, drawing on and integrating the considerable wealth of primary research on trade and industry policy that exists.
Using the same approach as the 2003 review, South Africa’s economic performance between 2002 and 2007 is analysed in Section four. For consistency, the datasets and analysis of Cassim et al. (2003) are adopted and updated.
The TOR calls for a cost-benefit analysis of the various government industrial support measures, and Section five addresses this by drawing from recent work commissioned by the dti2. In Section six, particular attention is paid to the key investment incentive programmes which absorb the bulk of fiscal resources allocated to industrial policy.
In Section seven, trade and industry policies are organised in accordance with the policy themes/tools used in the 2003 review. Progress since 2003, measured against the empirical analysis of Sections five and six, is assessed and an attempt is made to draw out the main policy debates, policy contestations and implementation issues during these past five years.
At the same time, the key policy ideas and debates are periodised over the fifteen year period. The choices made, and the determinants of such policy decisions (where they are identifiable) are captured. The chapter concludes by linking the historical flow of policy ideas with the main trade and industry policy ideas that are currently seeking to influence policy makers.
Conclusions are drawn in Section eight on whether government’s industrial and trade policies, programmes and projects have been effective or not, since 2003 and over the 15 year period under review.
2 Rustomjee (2005), dti Incentives review process (Phase 1) – Incentives policy framework, Final report, 16 November. A study commissioned by the dti, Pretoria

2. Ten-year review: trade and industry policy issues and conclusions
The ten-year review set out to answer the following questions:
Has the government achieved its policy objectives?
Are these the appropriate objectives?
Against the backdrop of sound macroeconomic fundamentals, a strong fiscus, relatively low private sector investment and steadily increasing public sector investment in the economy, the Presidency (2003) noted certain achievements regarding economic policy and trade and industry policy, as well as a number of challenges that required prioritised attention after 2003. These achievements and challenges over the ten-year period 1994-2003 are listed below using the 2003 review thematic headings/tools; headings which are used in subsequent Sections that review progress from 2003-2008.
Figure 1: Ten-year review: Trade and industrial policy components
Source: The Presidency (2003; p.32)
2.1 Macro-economic stability
The 2003 review concluded that the government had been successful in ensuring macro-economic stability, improving the trade regime, and taking advantage of the country’s natural resources and financial and physical infrastructure. Significant progress was recorded in the main areas primarily under the control of the State (such as fiscal and monetary policy, and trade and industrial policy) but government had had less success in other areas (competition policy, restructuring and improving the performance of government and regulatory institution and agrarian reform).
7

A Review of Industry Policy, Instruments and Support Programmes: 1994-2008
8
Continuing with prudent macro-economic policies to achieve a more stable currency and lower real interest rates, and to improve the public sector’s investment performance, were to be prioritised post 2003.
2.2 Trade policy, trade reform and access
The 2003 review observed that industrial support measures between 1994 and 2003, coupled with the implementation of tariff reform as an instrument of industrial policy in line with the RSA’s WTO commitments, have led to a more competitive economy and an improved trade balance.
The improved trade balance, reflected in the growth of higher value added, secondary and tertiary exports, had also arisen from the renegotiated SACU trade agreement, the negotiation of a Southern African Development Community (SADC) free trade agreement, the negotiation of a bilateral trade and aid agreement with the European Union and through the unilateral USA-African Growth and Opportunity Act (AGOA) provision, which had also aided South Africa’s exports,
Going forward, the review recommended that South Africa should continue to lead developing country participation in the Doha Round of the World Trade Organisation WTO and continue to pursue mutually beneficial free trade talks with the USA and with fast growing emerging regions such as Mercosur and countries such as China and India.
2.3 Industrial policies, competitiveness & industrial promotion
The 2003 review noted that industrial policy had shifted focus since 2001, as articulated in the Integrated Manufacturing Strategy and the Micro-economic Reform Strategy, extending incentive programmes beyond traditional manufacturing sectors.
Certain key industries had been targeted for special attention, including growth sectors such as automotive and tourism, and cross-cutting sectors such as information and communications technology. In the case of the latter two, these sectors had become recipients of considerable resources allocated through government’s science and technology and human resource development programmes.
As a result of policy interventions, the competitiveness of the South African economy had improved since the early 1990s as reflected by the improvement in and diversification of exports, as well as the significant improvement in labour productivity. However, most measures still indicate that the availability of skilled labour remains a key constraint to further growth.
Arising from the improved investment climate in South Africa, foreign direct investment (FDI) had been net positive since 1994, although it was regarded as being low in comparison with other developing economies. FDI had been largely associated with state-leveraged deals and through the privatisation of state assets.
A simultaneous outflow of capital into the Southern African region had occurred, reflecting the increasing economic integration that is taking place, consciously encouraged by policymakers.
The review noted that the country’s small skills base, the volatility of the exchange rate and the interest rate, the cost of inputs such as transport and telecommunications, lack of competition in the domestic market, and poor perceptions of Africa and southern Africa were holding back higher rates of investment and required focused attention.
The review pointed to the opportunity to better use South Africa’s infrastructure to provide low-cost services, to continue to add more value to the processing and manufacturing sectors, and to reduce South

Africa’s risk rating through better marketing. However, it noted that competition from Asia and other parts of Africa, slow improvements in skills and input costs, and weaknesses in implementation continued to hold back such progress.
The 2003 review resolved to implement the Growth and Development Summit (GDS) recommendations to identify sectors for urgent investment and learnerships, to support focused sector strategies in key growth and employment industries following the examples of the motor industry and the tourism sector, and to speed up the restructuring of all industries to ensure global competitiveness, lower input prices and better access to key markets. The review further recommended the development of suitable instruments to direct 5% of the investible income of a wide range of public and private organisations, including the pension funds and insurance companies, towards job creating and poverty alleviating projects.
2.4 Competition policy and regulation
The Competition Commission and Tribunal had built up a solid reputation in implementing the new Competition Act of 1996. However, the review concluded that they had not been as effective as expected in addressing abuses of dominant positions in certain key intermediate product groups such as beverages, paper and paper products, coke and petroleum products, basic chemicals, basic non-ferrous metals, and, to a lesser extent, ferrous metals, whereby price mark-ups were regarded as high by international standards.
The review also noted concerns about the high cost of transport and telecommunications, key factors in an economy at such great distance from major world markets, and that a focus was needed on the microeconomic reform strategy on input costs and skills.
The review called for increased effectiveness of SOE restructuring in accordance with prevailing policy, through more effective managed liberalisation and stronger regulators, and that the powers of the competition authorities to deal with anticompetitive practices be strengthened.
2.5 Small, medium and micro-enterprise support
Noting that the institutional support for SMMEs since 1994 had led to increasing measured contributions of such firms to economic activity and employment, the review regarded the challenge for the next period to be to disaggregate and focus strategies with regard to distinctively different sectors of the SMME community, i.e. micro businesses (often informal), small businesses, small technology start-ups and medium-sized businesses.
2.6 Broad-based black economic empowerment
The review recommended that adequate resources be provided to strengthen the broad-based empowerment programme, including the agrarian reform programme and micro-credit to support productive enterprises.
2.7 Research and development (R&D)
The review noted that industrial policy had not yet resulted in greater levels of domestic innovation and R&D, but that this was expected to improve as a result of the increasing coherence of, and resources being applied to, the national system of innovation that had been adopted as policy in the late 1990s – particularly after the introduction of the 2002 R&D Strategy which established new, relevant missions for the NSI. Expenditure on R&D averaged around 0.75% of GDP for most of the 1990s, and was recorded at 0.8% in 2003.
9

A Review of Industry Policy, Instruments and Support Programmes: 1994-2008
10
Post 2003, government should ensure implementation of the Research and Development Strategy, both in high-level niche areas such as fuel cell technology and issues related to immediate poverty eradication and protection of the environment.
2.8 Human resource development (HRD)
The 2003 review noted that government had made less immediate progress in a significant number of areas that require partnership with others (small business development, HRD, innovation and R&D, restructuring of SOEs and BEE). In those areas that depended significantly on private sector and civil society attitudes and behaviour and are only indirectly influenced by the State (investment and employment creation), government had had even less success. Acknowledging externalities between these areas, the review noted that, by 2003, the soundness of macro-economic policy and industrial strategy was beginning to positively influence investor attitudes. Unfortunately, this change in attitude had yet to translate into significantly increased employment and consequent poverty reduction.
Post 2003, the review pointed to the need to focus on targeted skills development and steady improvement in the education system and the functioning of the labour market.
2.9 Institution building
In 2003 the review recognised that, although successes were recorded in fiscal reform, these successes had not yet reached a few of the provinces and many municipalities. Consequently, existing policies and programmes needed to embed themselves more effectively across national, provincial and municipal levels of government.
Though economic policy processes had been sound, one of the key limitations in the implementation of economic policy had been the cost of institution building. Institutions such as some of the small business agencies, the National Empowerment Fund, the National Development Agency, the Umsobomvu Fund, some of the SETAs, and many local government -level economic agencies had taken a great deal of time to become effective. Some key lessons had been that the cost of institution building should not be underestimated, and that, where possible, new tasks should be incorporated into the work of existing successful agencies. In addition, some rationalisation of existing institutions might lead to medium-term gains, though these would have to be weighed against the costs of rationalisation.

3. Terms of reference and proposed methodology
The terms of reference for this study are as follows:
The Policy Unit in the Presidency is conducting a fifteen-year review of government business. The main aim of the review is:
To assess the outcome and impact of policies, programmes and projects as implemented by government since 1994, with particular emphasis on the current electoral mandate period (i.e. since 2004). The study/paper should take into consideration (be based on) the conclusions of the ten-year review,
To identify the impact of government industrial programmes and instruments, To provide analysis and evidence of reasons for the success (and sustainability) or failure of the dti
SMEDP, SIP, IDZs, SDIs, MIDP and other support measures such as customised sector programmes, including an analysis of various industrial support programmes at a local and provincial level,
To provide an overall cost-benefit analysis of the various government industrial support measures and programmes at national, provincial and local level,
To establish how effective government’s industrial support measures have been, To undertake systematic analysis of various government industrial support measures from national,
provincial and local level, and to use that as a basis for deducing the success or failure of government industrial support for the period under review. Data should cover the period since 1994 if possible, and longer if desired. Data series used should be included in the report in tabulated form (in addition to graphs and formulae).
3.1 Timeline
First draft – 30 January 2008
Workshop discussion/discussions – 1-12 March 2008
Final report – 30 March 2008
3.2 Methodology
The 2003 review organised its analysis of trade and industrial policy according to the following themes/policy tool areas:
Macro-economic stability,
Trade reform and market access,
Industrial policies,
Foreign direct investment,
Competition policies,
Encouraging SMMEs,
Skills development,
Affirmative action (empowerment),
11

A Review of Industry Policy, Instruments and Support Programmes: 1994-2008
12
Support innovation, research and development,
Land reform.
In each of these areas, the 2003 review highlighted the progress made over the period 1994-2003 and recommended certain priorities for the next five-year period. Subsequent sections of this report assess the impact of implementing the 2003 priorities by drawing on and integrating a considerable wealth of primary research on trade and industry policy, including the research on which the ten-year review was based.
Relevant research, analysis and literature mainly (but not exclusively) since 2003 has been reviewed and organised into a comprehensive industrial policy bibliography and database. This is currently maintained on the Trade and Industrial Policy Strategies (TIPS) website and can be further updated and utilised beyond the life of this project.
3.3 Data
The data used include selected Stats SA and SARB statistical data series as well as the Quantec database.
3.4 Interviews
Following the planned review workshop, selected interviews may be conducted with key policy decision makers and implementers within the dti and government as part of the methodology.

4. Review of South Africa’s economic performance 1994-2002 and 2003-2007
4.1 Introduction
Industrial policy has long been a cornerstone of South African economic policy under both the previous and current governments. The previous government, by virtue of its international pariah status, was forced to develop a particularly interventionist industrial policy with significant state funding for ‘strategic’ investments and a raft of financial support measures. The latter spanned the full range of the life-cycle of a firm, including R&D, support, manipulation of consumer demand, production support and, indeed, export and tariff assistance. Although often excessively wasteful, the degree of coordination and financial support provided to industry was impressive.
The current government’s interest in industrial policy can be traced as far back as the Freedom Charter –
‘The national wealth of our country, the heritage of South Africans, shall be restored to the people;
The mineral wealth beneath the soil, the Banks and monopoly industry shall be transferred to the ownership of the people as a whole;
All other industry and trade shall be controlled to assist the wellbeing of the people;
All people shall have equal rights to trade where they choose, to manufacture and to enter all trades, crafts and professions.’
– which alludes to a broad range of what have become the de rigeur tools of industrial policy, including competition policy and economic regulation, as well as the clear linking of industrial policy to improvement in living standards. These commitments were further detailed in the RDP and GEAR policy statements and have played a significant role in influencing the policy and programme content of the South Africa’s industrial policy, primarily coordinated by the dti.
The purpose of this report is to review government’s progress on industrial policy and programmes and the effectiveness thereof over the 15-year period, 1994 to 2008, thereby coinciding with the end of the current Administration’s electoral mandate. We attempt to do this through an assessment of South Africa’s industrial performance, including in relation to global developments, and a detailed review of the performance of current industrial policy programmes and incentive schemes.
4.2 Review of South Africa’s economic performance 1994-2007
4.2.1 Domestic performance
Growth
South Africa’s economic performance has been positive and stable over the last 15 years. Figure 1 shows the extent to which the SA economy has progressed from the boom-bust cycles of the 1980s and early 1990s. The economy is currently experiencing its longest continuous growth phase in SA recorded history and this has been accompanied by a substantial acceleration of growth in the last 3/4 years as domestic investor confidence has grown. Moreover, the SA economy has also developed resilience to global developments with the East Asian crisis of 1998 only temporarily slowing the positive rate of growth.
13

A Review of Industry Policy, Instruments and Support Programmes: 1994-2008
14
Figure 2: GDP year-on-year growth rate (%, 1981-2006)
1981 1982 1983 1984 1985 1986 1987 1988 1989 1990 1991 1992 1993 1994 1995 1996 1997 1998 1999 2000 2001 2002 2003 2004 2005 2006
6.00
5.00
4.00
3.00
2.00
1.00
0.00
-1.00
-2.00
The structure of the SA economy has, however, changed substantially during this period. Figure 3 shows the substantial increase in the importance of the tertiary sector of the economy which has become an important – and increasingly autonomous – driver of growth in SA.
Figure 3: Structure of South Africa’s economy – main economic sectors as % of total
0%
20%
40%
60%
80%
100%
1980 1982 1984 1986 1988 1990 1992 1994 1996 1998 2000 2002 2004 2006Years
Primary Sector Secondary Sector Tertiary Sector

15
Table 1 provides more detail and shows three key trends:
The steady decline in the importance of the primary sector;
The early decline and later stabilisation of the secondary sector; and
The steady and substantial growth in the importance of the tertiary sector in overall GDP.
Table 1: Structure of South Africa’s economy – main sector as % of GDP, 1980 to 2006, selected years
1980 1985 1990 1995 2000 2005 2006
Primary Sector 15.5 14.3 13.1 11.7 10.8 9.7 8.8
Secondary Sector 27.6 26.1 26.0 25.0 24.2 23.5 23.6
Tertiary Sector 56.9 59.6 61.0 63.3 64.9 66.9 67.6
The main cause of the decline in the importance of the primary sector is the near halving of the contribution of the mining sector, with gold mining in particular in long-term decline as deposits are depleted or become increasingly difficult to mine. The substantial growth of the platinum mining industry is overshadowed by developments in gold, but has at least softened what would otherwise have been a near catastrophic – especially in employment terms – reduction in the primary sector’s contribution to economic growth. Substantial investments have been undertaken by both private sector and state agencies in the development of technology to support more productive gold mining – at lower depths and to recover precious metals not previously viable – but it is increasingly clear that the sector is a ‘grandfather’ industry and that its long term outlook is deeply negative.
Some of the social implications of this have already been addressed but there remain a number of key questions surrounding the extent to which the technical and intellectual capacity that has been accreted over its lifespan can be protected and re-focused on other important growth sectors. Moreover, the currently stalled General Agreement on Trade in Services (GATS) negotiations could provide a significant opportunity for SA. In terms of Mode 4 Access (movement of people) the ‘export’ of technical staff in mining and its associated industries could become a significant source of additional revenue for SA.3 Moreover, with SA’s large mining houses already exploiting mineral opportunities in a range of both developed – but mainly developing – countries, a successful GATS negotiation could assist in accelerating SA firms’ ability to viably prospect, develop and mine deposits around the globe. Sub Saharan Africa and SADC in particular remain difficult countries for foreign investors including – or in some cases especially for – SA firms.
3 One line of argument is that highly skilled expatriates working abroad eventually return to SA, often with significant savings which enters the domestic economy through consumer spending, additional demand for housing and investment.

A Review of Industry Policy, Instruments and Support Programmes: 1994-2008
16
Table 2: Structure of South Africa’s economy: primary sector - % of sector’s contribution, 1980 to 2006, selected years
1980 1985 1990 1995 2000 2005 2006 Primary Sector 15.5 14.3 13.1 11.7 10.8 9.7 8.8
Agriculture, Forestry and Fishing [1] 3.7 3.3 3.7 2.9 3.3 2.9 2.4
Mining and Quarrying [2] 11.8 11.0 9.4 8.9 7.6 6.8 6.4
Coal Mining [21] 1.9 2.3 1.7 1.5 1.4 1.3 1.0
Gold and Uranium Ore Mining [23] 4.9 4.6 3.9 2.9 2.0 1.2 1.0
Other Mining [22/24/25/29] 4.9 4.0 3.8 4.5 4.1 4.3 4.5
Table 2 shows that Agriculture too has not performed very strongly and, although subject to climatic conditions and the availability of arable land, its growth has not kept pace with the growth of the economy more generally. Moreover, the decline in its contribution comes against the backdrop of strong local and international consumer demand, especially in the last four years. As is argued in the 15 Year Review of Agriculture, the sector has remained largely unchanged over the review period with a large and generally stagnant commercial agriculture component and a fledgling, heavily under-resourced emergent sub-class.
Table 3 presents the secondary sector and sub-sectors’ shares of total GDP. Manufacturing has declined in significance somewhat, although it remains substantial at just under 20% of total GDP. The sector underwent a widespread and generally painful restructuring in the mid and late 1990s, although it had already been in decline for extended periods during the 1980s.
Table 3: Structure of South Africa’s economy: secondary sector - % of sector’s contribution, 1980 to 2006, selected years
1980 1985 1990 1995 2000 2005 2006 Secondary Sector 27.6 26.1 26.0 25.0 24.2 23.5 23.6
Manufacturing [3] 21.3 20.1 20.1 19.3 19.0 18.0 18.0
Electricity, Gas and Water [4] 2.0 2.4 2.6 2.8 2.7 2.4 2.4
Electricity, Gas and Steam [41] 1.4 1.7 2.2 2.4 2.3 2.1 2.1
Water Supply [42] 0.5 0.6 0.4 0.5 0.4 0.3 0.3
Construction (Contractors) [5] 4.4 3.7 3.3 2.8 2.5 3.1 3.3
Building Construction [51] 2.4 2.4 2.1 1.8 1.5 1.8 1.9
Civil Engineering and Other Construction [52-53] 2.0 1.3 1.2 1.0 1.1 1.3 1.4

Figure 4: Year-on-year growth of total economy and manufacturing - %, 1981 to 2006
-8.00
-6.00
-4.00
-2.00
0.00
2.00
4.00
6.00
8.00
10.00
1981 1982 1983 1984 1985 1986 1987 1988 1989 1990 1991 1992 1993 1994 1995 1996 1997 1998 1999 2000 2001 2002 2003 2004 2005 2006
Simple Year on Year Growth Rate All Sectors Simple Year on Year Growth Rate ManufacturingSimple Year on Year Growth Rate Tertiary Simple Year on Year Growth Rate Primary
Figure 4 highlights a number of important trends. Firstly, the manufacturing sector’s very poor performance during the 1980s is apparent, accompanied by significant volatility up to 1994. Post 1994, the restructuring of the sector took place between 1996 and 2000 with generally low growth rates dragging down the growth of the Total Economy. From 2001, with the effects of the East Asian crisis largely muted for SA, the manufacturing sector appears to be on a more stable growth path. In addition, manufacturing growth now more closely tracks (or vice versa as some argue) the growth performance of the tertiary sector.
The rest of this section analyses trends in manufacturing sub-sectors in more detail.
Figure 5 shows annual average growth rates calculated for two five-year periods and two three-year periods. The periods have been deliberately chosen in order to periodise important developments in the domestic economy.
Figure 5 ranks manufacturing sector by annual change in the period 2004-2006. It is apparent that almost all manufacturing sectors are currently growing. Only five of the 28 manufacturing sectors are not growing in the latest period. Of these five sectors, only Machinery and Beverages are of any real consequence. Printing, Tobacco and Professional & Scientific equipment are all relatively small sectors (each accounting for less than a 3% share of total manufacturing) and are not particularly strategic. What is of concern, however, is the composition of the ten fastest-growing sectors.
17

A Review of Industry Policy, Instruments and Support Programmes: 1994-2008
18
Figure 5: Manufacturing performance by sector - weighted annual % change by main periods
-12
-8
-4
-
4
8
12
16
Pap
er
Bas
ic ir
on a
nd s
teel
Aut
os
Gla
ss
Leat
her
Oth
er m
anuf
actu
ring
etro
leum
pro
duct
s
Food
ther
tran
spor
t equ
ip.
Bas
ic c
hem
ical
s
Rub
ber p
rodu
cts
Clo
thin
g
Met
al p
rodu
cts
Non
-met
allic
min
eral
s
Foot
wea
r
Ele
ctric
al m
achi
nery
Pla
stic
o an
d co
mm
unic
atio
n
Non
-ferro
us m
etal
s
Woo
d
Furn
iture
Oth
er c
hem
ical
s
Text
iles
Toba
cco
Mac
hine
ry
Bev
erag
es
and
sci
entif
ic e
quip
.
Prin
ting
Cok
e an
d p
O
TV, r
adi
Pro
fess
iona
l
1990-1994 1995-1999 2000-2003 2004-2006
In what would appear to be a re-emergence of a trend first noted in the early 2000s by Simon Roberts, many of the fastest growing sectors are resource or capital intensive. With the exception of Autos and Other Transport Equipment, most of the fastest growing sectors are resource intensive with Glass and Basic Chemicals highly capital intensive. However, although this combination of sectors may not lead to substantial employment creation, they collectively account for more than 50% of total manufacturing output and the strong growth performance therefore easily outweighs the decline in relatively small sectors. This should be a key factor in policymakers’ decisions of where to focus resources.
Table 4: Growth trends: manufacturing sectors, 2004-2006 - weighted annual % change
Sector 2004-2006Paper 14.68Basic Iron and Steel 12.72Autos 10.85Glass 10.15Leather 8.65Other Manufacturing 7.80Coke and Petroleum Products 6.99Food 5.57Other Transport Equipment 5.51Basic Chemicals 4.14
It may be worth looking at the growth trends of manufacturing sectors sorted by their growth in the 2000-2003 period where a very different pattern presents itself. In this period, although the growth rates are largely comparable, the fastest growing sectors are generally very small with Plastic, Furniture, Textiles and Prof & Scientific Equipment each accounting for less than 3% of manufacturing GDP. The growth of these small

sectors and the decline of a small number of large sectors had a significant impact by cutting the overall manufacturing sector’s performance. What is particularly interesting about the group of fastest growing sectors is the prominence of labour intensive sectors such as Leather, Plastics, Furniture and Metal Products. Unfortunately this trend seems to have been reversed in the 2004-06 period and, apart from Leather, no labour intensive sectors have featured.
Table 5: Growth trends: manufacturing sectors, 2000-2003 - weighted annual % change
Sector 2000-2003Professional And Scientific Equipment 12.32Glass 11.71Leather 11.69Basic Iron and Steel 10.07Furniture 8.91Plastic 8.13Other Transport Equipment 6.40Machinery 5.92Textiles 3.68Other Chemicals 3.60Metal Products 2.55
Employment
Whilst we emphasize that employment data from the Quantec database should be treated with some caution, particularly for services, we use these next. Generally, figure 6 shows the underperformance of the economy generally in creating jobs. Although business services and retail services have seen rapid and sustained growth over the last few years, the former creates mainly high-skill jobs. Perhaps the biggest disappointment is the agriculture sector where jobs continue to be lost.
19

A Review of Industry Policy, Instruments and Support Programmes: 1994-2008
20
Figure 6: Underperformance of the South African economy in creating jobs - weighted average % change
-8.00
-6.00
-4.00
-2.00
-
2.00
4.00
6.00
8.00
10.00
1990-1994 1995-1999 2000-2003
A111: Agriculture, forestry and fishing [1] A112: Mining and quarrying [2]A121: Manufacturing [3] A122: Electricity, gas and water [4]A123: Construction (contractors) [5] A131: Trade, catering and accommodation services [6]A1321: Transport and storage [71-74] A1322: Communication [75]A1331: Finance and insurance [81-82] A1332: Business services [83-88]A13411: Medical, dental and veterinary services [93] A13412: Excluding medical, dental and veterinary services [94-96]
Figure 7, below, provides a breakdown of the key manufacturing sectors’ employment performance. Based on these data it is clear that the sectors creating jobs at the fastest rate are, in fact, relatively capital and/or resource intensive. What is key though is that the largest sectors (in terms of absolute employment numbers) are not creating jobs. These are the food sector (the largest employer accounting for 160 000 jobs), Autos with 135 000 jobs and metal products with 126 000 jobs.
Moreover, if we compare the performance of sectors in the 2000-03 period with the later 2004-06 period, it is clear that a reversal similar to that seen for output growth has occurred in respect of employment too. Figure 8 shows that, in the 2000-03 period, a number of labour intensive sectors such as Furniture, Metal Products, Machinery and Autos grew at around 1-2.5% per year. This rather modest growth nonetheless accounted for 16 000 of the total of 20 000 new jobs created in manufacturing between 2000 and 2003. In the 2004-06 period, although the highest growth rate achieved was 4.5% for non-metallic minerals, the sector was simply too small (in employment terms at least) to be of any great significance.
The point we made in an earlier section of the report is worth repeating: strong growth rates in sectors of manufacturing are not of themselves notable. The key issue is the size of the sector in both output and employment terms. In a similar vein, support to labour intensive sectors may be less effective than supporting sectors which account for large numbers of the employed.

21
Figure 7: Key manufacturing sectors’ employment performance - weighted annual % change
-12
-8
-4
-
4
8
Non
-met
allic
min
eral
s
Oth
er c
hem
ical
s
Bev
erag
es
Mac
hine
ry
Non
-ferro
us m
etal
s
Ele
ctric
al m
achi
nery
Gla
ss
Met
al p
rodu
cts
Aut
os
Prin
ting
Cok
e an
d pe
trol.
prod
ucts
V, r
adio
& c
omm
unic
atio
n
Oth
er m
anuf
actu
ring
Bas
ic c
hem
ical
s
Food
Pro
f. &
sci
entif
ic e
quip
.
Bas
ic ir
on &
ste
el
Oth
er tr
ansp
ort e
quip
.
Woo
d
Toba
cco
Pla
stic
Leat
her
Furn
iture
Pap
er
Foot
wea
r
Rub
ber p
rodu
cts
Text
iles
Clo
thin
g
T
2000-2003 2004-2006
Figure 8: Manufacturing employment sorted by year: 2000-2003 - weighted annual % average
-12
-8
-4
-
4
8
Oth
er tr
ansp
ort e
quip
.
Oth
er m
anuf
actu
ring
Pro
f. &
sci
entif
ic e
quip
.
Cok
e &
pet
ro p
rodu
cts
Mac
hine
ry
Met
al p
rodu
cts
Furn
iture
Bas
ic ir
on &
ste
el
Aut
os
Prin
ting
Gla
ss
Non
-met
allic
min
eral
s
Toba
cco
Non
-ferro
us m
etal
s
Oth
er c
hem
ical
s
Pap
er
Pla
stic
Text
iles
Rub
ber p
rodu
cts
Woo
d
Food
Clo
thin
g
Bas
ic c
hem
ical
s
Bev
erag
es
Ele
ctric
al m
achi
nery
Leat
her
Foot
wea
r
V, r
adio
& c
omm
unic
atio
nT
2000-2003 2004-2006

A Review of Industry Policy, Instruments and Support Programmes: 1994-2008
22
Gross domestic fixed investment
Figure 9, below, indicates trends in GDFI by main sector. In general, the growth rates of GDFI are substantially better than in all of the previous periods from 1994. Although some sectors have fared better than others, overall GDFI was strong in the 2004-06 period. Coal Mining, Transport, Communication and Retail Trade all grew by more than 10% per year. The worst performers were the Agriculture sector and Gold Mining.
Figure 9: Real GDFI, 2000-2003 and 2004-2006 - weighted annual % change
-40
-30
-20
-10
-
10
20
30
40
Coa
l min
ing
al a
nd v
eter
inar
y se
rvic
es
edic
al, d
enta
l and
vet
erin
ary
serv
ices
Com
mun
icat
ion
Bus
ines
s se
rvic
es
Wat
er s
uppl
y
Tran
spor
t and
sto
rage
Who
lesa
le a
nd re
tail
trade
Man
ufac
turin
g
Fina
nce
and
insu
ranc
e
Con
stru
ctio
n
Elec
trici
ty, g
as a
nd s
team
d ac
com
mod
atio
n se
rvic
es
ener
al g
over
nmen
t ser
vice
s
ultu
re, f
ores
try a
nd fi
shin
g
Oth
er m
inin
g
ld a
nd u
rani
um o
re m
inin
g
Med
ical
, den
t
Excl
udin
g m
Cat
erin
g an G Ag
ric
Go
2000-2003 2004-2006
For sectors in manufacturing, the picture is similar with the majority of these growing GDFI at high and sustained levels for the 2004-06 period. The pattern in investment is not particularly clear, but the prevalence of a number of consumer durable sectors may suggest that manufacturers were investing in anticipation of a continued consumer boom. Sectors such as Wood, Footwear and Furniture, as well as Mechanical and Electrical Machinery suggest a wide-ranging sense of confidence in the economy.
Capacity utilisation
During the period under review, manufacturing sector capacity utilisation has been growing steadily, and is currently at very high levels.

23
Figure 10: Growth in manufacturing sector capacity utilisation, % per month, 2000 to 2006, trend and actual
Figure 11: Real Manufacturing GDFI, 2000-2003 and 2004-2006 - weighted annual % change
-60
-40
-20
-
20
40
60
80
Woo
d
Mac
hine
ry
TV, r
adio
and
Foot
wea
r
Non
-met
allic
Prin
ting
Cok
e an
d
Oth
er
Oth
er
Furn
iture
Ele
ctric
al
Food
Met
al p
rodu
cts
Pap
er
Toba
cco
Aut
os
Pla
stic
Bas
ic
Gla
ss
Leat
her
Pro
fess
iona
l
Text
iles
Bev
erag
es
Bas
ic ir
on a
nd
Rub
ber
Clo
thin
g
Oth
er tr
ansp
ort
Non
-ferro
us
2000-2003 2004-2006

A Review of Industry Policy, Instruments and Support Programmes: 1994-2008
24
Figure 12: Manufacturing GDFI: shares as % of total for selected years
0%
20%
40%
60%
80%
100%
1980 1985 1990 1995 2000 2005
Wood Machinery TV, radio and communication FootwearNon-metallic minerals Printing Coke and petroleum products Other manufacturingOther chemicals Furniture Electrical machinery FoodMetal products Paper Tobacco AutosPlastic Basic chemicals Glass LeatherProfessional and scientific equip. Textiles Beverages Basic iron and steelRubber products Clothing Other transport equip. Non-ferrous metals
Trade
The 15 Year Review of Trade Policy paper covers this theme in detail. Here we only highlight that, overall, the patterns of structure of SA trade remain largely unchanged from 1994. Moreover, although manufactured exports are a larger share of total exports today, SA trade remains distinctively that of a developing country: exports are dominated by primary products and imports by capital goods. The costs and benefits of the consumer boom of recent years are reflected in the increase in imports of consumer goods from China in particular. In general, however, import penetration has increased only slightly in recent years. Export performance has slowed in recent years, partially a result of the volatility and exchange rate levels.
From a policy perspective, perhaps the most worrying aspect of SA’s trade performance is the very small – and declining – share SA has of dynamic product exports. These sectors, defined broadly as demonstrating sustained, high export growth, are seen as an indicator of export dynamism. SA’s weak showing in this category suggests that trade policy has not been very successful in changing the product profile of its exports.
4.3 Concluding remarks
This part of the Review has attempted to deconstruct some of the competing trends influencing the performance of the real economy – and especially manufacturing – in recent years. Our initial assessment suggests that the service sector is now firmly the most important contributor to SA growth and is, increasingly, a stable source of growth. There are significant opportunities for further growth in service sectors to be facilitated. In particular, the Health, Education and Communication sectors could benefit from further policy assessment. For example, trade in Education Services through distance learning – especially at postgraduate level – has become a substantial global industry with many of the top 100 universities globally seeing this as a new route for expansion.. SA universities already accommodate large numbers of SADC students, but the opportunities have not yet been maximised. In Health, the Netcare group has pioneered the movement of doctors and dentists, to the UK especially, for the provision of health services. This has

become a significant source of income for the Netcare Group and provides a non-threatening channel for ‘importing’ countries whilst potentially reducing the risk of a further exodus of SA doctors and nurses.
The primary sector – and mainly agriculture – continues to under-perform its potential. For agriculture and more broadly defined agribusiness, potential remains high but largely unexploited. Anecdotal evidence suggests that simply expanding access to land and agricultural services would have a significant impact on the sector. The commercial sector is moderately competitive and it is unlikely that substantial growth opportunities exist here.
Manufacturing’s performance has been positive throughout much of the Review period. However, three clear phases are visible. In the period immediately after 1994, many manufacturing sectors were in a state of restructuring. In general, deindustrialisation was successfully avoided. The structure of manufacturing GDP changed significantly in this period with clearly uncompetitive sectors such as TV and electronic appliances losing their share of Manufacturing GDP. By 2000, much of the restructuring activity appears to have been completed and the depreciation and relative weakness of the rand offered labour intensive sectors such as Furniture, Leather (though attached to the MIDP), Plastics and Metal products some respite. The third phase has seen a reversal of these trends and, coupled with the appreciation of the rand and China’s entry into key labour intensive export sectors, resource and capital intensive sectors have become more prominent.
Paper, Glass, Iron and Steel, and Coke products have all shown strong and sustained growth in the recent period. As a number of these sectors are large – in the production sense – the effect has been good manufacturing output growth. However, as these sectors are relatively small employers and the large employment sources such as Food and Metal products have grown less quickly, the effect on employment creation has been small.
25

A Review of Industry Policy, Instruments and Support Programmes: 1994-2008
26
5. Assessment of the effectiveness of key industrial policies, programmes and projects
Drawing from recent work commissioned by the dti,4 this chapter assesses the performance of government’s main industrial support measures. In fulfilling the cost-benefit component of the terms of reference, each industrial support programme is considered in terms of the impact of the allocated financial resources of the programme on its target/objective. The analysis also profiles the individual and collective sectoral coverage of the programmes.
5.1 Introduction – the evolution of dti incentive programmes: 1994-2005
This framework of the South African trade and industry policy incentive regime was set between 1995 and 1998, when the dti reorganised itself and all trade and industry support programmes underwent review and were restructured to provide support in three areas; Competitivess (through a range of supply-side measures), Export Marketing Assistance and Industrial Investment Promotion. The key changes included:
The introduction of a suite of new incentive programmes aimed at increasing the competiveness of South African industry,
Enhancement of the Export Marketing and Investment Assistance Programme (EMIA),
Increased focus on small and medium enterprises (SME),
Accelerated termination of the General Export Incentive Scheme (GEIS), the costs of which vastly exceeded the benefits delivered, and which was proving to be unsustainable and to be undermining improved competitiveness,
Phasing out of old programmes – the Regional Industrial Development Programme (RIDP) was replaced with the Manufacturing Development Programme (MDP),
The MDP was extended by opening a Small and Medium firm Manufacturing Development Programme (SMMDP)
Introduction of Spatial Development Initiatives (SDI), clearly defined projects, which were managed by a special unit within the dti.
These changes resulted in a real reduction in the overall value of on-budget dti programmes, mainly as a result of terminating the GEIS programme, and during the period 1994-1999, although the lower budget was not a significant constraint to programme implementation.
During this period there was also a growth in the value of tax-based incentives which were not recorded on the balance sheet of the dti in particular through:
Duty credit incentives for the motor industry through the revised Motor Industry Development Programme (MIDP) - (see below),
4 Rustomjee (2005), DTI Incentives review process (Phase 1) – Incentives policy framework, Final report, 16 November. A study commissioned by the dti, Pretoria

27
Duty credit incentives for the clothing and textile industry through the Duty Credit Certificate Scheme (DCCS),
Tax incentives utilising Section 37E of the Tax code (not on the dti’s budget), which terminated in 1999 according to its original timeline
Between 2000 and about 2003, further review and refocussing of policy and programmes, captured in a number of policy documents5, were initiated with the following changes:
Broadening of sector target definitions of the Small and Medium Enterprise Development Programme (SMEDP), the biggest of the dti’s budgeted programmes, to include service enterprises,
Industrial Development Corporation (IDC) targets were also broadened – its mandate was relaxed to include non manufacturing investments and Southern African Development Community (SADC) investments, the latter in order to promote regional economic integration,
Broadening of the dti’s sector target scope, in recognition of the sectoral linkages with core manufacturing sectors. Specific new support incentive programmes were introduced, such as:
• The Critical Infrastructure Programme (CIP), aimed at financing the necessary bulk infrastructure required to support other (mainly) industrial investment projects,
• Incentive packages, modelled on the MDP, which targeted non-manufacturing, labour-intensive sub-sectors, including:
− A Film & TV rebate scheme,
− A Business Process Outsourcing (BPO) incentive scheme,
Reintroduction of tax-based incentives through the new Strategic Investment Programme (SIP) initiated with a finite window and a defined overall value of fiscal benefit which, once reached, would automatically terminate the programme. The SIP programme value was not formally on the dti’s budget,
Regular review and modification of individual programmes.
5.2 The changing structure and application of dti incentives: 1994-2005
Over the past 15 years, the dti has gained considerable experience in developing and administering investment incentive programs, having adopted, adapted and discarded a range of incentives over two periods, 1994-1999 and 1999-2005.
This has taken place during a period of significant restructuring of the domestic economy and far-reaching changes to the global economy and the way in which different domestic sectors have interacted with it.
The table below attempts a preliminary analysis of how the changes in the economy have prompted changes in the incentive regime.
5 the dti (2001) Driving competitiveness: Towards a new integrated industrial policy for sustainable employment and growth, Department of Trade and Industry,
the dti (2003), 10-Year Review and Strategic Planning. Sustainable economic development – investment promotion and growth, Trade and Industry South Africa, the dti

A Review of Industry Policy, Instruments and Support Programmes: 1994-2008
28
Table 6: 1994-2006: changes in incentive structure and application
1994-1999 1999-2004 2005-
Overall trajectory of national economy
Mixed sectoral growth & decline during period of significant internal restructuring
Dangerous fiscal risks and adverse macroeconomic position of RSA economy
Spluttering global economy. RSA economy affected adversely by Asian crisis, Russian crisis, Latin American crisis
Continuation of restructuring of existing sectors
Major growth of the telecommunication/cellphone-related sector
RSA economy structurally sound & increasingly driven by domestic consumption & infrastructure investment
Emergence of increasing alignment and stabilisation of global growth drivers
Dragon-driven global growth impacting favourably on medium-term commodity price outlook
Major global risks - Dollar devaluation
RSA economy amongst most open of emerging market economies
Restructuring of domestic sectors – upstream
Upstream capital intensive Metals and Chemicals sectors restructure and expand significantly
Recapitalisation of Textile industry less successful than anticipated
Cyclical commodity price dip strains upstream metals sectors as new capacity comes onstream – driving further restructuring
Later, infrastructure & logistical capacity constraints begin to impede primary extraction and beneficiation sectors
Environmental specifications drive investment in the liquid fuel value chain
Competitive upstream sectors running at full capacity with Metals-related potential to expand on global demand
Environmental specifications and supply constraints to drive investment in the liquid fuel value chain
Monopoly control of upstream has potential to constrain downstream and economic growth
Restructuring of domestic sectors – downstream and other linked sectors like services
Little aggregate growth in fixed investment during restructuring period
Auto industry exception, due mainly to MIDP and existing investment incentives
Significant growth in services sub-sectors, partly driven by growing domestic consumption
Significant competitive threats from imported products
High capacity utilisation – significant investment needed to support 6% growth target
Incentive restructuring
Termination of wasteful incentives
Phased tariff liberalisation used to pressure industrial restructure
Conscious continuation to significantly incentivise capital intensive export-oriented beneficiation sectors
Restructuring of investment incentives to target downstream sectors
Particular focus on supporting SMEs
Reorganisation of institutions disbursing incentives
Extension of incentives to support capital intensive upstream industries
Expansion of investment incentives to support downstream small and medium firms
Broadening of incentives to cover non-manufacturing economic activities
Broadening of support to MSMEs by promoting entrepreneurship
Increasing alignment of investment incentives to support domestic vs. imported supply to meet infrastructure-led and domestic consumption demand-led growth
Consolidation of MSME support institutions

As at 2007, the economy and the manufacturing sector in particular, appear to be robust in the face of a much more open economy than might have existed in 1994. The key drivers of the economy now seem to be a mix of:
More sustainable domestic consumption demand,
A sustained plan of state-led infrastructure investment, based on a relatively strong fiscus,
Expected and sustained global demand for the RSA’s resource commodities,
5.3 Breadth and depth of targets covered by dti family incentives
In 2006, the dti embarked on a comprehensive review of its incentive programmes, in parallel with the development of the National Industrial Policy Framework and its associated Industrial Policy Action Plan.
The following tables show the wide array of programmes that are currently offered by the dti and its family of associated institutions.
As is apparent, the programmes are aimed at a variety of targets which include sector targets, small and medium enterprises, women-owned firms, spatial development targets, research, supplier development and many others.
Table 7: dti family investment incentives
Investment Grants & Tax Incentives Loan Finance & Loan Guarantees
Critical Infrastructure Programme Foreign Investment Grant Small and Medium Enterprise Development Programme
(SMEDP) Small and Medium Manufacturing Development Programme
(SMMDP) Capital Goods Feasibility Study Fund Business Process Outsourcing/ Offshoring scheme Cooperative Incentive Scheme Accelerated Depreciation Allowance Assistance by Individual Primary Steel Producers Comprehensive Business Asset Reinvestment Relief Depreciation Allowance Development Programme for the textile and clothing
industry Productive Asset Allowance Start-up allowances Strategic Industrial Projects Tax Stimulus in Support of Small Businesses Urban Renewal Tax Incentive Film and TV Production Rebate Scheme The National Industrial Participation Programme Developmental Electricity Pricing IDZ Regional Industrial Development Programme
Agro-Industries Development Finance Bridging Finance for Contractors and Tenders Business Loans for Retail Finance Intermediaries Empowerment Finance Entrepreneurial Mining and Beneficiation Finance Finance for the Textiles, Clothing, Leather and Footwear
Industries Financing for the Expansion of the Manufacturing Sector Orchards Schemes Seed Loans for Retail Finance Intermediaries Techno-Industry Development Finance Technology Transfer Guarantee Fund The Land Reform Credit Facility Tourism Development Finance Wholesale Finance
Loan Guarantees Danida Business to Business Programme Khula Credit Guarantee Khula Equity Fund Khula Start
29

A Review of Industry Policy, Instruments and Support Programmes: 1994-2008
30
Table 8: dti trade facilitation incentive programmes
Export Marketing and Investment Assistance (EMIA) • Missions • Primary Market Research • Individual Exhibitions • National Pavilions • Sector Specific Assistance • Exporter Training • SA Trust Fund
Export Credit Insurance: Financial Credit, Investment Insurance,Project Credit,Suppliers credit Industrial Development Zones
Reducing anti-export bias - Rebate Schedules to Customs and Excise Act – 470.03, etc Duty Credit Certificate Scheme Motor Industry Development Programme (MIDP)
Table 9: dti competitiveness programmes
Sector Partnership Fund Skills Support Programme Support Programme for Industrial Innovation (SPII) Technology and Human Resources for Industry Programme (THRIP) Workplace Challenge Competitiveness Fund Black Business Supplier Development Programme Learnership Tax Allowance Research and Development Allowance Techno-Girl Technology for Women in Business (TWIB) The Community Public Private Partnership Programme (CPPP)

31
5.4 Value of dti incentives : 2001-2005
Table 10: Historic value of dti incentives (Rm)
Year Investment Promotion6
Trade Facilitation
(EMIA only)
Competitiveness (SPII, THRIP,
Competitiveness fund, Sector
partnership fund only)
Total Budget
DCCS MIDP
National Industrial
Participation Programme 7
2001 1,009.7 121 0 2,554.8 532.0 500 2002 1,074.7 71 227 2,245.4 1,087.5 500 2003 1,133.8 100 272 2,280.0 1,557.1 15,000 500 2004 1,359.4 67 276 2,796.3 959.0 500 2005 538.1 287 3,623.3 357.3 17,000 500
Source : the dti
The above table illustrates the trends in nominal values of dti incentives, organised according to the major categories. Also shown are the fiscal values of the sectorally targeted DCC and MIDP duty rebate certificate programmes, as well as the National Industrial Participation Programme, all of which have an impact on their targeted economic sectors, but which are effectively financed outside of the dti budget.
Table 11: dti budget analysis
Category 2006/07
Total budget R3 665 912
Transfer payments 40.43% Incentive programmes 37.45% Personnel expenditure 8.21%
Operations & Professional services 12.79%
5.5 The performance of incentive instruments: incentive programme reviews
Since 1994 the dti has gained considerable experience in programme management through the regular review of the programmes that it administers. It has also continuously adjusted these programmes in accordance with review recommendations. The following sections are based on analysis of the reviews carried out over time on a number of dti incentive programmes.
6 Only actual payments of RIDP, MDP, SMMDP, SMEDP, SIP recorded above. 7 R500m average per annum (R2500m investment facilitated by NIP credits between 2001-2005).

A Review of Industry Policy, Instruments and Support Programmes: 1994-2008
32
Table 12: Programmes that have been reviewed since 1994
Programme Review date
RIDP 1995 MDP 2001, 2006 Strategic Investment Programme 2004, dti (2004b) Small and Medium Enterprise Development Programme (SMEDP)
2004, dti (2004a)
Competitiveness Fund & Sector Partnership Fund
2005, SDC (2005), Phillips (2005)
BBSDP 2004 SPII 2006, Pouris (2006) THRIP 2006, Pouris (2006)
5.6 The performance of Competitiveness programmes
5.6.1 Sector Partnership Fund (SPF)8
The SPF is a fund of about US$6 million, which was a component of the World Bank/ dti Industrial Competitiveness and Job Creation Project. The project was launched in 1997 and completed in September 2004.
The idea of a fund to promote sub-sector partnerships (SPs) was partly derived from the cluster strategy for industrial promotion that has been followed in a number of industrialised economies in recent years. The SPF supported networks of enterprises in making collective investments to boost both enterprise and sub-sector performance. Collective investments are those that benefit a group of producers or an industry, but which might not be attractive enough for individual firms to invest in for their own account. As an innovative approach it justifies an assessment separate from the overall project
Under the SPF project a total of about 870 individual firms received some degree of direct assistance through 100 upgrading programs in 96 SPs plus, indirectly, the member firms of a number of industry associations. The maximum grant from the SPF was 65% of the total cost for a partnership programme, subject to a normal limit of R1.0 million, the remainder being paid by the assisted partnership member firms.
The 2004 programme review found that the SPF had a satisfactory productivity outcome; weak vertical and horizontal spill-over effects mainly because partner firms were often not highly interlinked, but operated largely as independent recipients of the upgrading programmes; network impact was less than satisfactory - on balance the project did not actually build networks, nor did it significantly strengthen those that were in place already. About half of the partnerships have closed since the end of the project; the achieved productivity outcome was quite good but the economic impact was not as good. Overall, the review found the impact of the SPF was marginal, but could be improved through modification of the programme and perhaps by continuing with a partnership fund as part of a broader fund.
To improve the SPF’s impact, the review suggested that the sector specialists in the dti could have been used to vet SPF applications at the start of the application process so as to ensure that programmes were likely to create an impact. If the SPF continues in a new form, it can be modelled alongside the roll-out of CSPs to
8 Extracted from Phillip (2004).

33
ensure that funding is targeted towards identified industry constraints that can be monitored for impact for projects and should be expanded to include factors related to economic impact.
In SPF, domination of the programmes by intermediaries and service providers runs some risk of diluting the demand-driven nature of the assistance and may involve a degree of conflict of interest. While a strong facilitator is often important and adds value, future similar programmes should be designed to ensure that partnership members themselves have more direct knowledge of the programmes and do not become completely reliant on intermediaries. This requires better promotion and simplification of the procedures.
5.6.2 Competitiveness Fund (CF) and Sector Partnership Fund (SPF)9
Between 1999 and 2004, the dti implemented the International Competitiveness and Job Creation Project (ICJCP) consisting of three matching grant schemes, namely the Competitiveness Fund (CF), the Sector Partnership Fund (SPF) and the Black Business Development Fund. The purpose of the CF programme is, in effect, to provide an incentive to companies (by sharing the costs) to make upgrading investments that will benefit the companies themselves and society at large. The combined effect of the improved performance of beneficiary companies, spillover effects on other companies, and an increased market for business development services would benefit both the beneficiaries and also create positive spin-offs that impact on the economy. The CF programme is specifically characterised by the following:
i) Cost sharing by recipients, to ensure their buy-in,
ii) Payments reimbursable ex post, to ensure completion of programmes,
iii) Demand-driven assistance, to ensure relevance,
iv) Decentralised support by the private sector to strengthen local business service capacity,
v) Funding approvals based on objective eligibility criteria that avoid bureaucratic interference,
vi) Independent fund management to ensure efficient delivery.
An impact assessment study was completed on CF and SPF in May 2004 in conjunction with the World Bank. During its duration, the CF approved 1248 enterprises to the value of R230 million (R140 million disbursed) to co-fund their competitiveness promotion projects. 77% of beneficiaries were manufacturing, 23 % in services and 50% of beneficiaries could be defined as SMMEs. There appears to have been a net additional impact of the programme in that, although two-thirds of beneficiary enterprises stated that they would have funded their programmes themselves, they would have done this on a smaller scale and at a later stage. This also suggests that the 50% subsidy was excessively high and many companies reaped windfall profits. Horizontal (57%) and vertical (75%) spillover effects were noted and the programme exhibited a positive net cost-benefit.
The Review made the following recommendations: to continue funding competitiveness promotion activities, but to reduce duplicated activities with other national programmes; that consideration be given to focussing the scope of the CF towards targeted sub-sectors, possibly based on the dti’s CSP programmes; that the CF should be targeted more precisely at SMMEs, as some of the bigger firms appeared to have been able to implement the projects without CF funding. In doing so, there should be more careful selection of (smaller) companies to ensure additionality. If black economic empowerment is seen as a ‘public good’ or national priority then there is a justification for setting aside part of a future fund for black-owned business
An important finding of the CF and SPF Review in regard to programme management was that such programmes could be more effectively managed if they were offered a part of a more generic support programme with broader selection criteria, coupled with more effective monitoring and reporting systems.
9 Extracted from Phillip (2004).

A Review of Industry Policy, Instruments and Support Programmes: 1994-2008
34
The review also noted that the CF had been primarily marketed indirectly through BDS financial consultants and through generic dti marketing drives and suggested that, in future, the CF should define its target market more effectively, initiate selection criteria so that more detailed screening to identify projects that create a greater economic impact is enacted and then put a marketing campaign in place to specifically target that market.
5.6.3 Technology and Human Resourced for Industry Programme (THRIP)
The THRIP promotes partnership in pre-commercial research between business and the research base (universities and research councils). It was initiated in 1992 and, by 1996, was enhanced and incorporated into the dti’s supply-side measures.
In 2006, THRIP was reviewed and was found to have been successful in its objectives to:
Effect an increase in the number of people with appropriate science and technology skills,
Promote interaction between industry and higher education and SETIs, and
Stimulate industry and government to increase their investment in R&D, innovation and technology diffusion.
The review found that THRIP creates additionality in that a significant proportion of projects would not have been undertaken in South Africa without THRIP support. The cost sharing nature of the programme was proven to be useful. In testing the role of THRIP in promoting small enterprises (MSME), the review recommended against introducing MSME criteria for THRIP access as it confuses the targets. If MSMEs were to be targeted, the review suggested that a more specific THRIP-type programme be designed.
The overall recommendation was to increase the level of THRIP funding, drawing this from other national departments like Minerals and Energy and DEAT and to expand the scope of THRIP.
5.6.4 Support Programme for Industrial Innovation (SPII)
The SPII programme began in 1993 and was expanded in subsequent years and incorporated into the dti’s package of supply-side incentives. In the SPII review, Pouris (2006) came to the following conclusions:
The performance indicators of the SPII programme indicate that the supported firms declare high turnovers of the products/processes developed with emphasis on exports and that the relevant taxes paid by the beneficiary companies over-compensate government for the support it provides The SPII program creates additionality - a significant proportion of the projects supported would have not taken place in South Africa by the beneficiaries without SPII support.
The way SPII targeted SMEs was effective and should be retained. Large corporations should also be targeted by modifying the partnership scheme component of SPII, replacing it with a “technology platforms development scheme” to target large corporates.
The review recommended that the dti retain the following principles that SPII criteria use, namely high risk projects, collaboration and exports. Importantly, the review recommended a more conscious link between SPII and other support programmes of the dti and other institutions that can support the commercialisation of their innovation.
One deficiency of the SPII programme (compromising its reputation) appears to be its high overhead costs. In regard to programme management, the review recommended:

Improving the effectiveness of disbursing funds,
Streamlining the application and approval process,
Improve efficiency of funds auditing system,
A number of different programmes that target technology and innovation exist, including SPII and THRIP. These should all be housed under a single domain,
SPII management system improvement required.
5.6.5 Conclusions – competitiveness programmes
In summary, the various competitiveness programmes have all been successful in achieving their objectives. Collectively they constitute a small part of the dti’s budget and, in the next period, it will be important to continue the dti’s support of such programmes, while integrating their application with other dti support programmes.
5.7 Export Marketing and Investment Assistance Programme (EMIA)
The EMIA programme has been in existence for many years. Its current focus is on export promotion through research and the showcasing of products and services at international trade fairs. Its overall budget has declined over time and budget drawdowns, as might be expected, have also been shown to be sensitive to exchange rate fluctuations in the past.
The current EMIA client base consists of exporters operating at different levels and stages of internationalisation. The scheme has reported 8,323 projects assisted with an estimated grant total of R400 million. New targets were identified in the late 1990s to enhance the performance of the scheme, particularly through emerging SME exporters and HDI companies in particular.
Figure 13: EMIA Allocation per sector (2002-2006, Rm)
35

A Review of Industry Policy, Instruments and Support Programmes: 1994-2008
36
Figure 14: Exports achieved through EMIA support per sector (2002-2006, Rm)
EMIA utilisation indicates that the programme is capable of broad coverage across economic sectors, with the largest cumulative allocation of funds going to the Agriprocessing and Mining & Metals/Capital Goods sectors. Although the above statistics are not directly comparable with those of other programmes, the EMIA system is capable of generating such statistics using 3-digit SIC codes.
The programme has not been reviewed recently, but proposals for programme modification have been made through the dti’s National Export Strategy. The proposals cover ten strategic themes which, from an incentive perspective, include the following:
A sector-specific assistance scheme in support of export councils and to provide specific export project support,
Initiatives to expand the narrow exporter pool, and to to introduce an emerging exporters programme,
A shift in EMIA support from the firm to the value chain. If a company undertakes an export project, EMIA should be available to support the firm along this export value chain on a one-to-three-year basis.
The key thrust of the National Export Strategy is to increase the level of exports and the number of exporters, with specific focus on BEE-owned SMEs.
5.8 Broad-based black economic empowerment
In its strategy document on broad based economic empowerment, the dti (2006i) outlined a number of proposals that impact on incentives. The Broad-Based Black Economic Empowerment strategy aims to promote economic transformation through meaningful participation of black people in the economy10. The policy aims to promote investment that will lead to broad-based participation by black people; a substantial change in composition of ownership and management structures, and skilled occupations in enterprises by black people, local communities, workers, cooperatives and black women; as well as a Code of Good Practice
10 Broad-Based Black Economic Empowerment Act (53 of 2003); The Strategy for B-BBEE, 2003; The Codes of Good Practice on B-BBEE, 2004 Draft.

issued to provide interpretation, indicators and weightings for measuring BEE participation for various sectors.
In terms of this policy, every state organ or public entity must take into account and apply the relevant code of good practice in, amongst others:
Determining qualification criteria for the issuing of licences, concessions or other authorisations (this may include incentives);
Developing criteria for entering into partnerships with the private sector.
The B-BBEE strategy outlined in dti (2006i) proposes to enhance such support with changes to existing programmes, as well as with a range of new programmes.
5.8.1 Assessment of Incentive Programme impact on MSME targets – World Bank (2006)
Promoting micro, small and medium enterprises (MSME) has been an important policy objective of industry policy. The performance of incentive programmes, in particular the Small and Medium Enterprise Development Programme (SMEDP), has been assessed in a recent study by the World Bank (2006).
Drawing on the Investment Climate Survey (2004) and the Micro Enterprise Investment Climate Survey (2005), the World Bank finds a significant improvement in the role played by MSMEs in the economy since 1994 suggesting that, overall, the dti’s incentive programmes and institutional support for MSMEs are working. Going further, it appears that the dti’s incentive programmes are better able to address the needs of the formal sector. The Investment Climate Survey cited worker skills, macroeconomic instability, labour regulation, crime and tax rates as the major impediment to business growth, suggesting that the dti’s support programmes are not seen as impediments.
On the other hand, the Micro Enterprise Investment Climate Survey (2005) highlights access to finance, cost of financing, transportation, access to land and access to transport/power/telecoms as being major constraints to informal and micro enterprises. It finds that such firms are poorly integrated with formal supply chains and that most sell directly to individual customers. Furthermore, there is low awareness of dti incentive programmes, a situation which worsens outside metropolitan areas.
The World Bank (2006) review made a number of recommendations for the modification of programmes to support MSMEs, including that:
Separate support and incentive systems are required for formal small enterprises and informal micro enterprises,
Attention should be focused on building supply chain relationships between informal micro enterprises and formal firms,
Funding for skills-building activities in small firms should be increased,
Some consideration should be given to rationalising the number of programmes aimed at MSMEs. While there is a cost-benefit trade-off between having fewer programmes and more specialised programmes, duplication is a problem for both service providers and recipients. In conjunction with this, consideration should be given to spinning off programme management, particularly for microenterprises, to a government agency in order to improve programme management.
It is not clear whether such approaches are already beginning to be practiced by the dti in the consolidation and restructuring of MSME support institutions and the role that Khula is now playing together with the Black Business Supplier Development programme.
37

A Review of Industry Policy, Instruments and Support Programmes: 1994-2008
38
5.9 Assessment of impact of SMEDP incentive on mean effective tax rates of recipient firms – FIAS (2005) review
FIAS is the Foreign Investment Advisory Service that jointly serves the World Bank and the International Finance Corporation. FIAS (2005) is part of a multi-country study, in collaboration with the UK DFID, to determine whether the tax policy and tax administration regimes are conducive to economic growth. FIAS considers whether existing tax policies are appropriate for small enterprises and, having established that the fiscal regime is unduly onerous on small and micro enterprises, FIAS tries to identify how best to bring informal firms into the tax net. FIAS (2005) analyses the effective tax burden of five key sectors in the South African economy and tries to establish a relationship between the sector’s competitiveness and the fiscal regime. The following table summarises their recommendations.

Table 13: Summary of key FIAS (2005) issues and recommendations
Issues Recommendations General Economy: The tax system is broadly appropriate and conducive to growth of the five sectors. Tax issues are second order.
Avoid significant changes to the tax code, which would create uncertainty in the private sector.
Small businesses (METR 0% - 29%): Formal, registered small businesses benefit from tax concessions. Very small, often informal, businesses face a high METR.
Set up a Small Taxpayer Unit with a remit to bring small businesses, many of whom are currently informal, into the tax net.
Expand education and outreach to facilitate formalisation and full compliance.
Agriculture Sector (METR 5.7%): Currently pays very little tax. Faces uncertainty over municipal taxation.
Regulate the Municipal Rates Property Act to generate certainty.
Reduce the number of ad hoc exemptions. Manufacturing Sector (METR 21.3%): Few sector-wide incentives. But several industry-specific incentives, and the SMEDP, generate large firm-wide subsidies. METR on inventory capital is high.
Reform the SMEP and industry-specific incentives so that they only subsidise the marginal investment.
Move from FIFO to LIFO accounting to reduce the METR on inventories.
Tourism (METR 13.9%): Few sector-wide incentives. Number and complexity of taxes creates problems, especially for small firms. SMEDP administration is weak and creates a very large distortion of the METR. The interpretation of VAT varies widely, especially on transportation.
Further reduce the number of tax/levy instruments (e.g. Skills Development Levy, UIF).
Short term, consider out-sourcing the management of the SMEDP. Longer term, replace with a less generous taxed based benefit.
Hold a series of workshops with the tourism industry to tackle the application of VAT.
Financial Sector (29.8%): Sophistication of the sector poses challenges for firms and SARS. VAT exemption generates a high METR. Issues over the taxation of insurance funds, retirement accounts and private equity funds. Uncertain tax treatment of deferred income or capital gains from derivatives.
Consider tax exemption of retirement and insurance company investment fund income.
Codify and publish the treatment of investment proceeds as capital gains or as ordinary income, as interest or as dividends.
Codify and publish the tax treatment of private equity (an important source of finance).
Codify and publish definitions of derivatives and their tax treatment.
Mining Sector (METR 0.4%): Sector receives generous tax treatment. Specific formula for corporate income tax in the gold sector. Proposed 15% diamond export levy is intended to promote the local diamond cutting/polishing industry. Pending implementation of royalties creates several issues.
Remove the gold formula. Remove the Diamond Export Levy. Resolve existing royalty agreements and alleviate
initial royalty burden by exempting initial mine revenues (over +/- 3 years).
Source: FIAS (2005)
For purposes of this study, the FIAS (2005) report provides an important insight on the tax regime that prevails on MSME firms and, in particular, the impact of incentives on the mean effective tax rates (METR) paid by recipient firms.
39

A Review of Industry Policy, Instruments and Support Programmes: 1994-2008
40
Table 14: Impact of incentives on recipient mean effective tax rate (METR)
Targets
SMEs. Relatively high tax burden. Many MSMEs are outside tax net –
however, SIP and SMEDP result in negative METR for some firms. Manufacturing overall weighted average METR 21%. Accelerated depreciation schedule (4y) & 5% per annum depreciation allowance for
industrial buildings are not drivers for any investment decision. Without both, the METR increases by 3%.
Tourism Overall weighted average METR on capital 14%. Impact of the SMEDP on METR on equipment is -276%, which implies an extreme
subsidy at the margin. Further extending the SMEDP to tourism requires modification. Consider replacing the SMEDP with an incentive system that reduces the effective tax rate
on the marginal project only. Type
In the review of the Strategic Investment Programme, and the drafting of any subsequent replacement tax-based programme, carefully assess the METR to ensure that the incentive does not create a subsidy across the firm as a whole. Investment incentives, if any, should aim for a significant reduction in the METR of the marginal investment only.
For the Tourism sector, consider replacing the grant based SMEDP with accelerated depreciation rates of buildings/equipment or introducing an initial investment allowance associated with the development of small and large hotels.
Value
SMEDP- and SIP-negative METRs on machinery and equipment (ranging from -118% to -301%) reflects an extreme subsidy at the margin. This means that investments that would not have been undertaken even in the absence of taxes altogether, will be undertaken in the presence of the SMEDP,
however FIAS acknowledges that the SIP did attract additional capital investment that may well
have gone elsewhere, or have been delayed. The key questions (given the size of the subsidy) however are (a) at what cost, and (b) whether SIP investments were in the key sectors targeted at a national or provincial level.
An important principle for incentive guidelines is that the respective incentive should not create a subsidy across the firm as a whole and that investment incentives should aim for a significant reduction in the METR of the marginal investment only.
With regard to the Tourism sector, which is identified as a priority dti CSP, FIAS (2005) makes the following important points:
The rates of tax levied on Tourism, and small and medium enterprises in general, is not a major impediment to the firms concerned,
The main impediment is the complexity of the tax system and the cost of time and effort needed to comply,
FIAS makes proposals to National Treasury and SARS on ways to address this complexity,
For Tourism, consider replacing the grant based SMEDP with accelerated depreciation rates of buildings/equipment or introducing an initial investment allowance associated with the development of small and large hotels,

Investigate options for formalising the voluntary tourism levy and using any additional funds generated to boost the international marketing effort of South Africa as a tourist destination.
5.10 Spatial development programmes
Following the review of the RIDP and its replacement with the MDP and the SMMDP, three spatially-oriented incentive programmes were initiated by the dti.
In 1995, the Spatial Development Initiatives (SDI) was launched. The dti provided financial and logistical support for the investigation and scoping of economic development potential, as well as identification of critical projects within a range of SDIs within South Africa and, later, within SADC.
Through this in 2001, the Industrial Development Zone (IDZ) and Critical Infrastructure programmes emerged. The dti (2006h) Regional Industrial Development Strategy appears to provide an umbrella framework for the existing SDI, IDZ and CIP programmes and will be further discussed below.
5.10.1 Spatial Development Initiatives (SDI)
SDIs, largely centred around a set of infrastructure corridors, are no longer a core part of dti programmes, but the methodology has been replicated within South Africa and SADC.
Table 15: SDI initiatives
Initiative Sector
Maputo Development Corridor Industrial and Agri-Processing Lubombo SDI Agri-Tourism KwaZulu-Natal SDI Industrial Fish River SDI Industrial Wild Coast SDI Agri-Tourism West Coast Investment Initiative Industrials and Agri-Processing Gauteng Special Economic Zone Phalaborwa SDI Industrial and Agri-Tourism Gariep SDI Mining and Agri-Tourism Platinum SDI Industrial and Agri-Tourism Coast-to-Coast Corridor Transport and Tourism
In some cases, the dti went beyond a scoping level and assisted in the initiation of investment projects by providing a forum within which a range of project impediments, both public and private sector-related, could be addressed.
The intended limited purpose of SDI initiatives was often misunderstood and many provincial and local parties expected much more from the SDIs than they were intended to deliver. The SDI budget was always quite small, being made up of the costs of maintaining a small project unit to drive each SDI.
5.10.2 Industrial Development Zones (IDZ)
Legislation for Industrial Development Zones (IDZs) was passed in 2001 to provide for purpose-built industrial estates linked to international airports or ports which contain controlled Customs Secured Areas (CSAs). To date, the following IDZs have been established of which Coega, East London and Richards Bay have been issued with an IDZ operator permit:
41

A Review of Industry Policy, Instruments and Support Programmes: 1994-2008
42
Coega IDZ
Designated in 2001;
Current ownership: Eastern Cape Development Corporation (ECDC - 100%). ECDC is a listed provincial public entity in the Treasury Regulations;
Provisional IDZ Operator Permit issued in 2002;
Registered as Coega Development Corporation (Pty) Ltd;
Not listed as a public entity in its own right by virtue of the holding company being listed.
East London
Designated in 2001;
Current ownership: ECDC 74% and Buffalo City Municipality 26%;
Provisional IDZ Operator Permit issued in 2002;
Registered as East London IDZ Company (Pty) Ltd, and currently a Section 3(d) public entity under the Treasury Regulations.
Richards Bay
Designated in 2002;
Current ownership: Ithala Finance Dev Corporation and uMhathuze Municipality (N.B. Shareholders’ Agreement not yet concluded.);
Provisional IDZ Operator Permit issued in 2006;
Registered as Richards Bay Dev Company (Pty) Ltd.
Johannesburg International Airport
Designated in 2002;
Current ownership: Blue IQ and Airports Company of SA (N.B. Shareholders’ Agreement not yet concluded);
Provisional IDZ Operator Permit not issued.
Approximately R472m of the total R791m approved by August 2006 under the CIF has been allocated to the Coega and East London IDZs since 2002.
The IDZ unit made proposals in September 2006 to the National Treasury to consider the following proposals made by IDZ operators in mid-2005:
A Tax Holiday scheme that applies to all firms setting up within the IDZ,
Relief from customs duty for imported plant, machinery and equipment (although this partly exists for goods destined for export under the 470.03 schedule),
Training tax allowances,
Making IDZ operating companies tax exempt,

A range of more technical proposals relating to the treatment of VAT and tax deductibility of various operations within the IDZ,
Although this study has located the IDZ programme within the “spatial development” group of programmes, IDZ programme managers have pointed out that the IDZs should be viewed as part of the suite of measures aimed at increasing exports and beneficiation, rather than primarily having regional development objectives.
IDZ managers further argue that the current way of funding IDZs, through the CIP, is not appropriate and that from 2006/7 the IDZ programme will get its own budget – R422m for Coega, East London and Richards Bay (for 30% of requirements and with 70% coming from provinces)
In terms of the Customs Control Act, imports into a customs control area, (such as an IDZ) of capital goods, as well as inputs to be used in products subsequently exported, are exempted from duty. This issue potentially runs against the ASGISA objective of utilising SOE infrastructure expenditure to leverage and stimulate the domestic capital goods production sector, since a significant part of Eskom, Portnet and Spoornet’s capital expenditure programme will be made in areas that are defined as IDZs.
5.10.3 Critical Infrastructure Fund (CIF)
The Critical Infrastructure Fund (CIF) was initiated to supplement the cost of project specific infrastructure. A preliminary analysis of the impact of CIF projects on specific sectors indicates that CIF funding largely supported investments in the following sectors:
Motor Vehicle and Components
Basic Non-ferrous Metals
Food
Tourism
Figure 15: CIP payments – key sector investments supported 2003-2006
CIP Payments - Key investment sectors
supported 2003-2006
0 50 100
150
200
250
300
350
M iningFood
BeveragesTobacco
TextilesWearing Apparel
Leather and Leather ProductsFootwear
Wood and Wood ProductsPaper and Paper Products
Printing, publishing and recorded mediaCoke and refined petro leum products
Basic ChemicalsOther chemicals and man-made fibers
Rubber productsPlastic Products
Glass and Glass ProductsNon-metallic M inerals
Basic Iron and SteelBasic Non-ferrous M etals
M etal products excluding machineryM achinery and equipment
Electrical machinery and apparatusTelevision, radio and communication equipment
Professional and scientific equipmentM otor vehicles, parts and accessories
Other Transport EquipmentFurniture
Other M anufacturing IndustriesCatering & accommodation services (Tourism)
Transport & storageElectricity
Other
Rm
The 3-digit SIC 63 code covering Catering & Accommodiation does not capture the tourism sector accurately and is used as a proxy. The Tourism CSP, together with StatsSA, are developing a more accurate Tourism Satellite Account indicator covering the much wider tourism economy.
43

A Review of Industry Policy, Instruments and Support Programmes: 1994-2008
44
The bulk of the CIF incentive has been used to support the Coega and East London IDZ projects. The investments cited in the project proposals include motor industry investments, the Alcan aluminium smelter and bio-fuel projects (which have been categorised in the food sector, since they involves the processing of agricultural products).
It is not clear whether there is alignment between the target sectors supported by the CIP and the target sectors of the respective CSP strategies. In particular, approximately R52m of the CIF total R791m approved by August 2006 has been used to support high-income property development projects in the Balito area of KZN which is not a key target of the Tourism CSP.
Another potential area of alignment relates to the fact that CIP benefits are being used as off-budget financing for local government and the CIP may not be aligned with other national programmes that address local government financing capacity.
5.10.4 2006 Regional Industrial Development Strategy (RIDS) and associated Spatial Industrial Development Strategy
The dti (2006h) RIDS regards itself as “… a strategy document but aims to provide guidelines for the implementation of policy and the targeting of regions.” The RIDS provides an overview assessment of the various regionally–focussed dti programmes over past decades. In addition to the above, various efforts at Local Economic Development (LED) as well as the Integrated Sustainable Rural Development Programme (ISRDP) Nodes, and the Urban Renewal Programme (URP) Nodes are also assessed. The conclusion is that none of these programmes have been comprehensive enough nor have they been implemented on a sufficient scale to be effective.
The dti (2006h) outlines an interesting empirically-based methodology, using a multi-scale Geospatial Analysis Platform (GAP) model developed by the CSIR for the dti, for estimating the impact of differentiated regional rates of growth on employment to the year 2014.
It then goes on to propose the creation of Special Economic Zones which would include as SEZs:
IDZs,
SDIs,
Small towns,
Industrial parks,
Industrial estates,
Logistics parks,
Innovation hubs.
RIDS calls for a Systemic Competitiveness Support Facility which would be used for facilitation, quick-win activities, feasibility studies, and similar purposes to:
Promote the development of human resources and institutions that then have the capacity to promote and assist in the development of active, market-based clusters,
Build institutional and human resource capacity at the government level initiating the conversion of a passive cluster into an active one,
Fund the neutral facilitators required to manage the process,

Support firms wishing to upgrading their activities.
The dti (2006h) also proposes thematic fund type incentives which consist of:
Industrial clustering capacity building fund,
Industrial development zones (IDZ) strategic support facility (both tax relief and infrastructure support),
Business retention and expansion support facility,
Innovative start-ups support facility.
A further proposal is for a Regional Industrial Development Fund which will target support to those regions and areas of the country where well below-average scores of economic development and employment exist. Modelled on the EU Regional Development Fund, resources are intended to co-finance:
Productive investment leading to the creation or maintenance of jobs,
Infrastructure,
Local development initiatives and the business activities of small and medium-sized enterprises,
5.10.6 Conclusion – RIDS Proposals
The RIDS spatial approach to industrial/economic development is an interesting and useful one and the discussions that will follow the release of the RIDS will further develop the proposals summarised above.
The attempt in dti (2006h) by the RIDS proponents to empirically define these programmes is to be commended and will be quite essential to justify the scale of resources that are envisaged. In addition, an empirical model could usefully incorporate a sectoral categorisation. If so, it would then allow for a comparison with the sector model that other components of the dti use, leading to a single integrated model which the the dti can use to forecast incentives for sectors as well as required incentives for narrowing regional disparities.
RIDS proponents will also need to justify the need for stand-alone programmes that they propose because there are a number of existing incentive programmes that could be utilised for such purposes.
The IDZ unit’s proposal to National Treasury contains a number of proposals that might have contradictory implications for CSP proposals and for the dti’s commitment to some ASGISA goals. In particular, this relates to the proposal that all imports of plant and equipment into the IDZ be allowed free of customs duty which seems to run directly against stated ASGISA objectives of encouraging greater domestic supply of capital goods to the SOE-driven capital expenditure programme on ports, airports, transport infrastructure and energy infrastructure. As far as the proposal for a spatially-defined tax holiday, this proposal needs to be reconciled with proposals that other parts of the dti are also making to National Treasury for the re-implementation of strategically sectorally-targeted tax-based incentives.
It is also not clear what the relationship is between the proposed RIDS funds and the funds that are already in existence and aimed at similar targets currently administered by institutions such as the DBSA, IDC, Khula, DPLG and others.
There is no clear linkage between the activities that RIDS would seek to promote and existing programmes that are being implemented by other programmes of the dti, for example, the CSP programmes.
Since the RIDS is intended as a discussion document, the above issues will no doubt be amongst those that are debated as the policy develops.
45

A Review of Industry Policy, Instruments and Support Programmes: 1994-2008
46
Until these processes have been implemented, consideration should be given to continuing the existing CIP fund, although the access criteria need to be more tightly defined and integrated with CSP and other dti processes, because CIP does provide a degree of support in achieving the dti’s evolving spatial industrial development objectives.

6. Estimated value, sectoral spread and impact on GFCF 2000-2005 of dti incentives
Investment incentive programmes absorb the bulk of fiscal resources that are allocated towards implementing trade and industry policies. This section analyses the individual and collective impact of the Strategic Investment Programme (SIP) (tax-based), Small and Medium Enterprise Development Programme (SMEDP) (grant-based), Motor Industry Development Programme (MIDP) (auto industry focussed), Duty Credit Certificate Scheme (DCCS) (clothing and textile focussed) and the National Industrial Participation programme (NIP) (procurement policy-related) as a percentage of total Gross Fixed Capital Formation of each three-digit SIC sub-sector of manufacturing and of those service sectors that form part of the dti’s targets.
6.1 Tax-based incentives
During its operation between 2002-2007, the SIP programme approved projects worth R10 billion, at a fiscal cost of R3 billion, being the tax foregone on the projects at a 30% tax rate.
A large quantum of tax-based incentives are utilised by capital-intensive upstream sector targets in the metal smelting, chemicals and pulp and paper sectors, with the exception of the impact on the downstream Wood and Wood Products sector. Here SIP has incentivised a very large R700m chipboard project which will result in increasing total national output by a significant percentage, while simultaneously entrenching dominance of Steinhoff/ PG Bison in the Wood and Wood Products value chain. The high impact also reflects the fact that the sector concerned has not had a big investment project for some years, so the impact on 2001-04 GFCF figures is large.
Table 16: SIP tax incentive impact as %GFCF
Impact of tax-based programmes on GFCF 2001-2004
Sector
>15% Wood and Wood Products >10% Basic Non-Ferrous Metal >5% Printing, Publishing and Recorded Material >3% Food
Textiles Basic Chemicals Iron and Steel Other Transport Equipment
Source: the dti
47

A Review of Industry Policy, Instruments and Support Programmes: 1994-2008
48
Figure 16: SIP tax incentive impact as %GFCF11
DTI SIP Tax Incentive value Value of allowance @ 30 tax rate
0 200 400 600 800 1,000
FoodBeverages
TobaccoTextiles
Wearing ApparelLeather and Leather Products
Footw earWood and Wood ProductsPaper and Paper Products
Printing, publishing and recorded mediaCoke and refined petroleum products
Basic ChemicalsOther chemicals and man-made f ibers
Rubber productsPlastic Products
Glass and Glass ProductsNon-metallic MineralsBasic Iron and Steel
Basic Non-ferrous MetalsMetal products excluding machinery
Machinery and equipmentElectrical machinery and apparatus
Television, radio and communication equipmentProfessional and scientif ic equipment
Motor vehicles, parts and accessoriesOther Transport Equipment
FurnitureOther Manufacturing Industries
Catering & accommodation services (Tourism)Transport & storage
Other
Millions
Source: the dti
The SIP review dti (2004b) has shown that tax-based incentives are more useful if targets are capital-intensive projects, usually but not always in upstream manufacturing sectors.
Furthermore, the review indicates that, for approximately one third of projects by value, the approved SIP benefits were not decisive. In other words, the project would have taken place anyway. This suggests that the SIP programme was useful for two thirds of projects approved. It also suggests, as highlighted in the review, that the access criteria for SIP could be amended and tightened to ensure that the incentive is awarded to only those projects which require the incentive in order to achieve the normal project hurdle rate that the investor seeks to achieve.
11 Certain assumptions have been made in applying dti incentive data: For SIP, assume tax credit is claimed over a four-year period and on a straight line basis between 2001-2004. While not strictly accurate, since some projects – eg woodchip, Alcan aluminium smelter will only be built between 2006 and 2010 – it still gives a reasonable relative perspective.

The review also suggested that SIP selection criteria might not be aligned to the dti’s priorities at individual industrial sector levels. Should a tax-based incentive be reintroduced in the future, it may be prudent to ensure that sector priorities are incorporated in the allocation criteria.
6.2 Grant-based incentives
The Small and Medium Enterprise Development Programme (SMEDP) was formally reviewed in 2004 and was partly reviewed again in 2006 as part of the World Bank (2006) study. The latter’s assessment had a focus on firm size rather than a sectoral focus, but it did this through analysing the value chains of textile-clothing, construction and auto components.
Both the SMEDP (2004) and the World Bank (2006) concluded that the programme met its objectives, and the following recommendations emerged for the further enhancement of the SMEDP:
Qualifying criteria to be tightened:
• Give only small enterprises (<R5m t/o) access to SMEDP,
• Allocate benefits on additional net economic impact of investment,
Increase the awareness of the market to SMEDP,
Target business sustainability as an objective, particularly through the first three years,
Improve the monitoring of the business - to be based on analysis of annual audited financial statements during and after the grant period,
SMEDP access to be accompanied by access to/awareness of other dti incentive offerings,
Simplify the application process so that intermediaries/consultants are unnecessary,
Retain the SMEDP database as part of a common database for all dti support programmes,
Reduce budget exposure by <R5m t/o criteria (Average investment = R5m. >60% is <R6m).
49

A Review of Industry Policy, Instruments and Support Programmes: 1994-2008
50
Figure 17: SMEDP grant incentive impact as %GFCF12
DTI SMEDPGrant-Based Incentive as %GFCF
Average of 2001-2004
0 2 4 6 8 10
FoodBeverages
TobaccoTextiles
Wearing ApparelLeather and Leather Products
Footw earWood and Wood ProductsPaper and Paper Products
Printing, publishing and recorded mediaCoke and refined petroleum products
Basic ChemicalsOther chemicals and man-made f ibers
Rubber productsPlastic Products
Glass and Glass ProductsNon-metallic MineralsBasic Iron and Steel
Basic Non-ferrous MetalsMetal products excluding machinery
Machinery and equipmentElectrical machinery and apparatus
Television, radio and communication equipmentProfessional and scientif ic equipment
Motor vehicles, parts and accessoriesOther Transport Equipment
FurnitureOther Manufacturing Industries
Catering & accommodation services (Tourism)Transport & storage
Other
% GFCF
Source: the dti
The 3-digit SIC 63 code covering Catering & Accommodation does not capture the tourism sector accurately and is used as a proxy. The Tourism CSP, together with Stats SA, is developing a more accurate Tourism Satellite Account indicator covering the much wider tourism economy.
Grant-based incentives clearly cover a much broader spread of economic sectors, particularly those in the downstream and more labour-intensive sectors. The SMEDP review criticises this as signalling a failure to focus. Such a criticism is not warranted in terms of sectoral focus because the SMEDP criteria can be adjusted according to sectors that might be targeted after 2006.
Table 17: SMEDP grant incentive impact on % GFCF
Impact of grant-based programmes on GFCF 2001-2004 Sector
>6% Furniture Tourism Other
>5% Wood and Wood Products Plastic Products
>2% Textiles Wearing Apparel Footwear Printing, Publishing and Recorded Media
12 Certain assumptions have been made in applying dti incentive data, including the assumption that capex is incurred in the year that the grant is disbursed and tax credit is given in the same year.

51
Metal Products, excluding Machinery
The decision to broaden the targets of the SMEDP has resulted in a significant growth in absorbtion by the tourism sector, particularly bed and breakfast establishments. The FIAS (2005) study below also criticise this as having been over generous in supporting investments that have very little net economic benefit.
The impact of the SMEDP is clearly high in that the grant value constituted more than 5% of the total fixed investment in a number of sectors, as the above table shows.
6.3 Motor industry development programme (MIDP)
The MIDP is currently being reviewed by the dti and is one of two long-standing dti sector-specific programmes. The programme is based on the issuing of Import Rebate Credit Certificates (IRCC) to exporters of fully built up vehicles or components.
The original programme objective was to facilitate trade in motor vehicles and components and to allow the OEM-driven global industry to allocate the IRCCs in whichever part of the vehicle value chain they chose.
It has been very successful in growing both exports and imports and indirectly inducing investment within the assembly and components sectors as well as outside the direct value chain – for example, in the impact that the MIDP has had in restructuring the national tanning industry.
In accordance with the methodology utilised in this study, it is necessary to determine the quantum of financial resources being allocated to the motor industry sub-sectors via the MIDP incentive programme. This has not been easy to do, given the fact that :
a) Such resources are allocated via import duty rebate credit certificates (IRCC), and
b) The IRCC data is not easily available.
There have been many analyses of the MIDP but the most vibrant and challenging discourse has been that between Barnes et al. (2003) and (2004) and Flatters (2002) and (2003). On the one hand, Barnes et al. (2003) point to the success of the programme in achieving a range of policy objectives aimed at growth of skilled employment, exports, technological development and competitive production processes. On the other, Flatters (2002) and (2003) estimates the net cost of the programme to be negative and as outweighing any benefits costs ultimately borne by consumers paying higher prices for vehicles than would be the case if imports were permitted to flow freely.
Flatters estimates the value of the IRCCs to be of the order of R17 billion in 2005 only.13 In comparison, in 2005, the total GFCF in the Motor Vehicle Parts and Accessories sector amounted to around R6b. Although not meant as a direct investment subsidy, the R17b IRCC benefit is then the equivalent of >250% of GFCF in 2005. If the lower IRCC value of R6b is used, this is equivalent to 100% of GFCF in that year, which is still very significant.
In addition to the value of the IRCC, SIP, SMMDP and SMEDP, grants have also been used in the Auto Assembly and Component sectors, but this has been quite small in comparison to the amount of approximately 2% of GFCF between 2001 and 2005.
13 See Flatters (2005).

A Review of Industry Policy, Instruments and Support Programmes: 1994-2008
52
The same issue arises in respect of trade. If one argues that the MIDP’s objectives are trade facilitation then, in 2005, exports from the Motor Vehicles, Parts and Accessories sector were recorded at R36.5 billion, meaning that the IRCCs of R17b in 2005 contributed close to 50% of the sector’s total export value, which is also very significant.
Such numbers then lend credence to critics of the MIDP who argue that most of the benefits of IRCCs are absorbed as super-profit (rent) by the OEM firms and act to raise prices in the domestic market. However, such arguments do not take account of the employment and technology transfer benefits that the MIDP has resulted in.
For purposes of this study, the following points need to be noted:
The incentives provided through the MIDP are not as rigorously monitored and managed compared to other incentive programmes, such as the SMEDP, SPII, SPF and EMIA. The latter have very specific cost-benefit tracking systems, while the MIDP does not,
The dti has the opportunity at the inception of the MIDP and during the mid-term reviews to set the framework for targeting and it is then the OEMs that effectively make the specific sector investment target choices. In the case of the MIDP, the only levers that allow for industrial policy targets are in the tariff phase-down rates, the specific credits given to the catalytic convertor sector (which was recognised at the outset of the programme to be a relatively low priority value added product which was easy to generate credits from) and in the criteria relating to imported inputs,
The MIDP is currently being reviewed and it is not clear what target framework will be chosen by the dti for the next phase of the programme,
If the quantum of IRCC benefits at +-R17b is correct, then to continue the MIDP at the level of current IRCCs will confer an excessive benefit to the Motor Assembly and Component sectors, especially when compared to the levels of incentives that are allocated to other sectors,
On this basis, justification appears to exist to either reduce the levels of IRCC benefits, or to impose conditionality/additionality conditions, particularly on investment targets.
6.4 Duty credit certificate scheme (DCCS)
The DCCS was targeted at reducing the anti-export bias that prevailed in the economy and in the Fibre-Textile-Apparel value chain in the 1990s.
It emerged as an extension of the generic 470.03 rebate system which lowered input costs by granting duty rebates for inputs into products that would be exported.
Employment retention in South African-owned clothing factories in peri-urban areas was an additional target for this programme. Such firms argued in the mid-1990s that they required special support in order to upgrade equipment and machinery and to undertake training and skilling of staff to improve competitiveness. This was in contrast to their Asian-owned couterparts that had set up operations in the 1970s and 1980s in bantustan areas, and who tended to use the administratively simpler 470.03 rebates instead of the DCCS.
Analysing the DCCS in terms of its impact on the total sector’s fixed investment reveals a range of between 2% and 12% of GFCF. In addition to this, the SMEDP has already supported/subsidised textile investment by 6% of GFCF.

Figure 18: DCCS incentive benefit as % Textile GFCF
DCCS Value (Issued & Used) as % GFCF - Textiles
0.002.004.006.008.00
10.0012.0014.00
1995 1996 1997 1998 1999 2000 2001 2002 2003 2004 2005
% G
FCF
DCCS Used DCCS Issued
Viewing the DCCS in terms of its original role as a trade facilitation programme for both textiles and apparel reveals that the DCCS does not significantly contribute to export promotion.
Figure 19: DCCS incentive benefit as % Textile exports
Source : Export data 1995-2000 from Quantec. 2000-2005 & the dti for DCCS
In the case of apparel, the DCCS values are of the order of 100%-450% of sectoral GFCF and contribute between 10%-25% of total export value. For the past three years, the value of DCCs issued to the apparel sector has constituted a significant proportion of the total value of exports.
The biggest unintended beneficiaries of the programme appear to be the retail sector which purchases DCCs at discounts of reportedly up to 40% and then utilises the benefit to reduce the cost of imported goods.
53

A Review of Industry Policy, Instruments and Support Programmes: 1994-2008
54
Clearly the DCCS is more important to apparel manufacturers but, having run for almost a decade, the industry does not seem to have emerged for dependence on the incentive instrument.
Figure 20: DCCS incentive benefit as % Apparel GFCF
Figure 21: DCCS incentive benefit as % Apparel Exports and in value
Source : Export data 1995-2002 Quantec. 2003-2005 & the dti for DCCS value
The following issues may be useful to consider in the guidelines for future incentives:
Incentives should not have more than one major target objective. In the case of DCCS, there is a confusing amalgam of export, investment and employment targets that make it difficult to assess the

value of the programme, let alone the unintended consequence of it ending up subsidising Retail sector profitability,
If the DCCS is being reviewed, consideration should be given to removing the investment objective because existing investment incentive programmes such as SMEDP appear to cover the requirement adequately,
The programme does not seem to have achieved its trade facilitation role. If this is the case, then it may be better to view the DCCS programme as a peri-urban employment retention instrument and then to recraft it as such and perhaps relocate the programme to the Department of Labour, if this is viewed as appropriate.
6.5 Industrial Participation Programme (NIP)
Between 2001 and 2005, NIP investments of approximately R2.5 billion have been made across a range of manufacturing and service sectors.
Figure 22: NIP investment value by sector – 2001-2005
Source : the dti
55

A Review of Industry Policy, Instruments and Support Programmes: 1994-2008
56
The three-digit SIC 63 code covering Catering & Accommodation does not capture the toursim sector accurately and is used as a proxy. The Tourism CSP, together with Stats SA, is developing a more accurate Tourism Satellite Account indicator covering the much wider tourism economy.
The quantum of resources that are approved through NIP amounts to approximately R500m per annum on average, which is almost as large as the SMEDP.
As with the SMEDP, the impact of NIP projects on the respective sector’s total GFCF is quite significant for the following sectors.
Table 18: NIP investment impact on % GFCF
Impact of NIP approved investments on GFCF 2001-2005
Sector
>30% Professional And Scientific Equipment >15% Television, Radio and Communication >10% Machinery and Equipment >5% Wood and Wood Products
Source : the dti
From this preliminary analysis, there is clearly a need to align the NIP programme with CSP strategies and with other grant- and tax-based incentive programmes.
In 2007, Cabinet endorsed a proposal by the Department of Public Enterprises to create an alternative programme to the NIP. The alternative, the Competitive Supplier Development Programme (CSDP), has been adopted by Eskom and Transnet and, consequently, their associated capital expenditure will no longer be subject to the NIP. In terms of the CSDP, these parastatals were to table supplier development plans by March 2008 while a parallel processs would seek to skill the respective procurement departments to support the development of the domestic supplier base.
6.6 Role of Development Finance Institutions and Enterprise Development Agencies
The DFIs within the South African economy provide access to finance or risk sharing not available from the private sector. The basis is that market forces on their own will not necessarily ensure that the economy develops in ways that satisfy national objectives and, therefore, the state, through DFIs, takes its role in pursuing growth that balances both the economic and social dimensions.

57
Table 19: DFI Priorities and Targets
Priorities Targets Industrial Development Corporation Both wholesale and retail: Equity, Debt and Guarantees; Min R1m, Max R500m; Warehousing and bridging finance.
New investment projects, export orientation, Industrial development, BEE, SME;
All stages of business lifecycle: Pre-start up, start-up, expansion, acquisition;
All sectors except property businesses. Khula Wholesale financing: Equity, Debt and Guarantees; Min R10k, Max R3m.
Small and medium enterprises, women owned, owner managed enterprises;
Staged of business life cycle: Pre-start up, start-up, expansion; All sectors except property development, sex industry,
gambling. Export Credit Insurance Corporation Both wholesale and retail: Guarantees; Min none, Max none; Foreign credit underwriting.
SA exporters of capital goods and services, SA financing institutions, SA investing abroad;
Exports sector.
National Empowerment Fund Retail financing: Equity and Debt; Min R250k, Max R50m; Warehousing, underwriting of listings, and
bridging finance.
BEE owned firms, group owned, rural business, existing SMEs ready for BEE partnering;
Stages of business lifecycle: Start-up, expansion, acquisition; All sectors except property development, sex industry, gaming.
Apex fund14 Wholesale financing: Debt; Min R300k, Max R10k; Four micro credit components: Rural;
Urban; for progressive borrowers; for hardcore poor
Micro enterprises, black owned, women owned; Stages of business life cycle: start-up, expansion; All sectors, exclusions not specified.
Small Enterprise Development Agency15 Design development support programmes
for small enterprises; Build a service delivery network to
implement support for small enterprises.
80% of enterprise development activities on small, micro and co-operative enterprises; 20% on medium enterprises;
Business incubation, manufacturing support, export readiness, community information and advise, training and mentorship;
National and provincial structures
14 Operating Framework of the South African Microfinance APEX Fund (APEX Fund Task Team, 20 October 2004) 15 National Small Business Amendment Act, 2004; SEDA Presentation to MinMec meeting (Damane, 30 May 2005)

A Review of Industry Policy, Instruments and Support Programmes: 1994-2008
58
Development Bank of Southern Africa Contribution to sustainable development in the region by mobilising financial, knowledge and human resources to: Support Government and other
development role-players in improving the quality of life of the people of the region through the funding of infrastructure projects;
Accelerate the sustainable reduction of poverty and inequity; and
Promote broad-based economic growth and regional economic integration.
Making direct loans available at its prevailing interest rates for infrastructure;
Taking up an equity stake in infrastructure development, where appropriate;
Providing guarantees, where appropriate, to leverage private sector support by reducing the perceived risk of investment;
Offering a bridging financial facility to cater for the market gap regarding integrated housing, health, educational and related bulk and reticulated infrastructure;
Acting as a merchant bank to package risk appropriately, as well as the consequential investment and returns, in close collaboration with the private sector, government and other agencies.
The challenges pointed out by the DFI Working Group16 are to align the activities of DFIs with the high-level direction set by the state, to eliminate overlaps and inter-agency competition and in monitoring development impact. There are opportunities for improved coordination, amongst DFIs and with the dti, in order to achieve better impact in the following areas:
Investment support for industrial development projects;
Delivering incentive and enterprise support for SMEs and BEE;
Information dissemination and referrals;
Product design, monitoring and evaluation.
It is expected that the current DFI review will further illuminate this area. However, the quantum of investment support allocated by the IDC, in particular, has been very large, impacting particularly on the growth of relatively capital-intensive sectors.
6.7 Incentives – IDC Concessionary Financing Programmes 1994-2004
This section quantifies the usage of the various IDC programmes by sector and provides an assessment of the contribution of these incentive programmes to industrial growth.
During the past two decades, the IDC has offered a number of concessionary finance programmes, many of which would today be prohibited or countervailable by trading partners, but which have played a significant role in supporting investment in industry.
In any given year, the IDC advances loans and equity to various capital projects. The total investment value of these projects, or gross fixed capital formation (GFCF), has amounted to 4%-6% of total national GFCF as illustrated below. While this is quantitatively small in aggregate, IDC financing support has been concentrated amongst a few specific sectors where its quantitative and qualitative impact has been propulsive.
16 Discussion Document on Market Failures and Overlaps in DFI’s (Presentation by the DFI Working Group, 14 February 2005).

Figure 23: IDC Financing as % Total National GFCF
02468
101214161820
1990
1991
1992
1993
1994
1995
1996
1997
1998
1999
2000
2001
2002
2003
2004
2005
%
Source: IDC and Quantec Database
The large deviations in 1993 and 1995 were for the metals-sector Stage 2 and 3 mega projects that the IDC supported, including:
Columbus Stainless Steel (R3.6b);
Alusaf/ BHP Billiton Hillside Aluminium Smelter (R7.2b);
Namakwa Sands Titanium slag (R1.1b);
Saldanha Steel;
Hulett Aluminium.
6.8 The IDC’s Approach to Financing Projects
Prior to 1998, the IDC adopted a lending approach that was based on the size of the applicant or based on specific strategic criteria such as exports or job creation.
The IDC set interest rates to projects via a range of targeted financing instruments. The Table outlines the main low interest rate schemes that the IDC has utilised in the past:
59

A Review of Industry Policy, Instruments and Support Programmes: 1994-2008
60
Table 19: IDC Financing Instruments 1988 - 2000
Scheme Date Introduced
Date Terminated
Approved
(Rm)
Number of Projects
Jobs Created
Exports (Rm)
LIRS - 5% Import Replacement & Export Scheme
Feb 1988 Dec 1990 319.0 272 14823 1016.2
Multi Shift Scheme Jun 1990 Jun 1997 95.5 58 2332 176.7 LIFE - Low interest rate Scheme for the promotion of Exports
May 1991 Mar 1999 1578.5 411 13352 7991.5
JOBS - Low interest rate scheme for the promotion of employment
July 1993 447.4 391 19773 644.3
Orchards -Scheme for the expansion of orchards and other agro-products
Feb 1994 328.2 288 10829 426.5
World Player -Low interest rate scheme to improve international competitiveness
Oct 1995 Jun 1998 1011.9 83 3265 767.8
Agro-Industries Mar 1998 9.0 15 292 8.2 3789.5 1518 64666 11121.3
Source: IDC Research & Information
Time has not allowed for a thorough analysis of the use of these individual schemes according to its stage in the beneficiation value chain. Instead, the analysis has been based on all individual projects supported by the IDC, irrespective of the specific instrument used.
Analysis of IDC advances to projects in the various stages of beneficiation reveal the following aggregate pattern, between 1994 and 2004:
Figure 24: IDC Project Value by Beneficiation Stage – Metals & Chemicals 1994-2004, Rm
0
Metals
Chemica
ls
2,0004,0006,0008,000
10,00012,00014,00016,00018,000
Rm
Stage 4
Stage 3
Stage 2
Stage 1

61
The IDC has clearly tended to support large-scale capital-intensive projects at Stage 2 of the beneficiation value chain for both Metals and Chemicals. However, in the period after 1995, far fewer Stage 2 Metals beneficiation projects were undertaken in South Africa and this is reflected in profile of projects financed by the IDC between 2000 and 2004.
Figure 25: IDC Project Value by Beneficiation Stage – Metals and Chemicals 2000-2004, Rm
0
1,000
2,000
3,000
4,000
5,000
6,000
R
Metals Chemicals
m
Stage 4
Stage 3
Stage 2
Stage 1
Figure 26, provides an indication that IDC financing in any given year constituted a large proportion of total GFCF in the overall national investment quantum. Further interrogation of the data provided by the IDC is required, but we have assumed that GFCF = Total IDC share of the capital value of the project spread over the five subsequent years in equal amounts.
Figure 26: IDC Financing as % GFCF in Chemicals 1994-2004
0.0
5.0
1994 1995 1996 1997 1998 1999 2000 2001 2002 2003 2004
10.0
15.0
20.0
25.0
IDC % Stage 2+3IDC % Stage 4

A Review of Industry Policy, Instruments and Support Programmes: 1994-2008
62
Figure 27: IDC Financing as % GFCF in Metals 1994-2004
0.0
1994
1995
1996
1997
1998
1999
2000
2001
2002
2003
2004
10.0
20.0
30.0
40.0
50.0
60.0
IDC % Stage 2
IDC % Stage 3
IDC % Stage 4
The IDC does not usually promote investment projects on its own. It generally follows the patterns of investment promoted by private sector interests.
As shown elsewhere in this report, capital intensive investment in beneficiation projects has been supported by other incentives, including direct tax incentives such as the 37E Incentive and the Tax Holiday Scheme, both promoted and administered by the dti.
6.9 Post 2006 - National Industrial Policy Framework (NIPF) and the Industrial Policy Action Plan (IPAP)
In July 2006, Cabinet adopted the National Industrial Policy Framework. In this document, the dti (2006g) stated that:
“…..three main prerequisites for industrial growth and development in the South African economy have not emerged strongly enough through market forces alone since 1994. These are: a suitably cost-competitive production base; sufficient levels of industry upgrading and movement to higher value activities; and adequate inclusion of historically excluded people and regions in the formal economy.”
The NIPF seeks to address the above by organising the dti’s programmes so as to:
Strengthen the capacity to develop and implement sector strategies and to link them to trade negotiation positions,
Focus industrial financing to achieve the economic scale necessary for structural change,
Incorporate stronger conditions into incentives schemes to ensure that financing is met by corresponding developmental behaviour by firms,
Strengthen the 1998 Competition Act to improve the competitiveness of the economy as a whole and, in particular, of a number of concentrated strategic sectors.
Interventions are to be centred on the set of twelve Strategic Programmes (SPs) listed below.

Table 20: NIPF Strategic Programmes
Strategic Programme
SP1 Revision of Industrial Financing SP2 Large-scale Customised Sector Programmes for limited number of key sectors SP3 More Strategic Trade Policy SP4 Leverage Public Expenditure SP5 Spatial Industrial Development and Industrial Infrastructure Programmes SP6 Industrial Upgrading Programme SP7 Innovation and Technology Programme SP8 Improved Delivery of Finance and Services to Small Enterprises SP9 Strengthen Competition Policy and deal with Import Parity Pricing SP10 Leverage Empowerment for Growth and Employment SP11 Regional and African Industrial and Trade Framework SP12 Strengthen Capacity, Organisation and Coordination
A higher degree of prioritisation of sector targets, together with an approach that regards manufacturing as part of more complex value chains including services, appears to be an important implication of the NIPF, compared to pre-2006 dti policy approaches. Existing CSP’s are clustered into the following categories:
Table 21: Proposed NIPF Sector Clusters
Natural resource-based sectors Steel Chemicals Aluminium Paper and Pulp Bio-fuels
Downstream beneficiation of natural resources Metal fabrication Machinery and equipment Plastics Jewellery Oil and gas
Advanced manufacturing sectors Automotives and components Aerospace Energy Rail and marine
Labour-intensive sectors Clothing and textiles Food and beverages Furniture Crafts New labour intensive activities/services
Services Business Process Outsourcing Tourism Film and Television ICT
However, the NIFP does not go into the detail of which Strategic Programme will “house” existing incentive programmes.
63

A Review of Industry Policy, Instruments and Support Programmes: 1994-2008
64
A second target that the NIPF identifies is for the dti to develop a Spatial Industrial Development Strategy (SIDS) for the promotion of regional industrialisation outside the three traditional metropoles. The SIDS is to be based on the principles of the National Spatial Development Perspective (NSDP), including identifying specific areas and corridors in which high economic need coincides with good economic potential.
The existing IDZ programme is to receive more attention and the development of a regional industrial fund, along European Union lines, is being considered.
No new incentive type is called for in the NIPF, which is based on the retention and extension of existing incentive and support programmes. However, the spatial industrial development and industrial infrastructure programmes effectively build on and extend the critical infrastructure fund within a regional development/spatial industrial development strategy
Under the Industrial Upgrading strategic programme, there is a proposal to cluster a number of existing incentive programmes under the following umbrella funds:
Manufacturing Excellence,
Technology Infrastructure Fund.
The NIPF quantifies past incentive expenditure in aggregate terms and argues for a quantum increase in the overall dti industrial financing budget to address anticipated additional investment required to fulfil ASGISA needs.
The NIPF was accompanied by the Industrial Policy Action Plan (IPAP) in 2007 which spelled out a more detailed work programme to achieve NIPF objectives.
6.10 Conclusions – Impact of the dti’s past incentives on industry
From the above, the dti manages a very wide range of incentives, organised according to Investment Promotion, Trade Facilitation and Competitiveness programmes. Most of the incentive programmes have been reviewed and modified periodically while some of the programmes have come to the end of their approved lifetimes. Incentives have evolved since 1994 in accordance with the shifting targets of policy. The Targets of incentives have significantly increased over the past decade in terms of:
Job creation & retention,
Sector investment and export targets,
Firm-level competitiveness (R&D, innovation, partnerships),
Firm size – MSME,
BEE,
Non-manufacturing sectors.
The net result today is a complex mixture of investment, trade facilitation and competitiveness programmes which are sectorally generic but are nevertheless aligned to the dti’s complex and multiple policy objectives. In addition to the generic programmes, there are two very significant sector-specific incentive programmes for Clothing and Textiles and for the Automotive sector which are discussed separately elsewhere.
A wide range of incentive Types have been adopted by the dti to support direct and indirect investment, trade facilitation and competitiveness support, including incentive types which:

Are tax-based,
Are grant-based and matching grant-based,
Are duty credit-based,
Are loan risk-based,
Are service offering-based,
Involve developmental pricing of key inputs (electricity).
In regard to incentive Value, there have been shifts in the quantum of incentives applied to different (more generic programme) targets over the past decade. More noticeable is the relative overall decline in the quantity of financial resources being allocated directly through programmes on the dti budget. Conversely, there has been an exponential increase in the value of incentives allocated outside of the dti budget through the MIDP and DCCS incentives to Auto Assembly and Components and Apparel/Textiles – and also through the NIP programme.
Impact of Competitiveness programmes
Competitiveness programmes have performed well and have contributed, individually and collectively to the improved performance of South African industry. They constitute a relatively small part of total fiscal resources committed to industry and past performance presents a strong case to scale up the programmes considerably and to package them collectively towards specific sectors and value chains. The absence of a system to monitor the collective impact of all industrial support programmes on specific sub-sectors has concealed the effectiveness of these programmes and their potential to transform firms and industries.
Impact of Export marketing programmes
The same applies to export marketing programmes.
Impact of Investment Incentive programmes
Analysis of the dti’s grant-based SMMDP and SMEDP incentives indicate that these declined from 0.5% to 0.03% of total manufacturing sector GFCF between 2000 and 2005. The SMEDP was also directed at non-manufacturing sectors and these amounts have been excluded from the above percentage estimates. A similar analysis of tax-based incentives under the SIP programme during the same period indicates that the estimated value of the tax incentive amounted to approximately 1.8% of total manufacturing sector GFCF.
At an aggregated level, 1.8% of fixed investment does not appear to be very significant. However, further disaggregation reveals the relative impact on individual sub-sectors to have been much greater. The analysis above has revealed the disproportional impact of a number of key dti incentive programmes on individual economic sectors. However, the collective impact of the SMEDP, SIP and NIP programmes are very significant as the following graph shows.
65

A Review of Industry Policy, Instruments and Support Programmes: 1994-2008
66
Figure 28: All dti investment incentives: Impact as %GFCF, 2001-2005
However, the impact of these programmes on these sectors has gone unnoticed by the dti and other policy makers, mainly because of a) the fragmented and devolved way in which individual programmes are administered and b) the lack of a unit within the dti which consciously monitors the collective sectoral impact of the programmes of all dti and sister organisations.
Investment incentives to the value of more than 15% of total fixed investment have catalysed the following sectors over the past 7 years:
Textiles,
Wearing Apparel,
Footwear,
Wood and Wood Products,
Machinery and Equipment,
TV, Radio and Communication Equipment,

Professional and Scientific Equipment,
Motor Vehicles, Parts and Accessories,
Furniture.
The approach utilised in the study suggests that a system that continuously analyses the impact of total fiscal flows of all of the dti’s incentives to individual economic sectors would be a useful principle to adopt in designing and implementing incentives in the future. If the dti plans to target individual sectors more sharply, the screening and access criteria and conditionality for each incentive programme will need to be reviewed.
The question arises as to whether such investments would have taken place anyway? It is quite difficult to assess this. Reviews of the different programmes suggest that some would not have happened while some would have. The only way to address this undesirable phenomenon is to define the access criteria as tightly as possible. In addition to this, future incentive allocation should be based on investment projects that are identified in CSP investment plans.
67

A Review of Industry Policy, Instruments and Support Programmes: 1994-2008
68
7 What progress since 2003?
The conclusions are organised according to the themes utilised in the 10 year review.
7.1 Macroeconomic stability
The macroeconomic environment continued to improve during the past five years as follows:
Continued improvement of macro-economic stability, as reflected by increasing growth rates, improved fiscal effectiveness, increased expenditure on infrastructure upgrading and a budget surplus,
The main factors influencing the trade balance have been rising prices of primary and beneficiated minerals and chemicals, infrastructure expenditure causing increased imports of capital goods and, until recently, a strengthening exchange rate,
The reduced volatility of the exchange rate during the past five years has been a contributory factor to domestic economic stability and certainty. To the extent possible, given other macro-policy objectives, policymakers have consciously sought to avert an over-strengthening of the Rand, caused by rising commodity prices during this period, mainly in order to support domestic exports,
Domestic demand from a growing middle class has become an important economic growth driver,
Interest rates have reduced significantly over the past five years, although this downward trend has halted recently due to rising inflationary pressures.
Although this has generally been supportive of industrial investment and expansion, two key concerns remain. Firstly, supply and demand pressures have grown within the domestic economy. This has placed additional pressure on inflation and has led to changes in the basket of goods that SA imports. Although capital goods remain a substantial import item, luxury good imports have grown in importance, consequently placing additional pressure on the trade balance. Tariffs are increasingly difficult to use to stem imports but changes to the tax regime may provide a sustainable means to contain luxury good imports during times of high domestic demand.
Secondly, although the volatility of the exchange rate has declined, the SA Rand remains prone to fluctuations and, it could be argued, has been somewhat over-valued, particularly over the last 3 to 4 years. This has arguably led to a slowing of the growth of exports in recent years and has partly resulted in large imports of consumer goods from, especially, China. With the global economy entering a period of unprecedented uncertainty the main challenge will be to manage the likely depreciation of the Rand as portfolio investors look to other markets or the commodity ‘super cycle’ slows. A stable exchange rate is essential for both exporters and importers.
7.2 Trade policy, trade reform and access
This is the subject of a separate 15-year review study. However, the alignment between trade policy and industrial policy has been maintained during the last five years.

7.3 Industrial policies, competitiveness and industrial promotion
Industrial policy complexity and policy overlap. During the past five years, industrial policy targets have further broadened to encompass a range of sectors that have forward and backward linkages with manufacturing sub-sectors. This has implications for the internal management of the various support programmes as well as implications for the management of industrial policy programmes that are effected by departments other than the dti.
The extensive time that it took for the dti to get the National Industrial Policy Framework (NIPF) endorsed by other national departments is also reflective of the fact that industrial policy is significantly impacted by decisions taken by ministries such as Minerals and Energy, Public Enterprises, Communications, Transport, and Agriculture – as well as by decisions taken by the relatively independent boards of parastatals such as the IDC, Transnet, Eskom and PBMR. In this sense, the industrial policy project that government embarked on in 1994 is now significantly more complex and larger than originally contemplated. There needs to be serious reflection on whether the cabinet cluster model is a sufficiently equipped and empowered body to mediate between policy choices that have an impact on industrial policy objectives, such that the decisions adopted are aligned to a coherent industrial policy.
For example, transport and logistics costs and service quality have emerged as important constraints to industrial competitiveness. This is beginning to be addressed by increased investment in logistics infrastructure by the state-owned Transnet. However, Transnet’s strategy is significantly influenced by the primary objective of stabilising its balance sheet and this has partly influenced the sequencing of its investment programme. Thus, the iron ore and export coal railway lines were the first major recipients of investment, rather than container terminals, port and wharfage facilities which have a broader and more significant impact in national industrial development than primary ore exports, as important as the latter may be for the balance of payments. Although this is a complex area in itself, Transnet’s pricing policy of basing tariffs on the value of goods appears to favour bulk commodities and disfavour downstream beneficiated products.
A second example relates to the impediments to economic activity and competitiveness faced by industry and commerce by high telecommunications costs, the result of telecommunication policies over the past 15 years. Some progress can be recorded since the 2003 review. The Electronic Communications Act (ECA) has been promulgated. In terms of the powers conferred by the ECA, ICASA has initiated a number of investigations on market power and it is likely that their decisions will induce a telecommunications pricing reduction. The Department of Public Enterprises has simultaneously engineered the creation of Infraco which will provide access to bandwidth on its extensive fixed-line national backbone at significantly reduced rates compared to the Telkom monopoly, thereby driving prices downwards. (see competition section below regarding the importance of independent regulators)
A third example relates to the long-standing policy position of leveraging the purchasing power of the state to achieve industrial development objectives. In applying the influence that the Department of Public Enterprises can wield in its oversight role on large SOEs such as Eskom and Transnet, the DPE has embarked on an ambitious initiative (CSDP) that seeks to fundamentally transform the procurement function of these SOEs such that the procurement units of the SOEs perform a direct industrial development role in developing a competitive domestic supplier base. As an incentive for SOE’s such as Eskom and Transnet to adopt the CSDP programme, they have immediately been released from NIP obligations even though the CSDP has still to be developed. It appears that the sequencing of the shift from NIP to CSDP could have been done better. In the past year, several hundred billion rand of SOE contracts have been signed with no CSDP benefit or any obligation under the NIP. Had the NIP been in force, several hundred million rands of NIP benefits could have been recouped, in accordance with the demonstrated efficacy of the NIP programme.
A fourth example concerns the apparent disjointed way (from an industrial policy perspective) that major initiatives such as the Royalties Bill, the beneficiation aspects of mineral rights legislation and regulation and
69

A Review of Industry Policy, Instruments and Support Programmes: 1994-2008
70
the dti’s NIPF are being implemented. The processes for each of the above are driven by three separate line departments with very little apparent interaction and, consequently, the opportunity to make the policies mutually reinforcing in regard to industrial beneficiation is likely to be lost.
In this regard, the authors of this paper recognise that the apparent lack of industrial policy coordination is actually a reflection of, at best, a difference of industrial policy emphasis by different policy centres and, at worst, an outright contestation of industrial policy positions, which are not honestly reflected in the NIPF.
In the current context, because industrial policy impinges on the policy responsibility of so many departments of government other than the dti, every policy department feels that it owns and has every right to shape industrial policy. Consequently, in the consensual form that RSA processes take, it is quite difficult for any cross-cutting industrial policy to merge with programmes that move significantly from a lowest common denominator position. In the absence of a strong and purposeful dti, this situation is further perpetuated.
Competitiveness support programmes. During the last five year period, the positive impact of programmes targeting competitiveness suggests that such programmes could be significantly scaled up and expanded across other sectors. One of the tangible successes in firm-level competitiveness (using the dti’s industrial support measures) has been across the motor industry value chain. Such success, although at a smaller, local economic level, is being replicated in the clothing, textile and retail value chain.
As the NIPF and IPAP are implemented, this should be taken into account.
Capacity utilisation. Given the positive economic outlook, it is likely that firms in many sectors are currently contemplating brownfield and greenfield investment projects. The growing middle class and the current SOE-led infrastructure expenditure programme are largely inducing the demand that results in high capacity utilisation (recorded in Chapter 4). There are two major differences with the previous infrastructure-led investment programme of the 1970s and early 1980s. The first is that the South African economy is much more open to imported competition than it was in previous decades. This suggests that there is likely to be less investment in domestic production to meet the infrastructure requirements over the next decades.
The second difference is that most industrial sectors have undergone considerable restructuring over the past decade and those that are still in existence are currently globally cost competitive. This offers the opportunity to expand to meet both growing domestic market as well as global export markets. More open global markets provide opportunities for firms to invest in economies of scale that go beyond the capacity of the domestic market. In the 1970s, leveraging expansion into global markets off an infrastructure-led domestic growth path was constrained by apartheid economic sanctions.
The openness of the economy also fuels imports, as witnessed by growing current account deficits. Today, even existing manufacturing firms have the latitude to pursue an additional strategy that was not possible during the sanctions era of the 1970s and 1980s. A firm can run its domestic production at full capacity and, instead of investing in expanded capacity, develop an alliance to import part of its product range from lower cost manufacturers, particularly those in East Asia.
Taken collectively, this suggests that investment to expand existing capacity and/or to revive capacity need to be made on a much larger scale than might have been the case in previous decades of high growth. This requires firms to take greater risks and it will be important to ensure that such risks are appropriately incentivised so as to ensure that firms do not choose a more risk-averse import strategy.
Investment support. The evidence outlined above suggests that the dti’s various industrial investment-related programmes have had a positive impact on the recipient sectors in terms of the objectives of the individual programmes and in terms of the collective impact of programmes. The collective impact of all the

dti’s programmes on specific sub-sectors is shown to be very significant and there is good correlation between those recipient sectors and the fast-growing sub-sectors recorded between 2000 and 2005 in Chapter 4.
The dti does seem to be recently conscious of this cumulative past impact of its programmes as evidenced by the National Industrial Policy Framework (NIPF) commitment to streamline, cluster and collectively administer a number of industrial promotion programmes. However, there is little evidence that such collective administrative oversight is actually taking place and there is no recent dti data to suggest that the dti has created the internal machinery to update the profile of the impact of its investment-related incentives since 2005.
During this period, the intellectual research on the relationship between services and manufacturing sub-sectors is an area that requires reflection and further review of the dti’s industrial incentive regime. While incentive support has broadened to provide support to service sectors on a standalone basis (eg. BPO), it is clear from the research, that there is a case for targeting the growth and development of particular service and manufacturing sub-sector clusters.
An important contribution to the debate has been made by Tregenna, who argues that manufacturing continues to play an important role in service sector performance. However, she argues that manufacturing may not be as important to direct employment creation and suggests a more careful assessment of services’ potential to create employment.
In general, although investment support has been a positive influence on investment rates, more flexibility may be required from the dti in deciding which sectors qualify and which do not. The obvious examples are in services, but parts of agro-processing are equally important examples of sectors that fall between conventional definitions of manufacturing, services and agriculture.
7.4 Competition policy and regulation
Although not central to the terms of reference for this study, competition policy and regulation are playing an increasing role in industrial policy.
In the 2003 review, Chabane et al (2003) argued that the direction and pace of industrial development in the South African economy was still significantly determined by the decisions of a small number of large firms that continued to dominate a number of sectors of the economy. Such corporate power had been wielded through a structured conglomerate form during previous decades. In spite of the unbundling of that conglomerate form and the shift from family control towards broader institutional shareholder control, processes driven by tariff policies and the relaxation of exchange control regulations since the early 1990s, large firms continued to exercise significant market power in 2003.
Chabane et al (2003) point to the success of the Competition Commission and Tribunal since their creation in 1998 in addressing the rise in mergers and acquisitions that took place in the late 1990s and early 2000 period. However, they expressed concern that less progress had been made in countering the abuse of dominant market positions.
The impact of concentration in particular sectors on other sectors to which they are linked have been at the core of industrial policy consciousness since the early 1990s. Such impacts were viewed pragmatically. Where such concentration resulted in anti-competitiveness, the policy response was reflected in the promulgation of the Competition Act of 1996 – s which was a specific response to the historic concentration and associated anti-competitive bias that characterised many parts of South African industry. On the other hand, concentration and particular capital intensity of intermediate processed primary commodity sectors like steel, chemicals and ferro-alloys was also viewed as a national economic strength, which firstly cushioned South Africa’s minerals economy from some of the cyclical shifts of primary commodity prices and which provided
71
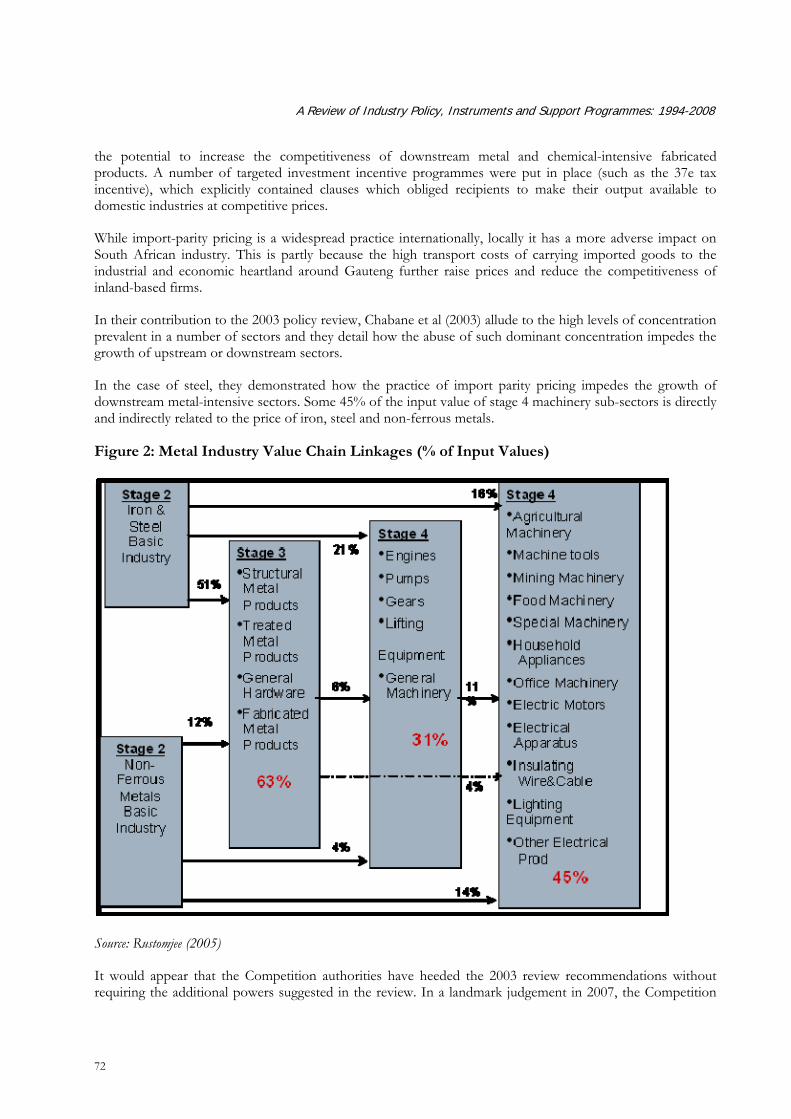
A Review of Industry Policy, Instruments and Support Programmes: 1994-2008
72
the potential to increase the competitiveness of downstream metal and chemical-intensive fabricated products. A number of targeted investment incentive programmes were put in place (such as the 37e tax incentive), which explicitly contained clauses which obliged recipients to make their output available to domestic industries at competitive prices.
While import-parity pricing is a widespread practice internationally, locally it has a more adverse impact on South African industry. This is partly because the high transport costs of carrying imported goods to the industrial and economic heartland around Gauteng further raise prices and reduce the competitiveness of inland-based firms.
In their contribution to the 2003 policy review, Chabane et al (2003) allude to the high levels of concentration prevalent in a number of sectors and they detail how the abuse of such dominant concentration impedes the growth of upstream or downstream sectors.
In the case of steel, they demonstrated how the practice of import parity pricing impedes the growth of downstream metal-intensive sectors. Some 45% of the input value of stage 4 machinery sub-sectors is directly and indirectly related to the price of iron, steel and non-ferrous metals.
Figure 2: Metal Industry Value Chain Linkages (% of Input Values)
Source: Rustomjee (2005)
It would appear that the Competition authorities have heeded the 2003 review recommendations without requiring the additional powers suggested in the review. In a landmark judgement in 2007, the Competition

Tribunal found Mittal Steel guilty of abusing its dominant position and fined it 5% of its turnover. Mittal has since appealed and it is likely that the case will drag on for several years into the future. Since then, the Commission and Tribunal have been very active in investigating and charging firms across a range of sectors for collusion, anti-competitive practices and abusing their dominant position.
Industrial competitiveness is further impeded by the high cost of telecommunications and transport. Indeed, the 2003 review highlighted the important role that independent regulators would need to play, in tandem with government policies, towards state-owned enterprises which dominated parts of these sectors. Since the promulgation of the ECA, ICASA has been systematically applying the various provisions of the Act and threatening to invoke its powers where appropriate. A transport regulator is in the process of being created. In addition, a number of related regulatory functions have been consolidated under the Energy regulator which is steadily building up a solid track record in the electricity, gas and pipeline sectors.
Independent regulatory processes are relatively slow but can be effective. These should be given consistent and requisite policy support in the next period and not be undermined by impatient policy makers and implementers.
7.5 Small, medium and micro-enterprise support
Increasing the contribution of the SMME sector to the SA economy has been a cornerstone of government policy since 1994. This is based on the demonstrated capacity for small enterprises to employ labour more intensely than large firms, the ability of small enterprises to act quickly to exploit market opportunities particularly in economic spaces which are difficult for large firms to penetrate, and the degree of innovation and product development which often occurs in small, flexible enterprises.
To date, the small enterprise sector has underperformed expectations. Two key themes emerge from the recent analysis of the sector. Firstly, the small enterprise sector is far more engaged with formal business networks than previously thought. Although this can be a positive attribute, in the context of the only moderate economic growth of the 1990s and early 2000s, the result was that the small enterprise sector was not a significant source of dynamism and job creation. Moreover, the lack of a sustained export response from formal medium and large enterprises means that economic space has not opened up in the domestic market for SMMEs to exploit. This underlines an additional objective for government support for an increasing emphasis on export market penetration.
Secondly, the pre-1994 policy environment for SMMEs was highly constrained with government policy explicitly undermining especially black SMMEs. Although many aspects of this were removed after 1994, a number of key regulatory barriers remained and many aspects of the way the SA economy operates – which were often directly detrimental to SMME development – were not identified and addressed very quickly. Examples of regulatory barriers which remained include parts of the Liquor Act and a number of Tax Acts and Municipal bylaws. In addition, the highly concentrated domestic economy and the tendency for anti-competitive behaviour by dominant firms has made it especially difficult for SMMEs to compete on an even footing. The recent proactive approach by the Competition Authorities suggests that perhaps SMMEs’ interests are now more firmly on the policy agenda. Small enterprises also find it difficult to access key services where regulatory barriers do not exist, but where large firms have not adjusted to new market opportunities. For example, SMMEs continue to struggle to access financial services. In many cases, banks base lending decisions on the collateral available to an SMME without taking into account the effect that apartheid had on black SMMEs’ capacity to own land and buildings. Furthermore, the financial services sector has not adjusted to the policy environment adequately and has failed to make even relatively low-risk adjustments to their lending practices. The latter would include lending working capital leveraged against confirmed orders.
Analysis of the increasing suite of the dti’s programmes and policies to support SMMEs suggests that they have impacted, and continue to impact, positively on small and medium enterprises. In particular, the recent
73
A Review of Industry Policy, Instruments and Support Programmes: 1994-2008
74
announcement of changes to various Tax Acts will substantially reduce the high tax compliance burden for SMMEs. In addition, the creation of a dedicated finance structure for providing small loans should assist especially very small enterprises to access loan finance.
However, over the past five years, a clear need has arisen for a greater focus in supporting informal micro enterprises and, in particular, to concentrate on strengthening the interface between informal micro enterprises and the formal sector. Although data are sketchy, it would appear plausible that some 1 million to 2 million informal enterprises exist in SA. Although generally not very profitable, these enterprises play a crucial role in alleviating poverty and providing a training ground for entrepreneurs. Many of SA’s local government structures continue to see these enterprises as nuisances to be dealt with by bylaw enforcement and harassment by both national and metro police forces. This would appear to be an area for urgent intervention through policy clarity and coordination at national government level.
On the whole, however, processes appear to be underway within the dti family of institutions to address a number of these issues.
7.6 Broad-based black economic empowerment
A key objective of government’s BBBEE policy is to redress the negative effects of past government policy. However, in the recent past, the generally poor response of white investors to market opportunities suggests the need for a new class of risk-taking black entrepreneurs. We would argue that, although a sweeping generalisation, many examples exist to suggest a fundamentally different risk analysis for many ‘traditional’ investors. This is most obviously seen in key upstream sectors where investors have failed to read market signals indicating increasingly tight supply conditions as demand has grown. Why this has happened is conjecture; what is clear is that without a substantial realignment of investors to SA’s growth prospects, the strong expansion seen in the recent past may be constrained by poor supply conditions.
The authors of this paper suggest establishment of enhanced information flows between government and investors regarding market opportunities and government’s own investment plans – with particular emphasis on BBBEE participants.
7.7 Research and development (R&D)
While not central to this paper’s TOR, the considerable progress made in increasing the level of R&D in the economy as part of the overall National System of Innovation approach of government (led by the dst) must be noted.
7.8 Human resource development (HRD)
The effects of apartheid-era education and training policies continue to be felt across all sectors of the economy. Moreover, the policy emphasis in the mid 1990s of fiscal restraint leading to a lowering of public investment levels was accompanied by a significant reduction in artisan and technical training at many government agencies. A return to a policy of these agencies providing substantial training opportunities for the broader good of the SA economy will require time and raises some questions about the extent to which the impact of fiscal restraint can be better managed in the future.
In general, skills levels in SA remain low for an economy where the manufacturing and service sectors are seen as the key drivers of employment creation and economic growth. Moreover, SA appears unable to

compete in manufacturing sectors where competitiveness derives from low labour costs, these sectors which generally provide relatively low skill jobs may require fiscal assistance if we are to match skills supply and demand more closely.
7.9 Institution building
The 10-Year Review noted the difficulty in creating new institutions and the time required for these to become effective. In addition, the principle-agent problem which sometimes arises from the creation of new institutions or changes in management of existing institutions – especially in cases where mandates are not clear – has also been experienced in the Review period.
Moreover, the authors would extend the institutional theme to coordination failures within government structures. As industrial policy becomes increasingly complex and as the point of intervention varies from sector to sector, the difficulty in ensuring policy coordination and coherence increases. In a number of cases, provinces have begun implementing industrial policies and programmes in advance of national government, especially the dti, policy processes. The dangers of ad hoc approaches such as these are that they encourage a ‘race to the bottom’ between provinces and metros, and also create opportunities for duplication or overlapping responsibilities. Well-known examples of this are the Western Cape Government’s RED Door programme and the Small Enterprise Development Agency’s roll-out of offices across all provinces.
A more positive development has been the convening of ‘cluster’ processes in a number of provinces. Although the experience is province- and sector-specific, there would appear to be a sound rationale for these activities to take place at a less-distant level than National government. Provincial relations with cluster participants – mainly private sector industry or service firms – allows for more regular interaction and a stronger appreciation of the impact of policies and market developments. This allows for better information flows between government and firms and provides government with an important ‘sounding board’ prior to policy implementation.
In general, institution-building issues have been addressed but processes and systems to address policy coordination and coherence between national departments and their agencies, and between national and provincial departments will be a challenge for the future.
75

A Review of Industry Policy, Instruments and Support Programmes: 1994-2008
76
References
Barnes, J, R.Kaplinsky and M. Morris (2003), “Industrial Policy in Developing Economies. Developing Dynamic Comparative Advantage in the South”, May http://www.ids.ac.uk/ids/global/pdfs/RJ&JB03.pdf
Bhorat, H. (2003), “Employment and Unemployment Trends in Post-Apartheid South Africa”, Paper Prepared for the Presidency 10-Year Cabinet Review Process.
Chabane, N, J.Machaka, N. Molaba, S. Roberts, M.Taka, 10 Year Review: Industrial Structure and Competition Policy, Corporate Strategy and Industrial Development research project, School of Economic and Business Sciences, University of the Witwatersrand
Cassim, R. D. Onyango, Z. Skosana, D. van Seventer (2003), A Review of the Changing Composition of the South African Economy, Report Prepared for the Presidency 10-year Review Project.
the dti (2005), Annual Review of Small Business, Pretoria.
the dti (2006), Annual Review of Small Business, Pretoria.
the dti (2001) Driving Competitiveness: Towards a New Integrated Industrial Policy for Sustainable Employment and Growth, Department of Trade and Industry, Pretoria.
DST (2005), A National Advanced Manufacturing Strategy for South Africa,
DST (2002), National Research and Development Strategy (NRDS)
the dti (2003), 10-Year Review and Strategic Planning. Sustainable Economic Development – Investment Promotion and Growth, Trade and Industry South Africa, the dti
the dti (2004a), “Impact review of the SMEDP”, the dti, Pretoria.
the dti (2004b), “Strategic Investment Program (SIP) Evaluation Report” , the dti, Pretoria.
the dti (2005), “Capital Goods Customised Sector Programme” , the dti, Pretoria.
the dti (2006a), “Business Process Outsourcing Customised Sector Programme” , the dti, Pretoria.
the dti (2006b), “Chemicals Customised Sector Programme” , the dti, Pretoria.
the dti (2006c), “Medium Term Strategic Framework 2006-2009” , the dti, Pretoria.
the dti (2006d), “Metals Customised Sector Programme” , the dti, Pretoria.
the dti (2006e), “National Industrial Policy Framework, July 2006” , the dti, Pretoria.
the dti (2006f), “Tourism Customised Sector Programme” , the dti, Pretoria.
the dti (2006g), “National Industrial Policy Framework” , the dti, Pretoria.
the dti (2006h), “South Africa’s New Regional Industrial Development Strategy, June” , the dti, Pretoria.

the dti (2006i), “South Africa’s economic transformation : A strategy for broad-based black economic empowerment”, Pretoria
the dti (2006g), “National Industrial Policy Framework” , the dti, Pretoria.
the dti (2006h), “South Africa’s New Regional Industrial Development Strategy, June” , the dti, Pretoria.
Flatters, F. (2002), “From Import Substitution to Export Promotion: Driving the South African Motor Industry” available at http://qed.econ.queensu.ca/faculty/flatters/main/writings.html
Flatters, F. (2003), "Is the MIDP a Model for Selective Industrial Policies?" Frank Flatters: Writings, Queens University Available at qed.econ.queensu.ca/faculty/flatters/.../ff_is_the_midp_a_model.pdf
Flatters, F. (2005), The Economics of the MIDP and the South African Motor Industry. Paper prepared for TIPS/NEDLAC South African Trade and Poverty Programme (SATPP) Policy Dialogue Workshop, Johannesburg, November 1-18.
Hodge, J. (1999), “Developing a Trade and Industry Policy for the Service Sector in South Africa”. Paper commissioned by the Trade and Industry Policy Secretariat.
Kaplan, D. (2007), “Industrial Policy in South Africa: Targets, Constraints and Challenges: Meeting of Experts on“FDI, Technology and Competitiveness”, paper prepared for a conference convened in honour of Sanjaya Lall, UNCTAD, Palais des Nations, Geneva, 8-9 March 2007.
Phillips. D.A. (2005), Evaluation of the Sector Partnership Fund, Vol. 1, Main Report (Final), dti/World Bank Industrial Competitiveness and Job Creation Project 30 April 2005.
Pouris, A (2006), “Review and impact assessment of THRIP and SPII for the dti”, Institute for Technological Innovation, University of Pretoria, July.
Rustomjee (2005), dti Incentives review process (Phase 1) – Incentives policy framework, Final report, 16 November. A study commissioned by the the dti, Pretoria.
Roberts, S. (2003), Industrial development and industrial policy in South Africa – a ten-year review, School of Economic and Business Sciences, University of the Witwatersrand.
Roberts, S (2006), “Understanding technology and economic development in South African industry: The case of the plastics sector”, Chapter 18: Measuring innovation in OECD and non-OECD countries, HSRC, Pretoria
Rustomjee (2005), “Minerals Beneficiation Incentive Strategy”; report commissioned by the dti.
SDC (2005), Competitiveness Fund Evaluation Report; dti/World Bank Industrial Competitiveness and Job Creation Project, May 2005 [compiled by Siyaphambili Development Consulting (SDC) in conjunction with David. A. Phillips, PMA Consulting and Urban Econ Development Consulting]
StatsSA (2006), Manufacturing: Utilisation of production capacity by large enterprises, Statistical release P3043, Preliminary, February.
The Presidency (2003), Towards a Ten-year Review – Synthesis report on implementation of Government programmes, Policy Coordinating and Advisory Services (PCAS), Pretoria.
Tregenna, F (2006) The Changing Character of Industrial Development, HSRC, Pretoria.
77

A Review of Industry Policy, Instruments and Support Programmes: 1994-2008
78
World Bank (2006), “Enhancing the effectiveness of Government in promoting micro, small and medium enterprise”, AFTPS Consultants, May.