industrial land inventory and supply estimates technical ......technical background . b-1 ... zoning...
TRANSCRIPT

APPENDIX B:
Industrial Land Inventory and Supply Estimates Technical Background
B-1
INDUSTRIAL LAND INVENTORY AND SUPPLY ESTIMATES—TECHNICAL BACKGROUND
Inventory Approach
In updating the Industrial Land Inventory and producing Industrial Land Supply Estimates for the Municipality of Anchorage (MOA), the EPS Team has followed an approach designed to assign all of the land located within the defined Study Area and in existing I-1, I-2, I-3 and MI Zoning Districts to mutually exclusive, but collectively comprehensive, categories. The industrial parcel classification criteria and selection rules defined for this process are parametric (i.e., they are based on discrete parcel attributes, development characteristics, and administrative/ownership status qualifiers) and recorded in the Industrial Land Inventory Database, which is described later in this section. This means the Industrial Land Supply Estimates may be directly related to the individual parcels making up each defined Supply Category, and that the Supply Estimates can be rapidly updated to reflect updates to parcel development status and/or adjustments to the defined selection criteria and categories.
Study Area , Suba reas and Contex t
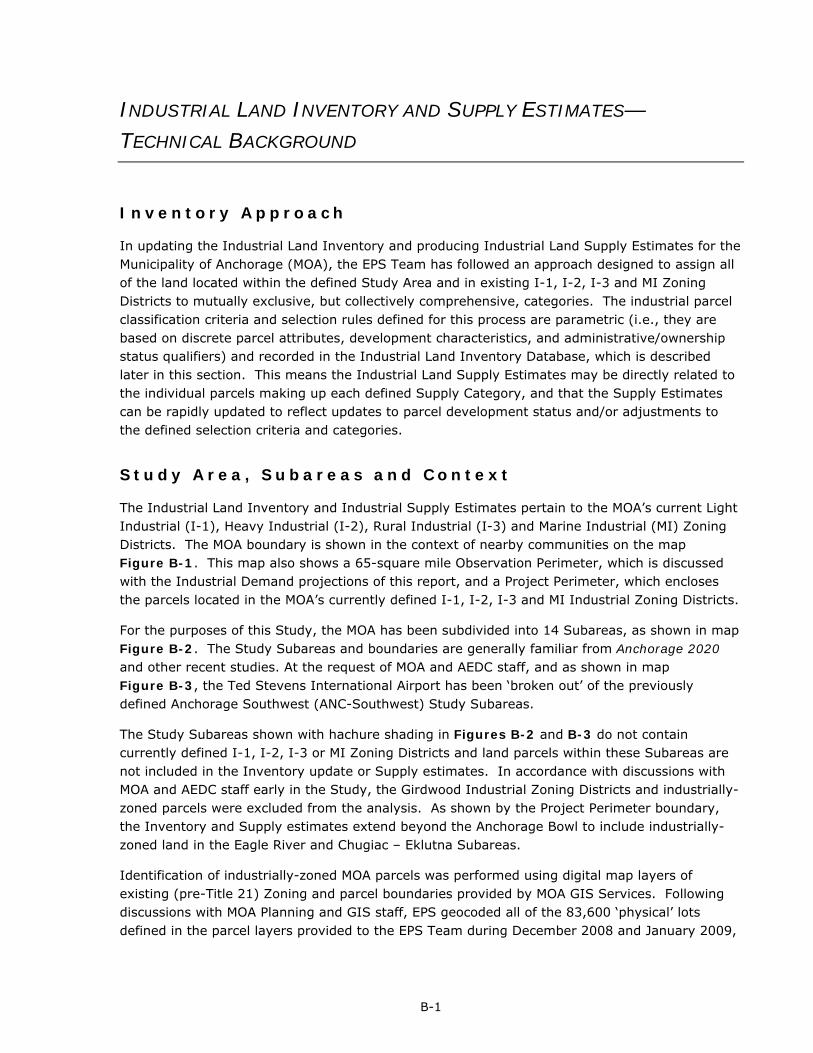
The Industrial Land Inventory and Industrial Supply Estimates pertain to the MOA’s current Light Industrial (I-1), Heavy Industrial (I-2), Rural Industrial (I-3) and Marine Industrial (MI) Zoning Districts. The MOA boundary is shown in the context of nearby communities on the map Figure B-1. This map also shows a 65-square mile Observation Perimeter, which is discussed with the Industrial Demand projections of this report, and a Project Perimeter, which encloses the parcels located in the MOA’s currently defined I-1, I-2, I-3 and MI Industrial Zoning Districts.
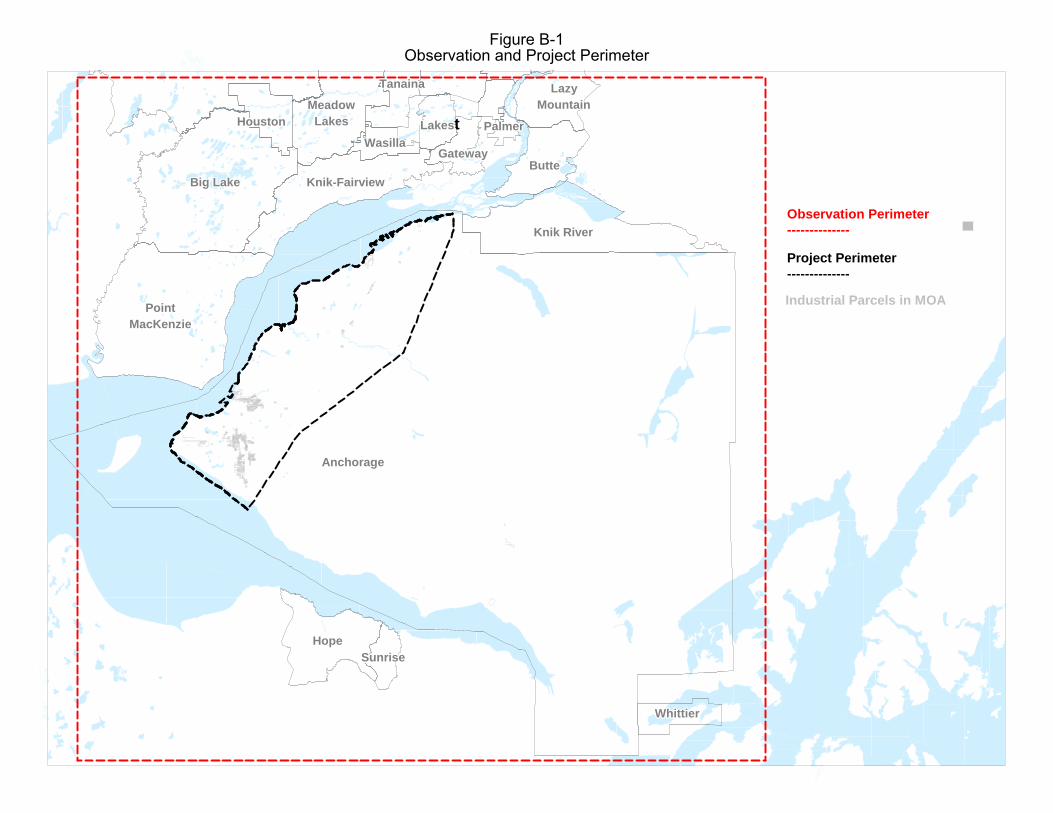
For the purposes of this Study, the MOA has been subdivided into 14 Subareas, as shown in map Figure B-2. The Study Subareas and boundaries are generally familiar from Anchorage 2020 and other recent studies. At the request of MOA and AEDC staff, and as shown in map Figure B-3, the Ted Stevens International Airport has been ‘broken out’ of the previously defined Anchorage Southwest (ANC-Southwest) Study Subareas.
The Study Subareas shown with hachure shading in Figures B-2 and B-3 do not contain currently defined I-1, I-2, I-3 or MI Zoning Districts and land parcels within these Subareas are not included in the Inventory update or Supply estimates. In accordance with discussions with MOA and AEDC staff early in the Study, the Girdwood Industrial Zoning Districts and industrially-zoned parcels were excluded from the analysis. As shown by the Project Perimeter boundary, the Inventory and Supply estimates extend beyond the Anchorage Bowl to include industrially-zoned land in the Eagle River and Chugiac – Eklutna Subareas.
Identification of industrially-zoned MOA parcels was performed using digital map layers of existing (pre-Title 21) Zoning and parcel boundaries provided by MOA GIS Services. Following discussions with MOA Planning and GIS staff, EPS geocoded all of the 83,600 ‘physical’ lots defined in the parcel layers provided to the EPS Team during December 2008 and January 2009,
ButteButteButteButteButteButteButteButteButteGatewayGatewayGatewayGatewayGatewayGatewayGatewayGatewayGateway
MeadowMeadowMeadowMeadowMeadowMeadowMeadowMeadowMeadowLakesLakesLakesLakesLakesLakesLakesLakesLakes
TanainaTanainaTanainaTanainaTanainaTanainaTanainaTanainaTanaina LazyLazyLazyLazyLazyLazyLazyLazyLazyMountainMountainMountainMountainMountainMountainMountainMountainMountain
Knik-FairviewKnik-FairviewKnik-FairviewKnik-FairviewKnik-FairviewKnik-FairviewKnik-FairviewKnik-FairviewKnik-Fairview
PointPointPointPointPointPointPointPointPointMacKenzieMacKenzieMacKenzieMacKenzieMacKenzieMacKenzieMacKenzieMacKenzieMacKenzie
Knik RiverKnik RiverKnik RiverKnik RiverKnik RiverKnik RiverKnik RiverKnik RiverKnik River
WhittierWhittierWhittierWhittierWhittierWhittierWhittierWhittierWhittier
HopeHopeHopeHopeHopeHopeHopeHopeHope
AnchorageAnchorageAnchorageAnchorageAnchorageAnchorageAnchorageAnchorageAnchorage
HoustonHoustonHoustonHoustonHoustonHoustonHoustonHoustonHouston PalmerPalmerPalmerPalmerPalmerPalmerPalmerPalmerPalmerWasillaWasillaWasillaWasillaWasillaWasillaWasillaWasillaWasilla
SunriseSunriseSunriseSunriseSunriseSunriseSunriseSunriseSunrise
Big LakeBig LakeBig LakeBig LakeBig LakeBig LakeBig LakeBig LakeBig Lake
LakesLakesLakesLakesLakesLakesLakesLakesLakest
Economic & Planning Systems, Inc. P:\18000s\18615Anchorage\Maps\MapInfo\R02-Settlements030109.wor
Observation Perimeter--------------
Project Perimeter--------------
Industrial Parcels in MOA
Figure B-1Observation and Project Perimeter

FortFortFortFortFortFortFortFortFortRichardsonRichardsonRichardsonRichardsonRichardsonRichardsonRichardsonRichardsonRichardson
PortagePortagePortagePortagePortagePortagePortagePortagePortageValleyValleyValleyValleyValleyValleyValleyValleyValley
GirdwoodGirdwoodGirdwoodGirdwoodGirdwoodGirdwoodGirdwoodGirdwoodGirdwoodTurnagain ArmTurnagain ArmTurnagain ArmTurnagain ArmTurnagain ArmTurnagain ArmTurnagain ArmTurnagain ArmTurnagain Arm
ANCANCANCANCANCANCANCANCANCSoutheastSoutheastSoutheastSoutheastSoutheastSoutheastSoutheastSoutheastSoutheast
Chugiak - EklutnaChugiak - EklutnaChugiak - EklutnaChugiak - EklutnaChugiak - EklutnaChugiak - EklutnaChugiak - EklutnaChugiak - EklutnaChugiak - Eklutna
Eagle RiverEagle RiverEagle RiverEagle RiverEagle RiverEagle RiverEagle RiverEagle RiverEagle River
ChugachChugachChugachChugachChugachChugachChugachChugachChugach
Economic & Planning Systems, Inc. P:\18000s\18615Anchorage\Maps\MapInfo\S02-Subareas030109.wor
Observation Perimeter--------------
Project Perimeter--------------
Industrial Parcels in MOA
Figure B-2Study Subareas in Regional Context
ANCANCANCANCANCANCANCANCANCAirportAirportAirportAirportAirportAirportAirportAirportAirport
ANCANCANCANCANCANCANCANCANCSouthwestSouthwestSouthwestSouthwestSouthwestSouthwestSouthwestSouthwestSouthwest
ANCANCANCANCANCANCANCANCANCNorthwestNorthwestNorthwestNorthwestNorthwestNorthwestNorthwestNorthwestNorthwest
ANCANCANCANCANCANCANCANCANCSoutheastSoutheastSoutheastSoutheastSoutheastSoutheastSoutheastSoutheastSoutheast
ANCANCANCANCANCANCANCANCANCCentralCentralCentralCentralCentralCentralCentralCentralCentral
ANCANCANCANCANCANCANCANCANCNortheastNortheastNortheastNortheastNortheastNortheastNortheastNortheastNortheast
ChugachChugachChugachChugachChugachChugachChugachChugachChugach
ElmendorfElmendorfElmendorfElmendorfElmendorfElmendorfElmendorfElmendorfElmendorf
Fort RichardsonFort RichardsonFort RichardsonFort RichardsonFort RichardsonFort RichardsonFort RichardsonFort RichardsonFort Richardson
Eagle RiverEagle RiverEagle RiverEagle RiverEagle RiverEagle RiverEagle RiverEagle RiverEagle River
Chugiak - EklutnaChugiak - EklutnaChugiak - EklutnaChugiak - EklutnaChugiak - EklutnaChugiak - EklutnaChugiak - EklutnaChugiak - EklutnaChugiak - Eklutna
Economic & Planning Systems, Inc. P:\18000s\18615Anchorage\Maps\MapInfo\S03-SubareaDetail030109.wor
Figure B-3Study Subarea Detail

Appendix B
B-5
according to their locations within Zoning Districts and by MOA GIS Land Use Category. During this process, EPS used the most recent Zoning and Land Use reference layers provided by MOA staff and/or available from the online MOA GIS data download website.
The locations and general zoning of the land identified as industrially zoned is shown in Figure B-4. EPS included lots having Special Limitation overlay status (e.g., I-1 SL and I-1 SL 2, I-2 SL, and I-3 SL 1 and I-3 SL 2) in the Inventory and Supply Estimates, and has grouped them with the more general I-1, I-2 and I-3 zoned land where appropriate. After discussions with MOA staff, the Zoning reference map layer provided by MOA GIS Services was assumed to have precedence in identifying current zoning designation over zoning designation fields found in CAMA and MUNIVIEW.
Where parcel boundaries were ‘split’ by the Zoning polygon boundaries in the reference maps, lots were assumed to be industrially zoned if the majority of the lot areas were located within the plotted Industrial Zone areas. EPS visually checked all ‘split’ lot zone geocoding to confirm this automated assignment, revising some assignments to compensate for lot geometric centroids located outside of lots’ actual boundaries. In total, 2,675 lots were initially identified as being completely or partially within Industrial Zoning Districts; following visual checks and exclusion of the Girdwood Subarea, 2,654 lots were selected for subsequent characterization and analysis.
Supp ly Ca tegor ies
Five distinct Industrial Land Supply categories have been defined for this study:
• Currently Undeveloped
• Redevelopable Residential
• Underutilized Non–Residential
• Currently Developed
• Unsuitable
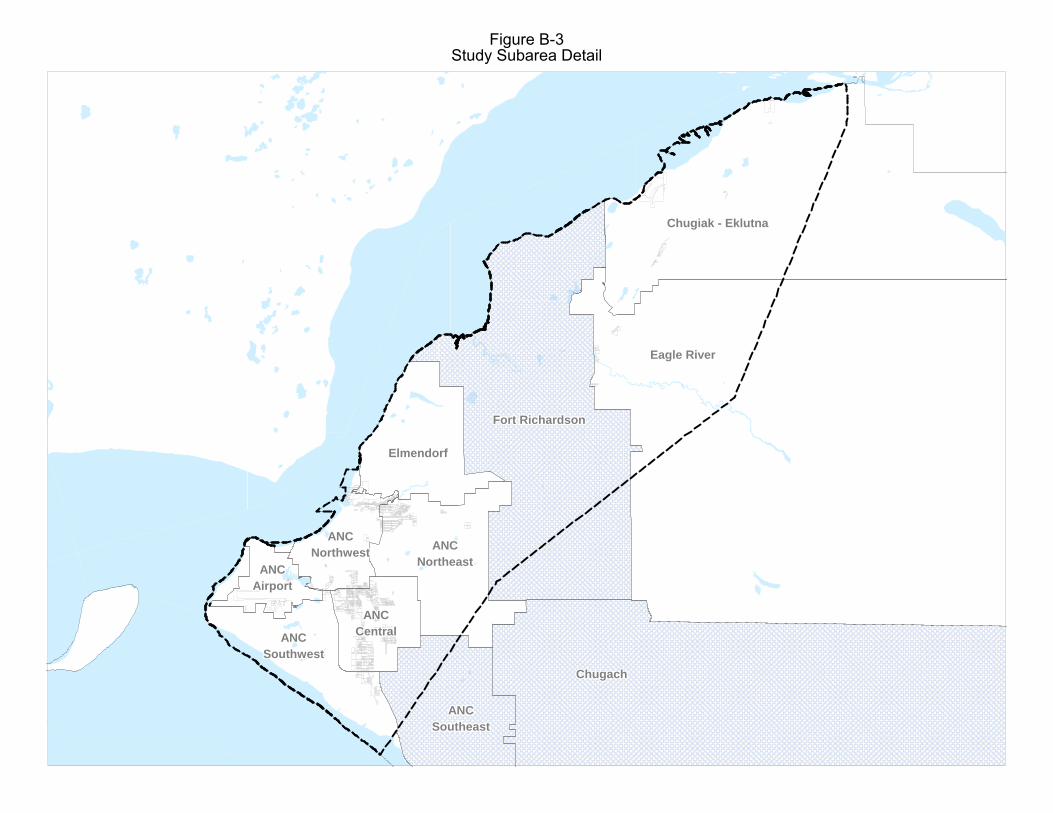
These five supply categories are defined and discussed individually below, with references to the selection criteria also summarized in Search and Classification Criteria. Current estimates of parcel counts and aggregate acreage of Industrial Land in each category, by Study Subarea, are shown in Table B-1.
Unsuitable for Development
The Industrial Land estimates in the Unsuitable Supply Category are shown near the bottom of Table B-1. However, the Unsuitable category was the first to be defined for this study, as the parcels in this group all have attributes, which are assumed to effectively exclude them from default consideration as land developable before 2030. Unsuitability for default classification of industrially-zoned land as having residual development capacity broadly includes parcels owned by the Federal, State or Local Governments, parcels having legislated status as wetland

Economic & Planning Systems, Inc. P:\18000s\18615Anchorage\Maps\MapInfo\S04-ZoneDetail030109.wor
Industrial Zoningw/o Limitation Overlays
I-1I-2I-3MI
Figure B-4Industrially Zoned Parcels
Table B-1Anchorage Bowl Industrial Land AssessmentPreliminary Industrial Zoning Districts Land Supply Estimates [1]
MOA LU Primary MOA LU Types Land Use Types Ival : Lval DU : Land Floor Area Suitability
Class Ownership Included (Prior Status) Excluded ratio ratio Ratio Classes Parcels Acres Parcels Acres Parcels Acres Parcels Acres Parcels Acres Parcels Acres Parcels Acres Parcels Acres
8000s 'Vacant' Land 18 25.74 11 37.21 186 255.73 12 21.88 10 144.56 10 47.54 247 532.66
2000s - 2400s Commercial 7 1.15 8 6.00 67 58.80 2 2.31 1 1.18 85 69.45
3000 - 3700s Industrial 10 4.13 23 27.57 220 143.58 12 14.12 4 9.22 269 198.62
1000s - 1400s Residential 1 0.27 1 0.15 71 25.68 10 19.17 2 4.78 85 50.04
1500s - 1700s Mixed Use [2] < 0.75 [3] < 0.10 [3] 1 0.49 1 0.49
1800 Unsound Dwelling Units #N/A 0 0.00
2000s - 2400s Commercial 12 8.58 12 18.92 68 102.03 6 41.35 2 2.76 100 173.65
3000 - 3700s Industrial < 0.75 [3] [3] 16 26.10 31 57.02 147 255.52 12 49.88 1 9.83 3 3.04 210 401.38
8000s Previously 'Vacant' Land 5 1.37 1 0.42 36 28.12 1 6.94 43 36.85
1000s - 1400s Residential 1 0.62 1 3.73 43 8.10 1 4.28 46 16.73
1500s - 1700s Mixed Use [2] [3] >= 0.10 [3] 3 0.81 2 0.58 5 1.40
1240, 1900s Residential Associated >= 0.75 #N/A 8 1.61 8 1.61
2000 - 2400s Commercial 96 117.66 70 98.39 355 352.42 22 53.42 1 2.28 5 6.50 549 630.67
3000 - 3700s Industrial 65 65.03 53 88.25 347 396.07 16 38.74 6 27.48 8 8.44 495 624.00
8000s Previously 'Vacant' Land 3 5.50 20 76.29 3 193.80 1 15.00 27 290.60
Unsuitable [4]Government, Utilities, Institutional
3800s - 7300s 8100, 8200
Utility-Related; Institutional;
Parks and OS; Transportation-Related ROWs;
Military; Intertidal, etc.
1000s - 3700s #N/A #N/A #N/A 3 28 269.23 239 662.90 94 388.77 86 239.98 12 46.68 13 240.35 12 27.14 484 1,875
Totals by Subarea [5] 28 269.23 473 919.04 305 726.43 1,658 1,945.24 97 275.92 49 650.95 44 116.38 2,654 4,903.20
"ind_sup"
Sources: Economic & Planning Systems, using MOA GIS Parcel, Zoning and Land Use boundary layers and 'roll-up' summaries of parcel development and valuation status developed by Dan Quinn and provided by MOA Information Technology Staff
Notes: These preliminary estimates incorporate 2009 Assessed Valuation, but do not yet reflect revisions in 4-digit Land Use Codes which are being assigned to update current site usage of Industrially Zoned properties.
[1] The targeted Industrial Zoning Districts are I-1, I-2, I-3 and MI, as located in the Anchorage Bowl, Chugiak-Eklutna, and Eagle River subareas of the Municipality of Anchorage; the Anchorage Bowl Subarea has been further subdivided into six regions: Airport, Northwest, Northeast, Central, Southeast and Southwest.
[2] Mixed-Use can contain both Residential and Non-Residential Components.
[3] Threshold criteria for underutilized/redevelopable land have been set within the ranges indicated in Bold Red Italic.
[4] Government, Utility, and Institutional contacts have been made independently to determine development plans and estimate potential development capacity on land generally excluded as 'Unsuitable' - these estimates will be added to the estimated supply from the Vacant, Redevelopable Residential and Underutilized Non-Residential classes.
[5] Parcel counts and acreages reflect reclassification of 1 SW parcel from 'Undeveloped' to 'Underutilized' in response to reviewers knowledge of site usage.
0, 1, 2
1240, 1900s< 1 : 5,000 sqft
Search and Classification Criteria
0.00 0.00 0.00
0 - 3
Increasing - Supply Potential - Decreasing
Redevelopable Residential Private
Underutilized Non-Residential Private
Currently Undeveloped (No Permanent Structures, E-Linkages or Assessed Building Value)
Private
Currently Developed Private
Land Summary by Class
0, 1, 2
Utility-Related; Institutional;
Parks and OS; Transportation-
Related ROWs; Military;
Intertidal, etc.
Eagle River Study Area TotalsSouthwestNorthwest Northeast Central Chugiak / EklutnaAirport
Subarea Geography
1800
>= 0.10
#N/A
0, 1, 2
#N/A
>= 1 : 5,000 sqft
< 0.10
Prepared by EPS 3/30/2009 P:\18000\18615 Anchorage Industrial Land Assessment\Models\18615 DraftSupplyClass_032709.xls B-7

Appendix B
B-8
preserves, dedicated open space and parks, military reserves, etc. The specific selection criteria for this and the other Supply Categories are identified below and in the report sections for those categories.
Specific potentials for development on industrial land categorized as generally ‘Unsuitable’, where identified during the Team’s interviews and research, constitute net additions to the ‘default’, ‘raw’ or baseline estimates of Currently Undeveloped, Redevelopable Residential and Underutilized Non-Residential development- and infill- capable land shown in Table B-1. As an example, all 269 acres of industrially zoned land in the Airport Study Subregion, having State or Federal ownership or being within the TSIA boundaries, is assigned a first-pass classification of Unsuitable. The EPS Team’s estimates of potential future industrial development for the Airport Subarea therefore represent a net addition of estimated Industrial Development Capacity to year 2030.
The defined exclusionary criteria applied to assign Unsuitable status include:
Existing Land Use
The following MOA Planning/GIS Land Use classes and included sub classifications are assumed to be incompatible with default assumed potential for additional or alternative Industrial development:
3800s Utility-Related Facilities
4000s INSTITUTIONAL
5000s PARKS, OPEN SPACE, AND RECREATION AREAS
6000s TRANSPORTATION - RELATED
7000s R.O.W.s and Military Reservations
8100 Intertidal Areas
8200 Waterbodies
EPS observed, consistent with MOA documentation and discussions with MOA Planning and GIS staff, several Industrially Zoned parcels with only partial Intertidal or Water Body coverage were assigned primary Land Use codes other than 8100 or 8200. Examples of such parcels are shown in the Chapter 5 of this Report. EPS used MOA and Census Bureau digital maps of marine, shoreline and inland water bodies to ‘net out’ Industrially-zoned parcels’ water acreage, in order to prevent overestimating the actual land acreage available to absorb new industrial uses.
Wetland Preserves
EPS visual review of all Industrially Zoned ‘vacant’ parcels of 0.5 gross acres or larger via Google Earth (which recently loaded 2006 orthophotographs provided by the MOA) showed some Industrially Zoned parcels located on or adjacent to obvious riparian or wetland habitats. This visual impression was confirmed against digital map wetland coverages available from the MOA GIS website. Those parcels having a wetland code of ‘PRESERVATION’ per the MUNIVIEW_BOTH table provided to the EPS Team have been assumed to have legislated wetland protection and have been assigned to the ‘Unsuitable’ category.
Appendix B
B-9
Institutional, Government and Utility Ownership
The following Property Tax Exemption Codes, as indicated in the MUNIVEW_PARCEL table provided to the EPS Team are assumed indicate Industrially Zoned parcel ownership incompatible with consideration for (additional/alternative) Industrial development:
‘A’ Utility
‘F’ Education - State
‘2’ State
‘3’ Federal
‘4’ Municipal
‘9’ Education - MOA
Anchorage 2020 Development Suitability Ratings
Industrially Zoned Parcels which had previously been assigned a Suitability Rating of ‘3’ – that is, ‘Unsuitable’ for assumed development, infill or redevelopment, due to environmental sensitivity, problematic access, etc. during the Anchorage 2020 buildout analysis, have also been assumed to be Unsuitable for consideration of development before 2030 in this Study. Parcels which had been assigned a Suitability Rating of ‘2’ – ‘Marginally Suitable’ during Anchorage 2020 buildout analysis, were ‘passed through’ for assignment to the other Supply Categories, unless they also matched other exclusionary criteria.
Currently Undeveloped
Industrially-Zoned Land with no or primarily non-residential surface use has been classified as Currently Undeveloped if it passes through the exclusionary criteria described above, has Zero (0) Residential Units, Zero Non-Residential Permanent Buildings AND Zero 2009 Building Assessed Value, per end of year 2008 and Tax Year 2009 CAMA extracts and MUNIVIEW tables provided to EPS by MOA staff. Land parcels meeting the Currently Undeveloped criteria are ‘Vacant’ in the sense they have no permanent, taxable structural improvements, but may not be ‘Empty’ lots; in fact, a large number of the ‘Vacant’ parcels viewed by EPS using 2006 and 2007 MOA and USGS aerials are seen to have some or even intensive use as lay-down and bulk storage yards.
To define a reasonable ‘Undeveloped’ standard for this Study, prior MOA GIS/Planning land use classifications other than 8000 – Vacant Land have been considered as potential candidates for Currently Undeveloped supply status. This consideration provided the industrially-zoned parcels met the Zero Buildings/Zero 2009 Building Assessed Value criteria AND were not Economically Linked to other, Currently Developed parcels, per the Economic Linkage and Lease maps and reference tables provided to EPS by MOA staff.
In all, EPS has classified 601 of the 2,654 parcels and 801 of the 4, 903 land acres in the Study Area as Currently Undeveloped (see Table B-1). The majority of the Currently Undeveloped category comprises parcels having an assigned MOA GIS/Planning Land Use Code of 8000 - Vacant Land in previous inventories, but 268 or one-third of the 801 acres are parcels which previously assigned Commercial or Industrial Land Use Codes – the non-vacant coding is

Appendix B
B-10
consistent with the outdoor storage/rental/repair of heavy equipment and outdoor bulk storage and ‘wall-less warehousing’ observed when EPS staff checked 2006 and/or 2007 aerials for all parcels assigned to the Currently Undeveloped category and having 0.5 or greater acres in gross area.
As shown in Table B-1, over half of the total acreage categorized as Currently Undeveloped is located in the Anchorage Central Subarea, and an additional nearly 20% of the total located in the Chugiac/Eklutna Subarea. Note the average parcel sizes for Currently Undeveloped Land in the Anchorage Central Subarea are much smaller than for the Chugiac/Eklutna Subarea.
This average size differential has possible implications for the ease of property assemblage for development, and can be examined in more detail in Table B-2. The breakouts by parcel size range show that in the Anchorage Central Subarea, 83% of the parcels and slightly less than one-third of the estimated ‘land’ acreage are in lots of less than 1 Acre; only 1% of the parcels and 20% of the ‘land’ acreage are in lots of 10 acres or larger. By comparison, in the Chugiak/Eklutna Subarea, over two-thirds of the parcels and 99% of the estimated ‘land’ acreage are in parcels of 1 acre or larger, with over 20% of the parcel count and over 80% of the estimated ‘land’ acreage in lots of 10 acres or larger.
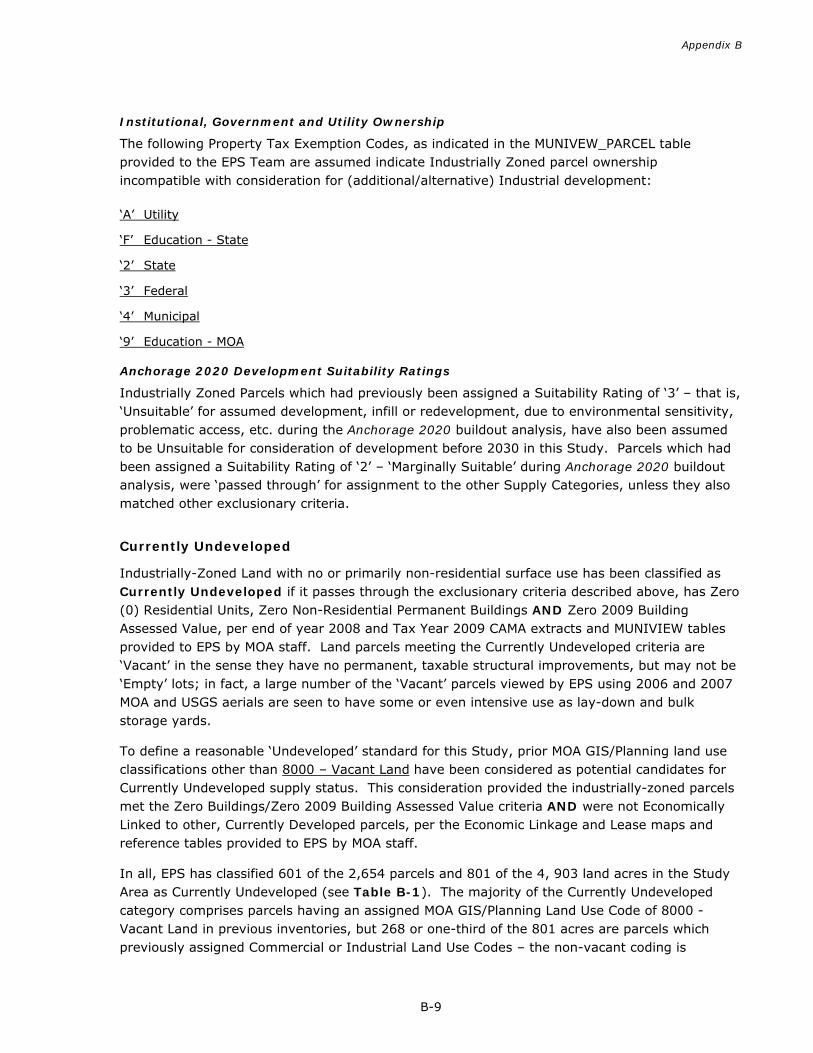
The proportional distribution of Currently Undeveloped land within existing MOA Industrial Zoning
Districts also varies by Subarea. As can be seen in Table B-3, approximately 66% of Anchorage Central currently undeveloped industrial land is located in I-1 zones. For the Chugiak/Eklutna Subarea, 47% of the currently undeveloped industrial land is located in I-1 zones.
The defined Currently Undeveloped selection criteria include:
Existing Land Use
The following MOA Planning/GIS Land Use classes and included sub classifications are assumed to be compatible with Currently Undeveloped status for additional or alternative Industrial development:
8000s Vacant Land
2000s – 2400s Commercial (Surface) Uses
3000s – 3700s Industrial (Surface) Uses
Anchorage 2020 Development Suitability Ratings
Industrially Zoned Parcels which previously were assigned a Suitability Rating of ‘0’, ‘1’ or ‘2’ – that is, ‘Not Rated’ ‘Suitable’ or ‘Marginally Suitable’ for assumed development, infill or

Table B-2Anchorage Bowl Industrial Land AssessmentPreliminary Industrial Zoning Districts - Vacant Land Supply Estimates [1] [2] [3]
Parcel MOA LU Primar MOA LU AssessedLand Types Land Use Types Residential Number of Building Suitability Acres Ownership Included (Prior Status) Excluded Units Buildings Value Classes Parcels Acres Parcels Acres Parcels Acres Parcels Acres Parcels Acres Parcels Acres Parcels Acres Parcels Acres
Private 2000 - 3700s, 8000
Vacant / Unbuilt Land
1000-1900s, 3800s-7300s, 8100, 8200
0 0 0 0, 1, 2
0 - 20,000 Sq. Ft. 25 4.93 12 4.15 291 70.09 9 2.81 2 0.47 339 82.45
20,000 Sq. Ft. - 1 Acre 1 0.79 18 11.81 100 74.62 7 4.90 3 1.75 1 0.93 130 94.82
1 - 3 Acres 6 11.62 7 12.61 56 98.27 6 10.29 2 3.14 6 12.88 83 148.81
3 - 7 Acres 3 13.67 1 5.15 15 77.45 3 13.00 3 12.22 2 8.96 27 130.46
7 - 10 Acres 4 37.06 6 51.99 1 7.32 1 9.94 1 9.86 13 116.18
10 Acres+ 5 85.67 3 126.26 1 16.08 9 228.02
Total 0 0.00 35 31.02 42 70.78 473 458.11 26 38.32 14 153.78 11 48.72 601 800.73
"vac_size"
Sources: Economic & Planning Systems, using MOA GIS Parcel, Zoning and Land Use boundary layers and 'roll-up' summaries of parcel development and valuation status developed by Dan Quinn and provided by MOA Information Technology Staff
Notes: These estimates incorporate 2009 Assessed Valuation and Development Status, but do not yet reflect revisions in 4-digit Land Use Codes which are being assigned to update current site usage of Industrially Zoned properties.
[1] Land Acreage adjusted by EPS to exclude areas with permanent/ standing water-coverage, tidal flats, low coastlands, etc.
[2] Government, Utility, and Institutional contacts have beeen made independently to determine development plans and estimate potential development capacity - these estimates will be added to the estimated supply from the Vacant/Unbuilt, Redevelopable Residential and Underutilized Non-Residential classes.
[3] Final parcel counts and acreages.
Search and Classification Criteria
Airport Northwest Northeast Southwest Chugiak / Eklutna
Vacant Land by Parcel Sizes
Eagle River Study Area Totals
Subarea Geography
Central
Prepared by EPS 3/30/2009 P:\18000\18615 Anchorage Industrial Land Assessment\Models\18615 DraftSupplyClass_032709.xls B-11
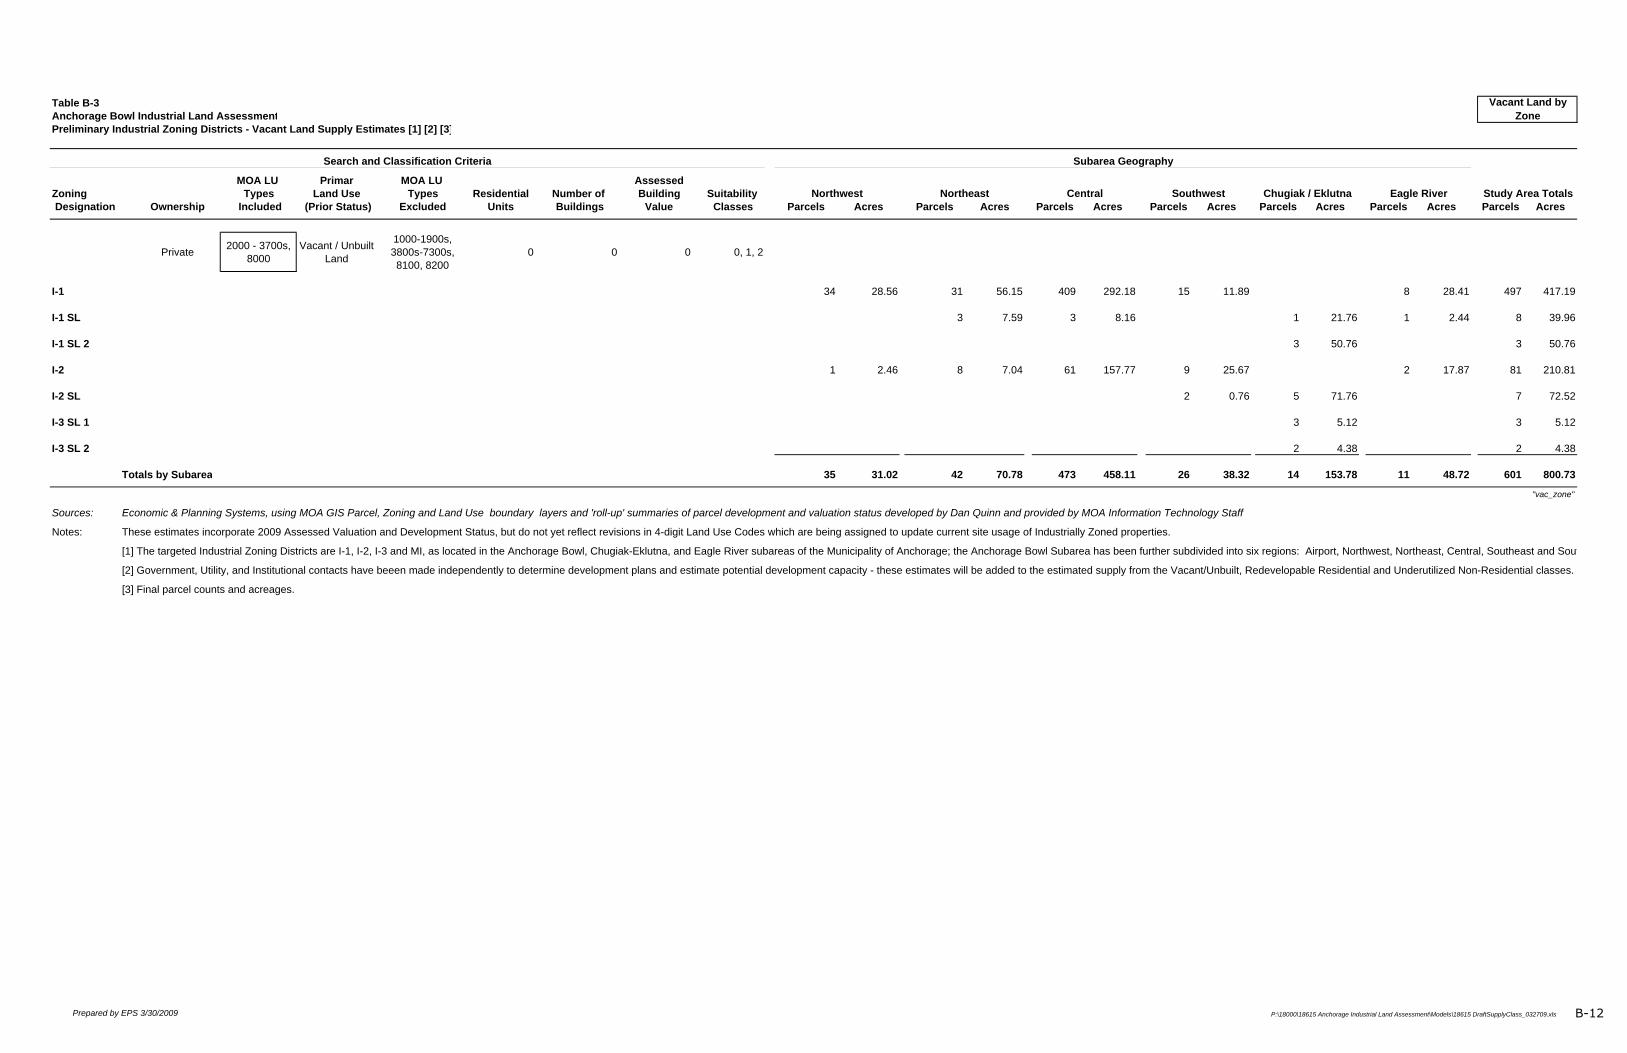
Table B-3Anchorage Bowl Industrial Land AssessmentPreliminary Industrial Zoning Districts - Vacant Land Supply Estimates [1] [2] [3]
MOA LU Primar MOA LU AssessedZoning Types Land Use Types Residential Number of Building Suitability Designation Ownership Included (Prior Status) Excluded Units Buildings Value Classes Parcels Acres Parcels Acres Parcels Acres Parcels Acres Parcels Acres Parcels Acres Parcels Acres
Private 2000 - 3700s, 8000
Vacant / Unbuilt Land
1000-1900s, 3800s-7300s, 8100, 8200
0 0 0 0, 1, 2
I-1 34 28.56 31 56.15 409 292.18 15 11.89 8 28.41 497 417.19
I-1 SL 3 7.59 3 8.16 1 21.76 1 2.44 8 39.96
I-1 SL 2 3 50.76 3 50.76
I-2 1 2.46 8 7.04 61 157.77 9 25.67 2 17.87 81 210.81
I-2 SL 2 0.76 5 71.76 7 72.52
I-3 SL 1 3 5.12 3 5.12
I-3 SL 2 2 4.38 2 4.38
Totals by Subarea 35 31.02 42 70.78 473 458.11 26 38.32 14 153.78 11 48.72 601 800.73
"vac_zone"
Sources: Economic & Planning Systems, using MOA GIS Parcel, Zoning and Land Use boundary layers and 'roll-up' summaries of parcel development and valuation status developed by Dan Quinn and provided by MOA Information Technology Staff
Notes: These estimates incorporate 2009 Assessed Valuation and Development Status, but do not yet reflect revisions in 4-digit Land Use Codes which are being assigned to update current site usage of Industrially Zoned properties.
[1] The targeted Industrial Zoning Districts are I-1, I-2, I-3 and MI, as located in the Anchorage Bowl, Chugiak-Eklutna, and Eagle River subareas of the Municipality of Anchorage; the Anchorage Bowl Subarea has been further subdivided into six regions: Airport, Northwest, Northeast, Central, Southeast and Sout
[2] Government, Utility, and Institutional contacts have beeen made independently to determine development plans and estimate potential development capacity - these estimates will be added to the estimated supply from the Vacant/Unbuilt, Redevelopable Residential and Underutilized Non-Residential classes.
[3] Final parcel counts and acreages.
Eagle River Study Area TotalsSouthwest Chugiak / EklutnaNorthwest Northeast Central
Search and Classification Criteria
Vacant Land by Zone
Subarea Geography
Prepared by EPS 3/30/2009 P:\18000\18615 Anchorage Industrial Land Assessment\Models\18615 DraftSupplyClass_032709.xls B-12

Appendix B
B-13
redevelopment during the Anchorage 2020 buildout analysis, are assumed Suitable for consideration of development before 2030 in this Study.
Soil Limitation Ratings for Small Commercial Buildings
EPS calculated Approximate Soil Limitation Ratings for all Industrially-Zoned Parcels using GIS layers and documentation of the United States Department of Agriculture’s Soil Survey of Anchorage, Alaska, provided by MOA staff and obtained from the USDA Natural Resources Conservation Service. Specific ratings by soil type were derived from the Soil Survey’s Table 13
- Building Site Development: Structures; Limitations for Small Commercial Structures1. Parcel ratings were allocated by EPS, using weighted averages where parcel polygons intersected multiple soil types.
The allocated Soil Limitation Ratings are approximate, for broad-brush analysis and not a substitute for parcel-specific onsite evaluations, and therefore have not been used as filtering or selection criteria for assignments of land to the Supply Categories. However, the Soil Limitation Ratings provide an aggregate impression of the relative challenge and potential costs of developing land in the Currently Undeveloped Category, as shown in Table B-4.
The Soil Survey Small Commercial Structure limitation ratings range from Not Rated (often assigned to already graded and filled, ‘urbanized’ areas) through 0.00 (No Limitation) to 1.00 (The most severe limitations for potential commercial construction). EPS has assumed, following a reading of the Soil Survey notes and documentation for Table 13 - Building Site Development: Structures; Limitations for Small Commercial Structures, that parcels having weighted average Small Commercial Structure limitation ratings in the range of 0.51 to 1.00 may have Very Severe limitations for competitive industrial development requiring permanent structures onsite.
For the Anchorage Central Subarea, nearly one-third (32%) of the Currently Undeveloped gross parcel acreage appears to be in the Very Severe Limitation range, which can be correlated in many cases to the extents of the Doroshin and Iknuun Peats. For the Chugiak/Eklutna Subarea, approximately 47% of the of the Currently Undeveloped gross parcel acreage appears to be in the Very Severe Limitation range, which can be correlated in many cases to the extents of tidal flats into parcels along the Knik Arm, and to slope conditions for parcels located inland.
1 From the Soil Survey: "Small commercial buildings are structures that are less than three stories high and do not have basements. The foundation is assumed to consist of spread footings of reinforced concrete built on undisturbed soil at a depth of 2 feet or at the depth of maximum frost penetration, whichever is deeper. The ratings are based on the soil properties that affect the capacity of the soil to support a load without movement and on the properties that affect excavation and construction costs. The properties that affect the load-supporting capacity include depth to a water table, ponding, flooding, subsidence, linear extensibility (shrink-swell potential), and compressibility (which is inferred from the Unified classification). The properties that affect the ease and amount of excavation include flooding, depth to a water table, ponding, slope, depth to bedrock or a cemented pan, hardness of bedrock or a cemented pan, and the amount and size of rock fragments."
Table B-4Anchorage Bowl Industrial Land AssessmentPreliminary Industrial Zoning Districts - Vacant Land Supply Estimates [1] [2] [3] [4]
Soil Soil MOA LU Primar MOA LU AssessedLimitation Limitation # Types Land Use Types Residential Number of Building Suitability Rating Range Ownership Included (Prior Status) Excluded Units Buildings Value Classes Parcels Acres Parcels Acres Parcels Acres Parcels Acres Parcels Acres Parcels Acres Parcels Acres
Private 2000 - 3700s, 8000
Vacant / Unbuilt Land
1000-1900s, 3800s-7300s, 8100, 8200
0 0 0 0, 1, 2
Not Rated #N/A 1 1.77 1 5.15 44 51.03 11 27.60 2 4.38 59 89.93
Not Limited 0.00 - 0.00 1 9.63 7 7.74 2 1.62 1 1.79 11 20.78
Some Limitation 0.01 - 0.10 20 8.72 40 56.00 333 192.85 15 10.72 4 26.88 1 1.18 413 296.35
Moderate Limitation 0.11 - 0.25 1 2.46 9 21.13 10 23.59
Severe Limitation 0.26 - 0.50 1 0.79 9 36.76 1 48.57 1 16.08 12 102.21
Very Severe Limitation 0.51 - 1.00 12 17.28 71 148.60 5 72.33 8 29.67 96 267.87
Totals by Subarea 35 31.02 42 70.78 473 458.11 26 38.32 14 153.78 11 48.72 601 800.73
"vac_soil"
Sources: Economic & Planning Systems, using MOA GIS Parcel, Zoning and Land Use boundary layers and 'roll-up' summaries of parcel development and valuation status developed by Dan Quinn and provided by MOA Information Technology Staff
Notes: These estimates incorporate 2009 Assessed Valuation and Development Status, but do not yet reflect revisions in 4-digit Land Use Codes which are being assigned to update current site usage of Industrially Zoned properties.
[1] Soil Limitation Ratings derived from GIS layers and documentation of Soil Survey of Anchorage, Alaska provided by MOA staff and USDA Natural Resources Conservation Service. Specific ratings by soil type derived from Table 13 - Building Site Development:Structures; Limitations for Small Commercial Structures*. Parcel ratings allocated by EPS, using weighted averages where parcel polygons intersected multiple soil types. Ratings are approximate, for broad-brush analysis and not a substitute for parcel-specific onsite evaluations.
[2] "Small commercial buildings are structures that are less than three stories high and do not have basements. The foundation is assumed to consist of spread footings of reinforced concrete built on undisturbed soil at a depth of 2 feet or at the depth of maximum frost penetration, whichever is deeper. The ratings are based on the soil properties that affect the capacity of the soil to support a load without movement and on the properties that affect excavation and construction costs. The properties that affect the load-supporting capacity include depthto a water table, ponding, flooding, subsidence, linear extensibility (shrink-swell potential), and compressibility (which is inferred from the Unified classification). The properties that affect the ease and amount of excavation include flooding, depth to a water table, ponding, slope, depth to bedrock or a cemented pan, hardness of bedrock or a cemented pan, and the amount and size of rock fragments."
[3] Government, Utility, and Institutional contacts have beeen made independently to determine development plans and estimate potential development capacity - these estimates will be added to the estimated supply from the Vacant/Unbuilt, Redevelopable Residential and Underutilized Non-Residential classes.
[4] Final parcel counts and acreages.
Search and Classification Criteria
Southwest Chugiak / Eklutna
Vacant Land by Soil Rating
Northwest Northeast Central Eagle River Study Area Totals
Subarea Geography
Prepared by EPS 3/30/2009 P:\18000\18615 Anchorage Industrial Land Assessment\Models\18615 DraftSupplyClass_032709.xls B-14
Appendix B
B-15
Redevelopable Residential
Industrially-Zoned Land with primarily residential surface use has been classified as Redevelopable Residential if it passes through the exclusionary criteria described above, and had a ratio of more than 5,000 square feet of land per residential unit OR a ratio of less than 0.75 of 2009 Building Assessed Value / Assessed Land Value, per end of year 2008 and Tax Year 2009 CAMA extracts and MUNIVIEW tables provided to EPS by MOA staff. Redevelopable Residential parcels located within industrial zones are therefore defined for this Study to include both relatively low densities of residential development for urbanized areas and relatively low-valuation of residential units compared to the value of the land they are occupying.
For Mixed-Use parcels having both residential and non-residential onsite uses, a more restrictive set of selection criteria have been applied, as such parcels can be generally well-developed even if the density and valuation of component individual uses to parcel totals may fall below the thresholds established for single-use development. Industrially-Zoned Land with mixed surface use has been classified as Redevelopable Residential if it had a ratio of more than 5,000 square feet of land per residential unit, AND a ratio of less than 0.75 of 2009 Building Assessed Value / Assessed Land Value, AND an overall Floor Area Ratio (FAR) of less than 0.10.
EPS also defined criteria to classify industrially-zoned parcels occupied by Unsound Residential Units (MOA GIS Land Use Code 1800) as Redevelopable Residential. In practice, no such parcels have been identified in the Study Area.
As was the pattern of distribution found for the Currently Undeveloped category, and as shown in Table B-1, the majority of the 86 parcels and about 50.5 acres of Redevelopable Residential land in the Study Area are located in the Anchorage Central and Chugiac/Eklutna Subareas. Similarly, the average size of parcels differs by Subarea, with the Anchorage Central Redevelopable Residential parcels averaging about 0.36 acres while the Chugiac/Eklutna Redevelopable Residential parcels average about 0.59 acres in size (see Table B-2).
The defined Redevelopable Residential selection criteria include:
Existing Land Use
The following MOA Planning/GIS Land Use classes and included sub classifications are assumed to be compatible with Redevelopable Residential status for additional or alternative Industrial development:
1000s – 1400s Single- and Multi-Family Residential, Mobile Homes and RV Parks, Group Quarters
1500s – 1700s Mixed Use Commercial/ Religious/ and Industrial/Residential
1800 Unsound Building Units
The following MOA Planning/GIS Land Use classes and included sub classifications are assumed to be incompatible with default assignment to Redevelopable Residential status for additional or alternative Industrial development:
Appendix B
B-16
1240 Parcels associated with mobile home park – no structure on lot
1900s Miscellaneous Residential-associated Uses
These exclusions are intended to prevent residential back yards, gardens, recreational yards and common space associated with existing residential buildings from being classified as vacant or underutilized. In practice, only 8 such parcels covering 1.61 land acres were found to be located on Industrially-Zoned land in the Anchorage Central Subarea – these were assigned to the Currently Developed category described below.
Development Thresholds
The following MOA current development densities and assessed valuation thresholds are assumed to be compatible with Redevelopable Residential status for additional or alternative Industrial development:
Land Sq. Ft. per Dwelling Unit > 5,000 Sq. Ft.
Building Value / Land Value < 0.75
Floor Area Ratio (FAR) < 0.10
Anchorage 2020 Development Suitability Ratings
Industrially Zoned Parcels which had previously been assigned a Suitability Rating of ‘0’, ‘1’ or ‘2’ – that is, ‘Not Rated’ ‘Suitable’ or ‘Marginally Suitable’ for assumed development, infill or redevelopment during the Anchorage 2020 buildout analysis, have been assumed to be Suitable for consideration of development before 2030 in this Study.
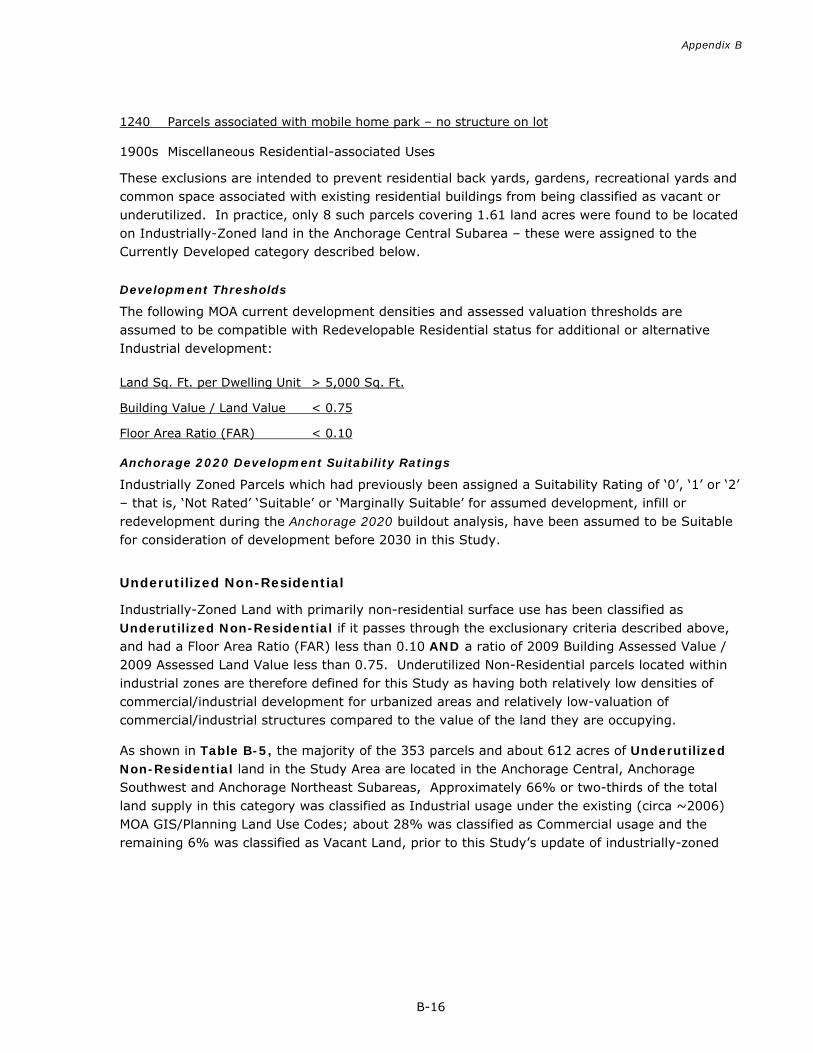
Underutilized Non-Residential
Industrially-Zoned Land with primarily non-residential surface use has been classified as Underutilized Non-Residential if it passes through the exclusionary criteria described above, and had a Floor Area Ratio (FAR) less than 0.10 AND a ratio of 2009 Building Assessed Value / 2009 Assessed Land Value less than 0.75. Underutilized Non-Residential parcels located within industrial zones are therefore defined for this Study as having both relatively low densities of commercial/industrial development for urbanized areas and relatively low-valuation of commercial/industrial structures compared to the value of the land they are occupying.
As shown in Table B-5, the majority of the 353 parcels and about 612 acres of Underutilized Non-Residential land in the Study Area are located in the Anchorage Central, Anchorage Southwest and Anchorage Northeast Subareas, Approximately 66% or two-thirds of the total land supply in this category was classified as Industrial usage under the existing (circa ~2006) MOA GIS/Planning Land Use Codes; about 28% was classified as Commercial usage and the remaining 6% was classified as Vacant Land, prior to this Study’s update of industrially-zoned

Table B-5Anchorage Bowl Industrial Land AssessmentPreliminary Industrial Zoning Districts - Underutilized Land Supply Estimates [1] [2] [3]
Parcel MOA LU Primary MOA LU Land Types Land Use Types Ival : Lval DU : Land Floor Area Suitability Acres Ownership Included (Prior Status) Excluded ratio ratio Ratio Classes Parcels Acres Parcels Acres Parcels Acres Parcels Acres Parcels Acres Parcels Acres Parcels Acres Parcels Acres
Private 2000 - 3700s, 8000
Underutilized/Unbuilt Non-Residential
1000-1900s, 3800s-7300s, 8100, 8200
> 0 < 0.75 < 0.10 0, 1, 2
0 - 20,000 Sq. Ft. 20 5.38 11 4.47 103 28 6 1.56 140 39.41
20,000 Sq. Ft. - 1 Acre 3 2.36 18 12.09 76 55 1 0.71 1 0.72 99 70.62
1 - 3 Acres 8 15.04 8 12.65 44 73.90 5 9.47 4 5.08 69 116.14
3 - 7 Acres 1 3.60 5 21.86 22 100.83 3 17.60 31 143.88
7 - 10 Acres 1 9.67 1 9.58 2 16.32 1 9.30 1 9.83 6 54.68
10 Acres+ 1 15.72 4 111.89 3 59.53 8 187.14
Totals by Subarea 0 0.00 33 36.04 44 76.36 251 385.67 19 98.17 1 9.83 5 5.80 353 611.87
"under_size"
Sources: Economic & Planning Systems, using MOA GIS Parcel, Zoning and Land Use boundary layers and 'roll-up' summaries of parcel development and valuation status developed by Dan Quinn and provided by MOA Information Technology Staff
Notes: These estimates incorporate 2009 Assessed Valuation and Development Status, but do not yet reflect revisions in 4-digit Land Use Codes which are being assigned to update current site usage of Industrially Zoned properties.
[1] Land Acreage adjusted by EPS to exclude areas with permanent/ standing water-coverage, tidal flats, low coastlands, etc.
[2] Government, Utility, and Institutional contacts have beeen made independently to determine development plans and estimate potential development capacity - these estimates will be added to the estimated supply from the Vacant/Unbuilt, Redevelopable Residential and Underutilized Non-Residential classes.
[3] Final parcel counts and acreages.
Search and Classification Criteria
Northwest Northeast Central Southwest Chugiak / Eklutna
Underutilized Land by Parcel Sizes
Eagle River Study Area Totals
Subarea Geography
Airport
Prepared by EPS 3/30/2009 P:\18000\18615 Anchorage Industrial Land Assessment\Models\18615 DraftSupplyClass_032709.xls B-17

Appendix B
B-18
parcels’ development status and assessed building and land valuation2. The average size of parcels differs by Subarea, with Anchorage Central Underutilized Non-Residential parcels averaging about 1.54 acres, Anchorage-Northeast about 1.74 acres and Anchorage-Southwest Underutilized Non-Residential parcels 5.17 acres (see Table B-5).
Table B-6 indicates over 340 of the 612 acres, 56%, is zoned I-1 or I-1 SL, while the remaining 272 acres, 44%, is zoned I-2 or I-2 SL. Table B-7 shows the Underutilized Non-Residential land in the Study Area sorted by soil limitation ratings.
The defined Underutilized Non-Residential selection criteria include:
Existing Land Use
The following MOA Planning/GIS Land Use classes and included sub classifications are assumed to be compatible with Underutilized Non-Residential status for additional or alternative Industrial development:
2000s – 2400s Commercial (Surface) Uses
3000s – 3700s Industrial (Surface) Uses
8000s (Previously) Vacant Land
Development Thresholds
The following MOA current development densities and assessed valuation thresholds are assumed to be compatible with Underutilized Non-Residential status for additional or alternative Industrial development:
Building Value / Land Value < 0.75
Floor Area Ratio (FAR) < 0.10
Anchorage 2020 Development Suitability Ratings
Industrially Zoned Parcels which had previously been assigned a Suitability Rating of ‘0’, ‘1’ or ‘2’ – that is, ‘Not Rated’ ‘Suitable’ or ‘Marginally Suitable’ for assumed development, infill or redevelopment during the Anchorage 2020 buildout analysis, have been assumed to be Suitable for consideration of development before 2030 in this Study.
2 As indicated in the following section of this Appendix, EPS has also linked and recorded updated (EOY 2008, BOY 2009) CAMA and MUNIVIEW land and site use and structure type designations for all of the Industrially-Zoned parcels, and has prepared Correlation Tables relating these MOA Property use codes to MOA GIS/Planning four-digit code equivalents.
Table B-6Anchorage Bowl Industrial Land AssessmentPreliminary Industrial Zoning Districts - Underutilized Land Supply Estimates [1] [2] [3]
MOA LU Primary MOA LU Zoning Types Land Use Types Ival : Lval DU : Land Floor Area Suitability Designation Ownership Included (Prior Status) Excluded ratio ratio Ratio Classes Parcels Acres Parcels Acres Parcels Acres Parcels Acres Parcels Acres Parcels Acres Parcels Acres Parcels Acres
Private 2000 - 3700s, 8000
Underutilized/Unbuilt Non-Residential
1000-1900s, 3800s-7300s, 8100, 8200
> 0 < 0.75 < 0.10 0, 1, 2
I-1 33 36.04 39 50.85 213 214.46 12 31.01 5 5.80 302 338.16
I-1 SL 1 1.42 1 0.71 2 2.13
I-1 SL 2 0 0.00
I-2 4 24.08 37 170.51 7 67.16 48 261.75
I-2 SL 1 9.83 1 9.83
I-3 SL 1 0 0.00
I-3 SL 2 0 0.00
Totals by Subarea 0 0.00 33 36.04 44 76.36 251 385.67 19 98.17 1 9.83 5 5.80 353 611.87
"under_zone"
Sources: Economic & Planning Systems, using MOA GIS Parcel, Zoning and Land Use boundary layers and 'roll-up' summaries of parcel development and valuation status developed by Dan Quinn and provided by MOA Information Technology Staff
Notes: These estimates incorporate 2009 Assessed Valuation and Development Status, but do not yet reflect revisions in 4-digit Land Use Codes which are being assigned to update current site usage of Industrially Zoned properties.
[1] The targeted Industrial Zoning Districts are I-1, I-2, I-3 and MI, as located in the Anchorage Bowl, Chugiak-Eklutna, and Eagle River subareas of the Municipality of Anchorage; the Anchorage Bowl Subarea has been further subdivided into six regions: Airport, Northwest, Northeast, Central, Southeast and Southwest.
[2] Government, Utility, and Institutional contacts have beeen made independently to determine development plans and estimate potential development capacity - these estimates will be added to the estimated supply from the Vacant/Unbuilt, Redevelopable Residential and Underutilized Non-Residential classes.
[3] Final parcel counts and acreages.
Underutilized Land by Zone
Eagle River Study Area Totals
Subarea Geography
Central Southwest Chugiak / Eklutna
Search and Classification Criteria
Airport Northwest Northeast
Prepared by EPS 3/30/2009 P:\18000\18615 Anchorage Industrial Land Assessment\Models\18615 DraftSupplyClass_032709.xls B-19

Table B-7Anchorage Bowl Industrial Land AssessmentPreliminary Industrial Zoning Districts - Underutilized Land Supply Estimates [1] [2] [3] [4]
Soil Soil MOA LU Primary MOA LU Limitation Limitation # Types Land Use Types Ival : Lval Floor Area Suitability Rating Range Ownership Included (Prior Status) Excluded ratio Ratio Classes Parcels Acres Parcels Acres Parcels Acres Parcels Acres Parcels Acres Parcels Acres Parcels Acres Parcels Acres
Private 2000 - 3700s, 8000
Underutilized/Unbuilt Non-Residential
> 0 < 0.75 < 0.10 0, 1, 2
Not Rated #N/A 2 11.30 24 137.32 6 75.62 32 224.24
Not Limited 0.00 - 0.00 5 5.11 1 10.81 1 1.11 7 17.04
Some Limitation 0.01 - 0.10 30 24.49 43 60.64 207 217.79 12 11.74 2 2.35 294 317.02
Moderate Limitation 0.11 - 0.25 1 15.72 4 6.04 1 9.83 6 31.59
Severe Limitation 0.26 - 0.50 3 6.41 3 6.41
Very Severe Limitation 0.51 - 1.00 1 0.24 8 12.99 2 2.34 11 15.58
Totals by Subarea 0 0.00 33 36.04 44 76.36 251 385.67 19 98.17 1 9.83 5 5.80 353 611.87
"under_soil"
Sources: Economic & Planning Systems, using MOA GIS Parcel, Zoning and Land Use boundary layers and 'roll-up' summaries of parcel development and valuation status developed by Dan Quinn and provided by MOA Information Technology Staff
Notes: These estimates incorporate 2009 Assessed Valuation and Development Status, but do not yet reflect revisions in 4-digit Land Use Codes which are being assigned to update current site usage of Industrially Zoned properties.
[1] Soil Limitation Ratings derived from GIS layers and documentation of Soil Survey of Anchorage, Alaska provided by MOA staff and USDA Natural Resources Conservation Service. Specific ratings by soil type derived from Table 13 - Building Site Development: Structures; Limitations for Small Commercial Structures. Parcel ratings allocated by EPS, using weighted averages where parcel polygons intersected multiple soil types. Ratings are approximate, for broad-brush analysis and not a substitute for parcel-specific onsite evaluations.
[2] "Small commercial buildings are structures that are less than three stories high and do not have basements. The foundation is assumed to consist of spread footings of reinforced concrete built on undisturbed soil at a depth of 2 feet or at the depth of maximum frost penetration, whichever is deeper. The ratings are based on the soil properties that affect the capacity of the soil to support a load without movement and on the properties that affect excavation and construction costs. The properties that affect the load-supporting capacity include depthto a water table, ponding, flooding, subsidence, linear extensibility (shrink-swell potential), and compressibility (which is inferred from the Unified classification). The properties that affect the ease and amount of excavation include flooding, depth to a water table, ponding, slope, depth to bedrock or a cemented pan, hardness of bedrock or a cemented pan, and the amount and size of rock fragments."
[3] Government, Utility, and Institutional contacts have beeen made independently to determine development plans and estimate potential development capacity - these estimates will be added to the estimated supply from the Vacant/Unbuilt, Redevelopable Residential and Underutilized Non-Residential classes.
[4] Final parcel counts and acreages.
Search and Classification Criteria
Airport Northwest Northeast Southwest Chugiak / Eklutna
Underutilized Land by Soil Rating
Eagle River Study Area Totals
Subarea Geography
Central
Prepared by EPS 3/31/2009 P:\18000\18615 Anchorage Industrial Land Assessment\Models\18615 DraftSupplyClass_032709.xls B-20

Appendix B
B-21
Currently Developed
Industrially-Zoned Land with primarily residential surface use has been classified as Currently Developed if it passes through the exclusionary criteria described above, and has a ratio of land per residential unit less than or equal to 5,000 square feet AND a ratio of 2009 Building Assessed Value / 2009 Assessed Land Value greater than or equal to 0.75, OR has been identified by the MOA as Economically Linked to other Currently Developed parcels.
Industrially-Zoned Land with primarily non-residential surface use has been classified as Currently Developed if it passes through the exclusionary criteria described above, has a Floor Area Ratio (FAR) greater than or equal to 0.10, OR has a ratio of 2009 Building Assessed Value / 2009 Assessed Land Value greater than or equal to 0.75, OR has been identified as Economically Linked to other currently developed parcels by MOA staff.
Currently Developed parcels located within industrial zones are therefore defined for this Study as having moderate to high densities of residential/commercial/industrial development for the Anchorage area and/or moderate to high valuation of residential/commercial/industrial units and structures to the land they are occupying. Development of these parcels with additional infill or alternative industrial development could therefore require displacement of well-established existing economic uses or extensive demolition or redevelopment of existing structures.
As indicated below, approximately 40% of the total acreage in this category has existing Industrial Land Use coding and thus may have (some) additional industrial infill capacity, but it is evident from both field work and inspection of historical and recent aerial views that many existing industrial establishments are intensive users of surface space for bulk outdoor storage, heavy equipment parking, assembly yards, etc., so that economically functional lot ‘coverage’ is often much greater than the associated permanent structures’ ‘footprints’.
As shown in Table B-1, the majority of the 1,130 parcels and about 1,565 acres of Currently Developed land in the Study Area are located in the Anchorage Central Subarea, containing about 53% of the acreage in this category, and the Chugiac/Eklutna Subarea, containing about 15% of the acreage in this category. The Anchorage-Northeast and Anchorage Northwest Subareas each contain about 190 acres or 12% of the category – together about 24% of the Currently Developed land.
The total land acreage in this category has been classified as 40% Commercial and 40% Industrial usage under the existing (circa ~2006) MOA GIS/Planning Land Use Codes; about 19% was previously classified as Vacant land and the remaining 1% was classified in Residential and Mixed Uses, prior to this Study’s update of parcels’ development status and assessed building and land valuation.
The defined Currently Developed selection criteria include:
Existing Land Use
The following MOA Planning/GIS Land Use classes and included sub classifications are assumed to be compatible with Currently Developed status:

Appendix B
B-22
1000s – 1400s Single- and Multi-Family Residential, Mobile Homes and RV Parks, Group Quarters
1240 Parcels associated with mobile home park – no structure on lot
1500s – 1700s Mixed Use Commercial/ Religious/ and Industrial/Residential
1900s Miscellaneous Residential-associated Uses
2000s – 2400s Commercial (Surface) Uses
3000s – 3700s Industrial (Surface) Uses
8000s (Previously) Vacant Land
The following MOA Planning/GIS Land Use classes and sub classifications were assigned to Unsuitable status, and have been excluded from the Currently Developed category to prevent double-counts of unique parcels and acreage:
3800s Utility-Related Facilities
4000s INSTITUTIONAL
5000s PARKS, OPEN SPACE, AND RECREATION AREAS
6000s TRANSPORTATION - RELATED
7000s R.O.W.s and Military Reservations
8100 Intertidal Areas
8200 Waterbodies
Development Thresholds
The following MOA current development densities and assessed valuation thresholds are assumed to be compatible with Currently Developed status:
Land Sq. Ft. per Dwelling Unit <= 5,000 Sq. Ft.
Building Value / Land Value >= 0.75
Floor Area Ratio (FAR) >= 0.10
Anchorage 2020 Development Suitability Ratings
Industrially Zoned Parcels which had previously been assigned a Suitability Rating of ‘0’, ‘1’ or ‘2’ – that is, ‘Not Rated’ ‘Suitable’ or ‘Marginally Suitable’ for assumed development, infill or redevelopment during the Anchorage 2020 buildout analysis, have been assumed to be Suitable for consideration of development before 2030 in this Study.
Add i t i ona l Techn i ca l D i scuss ion
In preparing the current Inventory of MOA Industrial Land, i.e., identifying MOA land parcels located in currently defined I-1, I-2, I-3 and MI Zoning Districts, and updating information about the physical characteristics, ownership, site use(s) and development status of those parcels, the EPS team assembled GIS map layers and data from several sources. These sources include:
Appendix B
B-23
• GIS map ‘layers’ in ESRI shapefile format, downloaded from the MOA GIS website: http://munimaps.muni.org/moagis/download.htm and provided by MOA staff. GIS Technician/Senior Cartographer Lisa Ameen, GIS Technician Terry Lamberson and GIS Tech II Brittni Kilborn have all been very generous with their expertise and very rapid in their response to EPS’ requests for data and technical assistance, and have taken pains to convey the origins, complexity, special characteristics and limitations, and potential sources of misunderstanding in the supplied data.
The shapefiles supplied by MOA GIS Services have as their defined projection and coordinate system State Plane Coordinate System 1983, Alaska 5004, Zone 4 (US Survey Feet). EPS has adhered to this standard in creating the Industrial Land Inventory shapefile, which comprises the parcel boundary digital map regions and the associated parcel attributes.
• GIS map ‘layers’ and data tables obtained from other government agencies, including 2000 and 2008 TIGER/Line shapefiles downloaded from ESRI and U.S. Census Bureau archives; Anchorage Soil Survey tables and documentation obtained from the Natural Resources Conservation Service; and USGS 1 degree Digital Elevation Map files downloaded from the WebGIS portal: http://www.webgis.com/terr_pages/AK/dem75/anchorageborough.html.
• Anchorage Computer Assisted Mass Appraisal (CAMA) and MUNIVIEW tables, documentation and custom data extracts provided by MOA Information Technology. Senior Systems Analyst Heidi Pollard provided invaluable guidance to EPS in dealing with the intricacies of the parcel appraisal and cadastral data, suggesting and coordinating assistance and special ‘roll-up’ parcel data extraction by MOA Contractor-Programmer Analyst Daniel W. Quinn.
Mr. Quinn suggested and programmed data extraction and reporting code that assembles Year 2009 parcel development (in terms of aggregate residential units, building counts and gross building square footage) and the associated building and land valuations, summarizing and assigning the aggregate development and AV measures at the ‘physical’/mappable parcel level. This greatly simplifies and accelerates access to data that would otherwise have required significant time and effort be expended by the Consultant Team, in tracing and correctly processing parcel development and valuation measures distributed across multiple CAMA data tables, ‘cards’ and property-lease relationships.
• The special parcel data extracts described immediately above, and correspondence tables of Anchorage CAMA land use codes and structure types to MOA GIS/Planning land use code equivalents constructed by EPS, in large part superseded the need to apply Alaska State Business License records obtained at the very beginning of the study from the Alaska State Department of Commerce, Community and Economic Development: http://www.commerce.state.ak.us/occ/buslic4.cfm. The State’s business license records are coded by industry using the North American Industry Classification System (NAICS) and have been helpful in a limited number of instances in supplementing data available from the MOA online Parcel Viewer: http://munimaps.muni.org/website/anchorage/application/map.htm to identify or confirm the location of specific industrial businesses during the interview and field check phases of the current study.
In follow-up and more extended land use studies within the MOA, EPS suggests the State Business License lists may have continuing utility, particularly if the full license database
Appendix B
B-24
contains more information about licensed establishments’ actual physical locations (which appears to be a requirement for issuance of a license) as opposed to the license-holders mailing address, and if both the MOA’s CAMA Parcel Site Address records and the State’s Business License Physical Address records were standardized to US Postal Office formats, possibly using services such as those offered to government researchers without charge by the University of Southern California GIS Research Laboratory: https://webgis.usc.edu/.
Data D i c t iona ry
The Industrial Land Inventory Data Dictionary is summarized as Table B-8, which shows the component data fields’ names, descriptions and formats. Table B-8 also indicates the data sources, indicating which data were assembled from CAMA, MUNIVIEW and GIS materials provided by the MOA, and which fields were assigned or calculated by EPS. Among the latter are: the development density ratios LSQFT_DU09 and FAR09, which are the calculated ratios of square feet of ‘land’ (excluding permanent water-body coverage) per dwelling unit for residentially-developed lots, and Floor Area Ratios; and IL_RATIO09, which is the calculated ratio of Aggregate Building Assessed Value to Aggregate Land Assessed Value, per calendar year 2009 tax valuations.
It should be noted the MOA’s CAMA database does not always include development data for tax-exempt properties, such as those owned by the Federal and State governments, and so the Inventory records for lots and parcels with Exemption Codes “A”, “F”, “2”, “3”, “4” and “9” (and possibly others) should be used with caution – EPS tagged several such parcels with a “B” flag in the LBFLAG_06 field to indicate visual confirmation of permanent surface structures, per 2006 and 2007 aerial views available in Google Earth. To ‘normalize’ variations in the prior assignment of Exemption Codes between CAMA fields EX_CD_1 and EX_CD_2, EPS created the field EX_CD_ASSM to assure uniform selection/filtering capability for parcels with Exemption Codes “A”, “F”, “2”, “3”, “4” and “9” .
For the purposes of this study, EPS used GIS tools to independently assign gross lot and parcel areas in acres, and subsequently adjusted these gross area estimates to exclude water coverage, as recorded in the EPS_ACRES, LAND_ACRES, WET_ACRES and LND_SF_ADJ fields. The MOA provided area fields AREA and LAND_SQFT have been included to allow comparison and, if necessary, future checks and revisions. Similarly, EPS created fields such as EPSROWID, PFC_LINK, DQS_ULNK, DQS_PLNK, and ELNK121208 to aid referential integrity when relating data across several GIS layers and CAMA and MUNIVIEW tables and extracts. Some of these linking fields, and the MOAs older SEQNUM fields, may now be superseded by the UNIQEID field created jointly by GIS and Information Services staff in late December, 2008 – EPS has recorded the UNIQUEID field as UNIQ123008.
During the Inventory and Supply analyses, EPS has made extensive use of parcel overlays created for Google Earth using our Google Earth Pro license and ArcGIS and MapInfo GIS applications. To assist future users of the Industrial Land Inventory, EPS has included the coordinates for each of the included lots and parcels as WGS84 Latitude and Longitude coordinates, recorded in the LAT_WGS84 and LON_WGS84 fields. The Google Earth overlays will be included in the Work Products for this Study in KML or KMZ format, along with the Inventory database and associated map layer in ESRI shapefile format.

Table B-8Anchorage Bowl Industrial Land AssessmentIndustrial Land Inventory Data Dictionary Summary [1] [2] [3]
Field FieldDesc Type Size Decimals Primary/Rollup Source
PARCEL_NUM 11-digit Parcel ID, No "-" MASK Text 11 MOA GIS 12/08/2008PLOT_CNT EPS-assigned count of GIS parcels sharing identical PARCEL_NUM attribute Numeric 11 0 MOA GIS, EPSSEQNUM Superseded unique link attribute for CAMA/GIS 'parcels' Text 10 MOA GIS 12/08/2008AREA GIS 'parcel' area in SqFT Float MOA GIS 12/08/2008LEN GIS 'parcel' perimeter in SqFT Float MOA GIS 12/08/2008ZONING_DES Zoning Designation, per 12/08/2008 Zoning shape file Text 9 MOA GIS, EPSZONING_GRP Zone (MOA Planning Dept. standard acronym) Text 4 MOA GIS, EPSGIS_LU_PRV Planning/GIS 4-digit Land Use Code (per 12/08/2008 shape file) Numeric 4 0 X MOA GIS, EPSGIS_LU_Y09 Planning/GIS 4-digit Land Use Code (per 2009 Update in progress) Numeric 4 0 X EPSSUIT_VCNT Suitability for development - (per Anchorage 2020 'vacant' parcel buildout analysis) Numeric 1 0 MOA GIS, EPSSUIT_UNDR Suitability for infill - (per Anchorage 2020 'underutilized' parcel buildout analysis) Numeric 1 0 MOA GIS, EPSSUIT_REDV Suitability for redevelopment - (per Anchorage 2020 'non-conforming' parcel buildout analysis) Numeric 1 0 MOA GIS, EPSEPSROWID EPS-assigned unique ordinal # for 12/08/2008 GIS parcel records Numeric 11 0 EPSSUBREGION MOA Regional Planning Subareas - per AEDC suggestions and GIS 'Community' shape files. Text 4 EPSUNIQ123008 Current unique link attribute for CAMA/GIS 'parcels' Numeric 11 0 MOA GIS, ITIND_FLAG EPS-assigned T/F flag for GIS parcels completely or mostly located in Industrial Zoning Districts Logical 1 EPSIND_SPLIT EPS-assigned T/F flag for GIS parcels 'split' by Industrial Zoning District boundaries Logical 1 EPSEPS_ACRES GIS 'parcel' area in Acres (polygon area - may include water-coverage) Float EPSLAND_ACRES GIS 'parcel' land area in Acres (land area - excludes water-coverage, tidal flats, low coastlands) Float MOA GIS, EPSWET_ACRES GIS 'parcel' wetland area in Acres (wetland area - per MOA GIS wetlands layer) Float MOA GIS, EPSWET_TYPE GIS 'parcel' wetland type - per MOA GIS wetlands layer Text 10 MOA GIS, EPSMAP_COMMNT Platting comment(s) Text 60 MUNIVIEW_PARCEL 12/08/2008PFC_LINK EPS-assigned T/F flag checking match on PARCEL_NUM to 1/08/09 MUNIVIEW_PARCEL file Logical 1 EPSDQS_ULNK EPS-assigned T/F flag checking unique match on PARCEL_NUM to 1/12/09 Quinn Summary File Logical 1 EPSDQS_PLNK EPS-assigned T/F flag checking match on PARCEL_NUM to 1/12/09 Quinn Summary File Logical 1 EPSELNK121208 Economic Link - Unique Ordinal # assigned to Economic Linkage Polygons in MOA-provided coverage. Numeric 11 0 MOA GIS, EPSY09_LND_AV Aggregate Current tax year land value Numeric 11 0 X QUINN SUMMARY 'ROLL-UP' 01/12/2009Y09_BLD_AV Aggregate Current tax year building value Numeric 11 0 X QUINN SUMMARY 'ROLL-UP' 01/12/2010Y09_TOT_AV Aggregate Current tax year value of property Numeric 11 0 X QUINN SUMMARY 'ROLL-UP' 01/12/2011LAT_WGS84 Parcel Centroid 'Y' Coordinate (WGS84 Latitude) Numeric 11 6 EPSLON_WGS84 Parcel Centroid 'X' Coordinate (WGS84 Longitude) Numeric 11 6 EPSCLASS_CD Class of parcel [Residential, Commercial] Text 17 MUNIVIEW_BOTH 12/08/2008APPLUCD Appraisal/Property 3-digit Land Use Code (per 12/08/2008 MUNIVIEW_BOTH file) Numeric 3 X MUNIVIEW_BOTH 12/08/2008LD_USE_CD Land Use Description Text 24 X MUNIVIEW_BOTH 12/08/2008STRCT_TYPE Structure type description [Apartment, Hotel, Nursing home, etc.] Text 25 X MUNIVIEW_COMMERCL 12/08/2008VDO V=vacant, D=Dwelling, O=Other (Superseded; used as crosscheck for other fields) Text 1 MUNIVIEW_BOTH 12/08/2008RENUMBR_ID Previous Parcel ID. Parcel may be renumbered and/or replatted Text 13 X MUNIVIEW_PARCEL 1/08/2009OWN_NAME_1 Owner Name, Part 1/3 Text 30 MUNIVIEW_PARCEL 1/08/2009OWN_NAME_2 Owner Name, Part 2/3 Text 30 MUNIVIEW_PARCEL 1/08/2009OWNER_ADDR Owner Mailing Address (Unparsed 'Street' Address) Text 30 MUNIVIEW_PARCEL 1/08/2009CITY Owner Mailing Address City Text 16 MUNIVIEW_PARCEL 1/08/2009STATE Owner Mailing Address State Text 2 MUNIVIEW_PARCEL 1/08/2009ZIP_CODE Owner Mailing Address 5-digit ZIP Area Text 5 MUNIVIEW_PARCEL 1/08/2009ZIP_BLOCK Owner Mailing Address 4-digit ZIP Suffix Text 4 MUNIVIEW_PARCEL 1/08/2009SITE_ADDR Site Address (Unparsed 'Street' Address) Text 40 MUNIVIEW_PARCEL 1/08/2009ST_EXMP_CD State exemption code Text 1 X MUNIVIEW_PARCEL 1/08/2009STATE_EXCD State exemption code description Text 15 X MUNIVIEW_PARCEL 1/08/2009EX_CD_ASSM Exemption code assumed for Industrial Land Inventory Study (EPS checks of leases and ownership) Text 1 EPSEX_CD_1 Exemption code one Text 1 X MUNIVIEW_PARCEL 1/08/2009EX_CD_1_LB Exemption code description one Text 21 X MUNIVIEW_PARCEL 1/08/2009EX_CD_2 Exemption code two Text 1 X MUNIVIEW_PARCEL 1/08/2009EX_CD_2_LB Exemption code description two Text 21 X MUNIVIEW_PARCEL 1/08/2009MAP_KEY 8 character parcel ID for tie to mapping Text 8 QUINN SUMMARY 'ROLL-UP' 01/12/2009MKEYLOTS EPS-assigned count of GIS parcels sharing identical MAP_KEY attribute Numeric 11 0 EPS, QUINN LEASE 'ROLL-UP' 01/12/09RES_UNITS Total number of living units on 'physical' parcel Numeric 11 0 X QUINN SUMMARY 'ROLL-UP' 01/12/2009LAND_SQFT Land Area in SqFt Numeric 11 0 QUINN SUMMARY 'ROLL-UP' 01/12/2009YEAR_BUILT Original date of construction Numeric 5 0 MUNIVIEW_COMMERCL 12/08/2008EFF_YEAR_B Effective year built Numeric 5 0 MUNIVIEW_COMMERCL 12/08/2008LND_SF_ADJ Adjusted Land Area in SqFt - excludes water-coverage, tidal flats, low coastlands Numeric 11 0 EPSNBR_BLDGS Total number of buildings on 'physical' parcel Numeric 11 0 X QUINN SUMMARY 'ROLL-UP' 01/12/2009BLDG_AREA Total GBA in SqFt on 'physical' parcel Numeric 11 0 X QUINN SUMMARY 'ROLL-UP' 01/12/2009BLDG_COVER Total built coverage (ground floor SqFt) on 'physical' parcel Numeric 11 0 X QUINN SUMMARY 'ROLL-UP' 01/12/2009BLDG_STORY Maximum floor levels on 'physical' parcel Numeric 11 0 X QUINN SUMMARY 'ROLL-UP' 01/12/2009CLASS 'Binary' Class of parcel [Residential, Commercial] Text 1 X QUINN SUMMARY 'ROLL-UP' 01/12/2009CONDO_CNT Total number of condominium units on 'physical' parcel Numeric 10 0 X QUINN SUMMARY 'ROLL-UP' 01/12/2009APTMT_CNT Total number of apartment units on 'physical' parcel Numeric 10 0 X QUINN SUMMARY 'ROLL-UP' 01/12/2009LEASE Active Lease Flag ('Y' or ' ') Text 1 QUINN SUMMARY 'ROLL-UP' 01/12/2009LEASE_CNT Active Lease Count Numeric 11 0 X QUINN SUMMARY 'ROLL-UP' 01/12/2009IL_RATIO09 Aggregate building value (2009) / Aggregate land value (2009) Numeric 9 2 EPSLSQFT_DU09 Adjusted Land Area in SqFt / Total # of living units on 'physical' parcel Numeric 9 2 EPSFAR09 Floor Area Ratio : Total GBA in SqFt / Adjusted Land Area in SqFt Numeric 9 2 EPSBSDS_SCM Soil Suitability/Limitation Rating for Small Commercial Structures Numeric 5 2 X EPS, USDA Anchorage Soil SurveyWET_LAND Wetland legislated condition Text 13 X MUNIVIEW_BOTH 12/08/2008LBFLAG_06 'Snapshot' impression of parcel surface development status, per Google Earth and 2006 MOA imagery Text 1 EPS, for selected parcelsSUPPLY_CAT Industrial Land Supply Category and Land Use Group Code Text 7 EPSSUPPLY_GRP Industrial Land Supply Group Code Text 3 EPSGEOTIF_06 Aerial 'tile' location, per USGS index, for use with 2007 MrSID Aerials of Anchorage Bowl Text 15 USGS
"diction_summ"
Sources: MOA GIS datasets and metadata; Economic & Planning Systems.
Notes: [1] The field list, data types and sizes indicated above are draft and subject to change during collaboration with MOA staff.[2] The Inventory Work Product will include an ArcView shapefile, using Alaska State Plane Coordinate System, Zone 4, (1983 U.S. Survey Feet) as the default projection.[3] Fields with Yellow Backgrounds are 'scaffolding' aids that may be dropped from final Industrial Land Inventory Deliverable.
Prepared by EPS 3/31/2009 P:\18000\18615 Anchorage Industrial Land Assessment\Models\18615 Tble B-8 WP_Format_030109.xlsB-25