industrial forensics article pt - pharma manufacturing...agile contamination identification ......
TRANSCRIPT

Pharmaceutical Manufacturing
Incorporating Industrial Forensics into a Quality by Design Approach for Foreign Particulate Matter Characterization
By Julianne Wolfe*, Karen Smith and Linxian Wu, Ph.D. RJ Lee Group, Inc., Monroeville, PA 15146
(Editor’s Note: This article appears as a two‐part series in Pharmaceutical Manufacturing magazine in October and Nov/Dec 2011. Copyright © 2011 by Putman Media.) A New Era of Quality In the life science industries, Foreign Particulate Matter (FPM), sometimes simply called Particulate Matter (PM), frequently is referred to as the contaminating components existing in solid forms in final pharmaceutical and biopharmaceutical products. This particulate matter can exist in many different sizes, shapes and chemical compositions. Most pharmaceutical and biopharmaceutical products are specified to be essentially free of visible particulates and are obligated to meet specifications limiting the number of sub‐visible particulates (USP/EP/JP). FPM can affect product efficacy, but more importantly product safety. While data from controlled human studies are not available due to ethical considerations, numerous animal studies have been conducted to evaluate the potential adverse effects and the possible destinations of intravenously injected particles (1, 2, 3). The concerns for the adverse effects of FPM on humans have been clearly articulated for likely having triggering effects on aspects of both toxicity and immunogenicity (4, 5). The critical importance of the investigation and characterization of FPM in the manufacturing processes has been highlighted by recent legal and the regulatory actions taken by the FDA against some of the most established pharmaceutical, biopharmaceutical and healthcare firms in the United States (6, 7, 8, 9). In addition, numerous recent product recalls have also been initiated due to FPM contamination issues (10, 11, 12). These actions clearly point out that new methods are needed to efficiently characterize FPM and reduce lost product while increasing safety. All pharmaceutical and biopharmaceutical firms follow compendial testing requirements which set standards for inspection of visible particulate, and also for examining the size and quantity of sub‐visible particulate in final products. These quality control mechanisms would typically be employed at the end of the production cycle. It is not unusual that visibility of the FPM would occur only after the products are released and shipped to the customer destination to be reported by the customers. Presumably, under those circumstances, the visible FPM in the products could derive from the sub‐visible particulate due to aggregation, agglomeration, precipitation or settling during the transportation processes. This type of outcome particularly poses specific challenges to the current inspection mechanisms in controlling FPM contamination. Furthermore, none of the existing compendial methods employed for analyzing FPM calls

Pharmaceutical Manufacturing
for the characterization of potential contaminating materials which would facilitate source identification. It may not be unrealistic and unreasonable, in our opinion, to consider the current FPM inspection and examination methods as reactive “Quality by Inspection” methods. During recent years, the concept of “Quality by Design” (QbD) has been gaining momentum in its acceptance and adaptation. The application of the concept into the life science industries has been well explained and established by the FDA (sometimes referred as Pharmaceutical Quality by Design) (13, 14). More and more drug manufacturers are participating in the FDA’s CMC (Chemistry, Manufacturing, and Control) pilot program for product submission. This program requires the incorporation of QbD into the product by accomplishing process design and development in a different and specific way. The QbD concept places emphasis on systematically understanding and determining the critical quality attributes (CQAs) related to the process, risk assessments for those critical attributes and the associated control strategies. Due to the critical importance of FPM contamination, we believe that a systematic approach in understanding, monitoring and characterizing FPM will enhance the product quality as a whole because these preventive procedures will increase understanding and decrease FPM variability. This proactive approach parallels QbD concepts more readily than the reactive approach of current compendial methods described above. Agile Contamination Identification Let us first address the limitations of the current reactive methods for FPM determination. These methods which rely on techniques such as light obscuration, light scattering or microscopy are only able to provide size, quantity and in some cases morphology information. Therefore a new characterization regimen is required so that FPM can be identified and subsequently sourced. The forensic trace evidence characterization mechanism, in our view, can be applied here. The principles and techniques employed in this type of characterization are applicable in FPM investigations for three important reasons. First, forensic trace evidence characterization is economical in its use of sample material. A single fiber transfer or small particulate transfer (such as glass or soil) is a reality. As in the criminal forensic application, FPM exists in minute amounts and will need to be handled with great caution. Since FPM tends to be in the barely visible or sub‐visible range, the economic use of materials is critically important. Second, the characterization regimen utilized in trace evidence is very efficient. A full characterization can be performed in hours. This allows for faster interpretation and consideration of data and ultimately faster investigations. Third, the characterization regimen is very diverse. Many of the trace materials collected for criminal forensic investigations are actually frequently found in the FPM investigations including items such as fibrous material, polymers, paint, building materials and more. Most importantly, in forensic trace evidence characterization, the origin of materials is investigated extensively and necessarily. While current compendial methods do not require source materials to be characterized as part of a proactive approach, we firmly believe that this type of source material characterization in both physical and chemical compositions will be necessary for understanding the potential for foreign particulate contamination in a QbD environment. Based on our experience, we consider that a tiered forensic characterization will provide a comprehensive understanding of FPM and potential source materials. The characterization regimen employs three major components: Optical Microscopy, Fourier Transform Infrared Spectroscopy (FTIR), and Scanning Electron Microscopy /Energy Dispersive X‐ray Spectroscopy (SEM/EDS). Their respective utilities follow.

Pharmaceutical Manufacturing
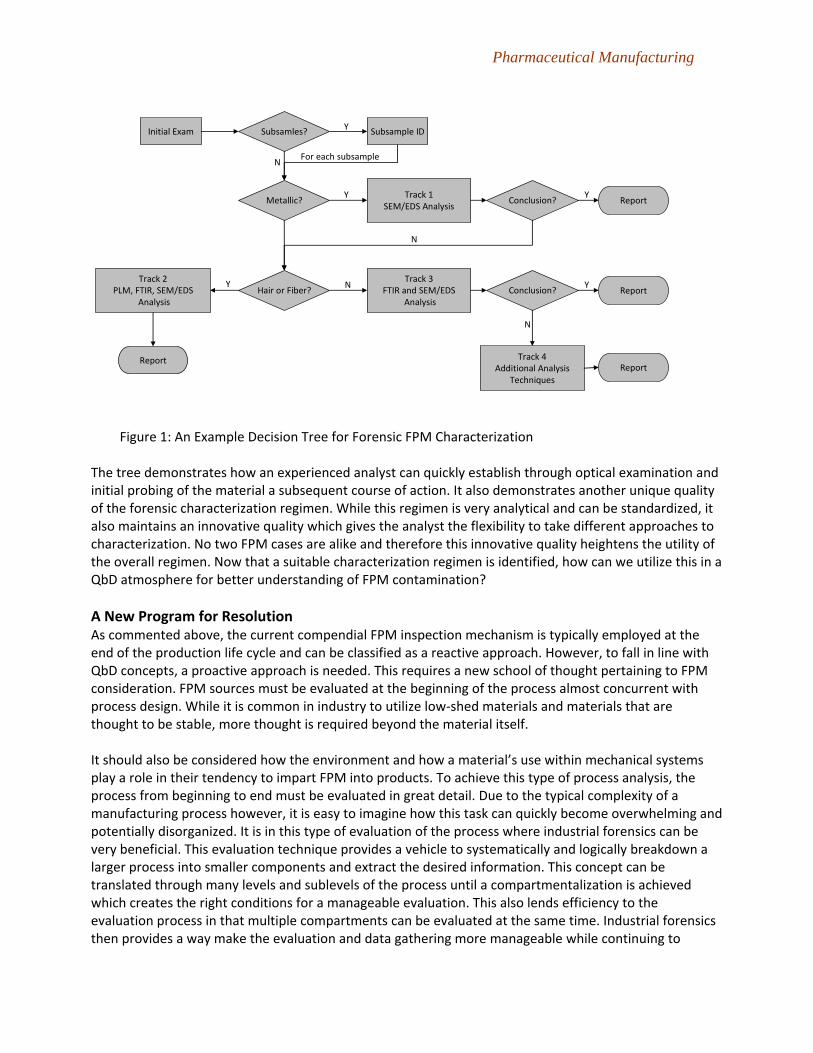
Optical Microscopy: This component indicates important physical properties of the sample such as morphology, color and size. During this first tier of evaluation, probing the material allows analysts to discern additional physical properties such as whether the material is tacky, polymeric, brittle, hard or soft, etc. Optical examination must be done in a controlled environment so the integrity of the original sample is maintained. A laminar flow environment is ideal to ensure cleansing of the environment during preparation and that no contamination to the original sample material occurs. FTIR: This component provides molecular information about a sample supplying details regarding organic and some inorganic functional groups. The efficiency of the technique and the availability of well established and comprehensive spectral searching libraries are highlights of its utility. FTIR is used principally for materials that appear to be organic during the microscopic optical examination process. However it is utilized in numerous other instances as well to provide confirmatory information for SEM/EDS. SEM/EDS: This component provides a technique for additional high magnification imaging (SEM) as well as accompanying elemental analysis of the material (EDS). The imaging component allows for additional information gathering regarding the morphology of the sample and also will indicate the degree of homogeneity. Quite often, a matrix material is experienced that contains various inclusions of other materials or types of surface particulate. These inclusions or surface particulate are additional items that can be considered when comparing unknown samples to source materials or trending FPM investigations. EDS indicates the elements that are present within the material(s). This serves as the major confirmatory technique to FTIR analysis and also provides information for inclusions or surface particulate which are not in enough abundance to contribute to the FTIR spectrum of the material. While the three core components of optical microscopy, FTIR and SEM/EDS serve to identify the great majority of materials, additional techniques are also useful and can be called upon in certain situations. For example, Raman spectroscopy can be complimentary to FTIR for analyzing materials that are dark in color and exhibit poor reflectance, are thought to be corrosion materials, charred material and in identifying some inorganic species like graphite. In these instances, Raman can provide more definitive information over FTIR but can still be utilized comprehensively in conjunction with the other information to arrive at a conclusion. Another example is to utilize polarized light microscopy (PLM) as an extension of the initial optical evaluation. This technique is particularly useful in situations where fibrous material is encountered and is thought to be from a fabric or biological in nature (i.e. a human or animal hair). The interference colors displayed by some materials during this analysis lend information to their natural or synthetic origin. Between PLM and SEM, scale patterns can be discerned for hair samples to indicate origin and the presence or absence of features like a medulla provide information. An example decision tree for this type of characterization regimen is provided in Figure 1.
Pharmaceutical Manufacturing
Figure 1: An Example Decision Tree for Forensic FPM Characterization
The tree demonstrates how an experienced analyst can quickly establish through optical examination and initial probing of the material a subsequent course of action. It also demonstrates another unique quality of the forensic characterization regimen. While this regimen is very analytical and can be standardized, it also maintains an innovative quality which gives the analyst the flexibility to take different approaches to characterization. No two FPM cases are alike and therefore this innovative quality heightens the utility of the overall regimen. Now that a suitable characterization regimen is identified, how can we utilize this in a QbD atmosphere for better understanding of FPM contamination? A New Program for Resolution As commented above, the current compendial FPM inspection mechanism is typically employed at the end of the production life cycle and can be classified as a reactive approach. However, to fall in line with QbD concepts, a proactive approach is needed. This requires a new school of thought pertaining to FPM consideration. FPM sources must be evaluated at the beginning of the process almost concurrent with process design. While it is common in industry to utilize low‐shed materials and materials that are thought to be stable, more thought is required beyond the material itself. It should also be considered how the environment and how a material’s use within mechanical systems play a role in their tendency to impart FPM into products. To achieve this type of process analysis, the process from beginning to end must be evaluated in great detail. Due to the typical complexity of a manufacturing process however, it is easy to imagine how this task can quickly become overwhelming and potentially disorganized. It is in this type of evaluation of the process where industrial forensics can be very beneficial. This evaluation technique provides a vehicle to systematically and logically breakdown a larger process into smaller components and extract the desired information. This concept can be translated through many levels and sublevels of the process until a compartmentalization is achieved which creates the right conditions for a manageable evaluation. This also lends efficiency to the evaluation process in that multiple compartments can be evaluated at the same time. Industrial forensics then provides a way make the evaluation and data gathering more manageable while continuing to
Initial Exam Subsample IDSubsamles?
Metallic?Track 1
SEM/EDS AnalysisReport
Hair or Fiber?Track 2
PLM, FTIR, SEM/EDSAnalysis
Report
Track 3FTIR and SEM/EDS
Analysis
Track 4Additional Analysis
Techniques
Conclusion?
Y
NFor each subsample
Y Y
N
Y NReportConclusion?
Y
Report
N

Pharmaceutical Manufacturing
maintain core QbD principles. This compartmentalization exercise will conclude in a work product that is essentially a detailed and well understood list of source materials. Table 1 provides some common materials that might be considered against a simplified pharmaceutical example. The list of these materials is by no means exhaustive. Additionally, each individual process will have a unique set of materials inherent to that specific process.
Table 1. Commonly Encountered Source Materials Process Common Contaminating Materials Receiving The greatest potential for contamination here is due to packaging
materials. Sources include cardboard, plastics (wrapping materials, pallets, drums, buckets, bags, packing straps, tape), paper and pallet materials.
Intermediate and Product Production
Materials most commonly seen are from filtration media/apparatus, components found in blending apparatus (stainless steel, gasket materials, etc.), components found in mixing apparatus (stir bars, fan components, etc.) and separation media.
Fill/Finish These materials are typically comprised of the final vessel selected for product distribution. Sources include glass vials, septa, closures and syringe components. For solid dosage forms this could encompass testing compression tooling, lubricants, and release agents.
Packaging Sources for this component include paper, cardstock, cardboard, plastic, foil, inks or pigments.
Secondary Sources FPM that is inherent to storage vessels, tubing, final product vessels or other permanent and/or disposable apparatus as received from the vendor of these products.
Environmental Contaminants (throughout processes)
Garments (bouffants, suits, lab coats, gloves, etc.), cleaning materials (such as wipes, mops, detergents, etc.), facilities (carpeting, HVAC, etc.), people (hair, skin cells).
After identifying a comprehensive list of potential contributing components the proactive approach really takes shape in the characterization of these components. But characterization of all of these components may not be warranted and immediately cost effective. Therefore, risk assessment must be conducted to evaluate and analyze CQAs related to FPM. Depending on the nature of the process, all of these components will have varying levels of risk associated with their potential to reveal themselves in the final product. Packaging operations provides a good example of risk assessment. For a parenteral product, the system will be closed once it reaches the packaging phase of the process. Therefore, there is lower risk that the packaging material can impart FPM into the product. However, for a solid dosage form that is being packaged into a blister pack the risk is much higher. The packaging materials are coming into direct contact with the product and have a high potential to contaminate it. Two additional categories which are not inherent to the actual manufacturing process should also be considered in the overall evaluation of the potential for FPM contamination. The first of these is environmental sources. Everything within the environment of the manufacturing process has the potential to impart FPM into the final product. People shed hair and skin cells, the gowning items that are

Pharmaceutical Manufacturing
worn and the actual facilities themselves can also contribute. It can not be discounted that even though most of the items utilized are designed to be low shedding materials that they can end up in final products as contamination. The second category is secondary contamination sources. Many of the items that are utilized in a manufacturing process in and of themselves contain a set of FPM that is inherent to their manufacturing process. Because these inherent FPM sources exist in each of the products, they then become a potential source for contamination in the processes they are used in. While these sources are labeled as secondary, they can often times become the most important aspect of potential source sample identification and should not immediately be discounted. An example of a commonly encountered secondary source is disposable plastic storage bottles. Characterization of the FPM inherent to these sources commonly identifies polymer material (presumably remaining from the manufacturing process), fibrous material and packing materials like cardboard. It can not be assumed that since these vessels are sterile that they are also particle free and therefore should be considered and characterized as potential sources for FPM. A detailed forensic characterization on the components designated as high risk should follow such an analysis so that monitoring and control strategies can be established and implemented as timely as possible. Forward Solutions for Established Processes The model of an industrial forensic approach utilizing forensic characterization methods is mostly utilized in a proactive capacity. However, this approach is also unique in that it can be applied to already established production processes. There are two schools of thought on this subject. First is to work backward through the evaluation process. Start from compartments such as packaging or fill/finish operations since traditionally, these operations have more risk associated with imparting FPM into the finished product. Then, use the industrial forensic approach to work back toward receiving to identify potential source materials. The positive to utilizing this backward approach is that the industrial forensic technique is still being employed and organization and manageability of the process are maintained. The negative aspect to using this backward approach is that investigations will be lengthened due to having to amass all of this data up front prior to resolving any issues. The second school of thought is to utilize existing particulate as a guide. Start with evaluating FPM that has already been identified in the finished product. With this information, a smaller collection of potential source materials can be identified and subsequently tested for comparison to the unknown material. The positive to using this existing particulate approach is that you are addressing a current issue within the product and also that a smaller amount of data is gathered which can lead to closing investigations faster. The negative aspect to using the existing particulate approach is that the organization and systematic evaluation afforded by industrial forensics is lost. There is a tendency to settle into an iterative process where some FPM is identified and a few source materials are tested. Then a different FPM material is identified and a few more source materials are tested. This iterative approach eventually leads to manageability issues because the organizational component is missing. There are also miscommunication issues as multiple contacts often participate in investigations and may not be aware of each other’s activities. The best approach to employ is a hybrid of these two schools of thought. First, start with the FPM that is already in the product so the immediate issue can be addressed. Amass a small collection of source materials for quick resolution. But, in parallel, utilize that organized and systematic approach with industrial forensics (either working forward or backward through the process) to identify source materials so that all future FPM investigations not involving that original material type are also facilitated.

Pharmaceutical Manufacturing
It has been recognized that forensic characterization is an ideal model for FPM characterization and that this characterization regimen can be employed very effectively using industrial forensics for a QbD approach to understanding FPM sources. Let us now turn to the guidance surrounding such a proactive approach to FPM consideration and we find that very little guidance is provided. Firms are indicated to have products “essentially free from visible particulates” or to adhere to “appropriate acceptance criteria for particulate matter” (15, 16), to have a thorough understanding of their process (13, 14, 17), are provided with methods to evaluate FPM in finished products (15) and are responsible for identifying root cause (18, 19, 20). However, there is nothing that describes how to utilize all of these items in conjunction to construct a proactive program and how exhaustive that program should be. We believe there are very real questions that must be addressed to provide direction when it comes to establishing boundaries for formulating a proactive and encompassing FPM program. For example, is it necessary to evaluate secondary sources immediately? Even with established risk assessment procedures, the situation has been encountered where incorrect assumptions of contamination potential from secondary sources resulted in a low risk assessment. In these situations, there have been significant consequences in terms of the FPM loading within the final product. Currently, it is the trend in industry to test these components only reactively. There also needs to be more guidance on how to handle anomaly situations. For example, how does one handle the identification of one single anomaly particle within a batch of material after all inherent potential source samples have been investigated? Are firms expected to then investigate every manufacturing process of every component within the process to determine the source? Where do you stop and still have the investigation considered to be thorough? As we move forward and more establishments wish to achieve QbD and wish to utilize this proactive approach, the community will need to stir some discussion on the topic. The industry and the regulatory agencies must work together to establish best practice guidelines. This guidance should be delivered by the regulatory agencies but it should be formed from information supplied by the industry. This ensures that the guidance developed is comprehensive enough but realistic and feasible at the same time. Without this guidance, the industry will continue to have a very subjective view of FPM management and continue to struggle with variability and lack of understanding. Providing additional guidance will result in a more industry wide standard so that all manufactures are being consistent and will provide the potential for validation initiatives to be developed. This standardization will ultimately serve to assist everyone in the life science industries as more detailed investigations continue to occur and new understanding of material behavior is realized. Data Reduction The last area to consider in terms of a proactive approach to FPM understanding and control is how we effectively use the multitude of data that is produced in such an evaluation. Each of these data points in and of themselves is relatively invaluable. It is how we put all of this information together and utilize it that gives it its value. It would not be ideal to continue to utilize manual methods because of the quantity of data that is generated during source sample evaluation (i.e. sifting through physical reports, relying on memory, using the limited search capabilities in Excel or Access). Therefore, it is suggested that an appropriate vehicle for data search assistance is identified. This vehicle should afford access to text information regarding a sample but also, in the same software, the ability to access accompanying analytical data. Table 2 details the minimum functionality and suggested information that should be captured.

Pharmaceutical Manufacturing
Table 2. Functionality and Suggested Information Functionality Description Text Input Captures details regarding sample product site, sampling location,
sampling technician, lot/batch numbers, sampling conditions, technician observations, vendor information (for source materials)
Data Input Data is uploaded and can be observed directly with text information including items like optical imagery, spectroscopic analysis, elemental analysis, chromatographic analysis
Query All input (text and data) should have the ability to be searched, basic query abilities can also facilitate summary reporting and trending
Comparison Data comparison directly within the program eliminates the need for multiple sources and makes source determination more efficient
For example, if a blue fiber is identified in a finished product, the package should allow the user to search for any blue fiber within the historical sample population. This would include both known and unknown materials. Once these candidates are identified, their text information and analytical data can be compared to the sample of interest to either source sample or trend. With these types of utilities in a vehicle for search assistance, historical sample polling can occur in minutes, which ultimately shortens investigation time due to the efficiency. To highlight the effectiveness of applying the industrial forensic approach into QbD for FPM characterization, we would like to share the following three case studies. They will build upon one another by demonstrating the core ability of the forensic characterization in Case Study 1 and highlighting a reactive approach followed by a proactive approach scenario in Case Studies 2 and 3, respectively. Case Study 1: Thorough Forensic Characterization The nonconformity in the first case study is an unidentified needle‐like particulate contamination. The needle‐like particles were observed amongst liquid in a plastic bottle being used for a stability study. The manufacturer had indicated the particles were appearing in the bottles after the product was incubated at a very high temperature. Figure 2 (below) depicts an optical image with the needle‐like particles annotated. The first step in the process was to isolate the sample of interest. A filtration technique was performed to isolate the particles due to their size (approximately 2μm wide by 500μm long). Once isolated on the filter substrate, the forensic characterization regimen was then performed. Optical analysis was employed which extended into utilizing PLM due to the morphology of the particles. PLM provided higher magnifications which enabled the confirmation of the needle like structure. The micrograph also revealed the particles were crystal‐like and had a very distinct morphology as shown in Figure 3.

Pharmaceutical Manufacturing
Figure 2: Optical Image of Needle‐like Particles Stemming from a Stability Study Nonconformance
Figure 3: High Magnification Optical Micrograph Showing Needle‐like Particle Morphology
Needle‐like Particles
Needle‐like Particles

Pharmaceutical Manufacturing
The filter was then directly utilized as the substrate for SEM/EDS analysis. SEM complimented the optical data by confirming the long, thin morphology and relative size of the particles. EDS evaluation revealed a carbon rich material as indicated in Figure 4.
Figure 4: SEM/EDS Evaluation of Needle‐like Particle (a) SEM image at 2,500x showing general morphology, (b) higher magnification SEM image at 4,200x showing more detailed morphology (c) EDS spectrum showing the particle to be carbon rich.
The FTIR analysis of an isolated needle resulted in a very distinct spectrum. A library search was performed on this spectrum which resulted in a high quality match with a complex, organic oxidizing agent. Additional research was performed regarding this material and revealed that it was commonly used as a polymer additive. Raman spectroscopy in addition was utilized because the FTIR spectrum was unusually complex. This allowed for another distinct type of characterization and enabled comparison to additional spectral libraries. The Raman spectral searching yielded the same result as the FTIR placing
a b
c

Pharmaceutical Manufacturing
both techniques in agreement. At this point a vendor of this raw material was identified and a small sample of the oxidizing agent was obtained for reference purposes. The reference material was also subjected to FTIR and Raman spectroscopy for comparative analysis. The result found that the unknown needle‐like particles were nearly identical in chemical structure to the oxidizing agent reference material. Spectral comparisons for FTIR and Raman data between the needle‐like particles and the oxidizing agent reference material are shown in Figure 5.
100015002000250030003500Wavenumber (cm-1)
0.00
0.02
0.04
0.06
0.08
Abs
orba
nce
100015002000250030003500Wavenumber (cm-1)
0.00
0.02
0.04
0.06
0.08
Abs
orba
nce
500 1000 1500 2000 2500 3000 3500 4000Raman Shift (cm-1)
5010
015
020
025
030
0R
aman
Inte
nsity
500 1000 1500 2000 2500 3000 3500 4000Raman Shift (cm-1)
5010
015
020
025
030
0R
aman
Inte
nsity
a
b
Needle‐like Particle
Reference Material
Needle‐like Particle
Reference Material

Pharmaceutical Manufacturing
Figure 5: FTIR (a) and Raman (b) Spectral Comparison of the Needle‐like Particles and Oxidizing Agent Reference Material (Note: The reference material Raman spectrum has been baseline corrected to remove broadband laser induced fluorescence.)
The Raman spectrum of the reference material has been baseline corrected to compensate for broadband laser induced fluorescence. These results were presented to the manufacturer and during the discussion that ensued, a leachate of the polymer bottle material was suspected because of the high temperature incubation. The manufacturer at this point initiated discussions with their bottle vendor. Later it was revealed that the vendor utilized an oxidation agent in the plastic bottles very similar to the one identified during the investigation. The characterization sources the nonconformity to the polymer additive in bottles being utilized for the stability study. Consequently, the resolution for this issue was that a different bottle type was utilized in subsequent case studies involving this product. Case study 1 demonstrates the utility of the forensic characterization in and of itself. Case Study 2: A Reactive Approach The second case study highlights an investigation that is reactive in nature. A small glass vial of parenteral product was received with a single visible foreign particulate within. Figure 6 shows the particle of interest while still in its original container.
Figure 6: Optical Image of the Gray Particle of Interest while Still in the Original Container. Note that the gray particle is encased in a bubble in this particular image. The black marking in the lower left corner is labeling on the container.

Pharmaceutical Manufacturing
Also submitted was a corresponding syringe with the needle intact. The manufacturer indicated that the particle was located after the gray vial septum was punctured with the syringe and that the septum was a potential source material. An isolation extraction technique was executed to extract the particle of interest from the product solution. The forensic characterization regimen was then performed. The optical analysis revealed anticipated physical properties such as the approximate size of the particle and that it was gray in color. While probing the sample during the microscopic examination, it was determined to be soft and rubber‐like. The FTIR analysis concluded it was a butyl rubber material. The SEM/EDS analysis concluded the material contained a carbon rich matrix with aluminum‐silicon rich inclusions. The combination of aluminum and silicon is consistent with aluminum silicates commonly used as a filler material in rubbers. From the characterization, the final conclusion was that determined as a butyl rubber with aluminum silicate fillers. At this point the interest was to confirm the hypothesis that the septum material was the source of the contamination as initially suspected. Therefore the forensic characterization was also performed on a portion of the vial septum. A comparative analysis was then implemented. Both the particle of interest and the septum material exhibited an FTIR spectrum consistent with a butyl rubber. A comparison is displayed in Figure 7.
100015002000250030003500Wavenumber (cm-1)
0.5
1.0
1.5
Abs
orba
nce
100015002000250030003500Wavenumber (cm-1)
0.5
1.0
1.5
Abs
orba
nce
Figure 7: FTIR Spectral Comparison of the Gray Particle of Interest and the Corresponding Septum Material
The SEM/EDS data also were mirrored indicating a carbon rich matrix material with aluminum silicate fillers as shown in Figure 8.
Particle
Septum Material

Pharmaceutical Manufacturing
Figure 8: SEM/EDS Evaluation of Particle and Septum Material (a) SEM image at 60x showing general morphology, (b) higher magnification SEM image at 230x showing homogeneity (c) EDS spectrum showing the particle to be carbon (C) rich with significant presence of aluminum (Al) and silicon (Si) (d) SEM image at 240x showing general morphology, (b) higher magnification SEM image at 880x showing homogeneity (c) EDS spectrum showing the particle to be carbon (C) rich with significant presence of aluminum (Al) and silicon (Si).
a b
c
d e
f
b
c
e
f

Pharmaceutical Manufacturing
However this comparative analysis did not exclude the possibility that an additional, gray butyl rubber material was not somewhere else in the production line. The need was to then to definitively identify the source material. It was observed during the initial optical examination that the septum had contained a void which appeared to be the point of puncture. Another forensic investigation technique was called upon: fracture matching. The original particle was able to be transferred to the top surface of the vial septum (Figure 9) where the edge pattern of the void and the particle were observed to be complimentary.
Figure 9: Optical Image Showing the Complimentary Edge Pattern between the Particle of Interest Placed and the Void in the Septum
Figure 10 depicts the particle after it was placed directly into the void to evaluate the fit. The particle of interest fit perfectly within the void and fell flush with the top of the septum. The combination of the forensic characterization with the fracture matching allowed a conclusion with a high degree of certainty that the gray particle sourced from the septum. The results were presented to the manufacturer who immediately initiated an observation investigation for the administration technique of the product. Due
Complimentary Edge Patterns

Pharmaceutical Manufacturing
to the fact that this particular case had resulted from a puncture of the vial septum these actions were observed for several individuals.
Figure 10: Optical Image Showing the Fit of the Particle within the Void (indicated by white circle)
At the result of the investigation, it was concluded that an improper administration technique was being utilized by some. These individuals received additional training on proper administration technique and were further required to pass additional evaluation. The case study was reactive in nature due to the fact that no source materials had previously been characterized. Furthermore, the manufacturer did not know in advance that there were no similar materials utilized in their process. A proactive approach would have facilitated the investigation and saved time and resources. The further characterization of the septum would have already been complete and the fracture matching could have been eliminated because the absence of any other butyl rubber based materials throughout the process would have already been known. By having to add these two additional steps, investigation time was increased by 200% while finished product remained at the production facility for clearance.

Pharmaceutical Manufacturing
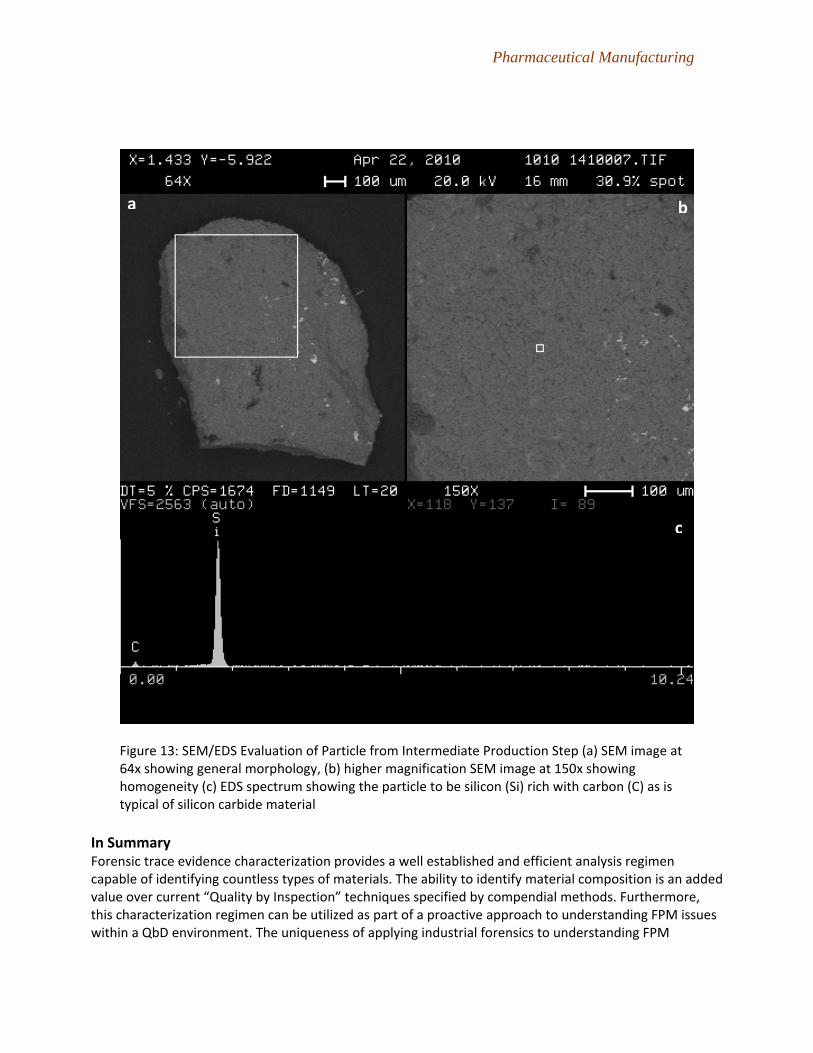
Case Study 3: A Proactive Approach The third and final case study highlights an approach that is proactive in nature. It involves a particle that was located in an intermediate production step. The initial optical examination revealed a very hard, solid, black particle. The particle was approximately sized at one millimeter making it a relatively a large particle compared to what is typically encountered in FPM investigations. The particle with sizing information is shown in Figure 11.
Figure 11: Optical Image of Particle from Intermediate Production Step with Approximate Size Measurement
In this case Raman spectroscopy was utilized directly instead of FTIR due to the hardness of the particle making it too difficult to apply adequate preparation for FTIR analysis. Raman became the logical choice due to no sample preparation being needed for this analysis technique. The Raman spectrum was compared to a library (Figure 12) and concluded to be silicon carbide. SEM/EDS analysis was complimentary in that it exhibited major amounts of silicon with carbon present, as is typical with silicon carbide material as shown in Figure 13.

Pharmaceutical Manufacturing
500 1000 1500 2000 2500 3000 3500 4000Raman Shift (cm-1)
150
200
250
300
350
400
450
500
550
Ram
an In
tens
ity
500 1000 1500 2000 2500 3000 3500 4000Raman Shift (cm-1)
150
200
250
300
350
400
450
500
550
Ram
an In
tens
ity
Figure 12: Raman Spectral Comparison of Particle from Intermediate Production Step and Silicon Carbide Library Spectrum
With the presentation of results the manufacturer immediately identified that the source of the particle was a pump seal contained in the intermediate production step. A control strategy was already in place which stemmed from previous activities where the wear and tear of the seal had been studied within the environment of this particular step. A certain amount of shedding of this material can be acceptable depending on the point of the lifecycle for this particular component. The amount and size of the particulate is an indication of whether a particular pump seal is following the anticipated life cycle wear or if there is a premature failure of the component. By indicating the approximate size of the particle from the optical examination, and the fact that the manufacturer had only observed one particle, they were able to conclude that this amount of observed particulate was normal for the point in the lifecycle of this particular seal. Essentially the entire investigation step was able to be eliminated and resolution was already in place. This enabled production to continue almost without interruption at the conclusion of the forensic characterization. Case study 3 serves to demonstrate how the proactive approach does indeed expedite investigation length. This organization already knew that their process contained silicon carbide and in which production components. They had already considered the wear and tear of this material in the exact environment of its use and were able to have implemented a control strategy.
Particle
Library Reference
Pharmaceutical Manufacturing
Figure 13: SEM/EDS Evaluation of Particle from Intermediate Production Step (a) SEM image at 64x showing general morphology, (b) higher magnification SEM image at 150x showing homogeneity (c) EDS spectrum showing the particle to be silicon (Si) rich with carbon (C) as is typical of silicon carbide material
In Summary Forensic trace evidence characterization provides a well established and efficient analysis regimen capable of identifying countless types of materials. The ability to identify material composition is an added value over current “Quality by Inspection” techniques specified by compendial methods. Furthermore, this characterization regimen can be utilized as part of a proactive approach to understanding FPM issues within a QbD environment. The uniqueness of applying industrial forensics to understanding FPM
a b
c

Pharmaceutical Manufacturing
contamination is evidenced by its ability to be utilized in already established systems as well. The fact that it can be utilized in a proactive or retroactive approach makes it an ideal tool for use in a number of situations where a holistic understanding of a process is required. The compartmentalization that is a result of applying industrial forensic techniques to a particular process provides a systematic and logical way to maintain organization and manageability throughout the implementation of an FPM program. Versatile data management systems will compliment the efforts of initiating a source sample evaluation and allow for highly efficient and thorough polling of all historical sample data. All of these attributes demonstrate the value of utilizing this approach. However, there are two attributes that are most important. By shortening investigation times and having a reduction in lost product, the impact of such an implementation can be highly significant to cost savings within an organization. Lastly, utilizing an industrial forensic approach to understanding FPM contamination will ultimately conclude in high quality and safe product for consumers. Acknowledgements RJ Lee Group would like to graciously thank the manufacturers who gave permission to use this data so that these experiences could be shared. We would also like to thank Casey Bunker for his input in the review and editing of this manuscript as well as Erin Barozzini of our Quality Assurance department for their assistance.
References
1. Brewer JH, Dunning JHF. An invitro and in vivo study of glass particles in ampules. J Am Pharm Assoc. 1947; 36:289‐293.
2. Schoenberg MD, Gillman PA, Mumaw V, Moore RD. Proliferation of the reticuloendothelial system and phagocytosis. Exp Mol Pathol. 1963; 2:126.
3. Hozumi K, Kitamura K, Kitade T, Iwagami S. Localization of glass particles in animal organs derived from cutting of glass ampoules before intravenous injection. Microchemical J. 1983; 28:215.
4. Thomas WH, Lee YK. Particles in intravenous solutions. N Z Med J. 1974; 80:170. 5. Borchert SJ, Abe A, Aldrich DS, Fox LE, Freeman JE, White RD. Paticulate matter in
parenteral products: a review. J Parenter Sci Technol. 1986; 40:212. 6. FDA news release: Genzyme Corp. signs consent decree to correct violations at Allston,
Mass., manufacturing plant and giving up $175 million in profits. May 24, 2010. 7. FDA news and events: Statement of Dr. Scharfstein before the Committee on Oversight
and Government Reform, U.S. House of Representatives. May 27, 2010. 8. FDA Warning Letter (10‐ATL‐12) to Hospira, Inc. April 12, 2010. 9. FDA Warning Letter (W/L 44‐10) to Gilead Sciences, Inc. September 21, 2010. 10. FDA: Recall – Firm Press Release; American Regent initiates voluntary recall of
Dexamethasone Sodium Phosphate Injection, USP 4 mg/ml, 30 ml multiple does vials. December 20, 2010.
11. FDA: Recall – Firm Press release; Sandoz initiates voluntary recall in the US of all 50 mg/2 ml and 250 mg/10 ml vials of Methotrexate Injection, USP due to the presence of glass particulates. October 27, 2010.
12. Randall T, Waters R. Amgen, J & J recall Epogen, Procrit tainted by glass. Bloomberg Businessweek. September 24, 2011.
13. Pharmaceutical Quality for the 21st Century: A Risk‐Based Approach http://www.fda.gov/AboutFDA/CentersOffices/CDER/ucm128080.htm
14. Van Arnum P, A FDA perspective on Quality by Design. Pharmaceutical Technology Sourcing and Management. 2007; 3:12.

Pharmaceutical Manufacturing
15. USP 16. International Conference on Harmonisation, “Q6A Specifications: Test Procedures and
Acceptance Criteria for New Drug Substances and New Drug Products: Chemical Substances,” 1999
17. International Conference on Harmonisation, “Q8(R2) Pharmaceutical Development” 2009
18. FDA Warning Letter (NYK‐2011‐33) to Luitpold Pharmaceuticals, Inc. August 31, 2011. 19. FDA Warning Letter (NWE‐27‐11W) to Lonza Biologics, Inc. September 1, 2011 20. Investigating Out‐of‐Specification (OOS) Test Results for Pharmaceutical Production,
Guidance for Industry, Food and Drug Administration, October 2006 *Corresponding Author
Mailing Address: RJ Lee Group, Inc. 350 Hochberg Road Monroeville, PA 15146 Email: [email protected]