industrial diagnostic study rwanda 2020
TRANSCRIPT
Programme for Country Partnership
Industrial Diagnostic Study
Rwanda 2020
ii
Acknowledgements
This diagnostic study was conducted between August and December 2020, and benefitted immensely
from support and information provided by major players in industrial policy and structural change in
Rwanda. Consultations were held with the Ministry of Trade and Industry, the National Industrial
Research and Development Agency (NIRDA) of Rwanda and the regional office of the UN Economic
Commission for Africa office in Rwanda, as well as the Private Sector Federation (PSF). The authors
would like to express their sincere gratitude to the representatives of all institutions involved for their
availability, time and inputs that have helped shape this report.

iii
Executive summary
Rwanda is a country with the ambition of rapidly climbing the ladder of development. According to the
National Strategy of Transformation 2017 – 2024 “Vision 2050 aspires to take Rwanda to high living
standards by the middle of the 21st century and high-quality livelihoods”. Rwanda has made
exceptional strides in economic performance. The poverty level has decreased from 77 per cent in
2000 to 55 per cent in 2016. The country’s GDP growth rate during the period 2010–2018 has been
one of the most dynamic among African countries.
Despite these commendable achievements, the country still faces challenges that may threaten its
transition to a higher income level. The share of manufacturing has stagnated at around 6 per cent
over the last decades. As highlighted in the literature and reiterated in policy circles, manufacturing is
an engine of sustained growth; it has the capacity to create backward and forward linkages, serves as
an impulse for innovation and has the capacity to generate economies of scale. A stagnating
manufacturing sector may threaten the development process in the medium- to long term.
The PCP (Programme for Country Partnership), which will accompany the Government of Rwanda,
UNIDO and all relevant stakeholders over the next few years, is timely for re-igniting the role of
manufacturing in the country.
The present study identifies thematic components, priority sectors and bottlenecks to businesses
which can guide further discussions on the identification of specific PCP projects. In this context, the
NST identifies, among others, agro-processing, meat and dairy, and textiles and garments as sectors
that deserve the highest attention. Many of the prerequisites for industries in terms of necessary
resources, including natural endowments, human skills and technologies, are available in Rwanda. So
far, however, the development of the value chains linking the primary activities (i.e. agriculture and
livestock farming) with downstream activities appear to be incomplete. The strengthening of value
addition and in particular of transformation activities to strengthen manufacturing represent a first
necessary strategic direction for the country. The creation of a component “Integrated value chain
development” will be important for reaching this goal.
The development of the manufacturing sector and the related necessary skills and capability are the
key prerequisite for the country to capture the opportunities provided by the new wave of
technological revolution. The thematic component “Adequate skills for Industry 4.0 and investment
promotion for economic diversification” is identified as an important intervention to boost
industrialization and sustained growth in the medium- to long term.
The pursuit of industrialization must take energy and environmental aspects into account. The
thematic component “Development of sustainable energy” will be essential for matching the growing
demand for energy required by industrialization with increased electrification and the production of
renewable energy. The introduction of the component “Circular economy for value addition” will
accompany the development of transformation and value addition processes, with operations aimed
at minimizing waste, using materials for efficient production and minimizing the use of toxic materials.

iv
The design and implementation of projects aimed at boosting inclusive and sustainable industrial
development will need to be accompanied by the right industrial policy framework. The overall
indicators of policy effectiveness suggest considerable improvements in recent years, and an increased
focus on industrial policy through the component “Governance development” could use the
momentum of governance improvements to further boost the manufacturing sector.
All the identified thematic components are in line with the objectives and pillars contained in the
national policy objectives.
The PCP will not be able to focus on all industries but will instead prioritize interventions in certain
manufacturing activities. UNIDO has analysed detailed manufacturing industries based on criteria such
as employment, exports and imports, and the capacity of industries to generate employment, to be
competitive in international markets and to create policy space for import substitution strategies. The
study identifies a set of priority industries (food and beverages, textile, wearing apparel, leather, paper,
chemicals, non-metallic minerals, basic metals, motor vehicles, other transport equipment) to be
considered in further dialogue following the diagnostic phase on project selection and design. The
identified industries are broadly aligned with those flagged in many relevant policy documents. This
document also discusses some other industries at a more disaggregated level for each identified
priority sector.
The development of value addition activities in the selected priority sectors will depend on the
country’s capacity to effectively remove the bottlenecks to business for firms. An analysis of the World
Bank Enterprise Survey was conducted using firm-level data in the manufacturing sector during three
different time periods. The bottlenecks to business that were repeatedly raised by enterprises in
Rwanda were further examined. Results show an impressive improvement in many of the examined
bottlenecks, reflecting the government’s ability to effectively address the main issues. Challenges still
remain in terms of access to finance, electricity, skilled labour, tax rate and—for formal firms—
competition practices in the informal sector.
This diagnostic report is the first step in the PCP process. In the following post-diagnostic phase, a
comprehensive project document will be formulated, and specific projects will be identified and
designed, taking the challenges that might hamper the effective process of value addition and of
transformation into account.
v
Table of Contents INTRODUCTION AND DIAGNOSTIC FRAMEWORK ................................................................................... 7
SECTION 1: INDUSTRIAL PERFORMANCE AND POLICY CONTEXT OF RWANDA .................................... 10
Economic Performance ............................................................................................................. 10
a) Value Addition ....................................................................................................................... 10
b) Trade developments.............................................................................................................. 21
c) Regional integration and international markets ................................................................... 25
d) Structural upgrading and value chain development in priority sectors ................................ 27
Social Performance .................................................................................................................... 30
a) Social inclusion and employment .......................................................................................... 30
b) Adequate skills for Industry 4.0 and investment promotion for economic diversification .. 35
Environmental Performance ................................................................................................. 40
a) Clean and circular production ............................................................................................... 40
b) Energy .................................................................................................................................... 46
Policy Context ........................................................................................................................ 50
a) Governance in Rwanda ......................................................................................................... 50
b) Policymaking: formulation, implementation and evaluation ............................................... 52
c) Governance and implications for the business environment ............................................... 53
d) Industrial policy and structural transformation in Rwanda .................................................. 54
Summary of Section 1 and implications for PCP project design ............................................... 57
a) Thematic component 1: Integrated value chain development ............................................. 58
b) Thematic component 2: Governance development ............................................................. 59
c) Thematic component 3: Development of sustainable energy .............................................. 60
d) Thematic component 4: Value added creation in a circular economy ................................. 60
e) Thematic component 5: Adequate skills for Industry 4.0 and investment promotion for
economic diversification ............................................................................................................... 61
SECTION 2: IDENTIFICATION OF PRIORITY SECTORS ............................................................................. 62
The Framework of Industry Prioritization ................................................................................. 62
Discussion on Findings ............................................................................................................... 65
a) Job creation potential ............................................................................................................... 65
b) Latent potential ......................................................................................................................... 67
c) Revealed comparative advantage (RCA) ................................................................................... 70
d) Emerging comparative advantage (ECA) ................................................................................... 71
vi
e) Import substitution ................................................................................................................... 71
f) World import dynamism ............................................................................................................ 72
Industry Prioritization for Rwanda ........................................................................................ 74
Desk-based Validation (Rwanda’s National Strategies) ........................................................ 76
Manufacturing Sub-sector Prioritization for Rwanda ............................................................... 83
SECTION 3: IDENTIFICATION OF KEY BOTTLENECKS FOR RWANDA ...................................................... 86
Introduction ........................................................................................................................... 86
Profile of Manufacturing Firms in Rwanda ............................................................................ 87
Main Obstacles for Manufacturing Firms .............................................................................. 88
Bottlenecks in Detail .............................................................................................................. 91
a) Access to finance ................................................................................................................... 91
b) Bottleneck: Electricity ............................................................................................................ 95
c) Tax rates ................................................................................................................................ 99
d) Inadequately skilled labour force ........................................................................................ 101
e) Competition from informal sector ...................................................................................... 103
SECTION 4: FINAL SUGGESTIONS FOR PCP DESIGN ............................................................................ 106
References ........................................................................................................................................... 108
Appendices .......................................................................................................................................... 112
Appendix to Section 1 ............................................................................................................. 112
Appendix to Section 2 ............................................................................................................. 113
Appendix to Section 3 ......................................................................................................... 115
a) Bottleneck analysis: methodology and survey Information ................................................ 115
b) Caveat of the analysis .......................................................................................................... 123
c) Bottlenecks: other topics .................................................................................................... 124
d) Other results of the micro analysis for the groups of firms ................................................ 127
Disclaimer ........................................................................................................................................ 134

7
INTRODUCTION AND DIAGNOSTIC FRAMEWORK
The present diagnostic study aims to explore Rwanda’s challenges and opportunities on the path to
industrial development. The study’s objective is to provide the PCP programming team and
stakeholders with comprehensive yet succinct inputs to successfully design and implement the PCP
Rwanda. The report is organized into major sections based on a macro-, meso- and micro-level
perspective of the economy (Figure 1)1.
All of the report’s analyses link up with Rwanda’s national industrialization and broader development
objectives. They thus link up with key policy documents, including but not limited to, the National
Strategy for Transformation (2017), the Domestic Market Restructuring Strategy (2015) and the
National Industrial Policy (2011), which is currently in the process of revision and, importantly, a recent
report by the Government of Rwanda produced jointly with the World Bank (2019), which identifies
the future growth drivers Rwanda needs to stimulate to achieve the broader development objectives
of its Vision 2050, the successor of the current Vision 2020. According to Vision 2050, Rwanda aspires
to achieve upper middle-income status by 2035 and high-income status by 2050, which is an average
annual growth rate of over 10 per cent.
Against this background, Section 1 takes a macro-economic perspective and analyses Rwanda’s
economic, social and environmental performance through the lens of an inclusive and sustainable
industrial development, the core mandate of UNIDO in line with Sustainable Development Goal (SDG)
9. That is, the ambitious growth and development objective also has a qualitative dimension which
requires corresponding human skills, infrastructure and technologies that are fully aligned with the
objective of transforming Rwanda into a modern, knowledge-based economy as envisaged in
Rwanda’s Vision 2020 and confirmed in the subsequent Vision 2050. The latter strives for the
transformation of the entire economy and society.
The economic dimension explores, among others, value addition and structural change; export
developments, including export diversification and export sophistication; regional integration and
global markets and the development of value chains. The social dimension focuses on the inclusiveness
of women and youth in the labour market and the development of skills and infrastructure required
for the digital transformation and Industry 4.0. The environmental dimension entails the role of waste
management and forestry and their potential for domestic value creation, as well as the role of energy,
above all, electricity, to achieve Rwanda’s industrial development goals. Section 1 concludes by taking
a closer look at the overall governance developments and their implications for private sector
development.
1 We acknowledge that the results of the industrial diagnostics may be sensitive 1) to the selected statistical classifications 2)
to the concordance tables adopted when needed to prepare trade datasets with a unique statistical nomenclature for
analyses 3) to the selected time horizon of the study. The adequacy of the findings is preserved by discussing them with
relevant stakeholders.

8
Figure 1: Diagnostic framework for the Programme for Country Partnership (PCP) Rwanda

9
In Section 2, a meso-level analysis is carried out which identifies potential priority industries on the
basis of their revealed comparative advantage, their production potential, level and dynamics of
imports as well as their job creation potential. All analyses of priority industries build on existing
national policy priorities. Furthermore, specific characteristics of the selected industries are examined.
Section 3 identifies key bottlenecks, the removal of which may provide additional impetus to private
sector development. Data from the World Bank Enterprise Survey is used (waves 2006, 2011, and
2019/2020) for this analysis. The firm-level analyses also include a profile of manufacturing firms in
the Rwandan economy and the situation of vulnerable firms.

10
SECTION 1: INDUSTRIAL PERFORMANCE AND POLICY CONTEXT OF
RWANDA
Economic Performance
a) Value Addition
Overall economic performance
Rwanda is a densely populated, landlocked, low-income country (LIC) in the African Great Lakes Region
and one of the fastest growing economies in the world. The country’s growth spurt has led to a three-
and-half-fold increase in per capita income since 1994 (World Bank and Government of Rwanda, 2019).
Within sub-Saharan Africa (SSA), Rwanda’s growth performance over the past decade has only been
surpassed by Ethiopia.2. Since the beginning of the new millennium, Rwanda’s GDP growth rate has
reached 7.4 per cent (Figure 2), which is clearly above the 6 per cent threshold required for a growth
take-off (Szirmai, 2012; UNIDO, 2015). The significant drop in the growth rate in 2020 due to the
COVID-19 pandemic, while lowering the long-term average growth rate, does not alter this conclusion.
Moreover, the country’s growth has been inclusive and has been used, inter alia, for extensive
investments in social safety nets which have helped reduce poverty significantly (IMF, 2019). One
2 Based on average annual GDP growth rates as reported in the World Bank’s World Development Indicators (WDI).

11
positive feature of Rwanda’s GDP trajectory is the absence of any major crisis or a growth collapse,
which afflict so many developing countries and derail promising catch-up processes (Pritchett, 2000).
Figure 2: GDP growth in Rwanda, 2000–2020
Note: Real GDP growth (in 2015 US dollars). The take-off rate is 6 per cent. Rwanda’s national growth target is 11.5 per cent. The average GDP growth rate is the compound annual growth rate. Source: UNIDO MVA database, Government of Rwanda, 2017, Szirmai, 2012.
Despite this remarkable growth performance, it remains below the very ambitious target of 11.5 per
cent for the period 2013–2020 set in the National Strategy for Transformation (NST), the main
instrument for implementing the country’s development programme Vision 2050 (Government of
Rwanda, 2017)3. The main objective of Vision 2050 is to transform the country into a knowledge-based
economy, to reach upper middle-income status by 2035 and to become a high-income country by 2050
(World Bank and Government of Rwanda, 2019).4 Achieving the upper middle-income objective
requires an average GNI per capita growth rate of 10.5% from 2020 to 2035, which corresponds to an
annual growth rate of about 12.5 per cent at the current demographic trend5. However, COVID-19 has
disrupted Rwanda’s economic boom of the past two decades and economic growth dropped to 2 per
cent in 2020 (according to UNIDO data). Growth may recover to pre-COVID levels in forthcoming years
3 Vision 2050 replaced the previous national development programme, Vision 2020, which was launched in the year 2000. 4 Given Rwanda’s gross national income (GNI) per capita (Atlas method) of USD 820 in 2019, the country would reach the
2019 threshold for lower middle-income countries (USD 1,036) in less than 5 years if the average (pre-COVID-19) GDP growth rate of 7.7 per cent (less 2 per cent population growth) could be maintained. By contrast, to reach the World Bank’s upper middle-income level of USD 4,046 by 2035, a GNI per capita growth rate of 10.5 per cent would be required (almost equivalent to the needed GDP per capita growth rate ignoring the methodological differences between the Atlas method and the real GDP).
5 The 2019 threshold for becoming a middle-income country according to the World Bank income classification is a gross national income (GNI) per capita (in current US dollars calculated using the Atlas method) of USD 1,036; the threshold for becoming a high-income country is USD 12,535. Rwanda’s GNI per capita in 2019 was USD 820.
0
5
10
15
2000 2005 2010 2015 2020
Gro
wth
in %
GDP growth Average GDP growth 2000-2020
Take-off rate (GDP) Rwanda - national target (for 2013-2020)
National target: 11.5%
Take-off growth rate: 6%
Average growth: 7.4%

12
(see IMF, 2020) but it is far from certain.6 In any case, the ambitious development objectives have now
become even more challenging.
A comparison of Rwanda’s growth rate with its partner countries in the East African Community (EAC)
(a customs union between six East African countries that was revived in 20007), other medium-sized,
landlocked LIC in SSA, South Africa as the regional leader, and Ethiopia (another fast-growing economy
in SSA), confirms that Rwanda has experienced a growth spurt over the last decade (Figure 3). With an
average annual growth rate of 7.7 per cent between 2010 and 2019, it grew much faster than the SSA
region (3.6 per cent) and the group of all LIC (3.3 per cent), but also outperformed all its EAC partners,
including Tanzania (6.7 per cent) and Uganda (4.9 per cent). Only Ethiopia (9.6 per cent) recorded a
higher GDP growth than Rwanda, with Mali growing at par (8.3 per cent). Such high growth rates
explain why many observers speak of the 21st century as the “African century”.8
Figure 3: GDP and MVA growth rates in Rwanda and comparator countries, 2010–2019
Note: Real GDP growth (in 205 US dollars). Source: UNIDO MVA database.
6 According to the IMF (2020), GDP growth in Rwanda is expected to reach around 6.3 per cent in 2021 and 8.0 per cent in 2022.
7 The members of the EAC are Burundi, Kenya, Rwanda, South Sudan, Tanzania and Uganda. 8 Reference to the African century, which is anticipated to bring peace, prosperity and a cultural revival to Africa, was made,
inter alia, by former South African president African Thabo Mbeki in his victory speech in 1999. See: http://news.bbc.co.uk/2/hi/world/monitoring/360349.stm.

13
Broad sectors and structural development
With a view to the aspired industrial transformation and development, a slight blemish in Rwanda’s
otherwise impeccable growth record since 2000, is that its real manufacturing value added (MVA)
growth rate, while impressive, fell short of the economy-wide growth dynamics. In comparison with
other SSA countries, Rwanda’s real MVA growth of 7 per cent is relatively high, and comparable to that
of Tanzania. Overall, the performance of the Rwandan manufacturing sector is considered to have
been subpar (World Bank and Government of Rwanda, 2019). The experiences in comparator countries
show that an MVA growth rate below that of GDP (as observed in Rwanda) is a common pattern in
many low-income SSA countries (and in LICs, in general) whose economies are dominated by
(subsistence) agriculture, mining activities and increasingly, services. Ethiopia, however, illustrates that
manufacturing-led growth is also feasible in sub-Saharan LICs when appropriate policies are in place.
The development and expansion of ‘modern’ sectors—essentially all parts of the economy apart from
subsistence agriculture and informal activities, such as petty traders—is crucial as the entire process
of development is rooted in the transformation of the production structure and its underlying
capabilities (see, e.g. Chang, 2010). Traditionally, the transformation of the production structure has
been associated with industrialization, implying a shift of production factors (mainly labour) from
(subsistence) agriculture to manufacturing and other modern industries characterized by high levels
of productivity (see, e.g. Cimoli et al., 2009; Reinert, 2007). This shift in the production structure
directly contributes to the country’s growth and is known as a ‘structural change bonus’ (Timmer and
Szirmai, 2000).
Against the background that Rwanda’s strategy for high growth is based on four essential and
interdependent drivers—innovation, integration, agglomeration and competition (World Bank and
Government of Rwanda, 2019)—a structural shift towards manufacturing appears expedient as
manufacturing is the source of most innovations, features strong agglomeration effects and is
characterized by a high degree of economic integration, leading to stronger competition. While
Rwanda’s growth strategy follows a multisectoral approach that does not rely alone on manufacturing
as a driver of growth (World Bank and Government of Rwanda, 2019), the strengthening of the, until
now, underdeveloped manufacturing sector is undoubtedly warranted. Over the past two decades,
the share of manufacturing in total value added has stagnated at just above 6 per cent, so that the
decline of the share of agriculture has been reflected in an expansion of the services sector from 50
per cent in 2000 to 58 per cent in 2019 (Figure 4). The pace of structural change in the Rwandan
economy has been slow overall in terms of value added. The downside of this is that the potential
aggregate productivity gains induced by structural change is not being fully exploited. At the same
time, the fairly stable economic structure might also reflect a ‘balanced growth’ experience across all
sectors.

14
Figure 4: Value added shares of main economic sectors, Rwanda, 2000–2019
Note: Shares of sectors are based on nominal values. Construction is subsumed under services. Source: UN National Accounts statistics.
Agriculture. The agricultural sector accounted for 31 per cent of total value added in 2018 (see Figure
4). Given the country’s demographic trend, the sector continues to absorb additional workers, who are
almost entirely informally employed, with a large share employed in subsistence agriculture (NISR,
2018)9. Agriculture, albeit characterized by low labour productivity, therefore remains the backbone
of Rwanda’s economy (see also AfDB, 2014), accounting for 63 per cent of total employment in 201910.
Due to its economic and social importance, Rwanda’s NST defines agriculture as one of its priority
sectors (Government of Rwanda, 2017), and hence as one of the key economic drivers with the
potential of significantly contributing to job creation and productive employment. Given its size, the
agricultural sector is central to Rwanda’s overall growth trajectory, and its ambitious growth targets
will require significant improvements in productivity. These should come from investments to improve
farming methods, including the adoption of climate resilient techniques and stronger value chain
linkages with domestic and export markets. The need for value chain development towards agro-
9 According to Rwanda’s Labour Force Survey (LFS) of 2018, 99.6 per cent of all persons employed in agriculture are informally employed; 41 per cent of agricultural employees participated in subsistence agriculture in 2018 (NISR, 2018). Moreover, many persons employed in other industries in the economy also participated in subsistence agriculture.
10 This figure is taken from the ILO’s World Employment and Social Outlook (WESO) database, available at https://www.ilo.org/shinyapps/bulkexplorer28/?lang=en&segment=indicator&id=EMP_2EMP_SEX_ECO_NB_A. These data are also reported in the World Bank’s World Development Indicators (WDI), but differ significantly from Rwanda’s national LSF survey data. The ILO estimate, however, is similar to the number indicated by the FAO. See: http://www.fao.org/rwanda/our-office-in-rwanda/rwanda-at-a-glance/en/.
15
processing activities is also warranted by the fact that arable land is scarce in Rwanda (Hausmann and
Chauvin, 2015). Hence, creating jobs in non-land-intensive activities is necessary.
As Rwanda is dominated by highlands, with the lowest altitude in the country 950 m above sea level,
it is estimated that 90 per cent of domestic cropland is on slopes ranging from 5 per cent to 55 per
cent.11 This topography limits the potential for large-scale agriculture. The most productive crops
include plantains, cassava, potatoes, sweet potatoes, maize and beans. The cultivation of tea and
coffee, products that are also important export items, is of particular relevance. In the marshlands,
where water is abundant, rice and vegetables are cultivated. Grazing of livestock is another major
activity, also primarily for subsistence purposes. Hides and milk are also produced for the market and
exported.
Mining and utilities contribute around 4 per cent to total value added (see Figure 4), with about half
of that, i.e. 2 per cent, attributable to the mining sector.12 While this is a modest share, the sector is
important for the generation of export revenues and as the base for the development of resource-
based manufacturing industries. For example, in June 2019, Rwanda acquired its first-ever gold
refinery, which is located in the Kigali Special Economic Zone in the Gasabo District. Given the strong
increases in the price of gold, the precious metal is believed to have considerable development
potential, and in 2019, became the country’s main export item, surpassing other minerals such as tin
and tantalum. The latter is a rare mineral, with Rwanda belonging to the top producers, accounting for
around 9 per cent of the world’s tantalum used in electronics manufacturing.13 Other mineral
resources exported by Rwanda include cassiterite, coltan, wolfram, peat and nickel.
Manufacturing. Rwanda’s manufacturing sector is still small and undiversified (AfDB, 2014),
accounting for around 6 per cent of the country’s total value added with a slightly negative trend. Until
recently, the manufacturing sector played a marginal role in Rwanda’s development strategy (Behuria,
2019). According to Behuria (2019), officials from the Ministry of Trade and Industry and the Ministry
of Finance and Economic Planning were pessimistic about the manufacturing sector’s growth potential,
as high transportation costs impede Rwanda from developing competitive manufacturing industries.
Therefore, the National Industrial Policy launched in 2011 (Ministry of Trade and Industry, 2011), which
called for import substitution to reduce the large trade deficit, but did not propose any major action
(Behuria, 2019). The importance assigned to the manufacturing sector increased with the Domestic
Market Recapturing Strategy (DMRS) of 2015 (Ministry of Trade and Industry, 2015), a supplement to
Rwanda’s industrial policy, which aims to combine export-oriented industrial development and import
substitution. The renewed interest in the manufacturing sector is also reflected in the country’s
(revised) Special Economic Zones Policy (Ministry of Trade and Industry, 2018), designed to address
the country’s remaining (but decreasing) infrastructure constraints, and its open trade policy, which is
designed to overcome the limited domestic market size, and is geared, in particular, towards regional
integration within the EAC and beyond.
11 Information from the FAO. See: http://www.fao.org/rwanda/our-office-in-rwanda/rwanda-at-a-glance/en/. 12 According to data from the NISR, available at: https://www.statistics.gov.rw/. 13 See website of the Rwanda Development Board (RDW): https://rdb.rw/export/export/products-directory/mining-sector/.

16
Similar to other low-income countries, Rwanda’s modest manufacturing sector is dominated by
resource-based manufacturing industries. In fact, as of 2012 MVA was generated in only seven
subsectors: food; beverages and tobacco; textiles and clothing; wood, paper and printing; chemicals14,
rubber and plastics; non-metallic minerals; and furniture (AfDB, 2014). Food, beverages and tobacco
account for the lion’s share of manufacturing output (AfDB, 2014, Calabrese et al. 2017). One surprising
feature of Rwanda’s manufacturing structure, given its endowments of tin, gold and other natural
resources, is the marginal role played by the mineral and metal industries. This points to the unused
potential of low skill-intensive industries that Rwanda could try to tap into in the future.
Over the past two decades, the growth of MVA at 7.6 per cent has not only remained below the
economy-wide growth, but also significantly below the industrial sector’s policy target of 14 per cent
for 2013–2020, as set in the NST.
Services. The services sector consists of a large set of relatively heterogeneous industries ranging from
comparatively low value added activities, such as construction services and retail sales, to modern
business services, such as information and communication technology (ICT), finance and business
services. The development of the services sector has until recently been perceived by the government
as a way to transform the economy into a modern, knowledge-based economy, leapfrogging
manufacturing. While the assessment of what are considered leading industries has—at the latest
since the introduction of the Domestic Market Restructuring Strategy (Ministry of Trade and Industry,
2015)—slightly shifted in favour of manufacturing, the government is determined to develop
comparative advantages in numerous modern service industries, including banking and finance, with
the aspiration of making Kigali a regional financial hub, to promote health care tourism and higher
education (World Bank and Government of Rwanda, 2019). Moreover, there might also be interesting
niches in traditional service industries. For example, within the tourism industry, Rwanda has been
very successful in developing conference tourism.15
In addition to the transformational potential of individual service industries, the service sector is
important because it is by far the largest sector (in value added terms) and has almost exclusively been
absorbing the resources freed in agriculture (Figure 5).
14 These mainly consist of basic chemicals such as fertilizers (see Hausmann and Chauvin, 2015). 15 Information obtained from consultations with stakeholders.

17
Box 1: The COVID pandemic and industrial policy
The current pandemic is jeopardizing the economies of many developing countries. As emphasized by a recent
UNIDO COVID bulletin1, countries with a lower level of income are exposed to the pandemic’s economic risks
through different channels: 1) a higher level of contagion reduces the availability of workers to work and produce;
2) global recession may reduce demand for goods from countries experiencing GDP contraction; 3) the pandemic
may disrupt value chains, as the production of technology-intensive components, especially in high-income
countries, might drop; 4) lower prices for raw materials (e.g. a reduction of the oil price) may decrease the
revenue of primary goods exporters. Containment measures (e.g. the shutdown of businesses) may also have a
negative impact on economic performance.
Figure B1.1: Index of industrial production in Rwanda
Source: UNIDO IIP dataset https://stat.unido.org/database/Monthly%20IIP
Compared to the levels in December and March 2019, Rwanda has registered a significant drop in the index of
industrial production followed by an encouraging rapid recovery. This index is an indicator that represents the
volume of production of industrial goods based on the IIP value = 100 in the 2015 the base year.
Figure B1.2: COVID policy stringency index in Rwanda and comparator countries
Source: https://www.bsg.ox.ac.uk/research/research-projects/coronavirus-government-response-tracker#data. Data
referring to 31/5/2021.
80
90
100
110
120
130
140
150
160
170
180
Mar
-19
Ap
r-1
9
May
-19
Jun
-19
Jul-
19
Au
g-1
9
Sep
-19
Oct
-19
No
v-1
9
Dec
-19
Jan
-20
Feb
-20
Mar
-20
Ap
r-2
0
May
-20
Jun
-20
Jul-
20
Au
g-2
0
Sep
-20
Oct
-20
No
v-2
0
Dec
-20
Jan
-21
Feb
-21
Mar
-21
0
10
20
30
40
50
60
70
Burundi Ethiopia Kenya Mali Rwanda Tanzania Uganda South Africa

18
An indicator of COVID policy stringency assesses the proactiveness of governments in addressing COVID from a
containment, economic response, and health system perspective2. This indicator does not determine whether
countries are responding successfully, but only specifies the level of stringency of their policies. According to this
index, Rwanda is characterized by a high level of activism in containing the pandemic and in designing economic
responses.
Even though the PCP is a medium-term programme, it could represent a good opportunity to study potential
interventions from an industrial policy perspective, which can help mitigate economic growth losses by
continuing to preserve the health objectives.
____________________________________
Notes : 1 https://www.unido.org/stories/coronavirus-economic-impact-10-july-2020 2 https://www.bsg.ox.ac.uk/sites/default/files/2020-09/BSG-WP-2020-032-v7.0.pdf
Figure 5: Structural change in Rwanda, 2010–2019
Note: Labour productivity is based on nominal value added data from the fiscal year 2018/2019. Employment data (from the ILO) are model estimates. The bubble size indicates the size of the industry in terms of employment (in thousands). Employment change is also expressed in thousands. FIRE includes the finance and insurance sectors and the real estate sector. A labour productivity of 1 indicates that the industry has the same level of labour productivity as the economy-wide average. Higher values indicate higher productivity. Source: NISR GDP database, ILO database, authors’ own calculations.
Figure 5, however, also reveals that the service industries that have taken up the overwhelming
majority of employees over the past decade are low-productivity segments, such as trade and repair
services (816,000 additional persons) or other services (415,000 additional persons). Most of the
additional workforce did not flow in from agriculture or any other sector, but is explained by the
growth of the labour force per se.
The fact that employment generation within the service sector, while crucially important, primarily
takes place in low-productivity industries suggests that leapfrogging manufacturing to accelerate
Agriculture3,930
66Mining
Manufacturing121
Utilities14
Construction360
Trade & repair816
Transport & communication
182182
45
Accomodation45
FIRE23
Real estate & business services
152
Public administration43
Education84
Health46
Other services
415Other services
-1.00
1.00
3.00
5.00
7.00
9.00
-200 0 200 400 600
rela
tive
lab
ou
r p
rod
uct
ivit
y (t
ota
l eco
no
my
=1)
change in employment 2000-2019

19
development is interesting theoretically but is de facto difficult to realize. The Domestic Market
Recapturing Strategy (DMRS) of 2015 as well as the NST, therefore, place stronger emphasis on the
development of the manufacturing sector. Importantly, propping up development efforts in
manufacturing does not come as an alternative to the expansion of modern services, but as a
complement. After all, it is the manufacturing sector that provides the necessary demand for many
professional, scientific and technical services as well as other business services, including banking and
ICT services. One of the manufacturing sector’s key advantages is its relatively high productivity
compared to other parts of the economy. In the case of Rwanda, labour productivity in manufacturing
is about three and a half times higher than that in the overall economy. So far Rwanda’s manufacturing
sector has been unable to create a significant number of new jobs. A stronger contribution of the
manufacturing sector to economic growth and employment generation would address many of the
priorities specified in the NST’s economic transformation objective, in particular the promotion of
industrialization per se and a structural shift in the export base towards higher value added products;
the creation of 214,000 decent and productive jobs annually and the build-up of a globally competitive
knowledge-based economy (Government of Rwanda, 2017, p. viii).
Labour productivity in the manufacturing sector
As is the case for the overall economy, the manufacturing sector’s productivity is retained by the high
prevalence of informal employment, amounting to 94 per cent according to the national LSF survey
(NISR, 2018). The labour productivity gains achieved since 2010 have allowed Rwanda to catch up with
other EAC countries such as Tanzania and Uganda, but the country remains far below the level of South
Africa (Figure 6, panel a). The latter is a particularly useful benchmark for Rwanda’s ambitious
manufacturing development objectives. The current situation, however, also reveals that the country
still has a long way to go to catch up even with the regional productivity frontier. Yet this assertion is
not specific to manufacturing but is also true for the labour productivity gaps at the level of the
economy (Figure 6, panel b).
The Secretariat of the Sector Working Group on Private Sector Development and Youth Employment
Strategy (PSDYES) (2017) identified low capacity utilization rates, amounting to 65 per cent of the
manufacturing sector’s installed capacity; lack of access to buyers; unreliable supply of inputs and a
lack of working capital (33.3 per cent) as key sources of inefficiencies, which in turn keep productivity
levels low.16 All of these elements, which tend to be mutually reinforcing, are potential areas for
additional policy support. The value chain approach enshrined in the government’s NST appears to be
highly suitable for ensuring that efficiency improvements in the value creation process are not
undermined by remaining obstacles in some segment of the value chain, despite substantial efforts in
numerous other segments. Against the background of financial resource constraints, an integrated
value chain development approach, which potentially requires numerous interventions across various
value chain segments, ideally targets a limited number of priority industries. Rwanda has, amongst
others, identified agro-processing as well as textiles and garments as priority sectors (Government of
16 The key bottlenecks that prevent firms from achieving further advances in productivity are discussed in detail in Chapter 3.

20
Rwanda, 2017). These two sectors account for the lion’s share of Rwanda’s MVA, which makes the
development of value chains within them crucial for overall manufacturing development.
Figure 6: Real productivities in Rwanda and competitor countries, 2010 vs 2019
(a) Manufacturing
(b) Total economy
Note: Real values (in 2015 US dollars). Employment data (from the ILO) are model estimates. Source: UNIDO MVA 2020 database, ILO database.
Since an integrated value chain approach needs to take all potential cost and quality factors within and
beyond the boundary of the firm into account (ranging from input sourcing to actual production

21
processes and technologies, to transportation and logistics or access to foreign markets), both the
integrated agro-processing and textile and wearing apparel value chains can be considered to be cross-
cutting thematic components. The need for structural upgrading in these priority sectors is discussed
further below.17
Improvements in productivity and structural upgrading are obviously a prerequisite for gaining
international competitiveness beyond primary products and minerals, which in turn supports efforts
by the Rwandan government to reduce the substantial trade deficit.
b) Trade developments
Export competitiveness
A key characteristic of successful industrializers is an export structure that is dominated by
manufactured goods.18 This is obviously not the case in Rwanda, which predominantly exports primary
products and services, while manufactured exports only accounted for 6 per cent of the country’s total
exports in 2019.
Figure 7: Rwanda’s export structure, broad sectors. 2010 vs 2019
Note: Definition of manufacturing goods is borrowed from the World Trade Organisation series: ‘manufacturing’ defined as ‘Merchandise exports by product group’ and ‘services’ as ‘Balanced International Trade in Services’. The primary sector calculated as merchandise goods less manufactured goods. Source: WTO Trade Database.
17 The appropriateness of selecting these industries is fully confirmed by the detailed analysis in Chapter 2. 18 This is due to the fact that the manufacturing sector produces (i) highly tradable output; (ii) features important economies
of scale, and (iii) is less likely to run into demand constraints than primary products (see Szirmai, 2012).
48%
40%
6%
4%
46%
57%
0% 20% 40% 60% 80% 100%
2019
2010
Primary Manufactures Services

22
Figure 8: Exports per capita in Rwanda and competitor countries, nominal USD
(a) Total merchandise exports, 2010 vs 2019
(b) Manufactured exports, 2010 vs 2018
Note: Panel (a): 2019 data for Tanzania and Malawi are from 2017 (last data available). Data for South Sudan are not available. Panel (b): Data for South Sudan, sub-Saharan Africa and low-income countries are not available. The definition of manufacturing goods is borrowed from the World Trade Organisation https://www.wto.org/english/res_e/statis_e/technotes_e.htm. Data on services trade for Rwanda are only available until 2013. Source: WTO Trade Database, World Bank WDI.
23
The fact that the low share of manufactured exports is not attributable to the exceptional performance
of services exports is revealed by Rwanda’s comparatively low export intensity19 (Figure 8, panel a).
The upside to this is a strongly positive trend, with export intensities rising from USD 30 in 2010 to USD
92 in 2019. This means that Rwanda has successfully defied the more general negative trend that
prevails in most countries in the EAC region (apart from Uganda) as well as in the wider SSA region and
in the group of LICs. More precisely, manufacturing export intensity increased by 13.5 per cent
annually, on average – a remarkable performance considering that Rwanda’s population has been
growing at around 2 per cent per year.20 At the same time, Rwanda still has a long way to go if it is to
close the gap to the leading industrial power in Africa in terms of export intensity, i.e. South Africa. As
of 2019, South Africa’s export intensity exceeded Rwanda’s by a factor of nearly seventeen times.
The status quo development of Rwanda’s manufacturing export intensity is in many respects similar
to that of overall merchandise exports: it remains at a very low level, namely USD 12 (as of 2018), but
grew dynamically after 2010, with an average annual growth rate of 18.5 per cent, outperforming all
other countries in the ECA region. Again, the distance to South Africa is large, but the export intensity’s
dynamic development signals that there must be a potential for many industries to also become
competitive in the manufacturing sector.
Export diversification and sophistication
A transformation process with a structural upgrading component requires not only a quantitative
expansion of exports but typically also a qualitative improvement of the export structure. Rwanda
currently has a very narrow export base that is strongly dominated by animal and mineral products,
and reflects the key role of agriculture in the economy (Table 1). Typically, the list of the top five export
products account for between 75 per cent to 80 per cent of total goods exports and does not include
any manufactured products.
Despite the strong concentration of exports in primary products, it is also true that exports have
become significantly more diversified and more sophisticated (Figure 9).21 While Rwanda clearly
started from a relatively low level of both export diversification and export sophistication, the situation
improved considerably between 2010 and 2019. Specifically, exports became significantly more
diversified, as measures by the Herfindahl-Hirschman Index (HHI), which dropped from 0.15 (2010) to
0.07 (2016). It is also remarkable that Rwanda is the only country in the EAC region that simultaneously
managed to (i) diversify its exports, (ii) increase its level of export sophistication (from 8.8 in 2010 to
9.2 in 2018), and (iii) increase the share of manufactured exports in total exports, which rose from 8
per cent in 2010 to 18 per cent in 2019 (indicated by the size of the bubble in Figure 9).
19 Export intensity in this context refers to nominal merchandise exports per capita. 20 Inflation does not change this result as the relatively volatile inflation rate was even slightly negative, on average, over the
period 2010–2019. Hence, the positive trend is confirmed by the data on real manufacturing value added per capita. 21 According to a commonly used measure for the level of sophistication of a country’s export basket that is based on the
export products’ exclusivity (i.e. a low number of countries exporting it). For details, see Hausmann et al. (2007).

24
Table 1: Rwanda’s main export products, 2010, 2017, 2018
Rank Product Product group Export share
(% goods exports) Exports (mn USD) RCA
Year: 2018
1 Gold Precious metals 65.62 636.5 39.6
2 Niobium, tantalum, vanadium
and zirconium ore Mineral products 7.91 76.7 745.2
3 Coffee Vegetable products 6.85 66.4 40.8
4 Tin Ores Mineral products 6.26 60.7 2000.7
5 Tea Vegetable products 5.78 56.1 137.8
Top 5 92.42 896.4
Year: 2017
1 Coffee Vegetable products 26.8 60.0 143.7
2 Tea Vegetable products 21.63 48.4 495.4
3 Niobium, tantalum, vanadium
and zirconium ore Mineral products 17.59 39.4 2112.0
4 Tin ores Mineral products 6.41 14.3 2225.8
5 Tungsten ore Mineral products 3.43 7.7 3779.3
Top 5 75.86 169.8
Year: 2010
1 Coffee Vegetable products 26.36 90.9 162.5
2 Tin ores Mineral products 24.73 85.3 6800.7
3 Niobium, tantalum, vanadium
and zirconium ore Mineral products 15.74 54.3 1760.8
4 Tea Vegetable products 9.11 31.4 218.3
5 Tungsten ore Mineral products 2.99 10.3 2206.2
Top 5 78.93 272.2
Note: RCA= revealed comparative advantage. The revealed comparative advantage is an index representing the ratio between the share of country´s sector exports in total country exports and the share of world sector exports in total world exports. A value of the index higher than 1 flags a specialisation of a country in a certain sector bigger than at world level. Source: Observatory of Export Complexity (based on data from CEPII’s BACI database).
As mentioned above, all of these positive trends may be partly attributable to a base effect, but it
nevertheless adds a positive qualitative element to the positive quantitative trends. The comparison
with other EAC members clearly demonstrates that these improvements are by no means a general
trend in the region. Neither Tanzania (which has a higher GDP per capita) nor fast-growing Ethiopia,
for example, managed to increase their level of export sophistication. Kenya and Uganda, on the other
hand, witnessed a loss of export diversification.

25
Figure 9: Export development in Rwanda and EAC partner countries, 2010 vs 2018
Note: The bubble size indicates the share of manufactured goods exports (according to SITC) in total exports. Export diversification is the normalized Herfindahl-Hirschman Index (HHI) which ranges from 0 to 1. Export sophistication is the EXPY measure developed by Hausman et al. (2007). In contrast to the other two indicators, the later period of the HHI refers to the year 2019 (instead of 2018), except for Rwanda, where the last available year is 2016. Export sophistication for Tanzania is the year 2015 (instead of 2018). The HHI is calculated at the HS 6-digit level for all export products. The level of export sophistication is expressed in logs. Source: UN Comtrade (downloaded over WITS) using the Trade Outcomes Indicators tool.
This generally positive trend could indicate that the basic framework condition that enables product
upgrading and diversification in resource-based and labour-intensive manufacturing industries is a
promising route for a more dynamic industrial development process in line with the country’s policy
objectives.
c) Regional integration and international markets
As a landlocked and relatively isolated country that is far from any major markets, Rwanda has an
intrinsic interest in regional integration. The country has therefore actively pursued further regional
integration efforts. This includes, above all, the development of the common market within the EAC,
with the lowering of common external tariffs, the promotion of harmonized standards in goods and
services and the removal of remaining non-tariff barriers (NTMs) being key priorities (World Bank and
RWA
KEN
TZA
UGA
ETH
RWA
KEN
TZA
UGA
ETH
8.6
8.8
9
9.2
9.4
-0.010 0.020 0.050 0.080 0.110 0.140
exp
ort
so
ph
isti
cati
on
export diversification lowhigh
2010 2018

26
Government of Rwanda, 2019).22 Rwanda also supports the development of the Common Market for
Eastern and Southern Africa (COMESA), a pan-African free trade area comprising over 20 member
states. Furthermore, a joint report by the UN Economic Commission for Africa and Trademark East
Africa (2020) suggests that further advances towards regional integration would provide substantial
benefits for the economies of East Africa. A comprehensive African Continental Free Trade Area
(AfCFTA), which entails the liberalization of goods and services trade, is estimated to increase intra-
African exports by more than USD 1.1 billion and welfare by USD 1.8 billion. Related employment
opportunities will mainly emerge in labour-intensive industries and could also support economic
diversification in the region as the manufacturing sector is likely to be a key beneficiary of such an
agreement (UN Economic Commission for Africa and Trademark East Africa, 2020).
While the importance of EAC partners as destinations for exports have diminished over time (Table 2),
they are still a major source of imports, accounting for nearly 20 per cent of imports. Moreover,
regional integration, which is a stated objective of the NST, is more important for Rwanda than
suggested by trade statistics, as it depends on EAC partners for access to seaports, notably Mombasa
(Kenya) and Dar es Salaam (Tanzania).23 Cooperation with EAC partners is also key for the development
of regional value chains, which Rwanda could strongly benefit from (World Bank and Government of
Rwanda, 2019), in particular, to secure the required inputs (such as cotton in the textile industry), but
also as outlets for manufactured goods to benefit from economies of scale. One important partner
country is neighbouring DR Congo, which is Rwanda’s primary destination for manufactured goods,
which absorbs some 37 per cent of Rwanda’s total manufactured exports. This situation is partly
explained by the usual ‘gravity factors’, that is, geographic proximity and the DR Congo’s market size.
Another part of the explanation may also be that the DR Congo is a relatively easy export market.
Rwanda’s trading partners have changed considerably over time, especially in terms of export markets,
when in 2019, the United Arab Emirates became Rwanda’s main export partner, which is related to
increased gold exports. Gold has potential as an export item, especially because of the new gold
refinery24 located in the Kigali Special Economic Zone (SEZ) in Gasabo District.25 A contentious issue in
this context, however, could be the sourcing of the raw material, as Rwanda’s own raw material
reserves are clearly insufficient for the gold refinery’s capacity.
22 The remaining NTMs are one of the key reasons why trading across borders is perceived as being a major obstacle to doing business in Rwanda (see Section IV).
23 Information obtained from consultations with stakeholders. 24 The project is a joint venture between Hilly Metals Company and the Rwandan company Aldabra. 25 See: https://www.newtimes.co.rw/news/rwanda-gold-refinery.

27
Table 2: Rwanda’s main trading partners, total goods and manufactured exports, 2010 vs 2019
Share in %
of total Trade value (USD mn)
Share in % of total
Trade value (USD mn)
2019 Exports, total 2019 Imports, total
United Arab Emirates 43.7 341.5 China 19.9 635.3
DR Congo 7.9 62.0 India 8.8 280.5
Switzerland 6.9 53.7 Kenya 8.7 278.5
Pakistan 5.0 39.1 Tanzania 8.4 269.7
United Kingdom 4.8 37.6 United Arab Emirates 7.6 244.1
Singapore 3.8 29.7 Saudi Arabia 4.8 152.3
Uganda 3.6 28.3 South Africa 3.9 124.1
Burundi 3.5 27.0 Switzerland 3.6 114.2
South Sudan 2.5 19.8 Germany 2.9 92.8
Kenya 1.5 11.7 Turkey 2.4 75.1
World 100.0 780.8 World 100.0 3,195.2
Sub-Saharan Africa 20.8 162.2 Sub-Saharan Africa 27.2 867.9
East African Community 11.6 90.3 East African Community 18.5 590.4
2010 Exports, total 2010 Imports, total
Kenya 18.9 38.9 China 15.0 211.3
Switzerland 18.0 37.1 Uganda 12.7 178.9
Belgium 13.0 26.7 Kenya 10.1 142.2
Hong Kong 9.3 19.2 India 5.5 77.2
China 8.5 17.6 Tanzania 5.4 75.9
DR Congo 7.9 16.3 Japan 5.3 74.1
United Kingdom 5.3 10.9 United Arab Emirates 5.1 71.2
USA 3.6 7.4 Belgium 3.6 50.6
Uganda 2.8 5.8 USA 3.3 46.4
Eswatini 2.1 4.3 Germany 3.0 42.8
World 100.0 206.0 World 100.0 1,405.2
Sub-Saharan Africa 36.3 74.7 Sub-Saharan Africa 34.1 479.7
East African Community 24.7 50.8 East African Community 28.4 399.1
2019 Exports, manufactured 2019 Imports, manufactured
DR Congo 36.9 23.8 China 32.5 585.6
United Arab Emirates 15.3 9.9 India 11.4 205.5
Burundi 8.0 5.2 Kenya 9.3 168.5
Uganda 5.8 3.8 Tanzania 5.9 106.0
USA 4.9 3.2 United Arab Emirates 5.0 90.3
Belgium 4.7 3.0 Germany 4.1 73.1
United Kingdom 3.7 2.4 Turkey 3.3 60.0
France 2.8 1.8 South Africa 2.5 44.8
China 2.2 1.4 USA 2.2 40.3
Tanzania 1.9 1.2 Belgium 1.7 30.2
World 100.0 64.6 World 100.0 1,803.8
Sub-Saharan Africa 61.1 39.5 Sub-Saharan Africa 19.6 352.8
East African Community 17.9 11.6 East African Community 16.6 299.1
Note: For 2010, the East African Community figures exclude South Sudan. Source: UN Comtrade (downloaded over WITS). Authors’ own calculations.
d) Structural upgrading and value chain development in priority sectors
With the share of agriculture accounting for roughly one-third of domestic value added and two-thirds
of employment, the need to structurally upgrade Rwanda’s economy towards activities with a high
potential for value added creation is obvious. However, such a structural transformation process is not
set in motion automatically but requires active policy support. Rwanda’s NST as well as numerous

28
other policies such as the Made in Rwanda Strategy (2011) or the DMRS (2015), take account of this
fact and highlight the need to develop entire value chains.
Table 3: Rwandan trade by processing stage, 2010 vs 2019
(a) Trade in primary and processed food and beverages
(b) Trade in coffee
(c) Trade in industrial supplies (excluding capital goods)
Note: Panels (a) and (b): classification by Broad Economic Categories (BEC). Panel (c): Coffee includes product categories 0711 coffee, not roasted, and 0712 coffee, roasted, according to SITC 3 classification. Values refer to nominal values in thousands USD. Source: UN Comtrade (downloaded over WITS). Authors’ own calculations.
In this context, the NST identifies agro-processing, meat and dairy, and textiles and garments as priority
sectors, among others. These sectors are well identified as many of the prerequisites in terms of
required resources, including both natural endowments, human skills and technologies, seem to be
available in Rwanda. So far, however, the development of value chains linking primary activities (i.e.
agriculture and livestock farming) with downstream activities appears to be incomplete. And just like
a chain is only as strong as its weakest link, a value chain is often only as efficient as its biggest
bottleneck allows. Hence, a shortcoming along a value chain tends to make downstream products and
activities uncompetitive. This becomes evident in Rwanda’s export profile by processing stage.
Although the trend points towards processed products, Rwanda still exported nearly 70 per cent of its
food and beverages as primary products, that is, unprocessed in 2019 (Table 3, panel a). At the same
time, three-quarters of imported food and beverages constitute processed goods, which points to the
primary processed primary processed primary processed primary processed
2010 90.1% 9.9% 95.4% 4.6% 21.3% 78.7% 23.8% 76.2%
2017 71.7% 28.3% 60.3% 39.8% 22.4% 77.6% 38.5% 61.6%
2018 74.5% 25.5% 59.6% 40.4% 27.1% 72.9% 42.9% 57.1%
2019 68.1% 31.9% 55.8% 44.2% 25.1% 74.9% 43.3% 56.8%
Exports Imports
(% of total food and beverages)(% of total food and beverages for
industrial use)(% of total food and beverages)
(% of total food and beverages for
industrial use)
unroasted roasted values unroasted roasted values
in USD '000 in USD '000
2010 100.0% 0.0% 55,690 27.9% 72.1% 37
2017 99.5% 0.5% 64,580 92.6% 7.4% 35
2018 99.7% 0.3% 70,257 99.4% 0.6% 2,757
2019 99.8% 0.2% 69,811 99.8% 0.3% 423
Exports Imports
in % of total coffee in % of total coffee
primary processed primary processed
2010 91.1% 8.9% 83.7% 16.3%
2017 71.3% 28.7% 90.1% 9.9%
2018 74.7% 25.3% 89.0% 11.0%
2019 25.9% 74.1% 92.6% 7.4%
(% of total food and beverages) (% of total food and beverages)
ImportsExports

29
potential for import substitution that is likely to be present, as not all agricultural imports can be
assumed to be non-competing imports. As emphasized in Rwanda’s DMRS, import substitution is not
to be achieved by shielding domestic industries from foreign competition by raising tariffs, but by
making Rwandan producers internationally competitive, an objective that is echoed in Rwanda’s
industrial policy which is currently in the process of being updated.
Panel (b) of Table 3 shows that the export of products in their raw form is also represented in major
export items such as coffee. Essentially, all of Rwanda’s coffee is exported in unroasted form. The fact
that imports of roasted coffee are minor indicates that Rwanda has roasting capacities at its disposal,
but they seem to be used for domestic coffee consumption only – presumably due to a lack of
international competitiveness. Making the downstream value chain activities, including roasting,
packaging and ideally also branding, internationally competitive—in line with Rwanda’s export
strategy and the “Made in Rwanda” strategy—would open up new potential for value added and
employment generation.
The described export profile geared towards primary exports is also found in numerous other industrial
supplies (Table 3, panel c), hence the development of value chains emerges as a key element in
Rwanda’s industrial development strategy with a substantial potential for employment generation.
Given the importance of structural upgrading for Rwanda’s economy, and the identification of the food
and beverages industry (associated with agro-processing) and the textiles and wearing apparel
industry as priority sectors (see Chapter 2), the development of value chains for the agro-processing
and textiles and garments industries, although industry-specific and not of a cross-cutting nature,
emerge as strategic priorities.
One of the major challenges for the textile and wearing apparel industries, which have also been
defined as an industrial policy priority, are the fragmented value chains (along with limited skills) and
have so far prevented these industries from fully unleashing their potential for job and value added
creation (World Bank and Government of Rwanda, 2019). However, the step-up in support measures
since 2015 developed by the Rwanda Development Board, the National Industrial Research and
Development Agency of Rwanda (NIRDA) and the Ministry of Trade and Industry, which provided land
in specialized industrial parks to various textile and wearing apparel industries, has led to a significant
acceleration of the industries’ overall job creation and export growth rate (World Bank and
Government of Rwanda, 2019). Therefore, the industrial policy approach applied to the textile and
wearing apparel industries could serve as a broader model for industrial policy, including the attraction
of foreign direct investment.

30
Social Performance
a) Social inclusion and employment
Poverty, inequality and undernourishment
With the impressive growth rate Rwanda has recorded over the past two decades, the country has also
been able to reduce poverty and significantly extend the life expectancy of its—predominantly very
young—population (World Bank and Government of Rwanda, 2019). Hence, Rwanda’s economic
development features many aspects of an inclusive and pro-poor growth process. Despite this social
progress, major challenges remain. About half of the population still lives in extreme poverty,26 and a
moderately high Gini coefficient (44 in 2016) indicates that inequality must be monitored as well. The
fact that according to internationally comparable data, the prevalence of undernourishment among
the population has not diminished is surprising as well (Figure 10). On the contrary, between 2010 and
2017, a slight increase to 37 per cent was recorded. This development counteracts the decline in
poverty rates and could possibly also point to logistical difficulties within the country. In any case, a
comparatively high rate of undernourishment confirms, on the one hand, the need to focus on the
development of reliable supply chains, including transportation and logistics, and the choice of agro-
processing as a priority industry (see Chapter 2) and a thematic component, on the other, as it may
have wider social implications.
Figure 10: Prevalence of undernourishment in Rwanda and in competitor countries, 2010 vs 2017
Note: The prevalence of undernourishment in per cent of the total population. Data for Burundi and South Sudan not available Source: World Bank WDI.
26 Applying the World Bank’s ceiling for extreme poverty of USD 1.90, 56 per cent of Rwandans lived in extreme poverty in 2016.

31
Participation of women and youth in the labour market
An important component of inclusion is the active participation of both sexes in social and economic
life. In post-genocide Rwanda, women made up an estimated 60 per cent to 70 per cent of the
population, which can be deemed as one of the contributing factors that led the country to follow a
deliberate policy of empowering women, which is constitutionally backed.27 This policy has had a
genuine impact, with women now holding 64 per cent of seats in the lower house of Rwanda's
parliament. School enrolment rates at the primary and secondary levels are comparable for both girls
and boys; maternal and infant mortality has dropped significantly, and Rwanda has also achieved one
of the highest rates of female labour force participation, not only in Africa, but in the world (Figure 11).
In fact, with a female labour force participation of 83.9 per cent in 2019, there is even a negative male-
female gap.
Figure 11: Labour force participation rates in Rwanda and competitor countries, 2019
Note: The gap is the difference between the male and the female labour participation rate (population 15 years and above). Source: ILO database (obtained via the World Bank’s WDI).
Women are also well represented across a large number of industries, with the overall female
employment rate in the economy standing at 44 per cent (Figure 12). Women are clearly
overrepresented in agriculture, wholesale and retail sale services and health services. The share of
female employment in manufacturing equals that of the economy as a whole, which is important as it
indicates that a more manufacturing-led development process is going to offer new job opportunities
of women in the Rwandan economy.
27 See: “A mixed tale of women’s empowerment in Rwanda”, Al-jazeera, 20 September 2018. Available at: https://www.aljazeera.com/indepth/features/mixed-tale-women-empowerment-rwanda-180918131311419.html.
-5.0
0.0
5.0
10.0
15.0
20.0
25.0
0.0
20.0
40.0
60.0
80.0
100.0
RWA BDI KEN SSD TZA UGA MLI MWI TCD ZAF ETH SSA LIC
Lab
ou
r fo
rce
par
tici
pat
ion
rat
e
Female Male Gap male-female

32
Figure 12: Share of female employment across industries in Rwanda, 2018
Note: Population 16 years or older. Source: NISR (Rwanda Labour Force Survey).
Having said this, there is room for improvement of gender issues in Rwanda. On the downside, Rwanda
is still perceived as a patriarchal society28 which, among others, implies a relatively segmented labour
market which is masked in the general sectoral employment patterns, but is reflected in the available
data on trainings attended (Table 4). Such a segregation also exists within the manufacturing sector,
which consists of typically ‘female industries’ or jobs and ‘male industries’ or jobs. The number of men
and women who participate in technical training, available by occupation, clearly demonstrates this.
What is of relevance for the manufacturing sector is that tailors, who are typically employed in the
textile and wearing apparel industries, are typically female,29 which implies that women would benefit
more proportionately from an expansion of these industries. The same is true for the food and
beverages as well as agro-business trainings,30 which are predominantly attended by women as well.
By contrast, technically-oriented occupations, such as mechanics or carpentry, are male-dominated.
This occupational gender divide needs to be kept in mind when discussing new technologies and the
transition to Industry 4.0.
28 See: “A mixed tale of women’s empowerment in Rwanda”, Al-jazeera, 20 September 2018. Available at: https://www.aljazeera.com/indepth/features/mixed-tale-women-empowerment-rwanda-180918131311419.html.
29 This is observable not only in Rwanda, but is a typical pattern across developing countries and beyond. 30 This may be less true for livestock herding and associate activities.
0%
10%
20%
30%
40%
50%
60%

33
Table 4: Number of persons attending trade and technical training in Rwanda, 2018
Technical skills acquired Total Share of females
Total persons in training 1,102,444 45.0%
Crop production 1,135 100.0%
Housekeeping 196 100.0%
Manicure and pedicure 286 100.0%
Crochet embroidery 44,963 92.0%
Tailoring 345,940 90.9%
Biding and jewelleries 9,247 90.5%
Beauty therapy 2,873 84.9%
Pottery 3,866 76.5%
Culinary arts 50,491 75.5%
Hairdressing 58,171 74.8%
Agri-business 1,662 65.7%
Food & beverage services 7,919 64.2%
Milk processing 434 56.2%
Front office 4,951 54.0%
Multimedia 627 53.4%
Food processing 3,090 49.1%
Leather crafts 3,155 44.9%
Animal health 1,636 43.0%
Software development 5,348 39.9%
Livestock 1,765 38.1%
Sport and medical massage 452 25.9%
NCDs and palliative care community health 1,020 25.9%
Other 13,482 25.4%
Nursery growing 661 20.3%
Forestry 314 17.2%
Plumbing 6,279 16.7%
Film making 3,797 15.6%
Civil engineering 6,294 14.7%
Computer maintenance 5,037 13.7%
Painting and decoration 5,827 10.6%
Industrial electricity 4,086 10.6%
Domestic electricity 36,577 10.6%
Motor vehicle engine mechanics 13,261 5.1%
Automotive technology 13,850 4.6%
Masonry 249,237 4.0%
Auto - electricity 1,059 3.7%
Carpentry 82,207 2.8%
Automotive body repair 65,292 2.2%
Welding 26,508 1.0%
Engine mechanics 15,363 0.4%
Music 1,695 0.0%
Networking 774 0.0%
Concrete masonry 425 0.0%
Agriculture mechanization 65 0.0%
Bee keeping 104 0.0%
Screen printing 1,025 0.0%
Note: Population 16 years or older. Source: National Institute of Statistics of Rwanda (NISR) – National Labour Force Survey for 2018.
'fem
ale'
occ
up
atio
ns
'mal
e' o
ccu
pat
ion
s

34
Another potentially vulnerable group in the labour market are young people, as the lack of previous
experience often makes it more difficult for them to find a job. This problem is obviously aggravated
in an environment where formal jobs are rare so that the only alternative for earning a living are often
informal activities, such as petty trade or (subsistence) agriculture. One result is that the youth
unemployment rate is generally higher than in the overall working age population. This is also the case
in Rwanda, where the unemployment rate stood at 18.7 per cent according to the National Labour
Force Survey (LFS) of 2018, a rate that has certainly increased since then due to the COVID pandemic.
What is more telling than the unemployment rate about the labour market opportunities of young
people is the share of youth, i.e. persons aged 15–24 years old, that are neither employed nor in
education (NEETs). In Rwanda, NEETs account for about one-third of youth, with the share of females
being even higher (Figure 13). This share of NEETs is in line with figures observed in many other African
countries, but is substantially higher than in neighbouring Kenya and Tanzania. The relatively high rate
of NEETs is just another indicator that Rwanda has not yet fully unleashed the potential of its young
population.
It is also true, however, that a considerable share, namely 28 per cent, of Rwanda’s working age
population continue their education either at the university level (12 per cent) or undergo some trade
or technical training (16 per cent),31 mainly at vocational schools; or an apprenticeship and on-the-job
training, and only to a lesser extent through friends or family. This demonstrates that an active
vocational training system is in place in the country, though its capacity may not be sufficient to provide
a place for all people seeking training.
Figure 13: Share of NEETS in Rwanda and comparator countries, 2018
Note: NEETs= Persons aged 15–24 years who are not in education, employment or training. Source: ILO database based on national sources.
31 Data is taken from the National Labour Force Survey of 2018, available from the National Institute of Statistics of Rwanda (Tables 6 and 11).
0.0
10.0
20.0
30.0
40.0
RWA KEN TZA UGA MLI MWI ZAF
NEE
TS in
%
Female Male Total
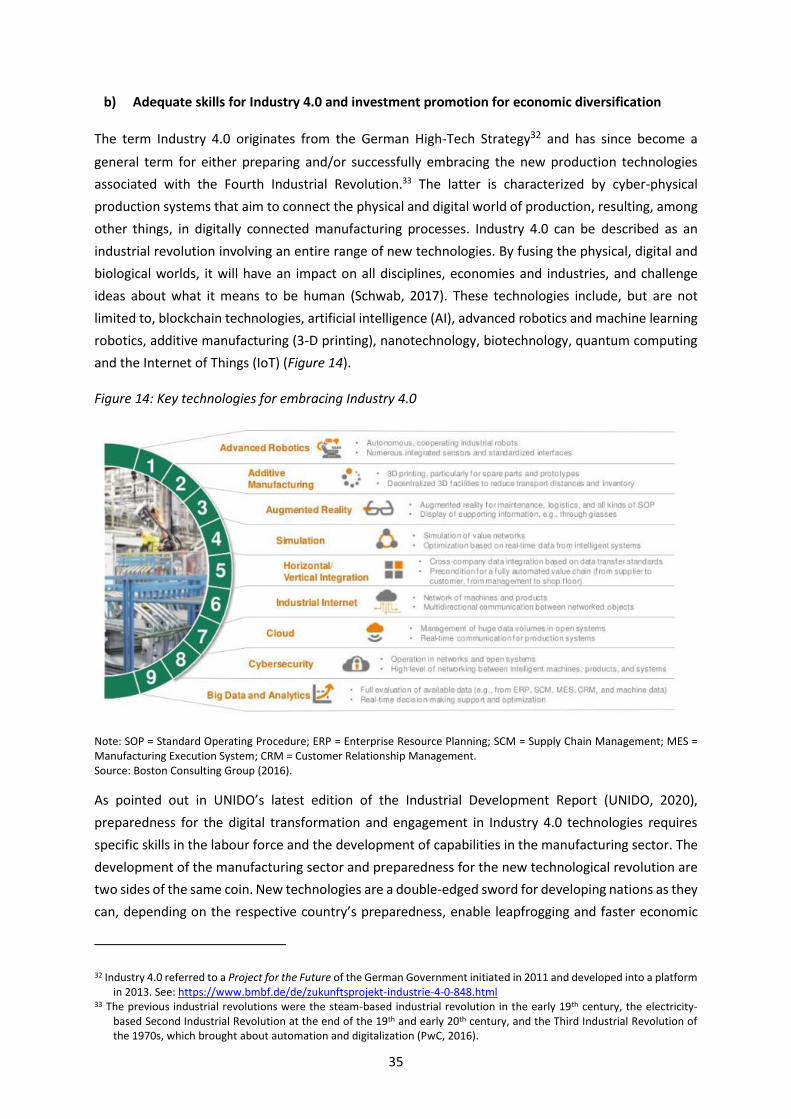
35
b) Adequate skills for Industry 4.0 and investment promotion for economic diversification
The term Industry 4.0 originates from the German High-Tech Strategy32 and has since become a
general term for either preparing and/or successfully embracing the new production technologies
associated with the Fourth Industrial Revolution.33 The latter is characterized by cyber-physical
production systems that aim to connect the physical and digital world of production, resulting, among
other things, in digitally connected manufacturing processes. Industry 4.0 can be described as an
industrial revolution involving an entire range of new technologies. By fusing the physical, digital and
biological worlds, it will have an impact on all disciplines, economies and industries, and challenge
ideas about what it means to be human (Schwab, 2017). These technologies include, but are not
limited to, blockchain technologies, artificial intelligence (AI), advanced robotics and machine learning
robotics, additive manufacturing (3-D printing), nanotechnology, biotechnology, quantum computing
and the Internet of Things (IoT) (Figure 14).
Figure 14: Key technologies for embracing Industry 4.0
Note: SOP = Standard Operating Procedure; ERP = Enterprise Resource Planning; SCM = Supply Chain Management; MES = Manufacturing Execution System; CRM = Customer Relationship Management. Source: Boston Consulting Group (2016).
As pointed out in UNIDO’s latest edition of the Industrial Development Report (UNIDO, 2020),
preparedness for the digital transformation and engagement in Industry 4.0 technologies requires
specific skills in the labour force and the development of capabilities in the manufacturing sector. The
development of the manufacturing sector and preparedness for the new technological revolution are
two sides of the same coin. New technologies are a double-edged sword for developing nations as they
can, depending on the respective country’s preparedness, enable leapfrogging and faster economic
32 Industry 4.0 referred to a Project for the Future of the German Government initiated in 2011 and developed into a platform in 2013. See: https://www.bmbf.de/de/zukunftsprojekt-industrie-4-0-848.html
33 The previous industrial revolutions were the steam-based industrial revolution in the early 19th century, the electricity-based Second Industrial Revolution at the end of the 19th and early 20th century, and the Third Industrial Revolution of the 1970s, which brought about automation and digitalization (PwC, 2016).

36
catch-up or, in the absence of basic capabilities, skills and institutions, raise additional barriers to
convergence. To unfold their potential, advanced digital production technologies require
complementary skills. These ‘skills of the future’ can be grouped into three categories, namely (i)
analytical skills, (ii) specific technology-related skills, which include science, technology, engineering
and math (STEM) skills and ICT-related skills, and (iii) soft skills. In the Global Talent Competitiveness
Index (GTCI) (INSEAD, 2020), an attempt is made to accurately measure such skills and talents,
differentiating between vocational training skills and global knowledge skills.34 As Figure 15 illustrates,
East African economies, including Rwanda, do not score high in vocational and technical skills and even
less in global knowledge skills. There is a significant gap even to the regional leader, South Africa, both
with respect to vocational training skills and global knowledge skills.
Figure 15: Global knowledge skills and vocational and technical skills in Rwanda and competitor
countries, 2020
Note: VT Skills = vocational training skills include (i) mid-level skills, which are based on GTCI scores for the workforce with secondary education; population with secondary education; technicians and associate professionals; labour productivity per employee; and (ii) employability which is based on GTCI scores for relevance of the education system to the economy; skills matching with secondary education; skills matching with tertiary education. GK Skills = global knowledge skills include (i) high-level skills based on GTCI scores for the workforce with tertiary education; population with tertiary education; professionals; researchers; senior officials and managers; availability of scientists and engineers; and (ii) talent impact based on GTCI scores for innovation output; high-value exports; new product entrepreneurial activity; new business density; scientific journal articles. Source: Global Talent Competitiveness Index (GTCI).
The gap to the African technological frontier is confirmed by more conventional data on skills from
Rwanda’s National Labour Force Statistics (Figure 16). As of 2019, over 80 per cent of Rwanda’s
working age population only has basic skills or less than basic skills. While this skill structure is quite
common across EAC partner countries and other African economies, the differences to South Africa
are obvious. Equally obvious is that any skill upgrading in Rwanda towards both intermediate and
34 Vocational training skills and global knowledge skills are output measures for the availability of talent in the medium-skill and high-skill segments of the labour force, respectively. For details, see notes for Figure 15.
13.7
4.0
14.7
10.4 11.7
28.5
13.912.4
28.0
21.7
44.3
24.827.8
44.4
21.2
29.7
0.0
10.0
20.0
30.0
40.0
Skill
s in
dex
Global knowledge skills Vocational and technical skills

37
advanced skills would facilitate the adoption of new disruptive technologies related to Industry 4.0.
Given this current skill profile, a quantitative as well as qualitative upgrading of the vocational training
system could be an important steppingstone towards closing the apparent skill gap.35
Against this background, it is not surprising that Rwanda is categorized as a laggard economy in the
Industrial Development Report (UNIDO, 2020), that is, an economy that is not strongly engaged in
advanced digital technologies and Industry 4.0. An ambitious objective for Rwanda, in line with
numerous other development objectives, could thus be to become a follower economy as a user of
advanced digital technologies, a position currently maintained by South Africa, for example.36 Follower
economies are economies that participate in the global economy as users of advanced digital
technologies, but are neither actively involved in Industry 4.0 innovation activities nor in the
production of such technologies – an activity performed by frontrunner economies only. However,
they can strongly benefit by absorbing and adapting such technologies to their specific needs.
Figure 16: Population shares by skill level, 2019 or latest year available
Skill level Rwanda Burundi Kenya Tanzania Uganda
Unknown 0.0% 0.7% 71.1% Less than basic 12.7% 82.6% 10.5% 77.4% 13.4%
Basic 69.7% 13.9% 45.3% 17.5% 7.0%
Intermediate 11.2% 2.6% 39.0% 4.1% 8.2% Advanced 6.3% 0.9% 4.4% 1.0% 0.4%
Total 100.0% 100.0% 100.0% 100.0% 100.0%
Skill level Mali Malawi Chad South Africa Ethiopia
Unknown 0.1% 1.6% 2.0% Less than basic 69.9% 14.2% 64.8% 12.4% 50.7%
Basic 23.9% 72.9% 26.6% 48.1% 40.2%
Intermediate 4.2% 11.9% 5.7% 26.9% 6.1%
Advanced 2.0% 1.0% 2.7% 10.9% 1.0%
Total 100.0% 100.0% 100.0% 100.0% 100.0%
Note: Data refers to working-age population. Data refers to 2013 for Ethiopia; 2014 for Burundi, Tanzania; 2016 for Kenya; 2017 for Uganda and Malawi; 2018 for Mali and Chad. Source: ILO database (based on national LFS data).
Continuous investments in digital and ICT infrastructure and complementary skills is one way to benefit
from the new digital technologies which can help overcome existing bottlenecks and foster substantial
productivity increases. In fact, these investments are crucial as no country will remain unaffected by
the disruptive impact of digital technologies on industry and societies as a whole. Moreover, the
technologies will affect what, how and where manufacturing products are produced, irrespective of
their tech content (World Bank and Government of Rwanda, 2019). Industry 4.0 will generate an
increasing merger of products and services. Specifically, the continuous embedment of software,
35 See also Ministry of Trade and Industry (2011). 36 Malawi, Uganda and Ethiopia are categorized as latecomer economies (as users), while all other comparator countries are
classified as laggards.

38
sensors and network connectivity in products—ranging from smart watches to smart homes—can help
countries address existing business obstacles. For example, modern technologies might mitigate the
disadvantages related to Rwanda’s distance to major markets. Rwanda is therefore likely to benefit
from its investments in network connectivity and sensor deployment in different applications (World
Bank and Government of Rwanda, 2019). Examples include investments in the use of (unmanned)
drones for deliveries of critical medical supplies to remote locations; the use of an electronic platform
in agriculture that provides farmers, consumers and traders with up-to-date price information by short
message service; and in mobile phone networks. With regard to the latter, the Government of Rwanda,
in partnership with the Korean telecommunications provider KT Corporation, is rolling out a high-speed
4G (LTE) broadband network across the country, which aims to achieve a coverage of 95 per cent.37
Figure 17: Digital & IT infrastructure in Rwanda and competitor countries, 2010–2017
Note: The Digital & IT Infrastructure Index captures the extent to which IT infrastructure is adequate for business needs; subscriptions to a mobile telephone service; households with a computer; and internet subscriptions. It consists of four sub-indicators. Source: Ibrahim Index of African Governance.
These services and technologies are just the beginning, and Rwanda’s firms and consumers would
certainly benefit from further investments in the digital and IT infrastructure, which still has substantial
potential for further improvements, despite the progress that has been achieved over the past years
(Figure 17).
Interestingly, there seems to be a positive perception in Rwanda about the domestic education system
(Figure 18). Rwanda scores high in terms of adequacy of education provided with regard to market
needs (78 out of 100) and the quality of the educational system (83 out of 100).
37 See: https://infomineo.com/rwandas-knowledge-economy/.
22.7
20.8
76.8
0
20
40
60
80
100
2010 2011 2012 2013 2014 2015 2016 2017
Dig
ital
an
d IT
infr
astr
uct
ure
ind
ex
Rwanda EAC South Africa

39
Figure 18: Quality of education and its alignment with market needs, 2008–2017
Note: Alignment of education with market needs is an indicator that assesses how well the educational system meets the needs of a competitive economy, ranging from ‘not well at all’ to ‘extremely well’. Education quality assesses the extent to which there are solid institutions for basic, secondary and tertiary education, as well as for research and development. It assesses whether education policy is successful in delivering high-quality education and training, and research and development receive effective support from the government. It does not focus on expenditures alone, but also on the quality and competitiveness of the education system and the research sector, considering: the structure of funding and knowledge providers (public, private and international cooperation); the output of the educational and developmental efforts, e.g. enrolment rates, literacy rates, percentage of people with higher education; and number of patent applications. Source: Ibrahim Index of African Governance.
Combined with the scores for the country’s skill base and its digital and ICT infrastructure, this positive
assessment indicates that Rwanda’s economy is generally not yet geared towards Industry 4.0.
Nevertheless, many of the trends and above-mentioned examples indicate that with the appropriate
investments in skills and infrastructure, the country could indeed benefit from the digital
transformation as a user of advanced digital technologies.
Science, technology and ICT was already considered a key cross-cutting issue for Rwanda in its Vision
2020, and a highly developed human capital base is identified as a future driver of growth, which is
therefore likely to be an essential element of Vision 2050, given that the digital transformation can be
assumed to remain one of the megatrends.
50
60
70
80
90
2008 2009 2010 2011 2012 2013 2014 2015 2016 2017
Ind
ex (
0-1
00
)
Alignment of education with market needs Education quality

40
Environmental Performance
a) Clean and circular production
Rwanda has taken a strategic decision to pursue a green growth approach to development. This goal
was first stated in the 2003 Environmental Policy and is the cornerstone of the most recent ‘National
Environment and Climate Change Policy’(Ministry of Environment of Rwanda, 2019). Indeed, the
environmental policy indicator, which measures the extent to which environmental concerns are taken
into account in government regulations, suggests that Rwanda is one of the most environment-
oriented countries in Africa, second only to a much more developed South Africa. Also, in terms of
promotion of the environmental sustainability indicator, Rwanda scores high among its peers (Figure
19).
Figure 19: Indicators of environmental policy and promotion of environmental sustainability in Rwanda and comparator countries, 2017
Note: The environmental policy indicator assesses the extent to which environmental concerns are effectively taken into account in both macro- and micro-economic terms. It considers the extent to which the externalization of costs or inadequate time horizons are avoided or restrained by environmental regulation. In macro-economic terms, it assesses whether tax and energy policies take ecological goals and measures into account (e.g. promotion of renewable energies, CO2 reduction goals). In micro-economic terms, it assesses whether the government sets incentives for environmentally sound consumption and investments by households and companies. A deeply ingrained awareness of the environment or nature in society may serve as a functional equivalent. The indicator of promotion of environmental sustainability captures the extent to which environmental policies promote the protection and sustainable use of natural resources and the management of pollution. It consists of two sub-indicators. Source: Ibrahim Index of African governance, http://iiag.online/
However, Rwanda is facing a wide range of environmental problems and challenges, including high
population density, water, air and soil pollution, land degradation, fossil fuel dependency, high-carbon
transport systems, irrational exploitation of natural ecosystems, lack of low-carbon materials for
housing and green infrastructure development, inadequate waste treatment, and increased electronic,
0 10 20 30 40 50 60 70 80 90 100
Rwanda
Burundi
Kenya
South Sudan
Tanzania
Uganda
East African Community
South Africa
Ethiopia
Promotion of environmental sustainability Environmental policies
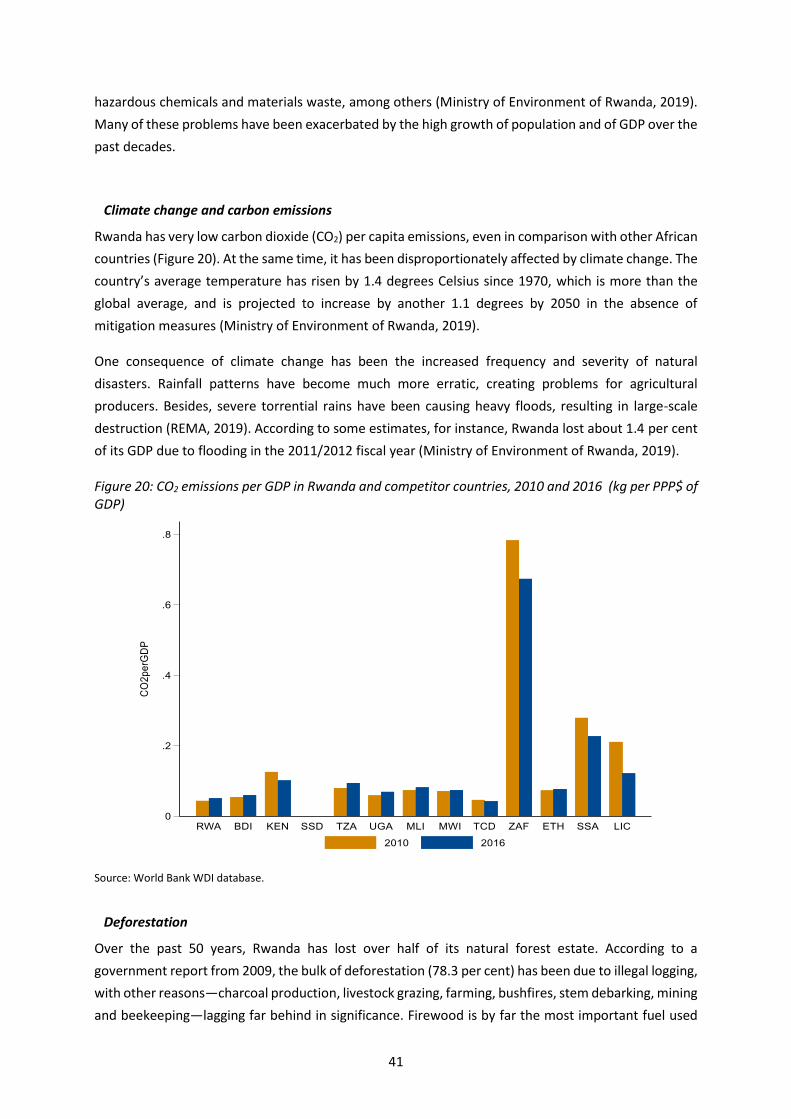
41
hazardous chemicals and materials waste, among others (Ministry of Environment of Rwanda, 2019).
Many of these problems have been exacerbated by the high growth of population and of GDP over the
past decades.
Climate change and carbon emissions
Rwanda has very low carbon dioxide (CO2) per capita emissions, even in comparison with other African
countries (Figure 20). At the same time, it has been disproportionately affected by climate change. The
country’s average temperature has risen by 1.4 degrees Celsius since 1970, which is more than the
global average, and is projected to increase by another 1.1 degrees by 2050 in the absence of
mitigation measures (Ministry of Environment of Rwanda, 2019).
One consequence of climate change has been the increased frequency and severity of natural
disasters. Rainfall patterns have become much more erratic, creating problems for agricultural
producers. Besides, severe torrential rains have been causing heavy floods, resulting in large-scale
destruction (REMA, 2019). According to some estimates, for instance, Rwanda lost about 1.4 per cent
of its GDP due to flooding in the 2011/2012 fiscal year (Ministry of Environment of Rwanda, 2019).
Figure 20: CO2 emissions per GDP in Rwanda and competitor countries, 2010 and 2016 (kg per PPP$ of GDP)
Source: World Bank WDI database.
Deforestation
Over the past 50 years, Rwanda has lost over half of its natural forest estate. According to a
government report from 2009, the bulk of deforestation (78.3 per cent) has been due to illegal logging,
with other reasons—charcoal production, livestock grazing, farming, bushfires, stem debarking, mining
and beekeeping—lagging far behind in significance. Firewood is by far the most important fuel used

42
by households for cooking, albeit with a declining trend over time (Table 5). In addition, the majority
of industrial processing operations in Rwanda use fuel wood as a source of energy as well (REMA,
2009).
Table 5: Distribution of households by primary fuel used for cooking in Rwanda
Fuel 2013/14 2016/17
Firewood 83.3% 79.9%
Charcoal 15.2% 17.4%
Gas 0.1% 1.1%
Others 0.8% 0.9%
Source: REMA (2019).
Recently, the government has undertaken various initiatives to reverse the trend of deforestation,
most notably through pilot projects such as green villages, afforestation programmes and
rehabilitation and restoration of degraded areas. Rwanda has also managed to preserve a green
canopy within national protected areas. On account of all these measures, forest coverage increased
to 29.8 per cent (from 28.3 per cent in 2012) by 2017, of which 11.9 percentage points are accounted
for by natural forests. This nearly matches the government target set for 2020 (30 per cent).
Biodiversity conservation also resulted in the expansion of eco-tourism, which has become an
increasingly important economic sector (Ministry of Environment of Rwanda, 2019).
To facilitate reforestation, the government has also set targets for the percentage of households using
firewood for cooking. According to the National Strategy for Transformation, this percentage shall be
reduced to 66 per cent by 2020/21 and to 42 per cent by 2023/24. Clearly, reaching these targets
would require a replacement of firewood with other energy sources, such as gas and electricity, which
are other important areas of policy intervention.
Land degradation
Deforestation has also been one of the factors facilitating soil erosion and the degradation of lands
more generally. Rwandan soils are naturally fragile, and human activities, such as over-cultivation due
to high population density and the use of chemical fertilizers, are adding to their degradation. Rwanda
is among the three countries in Africa experiencing unusually heavy soil loss. About half of its farmland
has shown evidence of modest to severe erosion, especially in the highlands. In 1986, the agricultural
survey and statistics service estimated that 10 tonnes/ha of arable land was being carried away by
erosion every year (Republic of Rwanda, 2004).
This has adverse effects on land productivity, has caused an increasing number of landslides, and has
resulted in the conversion of farmland into wasteland. The deterioration of soil reduces food
availability for people who depend solely on agriculture. In 2011, it was estimated that soil erosion
affected the ability to feed about 40,000 people per year (REMA, 2019).
Waste management and circular economy
Waste management in Rwanda is still in its infancy. For instance, residential units are currently not
serviced by centralized systems and utilities, neither in urban nor in rural areas. The waste

43
management system consists of the following elements: (i) solid waste collection, fully provided by
private companies and paid directly by households, (ii) small wastewater treatment units specific to a
building or a semi-collective sewer network, which releases uncontrolled treated effluent, (iii) septic
tanks for individual houses and small buildings, and (iv) individual latrines which are emptied regularly
with the faecal sludge disposed in dumping sites (REMA, 2019).
In general, the country has a lot of legislation and regulations on solid waste management, but their
enforcement is weak. For instance, there is a prohibition of manufacturing, importation, use and sales
of polythene bags in Rwanda (in place since 2008), but some people reportedly use plastic bags that
entered Rwanda illegally (Kabera and Nishimwe, 2019). In addition, the poor disposal of electronic,
industrial and nuclear/radioactive waste poses environmental and health risks (Ministry of
Environment of Uganda, 2019).
Most studies on solid waste management in Rwanda focus on the capital City of Kigali, and some
include useful comparisons with other major cities in East Africa (Table 6). Municipal solid waste (MSW)
generation in Kigali is still low by regional comparison. However, it has doubled over the past eight
years, from around 400 to approximately 800 tonnes per day, driven by fast economic growth and the
rapid rise in the city’s population (on average, by 2.6 per cent annually between 2002 and 2012, with
the trend likely having continued in recent years). Based on the current trends, it is estimated that
MSW generation in Kigali could increase by 63 per cent over the next ten years (Rajashekar et al.,
2019).
Table 6: Solid waste management in Kigali, compared to other four major East African cities
Maputo
(Mozambique)
Kampala
(Uganda)
Dar es Salaam
(Tanzania)
Kigali (Rwanda) Nairobi (Kenya)
MSW per capita
(kg/year)
316 201 346 205 350
Waste collection
coverage
82% 50% 40% 88% 52%
Controlled
treatment/disposal
0% 55% 0% 0% 0%
Recycling rate <5% 11% 18% 12% 30%
Note: MSW = Municipal solid waste. Source: Kabera et al., 2019.
Kigali’s waste collection system is based on a public-private partnership, with waste collection carried
out by 12 private companies operating exclusive franchises. Kigali’s only dumpsite (Nduba), which is
owned by the city, was put in operation in 2012 with assistance from the United Nations Development
Programme (UNDP). The system works reasonably well, and Kigali has a high waste collection coverage
of 88 per cent38 – roughly on par with Maputo, which has benefited from extensive international
assistance in this field and is much higher than in other regional peers (Table 6). This arguably makes
Kigali one of the cleanest cities in Africa (Kabera et al., 2019). The progress in MSW collection in Kigali
38 According to some other studies, however, the waste collection coverage rate in Kigali may be much lower. Rajashekar et al. (2019), for instance, put it at only 49 per cent.
44
has been relatively recent: in 2012, the coverage rate was still a mere 44 per cent (other urban areas
of Uganda have witnessed rising waste collection rates as well, although on a less impressive scale:
from 20 per cent to 35 per cent between 2012 and 2015) (REMA, 2019).
At the same time, similarly to most regional peers (except Kampala, which has an engineered disposal
site), Kigali scores poorly with respect to waste treatment and disposal. The Nduba dumpsite is an
open-air site, which lacks monitoring and verification of environmental controls. Its environmental
problems include, inter alia, leachate with high polluting potential, vermin and flies, unpleasant smells
and spontaneous combustions. An environmental impact assessment (EIA) of the site has never been
conducted, since it was originally supposed to only be in operation for two years until a sanitary landfill,
a composting site and a waste-to-energy site were built. However, these projects have never been
implemented (Rajashekar et al, 2019).
Promoting circular economy is one of the government’s priorities within the ‘greening economic
transformation’ policy objective (Ministry of Environment, 2019). However, the recycling rate of MSW
in Kigali (data for Rwanda as a whole are not available) is rather low. Officially, it stands at 2 per cent
(Office of the Auditor General of State Finances, Rwanda, 2016), although alternative studies have
found slightly higher figures: between 10 per cent and 12 per cent (Kabera and Nishimwe, 2019; Kabera
et al., 2019). For comparison, both Dar es Salaam and especially Nairobi have much higher recycling
rates. Kigali has no official recycling system, and recycling activities are generally performed informally
by private companies (mostly focusing on paper and plastics). There is no domestic recycling facility
for PET bottles, which are taken to neighbouring Uganda, Kenya, Tanzania and, until recently, China,
to be recycled (Rajashekar et al, 2019).
The prime reason for Rwanda’s low recycling rate is the fact that people do not separate waste at the
source. Kigali was the first city in East Africa to introduce a system of waste separation in 2008, which
worked well for a while. However, irregular collection of sorted waste and the above-mentioned failure
to build a recycling facility at Nduba have shaken trust in the system. Currently, all recycling in Kigali is
done from mixed wastes, either by collection workers employed by private companies or by pickers
working at Nduba or at illegal dumpsites (Kabera et al., 2019).
Over the last decade, Rwanda has recognized that poor solid waste management is a key obstacle to
sustainable development. This is reflected in the solid waste management targets both at the national
and city levels, which are to promote a ‘green economy’. Specifically, Rwanda’s Vision 2020 strategy
highlights the need for all towns to be serviced by solid waste treatment plants. As highlighted in the
National Sanitation Policy Implementation Strategy of 2016, the government aims to properly dispose
of 60 per cent of domestic waste by 2019/2020 and 80 per cent by 2029/2030. The target for the
recycling rate of non-organic solid waste for 2019/2020 is set at 30 per cent and 40 per cent for
2029/2030 (Rajashekar et al., 2019). Meeting these targets requires considerable policy efforts, both
in Kigali and elsewhere in the country. The construction of sanitary landfills and waste treatment plants
would reduce the incidence of uncontrolled dumping, raise the recycling rate, and encourage waste
separation at the source, thus contributing to the goal of a circular economy.

45
Water resource management
Rwanda has abundant water resources, being part of both the Congo and the Nile River basins and
with several large lakes on its borders with DR Congo and Burundi. In total, wetlands represent about
14.9 per cent of the country’s area, of which 6.3 per cent are marshlands and 8.6 per cent are lakes
and rivers (REMA, 2019). Rivers belonging to the Nile basin are especially voluminous, and some of
them offer hydropower potential, which is not yet being fully exploited (see also section b) below).
Only 20 per cent of total wetlands are fully protected, with 74 per cent under conditional and another
6 per cent under unconditional exploitation (REMA, 2019). Over the past decades, the acute scarcity
of land has accelerated the conversion of wetlands into agricultural production. Climate change has
played a role as well, as decreasing amounts of rainfall have threatened the hydrological regime of
wetlands. In such instances, there tends to be a reduction in the water recharge capacity, since
wetlands remove sediments, nutrients, toxic substances and other pollutants, and thus improve water
quality. Moreover, overall water availability is reduced as well, while sediments interfere with the
smooth flow of water; both negatively affect hydropower potential. Reduced water flow from
degraded wetlands to hydropower stations has resulted in energy crises in the past (REMA, 2009).
Rwanda’s water resources are generally still of a relatively good quality, with pH values between 6 and
7.5 (Ministry of Environment of Rwanda, 2019). However, increasing pollution from agro-inputs has
affected local groundwater, and the ability of ecosystems to naturally purify water is a concern. In
addition, land degradation results in water siltation and reduced water quality (REMA, 2019). In urban
areas, non-treated effluents are often dumped in rivers and marshlands, which results in a high
concentration of coliform bacteria (REMA, 2009).
Also, most of the industries lack waste treatment. Mining, in particular, is a major source of water
pollution. There are localized problems from high sediment loads and toxic and acidifying materials,
including heavy metals (Ministry of Environment of Rwanda, 2019). The preparation of ores, which
uses a lot of water, constitutes a major polluter of streams. A specific case in point is the water draining
in the mining sectors of Rutongo and Gatumba, which pollute the rivers of Nyabarongo and Nyabugogo
by sediments of clay and sand, which they transport over long distances. It is this considerable mineral
load that partly gives them the brown colour that is characteristic of the rivers in Rwanda (REMA,
2009).
For these reasons, the quality of water is not always satisfactory. Water quality tests have revealed
that some rivers contained high levels of the elements under investigation, exceeding WHO
recommendations for drinking water (REMA, 2009). However, access to drinkable water has increased
in recent years to 87 per cent in 2016/17, and the share in Kigali City is as high as 96 per cent (REMA,
2019).
In the future, water use in Rwanda is expected to increase, with more demand for irrigation, more
hydropower generation, and higher water use for industrial purposes, especially the water-intensive,
washed coffee processing (REMA, 2009). To this end, the government developed the National Policy
for Water Resources Management in 2011 as a framework for the conservation, protection and
management of water resources in Rwanda.
46
b) Energy
Access to electricity. High relative energy costs and unreliable power supply is a disincentive for
industrial growth and business expansion (Ministry of Infrastructure, 2015). For a long time, limited
access to electricity and frequent blackouts have been one of the key obstacles for industrial sector
growth (Hausmann and Chauvin, 2015), especially in rural areas. As a result of significant investments,
basic infrastructure, including energy supply, has improved consistently over the past decade (World
Bank and Government of Rwanda, 2019, p. 4). Nevertheless, energy, and above all electricity, remains
a crucial and sensitive issue and is one of Rwanda’s bottlenecks for economic development in general,
and the emergence of a competitive manufacturing sector, in particular. Consultations with
stakeholders confirmed that access to electricity as such has eased slightly in recent years, which is
confirmed by the data (Figure 21, panel a). Between 2010 and 2018, the share of the population with
access to electricity more than tripled, from 10 per cent to 35 per cent. Rwanda’s development follows
the region’s general trend, with many other East African countries making remarkable strides in terms
of electricity access. For a further discussion on energy as a bottleneck for business development, see
Chapter 3.
Electricity remains a crucial issue in Rwanda’s economic development and its social inclusion ambitions
for (at least) two reasons. First, there is a significant divide between electrification in rural and in urban
areas (Figure 21, panel b). As of 2018, only about 23 per cent of the rural population had access to
electricity, compared to nearly 90 per cent in urban centres. Second, the issue of the cost of electricity
remains.
Price of electricity. Interestingly, the comparison of electricity prices in Rwanda with those in
comparator countries does not point towards excessively high tariffs according to the World Bank’s
Ease of Doing Business indicators (Figure 22) in 2018. Moreover, the overall price of electricity in
Rwanda has declined considerably to about USD 0.13,7 per kWh in 2020. This suggests Rwandan
electricity prices are well below those in Kenya and Uganda and only slightly above those in Tanzania.
A recent publication, however, concludes that electricity tariffs are about 22 per cent higher than in
other EAC countries (Bimenyimana et al., 2018). In a similar vein, Rwanda’s Ministry of Infrastructure
(2015)39 states that the electricity tariff in Rwanda is relatively high compared to other countries in the
region and heavily subsidized. Likewise, in a joint report, the World Bank and the Government of
Rwanda (2019) lists the high cost of energy generation as one of the key reasons for the elevated
production costs. According to this report, the high cost of energy generation in Rwanda is, along with
the small market size, the far distance to external markets (by virtue of being landlocked), shallow and
costly credit markets and scarcity of land, a major reason for the generally high production costs. One
possible explanation for these seemingly contradictory assessments is that electricity prices developed
differently across sectors, with prices in the industrial sector actually increasing. The issue of industrial
electricity prices is certainly key for international competitiveness, which is why this issue is further
39 The document refers to a report by Energy & Economics Consulting from 2014 (‘Review of Current Electricity End User Tariffs: Final Report to RURA’).

47
discussed in Section 3 in the context of the country’s main bottlenecks experienced by Rwanda
manufacturing firms.
Figure 21: Access to electricity in Rwanda and comparator countries, 2010–2018
(a) Rwanda and comparator countries, total population, 2010 vs 2018
(b) Electricity access in Rwanda, rural versus urban population, 2010–2018
Source: World Bank WDI.
Hence, the Rwandan government seems well aware of the crucial role of electricity prices as an input
cost for the domestic economy and the manufacturing sector, in particular. This is why industrial

48
customers are offered preferential rates, ranging from Rwanda francs (RWF) 134 (USD 0.138) per kWh
for small-scale industries to RWF 106 (USD 0.109) per kWh.40
Figure 22: Price of electricity in Rwanda and comparator countries, 2015 vs 2020
Note: Price of electricity is in US cents per kilowatt hour (kWh). South Sudan: data for 2020 are not available. Source: World Bank's Ease of Doing Business Database.
Energy efficiency and the energy mix. Another crucial issue is energy efficiency. A relevant measure
for energy efficiency is energy intensity, defined as the primary energy requirement per unit of output.
Energy intensity clearly declined between 2010 and 2019 in Rwanda, which means that energy
efficiency improved over time. Nevertheless, energy efficiency still appears to be low in comparison
with comparator countries (Figure 23). This indicator must be interpreted in the context of the
countries’ general level of development, in particular, the high degree of subsistence agriculture in
Rwanda and the comparatively low rate of electrification. According to the Rwanda Development
Board, biomass (essentially, the use of wood) accounts for 80 per cent of its overall primary energy
consumption.41 The country aims to reduce this rate to 42 per cent by 2024, which can only be achieved
if the country gets electrified, which is one of the country’s key priorities.
A country’s energy efficiency is obviously strongly dependent on the energy mix. In this respect,
Rwanda stands out as a country with a comfortably high share of renewable energy in the energy mix,
40 Electricity tariffs as of January 2020 according to Rwanda Energy Group. See: https://www.reg.rw/customer-service/tariffs/. Note that these figures correspond with the data reported by the World Bank.
41 See Rwanda Development Board (RDB): https://rdb.rw/investment-opportunities/energy/#tab-1-2. Energypedia puts the share of biomass in primary energy consumption at 85 per cent without indication of the year it is referring to. See: https://energypedia.info/wiki/Rwanda_Energy_Situation#cite_note-Energy_resource-0. In any case, this confirms the extremely high share of biomass in the country’s energy mix.

49
with energy consumption (Figure 24) standing at 87 per cent in 2017. This is in line with prevailing
renewable energy consumption shares in EAC partner countries, which are similarly high. This is
explained by two factors. First, Rwanda (as well as the EAC partners), strongly relies on biomass (in
particular, wood for cooking and heating), especially in rural areas where the overwhelming majority
of households do not yet have access to electricity.
Figure 23: Energy intensity in Rwanda and comparator countries, 2010 vs 2017
Note: Energy intensity is measured as the energy intensity level of primary energy (megajoules per constant 2011 purchasing power parity GDP). It corresponds to indicator 7.3.1 with goal number 7 of the Sustainable Development Goals (SDG). Energy intensity is an inversely related measure for a country’s energy efficiency. Source: UN Sustainable Development Goals (SDG) database based on data from the Energy Balances, UN Statistics Division (2019) and the IEA (2019), World Energy.
Second, hydropower is Rwanda’s primary source for electricity production accounting for around half
of total electricity generation (Bimenyimana et al., 2018). Given the fact that other forms of renewable
energy generation, such as solar power, are still underdeveloped, the overall share of renewable
energy in electricity production is also about 50 per cent (Eustache et al., 2019). In any case, it is
important to keep the country’s relatively low electrification rate in mind, which results in a very high
share of renewable energy sources in overall energy generation due to reliance on biomass, whereas
the share of renewables in electricity generation, while still high, is much lower.
To summarize, the Government of Rwanda acknowledges the key role access to electricity plays for
accelerating living standards and economic development as well as for the internal cohesion of the
country, and has therefore set ambitious targets. The Energy Policy of 2015 (Ministry of Infrastructure,
2015) initially aimed to achieve an electrification rate of 100 per cent by 2020, a date that in the
meantime has been postponed to the year 2023/24, of which 52 per cent on-grid connections and 48

50
per cent off-grid connections (Bimenyimana et al., 2018). To achieve these targets, additional efforts
are, however, needed (Government of Rwanda, 2018).
Figure 24: Share of renewable energy sources in total energy consumption in Rwanda and comparator countries, 2010 vs 2018
Note: Renewables include hydropower. Source: UN Sustainable Development Goals (SDG) database based on data from the Energy Balances, UN Statistics Division (2019) and the IEA (2019), World Energy.
Policy Context
a) Governance in Rwanda
Overall governance
The capacity and efficacy of public institutions are a central element of any development process, as a
dysfunctional state inhibits any entrepreneurial activity within the private sector. That is why the NST
includes transformational governance as one of its three pillars (Government of Rwanda, 2017). A
glance at internationally comparable indicators for overall governance performance from the World
Bank reveals that Rwanda outperforms key partners in the EAC, notably Tanzania and Kenya, in
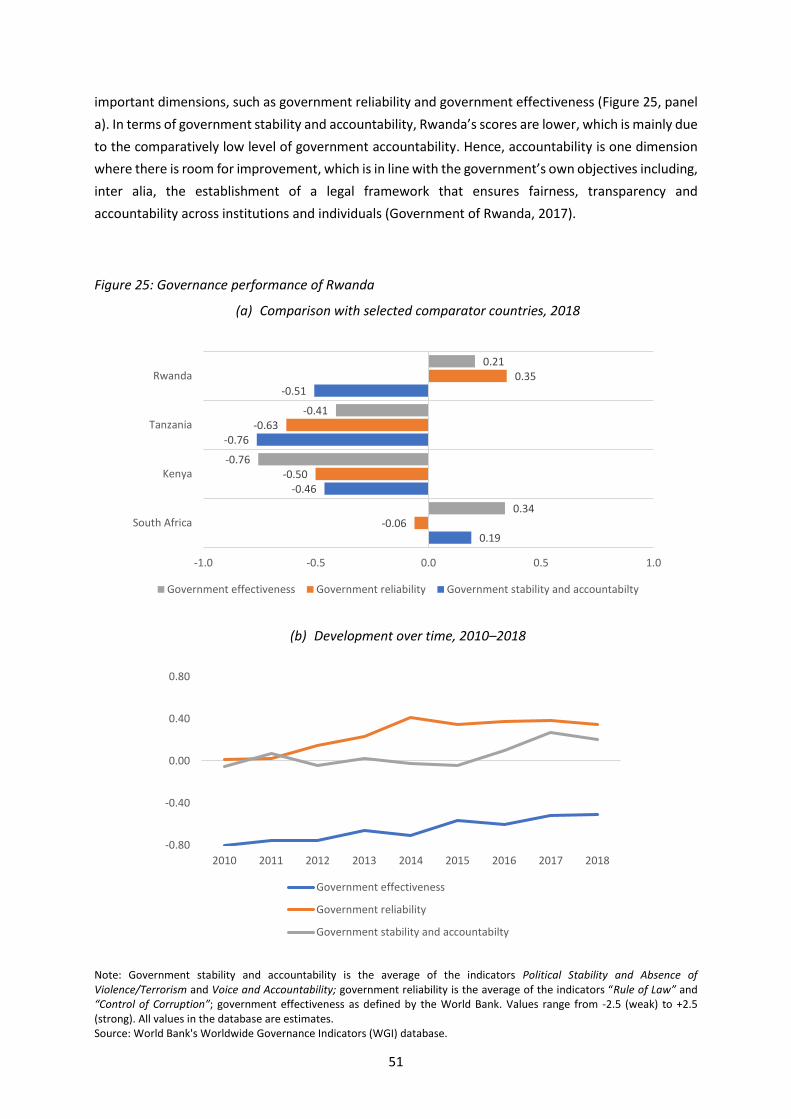
51
important dimensions, such as government reliability and government effectiveness (Figure 25, panel
a). In terms of government stability and accountability, Rwanda’s scores are lower, which is mainly due
to the comparatively low level of government accountability. Hence, accountability is one dimension
where there is room for improvement, which is in line with the government’s own objectives including,
inter alia, the establishment of a legal framework that ensures fairness, transparency and
accountability across institutions and individuals (Government of Rwanda, 2017).
Figure 25: Governance performance of Rwanda
(a) Comparison with selected comparator countries, 2018
(b) Development over time, 2010–2018
Note: Government stability and accountability is the average of the indicators Political Stability and Absence of Violence/Terrorism and Voice and Accountability; government reliability is the average of the indicators “Rule of Law” and “Control of Corruption”; government effectiveness as defined by the World Bank. Values range from -2.5 (weak) to +2.5 (strong). All values in the database are estimates. Source: World Bank's Worldwide Governance Indicators (WGI) database.
0.19
-0.46
-0.76
-0.51
-0.06
-0.50
-0.63
0.35
0.34
-0.76
-0.41
0.21
-1.0 -0.5 0.0 0.5 1.0
South Africa
Kenya
Tanzania
Rwanda
Government effectiveness Government reliability Government stability and accountabilty
-0.80
-0.40
0.00
0.40
0.80
2010 2011 2012 2013 2014 2015 2016 2017 2018
Government effectiveness
Government reliability
Government stability and accountabilty

52
Overall, governance performance has markedly improved in recent years (Figure 25, panel b), a fact
that can be assumed to have fed positively into the country’s dynamic growth – directly via facilitating
business activities and indirectly by inspiring optimism and confidence among citizens and investors
alike.
b) Policymaking: formulation, implementation and evaluation
The quality and capacities of institutions are decisive for overall policymaking. In this respect, it is
useful to divide the policymaking process into the (i) formulation stage (policy design), (ii) the
implementation stage, (iii) monitoring and evaluation stage, and (iv) learning from previous policy
experiences. Developing countries have generally achieved substantial progress in the formulation of
industrial policies (and policies in general). Mixed results prevail for the implementation of policies,
whereas serious and independent evaluation is often absent.
Table 7: Rwanda’s policymaking capacity, 2019/2020
Policy design Implementation of
policies
Statistical capacity
(monitoring) Policy learning
Coordination (score: 1-10)
Adaptability & future orientation
(score: 1-7)
(score: 1-10)
(score: 1-100)
(score: 1-10)
Rwanda 7.0 5.6 5.0 65.6 5.0
Comparators
Burundi 4.0 3.8 4.0 67.8 4.0
Kenya 4.0 4.4 5.0 57.8 5.0
South Sudan 2.0 2.0 45.6 1.0
Tanzania 4.0 4.3 6.0 62.2 4.0
Uganda 7.0 4.1 5.0 67.8 5.0
Mali 5.0 3.2 5.0 67.8 6.0
Malawi 5.0 3.1 6.0 73.3 6.0
Chad 2.0 2.8 3.0 50.0 1.0
South Africa 7.0 3.3 6.0 75.6 6.0
Ethiopia 4.0 3.8 5.0 61.1 5.0
Note: Policy design - coordination and policy, implementation of policies, policy learning: values refer to 2020. Policy design adaptability & future orientation; statistical capacity: values refer to 2019. Higher values/scores indicate better performance. Source: Bertelsmann Transformation Index (BTI), World Economic Forum (WEF) Global Competitiveness Index Database (Version 2019), World Bank Statistical Capacity Indicators.
Table 7 presents Rwanda’s policymaking capacity along these three dimensions. The comparison with
the usual set of comparator countries suggests that Rwanda scores high in terms of designing
appropriate policies (i.e. the formulation stage), where it is on par with Uganda and South Africa in
terms of coordination, and ahead of all comparators in terms of adaptability. When it comes to
implementing these policies, Rwanda appears to be midfield with the same scores as its EAC partners,
Kenya and Tanzania. Policy evaluation, which is the most difficult component to assess, can to some
extent be proxied by countries’ statistical capacity because adequate statistical data is a prerequisite

53
for a proper monitoring and evaluation.42 Rwanda’s statistical capacity is comparable with that of most
EAC partner countries, such as Uganda and Tanzania, but considerably lower than that of South Africa.
The next section explores the business community’s sentiment regarding the business environment,
which can be expected to be influenced by overall governance performance and the effectiveness of
the actual policies.
c) Governance and implications for the business environment
The argument from above that better institutions have helped lower some of the most severe business
obstacles for the private sector is confirmed by ease of doing business indicators43 (Table 8). Together
with Kenya, Rwanda registered the highest improvements in the overall Ease of Doing Business index
between 2010 and 2020 among the list of comparator countries. This development means that
Rwanda’s business environment is the most favourable not only within the EAC, but also in comparison
with Africa’s leading industrial country, South Africa, and fast-growing Ethiopia.
Table 8: Ease of Doing Business in Rwanda and comparator countries, 2010–2020
2010 2015 2016 2017 2018 2019 2020
Change in score
2010-2020
Change in score
2015-2020
Rwanda 60.8 67.5 67.1 69.0 71.1 75.4 76.5 15.7 8.9 Comparators
Burundi 37.2 49.0 45.6 45.7 45.9 46.5 46.8 9.5 -2.2 Kenya 56.3 53.9 58.0 62.8 65.4 71.0 73.2 16.9 19.3 South Sudan 34.8 32.8 32.7 31.6 33.6 34.6 -0.1 Tanzania 51.8 54.5 49.7 53.9 54.0 54.3 54.5 2.7 0.0 Uganda 47.5 51.9 56.6 57.3 57.9 58.4 60.0 12.5 8.1 Mali 44.4 51.2 50.3 52.6 52.9 53.1 52.9 8.5 1.8 Malawi 48.9 47.6 49.7 53.2 59.5 60.4 60.9 12.0 13.4 Chad 30.4 33.1 35.3 36.0 35.5 36.7 36.9 6.5 3.8 South Africa 68.0 68.7 66.2 65.4 65.3 66.7 67.0 -1.0 -1.7 Ethiopia 45.7 46.1 43.8 44.1 46.1 47.1 48.0 2.3 1.9
Note: Values are overall index scores. 0 = lowest performance, 100 = best performance. Source: World Bank's Ease of Doing Business Database.
Taking a closer look at the elements that feed into a favourable business environment, as measured
by the Ease of Doing Business indicators, suggests that the protection of minority investors and trading
across borders are the greatest obstacle for business (according to Rwanda’s global rank). The issue of
investor protection echoes the result on government accountability, whereas the issue of trading
across borders is explained by a combination of the country’s geographic location, but above all, the
42 Statistical data is a necessary but not a sufficient condition for independent monitoring and evaluation. 43 As pointed out by the World Bank the Ease of Doing Business may be subject to data inconsistencies (see
https://www.worldbank.org/en/news/statement/2020/08/27/doing-business).

54
remaining non-tariff barriers that continue to hamper trade with neighbouring countries, especially
the Democratic Republic of Congo and Burundi.44
More generally, however, Rwanda scores remarkably high in registering property, enforcing
contracts—again reflecting the comparatively good results for government reliability—starting a
business and paying taxes. Importantly, the trend has been positive across all dimensions over the past
ten years, with the biggest improvements achieved in access to electricity and trading across borders.
The issue of access to finance (getting credit) is further elaborated in Chapter 3 of this report.
Figure 26: Ease of Doing Business in Rwanda, rankings and scores, 2020
Note: The rank refers to the ranking of a list of 190 countries. Source: World Bank's Ease of Doing Business Database.
d) Industrial policy and structural transformation in Rwanda
Rwanda’s industrial policy strategy dates back to 2011 (Ministry of Trade and Industry, 2011) and is
currently in the process of being updated. Hence, priority areas and industries may change, but the
broader position on industrial policy is unlikely to change which can be described as (i) being a
comparative advantage-following strategy; (ii) combining export-orientation with import substitution;
(iii) blending vertical and horizontal instruments; (iv) following an integrated value chain approach; (v)
being supportive of regional integration; and (vi) being committed to environmental sustainability.
▪ A comparative advantage-following strategy. Rwanda’s Industrial policy serves as a tool for growth
and structural change. The role of industrial policy is to foster growth, value addition and dynamic
44 See also Section 1.

55
expansion into new and nascent areas with latent potential (Ministry of Trade and Industry, 2011).
For these reasons, industrial policy is geared towards developing the necessary skills, ensuring
adequate infrastructure as well as absorbing the necessary technologies for newly targeted
industries.
▪ Combining export-orientation with import substitution. Industrial policy is a hybrid form that
combines export promotion policies (to improve Rwanda’s export competitiveness) with import
substitution policies (to increase domestic production for local consumption) without, however,
resorting to protectionist policies. Rather, industrial policy is bound to be implemented in an
environment of open markets. This approach requires firms to be internationally competitive, which
in turn necessitates a supportive business environment (enabling environment). This two-pronged
approach, supported by an enabling environment, is enshrined in the National Industrial Policy and
confirmed in the Domestic Market Restructuring Strategy (Ministry of Trade and Industry, 2015a).
The National Export Strategy II (Ministry of Trade and Industry, 2015b) further sets out the details
of the industrial policy’s export promotion leg while the Made in Rwanda strategy (2017)
operationalizes the attempts to increase domestic value added by developing domestic value
chains, thereby supporting the import substitution objectives.
▪ Employing all instruments of the industrial policy toolkit. Rwanda’s industrial policy constitutes a
blend of vertical and horizontal measures and support programmes. This approach is also
manifested in the National Export Strategy, which relies on vertical and horizontal interventions,
whereas the Made in Rwanda policy relies primarily on vertical measures to remove supply-side
obstacles in specific value chains.
▪ Integrated value chain approach. Industrial policy measures are increasingly designed to support
integrated value chains rather than individual industries, which itself combines vertical elements—
the choice of priority value chains—with horizontal elements such as the proper functioning of value
chains. They depends on the capabilities of the respective value chain as well as its linkages to
upstream and downstream activities and a broad range of support activities beyond the boundary
of the firm (e.g. access to raw materials, affordable and reliable infrastructure or access to
international markets). Commitment to an integrated value chain approach is confirmed in the
country’s National Strategy for Transformation (NST) (Government of Rwanda, 2017) and support
is provided, for example, by the National Industrial Research and Development Agency (NIRDA) of
Rwanda, follows a targeted value chain approach “that focuses on the full range of activities that
are required to bring a product or service from conception, through the different phases of
production, delivery to final consumers and final disposal after use”. 45
The National Industrial Policy of 2011 identified ten value chains or clusters of priorities,
differentiating between the short-, medium- and long term (Table 9, panel a) and have largely been
confirmed in the NST in 2017 (Table 9, panel b). These priorities, however, are bound to change
with the forthcoming revision of the industrial policy.
45 See: https://www.nirda.gov.rw/nirda-innovate-for-industry.
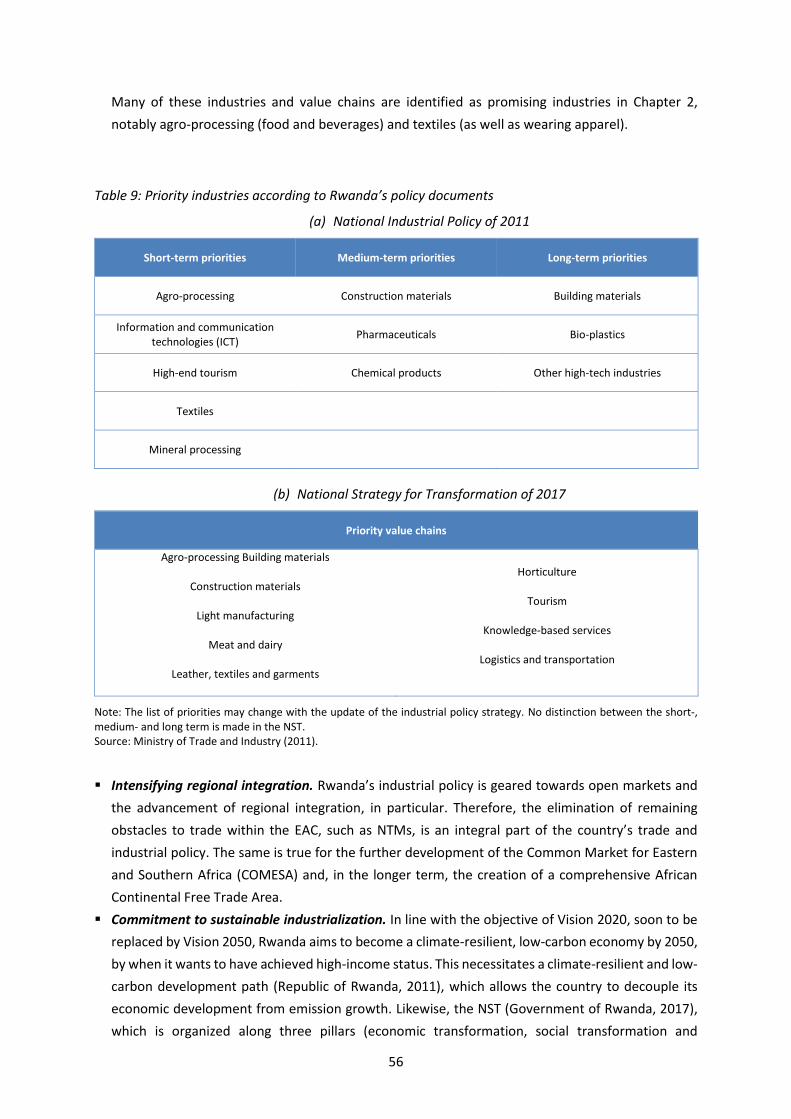
56
Many of these industries and value chains are identified as promising industries in Chapter 2,
notably agro-processing (food and beverages) and textiles (as well as wearing apparel).
Table 9: Priority industries according to Rwanda’s policy documents
(a) National Industrial Policy of 2011
Short-term priorities Medium-term priorities Long-term priorities
Agro-processing Construction materials Building materials
Information and communication technologies (ICT)
Pharmaceuticals Bio-plastics
High-end tourism Chemical products Other high-tech industries
Textiles
Mineral processing
(b) National Strategy for Transformation of 2017
Priority value chains
Agro-processing Building materials
Construction materials
Light manufacturing
Meat and dairy
Leather, textiles and garments
Horticulture
Tourism
Knowledge-based services
Logistics and transportation
Note: The list of priorities may change with the update of the industrial policy strategy. No distinction between the short-, medium- and long term is made in the NST. Source: Ministry of Trade and Industry (2011).
▪ Intensifying regional integration. Rwanda’s industrial policy is geared towards open markets and
the advancement of regional integration, in particular. Therefore, the elimination of remaining
obstacles to trade within the EAC, such as NTMs, is an integral part of the country’s trade and
industrial policy. The same is true for the further development of the Common Market for Eastern
and Southern Africa (COMESA) and, in the longer term, the creation of a comprehensive African
Continental Free Trade Area.
▪ Commitment to sustainable industrialization. In line with the objective of Vision 2020, soon to be
replaced by Vision 2050, Rwanda aims to become a climate-resilient, low-carbon economy by 2050,
by when it wants to have achieved high-income status. This necessitates a climate-resilient and low-
carbon development path (Republic of Rwanda, 2011), which allows the country to decouple its
economic development from emission growth. Likewise, the NST (Government of Rwanda, 2017),
which is organized along three pillars (economic transformation, social transformation and

57
transformational governance) calls for the sustainable management of the environment and natural
resources to transform Rwanda into a ‘green economy’. Rwanda’s industrial development process
is therefore set to be propelled by green technologies and predominantly renewable energy
sources, which is fully in line with the objective of becoming a globally competitive knowledge-
based economy as envisaged by the NST (Government of Rwanda, 2017).
Summary of Section 1 and implications for PCP project design
Rwanda’s two decade-long impressive growth spurt, its even more ambitious policy objective and the
generally optimistic view of future development offer many economic opportunities, especially in the
private sector.46 These opportunities are to be pursued in the context of a global economy that is
experiencing (i) two major transformations, an ecological and a digital transformation, both of which
are potentially disruptive, and (ii) a major economic shock related to the COVID-pandemic. The two
major transformations and the COVID shock necessitate concrete interventions in cross-cutting areas
that are of strategic importance to Rwanda’s economy, which shall help translate emerging
opportunities from green and digital technologies into business opportunities with high domestic value
added and high job creation potential, and to avoid the derailment of the very dynamic, longer-term
growth trajectory Rwanda has embarked on.
While there are countless potential interventions that could support the national policy objectives,
such as the graduation to a middle-income country by 2035, the macro-analysis of Rwanda’s economy
in combination with existing industrial development aspirations points towards five thematic
components, which are of strategic relevance and cross-cutting by nature. These thematic components
are listed in Table 10.
Table 10: Thematic components identified by the diagnostic report
Component Activity
Component 1: Integrated value chain development
Component 2: Governance development
Component 3: Development of sustainable energy
Component 4: Value added creation in a circular economy
Component 5: Adequate skills for Industry 4.0 and investment promotion for economic diversification
Source: Authors’ own analyses.
46 Rwanda’s Private Sector Development Strategy (PSDS).

58
a) Thematic component 1: Integrated value chain development
Rwanda’s export structure is highly geared towards minerals and agricultural products as revealed by
Rwanda’s top five export items, which together accounted for more than 90 per cent of total exports
(see Table 1). A closer look at the processing stages of major export items, such as coffee, but also food
and beverages, more generally revealed that the country is exporting the bulk of these products in
unprocessed form. Close to 100 per cent of Rwandan coffee is exported unroasted while the share of
unprocessed foods and beverages exceeded two-thirds in 2018 (see Table 3). This situation calls for a
development of integrated agricultural value chains, stretching from agricultural production to
modern processing technologies and further to marketing and sales, including for export markets. As
illustrated (see Figure 5), the potential for productivity gains of such a structural upgrading would be
substantial, as nearly 4 million Rwandans work in agriculture compared to 121,000 in overall
manufacturing, with the latter’s productivity level being more than three times higher than that of the
former (see Figure 5). The development of a competitive food and beverages industry is thus capable
of significantly contributing to the country’s development objectives, including numerous quantitative
targets of the NST, such as the creation of 214,000 decent and productive jobs annually, and a
structural shift in the export base to high-value goods and services with the aim of growing exports by
17 per cent annually (Government of Rwanda, 2017). The development of viable and internationally
competitive value chains in the food and beverages industries must take the backward linkages to the
agricultural sector as well as the forward linkages to potential distributors or final consumers into
account. Moreover, all functional aspects of the value chains and their interfaces should be well
managed, many of which will go beyond the boundary of the food company itself, such as parts of the
logistics, transportation or even packaging. Potential entry points for interventions therefore include:
▪ development of agro-processing parks with adequate infrastructure that meets the
requirements of the respective value chain, e.g. fruits and vegetables. The advantage of the
concept of agro-processing parks—as in the case of industrial parks—is the possibility to
overcome infrastructure shortcomings that make a value chain economically non-viable;
▪ development of rural micro-processing centres for agricultural produce (e.g. fruits and
vegetables);
▪ provision of technical and managerial (entrepreneurship) know-how and training;
▪ establishment of recognized standards, accreditation, certification and inspection schemes,
which are a prerequisite for (formal) export activities.
Integrated textile and wearing apparel value chains can also be an interesting thematic area for
component 1 because of their huge potential for employment creation. Not only have they served as
an entry point for many developing countries into manufacturing, Rwanda has also recorded
measurable success in terms of job creation and export growth, with both picking up significantly
(World Bank and Government of Rwanda, 2019). Changes in the structure of exports also support the
country’s efforts to diversify and upgrade its export base. Some progress has been achieved in this
respect, as both export diversification and export sophistication increased, along with the share of
manufactured goods in total exports, which more than doubled between 2010 and 2019 to 18 per cent
59
(see Figure 9). As is the case in agro-processing, the value chains of various textile industries still
struggle with dysfunctional supply chains (as evidenced by a low share of processed industrial supplies,
see Table 3), low capacity utilization, outdated machinery and, consequently, low labour productivity
in the manufacturing sector by regional (i.e. intra-EAC) standards, amounting to roughly USD 5.300 in
real terms in 2019 (see Figure 6), competition from imported second-hand garments,47 high
transportation costs and difficult access to international markets (e.g. due to NTMs), which was shown
to be a major obstacle for doing business (see Figure 26). Taking into account the positive recent
developments in the food and beverages industry and the remaining obstacles, potential entry points
for interventions include:
▪ development of specialized industrial parks providing the appropriate infrastructure and
potentially tax exemptions for exports;
▪ introduction of incentive programmes (including technical and management trainings or
subsidies for capital investments) to register informal firms;
▪ initiation of international technology transfer programmes (as was recently concluded with
India, administered by NIRDA);
▪ establishment of co-operatives (or community centres), possibly with a gender focus (such as
the Nyamirambo Women’s Centre, NWC), which manages logistics operations, in particular
the sourcing of raw materials (e.g. cotton), which cannot always be obtained in sufficient
quality or quantity, but also branding, marketing and quality controls;
▪ establishment of recognized standards, accreditation, certification and inspection schemes,
which are a prerequisite for (formal) export activities.
b) Thematic component 2: Governance development
Industrialization is necessary to promote sustained growth by incentivizing economies of scale,
innovation and the creation of backward and forward linkages with other sectors of the economy.
Industrial policy plays a vital role to create the right conditions for industrialization. The diagnostics
study has showed some promising areas of interventions that the PCP could target:
1) The widening of the statistics production of the country in the field of industrial data.
2) The strengthening of the evidence based industrial policy making through appropriate
technical analytical support.
3) Capacity building of policy makers to increase the policy making effectiveness.
The role of the international organizations is important to provide the technical support that is
necessary to accompany the country in the accomplishment of its policy objectives.
47 This problem eased in 2017, with a raise of the tariffs for used clothes which, however, induced retaliation from the United States, which suspended its duty-free privileges on domestically manufactured apparel under the African Growth and Opportunity Act (AGOA) for Rwanda. See: https://www.ban.org/news/2019/6/24/the-circular-economy-how-rwanda-tries-to-chart-its-course-in-hostile-global-waters.

60
c) Thematic component 3: Development of sustainable energy
Like in any other economy, Rwanda’s industrialization process needs to be fuelled by energy sources.
Currently, however, about 80 per cent of energy needs are satisfied with biomass (wood). While this
energy mix ensures a currently high share of renewables (87 per cent, see Figure 24) in total energy
consumption, the situation may change as Rwanda develops and advances with the electrification of
households and businesses. Any progress in terms of increasing access to electricity in the population,
currently standing at about 35 per cent (see Figure 21), also needs to track the sources of electricity
generation. The potential to improve the current access rate exists, as the country only uses a fraction
of its hydropower and solar power capacity.
Rwanda’s level of electricity is currently balanced with the rest of the world. However, it needs to
import all its fuel requirements, a further incentive for the country to reduce the economy’s carbon
dependence and intensity. One important element of a sustainable industrialization process is
therefore reliable and comprehensive renewable energy supply. Potential entry points for
interventions include:
▪ intensified efforts to continue the country’s electrification, especially in rural areas in line with
the national target of a 100 per cent electrification rate of the country by 2024, as stipulated,
for example, in the NST;
▪ further development of renewable energy sources, such as solar power, which are suitable to
pursue off-grid electrification, which is part of the Rural Electrification Strategy (Ministry of
Infrastructure, 2016). This approach would, at the same time, contribute to the aspired
decoupling of the industrialization process from CO2 and other greenhouse gas emissions.
d) Thematic component 4: Value added creation in a circular economy
Rwanda faces a series of environmental challenges ranging from coordinated waste management in
view of increasing urbanization to the protection and conservation of the country’s water and other
natural reserves. Judging by the country’s environmental policy strategies, Rwanda is determined to
embark on a sustainable industrial development process, and compared to other countries in East
Africa, Rwanda is a champion in promoting environmental sustainability (Figure 19). One of the guiding
principles of Rwanda’s National Environment and Climate Change Policy (Ministry of the Environment,
2019) is the gradual shift to a circular economy. The country’s conception of a circular economy reflects
that of the World Economic Forum, which characterizes a circular economy as one in which the end-
of-life concept is replaced with the principles of restoration, shifts towards the use of renewable
energy, the elimination of toxic chemicals that impede reuse and return to the biosphere, and the
elimination of waste through the superior design of materials, products, systems and business models.
The essence of the circular economy concept is that it tackles the omnipresent environmental
externalities and at the same time creates opportunities for value creation. The current recycling rate
in Kigali is still low, however, with estimates ranging from 2 per cent to 12 per cent (see Table 6), so
there is still a long and arduous road ahead to reach the policy targets (for non-organic solid waste),
which is set at 40 per cent by 2029/2030. Potential entry points for interventions include:

61
▪ improvement of recycling rates and waste disposal;
▪ reduction of the use of biomass (primarily wood) for household and industrial purposes to
prevent further depletion of Rwanda’s forests;
▪ increase the use of biodegradable materials in industrial products, which should be taken into
account from the product design stage onwards;
▪ protection and conservation of water sources (especially wetlands), which is crucial for the full
realization of the country’s hydropower potential;
▪ piloting of cleaner production methods and ensuring that industrial waste dumped into lakes
and rivers is treated properly, inter alia, by implementing the ‘polluter pays’ principle.
e) Thematic component 5: Adequate skills for Industry 4.0 and investment promotion for
economic diversification
The key for reaping the benefits of the digital transformation and Industry 4.0 are skills. Irrespective of
whether a country is an innovator, a producer or ‘only’ a user of advanced digital technologies, in all
cases, it is the human factor that determines an economy’s preparedness for Industry 4.0. In this
respect, the initial conditions for Rwanda, where 80 per cent of the workforce only has basic skills or
less (see Figure 16), and where global knowledge skills as well as vocational and technical skills are
trailing behind even the African technological frontier (see Figure 15), is challenging. Yet there are
some optimistic signs as well. The country scores high when it comes to people’s perception of the
alignment of their education with market needs (see Figure 18), which, on the one hand, suggests that
the economy seems to have little demand for advanced digital skills, but may also reflect a positive
attitude among the population, on the other. The latter may be fuelled by the current development of
educational quality, which is on the rise (see Figure 18), with gradual, albeit slow, improvements in
digital and IT infrastructure (see Figure 17). The plan to establish the Kigali Innovation City (Kigali
Technopole), which aims to foster the development of the ICT industry, goes in the same direction.
This is also true for the KLab (knowledge lab) project, which serves as an open technology hub in Kigali
where students, recent graduates, entrepreneurs and innovators can convene and develop their ideas
with the ultimate objective of turning them into viable projects.48 More generally, the capital-skills
complementarity requires parallel investments in both human skills and physical capital, including, but
not limited to, public infrastructure. In this context, diversification efforts, that is, investments in new
economic areas, could benefit from cooperation with foreign partners, either in the form of joint
ventures or technology transfer programmes. The recently initiated pilot programme between NIRDA
and India, the India Rwanda Innovation Growth Programme (IRIGP), is a good example of the latter.
Against the background of the ambitious objectives for the development of the ICT industry, which is
defined as a priority, and for digital transformation in general, but taking into account the current skill
base and the existing capital equipment, the potential entry points for interventions include:
▪ design of curricula for vocational training programmes in line with the organizational and
technological skill requirements of an increasingly digital economy;
48 See: https://rwandagateway.com/o/kigali-innovation-city.

62
▪ encouraging the absorption of advanced production technologies throughout manufacturing
industries;
▪ exploring methods and best practices to support small- and medium-sized enterprises (SMEs)
in their technological upgrading process, which may consist of leapfrogging directly to Industry
4.0 or of gradually proceeding via mechanization and automation (the latter being associated
with the third wave of industrialization);
▪ investment in skills, new capital and technologies via foreign direct investment (joint ventures)
and technology transfer programmes with cooperation partners.
SECTION 2: IDENTIFICATION OF PRIORITY SECTORS
Whereas Chapter 1 analyses indicators at the macro level to identify the PCP’s thematic components,
a meso-analysis of the manufacturing sector is carried out in Chapter 2 to identify priority industries.
The Framework of Industry Prioritization
In this section manufacturing industries and sub-sectors are identified that have the potential to spur
growth in Rwanda, based on a set of indicators: Job creation potential referring to Employment
generation; Latent potential, Revealed comparative advantage (RCA) and Emerging comparative
advantage (ECA) referring to Production and export capacities; Import substitution and World import
dynamism referring to Market analysis.
Figure 27 presents the logical framework of the industry prioritization conducted in the chapter.

63
Figure 27: Logical framework of industry prioritization49
Source: UNIDO elaboration based on various sources.
49 ISIC stands for International Standard Industrial Classification. ISIC2/4 stands for ISIC at 2 digits or 4 digits levels of disaggregation. INDSTAT is the UNIDO dataset of value added, employment and other industrial indicators. UN Comtrade is the UN trade dataset of goods. WITS is the World Integrated Trade Solutions platform from the World Bank to download trade data. PWT is the Penn World Table of economic indicators. DMRS stands for Domestic Market Recapturing Strategy, NST is the Rwanda National Strategy of Transformation, NIRDA is the National Industrial Research and Development Agency.
Step 1: Data Preparation Manufacturing
•Preparation of the dataset for 18 manufacturing industries(ISIC rev.3).
•Source: PWT, UNIDO INDSTAT2/4 rev.3, UN Comtrade, The World Bank WITS).
Step 2: First Stage Ranking
•Industry ranking based on six indicators:
•Job creation potential;
•Latent potential;
•Revealed comparative advantage, RCA;
•Emerging comparative advantage, ECA;
•Import substitution potential;
•World import dynamism.
Step 3: Industry Identification
•Identification of an optimal set of manufacturing industries with the potential for growth:
•Select top performers (industry/industrial clusters) for each indicator.
Step 4: Data Preparation Manufacturing Sub-industries.
•Preparation of the dataset for manufacturing sub-industries (ISIC4 rev.3) within shortlisted manufacturing industries.
•Source: PWT, UNIDO INDSTAT2/4 rev.3, UN Comtrade, The World Bank WITS).
Step 5: Second Stage Ranking
•Ranking based on six indicators.
Step 6: Sub industry identification
•Identification of an optimal set of manufacturing sub-industries (ISIC4 rev.3) with the potential for growth in each shortlisted industry.
Step 7: Verification
•Desk-based verification of Rwanda’s national strategies (DMRS, NST1, Industrial Policy, NIRDA).
•Consultations with stakeholders on the basis of technical and broader considerations
Step 8: Validation
•Stakeholder validation and alignment with Rwanda’s national strategies.

64
a) Preparation of datasets The datasets for manufacturing value added, employment and exports are based on the international
classification of manufacturing activities (ISIC2 rev.3, UNIDO, 2013)50.
b) First stage ranking and industry identification The following indicators are applied to the data:
- Indicator 1 (Job creation potential). This indicator determines the “average” pattern of
employment creation in different industries at global level based on available employment
data. We derive the job creation potential of each manufacturing industry at different levels
of income (see Appendix to Section 2). The job creation potential of manufacturing industries
is ranked in accordance with Rwanda’s level of per capita income (Int$ 1,460 PPP) to obtain an
optimal set of industries with the potential for job creation in Rwanda.
- Indicator 2 (Latent potential). This indicator establishes the “average” export patterns51 of
different industries in low- and middle-income countries and identifies industries with a
“latent potential”, i.e., industries that require an intervention to improve their performance,
promote the achievement of average LMI levels and rapid catching up.
- Indicator 3 (Revealed comparative advantage, RCA). RCA calculates the relative advantage of
an economy in given industries by comparing the country’s trade patterns with the world
average.52 Country 𝑖 has a comparative advantage if its share of industrial exports in total
exports exceeds the aggregate world export share, i.e. if its 𝑅𝐶𝐴𝑖𝑗 > 1.
- Indicator 4 (Emerging comparative advantage, ECA). The calculation used to determine an
economy’s emerging comparative advantage (ECA) is similar to RCA’s. ECA identifies industries
with a rising comparative advantage (i.e., with an 𝑅𝐶𝐴𝑖𝑗 between 0.3 and 0.9, indicating a
tendency for strong growth). Industries with an RCA lower than 1, but that post strong growth
reflect a country’s emerging capabilities and show promising industrial potential.
- Indicator 5 (Import substitution). This indicator explores the share of imports in Rwanda’s
industries. We focus on Rwanda’s import structure in 2019 to determine the level of domestic
demand for specific manufactured goods, and identify industries with the highest amount of
imports, flagging potential for Rwanda’s industries to meet national demand with local
products.
50 Trade data are not directly downloaded according to the ISIC classification but converted to ISIC on the basis of internationally recognized concordance tables.
51 Manufacturing value added data is usually used for this indicator. Due to the lack of available manufacturing value added data at the manufacturing 2-digit level, we use gross world exports as an alternative variable. The results should be interpreted with caution, however, as net exports (gross exports net of re-exports) would in fact be a more suitable variable, but the lack of data on re- exports for the majority of countries would limit the dataset’s explanatory value.
52 The concept of revealed comparative advantage (RCA) is based on Balassa (1965) and is derived by calculating the export
share of product 𝑥𝑖𝑗 relative to all exports 𝑋𝑖𝑗 from country 𝑖 to the rest of the world 𝑗 in proportion to the global share
of exports of the respective good 𝑥 . 𝑅𝐶𝐴𝑖𝑗 =𝑥𝑖𝑗/𝑋𝑖𝑗
𝑥𝑘/𝑋

65
- Indicator 6 (World import dynamism). World import dynamism reflects the manufacturing
industries with highest growth rate in world imports (2010–19). The selection of an industry
based on world import growth rate or “market dynamism” implies that “the market signals are
being read”.
We identify an optimal set of manufacturing industries out of a total of 18 industries in Rwanda that
have the potential for growth.
c) Second stage ranking and industry identification
Using the list of manufacturing industries identified in the first stage, we rank the manufacturing sub-
sectors within each shortlisted industry at a more disaggregated level (at ISIC4 rev.3) by applying the
same indicators as in the first ranking exercise.
d) Verification
Each shortlisted industry’s potential is analysed to substantiate its feasibility based on global and
domestic trends, the availability of technological capabilities, and the Rwandan government’s previous
policy decisions.
e) Validation with counterparts
Stakeholder and expert opinions were sought in cases of paucity of evidence. Some industries may
have been eliminated from the original list. Likewise, other industries with the potential for future
growth that are less obvious based on the analysis of historic data during the desk-based research
phase may have been added.
Discussion on Findings
a) Job creation potential
Structural change reflects the distinctive trajectories industries follow in terms of value added,
employment or exports as a country’s income level rises. Several country-specific factors influence the
trajectory of structural change. Structural change in manufacturing is attributable to (i) changes in
demand and supply associated with income level; (ii) a country’s given demographic and geographic
conditions, and (iii) a country’s overall conditions. Lower income countries tend to focus on relatively
labour- or resource-intensive activities, while higher income countries are more likely to engage in
capital-intensive and/or technology-intensive industries.
Patterns of structural change in the manufacturing sector can be identified by summarizing data on
employment and GDP per capita for a sample of countries. Employment patterns are useful for
identifying employment-intensive industries and the potential for job creation given a certain GDP per
capita level. The employment dimension of structural change in the manufacturing sector is illustrated
in Figure 28.

66
Rwanda’s per capita income level (red line) was around Int$ 1,460 (constant 2011, PPP) in 2019, i.e.,
the country is in the expansive stages of industrial development (i.e. similar to countries with per capita
income levels of less than Int$ 3,000).
The three major sources of manufacturing employment in the initial stages of industrial development
are food and beverages as well as textiles and wearing apparel. The food and beverages industry
provides a stable source of employment in all countries, regardless of income level. The textile industry
creates jobs at earlier stages of development, but unlike the food and beverages industry, textiles and
wearing apparel have comparatively lower levels of employment after peaking in the second stage of
development (around Int$ 9,000 per capita income).
Figure 28: Patterns of manufacturing employment
Source: UNIDO elaboration based on UNIDO INDSTAT2 rev.3.
Food and beverages and textiles are low-tech, labour-intensive industries that develop rapidly at a
relatively early stage of development (Table 11). At Rwanda’s per capita income level of around Int$
1,460, its current level of employment in the food and beverages industry (0.31) suggests that the
industry could, on average, create jobs for 0.31 per cent of the population.

67
Table 11: Patterns of manufacturing employment (Employment-to-population ratio)
Rwanda
Criteria 1: Job creation potential (highest value)
ISIC 2 rev.3 Description Employment to population ratio
(%) 15 Food and beverages 0.3052 16 Tobacco 0.0298 17 Textiles 0.2649 18 Wearing apparel, fur 0.1093 19 Leather, leather products and footwear 0.1093 20 Wood products 0.0602 21 Paper 0.0233 22 Printing and publishing 0.0520 23 Coke and refined petroleum 0.0163 24 Chemicals 0.0717 25 Rubber and plastic 0.0294 26 Non-metallic minerals 0.1025 27 Basic metals 0.0460 28 Fabricated metals 0.0615 29 Machinery and equipment 0.0359 30 Office, accounting and computing machinery 0.0040 31 Electrical machinery and apparatus 0.0375 32 Radio, television and communication equipment 0.0040 33 Medical, precision and optical instruments 0.0040 34 Motor vehicles, trailers, semi-trailers 0.0478 35 Other transport equipment 0.0478 36 Furniture; manufacturing n.e.c. 0.0481
Source: UNIDO elaboration based on UNIDO INDSTAT2 rev.3.
b) Latent potential
Similar patterns can be estimated by using different variables that are of policy relevance.
Manufactured exports, for example, are a key variable in this regard.
The identification of patterns helps detect “latent” comparative advantages of specific manufacturing
industries and their potential for growth. A comparison of Rwanda’s export performance and the
patterns of manufactured exports of comparators at similar levels of GDP per capita is useful for
policymakers to better understand manufacturing industries’ relative export performance.
Figure 29 and Figure 30 present the estimated patterns of different manufacturing industries, allowing
us to assess the “average” export performance of low- and middle-income countries (black curve) as
well as global trends (grey curve).
If Rwanda’s actual export performance (blue dots) lies below the average performance of lower
middle-income comparators (black curve), but the growth rate of its exports is rapidly increasing,
Rwanda has the potential to improve its export performance relative to that of other countries with
similar levels of per capita income. Given the specific country conditions, Rwanda’s comparative
advantage is still “latent” due to its untapped potential to increase industries’ export performance.
The red curve represents a lower bound threshold to exclude as potentially attractive those sectors
with growing exports but still a low level of gross exports per capita.

68
Figure 29: Patterns of manufactured exports in the paper industry for Rwanda and its comparators
Source: UNIDO elaboration based on UN Comtrade (2020).
Figure 30: Patterns of manufactured export in the motor vehicles industry for Rwanda and its comparators
Source: UNIDO elaboration based on UN Comtrade (2020).

69
Figure 29 and Figure 30 present the patterns of manufactured exports of two industries that are
underperforming, namely paper and motor vehicles, but that have the potential to grow more rapidly
than other industries if the country follows the average development path of exports in the future.
Rwanda’s labour-intensive industries are characterized by higher levels of gross exports (per capita)
and growth because the country can leverage cheap and abundant labour. Since Rwanda will
eventually reach a higher level of income, the possibility of engaging in capital-intensive industries will
arise, while the relevance of labour-intensive industries will decline. This trajectory has been followed
by many industrialized countries, including the “Four Asian Tigers”.
Table 12: Patterns of manufactured exports growth
Rwanda
Criteria 2: Latent potential (strong latent potential with the highest growth rate of gross exports)
ISIC 2 rev.3 Description Latent potential Growth rate of gross
export (2005-17) 15 Food and beverages Strong 27% 16 Tobacco - - 17 Textiles Strong -2% 18 Wearing apparel, fur Strong 13% 19 Leather, leather products and footwear Strong 13% 20 Wood products Strong 3% 21 Paper Strong 45% 22 Printing and publishing Strong -3% 23 Coke and refined petroleum Moderate 21% 24 Chemicals Strong 19% 25 Rubber and plastic Strong 12% 26 Non-metallic minerals Moderate 20% 27 Basic metals Moderate 61% 28 Fabricated metals Moderate 7% 29 Machinery and equipment Weak 2% 30 Office, accounting and computing machinery Weak 2% 31 Electrical machinery and apparatus Moderate 20% 32 Radio, television and communication equipment Weak 2% 33 Medical, precision and optical instruments Weak 2% 34 Motor vehicles, trailers, semi-trailers Moderate 17% 35 Other transport equipment Moderate 9% 36 Furniture; manufacturing n.e.c. Moderate 14%
Source: UNIDO elaboration based on UNIDO INDSTAT2 rev.3. Note: Strong latent potential indicates Rwanda’s actual export performance lies below the average performance of lower middle-income comparators. The opposite is the case for weak latent potential. Growth rate represents the cumulative annual growth rate (CAGR) of the period.
Table 12 highlights the set of manufacturing industries that Rwanda has latent export potential in
(Rwanda is underperforming relative to lower middle-income comparators). When we examine the
potential growth of these industries, paper (42 per cent) and motor vehicles (34 per cent) seem to be
growing more rapidly than other industries.

70
c) Revealed comparative advantage (RCA)
RCA allows us to identify those manufacturing industries that Rwanda has a comparative advantage
in, and which are attractive from a trade perspective (RCA > 1). Table 13 identifies five manufacturing
industries that Rwanda has a comparative advantage in (i.e., Rwanda’s share of exports is higher than
the world export share). They are 1) food and beverages; 2) leather; 3) coke and refined petroleum; 4)
non-metallic minerals, and 5) basic metals.
It comes as no surprise that these industries are labour-intensive and resource-based, as many
countries with a similar level of income as Rwanda (low- to lower middle-income countries) manifest
their comparative advantage in these industries due to their abundant labour force and the relatively
low factor costs (UNIDO, 2013). It is worth noting that because the production processes in these
countries are labour-intensive, far more workers (particularly female workers) can find employment,
which contributes to the creation of formal manufacturing jobs with decent wages. Probably triggered
by increasing demand for building materials in Rwanda, the non-metallic minerals industry (such as
cement and ceramic products) and the basic metal industry (such as steel metal) are the two fastest
growing manufacturing industries in the country, manifested in the RCA level and growth rate. Table
13 shows that the RCA of basic metals is 2.79 (21.11 per cent growth, 2015–2019) and that of non-
metallic minerals is 1.52 (11.50 per cent growth, 2015–2019).
Table 13: Revealed comparative advantage (RCA) and emerging RCA for Rwanda
Rwanda
Criteria 3: Revealed comparative advantage (highest value)
Criteria 4: Emerging comparative advantage
(RCA between 0.3 and 0.9 with the highest growth
rate)
ISIC 2 rev.3 Description Revealed comparative advantage,
RCA (2019) RCA growth rate (2015-19) 15 Food and beverages 1.8425 -8.82% 16 Tobacco 0.0134 72.77% 17 Textiles 0.3050 27.69% 18 Wearing apparel, fur 0.3210 37.96% 19 Leather, leather products and footwear 1.0423 33.36% 20 Wood products 0.0766 -18.04% 21 Paper 0.1170 12.17% 22 Printing and publishing 0.1217 4.87% 23 Coke and refined petroleum 1.1200 146.70% 24 Chemicals 0.0361 -5.33% 25 Rubber and plastic 0.1234 -1.86% 26 Non-metallic minerals 1.5175 11.50% 27 Basic metals 2.7925 21.11% 28 Fabricated metals 0.1106 2.48% 29 Machinery and equipment 0.0711 -5.85% 30 Office, accounting and computing machinery 0.0902 19.07% 31 Electrical machinery and apparatus 0.1350 7.75% 32 Radio, television and communication equipment 0.0484 -21.05% 33 Medical, precision and optical instruments 0.1063 -1.58% 34 Motor vehicles, trailers, semi-trailers 0.2870 0.93% 35 Other transport equipment 0.1719 -23.29% 36 Furniture; manufacturing n.e.c. 0.9508 -5.72%
Source: UNIDO elaboration based on UN Comtrade (2020) and The World Bank WITS (2020). Growth rate represents the cumulative annual growth rate (CAGR) of the period.

71
d) Emerging comparative advantage (ECA)
Industries with an emerging comparative advantage (manufacturing industries with an RCA between
0.3 and 0.9, and a tendency for strong growth) (Table 13) are textiles (RCA of 0.3, 27.7 per cent growth,
2015–2019) and wearing apparel (RCA of 0.32, 38 per cent growth, 2015–2019). Rwanda has an
emerging comparative advantage in the leather industry (RCA 1.04, 33.36 per cent, 2015-2019), with
its RCA slightly above 0.9. Furthermore, Rwanda also indicates a growing export advantage in motor
vehicles (RCA 0.28, 0.93 per cent growth, 2015-2019), although its RCA slightly fell to below 0.3.
e) Import substitution
The share of imports by industry reveals Rwanda’s potential for import substitution. By focusing on
Rwanda’s import structure in 2019, we identify domestic demand for specific goods and import
substitution opportunities for Rwandan industries to foster the generation of domestic value added.
Table 14 shows that coke and refined petroleum (USD 467 million), food and beverages (USD 417
million), and chemicals (USD 358 million) had the highest share of imports in Rwanda in 2019. Clearly,
Rwanda’s endowment provides a comparative advantage and an optimal industrial structure for some
but not all its industries.
Table 14: Import substitution potential and world import dynamism potential for Rwanda
Rwanda World
Criteria 5: Import
substitution (highest value) Criteria 6: World import dynamism
(highest value)
ISIC 2 rev.3 Description Import (USD) 2019
World import growth rate (2010-19)
15 Food and beverages 417,000,000 1.71% 16 Tobacco 3,834,421 1.20% 17 Textiles 80,100,000 0.79% 18 Wearing apparel, fur 27,300,000 1.87% 19 Leather, leather products and footwear 42,700,000 2.72% 20 Wood products 18,800,000 0.89% 21 Paper 53,300,000 -1.12% 22 Printing and publishing 25,100,000 0.24% 23 Coke and refined petroleum 467,000,000 -0.85% 24 Chemicals 358,000,000 1.15% 25 Rubber and plastic 86,000,000 2.15% 26 Non-metallic minerals 136,000,000 0.85% 27 Basic metals 149,000,000 0.71% 28 Fabricated metals 218,000,000 2.27% 29 Machinery and equipment 277,000,000 1.59% 30 Office, accounting and computing machinery 55,100,000 0.61% 31 Electrical machinery and apparatus 162,000,000 1.99% 32 Radio, television and communication equipment 102,000,000 -0.46% 33 Medical, precision and optical instruments 56,100,000 1.13% 34 Motor vehicles, trailers, semi-trailers 196,000,000 2.87% 35 Other transport equipment 30,000,000 3.03% 36 Furniture; manufacturing n.e.c. 48,100,000 1.88%
Source: UNIDO elaboration based on UN Comtrade (2020) and The World Bank WITS (2020). Growth rate represents the cumulative annual growth rate (CAGR) of the period.
Among the three manufacturing industries with the highest share of imports, chemicals plays a unique
role because it not only meets basic needs, but also contributes to the creation of formal

72
manufacturing jobs with decent wages across all stages of development; in other words, it serves as
an incubator and accelerator for other manufacturing activities and manufacturing-related services,
such as agro-processing, biotech and pharmaceuticals.
Rwanda’s manufacturing sector has the capacity to meet a certain level of demand for basic chemical
products, for example, agrochemicals and fertilizers, to modernize its agricultural sector and to
produce colouring matters and tanning agents, which are primary sources for the textile and wearing
apparel industries, and both of which are major contributors to value added at early stages of industrial
development. This represents an opportunity for Rwanda to further develop its domestic chemical
industry.
At low- and lower middle-income levels, primary chemical sub-sectors emerge to supply household-
and agrochemical products to meet domestic demand, including soaps, cleaning products, cosmetics
and fertilizers, just to name a few. Such sub-sectors play an important role in terms of their
contribution to the generation of value added and job creation, especially in those countries
undergoing a structural transformation from an agrarian-based economy to one that includes
industries with higher levels of productivity and complexity.
f) World import dynamism
By calculating the growth rate of world manufacturing imports (2010-19) (Table 14), we find that
automotive and transport equipment industries have the highest growth rate at 2.87 per cent and 3
per cent, respectively.
It should be noted that in countries like Rwanda with a population of around 12.3 million—and
considering the country’s geographic location and proximity to major markets—the automotive
industry (especially manufacturing sub-sectors supplying automotive parts, motorcycles and
assembling light auto vehicles for the regional market) has the potential of becoming one of the largest
industries in the middle stage of development.
Large regional markets nurture the automotive industry which relies on economies of scale. Moreover,
multinational corporations tend to build manufacturing and assembly plants in countries with
favourable economic conditions and establish regional hubs to serve smaller countries in the region
(exports).
Rwanda could benefit from its geographical proximity to Eastern African markets by entering regional
markets, which are opening up due to the loss in competitiveness of large international exporters (such
as China). Furthermore, there is potential for the relocation of firms from comparator countries to
Rwanda, which would generate transfers of knowledge, incubate local industry eco-system, and unlock
access to international markets. Motor vehicles, trailers, semi-trailers, and other transport equipment
demonstrate the strongest world import dynamism.

73
Table 15: Empirical findings of industry prioritization for Rwanda
Rwanda
Criteria
Revealed comparative advantage
(highest value)
Emerging comparative
advantage (RCA between 0.3 and
0.9 with the highest growth
rate)
Job creation potential (highest
value)
Latent potential (strong latent potential with the highest growth rate of gross
exports)
Import substitution
(highest value)
Word import dynamism
(highest value)
ISIC 2 rev.3 Description
Revealed comparative
advantage, RCA (2019)
RCA growth rate (2015-19)
Employment to population ratio
(%) Latent export
potential Growth rate of gross
exports (2005-17) Import (USD)
2019
World import growth rate (2010-19)
15 Food and beverages 1.8425 -8.82% 0.3052 Strong 27% 417,000,000 1.71% 16 Tobacco 0.0134 72.77% 0.0298 - - 3,834,421 1.20% 17 Textiles 0.3050 27.69% 0.2649 Strong -2% 80,100,000 0.79% 18 Wearing apparel, fur 0.3210 37.96% 0.1093 Strong 13% 27,300,000 1.87% 19 Leather, leather products and footwear 1.0423 33.36% 0.1093 Strong 13% 42,700,000 2.72% 20 Wood products 0.0766 -18.04% 0.0602 Strong 3% 18,800,000 0.89% 21 Paper 0.1170 12.17% 0.0233 Strong 45% 53,300,000 -1.12% 22 Printing and publishing 0.1217 4.87% 0.0520 Strong -3% 25,100,000 0.24% 23 Coke and refined petroleum 1.1200 146.70% 0.0163 Moderate 21% 467,000,000 -0.85% 24 Chemicals 0.0361 -5.33% 0.0717 Strong 19% 358,000,000 1.15% 25 Rubber and plastic 0.1234 -1.86% 0.0294 Strong 12% 86,000,000 2.15% 26 Non-metallic minerals 1.5175 11.50% 0.1025 Moderate 20% 136,000,000 0.85% 27 Basic metals 2.7925 21.11% 0.0460 Moderate 61% 149,000,000 0.71% 28 Fabricated metals 0.1106 2.48% 0.0615 Moderate 7% 218,000,000 2.27% 29 Machinery and equipment 0.0711 -5.85% 0.0359 Weak 2% 277,000,000 1.59% 30 Office, accounting and computing machinery 0.0902 19.07% 0.0040 Weak 2% 55,100,000 0.61% 31 Electrical machinery and apparatus 0.1350 7.75% 0.0375 Moderate 20% 162,000,000 1.99%
32 Radio, television and communication equipment 0.0484 -21.05%
0.0040 Weak 2% 102,000,000 -0.46%
33 Medical, precision and optical instruments 0.1063 -1.58% 0.0040 Weak 2% 56,100,000 1.13% 34 Motor vehicles, trailers, semi-trailers 0.2870 0.93% 0.0478 Moderate 17% 196,000,000 2.87% 35 Other transport equipment 0.1719 -23.29% 0.0478 Moderate 9% 30,000,000 3.03% 36 Furniture; manufacturing n.e.c. 0.9508 -5.72% 0.0481 Moderate 14% 48,100,000 1.88%
Source: UNIDO elaboration based on UN Comtrade (2020), The World Bank WITS (2020), and UNIDO INDSTAT2/4 rev.3. Note: Strong latent potential indicates that Rwanda’s actual export performance lies below the average performance of lower middle-income comparators. The opposite is the case for weak latent potential. Growth rate represents the cumulative annual growth rate (CAGR) of the period.
74
Industry Prioritization for Rwanda
Due to Rwanda’s relatively small size (with a population of around 12.3 million) and the significance of
inclusive development and job creation, Rwanda’s priority industries should be those that have a
strong potential for job creation, export growth, import substitution and that can meet world demand.
Given the forward-looking potential for Rwanda’s income range (potential for job creation and export
latency) based on industrial development patterns and the backward-looking assessment of Rwanda’s
past export performance (potential of RCA and ECA) and import structure (potential of import
substitution and world import dynamism) (Table 16), Rwanda has a strong development potential in
food and beverages, textiles, wearing apparel, leather, paper, coke and refined petroleum, chemicals,
non-metallic minerals, basic metals and possibly even in motor vehicles and other transport
equipment.
Table 16: Priority manufacturing industries for Rwanda
ISIC 2 rev.3 Manufacturing industries Potential
15 Food and beverages Job creation
17 Textiles Job creation
18 Wearing apparel, fur Emerging comparative advantage (ECA)
19 Leather, leather products and footwear
Emerging comparative advantage (ECA)
21 Paper Latent potential
23 Coke and refined petroleum Import substitution
24 Chemicals Import substitution
26 Non-metallic minerals Revealed comparative advantage (RCA)
27 Basic metals Revealed comparative advantage (RCA)
34 Motor vehicles, trailers, semi-trailers World import dynamism
35 Other transport equipment World import dynamism
Source: UNIDO elaboration based on empirical findings.
Food and beverages, as well as textiles tend to have strong potential in terms of job creation, as these
industries absorb excess labour that has been freed up by the agricultural sector, characterized by low
productivity, as the pace of industrialization of agrarian-based economies accelerates.
The non-metallic mineral industry will also expand as Rwanda’s income increases and as demand for
the industry’s products rises, primarily from the domestic market (expansion of public infrastructure
and housing developments). The basic metal industry is one of a few already successful manufacturing
industries compared to the average performance of this industry in countries with a similar income
level as Rwanda. The basic metal industry is more capital-intensive, however, and only offers limited
potential for job creation due to its high material-intensive and resource-based production processes,
which might furthermore pose an environmental risk.
The chemical industry not only rapidly increases its MVA contribution to GDP due to its fast growth in
labour productivity, it can already emerge at an early stage of industrial development because of its

75
specific characteristics (high domestic demand for basic necessities, agro-processing chemicals and
fertilizers).
With a view to both growth and inclusiveness, food and beverages, textiles, wearing apparel, leather,
and chemicals should be Rwanda’s priority in its industrialization efforts. The rapid growth of these
priority industries could generate a high number of formal manufacturing jobs (including female
employment), stimulate domestic consumption, increase tax revenue and investments in
infrastructure and education (vocational training), thereby building a solid foundation for the
development of other manufacturing and related service industries to facilitate structural change and
drive Rwanda’s catching up process.
Low wages and Rwanda’s young labour force could be assets in terms of cost competitiveness. Labour-
intensive industries and cost competitiveness are decisive factors for success in prioritized “early
stage” manufacturing industries.
Rwanda’s competitive wage level and abundant trainable labour force already provide a distinct
advantage not found in many countries, especially in those with higher levels of GDP per capita.
Rwanda will not be competing with industrialized countries in machinery, electronics and other high-
tech industries, but has the potential of entering the international market with textiles and wearing
apparel, i.e., with products from industries that developed countries have already lost competitiveness
in.
Countries that have recently experienced rapid industrialization, e.g. Viet Nam, rarely witnessed
sudden changes to their economic structure, or leapfrogging from an agrarian economy to one driven
by capital-intensive or high-tech manufacturing industries (Haraguchi, 2015). Successful countries that
have considerably reduced poverty, improved the well-being of their populations, and modernized
their economy in a relatively short period of time scored initial successes with export-oriented light
manufacturing industries and continued investing in infrastructure and human capital to achieve
industrial upgrading (for example, Malaysia, the Republic of Korea, Mauritius, China and Viet Nam, and
before them, the majority of industrialized countries, including the United Kingdom and Japan).
Thus, accelerating industrialization and improvements in living conditions are possible, but
development strategies must incorporate a structural change perspective, taking country-specific
conditions and comparative advantage into consideration.

76
Desk-based Validation (Rwanda’s National Strategies)
Eleven manufacturing sectors have been identified in the previous section based on six economic
indicators. We can group these eleven manufacturing industries into five industrial clusters (i)
construction materials, (ii) light manufacturing, (iii) agro-processing, (iv) petrochemicals, and (v)
logistics and transportation (see Column 1, Table 17). In a next step, we conduct a desk-based
verification of the list of economic activities prioritized in Rwanda’s national strategies (see Columns
2-5, Table 17).
The purpose of a national strategy is to position the country in the long term with the aim of improving
its economic performance. It proposes a unique set of activities that are difficult to imitate by others,
if at all. That is, the purpose of a national strategy is to identify and foster activities that differentiate
the country from others. It involves establishing priorities and determining the country’s future
direction, including which manufacturing industries to target, specifying existing industries’ future
development and goals, the types of new products to be manufactured, and which markets to serve.
It is worth mentioning that a 7-year government programme (2017–2024) was rolled out, which
coincides with the implementation of the Economic and Poverty Reduction Strategy (EDPRS2, 2013–
18) and Vision 2020 (which will cover the first four years of Vision 2050, a new 30-year vision for the
period up to 2050).

77
Table 17: List of priority manufacturing industries identified by UNIDO’s Industrial Diagnostic and economic activities prioritized in Rwanda’s national strategies
Column 1 2 3 4 5
Industrial clusters Priority industries identified by UNIDO’s Industrial Diagnostic (2020) Industries prioritized in Rwanda’s Domestic Market Recapturing Strategy (DMRS, 2015)
Economic activities prioritized in Rwanda’s National Strategy for Transformation (NST1, 2011)
Industrial activities prioritized in Rwanda’s Industrial Policy (2011)
Value chain identified in Rwanda’s National Industrial Research and Development Agency (NIRDA)
Construction materials
2610 Manufacture of glass and glass products ISIC 26: Non-metallic minerals Cement
Value addition and processing of mining products
Commodities and services
N/A 2691 Manufacture of non-structural non-
refractory ceramic ware Sub-sectors: Ceramic/granite tiles Minerals
2692 Manufacture of refractory ceramic products 2610, 2691, 2692, 2693, 2694, 2695, 2696, 2699
Plastic tube/construction materials
2693 Manufacture of structural non-refractory clay and ceramic products
Processing and value addition
N/A
2694 Manufacture of cement, lime, and plaster Construction materials (including Cement)
2695 Manufacture of articles of concrete, cement, and plaster
Mineral processing
2696 Cutting, shaping and finishing of stone
2699 Manufacture of other non-metallic mineral products n.e.c.
2710 Manufacture of basic iron and steel ISIC 27: Basic metals Steel and iron Medium- to high-tech manufactures
N/A 2720 Manufacture of basic precious and non-
ferrous metals Sub-sectors: Aluminium products Building materials (including metal parts and structures)
2710, 2720
2422 Manufacture of paints, varnishes, and similar coatings, printing ink and mastics ISIC 24: Chemicals (paints and
varnishes only)
Paints and varnishes N/A N/A N/A
Sub-sectors:
2422
Light manufacturing
1711 Preparation and spinning of textile fibres; weaving of textiles ISIC 17: Textiles
Textiles and garments
Textiles and garments Processing and value addition
Garment value chain
1721 Manufacture of made-up textile articles, except apparel
ISIC 18: Wearing apparel, fur ISIC 19: Leather, leather products and footwear
Textiles (including silk, leather and leather goods)
1722 Manufacture of carpets and rugs Subsectors: Silk
1723 Manufacture of cordage, rope, twine and netting
1711, 1721, 1722, 1723, 1729, 1730, 1810, 1820, 1911, 1912, 1920
Leather

78
1729 Manufacture of other textiles n.e.c.
1730 Manufacture of knitted and crocheted fabrics and articles
1810 Manufacture of wearing apparel, except fur apparel
1820 Dressing and dyeing of fur; manufacture of articles of fur
1911 Tanning and dressing of leather
1912 Manufacture of luggage, handbags and the like, saddlery and harness
1920 Manufacture of footwear
2101 Manufacture of pulp, paper and paperboard ISIC 21: Paper
Packaging materials N/A
Medium- to high-tech manufactures
N/A
2102 Manufacture of corrugated paper and paperboard and of containers of paper and paperboard Sub-sectors: Bioplastics
2109 Manufacture of other articles of paper and paperboard 2101, 2102, 2109
2411 Manufacture of basic chemicals, except fertilizers and nitrogen compounds ISIC 24: Chemicals (excl. paints and
varnishes, and fertilizer) Pharmaceuticals
N/A
Low-tech manufactures
N/A
2413 Manufacture of plastics in primary forms and of synthetic rubber Soap and detergents Pharmaceuticals
2421 Manufacture of pesticides and other agrochemical products Sub-sectors: Reagents Chemical products (excl. fertilizer)
2423 Manufacture of pharmaceuticals, medicinal chemicals, and botanical products 2411, 2413, 2421, 2423, 2424, 2429,
2430 Insecticides
2424 Manufacture of soap and detergents, cleaning and polishing preparations, perfumes and toilet preparations Beauty/make up preparations
2429 Manufacture of other chemical products n.e.c.
2430 Manufacture of man-made fibres
N/A N/A Wooden furniture
N/A N/A Wood processing and bamboo value chain Hand tools

79
1512 Processing and preserving of fish and fish
products
Agro-processing
1513 Processing and preserving of fruit and vegetables ISIC 15: Food and beverages Sugar Meat and dairy Processing and value addition Banana wines value chain
1514 Manufacture of vegetable and animal oils and fats Sub-sectors: Edible oils Horticulture
Agro-processing (including pyrethrum, dairy, vegetable oil, soaps and detergents)
Poultry value chain
1520 Manufacture of dairy products 1512, 1513, 1514, 1520, 1531, 1533, 1541, 1542, 1543, 1549, 1551, 1554
Rice Fruit and vegetable value chain
1531 Manufacture of grain mill products Dried fish/aquaculture
Animal feed value chain
1533 Manufacture of prepared animal feeds Maize
1541 Manufacture of bakery products
1542 Manufacture of sugar Commodities and services
1543 Manufacture of cocoa, chocolate and sugar confectionery
1549 Manufacture of other food products n.e.c. Commodities (including tea and coffee)
1551 Distilling, rectifying, and blending of spirits; ethyl alcohol production from fermented materials
1554 Manufacture of soft drinks; production of mineral waters
2412 Manufacture of fertilizers and nitrogen compounds ISIC 24: Chemicals (fertilizer only)
Fertilizer N/A
Low-tech manufactures
N/A Sub-sectors: Chemical products (fertilizer)
2412
Petrochemicals
2310 Manufacture of coke oven products ISIC 23: Coke and refined petroleum
N/A N/A N/A N/A 2320 Manufacture of refined petroleum products
Sub-sectors:
2310, 2320
Logistics and transportation
3410 Manufacture of motor vehicles ISIC 34: Motor vehicles, trailers, semi-trailers
N/A
Aviation
N/A N/A
3420 Manufacture of bodies (coachwork) for motor vehicles; manufacture of trailers and semi-trailers ISIC 35: Other transport equipment Logistics and transportation
3430 Manufacture of parts and accessories for motor vehicles and their engines
Sub-sectors:
3511 Building and repairing of ships 3410, 3420, 3430, 3511, 3512, 3520, 3530, 3591, 3592, 3599

80
3512 Building and repairing of pleasure and sporting boats
3520 Manufacture of railway and tramway locomotives and rolling stock
3530 Manufacture of aircraft and spacecraft
3591 Manufacture of motorcycles
3592 Manufacture of bicycles and invalid carriages
3599 Manufacture of other transport equipment n.e.c.
Other clusters (incl. non-manufacturing-related activities)
N/A N/A
Tourism knowledge-based services
Commodities and services N/A
Creative arts Tourism
Processing and value addition
N/A High-end tourism
Diversified tourism
Medium- to high-tech manufactures
N/A
ICT and other high-tech industries
Note: The green rows represent industries identified by UNIDO’s Industrial Diagnostic, which are confirmed by at least one of Rwanda’s national strategies; the orange rows represent otherwise.

81
National Strategy for Transformation (NST1). All of Rwanda’s national strategies will be implemented
by NST1, which has included the United Nations Sustainable Development Goals (SDGs) across a range
of economic, social and environmental issues. NST1 is built on three pillars: 1) economic
transformation; 2) social transformation, and 3) transformational governance. It highlights strategic
development in (i) value addition and processing of mining products; (ii) textiles, garment and leather;
(iii) meat, dairy and horticulture; (iv) aviation, logistics and transportation, and (v) tourism and
knowledge-based services and creative arts. With the exception of the petrochemical and paper
industries identified by UNIDO’s Industrial Diagnostic, all other manufacturing industries identified,
namely non-metallic minerals and basic metals, textiles, wearing apparel, leather, food and beverages,
motor vehicles, and other transport equipment (see Column 1, Table 17) have been included in NST1
(see Column 3, Table 17).
National Industrial Policy (NIP). The objectives of Rwanda’s NIP are stipulated in Vision 2020 and the
Economic Development and Poverty Reduction Strategy 2008–12 (EDPRS). They include promoting
economic growth with the target of becoming a middle-income country by 2020, which means
achieving an average annual GDP growth rate of at least 8 per cent. NIP also envisages structural
transformation, with industry accounting for 26 per cent of GDP by 2020; a national investment rate
of 30 per cent of GDP; and non-farm employment reaching 1.4 million. NIP has selected ten clusters
(across four progressive stages) that Rwanda will focus on in the short- to long term to promote value
addition in existing industries and the emergence of new export industries (see Column 4, Table 17).
The priority industries identified by UNIDO’s Industrial Diagnostic are consistent with those included
in NIP, except for coke and refined petroleum, motor vehicles, and other transport equipment.
Domestic Market Recapturing Strategy (DMRS). DMRS was developed by the Rwandan government
to contribute to Vision 2020’s objective of setting Rwanda on a path towards economic transformation
from a subsistence agricultural economy to a knowledge-based society. DMRS’s goals correspond with
Rwanda’s Vision 2020 and are closely aligned with NIP. DMRS aims to increase domestic production
for local consumption while contributing to the structural transformation of the productive sector; to
enhance international competitiveness and reduce the country’s trade deficit. The strategy introduces
a set of criteria, including the potential of forex saving, recapturing potential and existing investment
projects, to identify 21 manufacturing sub-sectors (see Column 2, Table 17). When comparing the
priority industries identified by UNIDO’s Industrial Diagnostic (see Column 1, Table 17) and those
selected by DMRS (see Column 2, Table 17), the strategic importance of construction materials, light
manufacturing and agro-processing clusters is highlighted in both documents, excluding
petrochemicals, logistics and transportation .
National Industrial Research and Development Agency (NIRDA) value chains. NIRDA identifies six
value chains, namely (i) garments, (ii) wood processing and bamboo, (iii) banana wines, (iv) poultry, (v)
fruits and vegetables, and (vi) animal feed. Apart from wood processing and bamboo, the
manufacturing industries identified by UNIDO’s Industrial Diagnostic, such as food and beverages,
textiles, wearing apparel and leather, correspond with five of the value chains selected by NIRDA.

82
Table 17 reveals that Rwanda has developed a series of well-integrated national strategies for its Vision
2020–50 and programmes that are based on its strengths and potential opportunities. Rwanda’s Vision
2020–50 is aspirational. Aside from being ambitious, the strategies presented are also achievable. They
indicate a clear understanding of the weaknesses and obstacles Rwanda faces and how to effectively
address them. A national strategy must also include the capacities to adapt to changing conditions.
The Rwandan government could consider upgrading its capacities by cooperating with international
agencies for technical assistance and technology transfer programmes for its priority industries.
Rwanda’s manufacturing sector has been building on the agricultural sector, shifting towards agro-
processing activities, and diversifying into light and export-oriented manufacturing activities. New
industries and industrial segments (such as agro-processing chemicals) need to evolve to complement
Rwanda’s agricultural commodities. These industries will need to follow a different path of
accumulation, which will depend far less on agro-processing and light manufacturing and much more
on complex industrial structures and consumer demand at both the local and international levels.
Rwanda should continue exploiting its comparative advantage, i.e., its young and motivated labour
force, and to continue upgrading its industrial structure, which will have to continue providing the
necessary financial resources in the foreseeable future for other industries to flourish.

83
Manufacturing Sub-sector Prioritization for Rwanda
Following the prioritization of manufacturing industries based on six indicators and a preliminary desk-
based verification of Rwanda’s national strategies, we now focus on a more in-depth prioritization
(second stage ranking) of manufacturing sub-sectors within each of the shortlisted industries.
The second stage ranking follows the same procedure as that used in the first ranking exercise. For an
industry with at least three sub-sectors, such as the food and beverages industry, we start by
identifying the top two performers (sub-sectors at the ISIC4 rev.3 level) for each indicator. We identify
the top performers for industries with three or fewer sub-sectors, such as the paper industry.
In the second stage ranking, presented in Table 18, we identify 57 manufacturing sub-sectors. We
highlight the top performers in each indicator using the same colour code. For example, in the chemical
industry, the chemical sub-sectors (i) Manufacture of pesticides and other agrochemical products, and
(ii) Manufacture of soap and detergents, cleaning and polishing preparations, perfumes, and toilet
preparations, have the highest RCA. Furthermore, the (iii) Manufacture of fertilizers and nitrogen
compounds, (iv) Manufacture of pharmaceuticals, medicinal chemicals and botanical products have
the highest share of imports, and thus show strong potential for import substitution.
We revisit the desk-based verification exercise and find that the majority of sub-sectors identified in
the second stage ranking correspond with the set of priority industries, value chains and products
identified by Rwanda’s government, with the exception of coke and refined petroleum.
The results of the two stages of prioritization serve different purposes: the results of the first stage
ranking are useful for strategic alignment purposes and to facilitate consultations and discussions with
counterparts due to the results’ synthesis. The findings of the second stage ranking are useful for
developing targeted and thematic enabler programmes (such as the innovator programme managed
by NIRDA), as it provides more granular insights into the characteristics and scope of economic
activities.
Although we cover the majority of components of industrial development in industry prioritization,
some of the prioritized sub-sectors might be removed from the priority list due to Rwanda’s market
and technological constraints, for example, the manufacture of railway and tramway locomotives,
building and repairing of ships, aircraft and spacecraft. The manufacture of other industries such as
paper, automotive, and transport equipment industries may not be operational in the PCP to further
limit the field of action and to pose the basis for an effective programme document formulation. On
the other hand, other industries might be added based on national trends and emerging visions in
consultation with the Rwandan government in the PCP formulation phase.

84
Table 18: Priority manufacturing sub-sectors in Rwanda
Rwanda World
Revealed comparative advantage (highest value)
Emerging comparative advantage (RCA between 0.3 and 0.9 with the highest growth rate)
Job creation potential (highest value)
Latent potential (Strong Latent potential with the highest growth rate of gross export)
Import substitution (highest value)
Word import dynamism (highest value)
ISIC 2 rev.3
ISIC 4 rev.3
Description
Revealed comparative advantages, RCA (2019)
RCA growth rate (2015-19)
Employment to population ratio (%)
Latent potential
Growth rate of gross export (2005-17)
Import (US$) 2019
World import growth rate (2010-19)
Food and beverages
15 1512 Processing and preserving of fish and fish products below 0.03
15 1513 Processing and preserving of fruit and vegetables 0.3129 10.43%
15 1514 Manufacture of vegetable and animal oils and fats 115,000,000
15 1520 Manufacture of dairy products 0.0140%
15 1531 Manufacture of grain mill products 21.8059
15 1533 Manufacture of prepared animal feeds 4.38%
15 1541 Manufacture of bakery products 4.59%
15 1542 Manufacture of sugar 18.3385
15 1543 Manufacture of cocoa, chocolate and sugar confectionery
below 0.81
15 1549 Manufacture of other food products n.e.c. 35,800,000
15 1551 Distilling, rectifying and blending of spirits; ethyl alcohol production from fermented materials
0.3897 161.34%
15 1554 Manufacture of soft drinks; production of mineral waters
0.0223%
Textiles
17 1711 Preparation and spinning of textile fibres; weaving of textiles
30,100,000
17 1721 Manufacture of made-up textile articles, except apparel 0.5129
17 1722 Manufacture of carpets and rugs 0.99%
17 1723 Manufacture of cordage, rope, twine and netting 3.61%
17 1729 Manufacture of other textiles n.e.c. 5,232,496
17 1730 Manufacture of knitted and crocheted fabrics and articles
0.3734
Wearing apparel, fur
18 1810 Manufacture of wearing apparel, except fur apparel 0.3242
18 1820 Dressing and dyeing of fur; manufacture of articles of fur
0.0017%
Leather, leather products and footwear
19 1911 Tanning and dressing of leather 722,900
19 1912 Manufacture of luggage, handbags and the like, saddlery and harness
1.1177
19 1920 Manufacture of footwear 3.02%
Paper
21 2101 Manufacture of pulp, paper and paperboard 30,300,000
21 2102 Manufacture of corrugated paper and paperboard and of containers of paper and paperboard
2.65%
21 2109 Manufacture of other articles of paper and paperboard 0.5144
Coke and refined petroleum
23 2310 Manufacture of coke oven products 0.0070%
23 2320 Manufacture of refined petroleum products 1.1478
Chemicals
24 2411 Manufacture of basic chemicals, except fertilizers and nitrogen compounds
below 0.22
24 2412 Manufacture of fertilizers and nitrogen compounds 51,600,000
24 2413 Manufacture of plastics in primary forms and of synthetic rubber
0.0026%
24 2421 Manufacture of pesticides and other agro-chemical products
0.5511
24 2422 Manufacture of paints, varnishes and similar coatings, printing ink and mastics
0.35%
24 2423 Manufacture of pharmaceuticals, medicinal chemicals and botanical products
109,000,000
24 2424 Manufacture of soap and detergents, cleaning and polishing preparations, perfumes and toilet prepara
0.2075
24 2429 Manufacture of other chemical products n.e.c. 0.42%
24 2430 Manufacture of man-made fibres below 0.46
Non-metallic minerals
26 2610 Manufacture of glass and glass products 0.6021
26 2691 Manufacture of non-structural non-refractory ceramic ware
below 0.09
26 2692 Manufacture of refractory ceramic products 28,200,000
26 2693 Manufacture of structural non-refractory clay and ceramic products
below 0.77
26 2694 Manufacture of cement, lime and plaster 17.8085
26 2695 Manufacture of articles of concrete, cement and plaster 4.90%
26 2696 Cutting, shaping and finishing of stone 0.0049%
26 2699 Manufacture of other non-metallic mineral products n.e.c.
13,600,000
Basic metals
27 2710 Manufacture of basic iron and steel 0.5117 45.60%
27 2720 Manufacture of basic precious and non-ferrous metals 4.1008
85
Motor vehicles, trailers, semi-trailers
34 3410 Manufacture of motor vehicles 0.4048
34 3420 Manufacture of bodies (coachwork) for motor vehicles; manufacture of trailers and semi-trailers
5.25%
34 3430 Manufacture of parts and accessories for motor vehicles and their engines
21,500,000
Other transport equipment
35 3511 Building and repairing of ships 0.0055%
35 3512 Building and repairing of pleasure and sporting boats 2.67%
35 3520 Manufacture of railway and tramway locomotives and rolling stock
0.0028%
35 3530 Manufacture of aircraft and spacecraft 6,739,830
35 3591 Manufacture of motorcycles 0.3768
35 3592 Manufacture of bicycles and invalid carriages 5,627,590
35 3599 Manufacture of other transport equipment n.e.c. 4.09%
Source: UNIDO elaboration based on various sources. Note: Strong latent potential indicates that Rwanda’s actual export performance lies below the average performance of lower middle-income comparators. The opposite is the case for weak latent potential. Growth rate represents the cumulative annual growth rate (CAGR) of the period.

86
SECTION 3: IDENTIFICATION OF KEY BOTTLENECKS FOR RWANDA
Introduction
This section of the report discusses the key bottlenecks that firms in Rwanda face in their daily
operations. Specifically, it focuses on formal manufacturing firms. As manufacturing is a priority sector
for Rwanda alongside the development of high-end services as outlined in the country’s Vision 2020
and the Ministry of Trade and Industry’s Industrial Master Plan for 2009–2020 and National Industrial
Policy in 2011 (Chang et al., 2016), this section contributes to understanding the key bottlenecks that
prevent the country’s manufacturing firms from attaining the identified industrial targets.
Bottlenecks in this context are defined as problems related to factors that have a negative impact on
the performance of manufacturing firms and their ability to create value added and jobs. The
bottlenecks range from problems related to direct inputs such as capital, labour and other production
inputs, or indirect inputs such as the institutional frameworks for labour regulation, customs and trade
regulation, tax rates, business licensing, finance, land rights, independent courts, political instability,
amongst others.
The manufacturing sector needs efficient “network” services, cargo transport, transportation
insurance, finance and business service systems for transfers between buyers and sellers, legal
consultation services to deal with licenses, patents and franchise issues; the availability of human
capital for innovation, and a strong institutional regime that guarantees property rights, contract
enforcement and to boost investor confidence. Additionally, the manufacturing sector needs an
efficient telecommunication system that makes it easy for firms to effectively coordinate with clients
and suppliers and to help downstream manufacturing firms manage their supply chains (Aker & Mbiti,
2010). In terms of electricity, adequate and uninterrupted power supply ensures production lines can
operate continuously and that production assets are not left to lie idle. A combination of these direct
and indirect inputs goes a long way to affect the performance of downstream manufacturing firms.
The absence or inefficient supply of these inputs makes manufacturing firms non-competitive (Arnold
et. al., 2008; Arnold et. al., 2011; Arnold et al., 2016).
Although Rwanda’s industrial policy and accompanying strategic documents list key objectives and
intervention areas, this section aims to substantiate and quantify the challenges manufacturing firms
in the country face as well as highlight the emerging major bottlenecks for the priority focus areas. The
analysis in this section is based on surveys conducted by the World Bank Group in their series of
Enterprise Surveys (WBES). In Rwanda, the WBES dates back to 2006. Data for the recently released
WBES 2019/2020 are included here. In total, we use three waves of the WBES for the years 2006, 2011
and 2019/2020 to observe the overall trends and development of bottlenecks Rwanda’s

87
manufacturing firms have faced over the last 13 to 14 years. The latest available wave from the WBES
database is used for the comparator countries. Details on the databases used for this analysis are
provided in Appendix III. A careful and thorough analysis of the survey data resulted in the
identification of 17 overall factors. Each of these 17 factors represents a potential bottleneck Rwandan
firms have faced in their daily operations. We identify the severity of these bottlenecks by summing
up the share of manufacturing firms in Rwanda that responded that at least one of the 17 factors
represented a “very severe or major bottleneck” to their operations. Given the PCP’s mandate to
prioritize industrialization, we rank and compare these potential obstacles at the level of
manufacturing sector firms in Rwanda. We compare how the potential bottlenecks in the
manufacturing sector differ across locations (Kigali, Southern province, and Western province); across
firm size (large and small- and medium-sized enterprises (SMEs))53, ownership structure (foreign and
domestic enterprises54), and across exporting and non-exporting firms55. We additionally document
how these factors are ranked by manufacturing firms compared to the average of non-manufacturing
firms in Rwanda and the average comparator manufacturing firms in other SSA countries (this group
is referred to the manufacturing benchmark group).
The next section of the report provides an overview of the characteristics of manufacturing firms in
Rwanda. Next, the findings on key bottlenecks in general are summarized, highlighting the major
bottlenecks for priority policy intervention. In the fourth section, we delve deeper to provide details
on the major bottlenecks and highlight other selected bottlenecks. It is important to mention that the
bottlenecks identified and detailed in this report have also been discussed with relevant stakeholders
during consultations.
Profile of Manufacturing Firms in Rwanda
Manufacturing firms in Rwanda are predominantly small (78 per cent) and domestically owned (82 per
cent). Over 79 per cent of Rwandan manufacturing firms have been in operation for five years or
longer. Additionally, goods-producing firms in Rwanda are non-exporters, active domestically but with
remarkably limited engagement in global trade. Around 35 per cent of manufacturing firms are
exporters, consisting of large (77 per cent) and foreign-owned firms (68.1 per cent).56 Although the
total number of exporting manufacturing firms in the country remains low, there has been a surge in
53 As defined in the WBES dataset, small and medium sized enterprises are all enterprises with (5-99) workers and large sized enterprises are those with (100 and over) workers.
54 Foreign ownership/enterprise is a dummy equal to one if there is any foreign ownership in the establishment and zero if otherwise. Domestic ownership/enterprise on the other hand is a dummy equal to one if there is no foreign ownership in the establishment.
55 Exporting firm is a dummy equal to one if a firm engages in either direct or indirect export of goods or both and zero if otherwise. Non-exporting firms on the other hand is a dummy equal to one if a firm does not engage in either direct or indirect export of goods or both.
56 This is based on calculations using the 2019/2020 World Bank Enterprise Survey for Rwanda. Similar trends are also documented in Frazer and Van Biesebroeck (2019).

88
the total number of exporting firms in the country, increasing from 22 per cent in 200657 to 27.1 per
cent in 201158 and 35 per cent in 2019.
As documented in Frazer and Van Biesebroeck (2019), the productivity of these exporting firms is also
high. Average sales per worker are USD 45,000 for the marginal exporting manufacturing firm and
about 158,000 USD for the largest exporters. Very importantly, the sector’s contribution to the
country’s total exports rose from 6 per cent to 21 per cent between 2008 and 2016. Large
manufacturing firms, on average, employed 519 workers in 2019, representing an increase of about
20 per cent from 2011. SMEs, on the other hand, employed around 25 workers.59
Despite the impressive growth in the share of exporting manufacturing firms in the country, albeit
from a lower base, the majority of manufacturing output produced in Rwanda is consumed
domestically and the little that is exported is extremely concentrated in terms of trade destinations
and is almost exclusively delivered to a few neighbouring countries such as Burundi and the Democratic
Republic of Congo. This trend has not decreased over time (Frazer and Van Biesebroeck, 2019). In
terms of inputs, manufacturing firms in Rwanda source a significant share of intermediate inputs and
value-added from within (about 81 per cent),60 and rely very little on imported intermediates (Van
Biesebroeck and Mensah, 2019).
Main Obstacles for Manufacturing Firms
Table 19 presents three periods (2006, 2011 and 2019), the share of formal manufacturing firms in
Rwanda, and its comparator group that listed the 17 factors as being ‘very severe or major’ obstacles
to their business operations. Overall, Rwanda’s performance is better in relative terms than other SSA
comparator countries (see the complete list of countries in Table A.III.2 in the Appendix) with reference
to these bottlenecks, and the number of firms reporting these bottlenecks as being a very severe or
major obstacle to their operations have declined over time. Although the severity of these obstacles
to business operations is comparably lower in Rwanda than in other SSA countries, some relevant
problems still exist.
In 2006, Rwandan manufacturing firms perceived access to electricity (74.6 per cent), tax rates (49.2
per cent), transportation (40.7 per cent), access to finance (40.7 per cent) and tax administration (25.4
per cent) as the top five bottlenecks to their operations. In 2019, however, the share of manufacturing
firms that perceived these factors as major business obstacles dropped substantially to 8.3 per cent
for access to electricity, 10.8 per cent for tax rates, 3.3 per cent for transportation, 15.8 per cent for
access to finance and 3.3 per cent for tax administration.
Despite these remarkable drops, three (access to finance, tax rate, and electricity) out of these five
factors, together with competition from the informal sector (13.3 per cent) and inadequately skilled
labour force (7.5 per cent) emerged in 2019 as the most widely perceived major business obstacles by
57 This is based on calculations using the 2006 World Bank Enterprise Survey for Rwanda. 58 This is based on calculations using the 2011 World Bank Enterprise Survey for Rwanda. 59 This is based on calculations using 2019/2020 and 2011 World Bank Enterprise Survey for Rwanda. 60 This is based on calculations using 2019/2020 and 2011 World Bank Enterprise Survey for Rwanda.

89
formal manufacturing firms in the country. Domestically-owned firms61, small-and medium-sized
enterprises, non-exporting manufacturing firms and manufacturing firms located in the Southern and
Western provinces62 of Rwanda appeared to have been more strongly affected by these obstacles.
There are a few exceptions to this general observation. For instance, more exporting manufacturing
firms perceived access to electricity as being a very severe and major obstacle to their business
operations. These firms seem less confident about the country’s electricity situation and nearly 58 per
cent of these firms therefore either own or share a generator (see Table 25 on electricity).63 Similarly,
more exporting than non-exporting firms reported access to finance to be a major obstacle to their
business operations.
Compared to other countries in SSA, however, the share of manufacturing firms in Rwanda that
perceived each individual factor to be a major business obstacle is markedly lower than the average
share of SSA manufacturing firms, as reported in Table 19. For instance, the share of formal
manufacturing firms in Rwanda that perceived access to finance as a major obstacle was around 19.5
percentage points lower than the average share of SSA manufacturing firms. Similarly, the share of
manufacturing firms in Rwanda that perceived access to electricity to be a major obstacle was 41.8 per
cent lower than the average share of manufacturing firms in SSA. Similar differences in Rwanda’s
favour also emerge when the share of manufacturing firms that perceived the informal sector or the
inadequately skilled labour force to be major business obstacles are compared to the corresponding
average shares of SSA manufacturing firms (see Table 19). Aside from the five major obstacles
discussed above, other factors listed in Table 19 also indicate a downward trend in the shares of
manufacturing firms that reported these factors to pose a very severe and major obstacle to their
business operations between 2006 and 2019.
61 Tables of Section 3 contain information of domestic owned firms, small and medium enterprises, non-exporting firms and
firms in different regions for the manufacturing sector. In the Appendix of Section 3, sub – section d) results for groups of firms are contained for the overall economy.
62 There are few exceptions. A greater share of firms in Kigali than in the Western province perceived tax rates to be a major bottleneck to their business operations. Similarly, a greater share of firms in Kigali than in the Southern province perceived access to finance and inadequately skilled labour as a major bottleneck to their business operations.
63 This could also mean that these firms have the financial capacity to own or share a generator.

90
Table 19: Share of firms identifying the listed factors as very severe or major bottlenecks to their business operations
Mnf 2006 2011 2019
No
n-
man
ufa
ctu
rin
g
Man
ufa
ctu
rin
g-
SSA
Kig
ali
Sou
ther
n
pro
vin
ce
We
ste
rn
pro
vin
ce
Do
mes
tica
lly-
ow
ne
d f
irm
s
Fore
ign
o
wn
ed
fir
ms
Larg
e
firm
s
SMEs
Exp
ort
ing
firm
s
No
n-e
xpo
rtin
g
firm
s
Electricity
74.6
7.9 50.1 6.7 5.1 13.8 9.2 0 3.8 9.5 11.6 6.4 22.2
8.3
Telecom.
15.3
. 15.4 . . . . . . . . . 13.6
.
Transportation
40.7
2.9 21.4 0 5.1 5.5 3.7 0 0 4.3 2.3 3.9 30.9
3.3
Customs
22.0
3.3 18.6 2.2 0 0 0.9 0 0 1.0 0 1.3 14.8
0.8
Informal sector
23.7
10.0 32.3 15.5 10.2 13.8 14.7 4.5 3.8 15.9 4.6 18.2 48.2
13.3
Access to land
22.0
8.8 26.5 2.2 5.1 5.5 3.6 0 0 5.3 6.9 2.6 16.1
4.2
Courts
15.3
0.4 11.3 0 0 0 0 0 0 0 0 0 6.2
0
Crime
11.9
5.0 18.3 0 7.6 2.7 3.7 4.5 3.8 3.2 2.3 3.9 13.6
3.3
Tax rates
49.2
9.5 28.6 6.6 18.0 8.3 11.0 4.5 3.8 12.8 0 16.8 14.8
10.8
Tax admin.
25.4
3.3 23.1 4.4 2.6 2.7 2.7 4.5 7.7 2.1 4.6 2.6 18.5
3.3
Business lic. and permits
6.8
0 14.5 0 0 2.7 0.9 0 0 1.0 0 1.3 6.2
0.8
Macroeconomic stability
25.4
. 80.0 . . . . . . . . . .
.
Political instability
8.5
0.4 25.7 0 0 0 0 0 0 0 0 0 18.5
0
Corruption
20.3
0 32.6 0 5.2 0 1.8 0 0 2.2 0 2.6 13.6
1.7
Access to finance
40.7
14.5 35.3 6.6 10.2 33.3 16.5 4.5 3.5 19.1 18.5 14.2 33.3
15.8
Labour regulation
13.6
1.8 10.1 2.2 5.1 0 2.7 0 0 3.1 4.6 1.3 9.9
2.5
Inadequately skilled labour force
13.6
3.8 16.1 4.4 5.1 13.8 7.3 4.5 3.8 8.5 4.6 9.1 29.6
7.5
Note: ‘.’ means data is not available for the indicator for the reference year. It also means that data is not available for the industry and location for the particular indicator. A value of 0 means that no establishment or industry identify the indicator as a very severe or major bottleneck to their operations. Rwanda 2019 data for all columns, except Mnf and Mnf-SSA. Source: World Bank Enterprise Survey.

91
Bottlenecks in Detail
a) Access to finance
Existing empirical evidence suggests that access to finance increases firm productivity, employment
creation and participation in international trade, which ultimately leads to economic growth and
poverty reduction (Rahaman, 2011; Manova, 2013; Fowowe, 2017; Arnold et. al., 2008). This occurs
because access to finance enables firms to expand their operations, innovate and invest in production
facilities, including investing in a skilled workforce (OECD, 2006b). Therefore, well-functioning and
developed financial markets become of utmost policy importance because it ensures efficient
allocation of scarce financial resources to firms to finance productive investments. This section
discusses the situation of manufacturing firms in Rwanda regarding access to finance.
According to the Enterprise Survey, and as shown in Table 20, over 70 per cent of manufacturing firms
in Rwanda source their working capital from retained earnings or through internal funds. This is
regardless of firm location, ownership, firm size, and whether a firm is an exporter or non-exporter.
This is relatively higher than the average share of manufacturing firms in SSA (69.5 per cent) that use
retained earnings as a source of working capital. Banks in Rwanda provide 13.3 per cent of
manufacturing firms’ working capital, a figure that is 4 per cent higher than the SSA average. Financial
assistance from suppliers and customers represents a very important source, contributing close to 5
per cent of the working capital of manufacturing firms in the country.
Table 20: Source of working capital 2019
Man
ufa
ctu
rin
g
No
n-
man
ufa
ctu
rin
g
Man
ufa
ctu
rin
g-
SSA
Kig
ali
Sou
ther
n
pro
vin
ce
We
ste
rn
pro
vin
ce
Do
mes
tica
lly-
ow
ne
d f
irm
s
Fore
ign
o
wn
ed
fir
ms
Larg
e
firm
s
SMEs
Exp
ort
ing
firm
s
No
n-e
xpo
rtin
g
firm
s
% from retained earnings 76.3 78.5 69.5 82.3 74.3 71.3 75.5 88.9 84.7 74.2 78.3 75.1
% from banks 13.3 14.7 9.3 14.6 11.5 13.7 13.2 9.9 13.5 13.2 16.2 11.7
% from non-bank financial institutions
3.6 1.8 1.9 0.5 3.8 7.2 4.0 0.4 0.4 4.6 0.8 5.2
% from suppliers/customers 4.9 2.9 8.2 1.6 7.9 5.5 5.2 0.4 1.1 6.0 1.6 7.0
% from friends and relatives 1.6 1.9 5.5 0.7 2.2 2.1 1.8 0.2 0.2 2.0 3.4 0.7
Note: Sources of raising working capital (%) 2019. Mnf: Manufacturing. Rwanda 2019 data for all columns except Mnf-SSA. Source: World Bank Enterprise Survey.
Except for manufacturing firms in the Southern province (79.4 per cent), over 80 per cent of
manufacturing firms in the country has a savings or checking account (Table 21). This is regardless of
firm ownership, firm size, and whether a firm is an exporter or non-exporter and is higher than the
average share of bankable manufacturing firms in SSA (84 per cent). Thirty percent of these bankable

92
firms in Rwanda have an overdraft facility (1.7 lower than the SSA average share) and 32.5 per cent
have a line of credit (11.4 per cent higher than the SSA average share). From the foregoing, it is fair to
say that manufacturing firms in Rwanda have more access to finance than manufacturing firms in
comparator SSA countries.
Table 21: Financing 2019
M
anu
fact
uri
ng
No
n-
man
ufa
ctu
rin
g
Man
ufa
ctu
rin
g-
SSA
Kig
ali
Sou
ther
n
pro
vin
ce
We
ste
rn
pro
vin
ce
Do
mes
tica
lly-
ow
ne
d f
irm
s
Fore
ign
o
wn
ed
fir
ms
Larg
e
firm
s
SMEs
Exp
ort
ing
fi
rms
No
n-e
xpo
rtin
g
firm
s
% firms with checking or savings account
92.5 94.1 84.0 100.0 79.4 97.2 91.7 100.0 100.0 90.4 100.0 88.3
% firms with overdraft facility
30.0 28.3 31.7 57.7 7.6 19.4 25.6 63.4 61.5 21.2 53.4 16.8
% firms with line of credit or loan
32.5 34.1 21.1 35.5 23.1 38.8 32.1 40.9 46.1 28.7 44.1 25.9
Note: Mnf: Manufacturing. Rwanda 2019 data for all columns except Mnf-SSA. Source: World Bank Enterprise Survey 2019.
The average number of times firms applied for a new loan/line of credit (1.3) and the average number
of times the applications were rejected (0.2 equivalent to 15 per cent of applications) (Table 22) further
support the lower share of manufacturing firms in Rwanda (40.7 per cent in 2006 to 8.3 per cent in
2019) (Table 19) that perceived access to finance as a major business obstacle relative to the average
share of manufacturing firms in SSA. This is also consistent with the World Bank Ease of Doing Business
report that ranks the country in the first position in SSA in terms of getting credit (World Bank Doing
Business, 2019).
Table 22: Outcome of loan application 2006
Man
ufa
ctu
rin
g
No
n-m
anu
fact
uri
ng
Man
ufa
ctu
rin
g-
SSA
Kig
ali
Sou
ther
n p
rovi
nce
We
ste
rn p
rovi
nce
Do
mes
tica
lly-
ow
ne
d f
irm
s
Fore
ign
ow
ne
d f
irm
s
Larg
e
firm
s
SMEs
Exp
ort
ing
fi
rms
No
n-e
xpo
rtin
g
firm
s
No. of applications 1.3 1.8 1.5 . . . 1.2 1.7 1.4 0.4 1.2 0.3
No. of rejected applications
0.2 0.5 0.7 . . . 0.2 0.3 0.0 0.3 0.2 0.2
Note: Average number of times a firm applied for a new loan or line of credit and average number of times of rejection of financial applications. ’.’ means data is not available for the indicator for the reference year. It also means data is not available for the industry and location for the particular indicator. Mnf: Manufacturing. Rwanda 2006 data for all columns except Mnf-SSA. Source: World Bank Enterprise Survey.
Despite the remarkable success achieved in terms of access to finance, among the top five factors
ranked by Rwandan firms as major business obstacles in 2019, access to finance was ranked first (see
Table 19) suggesting the need for more concerted policy efforts to address the associated market and

93
institutional failures in the country’s finance sector. According to the PSDYE (2017), firms in Rwanda,
like other SSA countries, struggle to mobilize financing for their operations. This is evident across all
industries and firm sizes, except for very large firms that are relatively able to mobilize financing for
their operations. This is also consistent with Table 19, which shows that fewer large and foreign firms
perceived access to finance as a major obstacle to their business operations. One-third of firms in the
country struggle to operate their facilities at full capacity due to working capital constraints. Also, more
than 40 per cent of firms reported that access to affordable finance was the number one constraint to
private sector development in Rwanda (PSDYE, 2017). While part of this problem is attributed to the
low capacity of Rwandan firms to design bankable projects, there is also a narrow range of finance
availability and specific challenges within the financial sector that make it difficult for firms to access
finance for their operations. For instance, firms that want to export need to obtain letters of credit
which can be challenging to obtain. Receiving international payments cost as much as 5 per cent to 20
per cent in fees and currency exchange losses (PSDYE, 2017).
As reported in Table 23, while 37.6 per cent of manufacturing firms had not applied for a loan because
they did not need one, the rest indicated factors such as the complex application procedure (14.6 per
cent), unfavourable interest rates (9.4 per cent), and high collateral requirements (7.3 per cent) as
reasons for not applying for a loan. Important heterogeneities also arise across formal manufacturing
firm types. Domestically-owned firms, SMEs, non-exporting manufacturing firms and manufacturing
firms not located in Kigali appear to be more strongly affected by these obstacles. However, more
foreign firms and exporting firms reported that the interest rates are not favourable.
Table 23: Access to finance: Reasons for not applying 2019
Man
ufa
ctu
rin
g
No
n-
man
ufa
ctu
rin
g
Man
ufa
ctu
rin
g-
SSA
Kig
ali
Sou
ther
n
pro
vin
ce
We
ste
rn
pro
vin
ce
Do
mes
tica
lly-
ow
ne
d f
irm
s
Fore
ign
o
wn
ed
fir
ms
Larg
e
firm
s
SMEs
Exp
ort
ing
firm
s
No
n-e
xpo
rtin
g
firm
s No need for loan 37.5 42.0 44.8 47.1 34.2 29.6 35.9 64.2 77.8 28.2 50.0 30.6
Application procedure were too complex
14.6 13.0 11.2 11.7 14.2 18.5 15.7 7.1 11.1 15.4 8.8 17.7
Interest rates were not favourable
9.4 6.7 16.1 14.7 2.8 11.1 7.9 14.3 5.6 10.3 14.7 6.4
Collateral requirements were too high
7.3 7.3 10.3 2.9 8.5 11.1 7.9 0 0 8.9 2.9 9.6
Size of loan and maturity insufficient
4.2 3.6 1.6 2.9 5.7 3.7 3.4 0 0 5.1 2.9 4.8
Other 21.9 20.7 8.1 20.5 25.7 18.5 23.6 14.2 5.6 25.6 20.5 22.5
Note: Share (%) of firms that responded why they did not apply for a loan. 0 means that no establishment or industry identify the indicator as a very severe or major bottleneck to their operations. Mnf: Manufacturing. Rwanda 2019 data for all columns except Mnf-SSA. Source: World Bank Enterprise Survey.
94
Manufacturing firms in Rwanda that applied for a new loan or new line of credit were required to
provide collateral with a value about three times the value of the loan or line of credit applied for. This
is regardless of firm location, ownership, firm size, and whether a firm is an exporter or non-exporter.
This situation seems to have deteriorated. In 2006, the collateral required for a loan was, on average,
166 per cent of the value of the loan or line of credit applied for as reported in Table 24.
Table 24: Required collateral as a share of the total value of loan/line of credit
Mnf 2006 2019 N
on
-m
anu
fact
uri
ng
Man
ufa
ctu
rin
g-
SSA
Kig
ali
Sou
ther
n
pro
vin
ce
We
ste
rn
pro
vin
ce
Do
mes
tica
lly-
ow
ne
d f
irm
s
Fore
ign
o
wn
ed
fir
ms
Larg
e
firm
s
SMEs
Exp
ort
ing
firm
s
No
n-e
xpo
rtin
g
firm
s
Collateral needed in % of total value of loan/line of credit
166.8 261.4 320.8 305.1 202.5 332.4 292.4 278.6 315.1 279.8 278.1 299.0
288.9
Note: Collateral as a share of total value of loan/line of credit. Mnf: Manufacturing. Rwanda 2019 data for all columns except Mnf and Mnf-SSA. Source: World Bank Enterprise Survey.
Consultations with stakeholders confirm the importance of access to finance for manufacturing firms
in the country and despite efforts made to increase access to finance, it still remains a bottleneck to
business operations. The stakeholders mentioned that the complex application procedure is not a
major obstacle to access finance, at least from their experience and engagement with firms. They
agree, however, that high interest rates, high collateral costs, improper financial bookkeeping
(especially for firms not paying VAT), and lack of information about potential opportunities that exist
in the financial market, act as barriers to access to finance. For instance, the Rwandan financial sector
is dominated by commercial banks, all of which require a more than 100 per cent finance value in
collateral, with a prime interest rate that remains high at between 16 per cent and 18 per cent (PSDYE,
2017). Lending interest rates in Rwanda are also higher than the SSA average (Figure 31).
Figure 31: Lending interest rates
Source: World Bank WDI.
The stakeholders also mentioned that the government has put measures in place to help alleviate
these constraints. For instance, some institutions in the country have been contracted to guide firms
05
101520253035404550
2006 2007 2008 2009 2010 2011 2012 2013 2014 2015 2016 2017 2018 2019
Lending interest rate (%)
SSA Rwanda

95
on how to keep proper books of accounts and how to successfully prepare and present projects to
banks for financial support. Also, the government has set up an agency called Business Development
Fund that acts as a guarantor for firms seeking to apply for financial support from banks but lack the
required collateral to secure new loans or lines of credit.
b) Bottleneck: Electricity
Adequate power supply ensures that production lines remain uninterrupted and production assets are
not left to lie idle. For this reason, unreliable electrical power supply increases the production and
operational costs of firms and serves as a disincentive to investors, leading to the diversion of foreign
investment. All of these factors put together makes firms non-competitive (Arnold et al., 2008;
Andersen and Dalgard, 2013). Abeberese (2013), for instance, shows firms that are located in countries
with poor power supply, lack the incentive to either move to productivity-enhancing industries or
expand, since doing so comes at the high cost of having to rely on electricity. Cole et al. (2018) find
that reducing average power outage levels to those of South Africa would increase the overall sales of
firms in sub-Saharan Africa by 85.1 per cent. Abdisa (2018) also finds that power outages in Ethiopia
negatively affect firms’ productivity, increasing firms’ costs by 15 per cent from 2011 to 2015, with the
negative effect being higher for smaller firms.
Figure 32: Share of population with access to electricity
Source: World Bank WDI.
Given the banes associated with poor electrical power supply on the economy and the prospect of
transitioning from a low-income to a middle-income country, the Government of Rwanda is aiming at
100 per cent electricity access by 2024. The country currently only has 218 MW of installed generation
capacity, with the major electricity sources being hydroelectric (42 per cent), thermal (31 per cent),
methane (14 per cent) and solar (5 per cent).64 To date, 59.7 per cent of Rwandan households have
access to electricity, and are either connected to the national grid (43.8 per cent) or obtain their
64 http://reg.rw/what-we-do/access/ 14/09/2020.
0
10
20
30
40
50
2006 2011 2018
Access to electricity (% of population)
Rwanda SSA

96
electricity from off-grid systems (15.9 per cent).65 As shown in Figure 32 and Figure 33, access to
electricity in Rwanda, including in rural and urban areas, has increased substantially over time.
In 2006, only about 4 per cent of the rural population had access to electricity. By 2018, nearly 24 per
cent of the same population had access to electricity (Figure 32). Access to electricity in Rwanda’s
urban areas is substantially higher. About 89 per cent of the urban population had access to electricity
in 2018. Between 2006 and 2018, the share of urban population with access to electricity increased by
almost 42 per cent (Figure 33). Compared to the average SSA sample, however, access to electricity in
Rwanda is lower, although the country performs better than the average SSA country in terms of the
electricity access rate in urban areas as presented in Figure 32 and Figure 33.
Figure 33: Share of rural and urban population with access to electricity
Source: World Bank WDI.
Consistent with the general improvements in access to electricity in the country, the share of Rwandan
manufacturing firms that perceived access to electricity as a major business obstacle declined by 66.3
percentage points between 2006 and 2019 (Table 19). Compared to 2006, when 74.6 per cent of
manufacturing firms perceived access to electricity to be a major obstacle to business operations, only
8.3 per cent of firms perceived it as a major obstacle to business operations in 2019. Also, compared
to the 50.1 per cent average share of manufacturing firms in SSA that perceived access to electricity to
be a major obstacle in 2019, manufacturing firms in Rwanda are better off, as the country’s share of
manufacturing firms that perceived access to electricity as a major obstacle to their business
operations was 41.8 percentage point lower than the SSA average. Nevertheless, there seem to be
heterogeneities due to firm characteristics. In 2019 (Table 19), more exporting manufacturing firms
(11.6 per cent) tended to perceive access to electricity to be an obstacle to their business operations,
although this figure represents a significant drop in the number of firms claiming that access to
electricity posed a problem in 2006. Specifically, about 63.2 per cent of exporting firms, respectively,
perceived access to electricity to be a major obstacle in 2006. Despite the progress, these firms seemed
65 http://reg.rw/what-we-do/access/ 19/03/2021.
0%
20%
40%
60%
80%
100%
Rwanda Rural SSA Rural Rwanda Urban SSA Urban
Access to Electricity by Region (%)
2006 2011 2018
97
to be less confident about the country’s electricity situation and for that matter, nearly 58 per cent of
these firms either own or share a generator (see Table 25).66
In terms of location, only 6.7 per cent of firms located in Kigali, the capital city, perceived access to
electricity to be a major obstacle, while around 15.1 per cent and 13.8 per cent of firms located either
in the Southern or Western provinces perceived access to electricity to be a major obstacle, indicating
a significant spatial disparity in electricity access across the country. This is also consistent with the
World Bank’s data in Figure 33.
According to the Enterprise Survey, about 36.7 per cent of all manufacturing firms in Rwanda in 2019
reported experiencing a power outage in a typical month, occurring about eight times in a typical
month, with each power outage lasting for about less than one hour. These power outages also cost
firms 2 per cent of losses in sales. These figures represent a significant improvement in the country’s
electricity situation since 2006. In 2006, about 81.4 per cent of all manufacturing firms in Rwanda
reported experiencing a power outage in a typical month, occurring about 15 times in a typical month,
with each power outage lasting for about four hours and costing firms about 9.2 per cent losses in sales
(Table 25). Compared to manufacturing firms in comparator SSA countries, for each of these indicators,
the share of manufacturing firms that perceived them as major business obstacles was lower in
Rwanda than in comparator countries in SSA. They were also lower than the share of non-
manufacturing firms in the country. Specifically, there were fewer manufacturing firms in Rwanda than
in SSA that experienced power outages in a typical month, there were also fewer occurrences of power
outages in a typical month in Rwanda than in other SSA countries; power outages in other SSA
countries lasted longer than in Rwanda before they were restored (Table 25). As expected,
improvement in access to electricity in the country was followed by a 39.9 per cent reduction in the
share of manufacturing firms that own or share generators between 2006 and 2019 (Table 25). This is
also consistent with the World Bank’s Ease of Doing Business report that ranks the country in the
second position in SSA in terms of access to electricity (World Bank Doing Business, 2019).
Different stakeholders we spoke to supported these progressive trends in access to electricity in the
country. They reported that load shedding has reduced, and power cuts have reduced significantly.
They mentioned, however, that there is still room for improvement. Specifically, providing and
extending access to electricity to the rural population is very important. The stakeholders also reported
that high electricity costs in the country still represent a huge bottleneck to the operations of firms.
According to the Enterprise Survey, firms spent 5.1 per cent of total production cost on electricity in
2019 (Table 25). The country’s high electricity cost is also highlighted in the PSDYE (2017) report. The
report reveals that the lack of affordable electricity is a challenge to firms’ operations. This is
particularly the case for larger firms engaged in the manufacturing and in high-end service sectors for
whom high-quality connectivity is paramount. Firms also cite high energy costs as contributing to the
high production costs. In 2016, manufacturing firms in Rwanda paid an average tariff of USD 0.24 per
kWh — the most expensive tariff in East Africa. In comparison, Tanzania’s industrial tariffs in 2016
averaged USD 0.12 while it was USD 0.13 in Uganda. The high-power tariffs in the country have partly
66 This could also mean that these firms have the financial capacity to own or share a generator.

98
been blamed for the slow growth of the manufacturing sector. From our consultations it emerged that
high energy costs have a negative impact on the profitability of businesses in Rwanda.67
Table 25: Electricity
Mnf 2006 2011 2019
No
n-
man
ufa
ctu
rin
g
Man
ufa
ctu
rin
g-
SSA
Kig
ali
Sou
ther
n
pro
vin
ce
We
ste
rn
pro
vin
ce
Do
mes
tica
lly-
ow
ne
d f
irm
s
Fore
ign
o
wn
ed
fir
ms
Larg
e
firm
s
SMEs
Exp
ort
ing
firm
s
No
n-e
xpo
rtin
g
firm
s
Experience power outages (%)
81.4
40.0 76.3 35.5 23.0 52.7 37.6 31.8 30.7 38.3 48.8 29.8 66.7
36.7
Number of power outages
15.1
11.1 17.6 5.1 11.0 8.3 8.1 3.5 3.6 8.6 4.6 10.5 5.4
7.7
Length of power outages
4.1
1.2 8.7 0.6 1.2 0.8 0.8 0.2 0.3 0.9 0.8 0.7 6.0
0.8
Losses (%) of sales
9.2
3.1 13.3 2.8 0.0 1.9 2.1 0.4 0.6 2.4 0.7 4.0 4.9
2.0
% that own or share generator
56.9
37.9 52.5 55.5 10.2 33.3 33.9 59.1 57.6 27.6 58.1 20.7 60.5
34.2
% of electricity from own or shared generator
30.3
7.6 35.1 8.3 14.6 9.4 9.9 10.2 9.0 9.9 8.3 11.7 7.6
9.6
Cost % of electricity68
8.5
6.7 14.3 2.7 6.4 6.5 5.2 5.3 4.9 5.2 3.2 6.1 13.5
5.1
Note: Mnf: Manufacturing. Rwanda 2019 data for all columns, except Mnf and Mnf-SSA. Source: World Bank Enterprise Survey.
In January 2020, the Rwandan Utilities Regulatory Authority (RURA) announced new electricity tariffs.
The new reviewed tariffs favoured healthcare facilities and data centres but were increased for
industries and residential consumers. The tariff for healthcare facilities was revised from RWF 192 per
kilowatt-hour (KWh) to RWF 186 per KWh, a reduction of 3 per cent. Residential customers who
consume between 15 KWh and 50 KWh per month now pay RWF 212 per KWh instead of RWF 182,
while those who consume beyond 50 KWh per month pay RWF 249 per KWh instead of RWF 210.
Although given incentives (in the form of subsidies) depend on the time of operations (off-peak,
shoulder hours, and peak hours), the government increased the tariffs for small industries (RWF 110
to RWF 134 per KWh), medium industries (RWF 87 to RWF 103 per KWh), and large industries (RWF
80 to RWF 94 per KWh). The new tariffs were last revised in 2018 but are now expected to be reviewed
every quarter to cater for fluctuating costs, such as currency exchange rates and fuel costs. The
67 Accessed at: https://www.theeastafrican.co.ke/tea/business/rwanda-s-power-costs-set-to-decline--1355742#:~:text=According%20to%20highly%20placed%20sources,%240.12%3B%20while%20Uganda's%20average%20%240.13. Accessed on 15/09/2020.
68 Share of electricity cost to total cost (%).

99
increase in tariffs is even higher for industries without smart metres. Small, medium, and large
industries without smart metres pay a flat rate of RWF 151 per KWh, RWF 123 per KWh, and RWF 106
per KWh, respectively. The increase in electricity tariffs is attributed to the increased production of
electricity, as well as activities related to the expansion and maintenance of the network.69
c) Tax rates
Tax constitutes an essential component of a government’s source of revenue, with large intended
public goods and services provision being dependent on it. In this vein, there is a widespread view that
higher tax compliance from citizens and corporate entities spurs economic growth and development
by enabling the government to fulfil its social contract (Barro, 1990; Barro & Sala-i-Martin, 1992;
Eubank, 2011; Gadenne, 2011; OECD, 2013). Nonetheless, when the tax burden becomes too high, it
can reduce economic growth because it diverts away scarce resources from productive investments,
such as innovation and capital investment. For instance, Liu & Mao (2019) find that a tax incentive
programme for Chinese firms’ investment in fixed assets between 2004 and 2009, on average, raised
investments and productivity of the treated firms relative to the control firms by 38.4 per cent and 8.9
per cent, respectively. One of the ways tax burdens increase is through high tax rates.
Figure 34: Total tax and contribution rate (% of profit)70
Source: World Bank WDI.
The tax rate is still among the top five bottlenecks manufacturing firms in Rwanda face. However, as
shown in Figure 34 and Figure 35, tax rates in Rwanda are business-friendly compared to the average
tax rates in SSA. Specifically, between 2006 and 2019, the ‘Total tax and contribution rate (% of profit)’
declined by 8 per cent, while ‘Other taxes payable by businesses (% of commercial profits)’ declined
by 6 per cent. Consistent with this drop at the aggregate level, the share of manufacturing firms that
69 Accessed at: https://www.newtimes.co.rw/news/electricity-tariffs-increased-residential-consumers-industries#:~:text=Residential%20customers%20who%20consume%20between,per%20KWh%20instead%20of%20Rwf210. Accessed on 15/09/2020.
70 The total tax rate measures the amount of taxes and mandatory contributions payable by businesses after accounting for allowable deductions and exemptions as a share of commercial profits. Taxes withheld (such as personal income tax) or collected and remitted to tax authorities (such as value added taxes, sales taxes or goods and service taxes) are excluded.
0
10
20
30
40
50
60
70
80
2006 2007 2008 2009 2010 2011 2012 2013 2014 2015 2016 2017 2018 2019
Total tax and contribution rate (% of profit)
SSA Rwanda

100
reported tax rates to be a major business obstacle dropped substantially from 49.2 per cent in 2006 to
10.8 per cent in 2019. Similar patterns emerge across all manufacturing firm types between 2006 and
2019, as shown in Table 19. Comparing firm types over time, the differences between domestic and
foreign firms’ shares that perceived tax rates as a major business obstacle tend to be time-dependent,
although declining over time in both cases. However, the share of SMEs that perceived the tax rates
as a major obstacle was consistently higher than the share of large formal manufacturing firms over
time. The Enterprise Survey does not ask for details, however, this pattern could be an indicator of
structural and institutional conditions in the tax system such as special tax incentive packages
favouring large firms. More firms in the country’s Southern province perceived tax rates as a major
obstacle to their business operations. Compared to the average of other comparator African countries,
tax rates are lower in Rwanda (Figure 34 and Figure 35) and the share of manufacturing firms in the
country that perceived the tax rates as a major obstacle is consistently lower than the average share
of manufacturing firms in SSA that perceived tax rates as being a major obstacle.
Figure 35: Other taxes payable by businesses (% of commercial profits)71
Source: World Bank WDI.
Over the years, especially from the late 1990s onwards, the Government of Rwanda recognized the
problems in the country’s tax system and initiated various progressive tax reforms, which have
contributed to improvements in the country’s tax system. The improvement in the country’s tax
administration and tax policy has resulted in an increase in the country’s tax revenues from under 10
per cent of GDP in 2000 to 16 per cent in 2016. The country has benefited from donor support,
particularly from the United Kingdom’s Department for International Development (DFID) to
modernize the country’s tax system. DFID provided Rwanda with a high level of technical and material
assistance for two decades. This helped reduce the administrative tax burden on businesses (USAID,
2016).72 The improvement of the country’s tax system began with the creation of the Rwanda Revenue
71 Other taxes payable by businesses include the amounts paid for property taxes, turnover taxes and other minor taxes such as municipal fees and vehicle and fuel taxes.
72 Accessed at: https://www.usaid.gov/sites/default/files/documents/1865/Rwanda_DRM_case_study_briefing_note_FINAL.pdf Accessed on 14/09/2020.
0
10
20
30
40
50
2006 2007 2008 2009 2010 2011 2012 2013 2014 2015 2016 2017 2018 2019
Other taxes payable by businesses (% of commercial profits)
SSA Rwanda

101
Authority (RRA) in 1998, the replacement of an inefficient sales tax with a more modern value-added
tax (VAT)73 in 2001 and plans that were put in place to prepare the country to enter the East African
Community (EAC) Customs Union in 2009 (effective 2010).
In the early days of RRA’s, “tax compliance requirements were costly and time consuming for
taxpayers. Filing for any of the domestic taxes, or even obtaining a tax clearance certificate, required
that a taxpayer physically walk into an RRA office to process paperwork, then go to a bank for payment,
and finally return to the RRA. This resulted in long queues at RRA offices and banks, especially around
peak filing deadline times. The finalizing of a return, filing, and payment for VAT, income tax, or Pay as
You Earn (PAYE) on average took over 23 days. In 2011 and 2012, the RRA launched e-filing and e-
payment – greatly reducing these taxpayer compliance burdens. RRA reports that it now takes three
days to get a taxpayer compliance certificate versus the 10 days that was previously customary.
Taxpayers can also directly pay their tax at the bank without having to make double trips to the RRA”
(USAID, 2016: 2). Moreover, the country also embarked on improving taxpayer education, outreach
and assistance programmes. Such education and assistance programmes, for instance, helped the RRA
staff bring more enterprises from the informal sector into the tax net. The programme helped increase
SME registration from 42,538 to 90,485 from 2010/11 to 2011/12. Accordingly, this increased the
revenue collected in the same period from RWF 385.2 billion to RWF 651.9 billion. The government
also implemented tax industrial friendly policies. For instance, in recent years, the government has
offered business tax incentives by eliminating VAT on imported inputs (USAID, 2016).
d) Inadequately skilled labour force
The quality and composition of the skilled labour force available to a firm plays a pivotal role in the
competitiveness of the firm. Increasingly, specific types of skills, such as soft skills (i.e. teamwork,
communication, language) and occupation-specific skills are gaining in importance, as well as high-end
skills (for instance, IT skills) are necessary to maintain the momentum of innovation in firms (ILO, 2012;
Choi et al., 2019). Acquired through a sequence of education, training and labour market programmes
(Banerji et al., 2010; Tan et al., 2015), the importance of a workforce with adequate skills for firm
performance is well documented in the literature, with extant studies suggesting that its dearth has a
negative impact on firm performance (Tan et al., 2015).
Developing countries predominantly suffer from inadequate workforce skills. Relative to other regions,
sub-Saharan Africa has the fastest-growing labour force, lack of human capital and the largest stock of
ill-equipped adults. The region has fared extremely poorly on the World Bank’s Human Capital Index
(Choi et. al., 2019). About 61 per cent of working-age adults are not proficient in reading, and 19.5 per
cent of adults aged 15 years and older can neither read nor write (UIL, 2017). The Rwandan
government and the country’s Workforce Development Authority (WDA) acknowledges that
inadequate workforce skills (including soft and technical skills) are a major challenge in the country.74
According to the PSDYE (2017), the skill constraints in the country are largely driven by relatively low
73 Sales tax had produced about 2 per cent of GDP in revenue. The VAT system produced 3.3 per cent of GDP in revenue in its first year, rising to 4.0 per cent in 2005 and 5.2 per cent in 2016 (USAID, 2016).
74 Accessed at: http://www.sdfrwanda.rw/ Accessed on 15/09/2020.
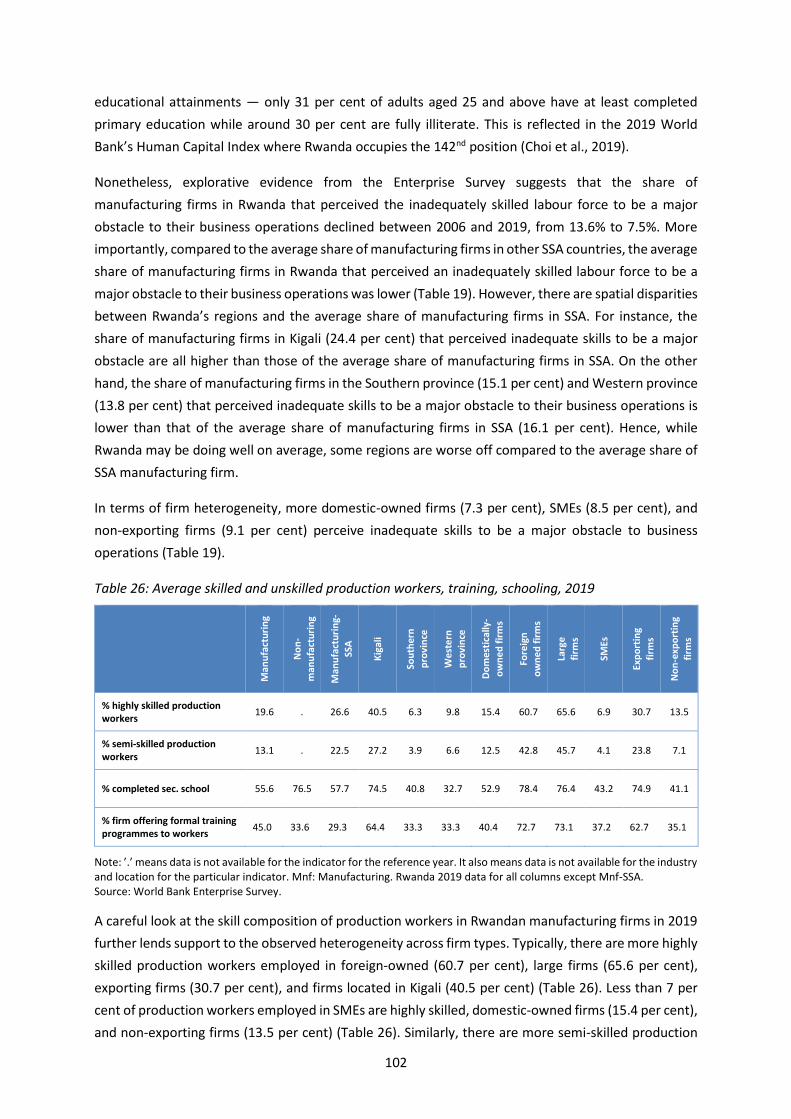
102
educational attainments — only 31 per cent of adults aged 25 and above have at least completed
primary education while around 30 per cent are fully illiterate. This is reflected in the 2019 World
Bank’s Human Capital Index where Rwanda occupies the 142nd position (Choi et al., 2019).
Nonetheless, explorative evidence from the Enterprise Survey suggests that the share of
manufacturing firms in Rwanda that perceived the inadequately skilled labour force to be a major
obstacle to their business operations declined between 2006 and 2019, from 13.6% to 7.5%. More
importantly, compared to the average share of manufacturing firms in other SSA countries, the average
share of manufacturing firms in Rwanda that perceived an inadequately skilled labour force to be a
major obstacle to their business operations was lower (Table 19). However, there are spatial disparities
between Rwanda’s regions and the average share of manufacturing firms in SSA. For instance, the
share of manufacturing firms in Kigali (24.4 per cent) that perceived inadequate skills to be a major
obstacle are all higher than those of the average share of manufacturing firms in SSA. On the other
hand, the share of manufacturing firms in the Southern province (15.1 per cent) and Western province
(13.8 per cent) that perceived inadequate skills to be a major obstacle to their business operations is
lower than that of the average share of manufacturing firms in SSA (16.1 per cent). Hence, while
Rwanda may be doing well on average, some regions are worse off compared to the average share of
SSA manufacturing firm.
In terms of firm heterogeneity, more domestic-owned firms (7.3 per cent), SMEs (8.5 per cent), and
non-exporting firms (9.1 per cent) perceive inadequate skills to be a major obstacle to business
operations (Table 19).
Table 26: Average skilled and unskilled production workers, training, schooling, 2019
Man
ufa
ctu
rin
g
No
n-
man
ufa
ctu
rin
g
Man
ufa
ctu
rin
g-
SSA
Kig
ali
Sou
ther
n
pro
vin
ce
We
ste
rn
pro
vin
ce
Do
mes
tica
lly-
ow
ne
d f
irm
s
Fore
ign
o
wn
ed
fir
ms
Larg
e
firm
s
SMEs
Exp
ort
ing
firm
s
No
n-e
xpo
rtin
g
firm
s
% highly skilled production workers
19.6 . 26.6 40.5 6.3 9.8 15.4 60.7 65.6 6.9 30.7 13.5
% semi-skilled production workers
13.1 . 22.5 27.2 3.9 6.6 12.5 42.8 45.7 4.1 23.8 7.1
% completed sec. school 55.6 76.5 57.7 74.5 40.8 32.7 52.9 78.4 76.4 43.2 74.9 41.1
% firm offering formal training programmes to workers
45.0 33.6 29.3 64.4 33.3 33.3 40.4 72.7 73.1 37.2 62.7 35.1
Note: ’.’ means data is not available for the indicator for the reference year. It also means data is not available for the industry and location for the particular indicator. Mnf: Manufacturing. Rwanda 2019 data for all columns except Mnf-SSA. Source: World Bank Enterprise Survey.
A careful look at the skill composition of production workers in Rwandan manufacturing firms in 2019
further lends support to the observed heterogeneity across firm types. Typically, there are more highly
skilled production workers employed in foreign-owned (60.7 per cent), large firms (65.6 per cent),
exporting firms (30.7 per cent), and firms located in Kigali (40.5 per cent) (Table 26). Less than 7 per
cent of production workers employed in SMEs are highly skilled, domestic-owned firms (15.4 per cent),
and non-exporting firms (13.5 per cent) (Table 26). Similarly, there are more semi-skilled production

103
workers and secondary school graduates in foreign-owned, large, and exporting manufacturing firms
and manufacturing firms located in Kigali. These same firms tend to offer more formal training
programmes to workers (Table 26). Except for firms offering formal training programmes to workers,
the performance of manufacturing firms in Rwanda in all of these indicators is lower relative to the
performance of average manufacturing firms in comparator SSA countries (Table 26).
This means that despite the decline and the lower share of firms in Rwanda that perceived an
inadequately skilled labour force to be a major obstacle to business operations compared to the
average share of manufacturing firms in other SSA countries, Rwanda seems to lag behind
manufacturing firms in other comparator SSA in certain indicators as shown in Table 26. Consultations
with stakeholders revealed that inadequately skilled labour is among the top four bottlenecks
manufacturing firms in the country face. In addition to inadequately skilled labour, the stakeholders
also mentioned that most industries lack the skills needed for market access (e.g. marketing and
communication skills) to increase the visibility of their operations and products. These bottlenecks
seem to have been identified by the country and are being addressed. Several skills development
programmes have been rolled out in the country to address the skill bottleneck. Specifically, the
Government of Rwanda through the Workforce Development Authority (WDA) received a credit from
the World Bank for the implementation of its skills development strategy under the country’s Skills
Development Project (SDP). Implemented by WDA through the existing National Employment Program
(NEP), the SDP aims to minimize the skills gaps experienced by private business operators in selected
sectors such as energy, transportation and logistics, and manufacturing (with a focus on ‘Made in
Rwanda’ products) by expanding training opportunities for the acquisition of quality, market-relevant
skills needed to work in these sectors. The project provides grants for firms that enable the workforce
in these firms to receive training from training providers. The beneficiary firms must have the potential
to promote employment and reduce skills gaps to receive this grant. Successful firms are selected to
receive the grants based on the number of employees, capacity and potential for value addition and
improved productivity, increased foreign direct investment, and the potential of the sector to support
growth in other sectors.75
e) Competition from informal sector
The informal sector in sub-Saharan Africa accounts for about 40 per cent of output and 80 per cent of
employment in the region (ILO, 2013; African Development Bank, 2013).76 The sector is characterized
by small and inefficient firms, run by poorly educated entrepreneurs, and the majority of these
informal firms are branded as unproductive (Mohammad and Islam, 2015; La Porta and Shleifer, 2011,
2014). Over the years, the informal sector has remained persistent, large, and has continued to
function as a key part of the structure of the region’s economies. The informal sector’s unique
attributes have made it very resilient and slow to change. In a region where employment opportunities
in the formal sector are limited, the informal sector remains the only significant pathway to generate
income.
75 Accessed at: http://www.sdfrwanda.rw/ Accessed on 15/09/2020. 76 This includes agricultural employment.

104
The Rwandan economy is no different from the general patterns observed in SSA countries. The
economy of Rwanda is dominated by a large informal sector. According to the country’s labour force
survey in 2017, approximately 91 per cent of all workers and 84 per cent of non-agricultural workers
are classified as informal workers (ILO, 2018). The sector is dominated by SMEs that are mostly
household-owned, accounting for about 17 per cent of Rwanda’s total output, and 90 per cent of all
firms in the country (EDPS2, 2013). For instance, in 2018, the ILO conducted an extensive study of the
country’s booming building construction sector and found that the sector depends almost exclusively
on an informal workforce (98 per cent are informal workers), many of which have very low skills and
education levels (87 per cent have completed primary education or less). Very low wages, irregular
payment of wages, worker occupational safety and health risks, irregular contracts, and limited
training opportunities are the common challenges faced by the vast majority of workers in the informal
sector (ILO, 2018).
When asked to name important reasons why they opt to operate in the informal economy, informal
firms in Rwanda named factors such as lack of sufficient capital to operate a formal business, high taxes
and increased business costs for operating a formal business, difficulty to understand how to formalize
their business and no special benefits from registration as part of their decision to operate informally
(Rukundo, 2015).
Typically, development literature considers informality and the activities of informal enterprises as
largely negative for the economy. Also, evidence from establishment-level data reveals that market
competitive behaviour of informal firms is one of the top three obstacles formal businesses face in the
product market in SSA (Avenyo et al., 2019, Mendi and Costamagna, 2017; Gonzalez and Lamanna,
2007). This competition occurs through prices at the local level, where competitive interactions are
found to occur in the product market. For instance, informal firms have a competitive advantage of
lower labour costs and face lower or no taxes. All of these aspects translate into lower prices for goods
produced by the informal enterprise. Research has also been carried out to investigate the effects of
informal competition on the performance of innovative products introduced by formal firms. Using the
World Bank’s Enterprise Survey with the Innovation Follow-up Survey for five sub-Saharan African
countries, Avenyo et al (2019) finds that local informal competition has a robust negative effect on the
product innovation intensity of formal firms, while within industry, informal competition enhances
innovative sales. The authors argue that local informal competition harms the performance of product
innovation, but only for formal firms that lack strategic collaborative ‘footholds’ in the informal
economy.
Consistent to the above and despite the substantial drop in the share of formal manufacturing firms in
Rwanda that perceived the informal sector as being a major business obstacle, competition from the
informal sector was the second major obstacle in 2019 that formal manufacturing firms in the country
faced. Between 2006 and 2019, the share of formal manufacturing firms in Rwanda that perceived the
informal sector as a major obstacle to their business operations declined by 10.4 per cent (from 23.7
per cent in 2006 to 13.3 per cent in 2019), which is higher than the average share of non-manufacturing
firms in the country (10 per cent) but lower than the average share of manufacturing firms in SSA (32.3
per cent) that also perceived it as a major obstacle. There are spatial differences in the shares of

105
manufacturing firms that perceived the informal sector to be a major obstacle for their business
operations. For instance, the share of formal manufacturing firms in Kigali that perceived the informal
sector as a major obstacle was 15.1 per cent, while the shares of the formal manufacturing firms in the
Southern and Western provinces were 10.2 per cent and 13.8 per cent, respectively, which were all
lower than the 32.3 per cent average share of manufacturing firms in SSA (Table 19). Also, more
domestic, non-exporting firms and SMEs perceived the informal sector to be a stronger obstacle to
their business operations than for other types of firms. Moreover, in Rwanda, formally registered firms
reporting payroll information to authorities are more likely to enter the export market (Frazer and Van
Biesebroeck, 2019).
Consultations with stakeholders revealed that the size of the informal sector itself may pose a severe
competition to formal firms, given the size advantage and limited regulation faced by these informal
enterprises. However, the exact magnitude of these obstacles to formal manufacturing firms is
unknown, given that the majority of these informal enterprises are small enterprises with a limited
capacity to operate on the scale of formal manufacturing firms.

106
SECTION 4: FINAL SUGGESTIONS FOR PCP DESIGN
The objective of this PCP diagnostic study was to reveal thematic components, priority industries
within the manufacturing sector as well as key bottlenecks as perceived by firms. The primary purpose
of these findings is to contribute to further discussions on project design and potential points of entry
for interventions with a substantial impact on Rwanda’s industrial development. For this reason, the
synthesis of the analyses across the macro-, meso- and micro-level are summarized in Figure 36along
the national priorities laid down in national policy and strategy documents. The results of both the
thematic components and the priority industries correspond closely with Rwanda’s national policy
objectives. Moreover, the key bottlenecks identified in this report overlap with those discussed in the
various national policy documents. The forthcoming dialogue between the Government of Rwanda
and UNIDO can be facilitated by an appropriate PCP governance structure. A governance system
aligned with the recommended PCP framework will ensure a smoother and more efficient
collaboration between UNIDO, the Government of Rwanda, other national stakeholders and
development partners, which in turn will ease effective implementation of identified activities. It is
recommended to establish a national coordination body to lead, guide and supervise the programme’s
implementation, with focal points representing each component. These focal points can be matched
with UNIDO’s technical focal points, which will ensure direct channels of communication and facilitate
joint work. Equally useful would be the establishment of working groups which, coordinated by the
focal points and comprising the wider PCP stakeholders, could support, where necessary, the national
coordination body.

107
Figure 36: Strategic map for Programme for Country Partnership (PCP) Rwanda
• ISIC 15: Food and beverages
• ISIC 17: Textiles
• ISIC 18: Wearing apparel/leather
• ISIC 21: Paper
• ISIC 24: Chemicals
• ISIC 26: Non-metallic minerals
• ISIC 27: Basic metals
• ISIC 34: Motor vehicles, trailers, semi-trailers
• ISIC 35: Other transport equipment
• Development of sustainable
energy
• Value added creation in a
circular economy
• Integrated value chain
development
• Adequate skills for Industry 4.0
and investment promotion
• Governance development
• Access to finance
• Access to electricity
• Tax rates
• Inadequately skilled labour force
• Informal sector competition
•Economic transformation pillar
•Social transformation pillar
•Transformational government pillar
National Strategy of Transformation
•Promotion of domestic production for local consumption
•Promotion of export competitiveness
•Enabling environment for industrialization
National Industrial Policy
•Development of sustainable energy
National Energy Strategy
Rwanda’s Vision 2050 and national priorities
Inclusive and Sustainable
Industrial Development
(Alignment with UN SDG 9)
Cross-cutting thematic
components of UNIDO PCP (enablers)
Priority manufacturing
industries
Firm-level bottlenecks (challenges)
Source: UNIDO

108
References
Chapter 1
AfDB (2014), Eastern Africa’s Manufacturing Sector. Promoting Technology, Innovation, Productivity and Linkages, Rwanda Country
Report, November 2014.
Behuria, P. (2019), Twenty‐first Century Industrial Policy in a Small Developing Country: The Challenges of Reviving Manufacturing
in Rwanda, Development and Change, 50(4), 1033-1062.
Bimenyimana S, Asemota G.N.O., Li L (2018), The State of the Power Sector in Rwanda: A Progressive Sector With Ambitious Targets,
Frontiers in Energy Research, 6, pp. 1-14.
Boston Consulting Group (2016), Sprinting to Value in Industry 4.0. Perspectives from and Implications for U.S. Manufacturers,
presentation, December 2016. https://www.slideshare.net/TheBostonConsultingGroup/sprinting-to-value-in-industry-40.
Calabrese L. Papadavid P. Tyson J., Rwanda: financinging for manufacturing, SET (Supporting rconomic transformation) working
paper, https://set.odi.org/wp-content/uploads/2017/06/Financing-for-Manufacturing-Rwanda-June-2017.pdf
Chang, H.-.J. (2010), ‘Hamlet without the Prince of Denmark: How development has disappeared from today’s “development”
discourse’, in: Khan, S. Christiansen, J. (eds.), Towards New Developmentalism: Market as Means rather than Master, Abingdon:
Routledge.
Cimoli, M., Dosi, G., Nelson, R., Stiglitz, J.E. (2009), ‘Institutions and Policies Shaping Industrial Development: An Introductory Note’,
in: Cimoli, M., Dosi, G., Stiglitz, J.E. (eds), Industrial Policy and Development. The Political Economy of Capabilities Accumulation,
Oxford University Press, Oxford. New York.
Eustache, H., Sandoval, D., Garba Wali, U., Venant, K. (2019), Current Status of Renewable Energy Technologies for Electricity
Generation in Rwanda and Their Estimated Potentials, Energy and Environmental Engineering 6(1), pp. 8-15.
Government of Rwanda (2017), 7 Years Government Programme: National Strategy for Transformation (NST 1), 2017 – 2024,
Government of Rwanda, Kigali.
Hausmann, R., Chauvin, J. (2015), Moving to the Adjacent Possible: Discovering Paths for Export Diversification in Rwanda, CID
Working Paper, 294, April 2015.
Hausmann, R., Hwang, J., Rodrik, D. (2007) What you export matters, Journal of Economic Growth, 12, pp. 1–25.
IMF (2018), World Economic Outlook: Cyclical Upswing, Structural Change, April 2018. Washington, DC: IMF.
IMF (2019), Staff Report for the 2019 Article IV Consultation and Request for a Three-Year Policy Coordination Instrument, IMF
Country Report No. 19/211 , July 2019.
IMF (2020), Rwanda: Request for Disbursement Under the Rapid Credit Facility, IMF Country Report No. 20/207, June 2020.
INSEAD (2020), The Global Talent Competitiveness Index 2020. Global Talent in the Age of Artificial Intelligence. Available at:
https://www.insead.edu/global-indices.
Kabera T. and H. Nishimwe (2019), Systems analysis of municipal solid waste management and recycling system in east Africa:
benchmarking performance in Kigali city, Rwanda, E3S Web of Conferences 80, 03004,
https://doi.org/10.1051/e3sconf/20198003004
Kabera, T., D. Wilson and H. Nishimwe (2019), Benchmarking performance of solid waste management and recycling systems in East
Africa: Comparing Kigali Rwanda with other major cities, Waste Management & Research, Vol. 37(1) supplement 58-72.
Ministry of Environment of Rwanda (2019), National environment and climate change policy, June 2019.
Ministry of Infrastructure (2015), Rwanda’s Energy Policy, March 2015.
Ministry of Infrastructure (2016), Rural Electrification Strategy, June 2016.
Ministry of Trade and Industry (2011), National Industrial Policy, April 2011.
Ministry of Trade and Industry (2015a), Domestic Market Recapturing Strategy, March 2015.
Ministry of Trade and Industry (2015b), National Export Strategy II.

109
Ministry of Trade and Industry (2017), Made in Rwanda Policy, November 2017.
Ministry of Trade and Industry (2018), Revised SEZ Policy. Addressing the infrastructure constraint to industrialisation in Rwanda,
January 2018.
National Institute of Statistics of Rwanda (NISR) (2018), Labour Force Survey Report. Annual Report 2018, December 2018.
National Institute of Statistics of Rwanda (NISR) (2019), Gross Domestic Product - National Accounts (Fiscal Year 2018/19),
September 2019.
Pritchett, L. (2000), Understanding Patterns of Economic Growth: Searching for Hills among Plateaus, Mountains, and Plains, The
World Bank Economic Review, 14(2), pp. 221–50.
Rajashekar, A., A. Bowers, A. Sebarenzi Gatoni (2019), Assessing waste management services in Kigali, July.
Reinert, E.S. (2007), ‘How Rich Countries Got Rich – and Why Poor Countries Stay Poor’, Carroll & Graf, New York.
REMA (2019), Rwanda compendium of environment statistics 2018, Rwanda Environment Management Authority (REMA),
February, https://www.rema.gov.rw/index.php?id=39
REMA (2009), Rwanda State of Environment and outlook report 2009, Rwanda Environment Management Authority,
https://www.rema.gov.rw/soe/
Republic of Rwanda (2004), Strategic Plan for the Transformation of Agriculture in Rwanda (PSTA I). Ministry of Agriculture and
Animal Resources, Republic of Rwanda (ROR), Kigali.
Republic of Rwanda (2011), Green Growth and Climate Resilience National Strategy for Climate Change and Low Carbon
Development, October 2011.
Rodrik, D., 2018. New Technologies, Global Value Chains, and Developing Economies, NBER Working Paper, 25164.
Schwab, K. (2017) The Fourth Industrial Revolution, Crown Publishing: New York.
Szirmai, A. (2012), Industrialisation as an engine of growth in developing countries, 1950–2005, Structural Change and Economic
Dynamics, 23(4), pp. 406-420.
Timmer, M.P. and Szirmai, A. (2000), ‘Productivity growth in Asian Manufacturing: the structural bonus hypothesis examined’,
Structural Change and Economic Dynamics, 11, pp. 371-392.
UNIDO (2020), Industrial Development Report 2020. Industrializing in the digital age. Vienna.
UN Economic Commission for Africa, TradeMark East Africa (2020) Creating a unified regional market: towards the implementation
of the African continental free trade area in East Africa, January 2020, available at:
https://www.uneca.org/publications/creating-unified-regional-market-towards-implementation-african-continental-free-
trade.
World Bank and Government of Rwanda (2019), Future Drivers of Growth in Rwanda: Innovation, Integration, Agglomeration, and
Competition. World Bank, Washington, DC.
Chapter 2
Balassa, B. (1965) Trade liberalization and revealed comparative advantage.
https://onlinelibrary.wiley.com/doi/abs/10.1111/j.1467-9957.1965.tb00050.x Accessed date: 05 August 2018
Government of Rwanda (2017) National Strategy for Transformation (NST1). http://www.minecofin.gov.rw/index.php?id=150
Accessed date: Accessed date: 01 September 2020
Haraguchi, N. and Rezonja, G. 2010. In Search of General Patterns of Manufacturing Development. UNIDO Working Paper 02/2010.
Vienna: United Nations Industrial Development Organization.
Haraguchi, N. 2014. Patterns of structural change and manufacturing development. UNIDO Working Paper 07/2014. Vienna: United
Nations Industrial Development Organization.
Haraguchi, N., 2015. Patterns of Structural Change and Manufacturing Development. In: Routledge Handbook of Industry and
Development, eds. Weiss, J. and Tribe, M., New York, NY: Routledge, pp. 38–64.
Katz, J.2000. Structural Change and Labour Productivity Growth in Latin American Manufacturing Industries 1970-96. World
Development. 28(9): 1583-1596.

110
Lin, J. and Chang, H-J.2009. Should Industrial Policy in Developing Countries Conform to Comparative Advantage or Defy it?
A Debate between Justin Lin and Ha-Joon Chang. Development Policy Review. 27(5): 483-502.
Ministry of Trade and Industry, Rwanda (2015) Rwanda Domestic Recapturing Strategy.
https://www.tralac.org/images/News/Documents/Rwanda%20Domestic%20Market%20Recapturing%20Strategy%20March%
202015.pdf Accessed date: 01 September 2020
Ministry of Trade and Industry, Rwanda (2011) National Industrial Policy.
http://www.minicom.gov.rw/fileadmin/minicom_publications/policies/Industrial_Policy-2.pdf Accessed date: Accessed date:
01 September 2020
National Industrial Research and Development Agency, Rwanda (2020) Open calls. https://www.nirda.gov.rw/open-
calls/#:~:text=The%20NIRDA%20Open%20calls%20are,for%20domestic%20and%20international%20markets. Accessed date:
Accessed date: 01 September 2020
UNIDO (2013) Industrial Development Report 2013
https://www.unido.org/sites/default/files/2013-12/UNIDO_IDR_2013_main_report_0.pdf
Accessed date: 30 August 2020
UN Comtrade (2020) International Trade Statistics Database. https://comtrade.un.org/ Accessed date: 30 August 2020
Chapter 3
Abdisa, L. (2018). Power outages, economic cost, and firm performance: Evidence from Ethiopia. Utilities Policy, 53, 111-120.
Abeberese, A. (2013). Electricity cost and firm performance: evidence from India. Review of Economics & Statistics, 99(3), 839-852.
African Development Bank. (2013). Recognizing Africa’s informal sector. Accessed at: https://blogs.afdb.org/afdb-championing-
inclusive-growth-across-africa/post/recognizing-africas-informal-sector-11645. Date Accessed 12/09/2020.
Aker, J & Mbiti, I. (2010). Mobile phones and economic development in Africa, Journal of Economic Perspectives, 24(3), 207–232.
Andersen, T., & Dalgaard, C-J. (2013). Power outages and economic growth in Africa. Energy Economics, 38, 19-23.
Arnold, J. M, Javorcik, B & Mattoo, A. (2011). Does services liberalization benefit manufacturing firms?: Evidence from the Czech
Republic, Journal of International Economics, 85(1), 136–146.
Arnold, J. M, Javorcik, B, Lipscomb, M & Mattoo, A. (2016). Services reform and manufacturing performance: Evidence from India,
The Economic Journal, 126(590), 1–39.
Arnold, J. M, Mattoo, A & Narciso, G. (2008). Services inputs and firm productivity in Sub-Saharan Africa: Evidence from firm-level
data, Journal of African Economies, 17(4), 578–599.
Avenyo, E. K., Konte, M., & Mohnen, P. (2019). Product Innovation and Informal Market Competition in sub-Saharan Africa. Journal
of Evolutionary Economics. https://doi.org/10.1007/s00191-020-00688-2.
Banerji, A., Cunningham, W., Fiszbein, A., King, E., Patrinos, H., Robalino, D., & Tan, J.-P. (2010). Stepping up Skills for More Jobs and
Higher Productivity, World Bank, Washington DC. Accesed at: https://elibrary.worldbank.org/doi/pdf/10.1596/27892 Date
Accessed. 12/09/2020.
Barro, R. (1990). Government spending in a simple model of endogenous growth. Journal of Political Economy, 98(S5), 103-125.
Barro, R., & Sala-i-Martin, X. (1992). Public finance models of economics. Review of Economic Studies, 59(4), 645-661.
Chang, H-J., Hauge, J. and Irfan, M. (2016). Transformative Industrial Policy for Africa. Addis Ababa: United Nations Economic
Commission for Africa (UNECA).
Choi, J., Dutz, M., Usman, Z. (2019). The future of work in Africa: Harnessing the potential of digital technologies for all. Washington,
DC: World Bank.
Cole, A., Elliott, R., Occhiali, G., & Strobl, E. (2018). Power outages and firm performance in Sub-Saharan Africa. Journal of
Development Economics, 134, 150-159.
EDPRS2 (2013). Economic Development and Poverty Reduction Strategy II. Accessed at:
http://www.minecofin.gov.rw/fileadmin/templates/documents/NDPR/EDPRS_2.pdf Date accessed 11/09/2020.

111
Eubank, N. (2012). Taxation, political accountability, and foreign aid: Lessons from Somaliland. Journal of Development Studies, 48(4),
465–480.
Fowowe, B. (2017). Access to Finance and Firm Performance: Evidence from African Countries. Review of Development Finance, 7(1),
6-17
Frazer, G & Van Biesebroeck, J. (2019), The Extent of Engagement in Global Value Chains by Firms in Rwanda. Policy Research
Working Paper No. WPS 8979. Washington, D.C.: World Bank Group.
Gadenne, L. (2011). Tax me, but spend wisely: the political economy of taxes, evidence from Brazilian local governments. American
Economic Journal: Applied Economics, 9(1), 274-314.
Gonzalez, A.S. & Lamanna, F. (2007). Who Fears Competition from Informal Firm? Evidence from Latin America. World Bank Policy
Research Paper. No. 4316. World Bank. Washington D.C.
ILO (2012), International Standard Classification of Occupations ISCO-08, Vol. 1, The International Labor Organization, Geneva.
ILO. (2018). Laying a Foundation for Better Working Conditions. A Market Analysis in Rwanda’s Building Construction Sector. ILO,
Geneva. Access at: https://www.ilo.org/wcmsp5/groups/public/---ed_emp/documents/publication/wcms_644796.pdf. Date
Accessed 12/09/2020.
La Porta, R., & Shleifer, A. (2011). The unofficial economy in Africa. NBER Working Paper16821. Cambridge, MA: National Bureau of
Economic Research.
La Porta, R., & Shleifer, A. (2014). Informality and development. NBER Working Paper20205. Cambridge, MA: National Bureau of
Economic Research.
Liu, Y., & Mao, J. (2019). How Do Tax Incentives Affect Investment and Productivity? Firm-Level Evidence from China. American
Economic Journal: Applied Economics, 11(3), 261-91
Manova, K. (2013). Credit Constraints, Heterogeneous Firms, and International Trade. Review of Economic Studies, 80, 711–744.
Mendi, P. & Costamagna, R. (2017). Managing Innovation Under Competitive Pressure from Informal Producers. Technological
Forecasting and Social Change, 114: 192-202.
Mohammad, Amin, and Islam Asif. 2015. “Are Large Informal Firms More Productive than the Small Informa Firms? Evidence from
Firm-Level Surveys in Africa.” World Bank. Washington, DC 74: 374–85.
OECD. (2013). Tax and development. Accessed at: https://www.oecd.org/ctp/tax-global/what-drives-tax-morale.pdf Date Accessed
10/09/2020.
OECD. (2013). Tax and development. Accessed at: https://www.oecd.org/ctp/tax-global/what-drives-tax-morale.pdf Accessed
Date: 09/09/2020.
PSDYE. (2017). Private Sector Development and Youth Employment Strategy. Accessed at
http://www.minecofin.gov.rw/fileadmin/templates/documents/NDPR/Sector_Strategic_Plans/PSD_YE.pdf Date Accessed
14/04/2020.
Rahaman, M. (2011). Access to Financing and Firm Growth. Journal of Banking & Finance, 35(3), 709-723.
Rukundo, J.B. (2015). Productivity and Informality in Rwanda. Evidence from Food Processing Sector. Accessed at:
file:///C:/Users/User1/AppData/Roaming/Microsoft/Windows/Network%20Shortcuts/ProductivityandInformalityinRwanda.Ev
idencefromtheFoodProcessingSector.pdf Date Accessed 12/09/2020.
Tan, H., Bashir, S., & Tanaka, N. (2016). Skill use, skill deficits, and firm performance in formal sector enterprises evidence from the
Tanzania enterprise skills survey, 2015. World Bank Policy Research Working Paper. No. 7672. World Bank. Washington D.C.
UIL (UNESCO Institute for Lifelong Learning). (2017). The Status of Adult Learning and Education in Sub-Saharan Africa: Regional
Report. Hamburg: UIL
USAID. (2016). Domestic Resource Mobilization: Case Study of Rwanda 1990-2016. Accessed at
https://www.usaid.gov/sites/default/files/documents/1865/Rwanda_DRM_case_study_briefing_note_FINAL.pdf Date
accessed 14/09/2020.
Van Biesebroeck, J & Mensah, E.B. (2019). The Extent of GVC Engagement in Sub-Saharan Africa. Policy Research Working Paper No.
WPS 8937. Washington, D.C.: World Bank Group.
World Bank Doing Business. (2019). Access at https://www.doingbusiness.org/en/rankings Date accessed 10/09/2020.

112
Appendices
Appendix to Section 1
Table A.I.1: List of comparator countries in sub-Saharan Africa
Country Country code World Bank income group
Burundi BDI Low income
Kenya KEN Lower middle income
South Sudan SSD Low income
Tanzania TZA Lower middle income
Uganda UGA Low income
Mali MLI Low income
Malawi MWI Low income
Chad TCD Low income
South Africa ZAF Upper middle income
Ethiopia ETH Low income

113
Appendix to Section 2
The theoretical concept of the comparative advantage is illustrated in Figure A1:
◼ (i) Comparative advantage: as illustrated in Figure A1, for example, Industry A can be
considered a low-tech, labour-intensive industry that develops rapidly at a relatively early
stage of development, e.g. USD 3,000 GDP per capita (constant 2005 PPP) (i-A), while Industry
B, a capital- and technology-intensive industry, is likely to emerge and grow rapidly at a higher
income level, e.g. USD 10,000 GDP per capita (constant 2005 PPP) (i-B).
◼ (ii) Country-given effects: while the relationship between income levels and manufacturing
structure has some elements of universality (as countries follow a more or less similar path of
structural change) as income increases, geographic and demographic conditions give countries
natural advantages or disadvantages in the development of certain industries (Katz, 2000). For
example, holding other conditions constant, abundant natural resources endowment tend to
work against manufacturing development (Haraguchi and Rezonja, 2010).
◼ (iii) Other long-term conditions: finally, the course of manufacturing structural change is not
only determined by the universal effects of income levels and given demographic and
geographic conditions, but there is also space for individual countries to have an autonomously
evolving structure. Therefore, the country-created or specific conditions, such as history,
culture and policy, are also significant (Lin and Chang, 2009). Some countries (ii-A) have
characteristics that give them distinct advantage (upward) over others in relation to
manufacturing export per capita for a given level of income, while others (ii-B) have
characteristics that give them a lower performance (downward) consistently over a long
period of time.

114
Figure A1: Schematic representation of the role of comparative advantage and country-specific and time-specific effects in manufacturing development
Source: Haraguchi (2014, pp.29)
Please see Haraguchi (2014, pp. 30) for model used in projecting the patterns of comparative
advantage and country-specific and time-specific effects.

115
Appendix to Section 3
a) Bottleneck analysis: methodology and survey Information
Methodology and interpretation of bottleneck analysis
The methods used are discussed to identify the bottlenecks Rwandan firms face, particularly formal
manufacturing firms, formal non-manufacturing firms and formal manufacturing firms in comparator
SSA countries, using information from a series of survey rounds of the World Bank Enterprise Survey.
A careful and thorough analysis of the survey data resulted in the identification of 17 overall factors.
Each of the 17 factors represents a potential bottleneck that firms in Rwanda face in their daily
operations. The factors are listed below in the order they appear in the WBES:
▪ Electricity
▪ Telecommunication
▪ Transportation
▪ Customs and trade regulation
▪ Informal sector
▪ Access to land
▪ Courts
▪ Crime
▪ Tax rates
▪ Tax administration
▪ Business licensing and permits
▪ Macroeconomic stability
▪ Political stability
▪ Corruption
▪ Access to finance
▪ Labour regulation
▪ Inadequately skilled labour force.
All of these factors represent potential bottlenecks to the operations of firms, albeit at different
degrees. Specifically, in the survey, participating firms were asked to rate how much the specific factor
acted as an obstacle to their current business operations. Survey participant firms could choose from
five answers, ranging from ‘No obstacle; minor obstacle, moderate obstacle, major obstacle, to very
severe obstacle’). To identify the lists of interventions and priority focus areas for the government and
policymakers, we rank these factors according to their level of severity by adding the share of firms
identifying each of the listed factors as “a very severe or major bottleneck” to the operation of their
business. This is our adopted strategy to define the severity of a given problem. Although we compare
the severity of these bottlenecks in Rwanda to other comparator countries in SSA to help in the
identification of priority areas, even if the severity of the problem is comparably lower in Rwanda, it
does not make the problem less severe for firms in Rwanda. We pay particular attention to analyse
and discuss in detail the most severe bottlenecks.

116
The WBES database we used dated back to 2006. Data for the recently released World Bank Enterprise
Survey 2019/2020 were also included. We used three waves of the WBES for the years 2006, 2011 and
2019/2020 to observe overall trends and the development of bottlenecks manufacturing firms in
Rwanda have faced over the last 13 to 14 years. We ranked these factors according to their level of
severity using results from the 2019/2020 survey data since it is the latest available data in the survey
for Rwanda and also provides a better picture of how these bottlenecks affect manufacturing firms’
current business operations.
Given the priority mandate of the PCP to focus on industrialization, we rank and compare these
potential obstacles first at the level of Rwanda’s manufacturing sector, compare the potential
obstacles across locations, across firm size, ownership structure, and across exporting and non-
exporting firms. We additionally documented how these factors as ranked by manufacturing firms,
compared to the average of non-manufacturing firms in Rwanda and averages of comparator
manufacturing firms (in other SSA in the WBES as shown in Table A.III.1). The table reports values per
group (column) and answer (row). The first cell is interpreted as the share of manufacturing firms in
Rwanda that reported that Factor 1 represented a “very severe or major bottleneck” to the operation
of their business. This was then compared to the share of non-manufacturing firms in Rwanda that
gave the same response to Factor 1, across the averages of comparator manufacturing countries in
SSA, and to the other dimensions of comparison listed above. The latest available data in the WBES
database is used for the comparator countries. Details on the databases and the questions code from
the Enterprise Surveys used for the analysis are provided and listed in Table A.III.2-6.
Answers to the questions in the series of the World Bank Enterprise Survey ranges from providing an
absolute number (for example, losses of % of sales due to power outages) or a share of firms naming
a factor or choosing from a category (for example, did a firm experience power outages in the last fiscal
year and give a ‘Yes, or No’ response). When answers in the table are presented in terms of numbers
or shares, they refer to averages. When answers are provided in terms of choosing from a category,
the corresponding values reported in the table refer to the share of firms that choose a specific
category.
Table A.III.1: Typical table for analysis
Man
ufa
ctu
rin
g
No
n-
man
ufa
ctu
rin
g
Man
ufa
ctu
rin
g-
SSA
Kig
ali
Sou
ther
n
pro
vin
ce
We
ste
rn
pro
vin
ce
Do
mes
tica
lly-
ow
ne
d f
irm
s
Fore
ign
o
wn
ed
fir
ms
Larg
e
firm
s
SMEs
Factor 1 . . . . . . . . . . . . .
Factor 2 . . . . . . . . . . . . .
Factor 3 . . . . . . . . . . . . .

117
Table A.III.2: Country and sector coverage, WB Enterprise Survey
WB Enterprise Survey year
Angola 2010
Benin 2016
Botswana 2010
Burkina Faso 2009
Burundi 2014
Cameroon 2016
Cape Verde 2009
Central African Republic 2011
Chad 2018
Congo 2009
Côte d'Ivoire 2016
DRC 2013
Djibouti 2013
Eswatini 2016
Ethiopia 2015
Gabon 2019
The Gambia 2018
Ghana 2013
Guinea 2016
Guinea-Bissau 2006
Kenya 2018
Lesotho 2016
Madagascar 2013
Malawi 2014
Mali 2016
Mauritania 2014
Mauritius 2009
Mozambique 2018
Namibia 2014
Niger 2017
Nigeria 2014
Rwanda 2006 2006
Rwanda 2011 2011
Rwanda 2019 2019
Senegal 2014
Sierra Leone 2017
South Africa 2007
South Sudan 2014
Togo 2016
Uganda 2013
Zambia 2019
Zimbabwe 2016
Note: We use the latest available data for all comparator countries in SSA in the WBES. Source: World Bank Enterprise Survey.

118
Table A.III.3: Country and sector coverage, WB Enterprise Survey
Number of observations (total)
Number of observations (manufacturing only)
Angola 360 141
Benin 150 70
Botswana 268 87
Burkina Faso 394 96
Burundi 157 60
Cameroon 361 102
Cape Verde 156 68
Central African Republic 150 37
Chad 153 74
Congo 151 38
Côte d'Ivoire 361 106
DRC 529 243
Djibouti 266 64
Eswatini 150 75
Ethiopia 848 377
Gabon 179 37
The Gambia 151 63
Ghana 720 377
Guinea 150 27
Guinea-Bissau 159 50
Kenya 1,001 455
Lesotho 150 76
Madagascar 532 282
Malawi 523 176
Mali 185 99
Mauritania 150 50
Mauritius 398 150
Mozambique 601 287
Namibia 580 170
Niger 151 41
Nigeria 2,676 1,147
Rwanda 2006 212 59
Rwanda 2011 241 81
Rwanda 2019 360 120
Senegal 601 247
Sierra Leone 152 77
South Africa 937 680
South Sudan 738 90
Togo 150 45
Uganda 762 382
Zambia 601 175
Zimbabwe 600 289
Note: We use the latest available data for all comparator countries in SSA in the WBES. The observations in the table are the maximum number of observations. However, not every firm participating in the survey responded to every question and often, there was a lower number of observations in terms of response rate. This usually happens when a participating firm either did not know the answer to the question being asked, the question did not apply to the firm or the firm simply did not want to answer. Source: World Bank Enterprise Survey.

119
Table A.III.4: Manufacturing sector coverage, WB Enterprise Survey
Foo
d &
B
eve
rage
s
Text
ile &
Leat
he
r
Wo
od
P
rod
uct
s
No
n-M
et.
Min
era
l
Bas
ic
Me
tals
Ch
em
Ru
bb
er
&
Pla
stic
P
rod
uct
s P
aper
&
Pap
er
Pro
du
cts
Pri
nti
ng
and
Pu
blis
hin
g
Co
ke, r
ef.
P
etr
ole
um
,
Nu
cle
ar F
ue
l
Angola 30 7 9 3 7 3 1 2
Benin 17 1 2 2 2 10 2 19
Botswana 9 19 4 5 3 6 3 1 10
Burkina Faso 20 9 5 2 10 8 5 1 13
Burundi 28 2 2 6 3 13
Cameroon 20 9 8 4 6 6 2 15 2
Cape Verde 22 9 11 1 2 3 1 3
Central African Republic 21 1 2 1 7
Chad 12 23 1 1 12
Congo
Côte d'Ivoire 30 16 11 1 2 9 7 1 7
DRC 44 42 13 14 1 21 2 3 9 1
Djibouti 32 1 6 5 3 1 1
Eswatini 20 12 3 8 1 3 5 2 7
Ethiopia 89 70 8 63 13 13 27 3 27
Gabon
Gambia 9 17 1 1 1 18
Ghana 57 35 1 21 10 26 25 3 62 3
Guinea 4 1 2 1 5 7
Guinea-Bissau 10 4 20 5 1 2
Kenya 143 68 9 23 4 49 39 13 14
Lesotho 8 33 17 2 2 2 1
Madagascar 70 65 36 9 4 19 10 18 1
Malawi 45 31 12 5 2 16 15 5 26 2
Mali 33 22 2 1 4 10 5 4 1
Mauritania 33 1 3 2 1 3 7 1
Mauritius 79 57 6 1 4 7 10 1 12
Mozambique 83 23 28 6 1 4 13 2 10 1
Namibia 29 20 10 20 7 6 6 4 7 2
Niger 18 5 2 2 8
Nigeria 272 239 57 182 42 39 26 7 164 14
Rwanda 2006 21 7 1 1 0 7 3 2 7 0
Rwanda 2011 24 6 4 3 2 9 5 1 15 0
Rwanda 2019 65 3 3 8 2 1 4 5 2 0
Senegal 126 30 23 3 5 12 8 3 15
Sierra Leone 12 20 1 2 6 4 2 6
South Africa 114 130 31 8 2 83 22 12 18 2
South Sudan 32 1 1 9 3 3 1 1
Tanzania 91 94 18 15 4 11 17 19 2
Togo 9 1 2 1 8 4 1 4
Uganda 118 59 22 14 3 9 5 5 15 1
Zambia 74 15 10 8 7 13 7 2 9 1
Zimbabwe 94 86 6 8 5 11 8 3 16 3
Note: We use the latest available data for all comparator countries in SSA in the WBES. Source: World Bank Enterprise Survey.

120
Table A.III.5: Coverage of other dimensions, WB Enterprise Survey
Country Domestically owned firm
Foreign- owned firm
Large firms SMEs Exporting firm Non-exporting firm
Angola 255 105 45 315 20 240
Benin 119 31 32 118 44 106
Botswana 176 92 45 223 31 237
Burkina Faso 339 55 60 334 48 346
Burundi 137 20 12 145 27 130
Cameroon 312 49 51 310 75 286
Cape Verde 129 27 25 131 10 146
Central African Republic 120 30 11 139 23 127
Chad 133 20 14 139 24 129
Congo 90 61 16 135 15 136
Côte d'Ivoire 262 99 53 308 63 298
DRC 425 104 25 504 50 479
Djibouti 238 28 18 248 57 209
Eswatini 116 34 18 132 38 112
Ethiopia 808 40 177 671 88 760
Gabon 97 82 19 160 21 158
Gambia 137 14 12 139 25 126
Ghana 628 92 61 659 141 579
Guinea 136 14 13 137 11 139
Guinea-Bissau 147 12 2 157 10 149
Kenya 921 80 186 815 304 697
Lesotho 125 25 28 122 36 114
Madagascar 436 96 83 449 112 420
Malawi 367 156 84 439 66 457
Mali 144 41 35 150 54 131
Mauritania 144 6 25 125 41 109
Mauritius 317 81 58 340 101 297
Mozambique 445 156 101 500 123 478
Namibia 431 149 28 552 66 514
Niger 118 33 15 136 30 131
Nigeria 2,173 503 189 2,487 627 2,049
Rwanda 2006 180 32 16 196 19 193
Rwanda 2011 204 37 37 204 26 215
Rwanda 2019 331 29 54 306 123 237
Senegal 542 59 47 554 76 525
Sierra Leone 137 15 18 134 14 138
South Africa 846 91 200 737 225 712
South Sudan 620 118 10 728 31 707
Tanzania 756 57 80 733 128 685
Togo 115 35 23 127 58 92
Uganda 672 90 66 696 160 602
Zambia 467 134 105 496 125 476
Zimbabwe 547 53 95 505 98 502
Note: We use the latest available data for all comparator countries in SSA in the WBES. Source: World Bank Enterprise Survey.

121
Table A.III.6: Coverage of other dimensions, WB Enterprise Survey
WBES Code WBES Questions
country Country
idstd Establishment Id
year Year of survey
a3ax Location of Establishment (city/town/village)
b5 Establishment year
stra_sector Sector
d1a2 ISIC Rev 3.1 4-digit code that best applies to the establishment’s main activity or product 2-digit were used to map to ‘priority sectors’
b2a What percentage of this firm is owned by private domestic individuals, companies or organizations?
b2b What percentage of this firm is owned by private foreign individuals, companies or organizations?
b2c What percentage of this firm is owned by government or state?
b4 Amongst the owners of the firm, are there any females? (Y/N)
b7a Is the Top Manager female? (Y/N)
c6 Over the last fiscal year, did this establishment experience power outages? (Y/N)
c7 In a typical month, over the last fiscal year, how many power outages did this establishment experience?
c8 How long did these power outages last on average?
c9a Please estimate the losses that resulted from power outages either as a percentage of total annual sales
c10 Over the last fiscal year, did this establishment own or share a generator? (Y/N)
c11 In the last fiscal year, what percentage of this establishment‘s electricity came from a generator or generators that the establishment owned or shared?
c15 Over the last fiscal year, did this establishment experience insufficient water supply for production?
c16 In a typical month, over the last fiscal year, how many incidents of insufficient water supply did this establishment experience?
c17 How long did these incidents of insufficient water supply last on average?
c30a To what degree is Electricity an obstacle to the current operations of this establishment?
c22a Do you currently communicate with clients and suppliers through e-mails? (Y/N)
c22b Does the establishment has its own website? (Y/N)
c30b To what degree is Telecommunications an obstacle to the current operations of this establishment?
d2 In the last fiscal year, what was this establishment’s total annual sales?
d3a In the last fiscal year, what percentage of this establishment’s sales were national sales?
d3b In the last fiscal year, what percentage of this establishment’s sales were indirect exports (sold domestically to third parties that export products)? Used to create group exporters vs. non-exporters
d3c In the last fiscal year, what percentage of this establishment’s sales were direct exports? Used to create group exporters vs. non-exporters
d12a In the last fiscal year, as a proportion of all material inputs or supplies purchased that year, what percentage of this establishment’s material inputs, or supplies were material inputs or supplies of domestic origin?
d12b In the last fiscal year, as a proportion of all material inputs or supplies purchased that year, what percentage of this establishment’s material inputs, or supplies were material inputs or supplies of foreign origin?
d14 In the last fiscal year, how many days did it take the establishment to clear the imported goods from customs?
d30a To what degree is Transport an obstacle to the current operations of this establishment?
d30b To what degree is Customs and Trade Regulation an obstacle to the current operations of this establishment?
e30 To what degree are Practices of Competitors in the Informal Sector an obstacle to the current operations of this establishment?
g2 Over the last two years, did this establishment submit an application to obtain a construction-related permit? (Y/N)
g3 In reference to that application for a construction-related permit, approximately how many days did it take to obtain it from the day of the application to the day the permit was granted?
g30a To what degree is Access to Land an obstacle to the current operations of this establishment?
h1 From the last 3 fiscal years, did this establishment introduce any new product or service? (Y/N)
h2 From the last 3 fiscal years, did this establishment introduce any new product or service? (Y/N) also new for the establishment’s main market
h5 From the last 3 fiscal years, did this establishment introduce any new or significantly improved process?
h8 In the last fiscal year, did this establishment spend on R&D (excl. market research? (Y/N)
h30 To what degree is Courts Theft and Disorder an obstacle to the current operations of this establishment?
i30 To what degree is Crime, Theft, and Disorder an obstacle to the current operations of this establishment?
j2 In a typical week over the last year, what percentage of total senior management's time was spent on dealing with requirements imposed by government regulations? (By senior management I mean managers, directors, and officers above direct supervisors of production or sales workers. Some examples of government regulations are taxes, customs, labor regulations, licensing and registration, including dealings with officials and completing forms)
j30a To what degree is/are Tax Rates an obstacle to the current operations of this establishment?
j30b To what degree is/are Tax Administrations an obstacle to the current operations of this establishment?
j30c To what degree is/are Business Licensing and Permits an obstacle to the current operations of this establishment?

122
j30d To what degree is/are Macroeconomic Stability an obstacle to the current operations of this establishment?
j30e To what degree is/are Political Instability an obstacle to the current operations of this establishment?
j30f To what degree is/are Corruption an obstacle to the current operations of this establishment?
K3a How much of establishment working capital comes from retained earnings or internal funds (%)?
K3bc How much of establishment working capital comes from banks (%)?
K3e How much of establishment working capital comes from non-bank financial institutions (%)?
K3f How much of establishment working capital comes from suppliers or customers (%)?
K3hd How much of establishment working capital comes from friends or relatives (%)?
K6 Does this establishment have a checking or savings account? (Y/N)
K7 At this time, does this establishment have an overdraft facility? (Y/N)
K8 At this time, does this establishment have a line of credit or a loan from a financial institution? (Y/N)
K15 Approx. Collateral needed as % of the loan value/ value of the line of credit
k16 In the last fiscal year, did the establishment apply for a new loan or line of credit?
k17 What was the main reason why this establishment did not apply for any line of credit or loan?
K18 How many applications for loans or lines of credit were submitted in the last fiscal year?
K18a Of these applications for loans or lines of credit submitted in the last fiscal year, how many of those applications were rejected?
K20 What was the most common reason given by the lender for those rejections for applications for a loan or line of credit? (7 possible answers)
k20a Referring only to the most recent application for a line of credit or loan, what was the outcome of that application?
k30 To what degree is Access to Finance an obstacle to the current operations of this establishment?
l1 At the end of the last fiscal year, how many permanent, full-time individuals worked in this establishment? Please include all employees and managers (Permanent, full-time employees are defined as all paid employees that are contracted for a term of one or more fiscal years and/or have a guaranteed renewal of their employment contract and that work a full shift)
l2 At the end of the last 3 fiscal year, how many permanent, full-time individuals worked in this establishment?
l4a At the end of the last fiscal year, how many permanent, full-time individuals working in this establishment were skilled/unskilled?
l4a1 At the end of the last fiscal year, how many permanent, full-time production workers were highly skilled?
l4a2 At the end of the last fiscal year, how many permanent, full-time production workers were semi-skilled?
l4b At the end of the last fiscal year, how many permanent, full-time production workers were unskilled?
l5 At the end of the last fiscal year, how many full-time individuals working in this establishment were female?
l5a At the end of the last fiscal year, how many full-time production workers working in this establishment were female?
l5b At the end of the last fiscal year, how many full-time non-production workers working in this establishment were female?
l9b What is the percentage of full-time permanent workers working in this established that completed secondary school education?
l10 In the last fiscal year, did the establishment have formal training programs for its full-time employers?
l30a To what degree are Labor Regulations an obstacle to the current operations of this establishment?
l30b To what degree is an Inadequately Educated Workforce an obstacle to the current operations of this establishment?
n2a Total annual cost of labor including wages, salaries, bonuses, social security payments
n2b Total annual costs of electricity
n2c Total annual costs of communication
n2e Total annual cost of raw materials and intermediate goods used in production
n2f Total annual costs of fuel.
n2j Other costs of production not included above
n2ra Total rental cost of machinery, vehicles, and equipment
n2rb Total rental cost of land and buildings
n2rb Total rental cost of land and buildings
Note: Not all questions are available in all surveys for all countries. WEBS has a different focus on different years. These sample questions are taken from the Rwandan World Bank Enterprise Survey 2006, 2011, 2019. Source: World Bank Enterprise Survey.

123
b) Caveat of the analysis
We use establishment data to provide a host of important information that is masked in aggregate
data and analysis. This notwithstanding, there are some caveats in this analysis that is worth
highlighting. These caveats do not in any way invalidate the analysis carried out in this report. The
caveat has to do with the database we used for the analysis. In the World Bank Enterprise Survey,
participating firms are asked several questions in an interview on these factors (i.e. bottlenecks) and
we have to trust the responses of firms to these questions. Sometimes, the response of firms is based
on opinions. Also, not every firm participating in the survey responds to every question and there is
thus often a lower number of observations in terms of response rate. This usually happens when a
participating firm either did not know the answer to the question being asked, the question did not
apply to the firm or the firm simply did not want to answer. We must therefore keep in mind the
subjective nature of some of the responses given by firms and the low number of observations in terms
of the response rate to avoid over-interpreting some of the results of the analysis. The data used for
the analysis, however, has been rigorously cleaned and is free from obvious mistakes and unrealistic
outliers.
The second caveat relates to the industries covered in the database used for the analysis. The World
Bank Enterprise Surveys do not cover certain sectors, notably the mining sector. We therefore only
use manufacturing sectors and non-manufacturing sectors (excluding mining) in our analysis. Non-
manufacturing sectors mainly refer to construction, transportation, wholesale and retail trade, real
estate, restaurants and hotels. The high coverage of the services sector in the analysis (making up
nearly the entirety of non-manufacturing industries) is very important as it highlights some of the
obstacles that firms in the Rwandan service sector face given the important contribution of this sector
to the country’s economy as highlighted in Section 1 of this report.
Third, the analysis is purely descriptive. It does not attempt to claim causality in any part of the analysis,
neither does it replace any more thorough econometric work performed on these bottlenecks,
although any such exercise will also suffer from a low number of observations (per subgroup).
Finally, the industrial policy documents and the accompanying strategic intervention areas of Rwanda
covers a wide range of topical issues, many of which are not covered in the World Bank Enterprise
Survey that we use, despite their importance. If these intervention areas are not exhaustively covered
in this report, it is attributable to data limitation and not because we value the importance of those
topical issues not covered in the analysis less. Also, the most recent Rwanda World Bank Enterprise
Survey was released in May 2020. This means that at the time of writing this report, not all of the
results based on the surveys may necessarily reflect the most recent circumstances. Wherever
possible, they have to be put into perspective using more recent, qualitative information. We have
tried to reduce the extent to which this could affect our results by interviewing stakeholders in Rwanda
in August and September 2020. Their views are included in the text.

124
c) Bottlenecks: other topics
Table A.III.7 shows the share (%) of firms that experienced water shortages, the average number of
occurrences in a typical month, and average length (in hours).
Table A.III.7: Coverage of other dimensions: Water, WB Enterprise Survey
Mnf 2006 2011 2019
No
n-
man
ufa
ctu
rin
g
Man
ufa
ctu
rin
g-
SSA
Kig
ali
Sou
ther
n
pro
vin
ce
We
ste
rn
pro
vin
ce
Do
mes
tica
lly-
ow
ne
d f
irm
s
Fore
ign
o
wn
ed
fir
ms
Larg
e
firm
s
SMEs
Exp
ort
ing
firm
s
No
n-e
xpo
rtin
g
firm
s
% experienced water shortages
42.4
. 18.7 20.0 10.2 22.2 19.3 4.6 11.5 19.2 27.9 11.7 17.1
17.5
Number of water shortages
15.8
. 11.4 2.1 78.5 7.8 18.8 4.0 2.3 21.5 5.3 36.7 8.2
18.8
Length of water shortages
6.9
. 17.5 15.9 14.3 2.9 10.6 2.0 17.0 9.5 11.7 9.2 101.777
10.6
Note: ’.’ means data is not available for the indicator for the reference year. It also means data is not available for the industry and location for the particular indicator. Rwanda 2019 data for all columns, except Mnf and Mnf-SSA. Mnf: Manufacturing. Source: World Bank Enterprise Survey.
Table A.III.8 shows the share (%) of firms that applied for a construction permit and the average length
in days it took for completion.
Table A.III.8: Coverage of other dimensions: Construction Permit, WB Enterprise Survey
Mnf 2006 2011 2019
No
n-
man
ufa
ctu
rin
g
Man
ufa
ctu
rin
g-
SSA
Kig
ali
Sou
ther
n
pro
vin
ce
We
ste
rn
pro
vin
ce
Do
mes
tica
lly-
ow
ne
d f
irm
s
Fore
ign
o
wn
ed
fir
ms
Larg
e
firm
s
SMEs
Exp
ort
ing
firm
s
No
n-e
xpo
rtin
g
firm
s Share % application
8.5
12.5 10.7 6.6 15.3 8.3 10.1 9.1 7.8 10.6 11.6 9.1 18.5
10.0
Length application
30.0
14.9 46.1 39.0 21.2 21.6 26.3 13.5 13.5 29.0 22.0 28.5 42.8
26.2
Note: Rwanda 2019 data for all columns, except Mnf and Mnf-SSA. Mnf: Manufacturing. Source: World Bank Enterprise Survey.
77 Data is for 2011. Breakdown numbers for domestic firms (119.8); foreign firms (11); large firms (15); SMEs (119); exporters (11); non-exporters (147); Kigali (101). Southern and Western provinces were only included in the 2019/2020 WBES.
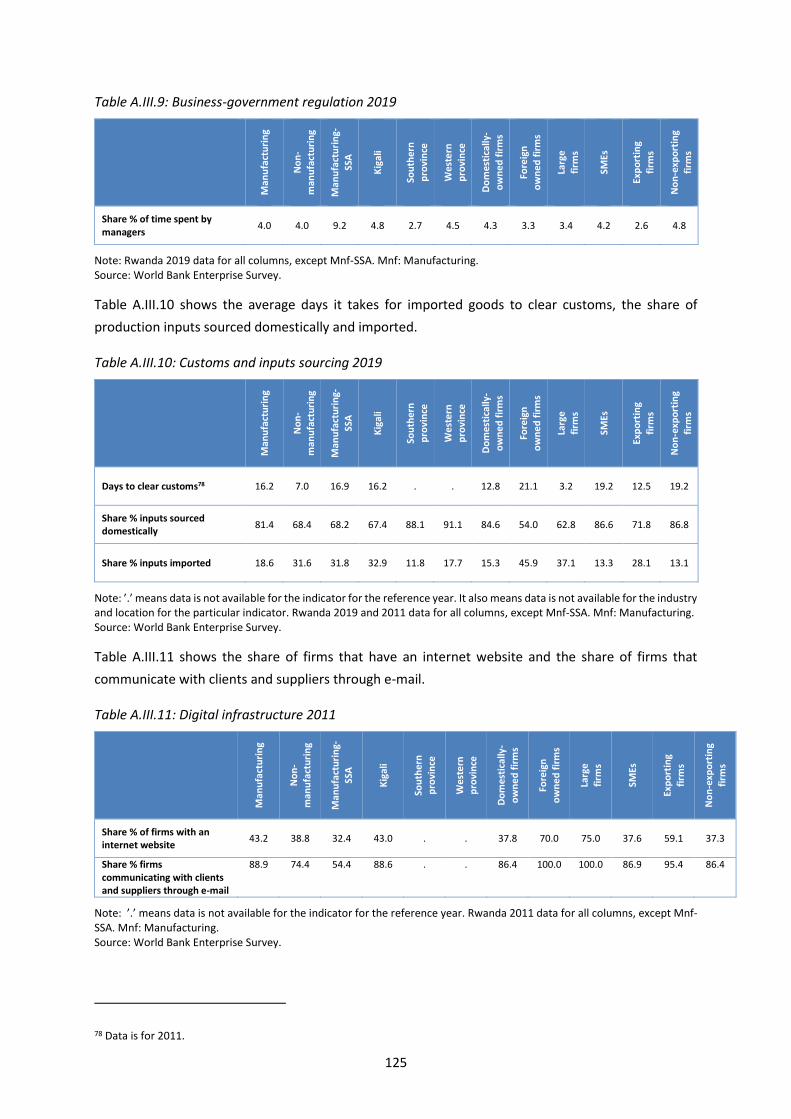
125
Table A.III.9: Business-government regulation 2019
Man
ufa
ctu
rin
g
No
n-
man
ufa
ctu
rin
g
Man
ufa
ctu
rin
g-
SSA
Kig
ali
Sou
ther
n
pro
vin
ce
We
ste
rn
pro
vin
ce
Do
mes
tica
lly-
ow
ne
d f
irm
s
Fore
ign
o
wn
ed
fir
ms
Larg
e
firm
s
SMEs
Exp
ort
ing
firm
s
No
n-e
xpo
rtin
g
firm
s
Share % of time spent by managers
4.0 4.0 9.2 4.8 2.7 4.5 4.3 3.3 3.4 4.2 2.6 4.8
Note: Rwanda 2019 data for all columns, except Mnf-SSA. Mnf: Manufacturing. Source: World Bank Enterprise Survey.
Table A.III.10 shows the average days it takes for imported goods to clear customs, the share of
production inputs sourced domestically and imported.
Table A.III.10: Customs and inputs sourcing 2019
Man
ufa
ctu
rin
g
No
n-
man
ufa
ctu
rin
g
Man
ufa
ctu
rin
g-
SSA
Kig
ali
Sou
ther
n
pro
vin
ce
We
ste
rn
pro
vin
ce
Do
mes
tica
lly-
ow
ne
d f
irm
s
Fore
ign
o
wn
ed
fir
ms
Larg
e
firm
s
SMEs
Exp
ort
ing
firm
s
No
n-e
xpo
rtin
g
firm
s
Days to clear customs78 16.2 7.0 16.9 16.2 . . 12.8 21.1 3.2 19.2 12.5 19.2
Share % inputs sourced domestically
81.4 68.4 68.2 67.4 88.1 91.1 84.6 54.0 62.8 86.6 71.8 86.8
Share % inputs imported 18.6 31.6 31.8 32.9 11.8 17.7 15.3 45.9 37.1 13.3 28.1 13.1
Note: ’.’ means data is not available for the indicator for the reference year. It also means data is not available for the industry and location for the particular indicator. Rwanda 2019 and 2011 data for all columns, except Mnf-SSA. Mnf: Manufacturing. Source: World Bank Enterprise Survey.
Table A.III.11 shows the share of firms that have an internet website and the share of firms that
communicate with clients and suppliers through e-mail.
Table A.III.11: Digital infrastructure 2011
Man
ufa
ctu
rin
g
No
n-
man
ufa
ctu
rin
g
Man
ufa
ctu
rin
g-
SSA
Kig
ali
Sou
ther
n
pro
vin
ce
We
ste
rn
pro
vin
ce
Do
mes
tica
lly-
ow
ne
d f
irm
s
Fore
ign
o
wn
ed
fir
ms
Larg
e
firm
s
SMEs
Exp
ort
ing
fi
rms
No
n-e
xpo
rtin
g
firm
s
Share % of firms with an internet website
43.2 38.8 32.4 43.0 . . 37.8 70.0 75.0 37.6 59.1 37.3
Share % firms communicating with clients and suppliers through e-mail
88.9 74.4 54.4 88.6 . . 86.4 100.0 100.0 86.9 95.4 86.4
Note: ’.’ means data is not available for the indicator for the reference year. Rwanda 2011 data for all columns, except Mnf-SSA. Mnf: Manufacturing. Source: World Bank Enterprise Survey.
78 Data is for 2011.

126
Table A.III.12 shows the average wage bill (cost of labour) as a share (%) of total costs.
Table A.III.12: Share of labour costs 2006 vs. 2019
Man
ufa
ctu
rin
g
No
n-
man
ufa
ctu
rin
g
Man
ufa
ctu
rin
g
- SS
A
Kig
ali
Sou
ther
n
pro
vin
ce
We
ste
rn
pro
vin
ce
Do
mes
tica
lly-
ow
ne
d f
irm
s
Fore
ign
o
wn
ed
fir
ms
Larg
e
firm
s
SMEs
Exp
ort
ing
firm
s
No
n-e
xpo
rtin
g
firm
s
Wage Bill (data 2006) 24.4 46.0 NA 24.3 . . 25.1 20.6 16.4 26.9 16.6 26.7
Wage bill (data 2019) 42.0 70.2 38.5 42.3 41.7 41.9 43.4 29.6 33.2 44.4 37.0 44.7
Note: ’.’ means data is not available for the indicator for the reference year. Rwanda 2006 and 2019 data for all columns, except Mnf-SSA. Mnf: Manufacturing. Source: World Bank Enterprise Survey.
Table A.III.13 lists the average share of female production and non-production workers, the average
share of female business owners, and the average share of female top managers.
Table A.III.13: Role of women in manufacturing 2019
Man
ufa
ctu
rin
g
No
n-
man
ufa
ctu
rin
g
Man
ufa
ctu
rin
g-
SSA
Kig
ali
Sou
ther
n
pro
vin
ce
We
ste
rn
pro
vin
ce
Do
mes
tica
lly-
ow
ne
d f
irm
s
Fore
ign
o
wn
ed
fir
ms
Larg
e
firm
s
SMEs
Exp
ort
ing
firm
s
No
n-e
xpo
rtin
g
firm
s
Share % of female production workers
21.9 . 16.8 50.0 7.6 4.1 18.0 74.2 89.0 4.0 40.8 11.5
Share % of female non-production workers
7.2 . 6.1 15.2 2.3 3.1 5.2 22.8 25.3 2.4 12.3 4.4
Share % of female owners 25.2 27.3 26.5 28.8 13.1 33.3 24.7 33.3 26.9 24.7 30.9 20.1
Share % of female top managers
14.2 22.1 12.1 8.8 15.3 19.4 13.7 13.6 23.1 11.7 18.6 11.6
Note: ’.’ means data is not available for the indicator for the reference year. It also means data is not available for the industry and location for the particular indicator. Rwanda 2019 data for all columns, except Mnf-SSA. Mnf: Manufacturing. Source: World Bank Enterprise Survey.
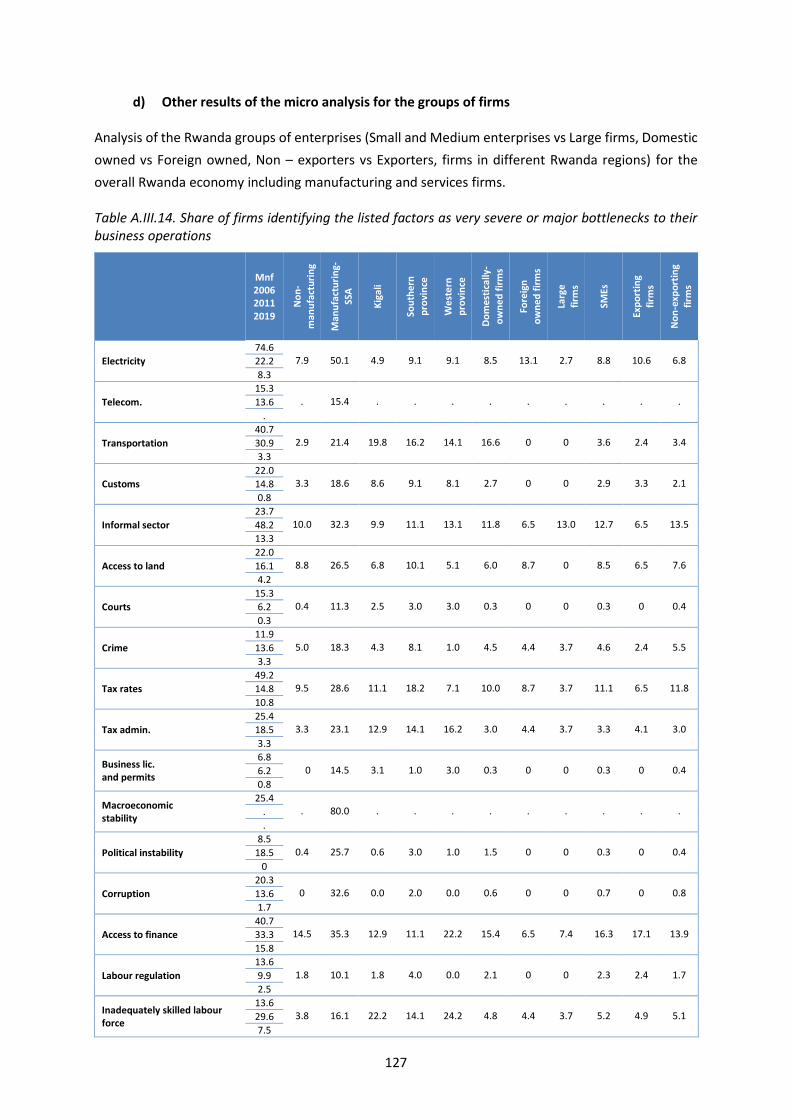
127
d) Other results of the micro analysis for the groups of firms
Analysis of the Rwanda groups of enterprises (Small and Medium enterprises vs Large firms, Domestic
owned vs Foreign owned, Non – exporters vs Exporters, firms in different Rwanda regions) for the
overall Rwanda economy including manufacturing and services firms.
Table A.III.14. Share of firms identifying the listed factors as very severe or major bottlenecks to their business operations
Mnf 2006 2011 2019
No
n-
man
ufa
ctu
rin
g
Man
ufa
ctu
rin
g-
SSA
Kig
ali
Sou
ther
n
pro
vin
ce
We
ste
rn
pro
vin
ce
Do
mes
tica
lly-
ow
ne
d f
irm
s
Fore
ign
o
wn
ed
fir
ms
Larg
e
firm
s
SMEs
Exp
ort
ing
firm
s
No
n-e
xpo
rtin
g
firm
s
Electricity
74.6 7.9
50.1
4.9
9.1
9.1
8.5
13.1
2.7
8.8
10.6
6.8 22.2
8.3
Telecom.
15.3 .
15.4
.
.
.
.
.
.
.
.
. 13.6
.
Transportation
40.7 2.9
21.4
19.8
16.2
14.1
16.6
0
0
3.6
2.4
3.4 30.9
3.3
Customs
22.0 3.3
18.6
8.6
9.1
8.1
2.7
0
0
2.9
3.3
2.1 14.8
0.8
Informal sector
23.7 10.0
32.3
9.9
11.1
13.1
11.8
6.5
13.0
12.7
6.5
13.5 48.2
13.3
Access to land
22.0 8.8
26.5
6.8
10.1
5.1
6.0
8.7
0
8.5
6.5
7.6 16.1
4.2
Courts
15.3 0.4
11.3
2.5
3.0
3.0
0.3
0
0
0.3
0
0.4 6.2
0.3
Crime
11.9 5.0
18.3
4.3
8.1
1.0
4.5
4.4
3.7
4.6
2.4
5.5 13.6
3.3
Tax rates
49.2 9.5
28.6
11.1
18.2
7.1
10.0
8.7
3.7
11.1
6.5
11.8 14.8
10.8
Tax admin.
25.4 3.3
23.1
12.9
14.1
16.2
3.0
4.4
3.7
3.3
4.1
3.0 18.5
3.3
Business lic. and permits
6.8 0
14.5
3.1
1.0
3.0
0.3
0
0
0.3
0
0.4 6.2
0.8
Macroeconomic stability
25.4 .
80.0
.
.
.
.
.
.
.
.
. .
.
Political instability
8.5 0.4
25.7
0.6
3.0
1.0
1.5
0
0
0.3
0
0.4 18.5
0
Corruption
20.3 0
32.6
0.0
2.0
0.0
0.6
0
0
0.7
0
0.8 13.6
1.7
Access to finance
40.7 14.5
35.3
12.9
11.1
22.2
15.4
6.5
7.4
16.3
17.1
13.9 33.3
15.8
Labour regulation
13.6 1.8
10.1
1.8
4.0
0.0
2.1
0
0
2.3
2.4
1.7 9.9
2.5
Inadequately skilled labour force
13.6 3.8
16.1
22.2
14.1
24.2
4.8
4.4
3.7
5.2
4.9
5.1 29.6
7.5

128
Note: ‘.’ means data is not available for the indicator for the reference year. It also means that data is not available for the industry and location for the particular indicator. A value of 0 means that no establishment or industry identify the indicator as a very severe or major bottleneck to their operations. Rwanda 2019 data for all columns, except Mnf and Mnf-SSA. Source: World Bank Enterprise Survey.
Table A.III.15. Source of working capital 2019
Man
ufa
ctu
rin
g
No
n-
man
ufa
ctu
rin
g
Man
ufa
ctu
rin
g-
SSA
Kig
ali
Sou
ther
n
pro
vin
ce
We
ste
rn
pro
vin
ce
Do
mes
tica
lly-
ow
ne
d f
irm
s
Fore
ign
o
wn
ed
fir
ms
Larg
e
firm
s
SMEs
Exp
ort
ing
firm
s
No
n-e
xpo
rtin
g
firm
s
% from retained earnings
76.3
78.5
69.5 79.2
77.8
75.7
77.2
89.1
77.8
77.7
77.6
77.8
% from banks
13.3
14.7 9.3
16.1
11.1
14.2
14.6
7.6
20.3
13.2
16.8
12.9
% from non-bank financial institutions
3.6
1.8
1.9
0.3
4.3
3.9
2.6
0.2
0.2
2.8
0.3
3.5
% from suppliers/customers
4.9
2.9
8.2
3.0
4.3
3.7
3.6
1.4
1.1
4.0
2.6
4.1
% from friends and relatives
1.6
1.9
5.5
1.2
2.1
2.5
1.8
1.5
0.5
2.1
2.4
1.5
Note: Sources of raising working capital (%) 2019. Mnf: Manufacturing. Rwanda 2019 data for all columns except Mnf-SSA. Source: World Bank Enterprise Survey.
Table A.III.16: Financing 2019
Man
ufa
ctu
rin
g
No
n-
man
ufa
ctu
rin
g
Man
ufa
ctu
rin
g-
SSA
Kig
ali
Sou
ther
n
pro
vin
ce
We
ste
rn
pro
vin
ce
Do
mes
tica
lly-
ow
ne
d f
irm
s
Fore
ign
o
wn
ed
fir
ms
Larg
e
firm
s
SMEs
Exp
ort
ing
fi
rms
No
n-e
xpo
rtin
g
firm
s % firms with checking or savings account
92.5
94.1
84.0
96.9
82.8
98.9
93.5
100.0
100.0
92.4
99.1
90.7
% firms with overdraft facility
30.0
28.3
31.7
41.3
11.1
26.2
28.4
41.2
61.1
23.2
43.1
21.5
% firms with line of credit or loan
32.5
34.1
21.1
36.4
22.2
40.4
34.1
30.4
51.8
30.3
48.7
25.7
Note: Mnf: Manufacturing. Rwanda 2019 data for all columns except Mnf-SSA. Source: World Bank Enterprise Survey 2019.
Table A.III.17: Outcome of loan application 2006
Man
ufa
ctu
rin
g
No
n-m
anu
fact
uri
ng
Man
ufa
ctu
rin
g-
SSA
Kig
ali
Sou
ther
n p
rovi
nce
We
ste
rn p
rovi
nce
Do
mes
tica
lly-
ow
ne
d f
irm
s
Fore
ign
ow
ne
d f
irm
s
Larg
e
firm
s
SMEs
Exp
ort
ing
fi
rms
No
n-e
xpo
rtin
g
firm
s
No. of applications 1.3 1.8 1.5 . . .
1.5
1.9
2.0
1.6
2.0
1.6
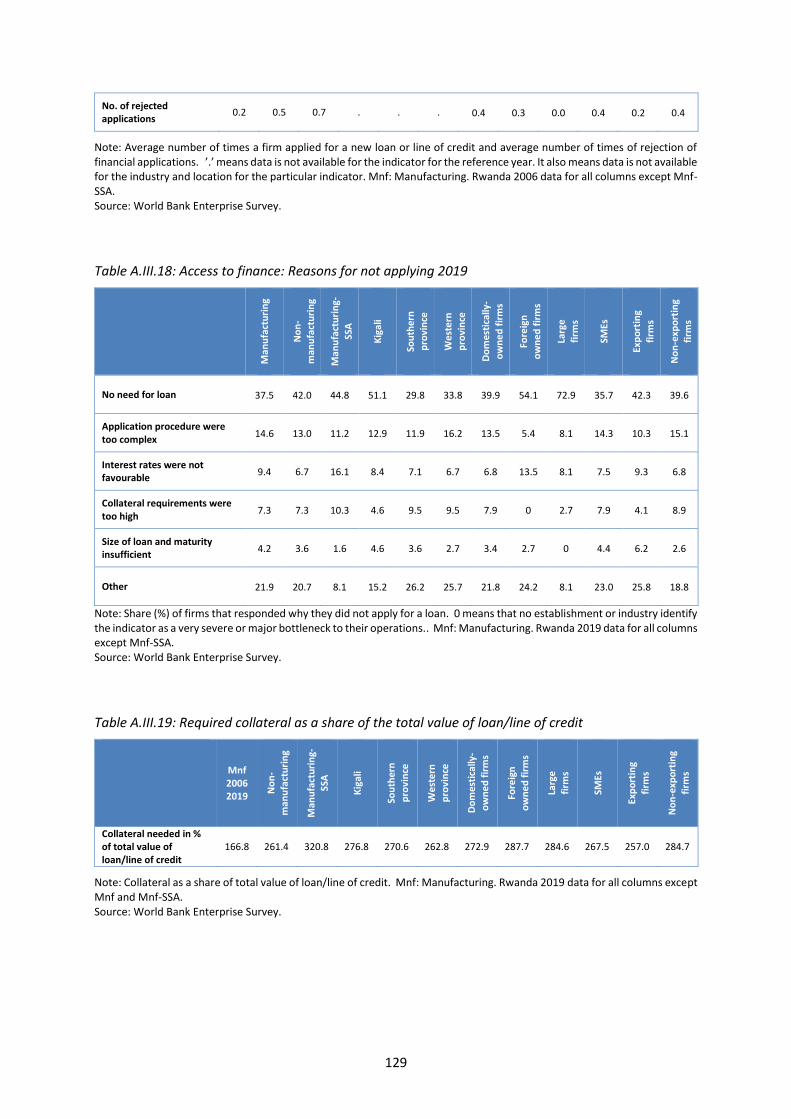
129
No. of rejected applications
0.2 0.5 0.7 . . .
0.4
0.3
0.0
0.4
0.2
0.4
Note: Average number of times a firm applied for a new loan or line of credit and average number of times of rejection of financial applications. ’.’ means data is not available for the indicator for the reference year. It also means data is not available for the industry and location for the particular indicator. Mnf: Manufacturing. Rwanda 2006 data for all columns except Mnf-SSA. Source: World Bank Enterprise Survey.
Table A.III.18: Access to finance: Reasons for not applying 2019
Man
ufa
ctu
rin
g
No
n-
man
ufa
ctu
rin
g
Man
ufa
ctu
rin
g-
SSA
Kig
ali
Sou
ther
n
pro
vin
ce
We
ste
rn
pro
vin
ce
Do
mes
tica
lly-
ow
ne
d f
irm
s
Fore
ign
o
wn
ed
fir
ms
Larg
e
firm
s
SMEs
Exp
ort
ing
firm
s
No
n-e
xpo
rtin
g
firm
s
No need for loan
37.5
42.0
44.8
51.1
29.8
33.8
39.9
54.1
72.9
35.7
42.3
39.6
Application procedure were too complex
14.6
13.0
11.2
12.9
11.9
16.2
13.5
5.4
8.1
14.3
10.3
15.1
Interest rates were not favourable
9.4
6.7
16.1
8.4
7.1
6.7
6.8
13.5
8.1
7.5
9.3
6.8
Collateral requirements were too high
7.3
7.3
10.3
4.6
9.5
9.5
7.9
0
2.7
7.9
4.1
8.9
Size of loan and maturity insufficient
4.2
3.6
1.6
4.6
3.6
2.7
3.4
2.7
0
4.4
6.2
2.6
Other
21.9
20.7
8.1
15.2
26.2
25.7
21.8
24.2
8.1
23.0
25.8
18.8
Note: Share (%) of firms that responded why they did not apply for a loan. 0 means that no establishment or industry identify the indicator as a very severe or major bottleneck to their operations.. Mnf: Manufacturing. Rwanda 2019 data for all columns except Mnf-SSA. Source: World Bank Enterprise Survey.
Table A.III.19: Required collateral as a share of the total value of loan/line of credit
Mnf 2006 2019 N
on
-m
anu
fact
uri
ng
Man
ufa
ctu
rin
g-
SSA
Kig
ali
Sou
ther
n
pro
vin
ce
We
ste
rn
pro
vin
ce
Do
mes
tica
lly-
ow
ne
d f
irm
s
Fore
ign
o
wn
ed
fir
ms
Larg
e
firm
s
SMEs
Exp
ort
ing
firm
s
No
n-e
xpo
rtin
g
firm
s
Collateral needed in % of total value of loan/line of credit
166.8
261.4
320.8
276.8
270.6
262.8
272.9
287.7
284.6
267.5
257.0
284.7
Note: Collateral as a share of total value of loan/line of credit. Mnf: Manufacturing. Rwanda 2019 data for all columns except Mnf and Mnf-SSA. Source: World Bank Enterprise Survey.

130
Table A.III.20: Electricity
Mnf 2006 2011 2019
No
n-
man
ufa
ctu
rin
g
Man
ufa
ctu
rin
g-
SSA
Kig
ali
Sou
ther
n
pro
vin
ce
We
ste
rn
pro
vin
ce
Do
mes
tica
lly-
ow
ne
d f
irm
s
Fore
ign
o
wn
ed
fir
ms
Larg
e
firm
s
SMEs
Exp
ort
ing
firm
s
No
n-e
xpo
rtin
g
firm
s
Experience power outages (%)
81.4
40.0
76.3
58.0
27.0
55.0
40.8
23.9
31.5
40.2
52.0
32.1 66.7
36.7
Number of power outages
15.1
11.1
17.6
4.2
29.1
7.2
9.3
15.8
3.7
10.9
10.1
10.0 5.4
7.7
Length of power outages
4.1
1.2
8.7
0.7
2.2
1.0
1.1
0.5
0.5
1.2
0.9
1.2 6.0
0.8
Losses (%) of sales
9.2
3.1
13.3
1.9
0.2
4.4
2.9
0.3
0.8
3.1
2.5
3.0 4.9
2.0
% that own or share generator
56.9
37.9
52.5
74.0
17.0
41.0
36.3
56.5
55.6
33.3
63.4
22.8 60.5
34.2
% of electricity from own or shared generator
30.3
7.6
35.1
7.9
10.7
7.6
8.1
10.2
8.5
8.1
7.9
8.3 7.6
9.6
Cost % of electricity79 8.5 6.7 14.3 4.5 6.9 8.2 6.3 5.7 5.0 6.4 6.7 5.9
Note: Mnf: Manufacturing. Rwanda 2019 data for all columns, except Mnf and Mnf-SSA. Source: World Bank Enterprise Survey.
Table A.III.21: Average skilled and unskilled production workers, training, schooling, 2019
Man
ufa
ctu
rin
g
No
n-
man
ufa
ctu
rin
g
Man
ufa
ctu
rin
g-
SSA
Kig
ali
Sou
ther
n
pro
vin
ce
We
ste
rn
pro
vin
ce
Do
mes
tica
lly-
ow
ne
d f
irm
s
Fore
ign
o
wn
ed
fir
ms
Larg
e
firm
s
SMEs
Exp
ort
ing
firm
s
No
n-e
xpo
rtin
g
firm
s
% highly skilled production workers
19.6
.
26.6
40.5
6.3
9.8
15.4
60.7
65.6
6.9
30.7
13.5
% semi-skilled production workers
13.1
.
22.5
27.2
3.9
6.6
12.6
42.8
45.7
4.1
23.8
7.1
% completed sec. school
55.6
76.5 57.7
81.4
54.3
59.0
67.7
85.2
76.5
66.6
80.8
64.2
% firm offering formal training programmes to workers
45.0
33.6
29.3
45.6
29.2
32.9
34.3
76.0
72.2
31.2
57.3
27.1
Note: ’.’ means data is not available for the indicator for the reference year. It also means data is not available for the industry and location for the particular indicator. Mnf: Manufacturing. Rwanda 2019 data for all columns except Mnf-SSA. Source: World Bank Enterprise Survey.
79 Share of electricity cost to total cost (%).

131
Table A.III.22: Coverage of other dimensions, WB Enterprise Survey
Mnf 2006 2011 2019
No
n-
man
ufa
ctu
rin
g
Man
ufa
ctu
rin
g-
SSA
Kig
ali
Sou
ther
n
pro
vin
ce
We
ste
rn
pro
vin
ce
Do
mes
tica
lly-
ow
ne
d f
irm
s
Fore
ign
o
wn
ed
fir
ms
Larg
e
firm
s
SMEs
Exp
ort
ing
firm
s
No
n-e
xpo
rtin
g
firm
s
% experienced water shortages
42.4
.
18.7
9.0
4.0
8.0
19.3
4.6
11.5
19.2
27.9
11.7 17.1
17.5
Number of water shortages
15.8
.
11.4
2.1
78.5
7.8
18.8
4.0
2.3
21.5
5.3
36.7 8.2
18.8
Length of water shortages
6.9
.
17.5
15.9
14.3
2.9
10.6
2.0
17.0
9.5
11.7
9.2 101.780
10.6
Note: ’.’ means data is not available for the indicator for the reference year. It also means data is not available for the industry Note: ’.’ means data is not available for the indicator for the reference year. It also means data is not available for the industry and location for the particular indicator. Rwanda 2019 data for all columns, except Mnf and Mnf-SSA. Mnf: Manufacturing. Source: World Bank Enterprise Survey.
Table A.III.23: Coverage of other dimensions. Construction permits. WB Enterprise Survey
Mnf 2006 2011 2019
No
n-
man
ufa
ctu
rin
g
Man
ufa
ctu
rin
g-
SSA
Kig
ali
Sou
ther
n
pro
vin
ce
We
ste
rn
pro
vin
ce
Do
mes
tica
lly-
ow
ne
d f
irm
s
Fore
ign
o
wn
ed
fir
ms
Larg
e
firm
s
SMEs
Exp
ort
ing
firm
s
No
n-e
xpo
rtin
g
firm
s
Share % application
8.5 12.5
10.7
14.0
17.0
11.0
12.1
8.7
9.3
12.1
13.8
10.6 18.5
10.0
Length application
30.0 14.9
46.1
20.5
17.8
16.9
18.7
11.3
22.0
18.0
13.7
21.3 42.8
26.2
Note: Rwanda 2019 data for all columns, except Mnf and Mnf-SSA. Mnf: Manufacturing. Source: World Bank Enterprise Survey.
Table A.III.24: Business-government regulation 2019
Man
ufa
ctu
rin
g
No
n-
man
ufa
ctu
rin
g
Man
ufa
ctu
rin
g-
SSA
Kig
ali
Sou
ther
n
pro
vin
ce
We
ste
rn
pro
vin
ce
Do
mes
tica
lly-
ow
ne
d f
irm
s
Fore
ign
o
wn
ed
fir
ms
Larg
e
firm
s
SMEs
Exp
ort
ing
firm
s
No
n-e
xpo
rtin
g
firm
s
Share % of time spent by managers
4.0
4.0
9.2
4.4
2.5
4.9
4.3
2.8
4.5
3.9
2.5
4.8
Note: Rwanda 2019 data for all columns, except Mnf-SSA. Mnf: Manufacturing. Source: World Bank Enterprise Survey.
80 Data is for 2011. Breakdown numbers for domestic firms (119.8); foreign firms (11); large firms (15); SMEs (119); exporters (11); non-exporters (147); Kigali (101). Southern and Western provinces were only included in the 2019/2020 WBES.

132
Table A.III.25: Customs and inputs sourcing 2019
Man
ufa
ctu
rin
g
No
n-
man
ufa
ctu
rin
g
Man
ufa
ctu
rin
g-
SSA
Kig
ali
Sou
ther
n
pro
vin
ce
We
ste
rn
pro
vin
ce
Do
mes
tica
lly-
ow
ne
d f
irm
s
Fore
ign
o
wn
ed
fir
ms
Larg
e
firm
s
SMEs
Exp
ort
ing
firm
s
No
n-e
xpo
rtin
g
firm
s
Days to clear customs81
16.2
7.0
16.9
16.0 .
.
12.6
21.1
3.2
18.8
12.2
18.6
Share % inputs sourced domestically
81.4
68.4
68.2
58.6
82.5
85.9
75.0
49.1
59.6
75.1
66.7
76.1
Share % inputs imported
18.6
31.6
31.8
41.4
17.5
14.1
25.0
50.9
40.9
24.9
33.3
23.9
Note: ’.’ means data is not available for the indicator for the reference year. It also means data is not available for the industry and location for the particular indicator. Rwanda 2019 and 2011 data for all columns, except Mnf-SSA. Mnf: Manufacturing. Source: World Bank Enterprise Survey.
Table A.III.26: Digital infrastructure 2011
Man
ufa
ctu
rin
g
No
n-
man
ufa
ctu
rin
g
Man
ufa
ctu
rin
g-
SSA
Kig
ali
Sou
ther
n
pro
vin
ce
We
ste
rn
pro
vin
ce
Do
mes
tica
lly-
ow
ne
d f
irm
s
Fore
ign
o
wn
ed
fir
ms
Larg
e
firm
s
SMEs
Exp
ort
ing
fi
rms
No
n-e
xpo
rtin
g
firm
s
Share % of firms with an internet website
43.2
38.8
32.4
64.2
26.3
38.4
34.8
69.2
75.7
33.8
61.5
37.8
Share % firms communicating with clients and suppliers through e-mail
88.9
74.4
54.4
81.4
.
.
76.9
94.2
97.3
75.9
96.2
77.2
Note: ’.’ means data is not available for the indicator for the reference year. Rwanda 2011 data for all columns, except Mnf-SSA. Mnf: Manufacturing. Source: World Bank Enterprise Survey
Table A.III.27: Share of labour costs 2019
Man
ufa
ctu
rin
g
No
n-
man
ufa
ctu
rin
g
Man
ufa
ctu
rin
g
- SS
A
Kig
ali
Sou
ther
n
pro
vin
ce
We
ste
rn
pro
vin
ce
Do
mes
tica
lly-
ow
ne
d f
irm
s
Fore
ign
o
wn
ed
fir
ms
Larg
e
firm
s
SMEs
Exp
ort
ing
firm
s
No
n-e
xpo
rtin
g
firm
s
Wage Bill (data 2006)
24.4
46.0 .
39.4
.
.
40.7
37.2
22.2
41.5
22.7
41.7
Wage bill (data 2019)
42.0
70.2
38.5
65.9
51.6
61.5
61.4
53.0
65.3
60.0
64.2
59.1
Note: ’.’ means data is not available for the indicator for the reference year. Rwanda 2006 and 2019 data for all columns, except Mnf-SSA. Mnf: Manufacturing. Source: World Bank Enterprise Survey.
81 Data is for 2011.
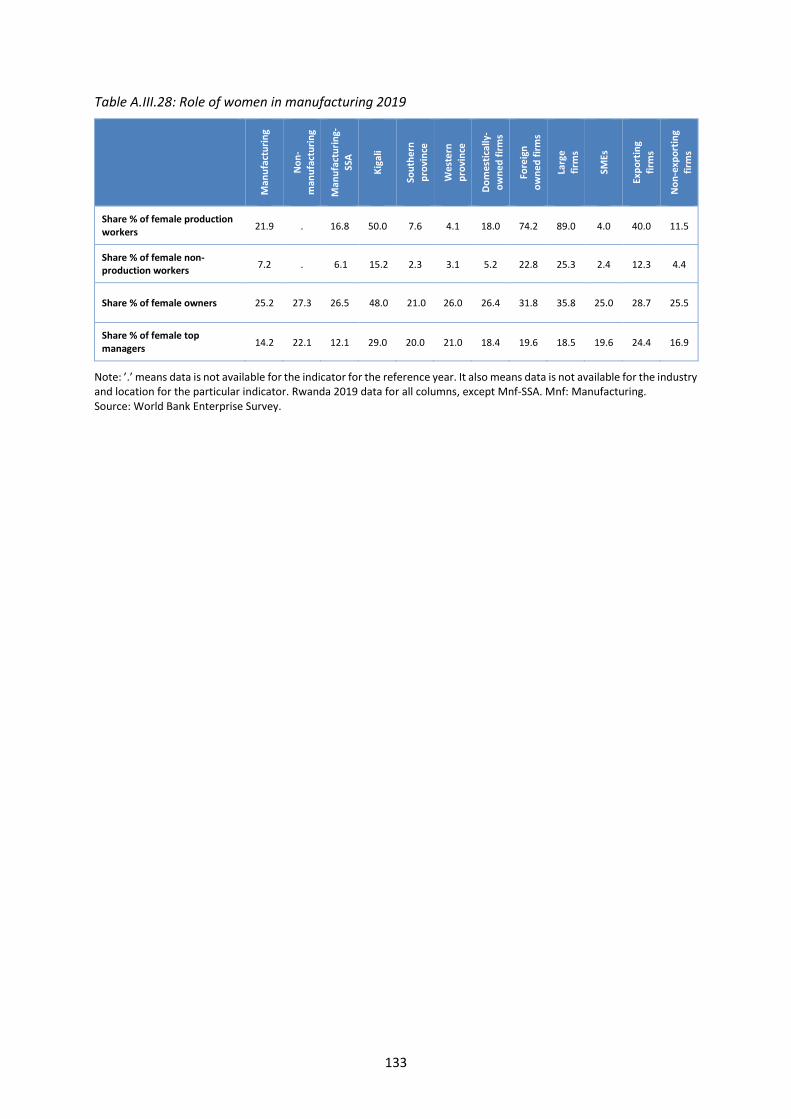
133
Table A.III.28: Role of women in manufacturing 2019
Man
ufa
ctu
rin
g
No
n-
man
ufa
ctu
rin
g
Man
ufa
ctu
rin
g-
SSA
Kig
ali
Sou
ther
n
pro
vin
ce
We
ste
rn
pro
vin
ce
Do
mes
tica
lly-
ow
ne
d f
irm
s
Fore
ign
o
wn
ed
fir
ms
Larg
e
firm
s
SMEs
Exp
ort
ing
firm
s
No
n-e
xpo
rtin
g
firm
s
Share % of female production workers
21.9
.
16.8
50.0
7.6
4.1
18.0
74.2
89.0
4.0
40.0
11.5
Share % of female non-production workers
7.2
.
6.1
15.2
2.3
3.1
5.2
22.8
25.3
2.4
12.3
4.4
Share % of female owners
25.2
27.3
26.5
48.0
21.0
26.0
26.4
31.8
35.8
25.0
28.7
25.5
Share % of female top managers
14.2
22.1
12.1
29.0
20.0
21.0
18.4
19.6
18.5
19.6
24.4
16.9
Note: ’.’ means data is not available for the indicator for the reference year. It also means data is not available for the industry and location for the particular indicator. Rwanda 2019 data for all columns, except Mnf-SSA. Mnf: Manufacturing. Source: World Bank Enterprise Survey.
134
Disclaimer
This document has been produced without formal United Nations editing. The designations employed
and the presentation of the material in this document do not imply the expression of any opinion
whatsoever on the part of the Secretariat of the United Nations Industrial Development Organization
(UNIDO) concerning the legal status of any country, territory, city, or area or its authorities, or
concerning the delimitation of its frontiers or boundaries, or its economic system or degree of
development. Designations such as “developed”, “industrialized” or “developing” are intended for
statistical convenience and do not necessarily express a judgement about the stage reached by a
particular country or area in the development process. Mention of firm names or commercial products
does not constitute an endorsement by UNIDO. The findings, interpretations, and conclusions
expressed in this work do not necessarily reflect the views of UNIDO. UNIDO does not guarantee the
accuracy of the data included in this work.