industrial analytics 2016/2017 - digital analytics … · · 2016-12-01sponsored report |...
TRANSCRIPT

Sponsored Report | December 2016
INDUSTRIAL ANALYTICS 2016/2017 The current state of data analytics usage in industrial companies
Sponsored by
A collaboration of:

2
© 2016 IoT Analytics. All rights reserved. 2© 2016 IoT Analytics. All rights reserved.
INDUSTRIAL ANALYTICS 2016/2017
Authors: Knud Lasse Lueth, Christina Patsioura, Zana Diaz Williams and Zahra Zahedi Kermani
Steering Committee Industrial Analytics, DAA e.V.: Frank Pörschmann, Alexander Thamm, Peter
Sorowka and Dr. Erik Schumacher
December 2016
The current state of data analy tics usage in industrial companies
INDUSTRIAL ANALYTICS 2016/2017

3
© 2016 IoT Analytics. All rights reserved. 3© 2016 IoT Analytics. All rights reserved.
TABLE OF CONTENTS
Table of Contents
Foreword 6
Executive Summary 8
1 Introduction to Industrial Analytics 11
1.1 Industry 4.0: The new industrial advancement 11
1.2 Internet of Things (IoT): Bringing billions of products and machines online 12
1.3 Data Analytics: The new intelligence frontier 13
1.4 Bringing it all together: Industrial Analytics 13
2 Industrial Analytics: Making sense of it 15
2.1 History - How analytics evolved towards automated decision-making 15
2.2 Status quo – Firms see the importance but are just getting started 16
2.3 Value Drivers – Industrial Analytics enables new revenue streams 17
2.4 Understanding Analytics 20
2.5 Paradigm shifts – How analytics reshapes industrial principles 24
3 Industrial Analytics Case Studies 28
3.1 HPE – Enabling predictive maintenance for wind turbines 28
3.2 Comma Soft AG: Reducing complexity-driven costs in the automotive industry 32
3.3 Kiana Systems – How to pick the right pill out of over 1,000 35
4 Industrial Analytics: Making it happen 38
4.1 Project approach – Starting an Industrial Analytics project 38

4
© 2016 IoT Analytics. All rights reserved. 4© 2016 IoT Analytics. All rights reserved.
TABLE OF CONTENTS
4.2 Tools/Technology – The backbone of Industrial Analytics 40
4.3 Organization – Aligning company structures for Industrial Analytics 43
4.4 Required skills – Staffing for Industrial Analytics 45
4.5 Implementation Challenges 48
4.6 Further Leadership Recommendations 49
5 References 51
6 Appendix 52
6.1 Methodology of the Study 52
6.2 About Digital Analytics Association Germany e.V. 56
6.3 About IoT Analytics 56
6.4 Special thanks 57
Copyright 58

5
© 2016 IoT Analytics. All rights reserved. 5© 2016 IoT Analytics. All rights reserved.
QUOTE
Data is the new oil. It’s valuable, but if unrefined it cannot really be used. It has to be changed into gas,
plastic, or chemicals to create a valuable entity that drives profitable activity; so must data be broken
down, analyzed for it to have value.
Clive Humby, Mathematician and architect of Tesco’s Clubcard, 2006
“
”

6
© 2016 IoT Analytics. All rights reserved. 6© 2016 IoT Analytics. All rights reserved.
FOREWORD
Foreword
Industrial Analytics is evolving from an isolated business function towards a strategic capability that impacts the future
competitiveness in any industrial business.
Today, we are facing a data-driven world that is changing faster than ever before. A large number of new methods, tools
and technologies are finding their way into management circles, often accompanied by a variety of abstract buzzwords.
For now, the world of data analytics seems to be dominated by visions rather than large-scale implementations. Reality
shows that Industrial Analytics still has a long way to go before it is finally becoming that strategic and scalable
business capability that it is promising to be.
Therefore, the Digital Analytics Association Germany set out to better understand the current status of data analytics
in industrial settings and its role within today’s discussions on the Internet of Things and other initiatives such as
“Industrie 4.0”.
This study was initiated and governed by the Digital Analytics Association e.V. Germany (DAAG), which runs a
professional working group on the topic of Industrial Analytics. Research firm IoT Analytics GmbH has been selected to
conduct the study and assure professional methods and standards are applied as part of the research effort.
Such a study would not have been possible without the support of three sponsors. A special thanks to Hewlett Packard
Enterprise, as well as to the data science service companies Comma Soft, and Kiana Systems for supporting and
financing this study. All research and analysis related steps required for the study, such as interviewing, data gathering,
data analysis and interpretation, were conducted solely by the authors and are not externally influenced. The case
studies provided by the sponsors are clearly marked as sponsor-provided content.
The goal of the study is to paint an accurate picture on the current state of data analytics in industrial settings, thereby
bridging the existing information gap on this topic. Furthermore, this study also represents a cornerstone for the Digital
Analytics Association e.V. in its mission to support both decision makers as well as data analysts to further develop
those skills and capabilities that are in demand and have been identified as being crucial.
For a detailed description of the methodology, please refer to the Appendix.

7
© 2016 IoT Analytics. All rights reserved. 7© 2016 IoT Analytics. All rights reserved.
FOREWORD
THIS REPORT INCLUDES:
• Results from an in-depth industry survey of 151 analytics professionals and decision-makers in industrial
companies
• Introductions to Industrial Analytics, its relation to the Internet of Things and Industry 4.0, how analytics has
evolved over time, what Machine Learning is and what value and paradigm shifts Industrial Analytics brings to the
industry
• 3 prime case studies of actual Industrial Analytics projects (in the areas of energy, healthcare, and automotive)
• Further insights into aspects such as how to organize for Industrial Analytics, which skills to build up and how to
approach these projects.
We hope you enjoy the read, gain insights for your Industrial Analytics projects or your personal skill development as a
data analyst, and become inspired to expand the art of the possible through industrial data analytics.
The Digital Analytics Association e.V. welcomes any interested supporters who are motivated to further develop
related insights or want to contribute to making the vision of Industrial Analytics a reality over the coming years.
Frank Pörschmann Knud Lasse Lueth
Member of the Board Managing Director
Digital Analytics Association e.V. IoT Analytics GmbH

8
© 2016 IoT Analytics. All rights reserved. 8© 2016 IoT Analytics. All rights reserved.
EXECUTIVE SUMMARY
Executive Summary
Findings per Chapter:
CHAPTER 2: INDUSTRIAL ANALYTICS - MAKING SENSE OF IT
1. Status quo – Firms acknowledge the huge importance but are not yet completely set-up
• The importance of analytics for decision-making is increasing: Analytics started as mere operational support
in the 1960s and 1970s. Today, it is increasingly used to drive decision-making. In the future, it will be used
to automate decisions.
• 15% of respondents surveyed view industrial data analytics as a crucial factor for business success today,
while 69% think it will be crucial in 5 years.
• Today, 68% of survey participants say they have a company-wide data analytics strategy, 46% have a dedicated
organizational unit and only 30% have completed actual projects.
2. Value drivers – Increasing revenue seen as the main driver; predictive maintenance as the leading application
• People see increased revenue as the main value driver for Industrial Analytics (33% weighted score).
Increased revenue can be achieved in three possible ways: Upgrading existing products, changing the business
model of existing products, or creating new business models.
• Despite the fact that one can witness a number of efficiency-related projects today, cost cutting is seen as
less important at only 3% (weighted score).
• The three main applications of Industrial Analytics in the coming 1-3 years are related to predictive and
prescriptive maintenance of machines (79% of respondents view it as important ), customer/marketing-
related analytics (77%) as well as the analysis of product usage in the field (76%).
3. Analytics – Slowly shifting to more sophisticated types of analytics
• The type of analytics deployed on various projects are moving from descriptive analytics to applications of
real-time analytics, predictive analytics and even prescriptive analytics.
• The importance of spreadsheets will decline (from 54% to 27% in 5 years) while the importance of Business
Intelligence (39% to 77%) and advanced analytics tools (50% to 79%) will increase sharply
9
© 2016 IoT Analytics. All rights reserved. 9© 2016 IoT Analytics. All rights reserved.
EXECUTIVE SUMMARY
• IoT brings additional challenges to Industrial Analytics, including real-time data streaming, management
of enormously large data sets, time-stamp data storage and completely new use cases –Most companies feel
they are good or excellent at collecting IoT-related sensor data (60% of survey respondents) but only few say
they are good or excellent at getting the right insights from the sensor data (32%).
4. Paradigm shifts – Industrial Analytics changes long-held manufacturing principles
• Agile project development is replacing waterfall-based project planning. 58% of survey respondents indicate
that they employ the agile (and often also “scrum”) methodology for their data analytics projects today.
• Other paradigm shifts include the creation of platforms and open ecosystems (e.g., companies are building
B2B marketplaces and app stores”), the reshaping of the well-established 5-layer automation pyramid
(software architecture), as well as an increasing flexibility and specialization of manufacturing through
manufacturing-as-a-service.
CHAPTER 4: INDUSTRIAL ANALYTICS - MAKING IT HAPPEN
1. Starting the project – Often in an explorative approach and using open source tools
• In their quest to embrace digital business models and build on the power of data, companies start projects
increasingly in an explorative manner (34% use an explorative approach) – still, the majority (66%) of
projects are approached with clear hypotheses in mind (hypotheses driven approach)
• 4 areas need to be addressed, when structuring Industrial Analytics project: Data sources, necessary
infrastructure, analytics tools and applications
• Using open-source analytics tools are increasingly the norm: Nearly two thirds of all survey respondents
(64%) are using open-source tools for some aspects of their data analytics projects.
• Most costs in Industrial Analytics projects incur in the initial phase of getting data access (21%), aggregating
the data (17%), and performing the data analysis (14%) – the costliest individual item, however, is related to
software and application development (26%).
2. Organizing and Staffing – Top management-driven, externally implemented – bridging the Data Science Skill
Gap
• Industrial Analytics is increasingly initiated by senior management - 34% of survey respondents indicate that
it is the CEO who drives Industrial Analytics projects.

10
© 2016 IoT Analytics. All rights reserved. 10© 2016 IoT Analytics. All rights reserved.
EXECUTIVE SUMMARY
• Large corporations have not centralized data analytics in one specific department (Only 33%). Instead,
many large industrial companies are outsourcing some of their data analytics activities in an external Data
lab, Digital lab, incubator or accelerator (55% of respondents)
• The biggest skill gap is currently in Data Science. (92% of respondents say it is important or very important
but only 22% of respondents have all necessary skills on board). Machine Learning, as an integral part of Data
Science also represents a large gap (83% vs 33%) – Another significant deficiency can be identified around
IoT/M2M infrastructure (68% vs 17%).
• Data Science Teams are diverse and typically include an overall manager, an industrial expert, a data engineer,
a data developer, a Machine Learning expert and a data analyst.
3. Challenges & further Recommendations – Focus on interoperability issues, data accuracy and shaping the
digital mindset
• Overlapping tasks with departments (60%) and difficulties in building the business case (60%) represent
the most important business challenges for IA Projects
• Interoperability between different components of the data analytics IT/OT stack (78%), data accuracy (62%)
and gaining insights from data (62%) represent the biggest technical challenges
• Further leadership recommendations: Shape the digital mindset, define strategic roles, start small, define a
capability roadmap, embrace a data governance strategy, and enable supporting functions

11© 2016 IoT Analytics. All rights reserved.
1. INTRODUCTION TO INDUSTRIAL ANALYTICS
1 Introduction to Industrial Analytics
“Data is the new oil”: A highly valuable resource that is
becoming more and more critical to worldwide business
operations and the source of tremendous wealth if
handled correctly. Analytics is to data what refining is to
oil: The process that turns the resource into a valuable
product.
The rise of Industrial Analytics: The value of data
analytics is becoming increasingly important in
industrial companies. This trend is supported by 3 main
enablers:
1. Next-generation industrial infrastructure
(Industry 4.0)
2. Connected machines and products
(Internet of Things)
3. Advanced data analytics techniques
(Data Analytics)
1.1 Industry 4.0: The new
industrial advancement
In the last 200+ years there have been three industrial
revolutions and we are on the verge of the fourth one.
• Industry 1.0: Two centuries ago, James Watt’s vapor
powered technology created novel mechanical
manufacturing techniques. This led to the First
Industrial Revolution, characterized by machine-
supported production. The result was a step-
change in productivity as well as the emergence
of completely new industry segments, like textile
production, chemicals, metallurgy, and so forth.
Rise of Industrial Analytics
The Fourth Industrial Revolution (Industry 4.0) Industrial Internet
of Things (IIoT)
Data Analytics (Big data & Machine learning)
ExHIBIT 1: 3 Enablers for the Next Wave of Industrial Analytics

12© 2016 IoT Analytics. All rights reserved.
1. INTRODUCTION TO INDUSTRIAL ANALYTICS
• Industry 2.0: The Second Industrial Revolution
followed at the beginning of the 20th century.
It was Henry Ford’s invention of the production/
assembly line that enabled a new kind of mass
production and a division of labor. A key driver of
this revolution was the widespread availability of
electrical energy.
• Industry 3.0: The Third Industrial Revolution, which
began in the early 1970s, is characterized by the
increasing use of electronics, integrated circuits
and IT systems to achieve a new kind of automated
production (e.g., through the use of automated
robots).
• Industry 4.0: As many leaders, scientists and
engineers point out the world is currently in the
early stages of the Fourth Industrial Revolution
which is about to bring yet another major change
to economies and societies.
INDUSTRY 4.0 IS CHARACTERIZED BY THE CONNECTION BETWEEN PHYSICAL AND DIGITAL SYSTEMS
This fourth revolution is characterized by the
connection between physical and digital systems.
The convergence of information technology and
industrial automation is creating completely new
technology architectures that allow yet another wave
of productivity increases as well as new data-driven
business models. Another central theme of Industry 4.0
is increased product individualization moving toward
batch-size one.
Unlike the three previous revolutions, Industry 4.0 is not
triggered by one single invention, like steam power or
integrated circuits, but by a fusion of technological
advancements. Cyber Physical Systems are often
mentioned as a core technology of Industry 4.0. It
describes how hardware and software components
interact in a complicated network with physical inputs
and outputs. Other technologies include advanced 3D
Printing, Augmented Reality, and Cloud Computing.
1.2 Internet of Things (IoT):
Bringing billions of products
and machines online
The Internet itself was originally designed to connect
computers. Over time it has expanded to connect
mobile phones and tablets. With the Internet of Things
it will also connect any other physical device used in
everyday life, like cars, machines, industrial products
and much more.
Whether there will be 20 or 50 billion connected Internet
of Things devices by 2020, the fact remains there will
be a significantly large number of devices, much more
than the current number of computers or smart phones.
McKinsey Global Institute predicts that by 2025 the
Internet of Things will generate up to $11trillion in
value to the global economy.
The Internet of Things (IoT) is seen by some as an
integral part of Industry 4.0. Sometimes the two are
used interchangeably. The industrial Internet of Things
describes the network of machines and products that
are able to communicate and share intelligence with
each other within the industrial environment in order to
optimize the related industrial operations.
While Industrial IoT connectivity leverages connections
via IP-based networks and the cloud, other types of
industrial communication aren’t so novel. On-premise
industrial automation systems (e.g., PLC/DCS and
SCADA systems), for example, have been around for

13© 2016 IoT Analytics. All rights reserved.
1. INTRODUCTION TO INDUSTRIAL ANALYTICS
years. Some industries like automotive have been
working with Machine to Machine communication
(M2M) that allows cellular connectivity of devices (e.g.,
cars). With other types of communication emerging,
M2M can now be seen as one potential connectivity
module for the overall IoT architecture.
Compared to system architectures that were built on top
of on-premise or M2M type of connectivity, IoT promises
a cheaper, more flexible and less rigid architecture
that enables completely new use cases. The backend
architectures for IoT are not solely on-premise and
the connection is not restricted to cellular networks.
Therefore, the silo-like, closed solutions of the past
are replaced by more modular concepts that connect
building blocks from multiple, specialized service
providers. New cloud architectures (e.g., IoT Platforms)
and new communication methods are emerging (e.g.,
Low-Power Wide Area Networks) with the effect that the
costs and energy requirements for connecting devices
and machines continue to decrease quickly.
1.3 Data Analytics: The new
intelligence frontier
Data Analytics describes processes and methods to
examine data with the goal to extract useful insights,
optimize processes and make better decisions.
Recent technological advancements are enabling data
analytics to be used in broader settings and in more
sophisticated ways. The two important drivers are:
1. Big Data architectures: The collection of huge
and complex, often unstructured datasets, has
been perfected. Today, there are a
number of first-class NoSQL databases and data
administration tools with the required processing
power and server infrastructure.
2. Artificial Intelligence/Machine Learning: A
number of Artificial Intelligence Tools and Machine
Learning Algorithms are available to perform all
kinds of analyses. These tools are often open-source
and freely available to be used by anyone for their
data analytics projects.
INDUSTRIAL ANALYTICS LEADS INDUSTRIAL FIRMS TOWARDS SMART DATA-DRIVEN ORGANIZATIONS
1.4 Bringing it all together:
Industrial Analytics
Combining the advancements in data analytics with
other Industry 4.0 technologies and the Internet of
Things means a significant stride forward for industrial
companies. The unique combination allows for new
business streams and higher efficiency levels:
• Processes across all business areas can achieve
higher levels of automation
• Real-time analysis allows for increased equipment
uptime and transparency
• Offerings can be quickly adjusted to individual
customer demand
• New products, services and data-driven insights
can be created and sold
Industrial Analytics plays a central role in all related
activities.

14© 2016 IoT Analytics. All rights reserved.
1. INTRODUCTION TO INDUSTRIAL ANALYTICS
As a result, Industrial Analytics is a key facilitator for
the next wave of industrial optimization, turning firms
into smart data-driven companies. Mastering it will
be essential for every company that wants to take
advantage of the next industrial revolution.
Defining Industrial Analytics
Industrial Analytics (IA) describes the
collection, analysis and usage of data generated
in industrial operations and throughout the
entire product life cycle, applicable to any
company that is manufacturing and/or selling
physical products.
Industrial Analytics involves traditional methods
of data capture and statistical modelling.
However most of its future value will be enabled
by advancements in connectivity (IoT) and
improved methods for analyzing and interpreting
data (Machine Learning).
Adjacencies: Industrial Analytics is sometimes
mentioned in conjunction with consumer-facing
and service industries (e.g., airlines, insurances)
as well as with other operations of companies
(sales, marketing, human resources). This study
does not focus on these adjacencies – even
though they are sometimes mentioned.

15© 2016 IoT Analytics. All rights reserved.
2. INDUSTRIAL ANALYTICS: MAKING SENSE OF IT
2 Industrial Analytics: Making sense of it
2.1 History - How analytics
evolved towards automated
decision-making
The mathematical foundations of data analytics were
established in the 18th, 19th, and early 20th century
but analytics was born in the 1950s and 60s when the
first computers were used for operational decision
support. The work involved small teams of experts
responsible for descriptive analytics and reporting
activity. In equipment maintenance for example, failure
rates were analyzed to support maintenance-related
decisions such as which equipment to test and when. [1], [2]
The early analytics tools used for query and reporting
were sold as “do-it-yourself” solutions for computer
science experts. In the mid-1970s, several vendors
began offering tools that allowed a non-programmer
to delve in the world of data access and analysis. It
thereby created the domain of Business Intelligence
and allowed for the next level of structured analytics-
enabled decision-making. In maintenance for
example the use of (ex-post) pattern recognition led to
preventive maintenance programs. Critical equipment
was intelligently monitored according to its calculated
failure probability. [3], [4]
The role of analytics further increased through
innovations in data mining methods, data warehouses,
client-server systems and eventually Big Data
repositories. This development lead to decisions that
ExHIBIT 2: How analytics evolved in the industrial context

16© 2016 IoT Analytics. All rights reserved.
2. INDUSTRIAL ANALYTICS: MAKING SENSE OF IT
were analytics-driven. In the maintenance industry,
for example, condition-monitoring became the norm.
Condition monitoring led to a visualization of critical
sensor readings, thereby giving humans a real-time
view on equipment status and driving mission-critical
decisions such as which bearing to replace.
MANY DECISIONS ARE NOW STARTING TO BE AUTOMATED BASED ON DATA AND ANALYTICS, OFTEN IN REAL-TIME
Today, the relevance of analytics for decision-making is
gaining interest thanks to the availability of machine-
learning tools and the Internet of Things. Many decisions
are now starting to be automated based on data and
analytics, often in real-time.
The maintenance industry is further advancing: What
started as failure rate analysis is now becoming
predictive maintenance 60 years later. Sensor readings
are analyzed in real-time and algorithms make
predictions on the remaining lifetime of individual
equipment. In many instances these processes are
becoming so automated that the decision-making
process does not require human interaction anymore.
2.2 Status quo – Firms see the
importance but are just
getting started
Most decision-makers acknowledge the huge importance
Industrial Data Analytics plays in the automation of
important decisions and processes
69% of survey respondents believe data analytics are
crucial for business success in 5 years. However, only
15% of respondents think it is already crucial today.
While 68% of survey participants say they have a
company-wide data analytics strategy, 46% have a
dedicated organizational unit and only 30% have
completed actual projects (Out of the remaining 70%,
most firms have ongoing projects or are in a prototyping
phase, however)
.
We see lots of quick wins in the coming
years through IoT.
Head of connected products at a crane
manufacturer
Question: What role does Industrial Data Analytics play in your organization?
Today In 5 years
15%
69%
= Respondents who answered: "It is crucial for business success"
ExHIBIT 3: Industrial Analytics to play a crucial role in organizations in 5 years
“
”

17© 2016 IoT Analytics. All rights reserved.
2. INDUSTRIAL ANALYTICS: MAKING SENSE OF IT
2.3 Value Drivers – Industrial
Analytics enables new
revenue streams
When looking deeper at the value of today’s Industrial
Analytics projects, it is important to separate analytics-
enabled revenue streams from analytics-enabled cost
reduction efforts.
INCREASED REVENUE IS THE BIGGEST VALUE DRIVER FOR INDUSTRIAL DATA ANALYTICS PROJECTS
The biggest value driver for Industrial Data Analytics
projects is clearly on the customer-facing/revenue-
generating aspect of the business. Increased revenue
is the main driver (33% - weighted score), followed by
increased customer satisfaction e.g., through better
service or more individualized offerings (22% - weighted
score).
Efficiency gains and cost cutting score very low with
only 3% of respondents (weighted score) seeing these
aspect as a major benefit of Industrial Data Analytics.
So how should firms think about generating revenue or
decreasing their costs?
2.3.1 Three typical new revenue streams
• Upgrading existing products: Enhancing the
existing products with new features (e.g., a
manufacturer of construction equipment is now
offering an additional feature to track vehicles in
real-time in a neat dashboard)
• Changing the business model of existing
products: A predominant theme is the shift towards
offering Products-as-a-Service (e.g., due to the
ability to analyze data in real time, a manufacturer
of compressors is now selling cubic meters of
compressed air over time, instead of selling the
compressor equipment as a one-off)
ExHIBIT 4: Many companies have a data analytics strategy but few have completed projects
Do you have a dedicated organizational unit for data analytics?
Have you finalized data analytics projects?
Do you have a company -wide data analytics strategy?
30%
68%
46%
70%
32%
54%
NoYes
Question:
Respondents who answered:

18© 2016 IoT Analytics. All rights reserved.
2. INDUSTRIAL ANALYTICS: MAKING SENSE OF IT
• Creating new business models: Some companies
are starting to enable new services in a connected
ecosystem (e.g., Insurance companies are
increasingly partnering with industrial companies
to create so-called usage-based insurance packages
that are for example based on the driving behavior
data of individual people).
2.3.2 Three typical ways to reduce costs
• Data-driven process optimization: Analytics
outcomes are often visualized in dashboards that
are assisting the workforce operating the plant.
These real-time knowledge-based insights can
drive workers’ actions (e.g., Intelligent Plant Floor
Dashboards on tablets help production supervisors
optimize daily manufacturing operations regardless
of where they are on the shop floor)
• Data-driven process automation: As more and
more industrial processes and workflows become
automated, intelligent data models help orchestrate
actions requiring less human intervention (e.g.,
Real-time fault detection on products during the
manufacturing process helps in automatically
reducing scrap-related costs)
• Data-driven product optimization: Analytics
can help reduce product costs. A manufacturer
of specific lighting systems, for example, needs
to guarantee a certain product lifetime to his
customers. Traditionally the manufacturer “over
engineered” certain components of the solution
in order to ensure that the required lifetime could
be guaranteed. Thanks to Industrial Analytics, this
manufacturer is now able to analyze the product
usage in detail. The manufacturer has started to
reduce the specifications for those components
that do not have a large impact on product lifetime
ExHIBIT 5: Increased revenue and customer satisfaction as biggest benefits of Industrial Analytics
Increased product quality
Increased customer satisfaction
Increased revenue
Optimized Supply Chain
Better insights on customers needs
Lower cost base (cost cutting)
Better resource planning
Better Demand Forecasting
Other
Better compliance with regulations
33.1%
5.5%
22.1%
4.1%
10.3%
3.4%
0.7%
9.0%
0.7%
11.0%
Question: What are the biggest benefits of Industrial Data Analytics for your company?*
*The survey specifically asked for the top three benefits. The ranking was generated by giving points – three points for first biggest, two points for second biggest and one point for third biggest benefit – The percentage is based on the overall number of points.
19© 2016 IoT Analytics. All rights reserved.
2. INDUSTRIAL ANALYTICS: MAKING SENSE OF IT
– thereby significantly reducing costs without
impacting guaranteed product performance.
2.3.3 Industrial Analytics Applications
across the value chain
Employing Industrial Analytics related projects often
results in bringing together the entire industrial
ecosystem collaborating with partners, suppliers
and often integrating further with customers and their
needs.
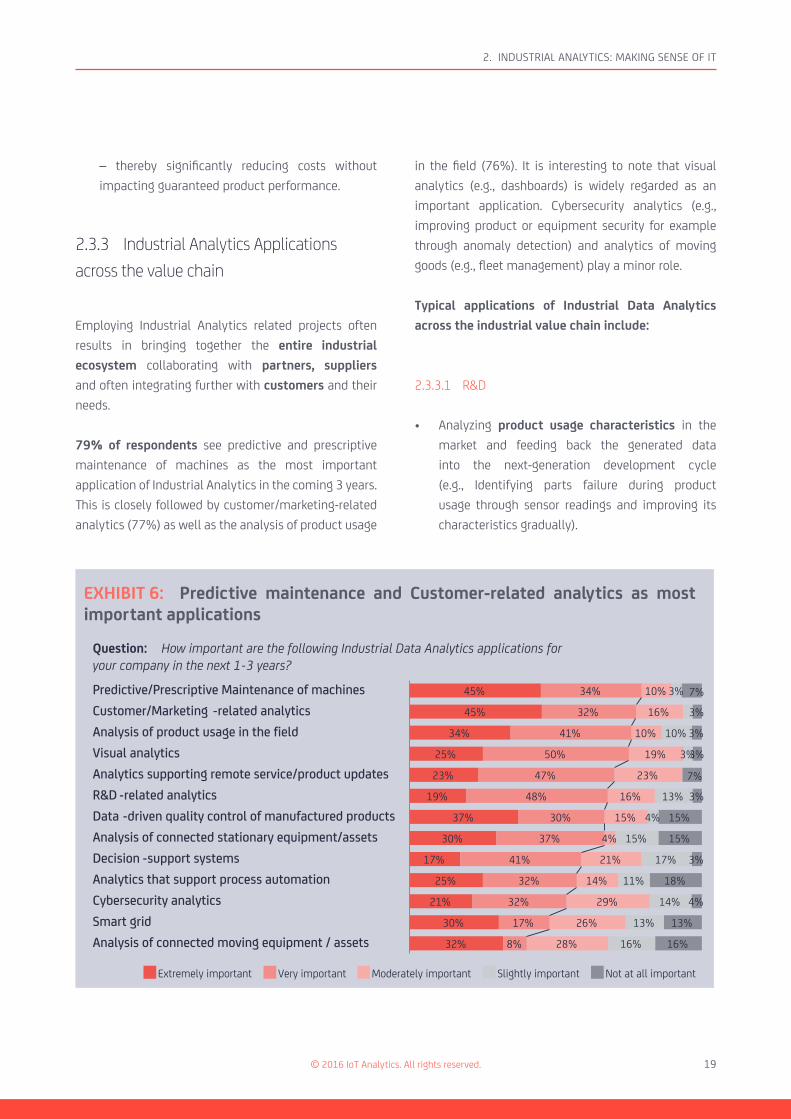
79% of respondents see predictive and prescriptive
maintenance of machines as the most important
application of Industrial Analytics in the coming 3 years.
This is closely followed by customer/marketing-related
analytics (77%) as well as the analysis of product usage
in the field (76%). It is interesting to note that visual
analytics (e.g., dashboards) is widely regarded as an
important application. Cybersecurity analytics (e.g.,
improving product or equipment security for example
through anomaly detection) and analytics of moving
goods (e.g., fleet management) play a minor role.
Typical applications of Industrial Data Analytics
across the industrial value chain include:
2.3.3.1 R&D
• Analyzing product usage characteristics in the
market and feeding back the generated data
into the next-generation development cycle
(e.g., Identifying parts failure during product
usage through sensor readings and improving its
characteristics gradually).
Predictive/Prescriptive Maintenance of machines
Analytics supporting remote service/product updates
Analysis of product usage in the field
Analysis of connected stationary equipment/assets
Data -driven quality control of manufactured products
Smart grid
Cybersecurity analytics
Visual analytics
Analysis of connected moving equipment / assets
Customer/Marketing -related analytics
R&D -related analytics
Analytics that support process automation
Decision -support systems
16%
41%
4%
7%
3%
37%
17%
3%
18%
26%
45%
23%
21%
25%
16%
29%
16%
32%
14%
30%
10%
28%
19%
45%
32%
19%
23%
34%
21%
30%
10%
15%37%
25%
4%
17%
15% 15%
34% 7%
13%48%
11%
15%30%
3%
13%
47%
3%
3%
16%
32%
3%
17%
32%
3%
4%
50%
14%
10%
41%
13%
8%
Not at all importantModerately important Slightly importantVery importantExtremely important
Question: How important are the following Industrial Data Analytics applications for your company in the next 1-3 years?
ExHIBIT 6: Predictive maintenance and Customer-related analytics as most important applications

20© 2016 IoT Analytics. All rights reserved.
2. INDUSTRIAL ANALYTICS: MAKING SENSE OF IT
2.3.3.2 MANUFACTURING / OPERATIONS
• Predictive Maintenance on equipment, machinery
and assets (e.g., rescheduling the maintenance
plan to act prior to equipment failure - according
to historical and real-time machine performance
analysis).
• Decision-support systems for industrial
processes (e.g., using data from operations to
automate purchase order or production scheduling
decisions).
• Manufacturing network optimization (e.g.,
correlating and optimizing performance across
multiple plants).
• Optimizing individual machine parameters
for smooth operations and optimal quality (e.g.,
correlating cause and effect of parameters such as
machine speed).
2.3.3.3 LOGISTICS / SUPPLY CHAIN
• Condition monitoring of moving assets (e.g. goods
in-transit)
• Cross-supplier supply chain optimization (e.g.,
analyzing warehouse stock levels and real-time
supply data to forecast shortages, reduce overall
inventory levels and bring efficiency to the supply
chain)
• Fleet management (e.g., analysis of transportation
data and fuel consumption to optimize the
distribution network)
• Strategic supplier management (e.g., Continuously
analyze quality metrics of individual suppliers)
2.3.3.4 MARKETING / SALES
(Although not necessarily classed as Industrial
Analytics, these need to be mentioned as well)
• Product usage-related analytics for strategy and
marketing (e.g., tracking usage patterns for better
customer targeting and positioning)
• Tracking, optimizing and individualizing consumer
interaction and conversion (e.g., by analyzing
social media and website traffic)
• Analytics-driven after sales (e.g., analyzing
product usage in real-time, offer suitable services
and propose suitable upgrades according to the
usage behavior)
• As-a-service business models (e.g., selling specific
products as a subscription instead of making a one-
time sale)
• Real-Time identification and response of
individual customer needs (e.g., gaining customer
insights to deepen customer relationship and/
or business opportunities, including business
partners)
2.4 Understanding Analytics
2.4.1 Analytics 101
There are several ways to classify analytics. On a high-
level, the type of analytics required is determined by:
• the question it seeks to answer
• the amount of resources its algorithms required
• the kind of solution that needs to be designed

21© 2016 IoT Analytics. All rights reserved.
2. INDUSTRIAL ANALYTICS: MAKING SENSE OF IT
The following terminology has prevailed in order to
group the different types of analytics according to the
question they seek to answer:
1. Descriptive / Diagnostic analytics are used
to describe what happened in the past and why
it happened (e.g., how many defect parts were
detected, the reason for their failure, whether
a threshold level has been exceeded). Usually,
Descriptive Analytics gain insight from historical
data using reporting, scorecards, or clustering.
2. Real-time analytics describe what is currently
happening (e.g., the current location of the product,
details on the progress of the manufacturing
processes, or detection of faulty parts).
3. Predictive analytics entail algorithms that
engage in forecasting of future incidents (e.g.,
the possibility of a defect showing up, expected
inventory levels, and anticipated demand levels).
Predictive analytics signals the need for an action
(e.g., to notify the technicians to repair the machine,
reschedule the inventory or the production plan).
The main goal of predictive analytics is to identify
potential issues before they occur. Most often
Predictive Analytics use statistical and Machine
Learning techniques.
4. Prescriptive analytics provide advice on the best
possible actions that the end-user should take. In
other words, it answers the “what should happen”
type of question. Prescriptive analytics requires a
predictive model with two additional components:
actionable data and a feedback system that
tracks the outcome produced by the action taken.
For example, an algorithm suggests the optimal
proportion of materials that are needed for the
production of a product, or a Machine Learning
algorithm leads a robot to take the shortest path on
its way to pick up the product from the warehouse
shelves.
THE ANALYTICS COMMUNITY IS SLOWLY SHIFTING ITS ATTENTION TOWARDS REAL-TIME, PREDICTIVE, AND PRESCRIPTIVE ANALYTICS
The analytics community is slowly shifting its attention
from Descriptive Analytics to the latter three types of
analytics, as these promise a whole new level of value
and have only been enabled by technology in the last
5-10 years (e.g., IoT, Big Data technology).
Descriptive/ Diagnostic analytics
Real-timeanalytics
Predictive analytics
What happened? What is happening now? What could happen?
Prescriptive analytics
What should happen?
e.g., the correlation between machine
failure and product quality
e.g., the visualization of the current
equipment status
e.g., the prediction of equipment failure
e.g., the optimization of equipment inputs to receive the right raw materials in the right amount just in time
ExHIBIT 7: Analytics evolution towards real-time, predictive, and prescriptive

22© 2016 IoT Analytics. All rights reserved.
2. INDUSTRIAL ANALYTICS: MAKING SENSE OF IT
Some sources also cite “Automated analytics” as a fifth
analytics type and the ultimate end goal of analytics.
Instead of presenting a recommendation to a human,
as in prescriptive analytics, automated analytics take
action on the results of their analysis.
Besides aforementioned types of analytics there are
several other important aspects when working with
analytics such as:
• Size/volume and “nature” of the data to collect
and analyse - namely small/big, structured/
unstructured data.
• Type of data sources connected - Internal/External,
time-series /log-file, etc.
• Analytics architecture – cloud architecture vs. on-
premise deployment.
2.4.2 Deep-dive: Machine Learning
Machine Learning is a crucial element, especially for
advanced and predictive analytics. It describes a set
of techniques that extract knowledge from data so
that systems can take smart and even autonomous
decisions. Through Machine Learning algorithms
computers can recognize patterns, learn from
experience and continuously improve the efficiency and
accuracy of the output. The benefits are manifold for
businesses across all industries, and also to end-users
that consume products and services with incorporated
Machine Learning components in them.
The concept has its roots in the early 1950s when
scientists tried to program computers to win logic-
based games and enable networks of computers to
perform certain tasks. By the 1960s these computers
were able to perform pattern recognition and, as the
computational power and the available storage capacity
increased, these techniques were available for a wider
area of applications, outside the laboratory.
Today, Machine Learning, has advanced as a set of
sophisticated algorithms that can handle complex data
and teach computer systems to learn. It is considered
a cornerstone of Artificial Intelligence (i.e., scientific
methodologies that try to teach computer systems
intelligent behaviour). Machine Learning algorithms will
be the driving force of Artificial Intelligence applications.
Popular applications of Machine Learning algorithms
today include spam filtering in e-mail accounts or
recommendation engines for e-commerce platforms
and music streaming services. In terms of industrial
applications, Machine Learning algorithms are the basis
to improve machine performance and optimize entire
manufacturing processes.
Mathematically speaking, Machine Learning draws
together methodologies from the areas of computational
statistics, mathematical optimization, and Data Mining.
The main groups of Machine Learning algorithms are the
following: Linear regression, association rule learning,
clustering, classification, Bayesian networks, Markov
chains, decision-tree models, random forest, artificial
neural networks, and genetic algorithms.
Data Scientists usually classify Machine Learning into
four different types: Supervised, unsupervised, semi-
supervised, and reinforcement learning.
• In supervised learning, the training data for
the algorithm includes desired outputs. A
typical application of supervised learning is face
recognition of individual people in a set of pictures.
• In unsupervised learning, the training data for the
algorithm does not include the desired outputs.
As unsupervised learning algorithms usually do
not know what to look for, unsupervised learning
mainly involves pattern recognition for a given

23© 2016 IoT Analytics. All rights reserved.
2. INDUSTRIAL ANALYTICS: MAKING SENSE OF IT
input variable. The output is usually data sorted
in clusters. If an algorithm, for example, is not told
what a human face looks like, it would likely start
with clustering human-looking faces in contrast to
horse faces or dog faces.
• In semi-supervised learning, the training data for
the algorithm already includes some of the desired
outputs. It can be seen as a mix of supervised and
unsupervised learning.
• In reinforcement learning, the training data for
the algorithm does not include the desired outputs
but the use of suitable algorithms gets rewarded.
The goal is to find an action or a good behavior of
the system for each particular situation so that it
maximizes the long-term benefits. Reinforcement
Learning is applied in autonomous driving vehicles
which need to ensure a safe and steady driving in
ever-changing conditions (e.g., the car must react
quickly and correctly when a small child suddenly
runs on the road – safe driving gets rewarded)
“Deep Learning” is the current buzzword for neural
networks, a particular form of Machine Learning
stimulated by the way human neurons work. It was
invented in the 50s and 60s, but has rarely been used
due to the lack of computing power and amount of
available data. Deep learning is now the driving force
behind today’s best algorithms in image recognition,
natural language processing (NLP), speech recognition
and many other similar areas.
Machine Learning in general is considered as a key
technology to develop true artificial intelligence (AI), and
today is a crucial element for data-driven decision-
making in all kinds of businesses. It is the “catalyst”
that enables smart systems to extract value from the
available data.
2.4.3 Deep-dive: Analytics for IoT
With the Internet of Things gaining importance for
industrial companies, understanding the specific
characteristics of analytics applied to sensor data is
important. While 60% of survey respondents feel that
ExHIBIT 8: Companies struggle with generating insights from the collected data
How good are you at collecting relevant sensor/machine/product-related data sets?
How good are you atgenerating insights from the collected sensor/machine/product-related data sets?
16%
8% 52%
16%
GoodExcellent
Question :
Respondents who answered:

24© 2016 IoT Analytics. All rights reserved.
2. INDUSTRIAL ANALYTICS: MAKING SENSE OF IT
they are good or excellent at collecting sensor data, only
32% feel that they are good or excellent at getting the
right insights.
IoT-based data analytics differs from other types of
analytics – typical characteristics of IoT-based data
analytics include:
1. Data Analysis: Instead of performing ex-post
(descriptive) analysis, IoT often requires an element
of real-time analysis. Real-time analysis requires
the software tools to be connected to the stream of
data and take actions in milliseconds.
2. Data size: Due to the large number of sensors
and machines (in many instances also optical/
video data) IoT often stretches the demands of
technology to store and handle these Big Data
streams.
3. Data quality: There is a whole new set of noise
present in the sensor data that needs to be dealt
with (e.g., a vibration sensor on a machine may
show an unwanted amplitude just because a truck
is driving by).
4. Data types: The data produced through these
sensors often comes with time-stamp protocols,
which may result in a new need for databases that
are organized according to those stamps.
5. Applications: Data analytics applications for
IoT need to deal with a new set of use cases (e.g.,
predictive maintenance, autonomous production,
etc.). As with all new applications, relatively few
people have experience in implementing the
algorithms for these new problems.
6. Architecture: A new challenge to analytics
architectures is the ability to perform decentralized
analytics, i.e. certain critical analytics on the device
(at the edge) and other analytics in the cloud.
Because analytics for IoT requires new approaches and
different skills there is a new set of IoT Analytics experts
and companies emerging and analytics companies
are building up specific capabilities for handling data
produced by the Internet of Things.
2.5 Paradigm shifts – How
analytics reshapes industrial
principles
Industrial Analytics advancements have a far greater
effect than just enabling selected new business cases –
in many ways it changes some long-held paradigms in
rather conservative industrial settings.
CHANGING SOME LONG-HELD PARADIGMS IN RATHER CONSERVATIVE INDUSTRIAL SETTINGS
2.5.1 Agile product development
Gone are the days of waterfall-based project planning.
“Agile” is becoming the new norm. The agile methodology
has its roots in the toolbox of the Toyota Production
System that revolutionized the way manufacturers
handle continuous improvement processes in the
70s, 80s, and 90s. The software industry adapted this
approach in a framework called “Scrum”, however the
general contemporary term is “Agile”.
In short, agile describes a set of principles under which
solutions evolve through the collaborative effort of self-
organizing cross-functional teams. It promotes aspects

25© 2016 IoT Analytics. All rights reserved.
2. INDUSTRIAL ANALYTICS: MAKING SENSE OF IT
such as iterative and incremental testing and face-to-
face communication.
With the Internet of Things, there is a new approach
performing agile project work on physical objects (e.g.,
enabling the ability to remotely analyze products and
remotely deploy software updates). The car manufacturer
Tesla is at the forefront of this development. Tesla has an
“over-the-air-fix” which allows the company’s engineers
to change software and applications remotely. New
features and feature improvements (e.g., the autopilot)
can be deployed while the car is sitting in the customer’s
garage.
It is not only about the software. Product and
maintenance-related data which loops back to product
design will also help engineers to refine sketches
and come up with better designs. As a first step,
many companies have already started to integrate
design bill of materials (BOM) with manufacturing
and maintenance BOM. By gathering and analyzing
information from different processes and feeding this
information back into product design, it is possible to
get a better understanding of product behavior and
problems associated with using an existing module in
a new product design.
Agility is achieved through collaboration between
different elements in the value chain as well as short
iterations that last from one to four weeks and include
so-called “sprints”. Agile, as well as Design Thinking, are
already widely accepted concepts with 58% of survey
respondents indicating that they employ the agile
methodology for their data analytics projects already
today.
2.5.2 Platforms and open ecosystems
Traditionally, manufacturing was a closed world that
consisted of interactions between specialists and
a few chosen third-parties. This ecosystem is now
changing. The success of Apple in creating a platform
that lets developers create and sell new applications is
encouraging industrial companies to pursue a similar
path. Industrial companies such as the agricultural
equipment manufacturer John Deere or the crane
manufacturer Liebherr are building platforms that
connect their equipment with other equipment and
We employ the Design Thinking methodologyfor our data analytics projects
We employ the Agile methodologyfor our data analytics projects
58%
56%
"Strongly Agree" or "Agree"
Question: How much do you agree with the following statements?
Respondents who answered:
ExHIBIT 9: Agile and Design Thinking are already used widely today

26© 2016 IoT Analytics. All rights reserved.
2. INDUSTRIAL ANALYTICS: MAKING SENSE OF IT
allows customers and third-parties to work on added-
value applications.
Another example is GE Digital, who is creating an
industrial app marketplace. Software developers,
Data Scientists and design thinking specialists are
collaborating to develop a platform that lets third-party
companies develop new industry applications.
For now, the applications and services provided through
these platforms are limited. However, just like Apple’s
app store was initially limited to certain apps, many of
the opportunities may still be beyond our imagination.
2.5.3 Changed software architectures
In the last decade a well-accepted 5-layer automation
pyramid has been defining the software architecture
for industrial processes. ERP systems are at the top of
the pyramid, MES systems below, SCADA systems in the
middle, PLC and DCS systems on the fourth level and
the actual input/output signals at the bottom.
IoT architectures and corresponding analytics
capabilities are possibly changing this picture.
Today, for example, Manufacturing Execution Systems
(MES) are the essential component that link shop
floor operations to ERP (Enterprise Resource Planning)
systems and other connected systems such as PLM
(product life cycle management). Traditionally,
management decisions have been taken in this
environment based on performance, quality and agility.
Cheaper sensors and integrated information are
however now making shop-floor entities smart agents
which can process the information to take autonomous
decisions. In this context, we may see smart processes
and smart products that communicate within this
environment and learn from their decisions, thereby
improving performance over time.
Following this trend, MES agents may be vertically
integrated into higher level enterprise planning and
product change management processes, so that these
entities are able to synchronously orchestrate the flow
of data, rather than go through each layer individually.
ExHIBIT 10: Beyond a layered system – Why IoT is a game changer for industrial analytics
1970s 1980/90s 2000s future
Mainframe ERP
MES
SCADA
PLC
I/O
Information technology
Industrialautomation
Today5-layer architecture
ERP = Enterprise Resource Planning MES = Manufacturing Execution System SCADA = Supervisory Control and Data Acquisition PLC = Programmable Logic Controller I/O = Input/Output signals Source: IoT Analytics
ERPInternet, ERP modules, MES, etc.
Direct digital control
Remote I/OLogical ControllerRobotics
Integrated architecture
Fieldbus protocols,TCP/IP
?Industrial
Internet of Things

27© 2016 IoT Analytics. All rights reserved.
2. INDUSTRIAL ANALYTICS: MAKING SENSE OF IT
2.5.4 Manufacturing-as-a-Service
Forward thinking manufacturers are considering new
ways to use capacity that does not necessarily belong
to them. Consider how Uber and Airbnb create value
by using assets that they do not possess. The same
movement may take over the manufacturing industry
as it seeks to advance agility in product development
and market testing.
As an example, FirstBuild, a partnership between GE
and Localmotors, is a micro factory that crowd sources
and manufactures automobiles. GE and Localmotors
use this concept to design, build prototypes and test
the market for new products. If the products prove to be
attractive to the market, they will find their way to GE
manufacturing sites for mass production.
Dassault MySolidWorks is another example. It is a
virtual online community of companies that specialize
in CNC Milling, injection molding, 3D Printing and
sheet metal manufacturing. This platform gives
clients the opportunity to use Dassault‘s software not
only to create designs but also to put users in contact
with manufacturers who then reply to a bid in hours.
Protolabs, Dassault’s partner for this project, is now
able to generate thousands of quotes per day for its
clients – thanks to the online community.
The manufacturing-as-a-service trend requires perfect
visibility into the flow of product and data in order to
take momentum and is therefore highly reliant on IoT
Data and the corresponding analytics.

28
© 2016 IoT Analytics. All rights reserved. 28
© 2016 IoT Analytics. All rights reserved.
SPONSOR SECTION
3 Industrial Analytics Case Studies
3.1 HPE – Enabling predictive maintenance for wind turbines
COMPANY HEWLETT PACKARD ENTERPRISE
Project name Windpark Management 4.0
Industry Wind energy
Use Case Predictive maintenance of wind turbine components
Date 2016
Analytics type Predictive / Machine Learning
Data volume High
Connection type IoT
3.1.1 Business case
Hewlett Packard Enterprise has developed a novel wind energy farm management solution, called Windpark Manager
4.0 that is based on latest Internet of Things, Security and Big Data technologies.
The solution enables wind farm operators to efficiently monitor all operations of the wind park, the IT equipment as
well as individual turbines. Key features of the system are real-time root cause analyses, a robust security framework
and the ability to perform predictive maintenance.
The effects are manifold: In early trials the new wind park management system allowed a control center to double
its capacity of monitored wind turbines without adding any personnel. The new root-cause-analysis tool also led to
the avoidance of expensive helicopter trips to verify the functioning of offshore turbines, as the tool can accurately
pinpoint network connectivity problems that may cause the operations team to believe there is a turbine failure e.g.,
rotor standstill.
3.1.2 Background
Wind turbines are traditionally managed by so-called SCADA systems that allow for remote monitoring and control of
a limited number of parameters. These systems (around since the 1970s) are evolving from their early-days but have
distinct limitations when it comes to functionality, network security and ability to perform large data analyses.
HPE are now merging the existing SCADA architectures of different wind turbine vendors with its IoT and IT Datacenter
management offering as well as integrating their Big Data analytics capabilities.
3. INDUSTRIAL ANALYTICS CASE STUDIES

29
© 2016 IoT Analytics. All rights reserved. 29
© 2016 IoT Analytics. All rights reserved.
SPONSOR SECTION
3.1.3 Approach
The HPE engineers set out to develop specific agents which run on top of the individual SCADA systems and help collect
and normalize the data of any turbine model as well as all the increasing IT and wireless components in the park. Each
turbine is equipped with an intelligent gateway which sends up to 300MB of data that gets generated each day via a
secure socket layer protocol (https) to the central server.
Data stored locally in a relational operational database is merged, optionally in the cloud, with other useful data sets
such as weather forecasts in an unstructured common data lake. With this setup the system collects data from over
500 different sources and compiles it into one single 360-degree view across all elements of the windpark.
In addition to the ability to monitor this data on a dashboard, the system enables predictive maintenance for individual
turbine parts. Over time the system correlates historic operational data and builds a statistical model that predicts
the likelihood of upcoming system failures and pins it down to individual locations and parts. In case of an upcoming
failure, the alert is pushed out onto a mobile device of the corresponding service personnel in charge.
3. INDUSTRIAL ANALYTICS CASE STUDIES
ExHIBIT 11: HPE Windpark (IoT) Management 4.0
30
© 2016 IoT Analytics. All rights reserved. 30
© 2016 IoT Analytics. All rights reserved.
SPONSOR SECTION
3.1.4 Challenges & Learnings
BUILDING THE PREDICTIVE MAINTENANCE MODEL
In order for the predictive maintenance system to run accurately, HPE engineers had to build and train the model.
A team of Data Scientist and mechanical engineers initially engaged in a data discovery phase during which they
validated the data sets, correlated different parts of the data and used their Data Science knowledge to reduce the
number of parameters that should be taken into account for the model. In a second step they built the model by
applying useful algorithms to these data sets. In a third step, the engineers assessed the model in terms of quality and
performance and together with the wind park engineers validated the value the model brings to everyday operations.
The outcome of the model lets you know how close you are to failure and if needed, an alert is generated indicating for
example, that a bearing is likely going to fail in 3 hours.
KEEPING THE MODEL ACCURATE OVER TIME
The engineers realized that over time the performance of the predictive maintenance model degrades. In order to
mitigate, they introduced a cycle of data re-creation and re-discovery which ensures the model stays valid at all times.
INTEGRATING THE DATA INTO EXISTING BUSINESS PROCESSES
Most companies demand the wind park management solution to integrate into the existing enterprise software
architecture. Only then can the full benefits of the solution be reaped (e.g., the existing SCADA system should
automatically shut down a turbine if an upcoming failure may lead to major part damages). HPE therefore takes
an open approach and integrates with major software vendors. The company even works with competing analytics
vendors such as Tibco or Tyco to integrate their toolsets into the overall solution.
3.1.5 Looking forward
This showcase focuses on predictive maintenance but the solution is also able to support the investment decision-
making process and supply-related topics such as verifying the correct BOM items have been received on-site. The
Windpark Manager 4.0 solution is just one of many IoT & Big Data applications that HPE supports. In particular, this
solution builds on HPE’s 25 year experience in managing complex, heterogeneous and distributed datacenters, as well
as its own data warehouse and database technologies HPE Vertica and HPE Idol.
HPE is further building out the capabilities and believes it is impeccable for wind park managers to adopt such a
solution in the future. One should note that the wind park management 4.0 is a blueprint that can easily be adopted by
other industries in which critical remote assets need to be managed.
3. INDUSTRIAL ANALYTICS CASE STUDIES

31
© 2016 IoT Analytics. All rights reserved. 31
© 2016 IoT Analytics. All rights reserved.
SPONSOR SECTION
3.1.6 About Hewlett Packard Enterprise
3.1.6.1 COMPANY OVERVIEW AND CONTACT DETAILS
COMPANY HEWLETT PACKARD ENTERPRISE
Headquarters Palo Alto, California, USA
Founded January 1st, 1939
Employees 240,000
Website hpe.com
3.1.6.2 COMPANY DESCRIPTION
Hewlett Packard Enterprise is an industry leading technology company that enables customers to go further, faster.
With the industry’s most comprehensive portfolio, spanning the cloud to the data centre to workplace applications,
our technology, market leading Software and services help customers around the world make IT more efficient, more
productive and more secure.
3.1.6.3 PRODUCT / SERVICE PORTFOLIO FOR INDUSTRIAL ANALYTICS
HPE Vertica is the industry’s first comprehensive, scalable, open, and secure platform for Big Data. HPE Vertica, a
massively scalable analytical database platform, is custom-built for realtime analytics on petabyte-sized datasets. It
supports standard SQL, Python and R-based analytics, and offers support for all leading BI and ETL vendors. Reference
customers include Facebook, Uber, New York Genome Centre. (Free HPE Vertica Community Edition at www.vertica.com/
community).
HPE IDOL: The quest to make computers “intelligent” is as old as computers themselves. The phrase artificial intelligence
produces notions of a robot-controlled future in which humans have been rendered largely obsolete. But HPE IDOL
next-generation enterprise search and data analytics platform uses pioneering techniques in artificial intelligence to
automate and enhance the processing of human information—not to take the decision away from humans, but to help
us make the best one. We call this approach augmented intelligence. HPE IDOL is an advanced enterprise search and
data analytics tool for unstructured data with machine learning that lets you search and analyze text, image, audio,
and video from virtually any source. Reference customers include large public sector (Surveillance, Safe/Smart City, etc.)
and health care customers.
HPE Haven OnDemand: With over 70 APIs for speech, video, text and predictive analytics, HPE Haven OnDemand
brings the power of machine learning to any developer. HPE Haven OnDemand Combinations enables developers to
improve time to market and ROI for app development and IT modernization projects with rapid integration of cognitive
services designed to accelerate self-service development with fewer lines of code, reduced testing with reusable APIs,
and improved app performance with fewer API calls and less latency. Combinations is the fastest possible way to add
intelligence to apps and increase ROI. It’s like plug and play Machine Learning for Enterprise apps. Largest reference
customer: Philips (Free HPE Haven OnDemand Developer Edition at www.havenondemand.com).
3. INDUSTRIAL ANALYTICS CASE STUDIES
Name Erika Hoffmann
Position Manager Big Data Analytics Partners
Email [email protected]
Telephone +49 162 290 19 12

32
© 2016 IoT Analytics. All rights reserved. 32
© 2016 IoT Analytics. All rights reserved.
SPONSOR SECTION
3.2 Comma Soft AG: Reducing complexity-driven costs in the
automotive industry
COMPANY COMMA SOFT AG
Project name Product Complexity Reduction
Industry Automotive Tier-1
Use Case Optimizing available product variants
Date 2015
Analytics type Descriptive
Data volume High
Connection type On-premise
3.2.1 Business Case
Comma Soft AG supported a large multinational car manufacturer in reducing production-related complexity costs
by analyzing all of its product variants. The elimination of rarely chosen product variants and very costly product
options led to millions in cost savings.
3.2.2 Background
Car buyers demand individualized offerings. Whether it is exterior looks, engine power or interior – the range of
configurations go into the millions, sometimes even billions. Car manufacturers are thus constantly caught between
the need to cater to these needs and the urge to keep complexity-driven production costs down. Take the steering wheel
as an example. In this case, just the combination of different cruise controls, lane warning systems, and control stalks
leads to 80 possible configurations that need to be ready for assembly. Related cost is driven up by an increased need
for product design, increased storage capacity and lower product quality.
3.2.3 Approach
Firstly, Comma Soft consultants gathered data from 3 sources:
1. The configuration choices available to the customer
2. The actual customer orders from the past years
3. The bill of materials (BOMs) and its related rules
(e.g., which parts fit together with other parts, etc.)
3. INDUSTRIAL ANALYTICS CASE STUDIES
ExHIBIT 12: Manufacturing Environment

33
© 2016 IoT Analytics. All rights reserved. 33
© 2016 IoT Analytics. All rights reserved.
SPONSOR SECTION
After cleaning and validating the data, the team built a data model that was able to cut through the enormous amount
of data quickly enough to perform all necessary analyses. After a few weeks of work the team was able to perform the
actual data analysis. The team built a mix of supervised and unsupervised Machine Learning algorithms to understand
the effect certain configurations have on the overall cost structure (e.g., analyzing customer configuration trends over
time). In addition, a browser based visualization interface was developed in order to discuss various results with senior
management. The tool gave management the ability to interactively “click through the car configuration tree” to
immediately see the cost effect of certain actions.
3.2.4 Challenges & Learnings
PREPARING THE DATA SETS
One of the key early challenges was to ensure data consistency. With data being pulled from different sources and the
Data Scientists coming from outside the company operations, several workshops between manufacturing experts and
Data Scientists were necessary to ensure that all of the rules applicable in the real world were properly mapped into the
data models. A 15-inch wheel rim, for example, does not fit together with a 17-inch wheel – this rule may be intuitive
for humans but unfortunately not for a data model that is lacking this association rule.
ACHIEVING QUICK DATA SEARCH FUNCTIONALITIES IN HIGHLY COMPLEX DATA SETS
With data relations in the area of 100 billion connections (n:m relations) a classical relational database was not
suited for solving this kind of problem. Therefore, the team had to pivot existing data rooms, define new suitable index
structures and build custom search trees using a map-reduce methodology to access data nodes quickly. The resulting
search tree was able to deliver results in milliseconds.
USING AGILE DEVELOPMENT PRACTICES
The project turned out to be a lot more difficult than anticipated. A key success to coming up with meaningful results
quickly was the use of agile development practices. Iterating quickly and often ensured that the Data Science team was
able to extract the important know-how from the manufacturing experts.
3.2.5 Looking forward
Comma Soft is working on similar complexity reduction efforts in a number of other industries. Analyzing enormous
data sets such as this one has only become possible in the past 5 years on the back of massive improvements in
hardware processing power (e.g., increase in random access memory). The cost savings that can be achieved from such
projects are instrumental for manufacturers who are seeking cost efficiencies in global markets.
3. INDUSTRIAL ANALYTICS CASE STUDIES

34
© 2016 IoT Analytics. All rights reserved. 34
© 2016 IoT Analytics. All rights reserved.
SPONSOR SECTION
3.2.6 About Comma Soft AG
3.2.6.1 COMPANY OVERVIEW AND CONTACT DETAILS
COMPANY COMMA SOFT AG
Headquarters Bonn, Germany
Founded 1989
Employees 135
Website http://www.comma-soft.com
3.2.6.2 COMPANY DESCRIPTION
Comma Soft AG, founded in 1989, belongs to the innovation leaders at the interface of IT and Business in Germany. With
more than 135 employees, Comma Soft AG and its interdisciplinary teams addressing business IT strategy, processes &
organization, technology & infrastructure, data analytics, Data Science and security, serves numerous companies with
various DAX corporations amongst them. Pioneering In-Memory technology and current Big Data technologies designed
to quickly process large data volumes, Comma Soft provides its customers with competitive advantages – with new
approaches for the digital transformation, innovative IT architecture and cutting-edge technologies such as the Data
Science solution INFONEA and the implementation of new security standards.
3.2.6.3 PRODUCT / SERVICE PORTFOLIO FOR INDUSTRIAL ANALYTICS
Comma Soft supports optimizing business challenges with state-of-the-art methods from Advanced and Predictive
Analytics, from Machine Learning up to Cognitive Computing. More than 25 years of experience in the business-
oriented analyses, organization, and management of information and knowledge meet an interdisciplinary team of
Data Scientists, analysts, business consultants paired with experts in Big Data technology as well as Data Security &
Information Rights.
Practical examples:
• Complexity Management: reducing the variant diversity in production industry with high component complexity
• Predictive maintenance: predicting the downtimes of machine components
• Industrial Internet: analyzing machine data in the context of the Industrial Internet of Things / digital transformation
of manufacturing
3. INDUSTRIAL ANALYTICS CASE STUDIES
Name Anja Hoffmann
Position Board Assistance
Email [email protected]
Telephone +49 228 9770-159
35
© 2016 IoT Analytics. All rights reserved. 35
© 2016 IoT Analytics. All rights reserved.
SPONSOR SECTION
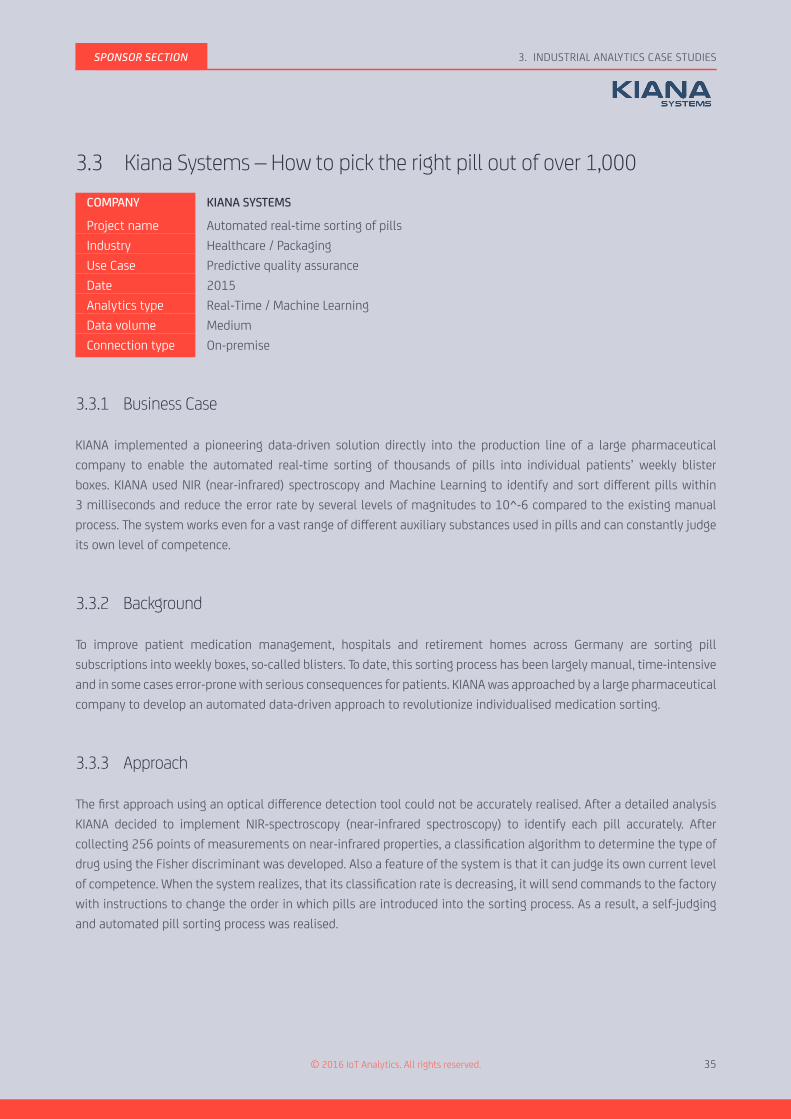
3.3 Kiana Systems – How to pick the right pill out of over 1,000
COMPANY KIANA SYSTEMS
Project name Automated real-time sorting of pills
Industry Healthcare / Packaging
Use Case Predictive quality assurance
Date 2015
Analytics type Real-Time / Machine Learning
Data volume Medium
Connection type On-premise
3.3.1 Business Case
KIANA implemented a pioneering data-driven solution directly into the production line of a large pharmaceutical
company to enable the automated real-time sorting of thousands of pills into individual patients’ weekly blister
boxes. KIANA used NIR (near-infrared) spectroscopy and Machine Learning to identify and sort different pills within
3 milliseconds and reduce the error rate by several levels of magnitudes to 10^-6 compared to the existing manual
process. The system works even for a vast range of different auxiliary substances used in pills and can constantly judge
its own level of competence.
3.3.2 Background
To improve patient medication management, hospitals and retirement homes across Germany are sorting pill
subscriptions into weekly boxes, so-called blisters. To date, this sorting process has been largely manual, time-intensive
and in some cases error-prone with serious consequences for patients. KIANA was approached by a large pharmaceutical
company to develop an automated data-driven approach to revolutionize individualised medication sorting.
3.3.3 Approach
The first approach using an optical difference detection tool could not be accurately realised. After a detailed analysis
KIANA decided to implement NIR-spectroscopy (near-infrared spectroscopy) to identify each pill accurately. After
collecting 256 points of measurements on near-infrared properties, a classification algorithm to determine the type of
drug using the Fisher discriminant was developed. Also a feature of the system is that it can judge its own current level
of competence. When the system realizes, that its classification rate is decreasing, it will send commands to the factory
with instructions to change the order in which pills are introduced into the sorting process. As a result, a self-judging
and automated pill sorting process was realised.
3. INDUSTRIAL ANALYTICS CASE STUDIES

36
© 2016 IoT Analytics. All rights reserved. 36
© 2016 IoT Analytics. All rights reserved.
SPONSOR SECTION
3.3.4 Challenges & Learnings
Almost immediately, it became clear that just an analysis of optical data would not be enough to identify each pill
accurately. Another method had to be selected to reach the desired speed and minimum error rate. KIANA decided to
apply NIR-spectroscopy to determine the chemical composition of a pill. However, as a result of the large amount of
auxiliary substances and the accompanied variance in pills, powerful Machine Learning algorithms had to be developed
to spot the spectra which contain the crucial information. Due to the given time frame, the collected information from
spectra had to be compacted. With a reduction of the pill dimensions, the help of an adapted version of the Fisher
discriminant and Machine Learning methods developed by KIANA, the required error rate and time frame could be
achieved. After implementing the classification software into the inspection module of the packaging machine, KIANA
successfully solved the challenge of integrating further processes (e.g. organizing the sequence of incoming goods)
seamlessly.
3.3.5 Looking forward
In order to ensure a continuing competitive advantage for the client, KIANA is continuously asked to further improve
the implemented software. KIANA has already doubled the number of pills (over 2,000 different ones) the classification
software can correctly identify. Also, KIANA further modified the algorithms such that they can identify pills through
packing film. Although this classification system was developed for the pharma industry, the methods used can be
adapted for every other industry that has to handle similar classification problems.
3. INDUSTRIAL ANALYTICS CASE STUDIES
ExHIBIT 13: Kiana Systems Example

37
© 2016 IoT Analytics. All rights reserved. 37
© 2016 IoT Analytics. All rights reserved.
SPONSOR SECTION
3.3.6 About Kiana Systems
3.3.6.1 COMPANY OVERVIEW AND CONTACT DETAILS
COMPANY KIANA SYSTEMS
Headquarters Saarbrucken, Germany
Founded 2001
Employees 20
Website http://www.kiana-systems.com/
3.3.6.2 COMPANY DESCRIPTION
KIANA Systems is one of the leading companies for Big Data analytics, Data Mining and Machine Learning technologies
based in Germany. The company was founded in 2001 as a spin-off of the renowned German Research Center for
Artificial Intelligence (DFKI) initially under the name of Mineway. For the direct benefit of its clients, KIANA remains at
the forefront of scientific advances in the Data Sciences through conducting R&D projects and engaging in research
collaborations with leading academic institutions.
3.3.6.3 PRODUCT / SERVICE PORTFOLIO FOR INDUSTRIAL ANALYTICS
KIANA helps companies to build IoT platforms and develops bespoke data analytics and Machine Learning software
solutions for industrial applications in order:
• to predict failures of machine parts and machines
• to conduct root-cause analysis of quality issues
• to optimize production line scheduling
• to minimize energy costs
• to implement smart self-learning product features (e.g. Smart home, Smart appliances, Smart UX…)
• to optimize pricing of original components and spare parts
• to forecast demand and increase efficiency of supply chains
KIANA has, for example, helped to build one of the most efficient factories to sort pills and personalize medicine. Near-
infrared spectroscopy combined with a classification algorithm based on the Fisher discriminant was introduced into
the production line to identify and sort over 2,000 pills within 3 msec and reducing the error to 10-6.
KIANA has developed a real-time optimal pricing solution for an industrial company selling over 12,000 different
products. KIANA analyzed extensive sales data and developed a sophisticated self-learning real-time pricing model. The
result is a significant profit increase, better competitive pricing and higher sales probabilities.
3. INDUSTRIAL ANALYTICS CASE STUDIES
Name Ushananthan Ganeshananthan
Position CEO
Email [email protected]
Telephone +49 (0)172 / 285 7012

38
© 2016 IoT Analytics. All rights reserved.
4 Industrial Analytics: Making it happen
4.1 Project approach – Starting
an Industrial Analytics
project
There are 2 distinctly different ways of approaching
individual data analytics projects:
A. Hypothesis-driven approach
(Starting from a hypothesis or problem to be
solved – with data being analyzed according to the
hypotheses).
B. Explorative approach
(letting the data talk by exploring unknown patterns,
clusters, cause-effect relations and singularities
from anomaly-detection – followed by a discussion
on insights and a continuous development of the
hypotheses). Based on these initial indications
hypotheses are then built and the process merges
into the hypothesis-driven approach.
The classical approach to data analytics projects is
somewhat similar to the following process:
1. Start with problems to be solved or articulate
expectation on analytics approach
2. Develop a process and decide on the approach,
either hypothesis-driven or explorative – as
discussed above
3. Define the data requirement (functional / non-
functional)
4. Define data access (ETL-process), e.g., how/
when/in which format will data be extracted and
delivered
5. Build the data architecture and model
6. Select the technology & integrate
7. Check data quality (completeness, consistency,
plausibility, calculate limitations of analytics
possibilities, identify limitations)
8. Apply analytics methods (analyze, model, code,
learn, etc.)
9. Discuss results, modify models, generate new
hypotheses
10. Iterate until the targeted accuracy is achieved
11. Put the solution into production
12. Monitor and adopt when necessary
Although you may refer to the standardized “CRISP
Cross Industry Standard Process for Data Mining” for
a standardized definition of the process, reality shows
that there is no single master methodology fits all
kinds of projects – especially in advanced data science
approaches.
4. INDUSTRIAL ANALYTICS: MAKING IT HAPPEN

39
© 2016 IoT Analytics. All rights reserved.
Generally speaking approaches and methods deployed
vary depending on:
• Project objective
• Methods and models applied (i.e. supervised or
un-supervised learning)
• Data infrastructure
• Data sources
• Data types given (structured, unstructured,
volume, stream or static).
34% OF PROJECTS ARE PERFORMED IN AN EXPLORATIVE MANNER
In a world in which the technological boundaries are not
clear to most decision-makers, in which agile methods
are used in order to build prototypes and in which the
amount of digitally-enabled business cases continue
to rise, the explorative approach is increasingly used.
Respondents of the survey indicated that on average
64% of industrial data analytics projects are
performed today using the hypothesis-based approach.
34% of projects are performed in an explorative manner
for which it is initially not clear what problem will get
solved and how.
When we are invited to present our technology
to potential customers there is often no pre-set
agenda. Instead, we hold creative workshops to
explore potential digital solutions. We jointly
develop ideas of what could be achieved, then
develop use cases and discuss how HPE technology
can help.
Ulrich Pfeiffer, Director HPE Software EMEA
Our approach has been both explorative and
hypothesis-based. Rather than building a business
case that caters to a specific need we are building
a vision and at the same time we are ensuring
the data is explored to see how that could help in
achieving our vision.
Director of connected solutions at a major
crane manufacturer
4. INDUSTRIAL ANALYTICS: MAKING IT HAPPEN
ExHIBIT 14: Most firms use the hypothesis-based approach
2% Other
Explorative approach
64%
Hypothesis-based approach
34%
Question: What percentage of your Industrial Data Analytics projects are implemented using the following approach?
“
“”
”

40© 2016 IoT Analytics. All rights reserved.
4. INDUSTRIAL ANALYTICS: MAKING IT HAPPEN
4.2 Tools/Technology – The
backbone of Industrial
Analytics
It makes sense to segment Industrial Analytics
technologies & tools into 4 separate modules:
1. Data sources - that generate the data
2.Necessary infrastructure – that transmits,
stores and processes the data
3. Analytics tools – that manage and make sense
of the data
4. Applications – that bring data to life and
generate the actual value
Exhibit 15 gives a broad overview of the four modules
and possible components in the industrial context.
Diving deeper into analytics, there are a wide range of
analytic software packages available.
The survey reveals that the role of spreadsheets (e.g.,
Microsoft Excel) for industrial data analytics is expected
ExHIBIT 15: Typical technology modules for Industrial Analytics - Including typical components in Industrial settings

41© 2016 IoT Analytics. All rights reserved.
4. INDUSTRIAL ANALYTICS: MAKING IT HAPPEN
to decline (i.e., 27% think it is important in 5 years vs.
54% today).
All other analytics tools surveyed are expected to gain
in importance. Notably Advanced Analytics Platforms
such as SAS Advanced Analytics Suite (from 50%
to 79%), Business Intelligence Tools such as SAP
Business Objects (from 39% to 77%), and Predictive
Analytics tools such as HPE Haven Predictive Analytics
(from 32% to 69%).
A key driver for the upward trend in the above mentioned
technologies is the growing adoption of open source
software tools.
Today, Linux/Unix is the major platform for cutting
edge machine learning. Python and its exhaustive
library ecosystem has emerged as a key programming
language. However, it is still heavily competing against
the traditional open source workhorse for econometrics
and statistics, R. Relevant Python libraries include
Numpy, Pandas, SciKit Learn, OpenCV, Keras, Theano and
Tensorflow to name a few.
Many companies including Google (Tensorflow) and
Amazon (Alexis) now actively make their software
open-source, hoping to reap the community benefits
while maintaining an edge through additional internal
development that goes beyond the open-source code.
ExHIBIT 16: Increasing role of Advanced Analytics and Business Intelligence
Edge / Fog Analytics
Statistical package
Advanced analyticsplatforms
Business Intelligence tools
Predictive Analytics tools
Event / Streaming Analytics tools
Cognitive Analytics
Spreadsheets
Artificial Intelligence
Simulation tools
52%
69%
32%
58%
46%
35%
27%
79%
50%
77%
54%
14%
18%
32%
25%
50%
32%
39%
32%
25%
In 5 yearsCurrently
Ques tion : W hich role do the following technologies play in your industrial data analys is? – N ow and in 5 years*
*P e rcentage of people who ans wered: “Important“ or “Very Important“

42© 2016 IoT Analytics. All rights reserved.
4. INDUSTRIAL ANALYTICS: MAKING IT HAPPEN
Nearly two thirds of all survey respondents (64%)
use open-source tools such as Python and its library
ecosystem, Apache Hadoop/Spark, R, or Knime for
their data analytics projects. Only 17% of respondents
indicated that it is not an option for them.
Most costs in Industrial Analytics projects incur in
the initial phases of getting data access (21%),
aggregating the data (17%), and performing the data
analysis (14%).
ExHIBIT 17: Wide adoption of open-source tools and technologies
No,this is not an option
for us
Yes, but not for
mission -critical elements
OtherMostly not,only for testing
/ prototyping purposes
Yes,absolutely
47%
10%
17%
10%
17%
Question: Do you use open -source tools/technology for your Industrial Data Analytics project?
Result visualization
Data analysis
Result interpretation
Other
Software / application development
Project management
Data aggregation / preparation
Getting data access
6.3%
6.9%
14.4%
17.2%
25.5%
3.4%
20.8%
5.5%
Question: What percentage (%) of the industrial data analytics project budget goes to the following?
ExHIBIT 18: Most Industrial Analytics related costs in software and application development

43© 2016 IoT Analytics. All rights reserved.
Project management (6%), result interpretation (6%),
and result visualization (7%) all play a minor role in
terms of overall costs. The costliest individual cost item,
usually incurs in relation to software and application
development as well as the related enterprise system
integration (26%). Depending on the complexity of the
system architecture and the problem at hand, these cost
Today, we are observing a strong misbalance
between the cost and the value structures of data
analytics. The value gets unlocked in the analysis
phase but the most time and resources are required
in the data preparation phase prior to the actual
analysis. Digital Leaders must therefore gain an
understanding of how to automate, scale and
accelerate data preparation in their organizations.
Frank Poerschmann, Board Member at the
Digital Analytics Association e.V.
4. INDUSTRIAL ANALYTICS: MAKING IT HAPPEN
buckets may shift – the survey results should however
serve as a good indication for anyone budgeting their
Industrial Analytics projects.
4.3 Organization – Aligning
company structures for
Industrial Analytics
Analytics projects often bring together a number of
people from different departments and do not fall into
one of the traditional functional corporate departments
such as Marketing, Sales, Operations or Maintenance.
34% OF INDUSTRIAL ANALYTICS PROJECTS ARE CEO-DRIVEN
ExHIBIT 20: Most Industrial Analytics projects are CEO-driven
A department or team formed only for such projects
Head of Quality
Head of R&D
COO / Head of Manufacturing
CTO / CIO
Other
CEO
7%
7%
34%
17%
3%
7%
24%
Question: Who drives your Industrial Data Analytics projects?
”
“
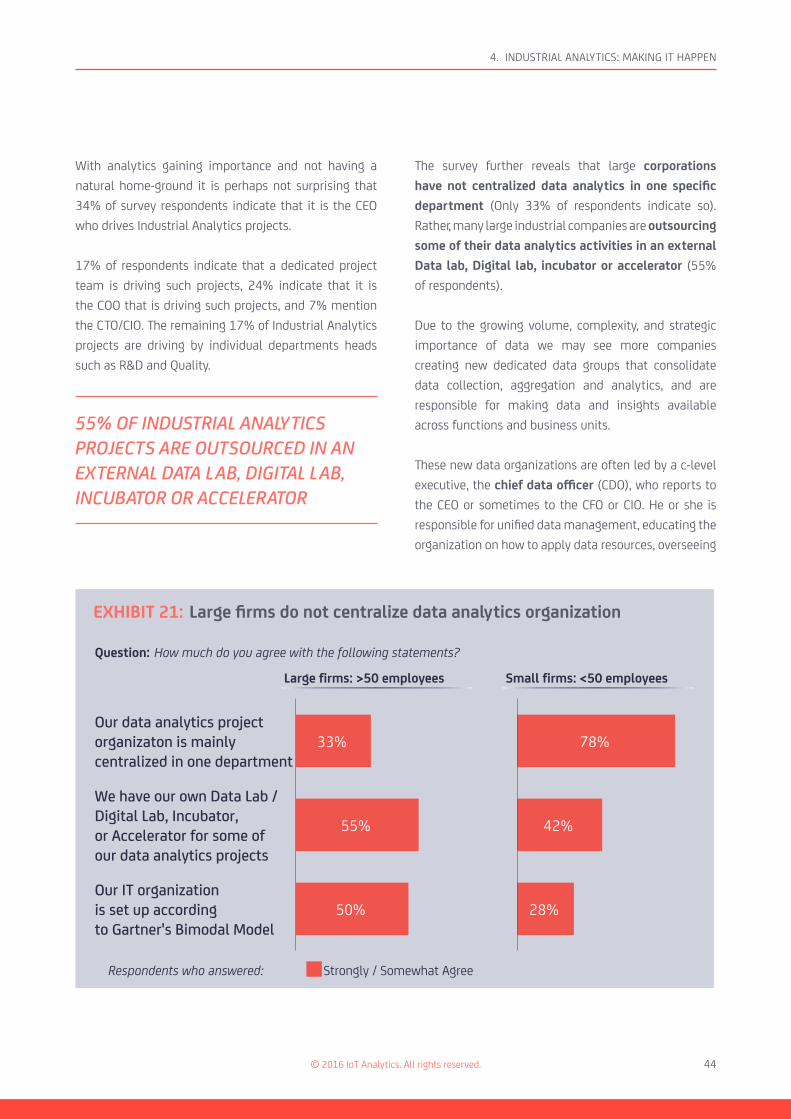
44© 2016 IoT Analytics. All rights reserved.
4. INDUSTRIAL ANALYTICS: MAKING IT HAPPEN
With analytics gaining importance and not having a
natural home-ground it is perhaps not surprising that
34% of survey respondents indicate that it is the CEO
who drives Industrial Analytics projects.
17% of respondents indicate that a dedicated project
team is driving such projects, 24% indicate that it is
the COO that is driving such projects, and 7% mention
the CTO/CIO. The remaining 17% of Industrial Analytics
projects are driving by individual departments heads
such as R&D and Quality.
55% OF INDUSTRIAL ANALYTICS PROJECTS ARE OUTSOURCED IN AN EXTERNAL DATA LAB, DIGITAL LAB, INCUBATOR OR ACCELERATOR
The survey further reveals that large corporations
have not centralized data analytics in one specific
department (Only 33% of respondents indicate so).
Rather, many large industrial companies are outsourcing
some of their data analytics activities in an external
Data lab, Digital lab, incubator or accelerator (55%
of respondents).
Due to the growing volume, complexity, and strategic
importance of data we may see more companies
creating new dedicated data groups that consolidate
data collection, aggregation and analytics, and are
responsible for making data and insights available
across functions and business units.
These new data organizations are often led by a c-level
executive, the chief data officer (CDO), who reports to
the CEO or sometimes to the CFO or CIO. He or she is
responsible for unified data management, educating the
organization on how to apply data resources, overseeing
ExHIBIT 21: Large firms do not centralize data analytics organization
Our data analytics project organizaton is mainly centralized in one department
Our IT organization is set up accordingto Gartner's Bimodal Model
We have our own Data Lab / Digital Lab, Incubator,or Accelerator for some of our data analytics projects
55%
50%
33%
Strongly / Somewhat Agree
Question: How much do you agree with the following statements?
Large firms: >50 employees Small firms: <50 employees
42%
78%
28%
Respondents who answered:

45© 2016 IoT Analytics. All rights reserved.
4. INDUSTRIAL ANALYTICS: MAKING IT HAPPEN
data rights and access, and driving the application of
advanced data analytics across the value chain. (Source:
Digital Analytics Association).
4.4 Required skills – Staffing for
Industrial Analytics
Industrial Data Analytics projects usually happen at the
intersection of industrial equipment, IT/IoT technology
and Data Science. Project are therefore made up of a
team with a variety of skills.
4.4.1 The project team
A typical Industrial Analytics project team is made up of
• An overall manager with experience in project
management and skills in communication and
stakeholder management
• An industrial expert who knows the equipment,
products and processes well
• A data engineer who is an expert in data
technologies
• A data developer who specializes in the algorithm
and application development
• A Machine Learning expert who possess deep
mathematical know-how of advanced optimization
algorithms
• A data analyst who performs various analysis and
knows how to prepare the data for the decision-
makers
The latter four form the Data Science team. One should
note that due to the rapidly developing analytics
community and the nascence of the topic, a lot of these
terms are not yet commonly accepted.
Exhibit 23 shows that the biggest skill gap is currently
in staffing this required Data Science expertise. (92%
ExHIBIT 22: Typical Industrial Analytics Project Team
Projectmanager
Industrial expert
Data engineer
Datadeveloper
Machine learningexpert
DataAnalyst
Data Science
• Project planningand management
• Communication with customers
• Collaborationwith partners
• Digital Strategy and Leadership
• Deep knowledge on the industrial topic at hand
• Technical equipment know-how
• Knowledge of the business processes within the organization
• Information technology expert with wide knowledge of data technologies
• Processes, architecture, data modeling, preparation for analysis and modeling
• Development and optimizationof algorithms
• Integration of the algorithms in applications
• Know-how on algorithms and best practices in ML
• Data modeling (esp. predictive and prescriptive analytics)
• Performing thedata analysisusing statisticaland mathematicalmethods
• Preparation ofresults, oftenvisually

46© 2016 IoT Analytics. All rights reserved.
4. INDUSTRIAL ANALYTICS: MAKING IT HAPPEN
of respondents say it is important or very important but
only 22% of respondents have all necessary skills on
board). Machine Learning as an integral part of Data
Science scores slightly better but still indicates an
important gap (83% vs 33%).
ONLY 22% OF COMPANIES HAVE ALL NECESSARY DATA SCIENCE SKILLS ON BOARD
Other deficiency themes emerge around IoT/M2M
infrastructure (17%) and enterprise system
integration (26%).
ExHIBIT 23: Biggest skill gap in Data Science
IoT/M2M infrastructure
Machine learning techniquesand algorithms
Business intelligence
Project Management& Implementation
Industrial process know-how
Computer engineering / programming
Cloud / Data storage
Data Science
Enterprise system integration
39%
68%
83%33%
22%
71%
71%
88%
65%
17%
67%
33%
63%
92%
71%
44%
39%
26%
All skills on boardImportant & Very Important
Questions:a.) How important are the following Data Analytics skillsb.) How well are they integrated in your company?
Respondents who answered:
Project management seems to be less of a worry in the
minds of respondents (67% indicate they have all skills
on board).
4.4.2 Deep-dive: Data Science
With Data Science being such an important skill for the
success of Industrial Analytics projects, firms need to
make recruiting and training for Data Science a strategic
priority.
First of all, firms should learn and address the specific
needs of data-professionals. Enterprises that have
identified analytics to be relevant to their business,
typically build specialized business units separate from

47© 2016 IoT Analytics. All rights reserved.
4. INDUSTRIAL ANALYTICS: MAKING IT HAPPEN
IT, BI or business domains, acting as internal analytics
service providers.
Research based capability maturity models (e.g., by the
International Institute of Analytics) or specified skill &
capability assessments (e.g., by the Digital Analytics
Association) find their way into the organizational
planning and development of these enterprises.
Governments and the education industry is now fostering
the development and expansion of data analytics as a
profession by itself on various professional levels. The
city of Hamburg has for example officially established
a vocational training program for digital analysts – on a
non-academic level.
Despite strong initiatives on data analytics education
a demand-supply mismatch is forecasted for the next
decade. [8]
“
”
Firms need to realize that the reason why it is so hard to
acquire these skills is also related to high expectations
towards individual Data Scientists or Data Analysts.
It is easy for us to find plenty of skilled Data Scientists
who have a solid mathematical background. We
struggle, however, to find Data Scientists who can
apply this know-how in industrial settings. A Data
Scientist who doesn’t know what parameters he or
she is currently correlating is practically worthless
because it usually does not lead to meaningful
results.
Senior project manager at an industrial
optimization consultancy
ExHIBIT 24: Data Scientist Profile & Data Science Team Profile

48© 2016 IoT Analytics. All rights reserved.
4. INDUSTRIAL ANALYTICS: MAKING IT HAPPEN
A Data Scientist should bring in skills in five distinct
functional areas:
• Academic background
• Quantitative methods
• Coding & Tools
• Domain / Application know-how
• Agile project management / Digital leadership
One rarely finds Data Scientists that are rockstars in all
of these 5 areas. The key is to build an interdisciplinary
team that in total brings in all of these five skills.
A well-working team with a diverse skillset can make
a great project team – given that the overall skills are
well-balanced across the 5 categories.
4.5 Implementation Challenges
4.5.1 Business challenges
Survey respondents indicate that overlapping tasks
with departments (60%) and the difficulty in building
the business case (60%) are the most important
business challenges for their Industrial Analytics
projects.
Handling project complexity (55%) and collaboration
with competitors (50%) are less of a challenge. While
not a problem for all, “missing skills or untrained
workforce” seems to be a major challenge for some
companies (25% say it is very challenging – more than
any other category).
ExHIBIT 25: Business/Organizational challenges for Industrial Analytics
Missing skills or untrained workforce
Overlapping tasks within departments
Collaboration with partners
Difficulty in building the business case
Handling project complexity
Collaboration with competitors 3%
28%
34%
22%
26%
25%
16%
41%
31%
41%
31%
28%
39% 19%
19%
9% 47%
13%
19% 9%
34%
25%
13%
9%
19%
I don't knowSomewhat challenging It is not a problemVery challenging Challenging
Question: How challenging are the following issues within your Industrial Data Analytics projects?

49© 2016 IoT Analytics. All rights reserved.
4. INDUSTRIAL ANALYTICS: MAKING IT HAPPEN
4.5.2 Technical challenges
In terms of technical challenges, the picture is a
lot more diverse. The biggest challenge is clearly
the interoperability between different system
components of the overall data analytics architecture
(78%). Both data accuracy (62%) and gaining insights
from data (62%) are further challenges. Gaining data
access is clearly the least of all technical challenges
(42%).
We have the data but still struggle making sense
of mass data. For example, when a machine breaks
down on the shop floor the detailed information
of what happened is only available a few hours
later when the nightshift needs to understand
what happened earlier in the day to avoid further
downtime.
Production manager at a Food&Beverage firm
4.6 Further Leadership
Recommendations
People engaging in Data Science projects should acquire
good know-how in the topics covered in this study,
namely: The project approach, the available tools and
technology, how to align the organization, which skills
to acquire and which challenges to expect and mitigate.
The most critical success factor for Industrial
Analytics lies in the hand of management:
Implementing clearly defined data governance
mechanisms and providing guidance through an
enterprise-specific code of conduct for all data
users.
Frank Poerschmann, Board Member Digital
Analytics Association Germany e.V.
ExHIBIT 26: Technical challenges for Industrial Analytics
Security
Integration withenterprise systems
Interoperability betweensystem components
Gaining insights from the data
Data accuracy
Privacy
Data access
Technical infrastructure/tools
6%
3%
36%
6%
21%
18%
24%
44%
24%
26%
36%
29%
35%
47%
41%
42%
32%
29% 38%
6%
15%
15%
15%
15%
15%
21%
15%
42%
24%
15%
21%
24%
18%
Very challenging Somewhat challenging It is not a problem I don't knowChallenging
Question: How challenging are the following issues within your Industrial Data Analytics projects?
““
” ”

50© 2016 IoT Analytics. All rights reserved.
4. INDUSTRIAL ANALYTICS: MAKING IT HAPPEN
• Initiate a management discussion on the “role of
data in organizational decision-making” (as data-
driven and data-supported decision making puts
pressure on managers used to rely on intuition and
experience only)
2. Define strategic roles. Build data capabilities in the
organization and define ownership for developing the
competencies throughout the organization.
3. Start small. Start with single pilots and PoCs (Proof
of concept) to learn about the value, processes, and
approaches
4. Define a capability roadmap. Derive requirements
for the skills needed, technology tools, service providers
& overall data ecosystem
5. Embrace a data governance strategy. Define data
governance on the top-level and decide on a necessary
code-of-conduct for data users (internal & external)
6. Perform a support function enablement. Build
channels within procurement for high-speed activation
of external data and analytics services. Involve
progressive, data-business experienced legal advisors in
business development teams. Integrate data analytics
development in HR, run a skill assessment and develop
a capability development plan on organizational and
individual level.
Additional aspects that have not been covered in the
previous chapter are noted below:
1. Shape the digital mindset. Top-level management
commitment and incentive structures play a key role
in making fundamental changes happen. Executives
should:
• Make the broader Digital Agenda a priority for
the company, integrate relevant projects into the
corporate strategy and communicate actively
• Promote an open and agile attitude that allows
for flexibility and promotes failure as a means to
achieve the desired goal.
• Build project teams that bring together a diverse
skillset
• Invite external partners who help cut through
the complexity, bring in external experience and
missing skills.
• Promote cross-training and skill enhancement of
current employees towards “digital” and analytics
skills.
• Educate middle and top-management on the new
paradigms, limitations, chances and the risks of
data driven business
YOUR INDUSTRIAL ANALYTICS INVOLVEMENT
If you liked the Industrial Analytics Report or if you are interested in a content-related discussion on any of
the topics covered in this study, feel free to reach out to the authors at IoT Analytics, the Digital Analytics
Association, or the study sponsors.

51© 2016 IoT Analytics. All rights reserved.
5 REFERENCES
5 References
[1] Retrieved from https://hbr.org/2015/10/how-smart-connected-products-are-transforming-companies
[2] Retrieved from www.wseas.us/e-library/conferences/2012/Porto/AEBD/AEBD-18.pdf
[3] Retrieved from https://en.wikipedia.org/wiki/Business_analytics#History
[4] Retrieved from https://en.wikipedia.org/wiki/Business_analytics#History
[5] Retrieved from http://iianalytics.com/research/a-brief-history-of-big-data-analytics
[6] Retrieved from https://www.bcgperspectives.com/content/articles/technology-business-transformation-
engineered-products-infrastructure-man-machine-industry-4/
[7] Retrieved from https://en.wikipedia.org/wiki/Business_analytics#History. (n.d.).

52© 2016 IoT Analytics. All rights reserved.
6. APPENDIX
6 Appendix
6.1 Methodology of the Study
6.1.1 General
The study was conducted between April to August 2016.
Its content is made up of four parts
1. General research from books, publications, and
the internet
2. Results of recent research performed by IoT
Analytics on the topics of Industry 4.0, IoT and
Analytics
3. Results from 8 industry expert interviews who
provided deep insights into the area of Industrial
Analytics
4. Results from an industry survey of 151 industrial
decision makers
All content was reviewed and approved by the Industrial
Analytics Steering Committee of the Digital Analytics
Association Germany.
6.1.2 Survey
The survey presented in this study polled the opinion
of 151 business executives in the area of Industrial
Analytics. 20 individual questions were displayed with
varying degrees of detail. Please find below detailed
information on the survey participants:
ExHIBIT 27: Question: What type of organization do you represent? N=151

53© 2016 IoT Analytics. All rights reserved.
6. APPENDIX
ExHIBIT 28: Question: In which sectors is your company mainly active?
ExHIBIT 29: What is the size of your company / organization? – Number of employees

54© 2016 IoT Analytics. All rights reserved.
6. APPENDIX
ExHIBIT 30: Question: What best describes your current position in your company?
ExHIBIT 31: Question: In which department do you work?

55© 2016 IoT Analytics. All rights reserved.
6. APPENDIX
ExHIBIT 32: Question: Where are you based?

56© 2016 IoT Analytics. All rights reserved.
6. APPENDIX
6.3 About IoT Analytics
IoT Analytics is the leading provider of market insights
and industry intelligence for the Internet of Things. More
than 30,000 IoT decision makers rely on IoT Analytics‘
data-driven market research every month. IoT Analytics
tracks important data around the IoT ecosystem such
as M&A activity, startup funding, job developments,
and company activity. The product portfolio includes:
1. Free insights on IoT markets and companies, 2.
Focused market reports on specific IoT segments, 3.
Go-to-market services for emerging IoT companies. IoT
Analytics is headquartered in Hamburg, Germany.
You may get directly in touch with the main author:
• Knud Lasse Lueth ([email protected])
RECENT PUBLICATIONS
IoT-Platforms Market Report
2015-2021
72-page focus report on the mar-
ket of IoT Platforms, including
market sizing, company profiles,
trends, and much more.
UPCOMING PUBLICATIONS
Predictive Maintenance Market Report 2016-2022
100-page focus report on
the market for predictive
maintenance solution,
including market sizing,
competitive landscape,
trends, and much more.
Find out more at https://iot-analytics.com
Market Report | January 2016
IOT PLATFORMS: MARKET REPORT 2015-2021Enterprise Edition
IoT Platforms have become a topic of major strategic importance for many different companies. Find out which companies are leading the fast growing IoT Platforms market, which IoT segments are accelerating and which regions will drive this exciting new field of technology.
6.2 About Digital Analytics
Association Germany e.V.
For more than 10 years the Digital Analytics Association
with its more than 5.000 members globally drives
the professionalization of data-driven professions.
As an independent, non-for-profit organization this
engagement is carried out in Europe by the “Digital
Analytics Association e.V.“
DAA e.V activities are focused on the development of
digital competencies, especially in digital-analytics and
data-science, for institutions, experts and management.
A major emphasis lies on the development and
promotion of young professionals. The services of
the DAA cover professional qualification, networking,
digital-leadership development and knowledge transfer.

57
© 2016 IoT Analytics. All rights reserved.
6.4 Special thanks
The editorial team would like to thank all of those who have been instrumental in getting this study published, namely:
• Zana Diaz Williams - IoT Analytics GmbH
• Padraig Scully - IoT Analytics GmbH
• Christina Patsioura - formerly IoT Analytics GmbH
• Zahra Zahedi Kermani - Freelance Analyst
• Michaela Tiedemann - Alexander Thamm Data Science GmbH
A special thank you goes out to all of the survey participants as well as the DAA-IA steering committee for their
guidance on the contents of this study:
• Dr. Erik Schumacher - Schumacher Management Consulting
• Alexander Thamm - Alexander Thamm Data Science GmbH
• Peter Sorowka - Cybus GmbH
• Frank Poerschmann - Digital Analytics Association e.V.

Copyright
© 2016 IoT Analytics GmbH. All rights reserved.
IoT Analytics is a leading provider of market insights and competitive
intelligence for the Internet of Things (IoT).
This document is intended for general informational purposes only,
does not take into account the reader’s specific circumstances, and may
not reflect the most current developments. IoT Analytics disclaims, to
the fullest extent permitted by applicable law, any and all liability for
the accuracy and completeness of the information in this document
and for any acts or omissions made based on such information. IoT
Analytics does not provide legal, regulatory, audit, or tax advice.
Readers are responsible for obtaining such advice from their own legal
counsel or other licensed professionals.
For more information, visit http://www.iot-analytics.com