indoor air quality assessment - oaa.on.ca air... · sel project number: 404614 september &...
TRANSCRIPT

INDOOR AIR QUALITY ASSESSMENT
Ontario Association of Architects 111 Moatfield Drive North York, Ontario
Prepared for:
Mr. David Fujiwara Architect
Main Street Studio
276 Main Street, Suite 202 Toronto, Ontario
M4C 4X5
Performed by:
Safetech Environmental Limited
Natalie Markiewicz, B.A.Sc., (OH&S)
Occupational Hygiene Technician
Reviewed by:
Michael Mitanis, B.A.Sc. (OH&S)
Occupational Hygienist
SEL Project Number 404614

Table of Contents 1.0 BACKGROUND & OBJECTIVE .......................................................................................................... 1
2.0 INTRODUCTION .................................................................................................................................. 2
2.1 HVAC SYSTEMS AND IAQ .............................................................................................................. 2 2.2 THERMAL COMFORT ....................................................................................................................... 3 2.3 SUSPENDED PARTICULATES ........................................................................................................... 3 2.4 TOTAL VOLATILE ORGANIC COMPOUNDS (TVOCS) ......................................................................... 3
3.0 INDOOR AIR QUALITY REGULATIONS, STANDARDS AND GUIDELINES ................................... 4 3.1 REGULATIONS ................................................................................................................................ 4 3.2 STANDARDS AND GUIDELINES ......................................................................................................... 5
3.2.1 ASHRAE .................................................................................................................................. 5 3.3 SUMMARY OF RECOMMENDED IAQ GUIDELINES AND EXPOSURE LIMITS ........................................... 6 3.4 SUMMARY OF EXPOSURE GUIDELINES FOR TOTAL VOLATILE ORGANIC COMPOUNDS ......................... 7
4.0 METHODOLOGY ................................................................................................................................. 9
4.1 VISUAL INSPECTION........................................................................................................................ 9 4.2 SPOT READINGS FOR THERMAL COMFORT AND IAQ PARAMETERS ................................................... 9
4.2.1 Thermal Comfort and General IAQ Parameters ...................................................................... 9 4.2.2 Suspended Particulates .......................................................................................................... 9
4.3 CONTINUOUS MONITORING FOR THERMAL COMFORT AND GENERAL IAQ PARAMETERS .................. 10
5.0 RESULTS ........................................................................................................................................... 10
5.1 VISUAL INSPECTION...................................................................................................................... 10 5.2 SPOT READINGS FOR THERMAL COMFORT AND GENERAL IAQ PARAMETERS .................................. 11 5.3 CONTINUOUS MONITORING FOR THERMAL COMFORT AND GENERAL IAQ PARAMETERS .................. 12
6.0 CONCLUSIONS & RECOMMENDATIONS ...................................................................................... 16
6.1 VISUAL INSPECTION...................................................................................................................... 16 6.2 SPOT READINGS FOR THERMAL COMFORT AND GENERAL IAQ PARAMETERS .................................. 16 6.3 CONTINUOUS MONITORING FOR THERMAL COMFORT AND GENERAL IAQ PARAMETERS .................. 17
7.0 LIMITATIONS ..................................................................................................................................... 18
Appendix I Site Photographs Appendix II Summary of Spot Measurements for Thermal Comfort and IAQ Parameters Appendix III Graphical Summaries for Thermal Comfort and IAQ Parameters

November 4th, 2014 Main Street Studio 276 Main Street, Suite 202 Toronto, Ontario M4C 4X5 Attention: Mr. David Fujiwara Architect Re: Indoor Air Quality Assessment 111 Moatfield Drive, Toronto, Ontario 1.0 BACKGROUND & OBJECTIVE From September 25th to October 2nd, 2014, Safetech Environmental Limited (SEL) personnel were on site to perform an indoor air quality (IAQ) assessment throughout the building located at 111 Moatfield Drive, Toronto, Ontario.
The IAQ assessment was performed at the request of Mr. David Fujiwara, Architect of Main Street Studio to determine indoor air quality prior to the building undergoing a major HVAC replacement project. Therefore, spot and continuous monitoring was performed throughout the 2nd and 3rd floors of the building to evaluate the quality of air. The assessment consisted of visual inspections and spot sampling and continuous monitoring for general IAQ parameters. General IAQ parameters that were measured included temperature (T), relative humidity (RH%), carbon monoxide (CO), carbon dioxide (CO2), particulates (PM10 & PM2.5) and total volatile organic compounds (TVOCs).

SEL Project Number: 404614 September & October, 2014
Indoor Air Quality Assessment 111 Moatfield Drive, Toronto, Ontario Page 2
2.0 INTRODUCTION Indoor Air Quality has emerged as a concern for commercial and institutional facilities such as office buildings and schools. The demand for energy efficiency has resulted in more tightly constructed buildings where windows cannot be opened and environmental conditions are dependant solely on mechanical ventilation. In addition, many more products are now being introduced into buildings that are composed of synthetic materials, plastics, compressed wood products, glues and varnishes, etc. Good indoor air quality includes the introduction and distribution of adequate ventilation air, control of airborne contaminants and maintenance of acceptable temperature and relative humidity. However, it is important to remember that while occupant complaints may be related to time at work, they may not necessarily be due to the quality of the air. Other factors such as noise, lighting, ergonomic stressors, and job-related psychosocial stressors can also contribute to poor IAQ complaints. As defined in ASHRAE (American Society of Heating, Refrigerating and Air-Conditioning Engineers) Standard 62.1-2013 “Ventilation for Acceptable Indoor Air Quality”, acceptable indoor air quality is “air in which there are no known contaminants at harmful concentrations as determined by cognizant authorities and with which a substantial majority (80% or more) of the people exposed do not express dissatisfaction.”
2.1 HVAC Systems and IAQ Operation and maintenance of the Heating, Ventilating and Air-Conditioning (HVAC) system plays a critical role in maintaining acceptable air quality for indoor environments. HVAC systems for buildings are designed to provide good air quality and thermal comfort at a reasonable energy cost. Failure to properly design, install, commission, operate and maintain HVAC systems may lead to IAQ complaints. Thermal comfort and ventilation needs are met by supplying “conditioned” air to occupied spaces of the building at an adequate outdoor air supply rate. IAQ complaints often arise because the quantity or distribution of outdoor air is inadequate to serve the ventilation needs of building occupants. Under conditions of inadequate outdoor air ventilation, human bioeffluents and other indoor contaminants may build up in occupied areas to levels which may affect occupant comfort or health. HVAC systems can also play a role in distributing contaminants to occupied spaces from external sources or other internal sources. HVAC systems themselves can also become a source of contamination if not properly maintained. Internal rusting, debris accumulation and deterioration of internally insulated surfaces can lead to infiltration and distribution of these contaminants into the supply air stream. Stagnant water sources can also provide locations for microbial growth. It is therefore important to

SEL Project Number: 404614 September & October, 2014
Indoor Air Quality Assessment 111 Moatfield Drive, Toronto, Ontario Page 3
properly maintain HVAC systems on a regularly scheduled basis to ensure that normal operation of the systems do not contribute to any IAQ issues.
2.2 Thermal Comfort Maintaining comfortable thermal and moisture conditions generally improves occupant perception of air quality. Good thermal comfort can be achieved only when the air temperature, humidity, and air movement are within a specified range often referred to as the “comfort zone”. Thermal comfort is typically defined as an environment in which at least 80% of normally clothed occupants engaged in sedentary or near-sedentary activities feel comfortable. Inadequate thermal comfort conditions can result in complaints from building occupants. Many studies have found an association of increased indoor air temperatures with SBS (Sick Building Syndrome) symptoms and with perceptions of worsened IAQ. Office areas that are too warm can make occupants feel tired, while temperatures that are too cool can make building occupants restless, distracted and cause their attention to drift. Low humidity is sometimes associated with mucous membrane symptoms, and increased humidity is associated with worsened perceived air quality. These problems are diminished by effective control of thermal conditions and humidity.
2.3 Suspended Particulates Airborne particulates are solid or liquid substances that are suspended in the air, and can include dusts, fumes, smoke, microorganisms, mists and fog. These particles can range widely in diameter, and can be classified as total suspended particulates (TSPs) or Respirable Suspended Particulates (RSPs), depending on their size. Generally, RSPs have a particle size below 10μm, which is an important consideration with respect to human health as small particulates within the size range of 0.1-10μm are able to penetrate into the lower thoracic and respiratory regions of the respiratory tract, thereby causing most of the negative health effects associated with exposure to particulates. Particles smaller than 0.1μm are generally too small to remain trapped in the lower respiratory tract, and are removed from the body during exhalation. Conversely, particles larger than 10μm are too large to reach the lower respiratory tract, and are filtered by the nose and other components of the upper respiratory tract. 2.4 Total Volatile Organic Compounds (TVOCs) Volatile organic compounds comprise the group of all chemicals containing carbon and hydrogen whose boiling points fall approximately within the range from 50-250°C. Although there may be thousands of chemicals that satisfy these criteria, whether they are naturally occurring or synthetic, approximately 900 of these have been identified in the indoor environment. These chemicals may be present in a variety of indoor furnishings, finishes and other building elements such as paints, solvents, adhesives,

SEL Project Number: 404614 September & October, 2014
Indoor Air Quality Assessment 111 Moatfield Drive, Toronto, Ontario Page 4
carpets, fabrics and textiles. As such, odours typically associated with a buildup of VOCs resemble those associated with the aforementioned materials (i.e. paints, solvents, etc.). Exposure to elevated airborne concentrations of VOCs may result in a range of toxicological effects, including fatigue, headaches, drowsiness, skin and eye irritation, and general discomfort. However, the wide variety of potential sources and compositions renders it impractical to measure the concentrations of each particular chemical individually. As such, the concept of total volatile organic compound (TVOC) attempts to address this practical limitation, by providing a simple measure for the aggregate of all volatile organic compounds without distinguishing between individual chemicals. 3.0 INDOOR AIR QUALITY REGULATIONS, STANDARDS AND GUIDELINES 3.1 Regulations Currently there are no provincial or federal regulations in Canada that establish “safe” exposure limits for airborne contaminants that are typically found in commercial, residential or institutional settings. For provincially regulated industrial facilities in Ontario, Regulation 833/90, “Control of Exposure to Biological or Chemical Agents” (made under the Occupational Health & Safety Act) as amended by O. Reg. 419/10 establishes permissible exposure limits for a variety of chemical contaminants. Under this regulation, the employer is required to limit the daily and weekly exposure of workers to a chemical agent to the regulated airborne exposure limit. These exposure limits are expressed as a time-weighted average (TWA), a short-term exposure limit (STEL) or a ceiling exposure limit (C). The TWA is a contaminant concentration considered acceptable for a normal 8-hour workday and a 40-hour workweek, to which nearly all workers may be repeatedly exposed, day after day, without adverse health effects. The STEL is the maximum airborne concentration of a substance to which a worker can be exposed to in any fifteen-minute period while the C is the maximum airborne concentration to which a worker can be exposed to at any time. As indicated, exposure limits provided in Ontario Regulation 833 have been developed to protect workers in manufacturing environments. They are intended to protect against the onset of specific illnesses or health effects and in many instances are not intended to protect against irritation or to limit odours. In addition, the limits are intended to protect “healthy workers”. Individuals having pre-existing medical conditions, severe allergies, chemical sensitivities and other such conditions would not be expected to work in a manufacturing environment. However, these individuals may work in non-industrial, commercial and institutional environments. For these reasons, exposure limits provided in Ontario Regulation 833 are not considered to be appropriate for use in assessing IAQ in office and institutional workplaces.

SEL Project Number: 404614 September & October, 2014
Indoor Air Quality Assessment 111 Moatfield Drive, Toronto, Ontario Page 5
3.2 Standards and Guidelines In the absence of specific legislation for non-industrial indoor environments, the “general duty clause” applies. This clause, common to all Canadian occupational health and safety legislation, states that employers are required to take every precaution reasonable in the circumstances for the protection of workers. In order to ensure that workers are adequately protected from IAQ issues arising in non-industrial facilities, several organizations have published guidelines and standards specifically for these types of environments. 3.2.1 ASHRAE Standards published by the American Society of Heating, Refrigerating and Air-Conditioning Engineers (ASHRAE) are the most widely recognized standards that provide guidance for maintaining thermal comfort and air quality in a variety of indoor environments. ASHRAE Standard 55-2013, “Thermal Environmental Conditions for Human Comfort” provides recommended ranges for thermal comfort parameters (temperature, relative humidity, air speed, etc.). The ranges provided are based on occupant activity and clothing factors and are set to satisfy the majority of occupants in the space with respect to comfort conditions. ASHRAE Standard 62.1-2013, “Ventilation for Acceptable Indoor Air Quality” (Standard 62) specifies minimum ventilation rates and indoor air quality that will be acceptable to human occupants and are intended to minimize the potential for adverse health effects. This standard considers chemical, physical, and biological contaminants that can affect air quality. In determining whether ventilation systems within buildings fall within ASHRAE Standard 62, either the Ventilation Rate Procedure or the IAQ Procedure can be used. For the purpose of this assessment, SEL has applied the IAQ Procedure to address the control of specific contaminants and the Ventilation Rate Procedure to address the general aspects of indoor air quality in the building. Using the Ventilation Rate Procedure, outdoor air intake rates are determined based on the type of space/application, occupancy level, and floor area. Minimum recommended airflow rates per person and per unit area are provided in Standard 62 based on contaminant sources and source strengths that are typical for that type of space. These two ventilation rates account for people-related contaminant sources and area-related contaminant sources. For typical office spaces, the default value for the combined outdoor air ventilation rate is 17 cfm/person. This is based on recommended minimum ventilation rates of 5 cfm/person and 0.06 cfm/ft2 and a default occupant density of 5 people/1,000 ft2.

SEL Project Number: 404614 September & October, 2014
Indoor Air Quality Assessment 111 Moatfield Drive, Toronto, Ontario Page 6
In order to provide an indication as to whether occupied areas of the building are providing the ASHRAE-recommended ventilation rates based on the default values listed above, CO2 concentrations were measured by SEL. Carbon dioxide is a natural product of human respiration. Therefore, under certain conditions, CO2 concentrations measured in indoor air, as compared to the exterior concentration, can act as a surrogate indicator of the ventilation rate. The steady-state CO2 concentration obtained based on maintaining an outdoor air flow rate of 17 cfm/person can be approximated using a simple mass balance equation. Based on the equation presented in Appendix C of Standard 62, CO2 concentrations up to approximately 600 ppm above outdoor air levels will indicate that the recommended default outdoor air ventilation rate of 17 cfm/person is being met. Therefore, based on the average measured exterior CO2 concentration of approximately 370 ppm, interior concentrations above 970 ppm may represent inadequate outdoor air ventilation rates for an occupant density of 5/1,000 ft2. Carbon dioxide concentrations above 970 ppm will provide an indication that the outdoor air ventilation rate is inadequate and that building-related and people-related contaminants released under typical conditions could build up in the work space. The IAQ Procedure determines acceptable outdoor air intake rates based on an analysis of contaminant sources, contaminant concentration targets, and perceived acceptability targets. Using this method, contaminants of concern are identified and a target concentration limit, its corresponding exposure period and an appropriate reference to a cognizant authority are specified. Compliance with these values can then be used to validate the acceptability of perceived air quality. Concentration targets used in this assessment along with the cognizant authority from which it came are summarized below in Table I. 3.3 Summary of Recommended IAQ Guidelines and Exposure Limits A summary of recommended IAQ guidelines and exposure limits for thermal comfort and ventilation are summarized below in Table I.

SEL Project Number: 404614 September & October, 2014
Indoor Air Quality Assessment 111 Moatfield Drive, Toronto, Ontario Page 7
TABLE I Summary of Recommended IAQ Guidelines and Exposure Limits
Standard, Guideline or Regulated Limit
THERMAL COMFORT PARAMETERS Temperature (ºC) Relative Humidity (%)
ASHRAE(1)
20.0-25.0°C (during the winter season @ 50% RH)a
24.0-27.0°C (during the summer season @ 50% RH)a
Max of 60% at 24.0°Ca
(No recommended Lower Limit)
Health Canada(2) --- 30-80 (summer) 30-55 (winter)b
aAcceptable levels of humidity and temperature are interdependent (based on ASHRAE 55-2010);
bUnless constrained by window condensation
Standard, Guideline or Regulated Limit VENTILATION RATES/CARBON DIOXIDE
ASHRAE(3) 970a ppm Health Canada(2) ≤3,500 ppm[L]
O.Reg 833/90(4) 5,000 ppm aBased on average measured exterior CO2 concentration of approx. 370 ppm and an outdoor air ventilation rate of 17 cfm/person.
Standard, Guideline or Regulated Limit
COMMON INDOOR AIR POLLUTANTS CO
(ppm) Suspended Particulate
(µg/m3)
O.Reg 833/90(4) 25[8hr] 100[15min]
3000c[8hr]
NAAQS/EPA(5) 9[8hr]
35[24hr] 50a[1yr]
150a[24hr]
Health Canada(2) 10[24hr] 25[1hr]
≤100b[1hr] ≤40b[L]
Numbers in brackets [ ] refer to averaging times (min=minutes; hr=hours; yr=years; L=long-term). aFor particles with a mass median aerodynamic diameter of ≤10 µm; bFor particles with a mass median aerodynamic diameter of ≤2.5 µm; cRespirable fraction for
particles not otherwise specified.
Table References: 1. ASHRAE Standard 55-2013. Thermal Environmental Conditions for Human Occupancy. 2. Health Canada. 1995. Exposure Guidelines for Residential Indoor Air Quality: A Report of the Federal-
Provincial Advisory Committee on Environmental and Occupational Health. 3. ASHRAE Standard 62.1-2013. Ventilation for Acceptable Indoor Air Quality. 4. Occupational Health and Safety Act Ontario Regulation 833. 1990. Control of Exposure to Biological or
Chemical Agents. 5. U.S. Environmental Protection Agency. 2000. Code of Federal Regulations, Title 40, Part 50. National
Ambient Air Quality Standards.
3.4 Summary of Exposure Guidelines for Total Volatile Organic Compounds Risk assessment and guideline setting for VOCs is an exceptionally difficult task because of the potential for such a large number and varied composition of organic compounds to be present in indoor air. One practical approach for providing indoor air quality guidelines for VOCs has been to use the Total VOC (TVOC) approach as a general indication of the quality of air. This approach is generalized from published toxicological studies performed to determine the health effects elicited by humans

SEL Project Number: 404614 September & October, 2014
Indoor Air Quality Assessment 111 Moatfield Drive, Toronto, Ontario Page 8
exposed to mixtures of VOCs under controlled conditions. A general TVOC guideline based on such studies is summarized in Table II.
TABLE II Summary of Exposure Guidelines for Total Volatile Organic Compounds
Concentration
Range Exposure
Range Health Effects
< 120 ppb* Comfort Range
No irritation or discomfort expected
120 to 1,200 ppb* Multifactorial
Exposure Range
Odours, irritation and discomfort may
appear in the presence of TVOC together with other thermal comfort
factors and stressors
1,200 to 10,000 ppb* Multifactorial
Discomfort Range
Further discomfort, complaints may
be expected
>10,000 ppb Demonstrated Irritation Range
Temporary discomfort and
demonstrated respiratory irritation
Source: Health Canada: “Indoor Air Quality in Office Buildings: A Technical Guide” (2007).
*Concentration ranges have been converted from mg/m3 to ppb based on the response of the monitoring unit used to the calibration gas (isobutylene), and thus should be considered approximations based on isobutylene units.
Currently, neither Ontario nor the federal government has set standards specifically for TVOC levels in industrial, commercial, institutional or residential settings. However, global consensus has resulted in the emergence of preliminary guidelines for TVOC standards for IAQ in non-industrial settings. Depending on location (home, school, etc.) recommended levels range from approximately 100 to 650 ppb isobutylene units. Health Canada guidelines indicate that a target limit of 1,000µg/m3 (approx. 400 ppb) and an action limit of 5,000µg/m3 (approx. 2000 ppb) are being discussed. Furthermore, these guidelines indicate that one may expect complaints when TVOC concentrations exceed 3,000µg/m3 (1,200 ppb).

SEL Project Number: 404614 September & October, 2014
Indoor Air Quality Assessment 111 Moatfield Drive, Toronto, Ontario Page 9
4.0 METHODOLOGY 4.1 Visual Inspection A visual walkthrough inspection of the assessment areas was performed to identify conditions present at the time of our assessment. The intent of the walkthrough inspection was to acquire an overview of occupant activities, equipment, materials and building layout to identify conditions that may impact on IAQ. Locations where photographs (P#) were taken that support our observations are provided in Appendix I. 4.2 Spot Readings for Thermal Comfort and IAQ Parameters Spot measurements for temperature, percent relative humidity, carbon dioxide, carbon monoxide, respirable suspended particulates and total volatile organic compounds were collected in representative locations of the building and were chosen by the architect, Mr. Fujiwara. Readings were retrieved for a period of approximately 30 seconds at each location. Each spot measurement represents the conditions measured at the time and locations indicated. The assessment included a total of 24 locations, plus two exterior measurements for comparison. 4.2.1 Thermal Comfort and General IAQ Parameters Measurements for temperature, percent relative humidity, CO2, CO and TVOCs were taken using a GrayWolf Advanced Sense Environmental Test Meter. This instrument allows for direct-reading of each of the above parameters via five separate sensors. The GrayWolf Advanced Sense Environmental Meter was calibrated according to manufacturer instructions, with CO2 measurements taken outside at the beginning of our assessment to ensure proper operation.
4.2.2 Suspended Particulates Airborne particulate measurements were taken using The GrayWolf PC-3016A 6-Channel Particle Counter. This device instantaneously counts particles between approximately 0.3 and 10 μm in diameter, with sampling conducted at a flow rate of 2.8 L/minute. This unit then calculates the concentration of particulate at different size ranges, including particulates less than or equal to 10 microns in diameter (i.e. PM10) and particulates less than or equal to 2.5 microns in diameter (i.e. PM2.5). The GrayWolf PC-3016A 6-Channel Particle Counter is factory calibrated to the standard ISO 21501-4 Calibration using NIST Traceable PSL Spheres, DMA and Condensation Particle Counter. A zero check was performed on site prior to use to ensure accuracy.
SEL Project Number: 404614 September & October, 2014
Indoor Air Quality Assessment 111 Moatfield Drive, Toronto, Ontario Page 10
4.3 Continuous Monitoring for Thermal Comfort and General IAQ Parameters Continuous monitoring for thermal comfort and general IAQ parameters consisted of placing two Canary IAQ Monitors and two Yes IMS IAQ Monitors in four locations of concern to continuously monitor IAQ parameters (temperature, percent relative humidity, CO2, CO, suspended particulate and TVOCs) for periods varying approximately 168 hours at each location. The two Canary IAQ monitors were placed on the 2nd Floor West side of the Atrium and 3rd Floor Room 304 (Registrar Area). The two YES IMS IAQ monitors were placed in the 3rd Floor East side of the atrium gallery and 3rd Floor Room 306 (within the ceiling cavity). Each monitoring device was programmed to record average readings for each of the above parameters every 5 minutes throughout the duration of the sampling period. At the completion of air monitoring, the information was downloaded from the instruments for interpretation. 5.0 RESULTS 5.1 Visual Inspection The locations assessed included representative areas of the 2nd and 3rd Floors. Offices and boardrooms were observed to be primarily located along the perimeter of the building with an atrium located at the south centre section. Cubicles were noted to be adjacent to the atrium. Interior building materials primarily consisted of carpet flooring, drywall walls, lay-in ceiling tiles, drywall ceilings, windows and steel beams. Moderate water damage was observed to the west upper exterior wall common to the offices located west of the atrium. Typical office furnishings, equipment and stored items were noted to be present throughout the office areas such as computers, printers, fax machines, photocopiers, engineered wood furnishings (desk, credenza, book case, etc.), personal items, paper products and other office supplies. All of these items generally appeared to be in good condition. There were no obvious odours associated with new building materials or the operation of typical office equipment noted at the time of our assessment. Overall, housekeeping practices appeared to be generally adequate. Moreover, there was no significant evidence that any materials likely to generate significant quantities of airborne contaminants were present. Work activities were primarily limited to each individual’s computer workstation, which involved speaking on the phone, typing on the computer and other related procedures. No work activities were noted to agitate the environment such that any IAQ or thermal comfort parameters would likely be altered to a significant degree. It was reported by an employee within the building that the adjacent building would conduct tests on its generator once a month (at approximately 5pm) and would detect odours potentially produced by the generator. Inspection of the exterior revealed that the fresh air intake (P1) is located on the north side (3rd floor level) facing north and downwards (the generator is located on the north side of the adjacent building, P2).
SEL Project Number: 404614 September & October, 2014
Indoor Air Quality Assessment 111 Moatfield Drive, Toronto, Ontario Page 11
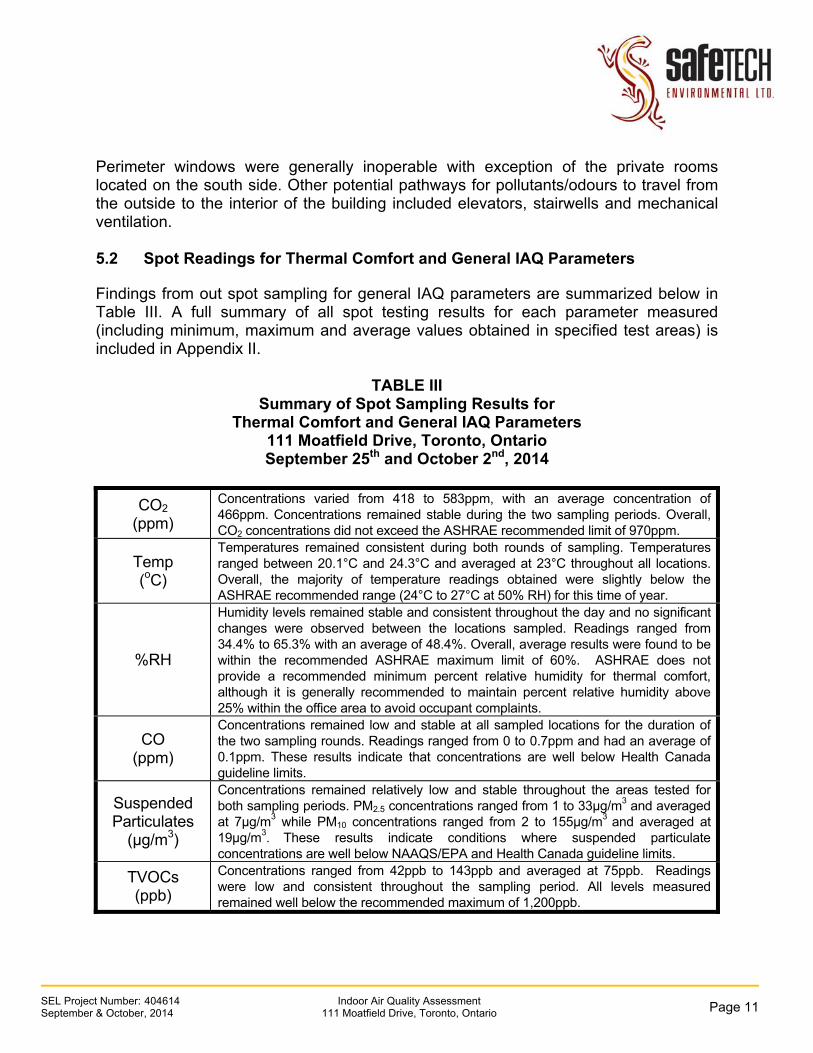
Perimeter windows were generally inoperable with exception of the private rooms located on the south side. Other potential pathways for pollutants/odours to travel from the outside to the interior of the building included elevators, stairwells and mechanical ventilation. 5.2 Spot Readings for Thermal Comfort and General IAQ Parameters Findings from out spot sampling for general IAQ parameters are summarized below in Table III. A full summary of all spot testing results for each parameter measured (including minimum, maximum and average values obtained in specified test areas) is included in Appendix II.
TABLE III
Summary of Spot Sampling Results for Thermal Comfort and General IAQ Parameters
111 Moatfield Drive, Toronto, Ontario September 25th and October 2nd, 2014
CO2
(ppm)
Concentrations varied from 418 to 583ppm, with an average concentration of 466ppm. Concentrations remained stable during the two sampling periods. Overall, CO2 concentrations did not exceed the ASHRAE recommended limit of 970ppm.
Temp (oC)
Temperatures remained consistent during both rounds of sampling. Temperatures ranged between 20.1°C and 24.3°C and averaged at 23°C throughout all locations. Overall, the majority of temperature readings obtained were slightly below the ASHRAE recommended range (24°C to 27°C at 50% RH) for this time of year.
%RH
Humidity levels remained stable and consistent throughout the day and no significant changes were observed between the locations sampled. Readings ranged from 34.4% to 65.3% with an average of 48.4%. Overall, average results were found to be within the recommended ASHRAE maximum limit of 60%. ASHRAE does not provide a recommended minimum percent relative humidity for thermal comfort, although it is generally recommended to maintain percent relative humidity above 25% within the office area to avoid occupant complaints.
CO (ppm)
Concentrations remained low and stable at all sampled locations for the duration of the two sampling rounds. Readings ranged from 0 to 0.7ppm and had an average of 0.1ppm. These results indicate that concentrations are well below Health Canada guideline limits.
Suspended Particulates
(μg/m3)
Concentrations remained relatively low and stable throughout the areas tested for both sampling periods. PM2.5 concentrations ranged from 1 to 33µg/m3 and averaged at 7µg/m3 while PM10 concentrations ranged from 2 to 155µg/m3 and averaged at 19µg/m3. These results indicate conditions where suspended particulate concentrations are well below NAAQS/EPA and Health Canada guideline limits.
TVOCs (ppb)
Concentrations ranged from 42ppb to 143ppb and averaged at 75ppb. Readings were low and consistent throughout the sampling period. All levels measured remained well below the recommended maximum of 1,200ppb.

SEL Project Number: 404614 September & October, 2014
Indoor Air Quality Assessment 111 Moatfield Drive, Toronto, Ontario Page 12
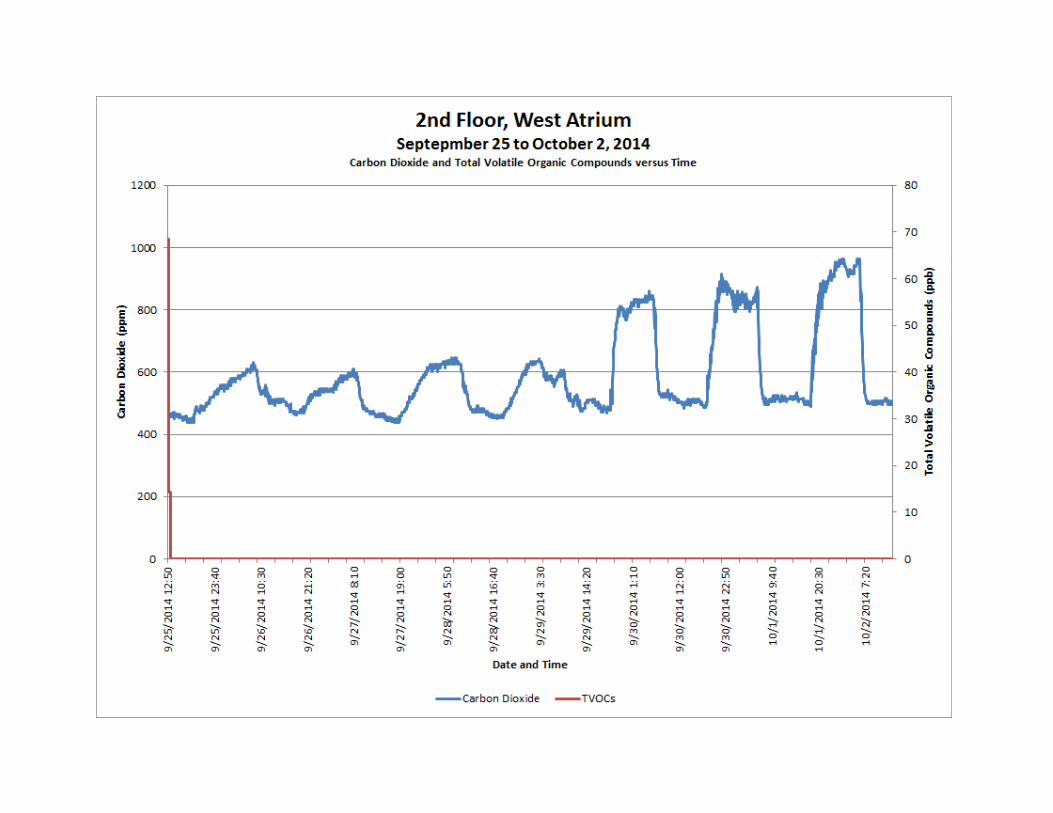
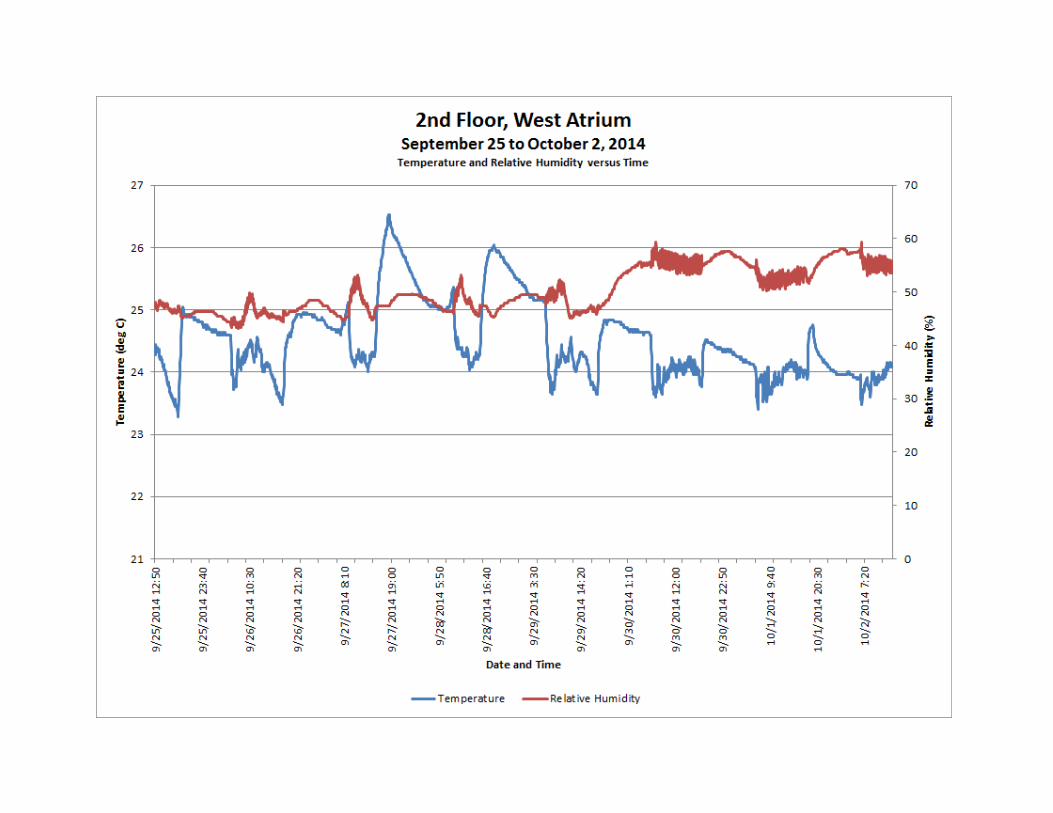
5.3 Continuous Monitoring for Thermal Comfort and General IAQ Parameters Continuous monitoring results for thermal comfort and general IAQ parameters are summarized below in Tables IV, V, VI and VII for the duration of the sampling period. Results are summarized according to the minimum, maximum and average concentrations obtained for each parameter during the sampling period from September 25th to October 2nd, 2014. Results for the entire sampling period are also summarized graphically in Appendix III for illustrative purposes.
TABLE IV Summary of Continuous Monitoring Results for Thermal Comfort and General IAQ Parameters
111 Moatfield Drive, Toronto, Ontario
2nd Floor West Atrium September 25th to October 2nd, 2014
Parameter (units) Min. Max. Avg. General Observations
Temp. (ºC)
23.3 26.5 24.5
Temperature readings were found to be stable for the duration of the work week. Average readings were
found to primarily remain in the 24ºC range during the 7am to 5pm timeframe. Average temperature levels were within the ASHRAE recommended minimum of 24°C and maximum of 27°C for the cooling season.
RH (%)
43.1 59.4 50.3
RH levels varied slightly with an increase as the week progressed. Levels generally remained between 55 to
60% during the monitoring period. Overall, %RH readings were below the maximum limit of 60%
recommended by ASHRAE. ASHRAE does not provide a minimum percent relative humidity for thermal
comfort, although it is generally recommended to maintain percent relative humidity above 25% within
the office area to avoid occupant complaints.
CO2 (ppm)
438 963 586
CO2 concentrations were found to increase during the evening hours with lower concentrations (maximum of 600ppm) the first week (September 25th to 29th) and
began to increase slightly to a maximum of 810-960ppm on September 30 to October 2. Day time concentrations were found to be primarily in the
500ppm range. Average CO2 concentrations were well within the ASHRAE recommended guideline limit of
970ppm; however, readings were found to be approaching the limit on the last two days of
monitoring.
CO (ppm)
0.3 2.4 1 Concentrations remained low throughout the sample
period. Average CO concentrations were well within the Health Canada guideline limit.

SEL Project Number: 404614 September & October, 2014
Indoor Air Quality Assessment 111 Moatfield Drive, Toronto, Ontario Page 13
2nd Floor West Atrium September 25th to October 2nd, 2014
Parameter (units) Min. Max. Avg. General Observations
Suspended Particulate
(ug/m3) 4 49 9
Suspended particulate concentrations were generally low with slightly higher concentrations during the last
two days of monitoring. Overall, average concentrations remained well within guideline limits.
TVOCs (ppb)
0 68 0.1 TVOC concentrations remained below 70ppb
throughout the sampling period and were generally within the comfort range.
TABLE V
Summary of Continuous Monitoring Results for Thermal Comfort and General IAQ Parameters
111 Moatfield Drive, Toronto, Ontario
3rd Floor West Atrium September 25th to October 2nd, 2014
Parameter (units) Min. Max. Avg. General Observations
Temp. (ºC)
22.8 26.7 24.4
Temperature readings were found to be stable for the duration of the work week. Average readings were
found to primarily remain in the 23-24ºC range during the 7am to 5pm timeframe. Average temperature levels
were within the ASHRAE recommended minimum of 24°C and maximum of 27°C for the cooling season.
RH (%)
37 52 43
RH levels varied slightly with an increase as the week progressed. Levels generally remained between 40 to
50% during the monitoring period. Overall, %RH readings were below the maximum limit of 60%
recommended by ASHRAE. ASHRAE does not provide a minimum percent relative humidity for thermal
comfort, although it is generally recommended to maintain percent relative humidity above 25% within
the office area to avoid occupant complaints.
CO2 (ppm)
340 990 498
CO2 concentrations were found to increase during the evening hours with lower concentrations (500-600ppm)
the first week (September 25th to 29th) and a slight increase to maximum averages of approximately
700ppm on September 30 to October 2. Day time concentrations were found to be generally in the
400ppm range. Average CO2 concentrations were well within the ASHRAE recommended guideline limit of
970ppm during time hours.
CO (ppm)
0 4.5 0
Concentrations remained either low or undetected throughout the sample period. Average CO
concentrations were well within the Health Canada guideline limit.
SEL Project Number: 404614 September & October, 2014
Indoor Air Quality Assessment 111 Moatfield Drive, Toronto, Ontario Page 14
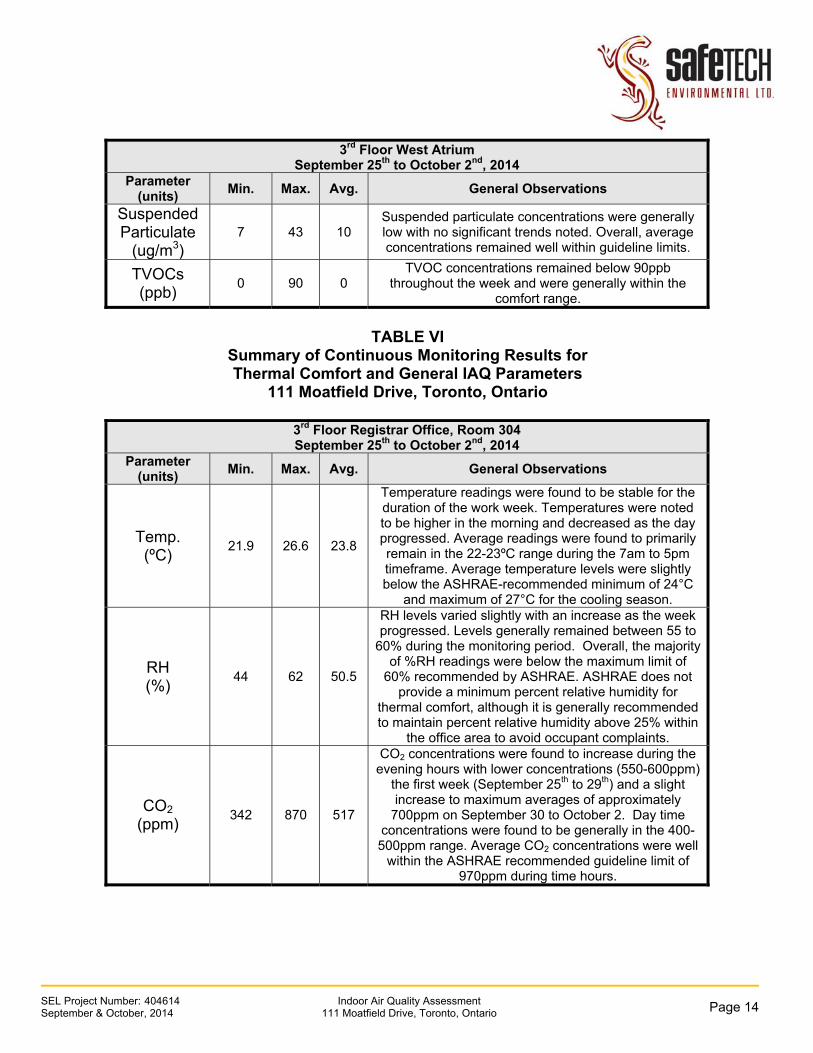
3rd Floor West Atrium September 25th to October 2nd, 2014
Parameter (units) Min. Max. Avg. General Observations
Suspended Particulate
(ug/m3) 7 43 10
Suspended particulate concentrations were generally low with no significant trends noted. Overall, average concentrations remained well within guideline limits.
TVOCs (ppb)
0 90 0 TVOC concentrations remained below 90ppb
throughout the week and were generally within the comfort range.
TABLE VI
Summary of Continuous Monitoring Results for Thermal Comfort and General IAQ Parameters
111 Moatfield Drive, Toronto, Ontario
3rd Floor Registrar Office, Room 304 September 25th to October 2nd, 2014
Parameter (units) Min. Max. Avg. General Observations
Temp. (ºC)
21.9 26.6 23.8
Temperature readings were found to be stable for the duration of the work week. Temperatures were noted to be higher in the morning and decreased as the day progressed. Average readings were found to primarily remain in the 22-23ºC range during the 7am to 5pm timeframe. Average temperature levels were slightly below the ASHRAE-recommended minimum of 24°C
and maximum of 27°C for the cooling season.
RH (%)
44 62 50.5
RH levels varied slightly with an increase as the week progressed. Levels generally remained between 55 to
60% during the monitoring period. Overall, the majority of %RH readings were below the maximum limit of
60% recommended by ASHRAE. ASHRAE does not provide a minimum percent relative humidity for
thermal comfort, although it is generally recommended to maintain percent relative humidity above 25% within
the office area to avoid occupant complaints.
CO2 (ppm)
342 870 517
CO2 concentrations were found to increase during the evening hours with lower concentrations (550-600ppm)
the first week (September 25th to 29th) and a slight increase to maximum averages of approximately
700ppm on September 30 to October 2. Day time concentrations were found to be generally in the 400-500ppm range. Average CO2 concentrations were well
within the ASHRAE recommended guideline limit of 970ppm during time hours.
SEL Project Number: 404614 September & October, 2014
Indoor Air Quality Assessment 111 Moatfield Drive, Toronto, Ontario Page 15
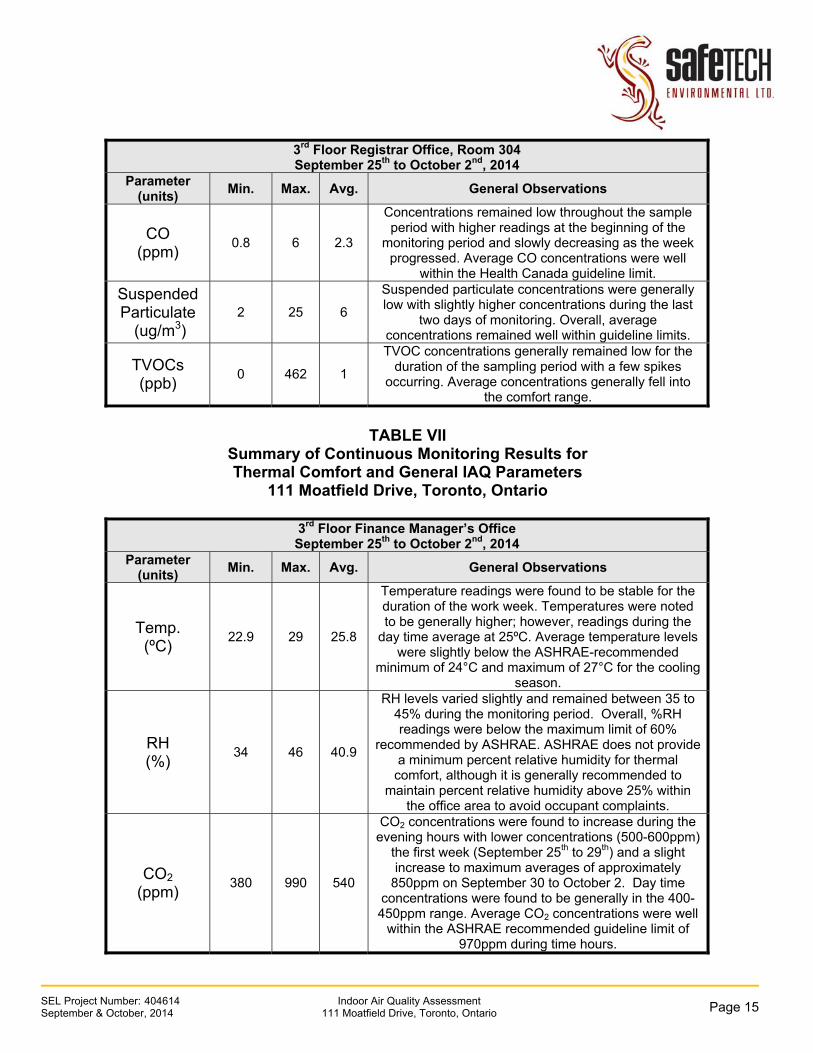
3rd Floor Registrar Office, Room 304 September 25th to October 2nd, 2014
Parameter (units) Min. Max. Avg. General Observations
CO (ppm)
0.8 6 2.3
Concentrations remained low throughout the sample period with higher readings at the beginning of the
monitoring period and slowly decreasing as the week progressed. Average CO concentrations were well
within the Health Canada guideline limit.
Suspended Particulate
(ug/m3) 2 25 6
Suspended particulate concentrations were generally low with slightly higher concentrations during the last
two days of monitoring. Overall, average concentrations remained well within guideline limits.
TVOCs (ppb)
0 462 1
TVOC concentrations generally remained low for the duration of the sampling period with a few spikes
occurring. Average concentrations generally fell into the comfort range.
TABLE VII
Summary of Continuous Monitoring Results for Thermal Comfort and General IAQ Parameters
111 Moatfield Drive, Toronto, Ontario
3rd Floor Finance Manager’s Office September 25th to October 2nd, 2014
Parameter (units) Min. Max. Avg. General Observations
Temp. (ºC)
22.9 29 25.8
Temperature readings were found to be stable for the duration of the work week. Temperatures were noted to be generally higher; however, readings during the
day time average at 25ºC. Average temperature levels were slightly below the ASHRAE-recommended
minimum of 24°C and maximum of 27°C for the cooling season.
RH (%)
34 46 40.9
RH levels varied slightly and remained between 35 to 45% during the monitoring period. Overall, %RH readings were below the maximum limit of 60%
recommended by ASHRAE. ASHRAE does not provide a minimum percent relative humidity for thermal
comfort, although it is generally recommended to maintain percent relative humidity above 25% within
the office area to avoid occupant complaints.
CO2 (ppm)
380 990 540
CO2 concentrations were found to increase during the evening hours with lower concentrations (500-600ppm)
the first week (September 25th to 29th) and a slight increase to maximum averages of approximately
850ppm on September 30 to October 2. Day time concentrations were found to be generally in the 400-450ppm range. Average CO2 concentrations were well
within the ASHRAE recommended guideline limit of 970ppm during time hours.

SEL Project Number: 404614 September & October, 2014
Indoor Air Quality Assessment 111 Moatfield Drive, Toronto, Ontario Page 16
3rd Floor Finance Manager’s Office September 25th to October 2nd, 2014
Parameter (units) Min. Max. Avg. General Observations
CO (ppm)
0 6 0
Concentrations remained low or undetected throughout the sample period with higher readings at the beginning of the monitoring period and slowly
decreasing as the week progressed. Average CO concentrations were well within the Health Canada
guideline limit. Suspended Particulate
(ug/m3) 7 37 10
Suspended particulate concentrations were generally low with no significant trends noted. Overall, average concentrations remained well within guideline limits.
TVOCs (ppb)
0 0 0 TVOC concentrations remained undetected for the
duration of the monitoring period and therefore fell into the comfort range.
6.0 CONCLUSIONS & RECOMMENDATIONS 6.1 Visual Inspection Our walkthrough inspection did not reveal any obvious significant deficiencies within the inspected areas that would be expected to result in a major reduction in air quality or serve as a source of odours/contaminants. In general, the building appeared to be free from significant dust accumulation indicating that housekeeping activities are adequate. In addition, no obvious visible mould growth was identified; however, one location was observed to exhibit water damage on the third floor west of the atrium gallery. 6.2 Spot Readings for Thermal Comfort and General IAQ Parameters Carbon dioxide concentrations measured throughout the building did not exceed the ASHRAE-recommended limit of 970ppm during the two sampling rounds. Therefore, adequate ventilation is being introduced into the building and there should not be a buildup of contaminants within these areas. Results of spot sampling for temperature were found to be slightly below the ASHRAE-recommended comfort zone (24.0°C to 27°C at 50%RH during the cooling season); however, occupants should still feel comfortable with respect to temperature within the designated areas assessed. Readings for relative humidity were generally found to be below the ASHRAE-recommended maximum of 60%RH. Therefore, occupants should feel comfortable with respect to relative humidity levels.

SEL Project Number: 404614 September & October, 2014
Indoor Air Quality Assessment 111 Moatfield Drive, Toronto, Ontario Page 17
Carbon monoxide concentrations remained low during the sampling period and therefore were found to be within currently recommended IAQ guidelines and should not pose any health concerns to occupants. Suspended particulate concentrations remained relatively low during both sampling rounds and were found to be within currently recommended IAQ guidelines, indicating acceptable conditions for occupants that should not result in any health or comfort concerns. TVOC concentrations measured throughout the building were found to be generally low and primarily remained below 150ppb and generally fell into the comfort range (see Table II), where no irritation or discomfort would be expected. Therefore, based on these results, occupants should not experience any discomfort or health concerns with respect to TVOCs. 6.3 Continuous Monitoring for Thermal Comfort and General IAQ Parameters Results of continuous monitoring within the four locations monitored (2nd Floor West atrium, 3rd Floor East Atrium Gallery, 3rd Floor Room 304 and 3rd Floor 306 (ceiling cavity) indicated similar results for the majority of all IAQ parameters measured. Measurements for CO2 and temperatures found to be were higher during the evening hours in all locations in comparison to daytime hours suggesting that the HVAC unit serving the areas is possibly turned off or fresh air dampers are closed. Daytime CO2 concentrations were found to be generally in the 400-500ppm range while evening CO2 concentrations were found to be higher (concentrations ranged from 500-600ppm the first week and increased slightly the second week with concentrations ranging from 700-900ppm). Overall, the average CO2 values obtained over the entire sampling period and occupied period were below the maximum limit recommended by ASHRAE, indicating that the areas assessed were receiving adequate fresh outdoor air to satisfy the ASHRAE-recommended ventilation rate. Measurements for temperature were stable and were typically lower during the workday with readings slightly below or borderline to the recommended minimum temperature of 24°C. Temperatures typically averaged at 22.8°C within Room 304, 23-24°C within the 3rd Floor East Atrium Gallery, 24°C within the 2nd Floor West Atrium Area and 25°C within the ceiling cavity of Room 306. Preferences with respect to temperature, which may deviate slightly from the existing environment, may be addressed by encouraging occupants to modify their personal clothing as needed. Measurements for relative humidity indicated stable conditions below the maximum limit of 60% recommended by ASHRAE with reading averages ranged between 35% and 60%. It is generally recommended that percent relative humidity be maintained above

SEL Project Number: 404614 September & October, 2014
Indoor Air Quality Assessment 111 Moatfield Drive, Toronto, Ontario Page 18
25% in order to avoid occupant complaints. Therefore, occupants should not experience comfort concerns at the levels measured. Overall, CO concentrations remained low and well within recommended IAQ guidelines and exposure standards throughout the sampling period at each monitoring location. Therefore, based on the overall low readings, occupants should not experience comfort concerns or adverse health effects at the levels measured. Suspended particulate concentrations at each monitoring location were observed to be low overall; with some minor short-term peaks. Concentrations were found to be within acceptable IAQ guideline limits and should not pose a health concern to occupants. Concentrations for TVOCs were determined to be either low or undetected and averages fell into the comfort exposure range. Overall, continuous monitoring for TVOCs in all four locations indicated levels well below the recommended maximum limit of 1,200ppb. Therefore, the majority of occupants would not be expected to experience health/comfort-related concerns with respect to TVOC exposure at the levels measured. 7.0 LIMITATIONS The information and recommendations detailed in this report were carried out by trained professional and technical staff in accordance with generally accepted environmental and industrial hygiene work practices and procedures. Recommendations made in this report have been made in the context of existing industry accepted guidelines, which were in place at the date of this report. In preparing this report, Safetech Environmental Limited (SEL) relied on information supplied by others. Except as expressly set-out in this report, SEL has not made any independent verification of such information. The collection of samples at the site was consistent with the scope of work agreed-upon with the person or entity to whom this report is addressed and the information obtained concerning prior site investigations. As conditions between samples may vary, the potential remains for the presence of unknown additional contaminants for which there were no known indicators. Conclusions are based on site conditions at the time of inspection and can only be extrapolated to an undefined limited area around inspected locations. The extent of the limited area depends on building construction and conditions. SEL cannot warrant against undiscovered environmental liabilities. If any information becomes available that differs from the findings in this report, we request that we be notified immediately to reassess the conclusions provided herein.

SEL Project Number: 404614 September & October, 2014
Indoor Air Quality Assessment 111 Moatfield Drive, Toronto, Ontario Page 19
This report has been prepared for the sole use of the person or entity to who it is addressed. No other person or entity is entitled to use or rely upon this report without the express written consent of Safetech Environmental Limited and the person or entity to who it is addressed. Any use that a third party makes of this report, or any reliance based on conclusions and recommendations made, are the responsibility of such third parties. SEL accepts no responsibility for damages suffered by third parties as a result of actions based on this report.

APPENDIX I Site Photographs

P1 View of the location of the fresh air intake.
P2 View of the adjacent building with generator.

APPENDIX II Summary of Spot Measurements for Thermal Comfort and IAQ Parameters

Summary of Spot Measurements for Thermal Comfort and General IAQ Parameters
Loc. # Floor Location TVOCs (ppb)
CO2 (ppm)
CO (ppm)
Temp (°C) RH (%) PM2.5
(ug/m3)PM10
(ug/m3)49 463 0 23.7 42.3 2 19133 440 0 20.4 63.7 9 4548 457 0 23.7 43.3 2 14126 418 0.3 21 62.6 9 2749 454 0 23.2 43.3 2 15121 427 0.4 21.1 61.9 9 3546 461 0 23.3 43.7 3 7117 443 0.6 21.5 61.3 10 2142 459 0 23.4 43.5 2 8116 425 0.6 22 59.4 9 2751 452 0 23.7 42.3 2 5143 436 0 20.1 65.3 31 7045 454 0 23.5 43.4 3 5100 461 0.7 23 53.4 10 1645 447 0 23.5 44.3 33 155103 436 0.7 23 54.2 10 3042 499 0 23.1 42.6 2 1595 470 0.7 22.5 49.5 12 4342 480 0 22.7 34.7 2 968 491 0.1 22.9 34.4 5 846 505 0 23.7 43.9 2 880 583 0 23.8 53.8 10 1442 467 0 23.1 43.6 1 381 532 0 24 52.1 9 2451 464 0 23.3 42.9 2 880 498 0.2 23.6 51.1 10 2156 458 0 23.3 43.9 2 575 482 0 22.8 52.1 10 1486 477 0 23.2 45.2 2 1588 504 0.1 23 53.6 9 15105 472 0 23.1 47.6 3 489 487 0.2 22.9 53.7 9 1968 427 0 23.2 45.4 2 486 462 0.1 23 52.1 10 1262 448 0 23.4 43.8 2 1181 452 0.1 23.2 49 11 2260 427 0 23.2 42.2 2 880 469 0.1 22.8 49.1 11 1556 453 0 23.2 43.2 2 382 516 0 23.1 51.1 10 1245 493 0 24.3 40.7 3 1180 508 0.2 23.5 51.5 8 2070 426 0 23 44.3 2 983 459 0.2 23 50.8 9 22
16 3 Room 304
17
12
14
3Mechanical Room,
Room 332
13 3 North Bridge
3Room 330, Printer
Room
15 3Room 302, Meeting
Area
Atrium North
2 2 Atrium South
Atrium West Cubicles
21
23
4 2Lounge, Southeast
Corner
5 2 Kitchen
Reception
Room 204, Meeting Room
8 2 Room 205, Boardroom
27
6 2
Room 216, Northwest Corner
10 2Room 217, Server
Room
11 3Room 331, Boiler
Room
9 2
3Room 312, Southeast
Office
18 3 Room 317
19 3 Room 322
20 3 Room 327
21 3Room 328, Staff
Lounge
22 3Room 339a, Cubicle Station 3, Southeast
SEL Project #404614 IAQ Assessment ‐ 111 Moatfield Drive, Toronto, OntarioSept and Oct 2014
Page 1

Summary of Spot Measurements for Thermal Comfort and General IAQ Parameters
Loc. # Floor Location TVOCs (ppb)
CO2 (ppm)
CO (ppm)
Temp (°C) RH (%) PM2.5
(ug/m3)PM10
(ug/m3)66 437 0 23.4 42.8 2 481 475 0 23.1 48.5 11 1665 448 0 23.3 43.7 2 285 461 0 23.2 50.8 9 1225 400 0 22.4 46.1 5 25179 372 0 17.8 77.7 5 26
42 418 0 20.1 34.4 1 2143 583 0.7 24.3 65.3 33 15575 466 0.1 23 48.4 7 19
23 3Room 342a, Cubicle
station 2
24 3 South Bridge
Average
25 0 Exterior
MinimumMaximum
SEL Project #404614 IAQ Assessment ‐ 111 Moatfield Drive, Toronto, OntarioSept and Oct 2014
Page 2

APPENDIX III Graphical Summaries for Thermal Comfort and IAQ Parameters