indonesia madiun river urgent flood control project madiun river urgent flood control project report...
TRANSCRIPT

Indonesia
Madiun River Urgent Flood Control Project
Report date:October, 2002
Field Survey:August, 2001
1.Project Profile and Japan’s ODA Loan
Location Map of the Project Madiun River (improved river section)
1.1 Background
The Project area is situated in the Solo River basin. The Solo River is one of the longest rivers in Java Island, and the basin is home to the largest granary area in the island. This region has a high population density and advanced agricultural development. Past efforts at flood control, such as construction of Wonogiri dam, were particularly important, since frequent floods had damaged the areas along the main and tributary streams of the river.
The Madiun River is the largest tributary of the Solo River. It has a flow capacity of 320 – 1,200 m3/sec (800 m3/sec on average), and since it runs through steep valleys, is vulnerable to flooding after heavy rains. The Madiun River basin, including Madiun City, with a population of 186,000 in 1998, suffered flooding damage seven times in the 10 years before project appraisal in 1984. Frequent floodings had seriously damaged agricultural and civil life in the river basin area. This Project was expected to mitigate flood damage by improving controls on the Madiun River, and was to be implemented as early as possible.
1.2 Objectives
To mitigate flood damage by means of river improvement works on the Madiun River in East Java Province, based on a five (5) year return period1) flood control plan.
1.3 Project Scope
1) Civil Works for River Improvement
Excavation / Embankment / Disposal of excavated material / Revetment / Construction of a bridge and gate / Modification works, consisting of three packages, detailed below:
1 1) A magnitude of around 1,500 m3/sec in Maximum Flood Discharge.

(i) Package 1 : Kwadungan – Patihan (±14 km), covering Madiun River and Jerowan River
…excavation, dyke, bridge, drainage, river system structure
(ii) Package 2 : Patihan – Kali Catur (±8 km), covering Madiun River, Jerowan River, Gandong River and Catur River
…excavation, dyke, heightening of bridge, drainage, river system structure
(iii) Package 3 : Kwadungan – Patihan (±13 km), covering Madiun River …excavation, river system structure
2) Consulting Services
Review of detailed design / Support of tender evaluation / Construction supervision
Figure 1 : Project Map
Kali Catur
Patihan
Kuwadungan
※
Package 1A and Package 2A were incorporated as additional works after projectappraisal, bringing the total to five packages in all (Packages 1, 2, 3, 1A and 2A). TheScope of Works and the reasons for modifications are stated in 2.2.1.
2

1.4 Borrower / Executing Agency
The Government of the Republic of Indonesia / Directorate General of Water Resources (DGWR), Ministry of Settlements and Regional Infrastructure
1.5 Outline of Loan Agreement
Loan Amount Loan Disbursed Amount
6,400 million yen 5,936 million yen
Exchange of Notes Loan Agreement
July, 1984 February, 1985
Terms and Conditions -Interest Rate -Repayment Period (Grace Period) -Procurement
3.5% p.a.
30 years (10 years) General Untied
Final Disbursement Date July, 1995
3

2.Results and Evaluation
2.1 Relevance
The Project objective is to mitigate flood damage by means of improvement works. This urgent issue was addressed in the Master Plan of Bengawan Solo River Area Development2), and the project is still relevant under the current vision for flood control, as reviewed in the CDMP3) Study, the authorized master plan for regional and water resources development pertaining to the river basin. The project was realized in order to protect the Madiun City area, which is situated in the middle reaches of the Madiun River, from chronic flooding. According to the CDMP study, subsequent project stages -- specifically, Phase II and Phase III, covering the lower reaches -- are to be implemented to enhance flood control capability and to improve regional safety equitably.
2.2 Efficiency
2.2.1 Project Scope
There were two additional packages, Package 1A and Package 2A, incorporated after the commencement of the project, to cope with serious riverbed degradation. These packages were unforeseeable at the time of project appraisal4).
<Package 1A>
Construction of a shortcut and extension of the flood control works in the Kwadungan area, covering Madiun River, Uneng River and Gurdo River.
<Package 2A>
River training in the main stream of the Madiun river and dam modification works in the upper reaches, up to the Ponorogo area.
As a result, the Project’s actual work volume was revised/modified, as seen in “Comparison of Original and Actual Scope”. The major revisions or modifications are as follows:
a) Additional revetment work items, i.e., Wet masonry, Groundsill, Parapet Wall.
b) Increased number of new bridges and gates.
c) Increased number of intake dam modification sites, from 0 to 8 places.
2) Source: URAIAN SINGKAT PERBAIKAN DAN PENGATURAN SUNGAI KALI MADIUN (Brief Description of Madiun River Improvement & Management Project) 3) The CDMP (Comprehensive Development Master Plan) for Bengawan Solo River Basin was carried out in 2000. The six major requirements of the plan were: 1) Water Resources Development for Equitable Regional Development, 2) Watershed Management, 3) Water Quality Management, 4) Water Allocation Management for Diversifying Water Demand, 5) Flood Control Management, and 6) Inter-regional Management for Water Users.
4
4) “Riverbed Movement Study” was undertaken in the mid-construction stage in April 1991 to analyze riverbed degradation in the stretch along Madiun City that had been identified in the detailed design and construction stages. The study concluded that the riverbed degradation might have been caused by the over-extraction of riverbed material. A preliminary study of countermeasures was conducted in October, 1992. The study proposed restricting sand and gravel extraction along the Madiun River, conserving the river channel, implementing protection works for river structures, and modifying eight existing small irrigation dams, including the Dam Jati.

d) Additional man-months of the consulting service, from 351 M/M to 1,242 M/M in total.
a) and b) were implemented as a result of additional Package 1A, c) resulted from Package 2A and d) covers all packages. These revisions/modifications are considered relevant, since they are in line with the project’s objective.
2.2.2 Implementation Schedule
The Project was completed in July, 1995, delayed about five years from the original schedule, mainly due to the additional packages. Major reasons for the delay are as follows:
a) Extension of the construction period.
b) Additional land acquisition for the construction requirement of Packages 1A and 2A.
c) Shortage or late distribution of governmental funds to compensate those who resettled.
2.2.3 Project Cost
The total project cost was 10,298 million yen, which is less than the original estimate, 12,609 million yen. The actual foreign currency portion financed by Japan’s ODA loan was 5,936 million yen, less than estimate of the 6,400 million yen, despite the fact that two additional packages were incorporated into the total. On the other hand, the local currency portion, financed by the Indonesian government, was 48,705 million Rp., compared with the estimate of the 26,200 million Rp. This represented a 85% cost overrun and it was caused by a rise in prices resulting from the construction delays and by the additional cost of Packages 1A and 2A (including the increase of land acquisition area5)). The government paid the excess of local currency, but payment was delayed.
5
5) The original land acquisition cost was estimated at 8,887 million Rp., while the actual was 18,647 million Rp.

2.3 Effectiveness
2.3.1 Mitigation of Flood Damage
Figure 2 illustrates the record of flooding in the project area, covering Madiun (including Jerowan area) and Ngawi, specifically Maximum Flood Discharge (MFD) (m3/sec) and flood area (ha). The data for MFD are arranged in order of magnitude; the corresponding data for flood area are indicated for each year. In general, the bigger the MFD, the larger the flood area, although 1968 represents a significant exception.
As the figure shows, the area subjected to flooding decreased after project completion in 1995. For instance, flood magnitude in 1998 was 900 m3/sec of MFD, of greater magnitude than a 2 year return-period flood, but the flooded area was only 1,000 ha at that time. When floods of the same magnitude occurred before the project (e.g. 1966, 1978, 1984 or 1989), there was flooding over as much as 12,000 ha.
Figure 2 : Flood Record
1994
Source : PBS
10,572
13681,000
8,000
9,900
12,000
3,400
4,716
1,500
2,900
14,000
6331,300
5,200
2,700
0
1,895
0
1,6801,200
2,200
4,380
1,383
0
2,851
1,091
1000
900850830
800790790770750750720708700680680650646630627605
570550545535
0
2,000
4,000
6,000
8,000
10,000
12,000
14,000
16,000
1989
1999
1998
1984
1978
1966
1975
1985
1979
1963
1968
1992
1976
1990
1973
1995
1987
1996
1982
1991
1986
1980
1981
1997
0
200
400
600
800
1,000
1,200
1,400
2-years return period
5-years return period
After Completion of the Project
Maximum Flood Discharge (m3/sec) Flood Area (Ha)
Note 1) Flood area is within Madiun and Ngawi.
2) The MFD in 1999 is a estimated value based on the memory of PBS staff in Madiun.
In light of these data, the project dramatically contributes to mitigating flood damage. Some areas are still likely to be inundated due to insufficient flood control at its tributaries, which is out of the project scope, when the flood magnitude is larger than a 2-year return period flood, as in 1998 and 1999.
Figure 3 illustrates flooding hazard areas of before and after project. It is found that the chronic inundation area was significantly decreased. Madiun city has been protected from flooding as a result of the project, while some areas (Ngawi city and Ponorogo city),
6

which do not have sufficient river improvement at its tributaries, are still at risk of being inundated.
Figure 3 : Flooding Hazard Area Map
<Before Project> <After Project>
Source: PBS Note: Hazard area is illustrated in color.
7

2.3.2 Assessment by beneficiaries---Results of Interview Survey6)---
To confirm the effects of the project and to gain greater insight into its impact, the evaluation mission conducted an Interview Survey of beneficiaries. Figure 4 illustrates responses reflecting the beneficiaries’ flood experience before and after the project. The two horizontal axes in the 3-D graph indicate the height of flood inundation (cm) and the length of the inundation (days), while the vertical axis shows the percentage of effective responses.
Figure 4 : Beneficiaries’ experience of flooding 7) 8)
N=100 After Project Before Project
Note: 43 of 100 respondents did notexperience flooding or did notremember the degree of damage
Note: 29 of 100 respondents did notexperience flooding or did notremember the degree of damage
< July 1989>
��������������������������������������������������������������������������������������������������������������������������������������������������������������������������������������������������������������������������������������������������������������������������������������������������������������������������������������������������������������������������������������������������������������������������������������������������������������������������������������������������������������������������������������1
days
2 days
3 days
4 days
5 days
-50cm
50-75cm
75-100cm
12.0%
38.0%
3.0%2.0%
2.0%0%
10%
20%
30%
40%
50%
�������������������������������������������������������������������������������������������������������������������������������������������������������������������������������������������������������������������������������������������������������������������������������������������������������������������������������������������������������������������������������������������������������������������������������������������������������������������������������������������������������������������������������1
days
2 days
3 days
4 days
5 days
-50cm
50-75cm
75-100cm
1.0%10.0%
42.0%
16.0%2.0%0%
10%
20%
30%
40%
50%
<January 1999 >
Flood magnitude in July 1989 was 1,091 m3/sec., covering an area of 10,572 ha; in January 1999, the respective figures were 1,000 m3/sec.9 and 1,368 ha. The magnitude of these floods was roughly the same, but the area flooded decreased substantially after the project. Survey respondents reported that, prior to the projects, they typically suffered inundation for more than three days at depths up to 100 cm. After the project, however, flooding lasted less than three days, and flooding depths fell below 75 cm. From these data, it can be concluded that flooding damage has been reduced.
6) A questionnaire-based Interview Survey of beneficiaries was carried out during the field survey in order to examine the project effect/impact. A hundred (100) interviewees were randomly selected in Madiun and Ngawi. The major interview items in the questionnaire were: 1) Suffering record and people’s assessment in terms of security, sanitation and socio-economical benefit, 2) Impact/indirect effect of the project, 3)Further requests.
7) July falls in the midst of the dry season in Indonesia, but the July 1989 flood was officially recorded. 8) In March 1994 the project was under implementation. 9) According to a PBS Madiun estimate.
8

Figure 5 and Figure 6 also show results of the Interview Survey; the former compares the extent of damage before and after the project and the latter shows how respondents felt regional safety improved as a result of the project.
In general, respondents said that the degree of damage was reduced by the project. Now, most of the respondents can, live without the fear of floods, whereas prior to the project worries about potential flooding made them consider relocating.
Even though this kind of comparison is based on the subjective impressions of respondents, it is helpful in understanding the effects of the project, and shows that the project contributed to improving living conditions, in terms of safety and security.
Figure 5 : Comparison of the extent of flood damage before and after the project
<Before Project (N=100)> <After Project (N=100)>
15
2
0
71
97
3
0
1
98
82
82
0
28
3
92
23
79
2
3
16
0
1
0
5
35
20
0
0
0
100
0
0
0
42
0
0
0% 10% 20% 30% 40% 50% 60% 70% 80% 90% 100%
)
,
)
c
d
)
e
Large Medium Small No Damage
98
86
0
98
99
83
46
71
100
2
14
0
2
1
17
41
29
0
0
0
0
0
0
0
11
0
0
0
0
100
0
0
0
2
0
0
0% 10% 20% 30% 40% 50% 60% 70% 80% 90% 100%
Damage to household goods, property and assets
Damege to house (washed away, etc.)
Damage to household business
Dusruption to facilities (power supply, water supply,telecommunications, etc.)
Disruption to sanitary facilities (toilets, drainage, etc.)
Disruption to road traffic
Injuries due to flood
Absenteeism (cannot go to office or school)
Dirtiness and mess in the house
Large Medium Small No Dam eag
Figure 6: An assessment of regional safety and security
87
13
0
0
100
0
0 20 40 60 80 100
So scared, andwant(ed) to moveoutside the area
Scared in case ofheavy raining, but
no need to move out
No worry at all(living without
scared)
Before the project (N=100)
After the project (N=100)
9

2.3.3 Recalculation of EIRR (Economic Internal Rate of Return)
EIRR of the current project was re-calculated using the same assumptions as at the time of appraisal. In addition, 90%10) of the originally expected benefit11) was applied and annual cost data on an actual disbursement basis was adjusted by the economic cost conversion ratio. The EIRR for 55 years’ operation was re-evaluated at 5.1%, which is slightly less than the projection of 6.1% at the time of project appraisal. This difference stems from the fact that the actual construction period was longer than originally planned, while the actual project cost stayed within the range of the original estimate. The benefit realization ratio is assumed to be 90% of the original expectation.
2.4 Impact
2.4.1 Impacts on Economy
It is difficult to make a quantitative analysis of how a project contributes to the regional economy. In this case, the Interview Survey was conducted to gain insight into its contribution. One hundred percent of those interviewed said they think the project has contributed sufficiently to the regional economy. A multiple-choice question was asked to clarify the type of contribution, the results of which are shown in Figure 7. All of the respondents said the project increased job opportunities, 94 of 100 said it improved living standards, and 43 noted improved land use. These responses are surely subjective, but they also imply that the project has had a positive impact on the regional economy.
Figure 7 : An assessment of regional safety and security (N=100, MA)
65
100
98
0
0 20 40 60 80 10
Improvement ofland use
Increase of jobopportunity
Improvement ofliving standards
Others
0
2.4.2 Impacts on Water Environment
At the time of project appraisal, it was expected that the project would improve the water environment and reduce water-borne illness. Respondents to the Interview Survey also noted the project’s positive impacts on the environment. Asked, “Do you think that the
10) Roughly set as a benefit realization ratio, based on the actual flood record in 2.3.1.
10
11) Additional packages, 1A and 2A, were incorporated after the commencement of the project. They were expected to cease the progress of riverbed degradation but not to increase the whole benefit in the subject area.

incidence of water-borne illness in your community has fallen? “, all 100 respondents said, “yes”. As shown in Figure 8, 78% of the respondents answered that the spread of “diarrhea” was reduced, 62% indicated there had been a reduction in “skin disease” and 52% pointed to a drop in “dengue fever”. Although other factors, such as improvements in medical service, may also have helped, it can be concluded that the project contributed the reduction of disease.
Figure 8 : Reduction of spread of disease (N=97, MA)
78
6252
8
45
0
20
40
60
80
100
Diarrhea Skindisease
DengueFever
Influenza Filaria
2.4.3 Social Impacts ---Land Acquisition---
Approximately 5.5 ha of land were acquired without opposition for the parapet wall, and compensation amounting to 18,647 million Rp. was disbursed. The government also provided land for 114 households subject to resettlement. 83% (83 of 100) of Interview Survey respondents were subject to land acquisition and compromised with the compensation.
Figure 9 : Assessment of compensation (N=83)
fairlysatisfied
61%
notsatisfied,
butaccepted
39%
completelysatisfied
0%
completelydissatisfied
0%
11
2.5 Sustainability
2.5.1 Operation and Maintenance
1) O&M Organization
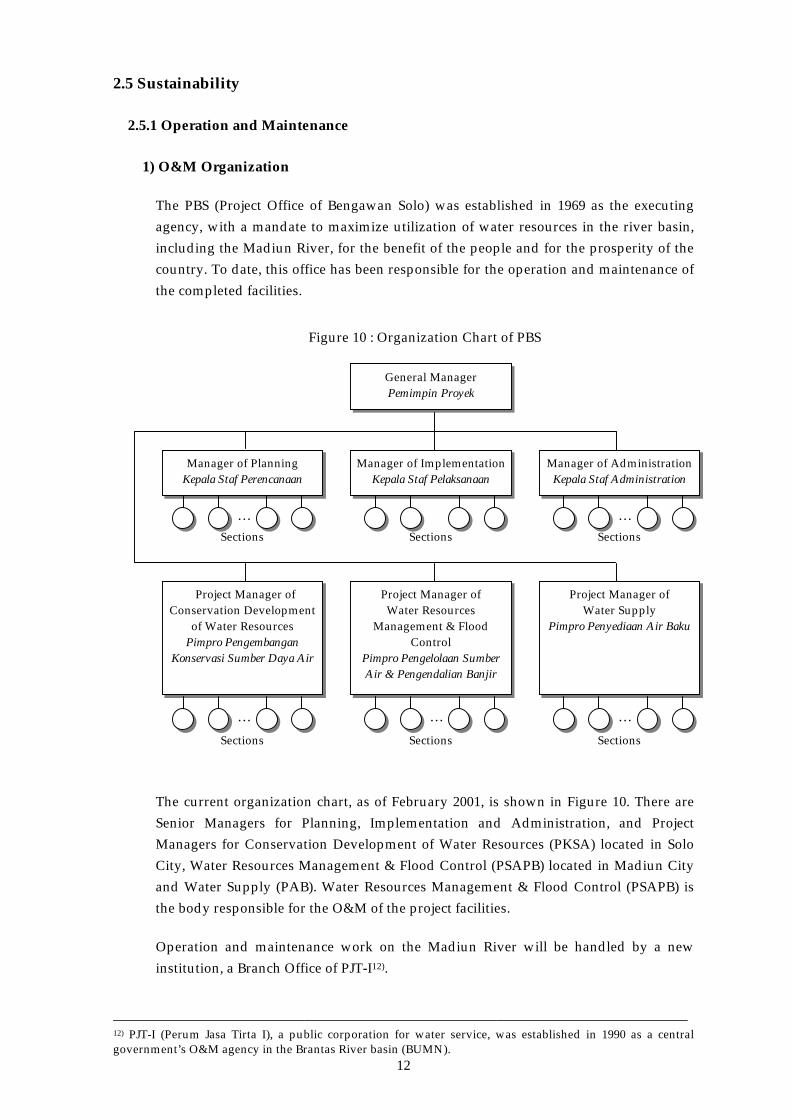
The PBS (Project Office of Bengawan Solo) was established in 1969 as the executing agency, with a mandate to maximize utilization of water resources in the river basin, including the Madiun River, for the benefit of the people and for the prosperity of the country. To date, this office has been responsible for the operation and maintenance of the completed facilities.
Figure 10 : Organization Chart of PBS
Sections Sections Sections
………
… …
Manager of Administration Kepala Staf Administration
Manager of Planning Kepala Staf Perencanaan
Manager of Implementation Kepala Staf Pelaksanaan
Project Manager of Water Supply
Pimpro Penyediaan Air Baku
Project Manager of Conservation Development
of Water Resources Pimpro Pengembangan
Konservasi Sumber Daya Air
Project Manager of Water Resources
Management & Flood Control
Pimpro Pengelolaan Sumber Air & Pengendalian Banjir
General Manager Pemimpin Proyek
Sections Sections Sections
The current organization chart, as of February 2001, is shown in Figure 10. There are Senior Managers for Planning, Implementation and Administration, and Project Managers for Conservation Development of Water Resources (PKSA) located in Solo City, Water Resources Management & Flood Control (PSAPB) located in Madiun City and Water Supply (PAB). Water Resources Management & Flood Control (PSAPB) is the body responsible for the O&M of the project facilities.
Operation and maintenance work on the Madiun River will be handled by a new institution, a Branch Office of PJT-I12).
12
12) PJT-I (Perum Jasa Tirta I), a public corporation for water service, was established in 1990 as a central government’s O&M agency in the Brantas River basin (BUMN).

2) Current Status of Project Facilities
The Mission for project evaluation visited the project site in July 2001 to inspect the current status of the completed project facilities.
Riverbed degradation is causing various problems at the project site. These problems include intensive bank erosion and unstable conditions of the existing revetments and ground sills. The riverbed degradation may have been caused by a combination of the following factors:
a) The Sabo dams built in upstream in the 1970’s and 1980’s have reduced the sediment flow.
b) Active sand mining activities along the river channel.
c) The construction of a short-cut channel accelerates riverbed scouring at its upstream reaches.
Rehabilitation of structures damaged by riverbed degradation is needed urgently restore their original functions. Furthermore, it is necessary to build several drop structures and ground sills to stabilize the river channel is necessary to cope with the lowering of the riverbed. In addition, the existing masonry revetments have been damaged due to heavy scouring at Jati and Kori weirs. The immediate repair of the revetments is necessary to prevent adverse impacts on the stability of downstream apron structures, which is likely to be serious. One of the three rubber gates at the Sungkur Weir broke because of a rupture where a temporary masonry weir had been constructed to supply irrigation water. At Jati Weir, one of two rubber gates was broken and is temporarily being repaired to restore intake of irrigation water. In order to ensure a sustainable supply of irrigation water, the reinstallation of the rubber weirs is indispensable.
The Rehabilitation SAPS Study conducted by JBIC in 2001 identified a number of places/structures that urgently need rehabilitation works (see Table 1). The rehabilitation works will be implemented under Japan’s ODA loan, named “Water Resources Existing Facilities Rehabilitation and Capacity Improvement Project”13).
Table 1 : List of Necessary Rehabilitation in Madiun River
River Structure Necessary rehabilitation works Madiun mainstream Ground sill
Jati weir River stretches
Repair of ground sills Repair of revetment, Re-installation of rubber gate Repair and construction of revetment
Jerowan river River stretches Construction of additional ground sills & drop structure, repair of revetment
Sungkur river Sungkur weir Re-installation of a rubber gate Keyang river Kori weir Repair of revetment
source : Rehabilitation SAPS Study
13
13) Loan Agreement (L/A) for Water Resources Existing Facilities Rehabilitation and Capacity Improvement Project was concluded on October 10, 2002.

Supplementary Information on Riverbed Lowering and Scouring/Erosion
There are some areas of the tributaries to the Madiun River where serious scouring/erosion and riverbed lowering have been observed. According to the Project Official, this situation developed after the commencement of the project, and has been growing gradually. People living in the surrounding area worry that continuous scouring/erosion will reach their land/property in the near future, if appropriate countermeasures are not implemented. They have requested that the Project Office, through the local government, treat/solve the problem, but no proper action has been taken, because of the lack of government funds.
Current status of a problem river segment (Jerowan River)
Scouring / Erosion
Riverbed Lowering
2.5.2 Technical Capacity
There was a total staff of 739 at the time of the CDMP (Comprehensive Development Master Plan) study in June 2000, 19 of which (at PSAPB) were in charge of operation and maintenance for the project. These employee are conducting maintenance activities every three months as follows:
- Patrol and inspection of the river courses and river structures, and reporting of the results.
- Maintenance of equipment.
- Maintenance of the river channels, which comprises maintenance of existing river channels and newly constructed shortcut channels, and removal of obstacles in the river channels.
- Maintenance of the river structures, such as levees, parapet walls, revetments, ground sills, groins, sluice ways, canal and roads.
14
According to the General Manager of the PBS, the technical capacity of the staff has been sustained and improved mainly through on-the-job and technology transfer from the consultants. However, there seem to be general and structural problems in the PBS. The problem of an aging staff was pointed out in the CDMP Study; “36% of the total PBS workforce is between 41-45 years of age, and 38% between 46-50 years. In less than 5 years, 17% of the PBS staff will be eligible for retirement. This situation makes for low staff mobility, flexibility, and, therefore, more difficult human resources management.” To cope with this situation, it is necessary for the PBS to make efforts to hire younger people and rejuvenate the organization.
2.5.3 Financial Status
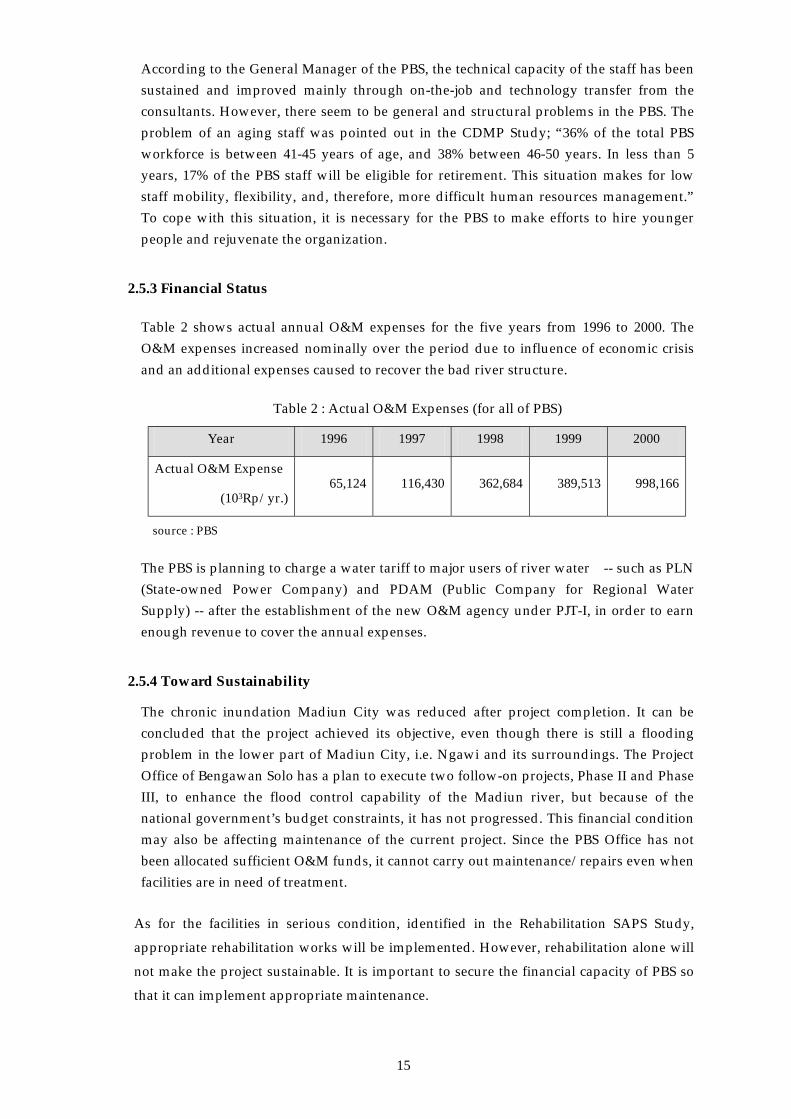
Table 2 shows actual annual O&M expenses for the five years from 1996 to 2000. The O&M expenses increased nominally over the period due to influence of economic crisis and an additional expenses caused to recover the bad river structure.
Table 2 : Actual O&M Expenses (for all of PBS)
Year 1996 1997 1998 1999 2000
Actual O&M Expense
(103Rp/yr.) 65,124 116,430 362,684 389,513 998,166
source : PBS
The PBS is planning to charge a water tariff to major users of river water -- such as PLN (State-owned Power Company) and PDAM (Public Company for Regional Water Supply) -- after the establishment of the new O&M agency under PJT-I, in order to earn enough revenue to cover the annual expenses.
2.5.4 Toward Sustainability
The chronic inundation Madiun City was reduced after project completion. It can be concluded that the project achieved its objective, even though there is still a flooding problem in the lower part of Madiun City, i.e. Ngawi and its surroundings. The Project Office of Bengawan Solo has a plan to execute two follow-on projects, Phase II and Phase III, to enhance the flood control capability of the Madiun river, but because of the national government’s budget constraints, it has not progressed. This financial condition may also be affecting maintenance of the current project. Since the PBS Office has not been allocated sufficient O&M funds, it cannot carry out maintenance/repairs even when facilities are in need of treatment.
As for the facilities in serious condition, identified in the Rehabilitation SAPS Study,
appropriate rehabilitation works will be implemented. However, rehabilitation alone will
not make the project sustainable. It is important to secure the financial capacity of PBS so
that it can implement appropriate maintenance.
15

Comparison of Original and Actual Scope Item Plan Actual
(1) Project Scope 1. Civil Works for River Improvement
a. Excavation b. Embankment
c. Disposal of excavated material
d. Revetment
-Planting of grass -Wet masonry -Consolidation of foundation -Foot protection of groin -Groundsill -Parapet Wall -Ditch
e. Construction of bridge and gate -Bridge -Gate
f. Modification works
-Bridge -Irrigation canal -Road -Intake dam modification
2. Consulting Services
a. Review of detailed design b. Support of tender evaluation c. Construction Supervision
3,900,000 m3
2,100,000 m3
1,100,000 m3
760,000 m2 38,000 m2
310 m 12 places 3 places
1,800 m 67,000 m
2 nos 1 nos
5 nos 240 ha (paddy field)
0.8 km 0 places
Total : 351 M/M (Foreign : 258 M/M)
(Local : 113 M/M)
3,943,400 m3
2,228,700 m3
1,301,600 m3
838,900 m2 153,500 m2
0 m 2 places
15 places (of which 11 are in the
main stream) 2,460 m
48,700 m
8 nos 9 nos
7 nos 0 ha
2.26 km 8 places
Total : 1,242 M/M(*) (Foreign : 424 M/M)
(Local : 819 M/M)
(2) Implementation Schedule 1. Loan Agreement 2. Selection of Consultant 3. Consulting Services 4. Selection of Contractor 5. Compensation 6. Main Work (River Improvement)
Nov. 1984 Nov. 1984 – Nov. 1985 Nov. 1985 – Mar. 1990 Nov. 1984 – Apr. 1986 Jun. 1985 – Sep. 1989 Feb. 1986 – Mar. 1990
Feb. 1985 Jan. 1987 – Mar. 1987(*)
Jul. 1987 – Dec. 1995 Jul. 1985 – Sep. 1992 Jul. 1985 – May. 1995 Feb. 1988 – Jul. 1995
(3) Project Cost Foreign currency Local currency Total ODA Loan Portion Exchange Rate
6,400 million yen 26,200 million Rp.
12,609 million yen 6,400 million yen 1Rp. = 0.237 yen
(as of Apr. 1984)
5,936 million yen 48,705 million Rp. (*)
10,298 million yen 5,936 million yen
12.496 Rp. = 1 yen
16 note: Actual data with (*) was corrected by the mission for PCR improvement in 2000 dispatched from JBIC.

Independent Evaluator’s Opinion on Madiun River Urgent Flood Control Project
Mochammad Maksum
Agricultural Economist and Director of the Center for Rural and Regional Development Studies,
Gadjah Mada University, Yogyakarta Indonesia
The project objectives to mitigate flood damage by means of improvement works is considered very relevant with national development policy in mitigating natural hazard. Major delays of approximately 5 years significantly characterized the project due to additional packages to cope with serious riverbed degradation problem, which was unforeseeable during the time of project appraisal. Such delays indicated poor performance in project planning and appraisal, though it has no significant financial consequences in real terms. The actual spending in foreign currency portion was still far beyond the estimated budget. The cost over-run in the local currency might be partly attributed to the price escalation due to inflation rate.
Flood mitigation has been effectively performed by the project. Flooded area decreased significantly after the completion of the project. Madiun city, which was the target of the project, has been well protected from flood. However, its nearby areas are still at risk of being inundated.
Increase in job opportunity, improved standard of living, improved land use and decrease in the incidence of water-borne illness are among socio-economic impact of the project. People acceptability on resettlement and land compensation could be coined as very supportive phenomenon connected with land acquisition.
As part of the Project office of Bengawan Solo, institutional sustainability of the project could be very optimistic. However, in terms of physical sustainability, serious consideration must be placed on various emerging problems due to riverbed degradation.
On the environmental aspect, the enlargement of flood area surrounding this project area must be further investigated. While the O&M expenses reported by the reviewer did not give any idea on the O&M financial sustainability. To avoid sustainability problem, O&M financial prospect could be better assessed.
17