indonesia jobs outlook 2017 - ilo.org · laporan ketenagakerjaan indonesia 2017: memanfaatkan...
TRANSCRIPT
Indonesia Jobs Outlook 2017Harnessing technology for growth and job creation
InternationalLabourOrganization
International Labour OrganizationILO Office for Indonesia and Timor-Leste
Indonesia Jobs Outlook 2017Harnessing technology for growth and job creation
Indonesia Jobs Outlook 2017
ii
Copyright © International Labour Organization 2017First published 2017
Publications of the International Labour Office enjoy copyright under Protocol 2 of the Universal Copyright Convention. Nevertheless, short excerpts from them may be reproduced without authorization, on condition that the source is indicated. For rights of reproduction or translation, application should be made to ILO Publications (Rights and Permissions), International Labour Office, CH-1211 Geneva 22, Switzerland, or by email: [email protected]. The International Labour Office welcomes such applications.
Libraries, institutions and other users registered with reproduction rights organizations may make copies in accordance with the licences issued to them for this purpose. Visit www.ifrro.org to find the reproduction rights organization in your country.
This report was prepared by Owais Parray (ILO, Jakarta) with contributions from Dyah Retno Sudarto (Consultant) and Greg Yameogo (ILO, Jakarta). The author would like to express gratitude to Sara Elder and Phu Huynh (ILO Regional Office, Bangkok) for their technical review and inputs.
ISBN 978-92-2-030689-5 (print) 978-92-2-131450-9 (web pdf)
ILOIndonesia Jobs Outlook 2017: Harnessing technology for growth and job creation/International Labour Office – Jakarta: ILO, 2017xii, 76 p.
Laporan Ketenagakerjaan Indonesia 2017: Memanfaatkan Teknologi untuk Pertumbuhan dan Penciptaan Lapangan Kerja; ISBN: 978-92-2-030689-5 (print); 978-92-2-830888-4 (web pdf)/Kantor Perburuhan Internasional – Jakarta: ILO, 2017
ILO Cataloguing in Publication Data
The designations employed in ILO publications, which are in conformity with United Nations practice, and the presentation of material therein do not imply the expression of any opinion whatsoever on the part of the International Labour Office concerning the legal status of any country, area or territory or of its authorities, or concerning the delimitation of its frontiers.
The responsibility for opinions expressed in signed articles, studies and other contributions rests solely with their authors, and publication does not constitute an endorsement by the International Labour Office of the opinions expressed in them.
Reference to names of firms and commercial products and processes does not imply their endorsement by the International Labour Office, and any failure to mention a particular firm, commercial product or process is not a sign of disapproval.
ILO publications and electronic products can be obtained through major booksellers or ILO local offices in many countries, or direct from ILO Publications, International Labour Office, CH-1211 Geneva 22, Switzerland. Catalogues or lists of new publications are available free of charge from the above address, or by email: [email protected]
Visit our website: www.ilo.org/publns
Printed in Indonesia
Indo
nesi
a Jo
bs O
utlo
ok 2
017
iii
Foreword
I am pleased to present the Indonesia Jobs Outlook Report 2017: Harnessing technology for growth and job creation. In the past, this flagship report of ILO Jakarta was published under a different title: Labour and Social Trends in Indonesia. This year, the content and structure of the report was modified, which also made it necessary to change the title.
This report provides an in-depth analysis of the employment and labour situation in Indonesia. These trends are discussed in the context of the state of the economy. In particular, the report looks at structural transformation and resultant effect on the job market.
As the report notes, structural changes in the past resulted in diversification of the economy and more job opportunities. However, of late, less than desirable growth in manufacturing and other value-added sectors is a cause for concern.
A look at the labour market shows that over the last two decades across several labour market indicators, Indonesia has made noticeable improvements. Many more workers are now engaged in productive employment. In the last five years unemployment rate has fallen significantly.
But, low unemployment also disguises several deficits in the labour market. Vulnerable employment and those engaged in informal employment is decreasing, but there are still a significant number of workers involved in low- productive work.
Besides analyzing past trends, the report explores the implications for jobs in light of rapid technological advances. We believe it is a very topical issue which is taking center stage in the policy discourse.
As the report highlights, technology and jobs always had a symbiotic relationship. In the past, technological change over time led to new jobs and industries. In other words, technology was a catalyst for growth.
However, technological upgrading while improving productivity can lead to job losses. Historically, technological disruptions in the labour market were short-term and often accompanied by the growth of new sectors and industries.
The concern with the present technological advancements is the pace at which it is happening. Also, it is happening when the global economy is not growing as fast as it did before the 2008 global financial crisis. The report tries to explain some of the factors behind these shifts and what can be done to protect jobs and using technology to stimulate growth and job creation in Indonesia.
I hope the report feeds the ongoing national dialogue on the “future of work”. The ILO remains committed to supporting this process as well as the ongoing cooperation with the national stakeholders to promote good jobs and decent employment in Indonesia.
Lastly, I would like to take this opportunity to thank Owais Parray who is the main author of this report. I would also like to offer a world of appreciation to Greg Yameogo (ILO Jakarta) and Dyah Retno Sudarto (ILO’s consultant), who contributed in the preparation of this report.

Indonesia Jobs Outlook 2017
iv
Valuable comments were provided by Sara Elder and Phu Huynh from the ILO’s Regional Office in Bangkok. Also, special thanks to Grace Halim, Tendy Gunawan and Gita Lingga from ILO Jakarta Office for their help in the production of this report.
Michiko MiyamotoCountry DirectorILO Country Office for Indonesia and Timor-Leste
Indo
nesi
a Jo
bs O
utlo
ok 2
017
v
Contents
Foreword iii
Contents v
List of Figures vi
List of Tables vii
Executive Summary ix
1. Introduction 1
2. State of economic development 3
3. Economic growth and jobs 7
4. Who is employed 13
5. Understanding unemployment 23
6. Youth, employment, and inactivity 27
7. Technology, productivity, and jobs 31
7.1 Blessing for job creation? 32
7.2 Threat to jobs? 34
7.3 Looking ahead: technology and firms 35
7.4 Towards a technology driven economy 44
8. Skills challenge in Indonesia 47
8.1 Working age population and labour force 47
8.2 Labour force and education 50
8.3 Skills gap 52
9. Conclusions 57
10. Recommendations 59
References 61
Annexes 65
Annex 1. Skills Mismatch & Measurement 65
Annex 2. Labour Force Survey Comparison 2006 and 2016 67
Indonesia Jobs Outlook 2017
vi
List of Figures
Figure 1. Annual GDP growth (percent) 2010-2016 5Figure 2. Expenditure share in GDP 2010-2016 5Figure 3. Sector share of GDP (%) 7Figure 4. Sector share of GDP (LHS) and employment share of GDP (RHS) in percent 8Figure 5. Sector growth in GDP and employment 1991-2016 9Figure 6: Change in employment-to-population ratio by sex and age group, 2006 & 2016 13Figure 7. Number in thousands (LHS) and percent (RHS) of people employed by sectors
(2006 & 2016) 14Figure 8. Status of employment in 2006 and 2016 15Figure 9. Occupations by sex, 2006 and 2016 16Figure 10. Employed with second job, 1996-2016 17Figure 11. Total number (LHS) and percent (RHS) of employed with second jobs
by occupations (2016) 18Figure 12. GDP per capita (LHS) and average monthly wage earnings (RHS) by province 19Figure 13. Share of employment (LHS) by broad sectors in four provinces with high
unemployment rate (RHS) 2016 24Figure 14. Provinces with unemployment rate (left) lower than the national average and
share (right) of employment by broad economic sectors (2016) 25Figure 15. Number of unemployed (RHS) and unemployment rate (LHS in %) among
youth by education (2016) 28Figure 16. Youth unemployment rate in 2006 & 2016 28Figure 17. NEET (%) in selected countries in Southeast Asia for latest year available 29Figure 18. Number (LHS) and proportion (RHS in %) of NEET by education 30Figure 19. Decline of mid-level jobs involving routine tasks 34Figure 20. Action taken by enterprises shown by a) comparing with ASEAN
b) sectors c) size and d) age 36Figure 21. Barriers to technology upgrade shown by a) comparison to ASEAN,
b) sectors, c) size and d) age 37Figure 22. Employing different types of workers compared to ASEAN, sectors, and size 38Figure 23. Conditions for recruiting international migrant, freelance, or remote workers 39Figure 24. Long-term business prospects in future 40Figure 25. Long-term future prospects by a) sector b) size 41Figure 26. Impact of technology on business performance 42Figure 27. Impact of technology on business performance by sectors 43Figure 28. Impact of technology on business performance by size of enterprises 43Figure 29. Impact from ASEAN economic integration by a) sector and b) size 44Figure 30 Labour force participation rate by age and sex (1996 and 2016) 48Figure 31: Female gender gap in labour force participation rate (LFPR) in provinces 49Figure 32: Labour force participation rate in selected countries in Asia 49Figure 33: Labour force by education 50Figure 34. Field of study among university & TVET students 51
Indo
nesi
a Jo
bs O
utlo
ok 2
017
vii
Figure 35. Preferred sectors of employment by a) gender and b) qualification 52Figure 36. Occupations and skills, 2006 and 2016 53Figure 37. Trend over-education and under-education in Indonesia between 2006 and 2016 55Figure 38. Incidence of undereducation and overeducation by age 56
List of Tables
Table 1. Growth of value added by sectors and employment 10Table 2. Employment elasticity estimation using OLS, 1990-2016 11Table 3. Share of vulnerable in total employment (percent) 15Table 4. Share of vulnerable in total employment (percent) 16Table 5. Average monthly earnings, male & female by sectors & gender pay gap, 2016 19Table 6. Average monthly earnings by educational attainment, male & female, 2016 20Table 7. Wage and gender regression results 21Table 8. Average years of education (mean) of employed and standard deviation
per major occupation group 54Table 9. Over-education and under-education by sex and urban/rural 55

Indonesia Jobs Outlook 2017
viii
Indo
nesi
a Jo
bs O
utlo
ok 2
017
ix
Executive Summary
IN this edition of the “Indonesia Jobs Outlook 2017” we examine the economic and employment trends in the country. We also explore the potential impact from the current wave of technologic changes on future jobs. In the past, the International Labour Organization (ILO) has regularly published the “Indonesia Labour and Social Trends Report”. A change of tile was felt necessary to better reflect the content of the report.
Indonesia has maintained a steady growth rate in a global economic environment dubbed as the new normal,1 a period that is likely to see more moderated levels of economic growth compared to the period before the global financial meltdown in 2008. The commodity prices have recovered and are steadily increasing. Being one of the larger commodity producing countries in the world, an uptick in commodity prices will boost Indonesia’s exports and provide further impetus to the economy.
To adjust to the current global situation and help the country to further reduce its dependency on commodities, the Government of Indonesia has launched several reforms to improve the business and investment climate. As many as 15 business and economic policy packages were launched with an aim to make Indonesia more competitive and boost economic development. In addition to this, government is allocating more public funding for infrastructure which, if realized, should improve connectivity and reduce cost for businesses.
Looking back, Indonesia can be considered as a good country example that has experienced a relatively balanced growth, at least until the Asian Financial Crisis in 1997. In the past, structural change in the Indonesian economy was characterized by an increase in value added, job creation, and labour productivity. Our analysis shows that in the past structural transformation played a key role in ushering productivity gains across and within the sectors. Jobs were created in non-farm sectors which not only provided opportunities for new labour entrants, it reduced dependency on agriculture. Before the crisis of 1997, Indonesian manufacturing sector was growing rapidly with a commensurate growth of jobs.
The period between 2006 and 2016 saw services becoming the fastest growing sector in the economy achieving 7 percent growth annually,2 While there are alternative theories on evolving sector composition as the country achieves higher levels of development, manufacturing has traditionally
1 The term is attributed to Mohamed A. El-Erian, Head of PIMCO, who questioned the notion that after the 2007-2008 financial crisis, industrial economics would return to previous growth rate which was seen as an abnormal episode.
2 ILO staff calculation using BPS national accounts data.
Indonesia Jobs Outlook 2017
x
provided the pathway for industrialization and economic development. Almost all the developed countries achieved industrialization through an expansion of manufacturing and subsequent growth of high value services.
Considering that productivity in services is relatively low (USD 8,079) compared to manufacturing (USD 14,282),3 the slowdown of manufacturing growth which some have even termed as “deindustrialization” does not augur well for employment. Although in absolute terms more people are employed in manufacturing, the share of employment in this sector increased only slightly to 13.1 percent in 2016 compared to 2006 when it was 12.5 percent.4 Together services and trade now account for 46.7 percent of the employed.
Unemployment rate has further fallen to 5.3 percent in 20175 from a high of 11.2 percent in 2005. However, relatively low unemployment rate in Indonesia does not fully reveal the challenges that the economy faces to create adequate number of good and decent jobs. There are still major deficits in employment outcomes by productivity, quality of work, gender, and disparities across the provinces. A lot of workers are engaged in low-productivity employment as seen by relatively high proportion of workers in vulnerable employment (30.6 percent). If employers assisted by temporary workers and casual workers are added, the vulnerable employment rate increases to as high as 57.6 percent. The rate is even higher for female workers (61.8 percent).6
Compared to 1996, there are more workers and job seekers with higher educational qualifications in the labour market. But, the proportion of them remains relatively low. Moreover, proportionally there are still fewer women in the labour force. In fact, the labour force participation rate of females hardly changed from 1996 when it stood at 50.6 percent compared to 2016 (50.8 percent). Although declining, the unemployment rate among youth is still very high (19.4 percent). An equally worrying trend is the number of young people who are neither employed, in education or training (NEET). The proportion of NEET in Indonesia is quite high (23.2 percent) and in fact it is one of the highest rates in Asia.
As the country moves forward, Indonesia, like other emerging and industrialized economies, is confronted by a new wave of rapid technological advancements which are likely to shape the economy and jobs of the future. Technological forces including digitalization and use of machines are converging and changing production, distribution, and consumption patterns. In Indonesia, there are understandably divergent views on the way the technology will affect firms and jobs.
Some see technology playing its “creative destruction” role to spur innovation and growth. According to this view, while jobs will be lost initially, new and better jobs will be created which in turn will improve overall welfare of the people. This view emanates from past trends which historically have seen improvements in technology indeed minimizing need for human intervention, but at the same time creating new jobs and industries. In other words, technology complemented rather than made labour totally redundant.
In Indonesia we can see rapid growth in online platforms creating opportunities for e-commerce, on-demand services, and transportation. A digital marketplace has brought buyers and sellers as well as potential workers and employers even closer. It appears that new work opportunities resulting from technological uptake is much more widespread in the trade and services sector. It is possible that this development may have contributed in lowering the unemployment rate in Indonesia. However, without
3 ILO staff calculations using 2016 GDP value added figures from World Bank database and employment figures by sector from Sakernas 2016.
4 ILO staff calulations using the Sakernas microdata.5 This figure is from the labour force survey (Sakernas) 2017, February series. In this report, only Sakernas data from August series
has been used owing to a larger sample and for the sake of consistency when making comparisons. 6 ILO calculations using Sakernas 2016.
Indo
nesi
a Jo
bs O
utlo
ok 2
017
xi
detailed data on occupations and sub-sectors, which is difficult to obtain, is not possible to verify the net effect on jobs.7
A clear trend in Indonesia is the growing number of people who are getting connected to the digital space which is happening mainly through hand-held devices. Considering the growth in internet users and a large number of people using social media, potentially, Indonesia is well placed to benefit from the digital revolution. But, owing to the poor state of physical infrastructure especially outside Java and Bali, low investment in research and development, Indonesia faces considerable challenges. In technological readiness, Indonesia is placed very low (80) on the technological readiness, much lower than its overall global ranking of 36 on the Global Competitiveness Index.8
Historically, technological upgrading was critical for continuous growth and economic development. In this respect, the technology versus jobs debate is not new. However, the current wave of technological advances are happening at a much faster rate. Artificial intelligence, internet-of-things, 3D printing, to name a few, are some of the new technologies which are converging and reached at a stage that one can foresee them achieving commercial viability in near future. This undoubtedly will have a major impact on the production processes and the organization of work.
A slightly opposing view on jobs and technology is that the two are competing against each other. And, it is not long that a large number of human occupations will be lost. Studies have shown that several occupations involving routine tasks are facing the greatest threat from automation and machines. According to an ILO estimate more than 60 percent of salaried jobs in Indonesia are at risk.9 Increasingly, jobs will become more polarized i.e. a concentration of very high skilled and low skill work. Occupations involving repeated functions that can be converted into an algorithm or can be learned by machines will become obsolete.
One would assume that, at least for now, adoption of technology by firms will have far great implications for industrialized economies. The argument being that the developing countries still have some leeway before reaching the technological frontier. In the short-term, it is more economical for firms in developing countries to deploy labour rather than switch to labour saving machines which usually require a significant upfront investment.
However, recent developments show that compared to the past technological diffusion is happening faster than before. And, this is happening alongside rapid reduction of costs and thus making it quickly commercially viable. This could mean that developing countries may only have a temporary respite. Interestingly, in the last few years the sale of industrial robots is increasing in countries like Indonesia. According to a survey, more firms in Southeast Asia are planning to upgrade their technology.10 In fact, in some quarters there are concerns that Indonesian manufacturing sector is quite susceptible to technology and automation. It is important to note here that even before the current wave of digitalization, Indonesia was already losing ground in manufacturing.
While there is still some disagreement on how technology will shape work in future, there is more consensus that skills upgrading has become even more important for future growth and development. Over the last two decades one can see improvement in the educational attainment of Indonesian workers, but many still have low educational qualifications and labour productivity is low, especially among small enterprises. There are skills gap which need to be addressed otherwise Indonesia’s future development will be compromised.
7 Sakernas microdata from 2016 had occupations disaggregated at 2 digit level.8 Global Competitiveness Report 2016-2017, World Economic Forum.9 ILO, 2016 ASEAN in Transformation.10 Ibid.
Indonesia Jobs Outlook 2017
xii
To ensure that technology is a blessing for the Indonesian economy and jobs, the report offers the following recommendations.
1. Indonesia needs a “second wave” of structural transformation. The country has to move away from its dependency on extractive industries and create new sources of growth in manufacturing and other high value services. Technology can be used a catalyst for ushering in this next wave of structural transformation. Indonesia needs to pursue a pro-employment industrial policy. In this regard, the government can tailor its support in the revival of manufacturing as well as growth of new and creative industries.
2. In a globalized world, resisting the use of technology in the production processes may be difficult, if not impossible. Adoption of improved technology should be the means for achieving higher levels of development. It is inevitable that with new technology including digitalization and machines carrying out certain tasks, in the short-term, there will be disruptions in the labour market including jobs losses. It is here that public policy can be critical. Active labour market policies and programmes can be initiated to enable people to learn new skills, assist them in job placements, and provide incentives to firms to invest in human capital.
3. Related to above, there is now even a stronger case for continued and even more public investment in skills development. Indonesia already spends 20 percent of its budget on education. While education spending has increased over the years, the quality of education and learning achievement of students is still fairly low. With a single ASEAN market, there is greater urgency to ensure that investment in education is closely linked to outcomes. Education and learning should not be limited to academic institutions, but it should form an integral part of the work place. A culture of life-long learning should be instituted to enable workers to adapt to the changes in the labour market.
4. With a large young population, many Indonesians are receptive to technology. There are already a large number of internet users who use social media quite regularly. Connectivity will be important for those living in the outer islands of Indonesia where access is still a problem. Bringing more people to the digital world will undoubtedly spur innovation, encourage use of new mediums for learning, and open up avenues for small enterprises and young entrepreneurs. The opportunities for businesses can come in the form of greater market penetration and raising capital through online portals.
5. In light of the changes in the labour market and growth of the so called gig economy, the current labour governance systems should be revisited. In this regard, an ongoing dialogue on the standards of work should be initiated among key stakeholders such as the government, private sector employers, worker representatives, and other civil society organizations representing youth who after all will be most affected in future. Moreover, social security coverage should include non-standard forms of work. A simplified and portable system for independent workers or groups with innovative financing options should be explored to provide greater coverage.
6. Indonesia needs to rethink its social protection framework. The country already spends a considerable amount of public resources for social transfer including cash and non-cash supplements to the poor. While social security schemes can provide temporary support to the unemployed, there may be those who need longer to get back on their feet. Globally, the idea of a universal basic income (UBI) is gaining more currency as a measure to provide a social safety net for workers against job losses. This is something worth looking into.
Indo
nesi
a Jo
bs O
utlo
ok 2
017
1
Introduction
1
THE current edition of the “Indonesia Jobs Outlook 2017” report takes stock of the economic and employment situation in the country. The report also provides a synthesis of the ongoing debate concerning the impact of technological advancements on the production processes and employment. Since 2008 the ILO Office in Jakarta has regularly published its flagship report titled “Labour and Social trends in Indonesia”. Besides providing the reader an updated and comprehensive overview of the labour market, each report focused on a specific theme to highlight a topical issue. The purpose of the report is to feed the national policy discourse, stimulate discussions, and help shape economic and employment policies and programmes in the country.
The present report continues this tradition. A change of title was felt necessary to better represent the content of these reports. Previous reports mainly featured a chapter on past and current trends and another chapter on a chosen theme. In the present report, an attempt was made to integrate the two to provide a continuous narrative in which trend analysis also provides the context for the selected theme.
Past themes have included productivity through decent work (2014-2015), role of decent work in equitable growth (2013), working for sustainable and equitable economy (2012), promoting job-rich growth in provinces (2011), translating economic growth into employment creation (2010), recovery and beyond through decent work (2009), and pathways to job-rich growth (2008).
Globally, the “future of work” has become one of the key policy issues in the development discourse. ILO is at the forefront of moderating this debate and helping stakeholders to formulate employment-centric policies and solutions for future. In Indonesia, a number of national consultations provided the basis for the selection of the theme for this report. The aim of these dialogues was to identify measures to minimize disruptions in the labour market and to ensure that the adoption of technology yields decent work outcomes and greater welfare for Indonesia.
In November of 2016 a dialogue was organized to discuss the labour market implications as Indonesia moves towards a low-carbon economy. Another “future of work” national dialogue which focussed on digitalization and employment was held in April of 2017. It provided an opportunity to crystallize views from various stakeholders. Several experts were invited to explain the emergence of new technologies, changes observed in the economy, and the job market.
Indonesia Jobs Outlook 2017
2
With the recent slowdown of the economy, job creation and poverty reduction is again high on the national agenda. The current government has undertaken several policy reforms with an objective of improving the investment climate and stimulating growth. Infrastructure spending was prioritized as well to improve connectivity across the archipelago. Indonesia is also trying to increase both public and private investment to create good jobs for people entering the labour force.
The present report focuses on a very important policy dimension in the public discourse. It is critical for Indonesia to reflect on how the economy will evolve in future and respond to technology, and what public policy can to do shape a course that yields greater development benefits. While the theme is more forward-looking, the report also dwells on structural changes in the past to better understand the present state of the economy and the job market. Limited data on the adoption of technology at the firm level no doubt constrained the analysis, but to offset that, and to the extent possible, the report relied on existing literature and studies which have explored the relationship between employment and technology.
The drafting of the report was done in-house by ILO Jakarta with feedback and peer reviews provided by the experts in the ILO Regional Office in Bangkok. The data sources for this report include statistics from Statistics-Indonesia (BPS). Data was also obtained from global databases such as ILOSTAT and World Bank Open Data maintained by ILO and World Bank respectively. Microdata sets from the National Labour Force Surveys (Sakernas) were obtained from BPS which were then processed and analyzed by the ILO staff. In most of the cases standard international definitions were used for calculation of labour and employment indicators. It is, however, possible that some of the figures reported may vary from the published figures in BPS reports or website. To ensure proper comparisons only the August data series of Sakernas was used.
The report is divided into several sections. We first look at the present state of the economy which is followed by an analysis of the relationship between economic growth and job creation in the country. In this section we have estimated the growth elasticity of jobs by different sectors. Following that we examine trends over a decade (2006-2016) and in some cases over two decades (1996-2016). The trend analysis covers several employment and labour indicators.
Unfortunately, changes in the way data is collected and codified for Sakernas made it difficult to make full comparisons between 1996 and 2016. After the section on trends, we discuss the more recent technological changes and possible impact on the labour market globally as well as in Indonesia. This section contains a synthesis of literature, expert views, and perspectives from the business community, and students. The latter two are part of the ASEAN wide survey that ILO Regional Office in Bangkok commissioned in 2016. In the last two sections of the report we draw key conclusions and offer some policy recommendations.
Indo
nesi
a Jo
bs O
utlo
ok 2
017
3
INDONESIA has come a long way from a low-income country with a per capita GDP of USD 772 in 1970 to a middle income status with a per capita GDP of USD 3,974 in 2016.11 In 1966, the first National Long-Term Development Plan (Garis-Garis Besar Haluan Negara/GBHN) which was broken down into five-year plans or Repelita (Rencana Pembangunan Lima Tahun) articulated a vision to transform the country, which at that time was primarily a subsistence agriculture-based economy. In the plan, agriculture development, transition to processing of raw materials for domestic consumption, and then gradually moving into export-driven manufacturing were laid out as the broad stages of structural transformation.
With an annual gross domestic output of USD 932 billion, and a workforce of over 125 million, out of whom 21.8 million (17 per cent) are youth (15-24 years old), 12 Indonesia is one of the larger economies in the world and an important member of the G20. In Asia, after China and India, Indonesia is considered as the most attractive destination for foreign investment. In a survey conducted by the Economist in 2016, around 48 percent executives of businesses operating in Asia expected to increase their investment in Indonesia.13
In 2016, Indonesia received more than USD 16 billion in realized foreign direct investment (FDI).14
Over the last three decades, Indonesia has recorded impressive gains in human development. With a human development index (HDI) score of 0.68, Indonesia is placed in the “medium human development” group of countries. Overall, the country was ranked 113 among 188 countries in 2015 having moved up three places from 2010.15 The annual HDI growth slowed in the period from 2010 to 2015 (0.78 percent increase) compared to 2005-2010 (0.92 percent increase). One can argue that part of the reason for the slower growth of HDI in the last five years is that for countries which are already in the medium to high human development category it is harder to increase HDI score at the same pace as those which start at a much lower level.
In 1996 poverty rate in Indonesia was 17.4 percent, but the financial crisis that struck Asia resulted in a steep increase in the proportion of people living below the poverty line (24.2 percent in 1998).
State of economic development
2
11 World Bank Dbase, accessed July 18, 2017.12 These figures are from 2016: GDP data from World Bank database and labour force data from Sakernas. 13 http://ftp01.economist.com.hk/ECN_papers/2016ABOS14 www.bkpm.go.id15 http://hdr.undp.org/en/composite/trends
Indonesia Jobs Outlook 2017
4
Since then, the headcount poverty ratio has decreased, albeit slowly. Between 2010 and 2017, the drop in the poverty rate was almost negligible.16 It only decreased from 11.1 percent to 10.6 percent. During this period income inequality also rose. In 2011, inequality in the distribution of income, measured by the Gini Coefficient, spiked from 0.37 to 0.41. Since then the Gini Coefficient has fallen, but very slightly to 0.39 in 2017.17
Indonesia can be considered as a good example of achieving a relatively balanced growth, especially prior to the financial crisis in 1997. Structural transformation of the Indonesian economy shows that labour productivity, employment and demographics have all positively contributed to economic growth (Khatiwada and Lennon, 2017). Structural transformation is described as the reallocation of resources across the three broad sectors of the economy which are agriculture, industry, and services (Herrendorf, Rogerson, & Valentinyi, 2011).
A key feature of structural transformation is the increase in the share of output in industry and services with a concurrent decrease in the share of agriculture in the total GDP. As countries start to industrialize, “surplus” labour from agriculture is often freed and employed in industry and services. The movement of labour and expansion of the non-agriculture sectors provide the foundation for economic development (Lewis, 1954).
Sustained growth is only possible when all sources of growth are balanced. As such, employment growth without improvement in labour productivity might lead to an impoverishment of the labour force as a result of stagnant wages. At the same time, labour productivity gains that do not result in more job opportunities benefit only those who are already employed, thereby increasing the social divide and rising inequality. Similarly, improvement in education without increasing physical capital, reduce the return to education and new skills are underutilized when latest technology is not deployed. Conversely, underutilization of physical capacity might result when investment by firms is not accompanied by upgrading skills of the labour force.
In the aftermath of the global meltdown of 2008 and in a period that is being described as the new normal, Indonesia maintained its growth momentum. As can be seen from Figure 1, global growth has declined since 2010. Lower-middle income countries such as Indonesia are still experiencing a relatively healthy growth, but growth is slowing down except in the case of Philippines.
In 2016, the Indonesian economy grew by 5 percent, a slight increase compared to the growth rate in 2015 (4.8 percent)18. In the second quarter of 2017, the economy grew (yoy) 5 percent, thus somewhat maintaining its current trajectory. However, several estimates suggest that overall annual growth rate in 2017 will be slightly higher than 2016 and it may pick up further in 2018.19 Driven by strong household consumption and investment, GDP growth is projected to reach 6 percent by 2020.20
16 Susenas, BPS Indonesia.17 Susenas, BPS Indonesia.18 BPS, Indonesia.19 IMF (2016), ADB (2017), World Bank (2017) have forecast growth rate of 5.1-5.3 for Indonesia. 20 World Economic Outlook, IMF, October 2016.
Indo
nesi
a Jo
bs O
utlo
ok 2
017
5
The positive outlook for Indonesia’s growth stems from both external and internal factors. First of all, global economy as a whole is finally showing signs of an uptick. Secondly, the price of commodities is increasing which for a resource rich country like Indonesia can boost its exports. Indonesia is the largest producer of crude palm oil and thermal coal. Other major commodity exports include gas, crude oil, and rubber. Thirdly, the Government of Indonesia has launched a series of reforms or “economic packages” to address regulatory bottlenecks and attract private investment. Public funding for infrastructure is also prioritized and it is likely to increase further.
On the macroeconomic front, a low inflation rate and an accommodative monetary policy which has underpinned growth may continue to spur domestic demand. Over the years household consumption has been the main driver of economic growth. Between 2010 and 2016 the share of household consumption averaged 50 percent of the GDP. Government consumption and gross fixed capital formation averaged around 9 percent and 32 percent of the GDP respectively.
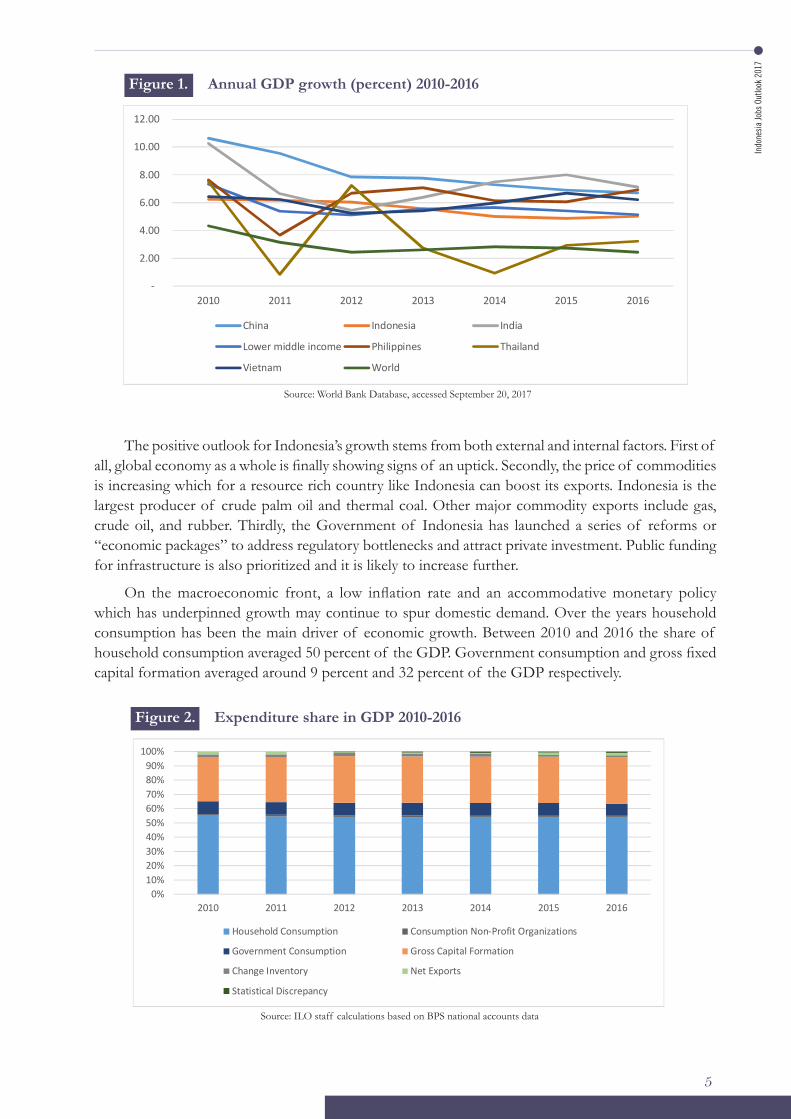
Figure 1. Annual GDP growth (percent) 2010-2016
5
Figure 1. Annual GDP Growth (percent) 2010-2016
Source: World Bank Database, accessed September 20, 2017
The positive outlook for Indonesia’s growth stems from both external and internal factors. First of all, global economy as a whole is finally showing signs of an uptick. Secondly, the price of commodities is increasing which for a resource rich country like Indonesia can boost its exports. Indonesia is the largest producer of crude palm oil and thermal coal. Other major commodity exports include gas, crude oil, and rubber. Thirdly, the Government of Indonesia has launched a series of reforms or “economic packages” to address regulatory bottlenecks and attract private investment. Public funding for infrastructure is also prioritized and it is likely to increase further.
On the macroeconomic front, a low inflation rate and an accommodative monetary policy which has underpinned growth may continue to spur domestic demand. Over the years household consumption has been the main driver of economic growth. Between 2010 and 2016 the share of household consumption averaged 50 percent of the GDP. Government consumption and gross fixed capital formation averaged around 9 percent and 32 percent of the GDP respectively.
-
2.00
4.00
6.00
8.00
10.00
12.00
2010 2011 2012 2013 2014 2015 2016
China Indonesia India
Lower middle income Philippines Thailand
Vietnam World
Source: World Bank Database, accessed September 20, 2017
Figure 2. Expenditure share in GDP 2010-2016
Source: ILO staff calculations based on BPS national accounts data
6
Figure 2. Expenditure share in GDP 2010-2016
Source: ILO staff calculations based on BPS national accounts data
Despite the positive outlook and a relatively healthy growth in the last decade, Indonesian economy is not expanding at the desired level that the current administration aims to reach. With higher infrastructure spending, the government expected that by 2017 the economy would be growing at 7 percent21. Part of the reason for a lower than expected growth is the global environment characterized by low demand22. In the last two decades, Indonesian growth was driven mainly by high commodity prices. Naturally, with less external demand, Indonesia’s exports have suffered.
The nature of growth in Indonesia has also changed considerably. Before 1997 manufacturing played a more dominant role in the economy. Between 1990 and 1997, for example, the growth of value added in manufacturing was 9.8 percent annually. During this period, economy, as a whole, grew 6.9 percent per annum. On the other hand, while the economic growth for the period between 2006 and 2016 averaged 5.4 percent annually, growth in the manufacturing sector averaged only 4.4 percent. Agriculture grew at less than 4 percent annually while industry as a whole which includes mining, construction and manufacturing grew at the same rate (4.4 percent) as manufacturing23.
Between 2006 and 2016, the fastest growing sector of the economy was services which recorded an average annual growth rate of 7 percent24. A commonly held view (Szirmani,
21 http://www.thejakartapost.com/news/2014/12/24/jokowi-aims-7-percent-annual-growth.html 22 https://www.bloomberg.com/news/articles/2017-04-07/indonesia-seeks-growth-boost-to-meet-7-target-indrawati-says 23 ILO staff calculations using 2016 GDP value added figures from World Bank database 24 ibid
0%10%20%30%40%50%60%70%80%90%
100%
2010 2011 2012 2013 2014 2015 2016
Household Consumption Consumption Non-Profit Organizations
Government Consumption Gross Capital Formation
Change Inventory Net Exports
Statistical Discrepancy
Indonesia Jobs Outlook 2017
6
Despite the positive outlook and a relatively healthy growth in the last decade, Indonesian economy is not expanding at the desired level that the current administration aims to reach. With higher infrastructure spending, the government expected that by 2017 the economy would be growing at 7 percent21. Part of the reason for a lower than expected growth is the global environment characterized by low demand.22 In the last two decades, Indonesian growth was driven mainly by high commodity prices. Naturally, with less external demand, Indonesia’s exports have suffered.
The nature of growth in Indonesia has also changed considerably. Before 1997 manufacturing played a more dominant role in the economy. Between 1990 and 1997, for example, the growth of value added in manufacturing was 9.8 percent annually. During this period, economy, as a whole, grew 6.9 percent per annum. On the other hand, while the economic growth for the period between 2006 and 2016 averaged 5.4 percent annually, growth in the manufacturing sector averaged only 4.4 percent. Agriculture grew at less than 4 percent annually while industry as a whole which includes mining, construction and manufacturing grew at the same rate (4.4 percent) as manufacturing.23
Between 2006 and 2016, the fastest growing sector of the economy was services which recorded an average annual growth rate of 7 percent.24 A commonly held view (Szirmani, 2012) is that manufacturing is the catalyst that leads to industrialization and productive jobs. Thus, growth of manufacturing can be seen as more development and welfare enhancing.
However, an alternative view is that services can also be the leading sector in economic development and it is possible for countries to follow a different path as the economy starts to diversify (Bhagwati, 2011). In the case of Indonesia, it may be premature for services to play a dominant and more development role in the economy considering that overall labour productivity in services is relatively low (USD 8,079) compared to manufacturing (USD 14,282).25
Besides slower growth in value added sectors like manufacturing, Indonesian economy also faces some downside risks. As mentioned, public investment in infrastructure is expected to spur growth. But, actual spending may be constrained owing to tight fiscal space and difficulty to run larger budget deficits. The current budget deficit level is already close to the 3 percent legal threshold limit.
Moreover, based on GDP data from the first two quarters of 2017, it appears that household consumption is slowing down. With a large population and a growing middle-class, household consumption is one of the key drivers of economic growth in Indonesia. Lately, the price of commodities has started to increase, but it is not clear how long this will last in light of the economic slowdown in China. Depending on policy response, the dampening appetite for commodities can be a blessing in disguise and an opportunity for Indonesia to revive its manufacturing and other value-added sectors of the economy.
21 http://www.thejakartapost.com/news/2014/12/24/jokowi-aims-7-percent-annual-growth.html22 https://www.bloomberg.com/news/articles/2017-04-07/indonesia-seeks-growth-boost-to-meet-7-target-indrawati-says23 ILO staff calculations using 2016 GDP value added figures from World Bank database.24 Ibid.25 ILO staff calculations using 2016 GDP value added figures from World Bank database and employment figures by sector from
Sakernas 2016.
Indo
nesi
a Jo
bs O
utlo
ok 2
017
7
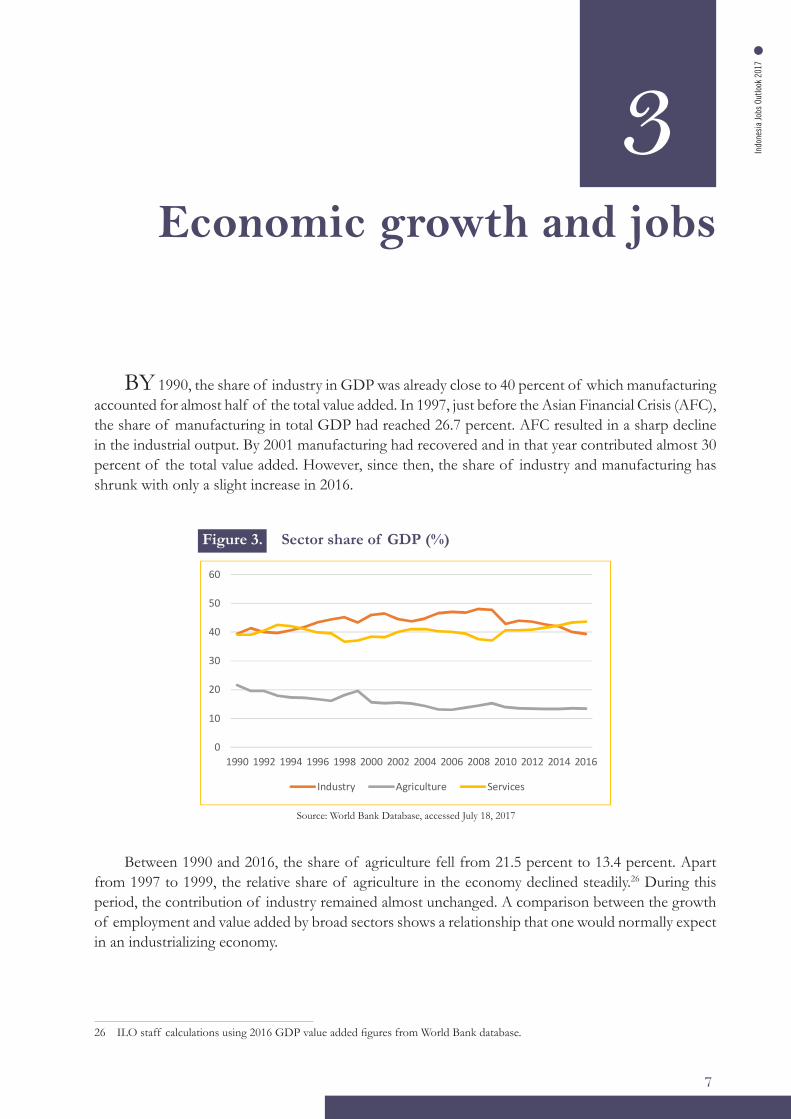
BY 1990, the share of industry in GDP was already close to 40 percent of which manufacturing accounted for almost half of the total value added. In 1997, just before the Asian Financial Crisis (AFC), the share of manufacturing in total GDP had reached 26.7 percent. AFC resulted in a sharp decline in the industrial output. By 2001 manufacturing had recovered and in that year contributed almost 30 percent of the total value added. However, since then, the share of industry and manufacturing has shrunk with only a slight increase in 2016.
26 ILO staff calculations using 2016 GDP value added figures from World Bank database.
Economic growth and jobs
3
Figure 3. Sector share of GDP (%)
Source: World Bank Database, accessed July 18, 2017
8
Figure 3. Sector share of GDP (%)
Source: World Bank Database, accessed July 18, 2017
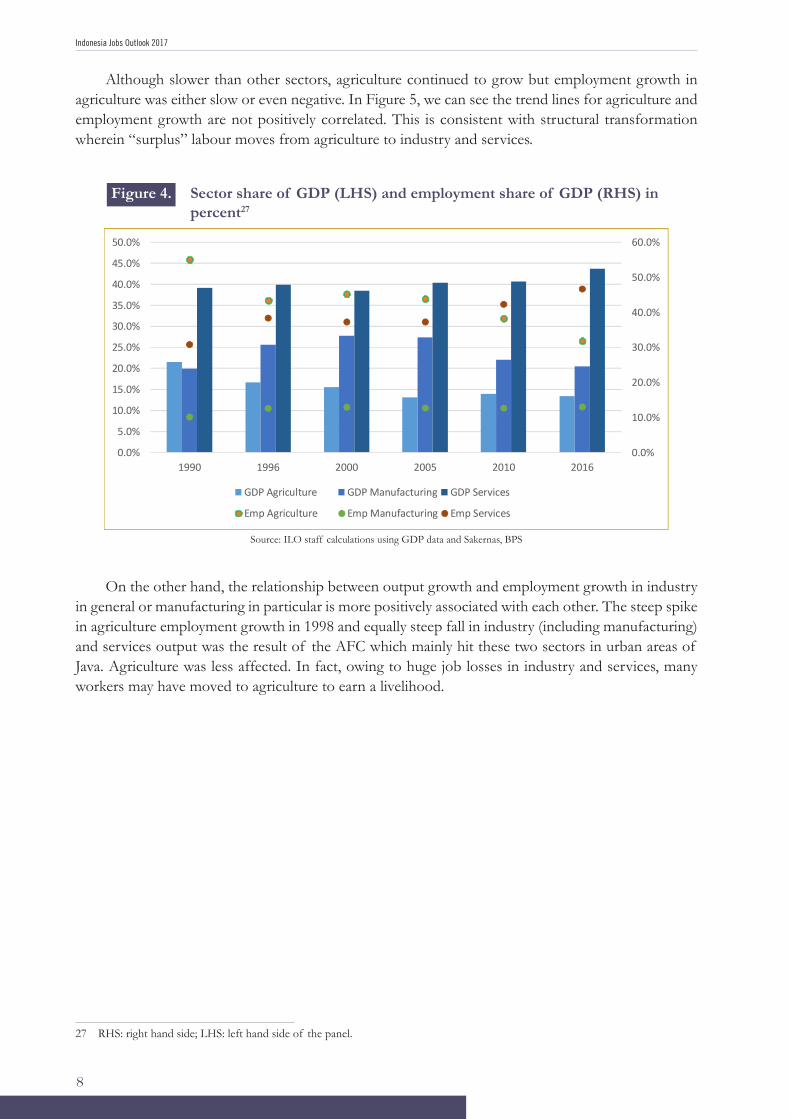
Between 1990 and 2016, the share of agriculture fell from 21.5 percent to 13.4 percent. Apart from 1997 to 1999, the relative share of agriculture in the economy declined steadily26. During this period, the contribution of industry remained almost unchanged. A comparison between the growth of employment and value added by broad sectors shows a relationship that one would normally expect in an industrializing economy. Although slower than other sectors, agriculture continued to grow but employment growth in agriculture was either slow or even negative. In Figure 5, we can see the trend lines for agriculture and employment growth are not positively correlated. This is consistent with structural transformation wherein “surplus” labour moves from agriculture to industry and services.
26 ILO staff calculations using 2016 GDP value added figures from World Bank database
0
10
20
30
40
50
60
1990 1992 1994 1996 1998 2000 2002 2004 2006 2008 2010 2012 2014 2016
Industry Agriculture Services
Between 1990 and 2016, the share of agriculture fell from 21.5 percent to 13.4 percent. Apart from 1997 to 1999, the relative share of agriculture in the economy declined steadily.26 During this period, the contribution of industry remained almost unchanged. A comparison between the growth of employment and value added by broad sectors shows a relationship that one would normally expect in an industrializing economy.
Indonesia Jobs Outlook 2017
89
Figure 4. Sector share of GDP (LHS) and employment share of GDP (RHS) in percent27
Source: ILO staff calculations using GDP data and Sakernas, BPS
On the other hand, the relationship between output growth and employment growth in industry in general or manufacturing in particular is more positively associated with each other. The steep spike in agriculture employment growth in 1998 and equally steep fall in industry (including manufacturing) and services output was the result of the AFC which mainly hit these two sectors in urban areas of Java. Agriculture was less affected. In fact, owing to huge job losses in industry and services, many workers may have moved to agriculture to earn a livelihood.
27 RHS: right hand side; LHS: left hand side of the panel
0.0%
10.0%
20.0%
30.0%
40.0%
50.0%
60.0%
0.0%
5.0%
10.0%
15.0%
20.0%
25.0%
30.0%
35.0%
40.0%
45.0%
50.0%
1990 1996 2000 2005 2010 2016
GDP Agriculture GDP Manufacturing GDP Services
Emp Agriculture Emp Manufacturing Emp Services
Although slower than other sectors, agriculture continued to grow but employment growth in agriculture was either slow or even negative. In Figure 5, we can see the trend lines for agriculture and employment growth are not positively correlated. This is consistent with structural transformation wherein “surplus” labour moves from agriculture to industry and services.
27 RHS: right hand side; LHS: left hand side of the panel.
Figure 4. Sector share of GDP (LHS) and employment share of GDP (RHS) in percent27
Source: ILO staff calculations using GDP data and Sakernas, BPS
On the other hand, the relationship between output growth and employment growth in industry in general or manufacturing in particular is more positively associated with each other. The steep spike in agriculture employment growth in 1998 and equally steep fall in industry (including manufacturing) and services output was the result of the AFC which mainly hit these two sectors in urban areas of Java. Agriculture was less affected. In fact, owing to huge job losses in industry and services, many workers may have moved to agriculture to earn a livelihood.
Indo
nesi
a Jo
bs O
utlo
ok 2
017
9
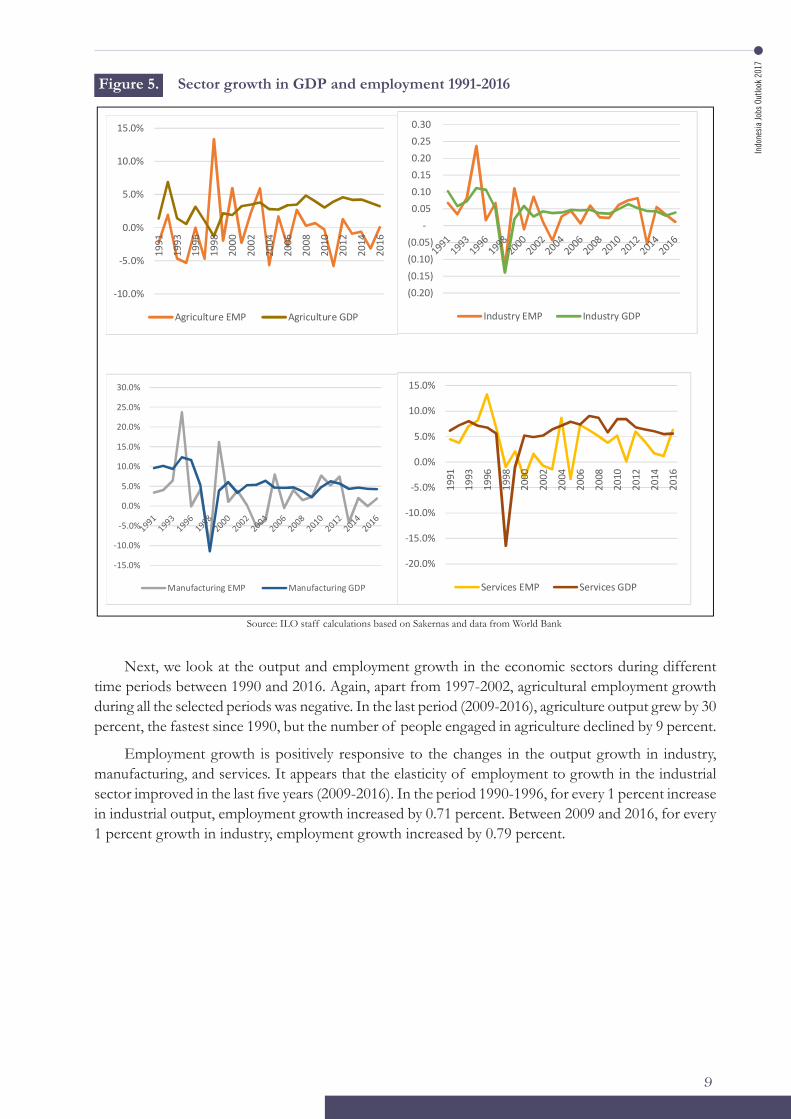
Next, we look at the output and employment growth in the economic sectors during different time periods between 1990 and 2016. Again, apart from 1997-2002, agricultural employment growth during all the selected periods was negative. In the last period (2009-2016), agriculture output grew by 30 percent, the fastest since 1990, but the number of people engaged in agriculture declined by 9 percent.
Employment growth is positively responsive to the changes in the output growth in industry, manufacturing, and services. It appears that the elasticity of employment to growth in the industrial sector improved in the last five years (2009-2016). In the period 1990-1996, for every 1 percent increase in industrial output, employment growth increased by 0.71 percent. Between 2009 and 2016, for every 1 percent growth in industry, employment growth increased by 0.79 percent.
Source: ILO staff calculations based on Sakernas and data from World Bank
Figure 5. Sector growth in GDP and employment 1991-2016
10
Figure 5. Sector growth in GDP and employment 1991-2016
Source: ILO staff calculations based on Sakernas and data from World Bank
Next, we look at the output and employment growth in the economic sectors during different time periods between 1990 and 2016. Again, apart from 1997-2002, agricultural employment growth during all the selected periods was negative. In the last period (2009-2016), agriculture output grew by 30 percent, the fastest since 1990, but the number of people engaged in agriculture declined by 9 percent. Employment growth is positively responsive to the changes in the output growth in industry, manufacturing, and services. It appears that the elasticity of employment to growth in the industrial sector improved in the last five years (2009-2016). In the period 1990-1996, for every 1 percent increase in industrial output, employment growth increased by 0.71 percent. Between 2009 and 2016, for every 1 percent growth in industry, employment growth increased by 0.79 percent.
-10.0%
-5.0%
0.0%
5.0%
10.0%
15.0%
1991
1993
1996
1998
2000
2002
2004
2006
2008
2010
2012
2014
2016
Agriculture EMP Agriculture GDP
(0.20) (0.15) (0.10) (0.05)
- 0.05 0.10 0.15 0.20 0.25 0.30
Industry EMP Industry GDP
-15.0%
-10.0%
-5.0%
0.0%
5.0%
10.0%
15.0%
20.0%
25.0%
30.0%
Manufacturing EMP Manufacturing GDP
-20.0%
-15.0%
-10.0%
-5.0%
0.0%
5.0%
10.0%
15.0%
1991
1993
1996
1998
2000
2002
2004
2006
2008
2010
2012
2014
2016
Services EMP Services GDP
Indonesia Jobs Outlook 2017
10
Table 1. Growth of value added by sectors and employment
Sector /Emp Growth
Agriculture VA
Agriculture Emp
Industry VA
Industry Emp
Manufacturing VA
Manufacturing Emp
Services VA
Services Emp
1990-1996
19%
-10%
70%
50%
84%
42%
51%
42%
2003-2008
18%
-4%
24%
17%
26%
9%
47%
26%
1997-2002
10%
18%
0%
6%
6%
10%
-4%
-1%
2009-2016
30%
-9%
37%
29%
40%
21%
58%
27%
1990-2016
119%
-6%
223%
150%
289%
108%
299%
145%
1990-2016 (Average Annual)
3%
-0.2%
5%
4%
5%
3%
5%
4%
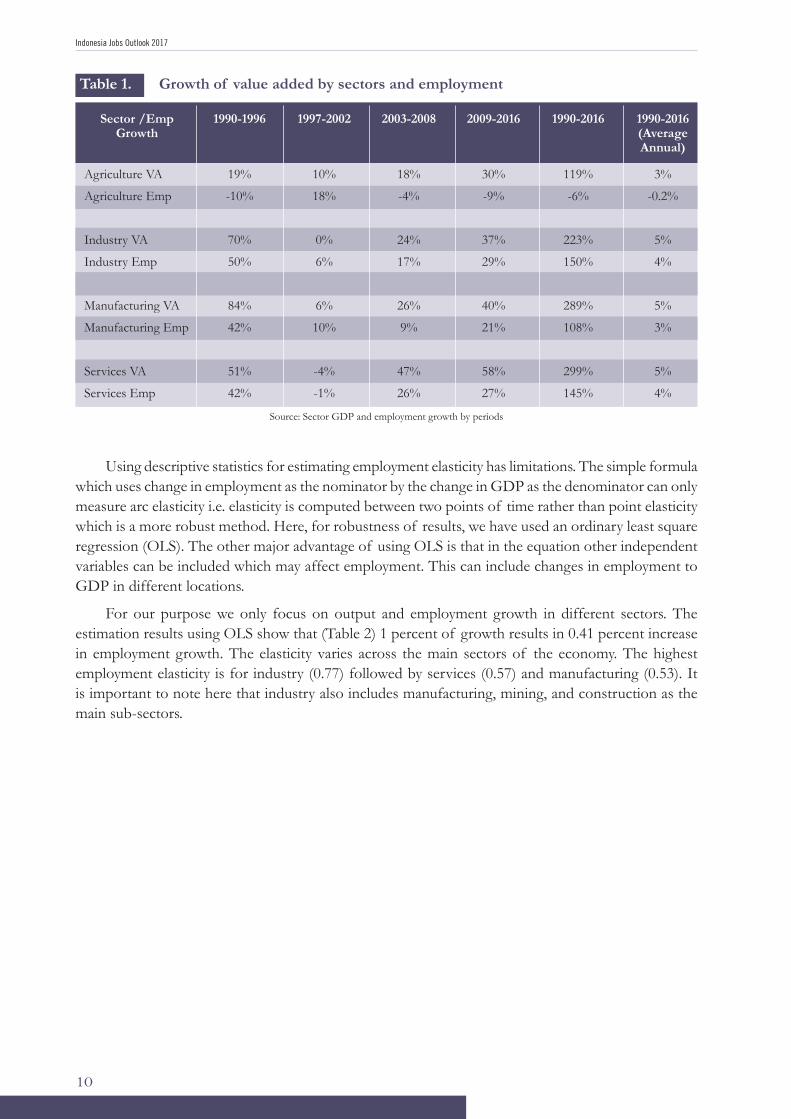
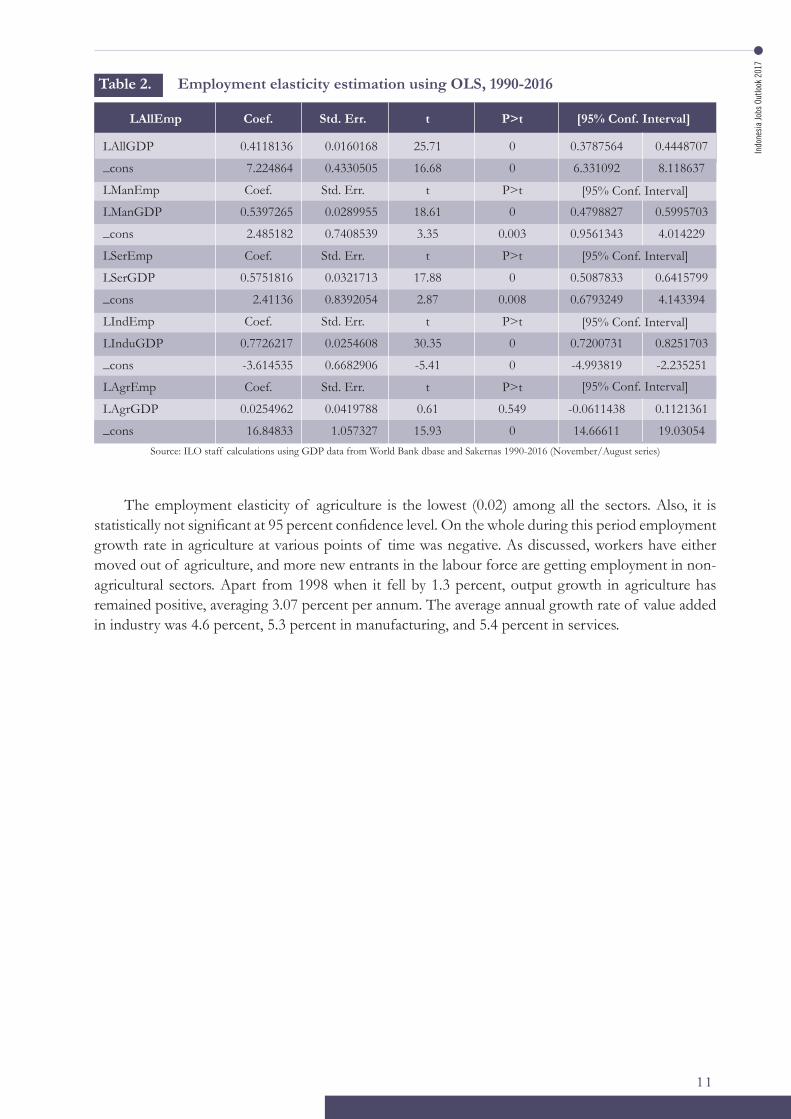
Using descriptive statistics for estimating employment elasticity has limitations. The simple formula which uses change in employment as the nominator by the change in GDP as the denominator can only measure arc elasticity i.e. elasticity is computed between two points of time rather than point elasticity which is a more robust method. Here, for robustness of results, we have used an ordinary least square regression (OLS). The other major advantage of using OLS is that in the equation other independent variables can be included which may affect employment. This can include changes in employment to GDP in different locations.
For our purpose we only focus on output and employment growth in different sectors. The estimation results using OLS show that (Table 2) 1 percent of growth results in 0.41 percent increase in employment growth. The elasticity varies across the main sectors of the economy. The highest employment elasticity is for industry (0.77) followed by services (0.57) and manufacturing (0.53). It is important to note here that industry also includes manufacturing, mining, and construction as the main sub-sectors.
Source: Sector GDP and employment growth by periods
Indo
nesi
a Jo
bs O
utlo
ok 2
017
11
The employment elasticity of agriculture is the lowest (0.02) among all the sectors. Also, it is statistically not significant at 95 percent confidence level. On the whole during this period employment growth rate in agriculture at various points of time was negative. As discussed, workers have either moved out of agriculture, and more new entrants in the labour force are getting employment in non-agricultural sectors. Apart from 1998 when it fell by 1.3 percent, output growth in agriculture has remained positive, averaging 3.07 percent per annum. The average annual growth rate of value added in industry was 4.6 percent, 5.3 percent in manufacturing, and 5.4 percent in services.
Table 2. Employment elasticity estimation using OLS, 1990-2016
LAllEmp
LAllGDP
_cons
LManEmp
LManGDP
_cons
LSerEmp
LSerGDP
_cons
LIndEmp
LInduGDP
_cons
LAgrEmp
LAgrGDP
_cons
Coef.
0.4118136
7.224864
Coef.
0.5397265
2.485182
Coef.
0.5751816
2.41136
Coef.
0.7726217
-3.614535
Coef.
0.0254962
16.84833
t
25.71
16.68
t
18.61
3.35
t
17.88
2.87
t
30.35
-5.41
t
0.61
15.93
Std. Err.
0.0160168
0.4330505
Std. Err.
0.0289955
0.7408539
Std. Err.
0.0321713
0.8392054
Std. Err.
0.0254608
0.6682906
Std. Err.
0.0419788
1.057327
P>t
0
0
P>t
0
0.003
P>t
0
0.008
P>t
0
0
P>t
0.549
0
[95% Conf. Interval]
0.3787564
6.331092
0.4798827
0.9561343
0.5087833
0.6793249
0.7200731
-4.993819
-0.0611438
14.66611
0.4448707
8.118637
0.5995703
4.014229
0.6415799
4.143394
0.8251703
-2.235251
0.1121361
19.03054
[95% Conf. Interval]
[95% Conf. Interval]
[95% Conf. Interval]
[95% Conf. Interval]
Source: ILO staff calculations using GDP data from World Bank dbase and Sakernas 1990-2016 (November/August series)

Indonesia Jobs Outlook 2017
12
Indo
nesi
a Jo
bs O
utlo
ok 2
017
13
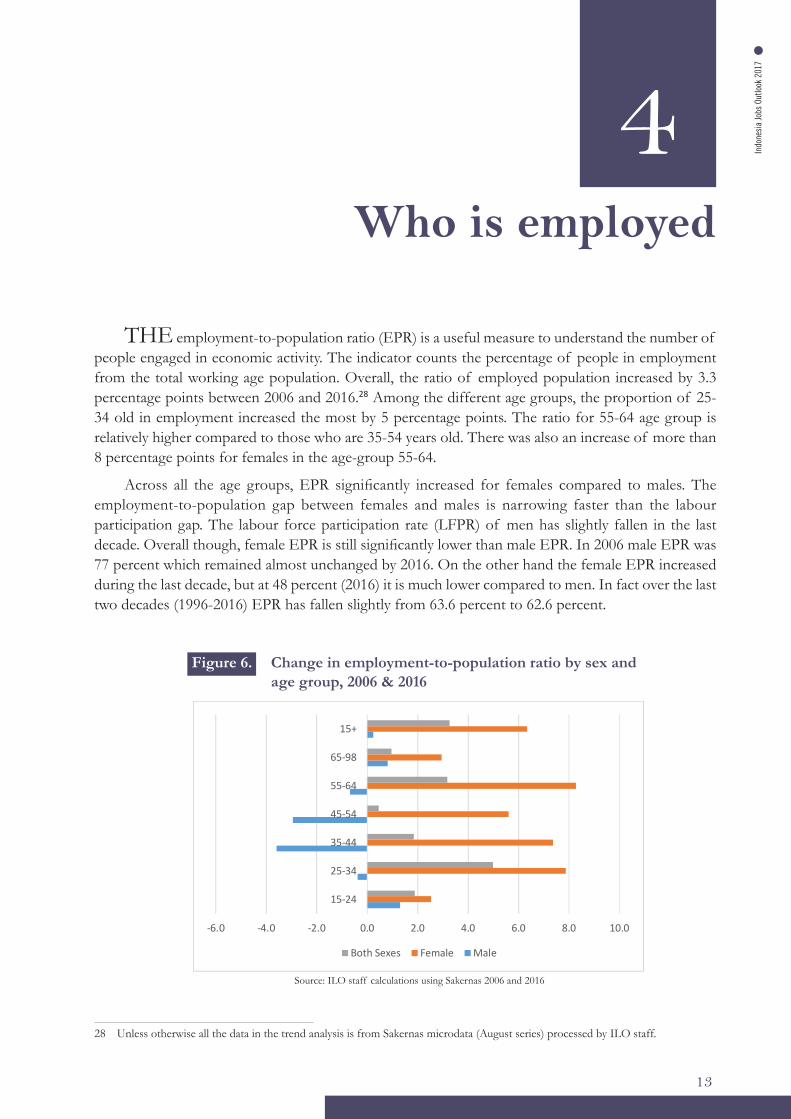
THE employment-to-population ratio (EPR) is a useful measure to understand the number of people engaged in economic activity. The indicator counts the percentage of people in employment from the total working age population. Overall, the ratio of employed population increased by 3.3 percentage points between 2006 and 2016.28 Among the different age groups, the proportion of 25-34 old in employment increased the most by 5 percentage points. The ratio for 55-64 age group is relatively higher compared to those who are 35-54 years old. There was also an increase of more than 8 percentage points for females in the age-group 55-64.
Across all the age groups, EPR significantly increased for females compared to males. The employment-to-population gap between females and males is narrowing faster than the labour participation gap. The labour force participation rate (LFPR) of men has slightly fallen in the last decade. Overall though, female EPR is still significantly lower than male EPR. In 2006 male EPR was 77 percent which remained almost unchanged by 2016. On the other hand the female EPR increased during the last decade, but at 48 percent (2016) it is much lower compared to men. In fact over the last two decades (1996-2016) EPR has fallen slightly from 63.6 percent to 62.6 percent.
Who is employed
4
28 Unless otherwise all the data in the trend analysis is from Sakernas microdata (August series) processed by ILO staff.
Figure 6. Change in employment-to-population ratio by sex and age group, 2006 & 2016
13
Figure 6: Change in Employment-to-population ratio by sex and age group, 2006 & 2016
Source: ILO staff calculations using Sakernas 2006 and 2016
Between 1996 and 2016 the number of employed increased by more than 34 million people. On an average, annually, 1.74 million additional workers found employment. Between 1996 and 2006, 11.9 million workers were added while in the period from 2006 to 2016, the number of employed increased by almost 23 million. In other words, the pace of employment growth quickened significantly in the last decade compared to the decade before it. However, looking further back jobs creation between 1990 and 1996 was much more robust. On average jobs were added at a rate of 2.2 percent annually. The rate dropped (1.1 percent) significantly between 1996 and 2006 before increasing again (1.7 percent) in the period from 2006 to 2016. In the three periods discussed, the slow growth of jobs from 1996 to 2006 maybe attributed to the prolonged effect of the AFC which hit Indonesia the hardest in the region. A sectoral breakdown of employment data show that agriculture is still the largest source of employment (31.9 percent) followed by services (24.2 percent) and trade (22.5 percent). Combined together though, trade & services, account for almost half (46.7 percent) of the people employed in Indonesia. In the last decade the share of employment in manufacturing has marginally increased from 12.5 percent (2006) to 13.1 percent (2016). During this period, around 3.7 million more workers were added to the manufacturing sector. However, the rate of employment growth in manufacturing is a lot slower than trade and services.
-6.0 -4.0 -2.0 0.0 2.0 4.0 6.0 8.0 10.0
15-24
25-34
35-44
45-54
55-64
65-98
15+
Both Sexes Female Male
Source: ILO staff calculations using Sakernas 2006 and 2016
Indonesia Jobs Outlook 2017
14
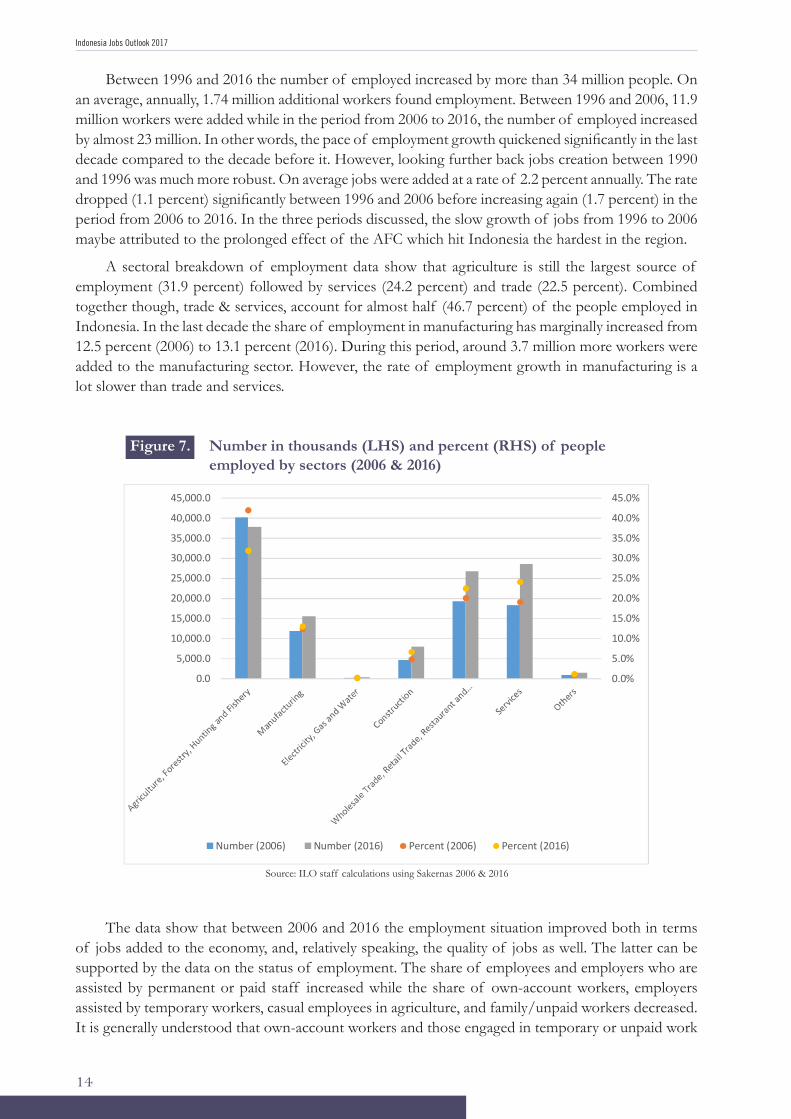
Between 1996 and 2016 the number of employed increased by more than 34 million people. On an average, annually, 1.74 million additional workers found employment. Between 1996 and 2006, 11.9 million workers were added while in the period from 2006 to 2016, the number of employed increased by almost 23 million. In other words, the pace of employment growth quickened significantly in the last decade compared to the decade before it. However, looking further back jobs creation between 1990 and 1996 was much more robust. On average jobs were added at a rate of 2.2 percent annually. The rate dropped (1.1 percent) significantly between 1996 and 2006 before increasing again (1.7 percent) in the period from 2006 to 2016. In the three periods discussed, the slow growth of jobs from 1996 to 2006 maybe attributed to the prolonged effect of the AFC which hit Indonesia the hardest in the region.
A sectoral breakdown of employment data show that agriculture is still the largest source of employment (31.9 percent) followed by services (24.2 percent) and trade (22.5 percent). Combined together though, trade & services, account for almost half (46.7 percent) of the people employed in Indonesia. In the last decade the share of employment in manufacturing has marginally increased from 12.5 percent (2006) to 13.1 percent (2016). During this period, around 3.7 million more workers were added to the manufacturing sector. However, the rate of employment growth in manufacturing is a lot slower than trade and services.
Figure 7. Number in thousands (LHS) and percent (RHS) of people employed by sectors (2006 & 2016)
14
Figure 7. Number in thousands (LHS) and percent (RHS) of people employed by sectors (2006 & 2016)
Source: ILO staff calculations using Sakernas 2006 & 2016
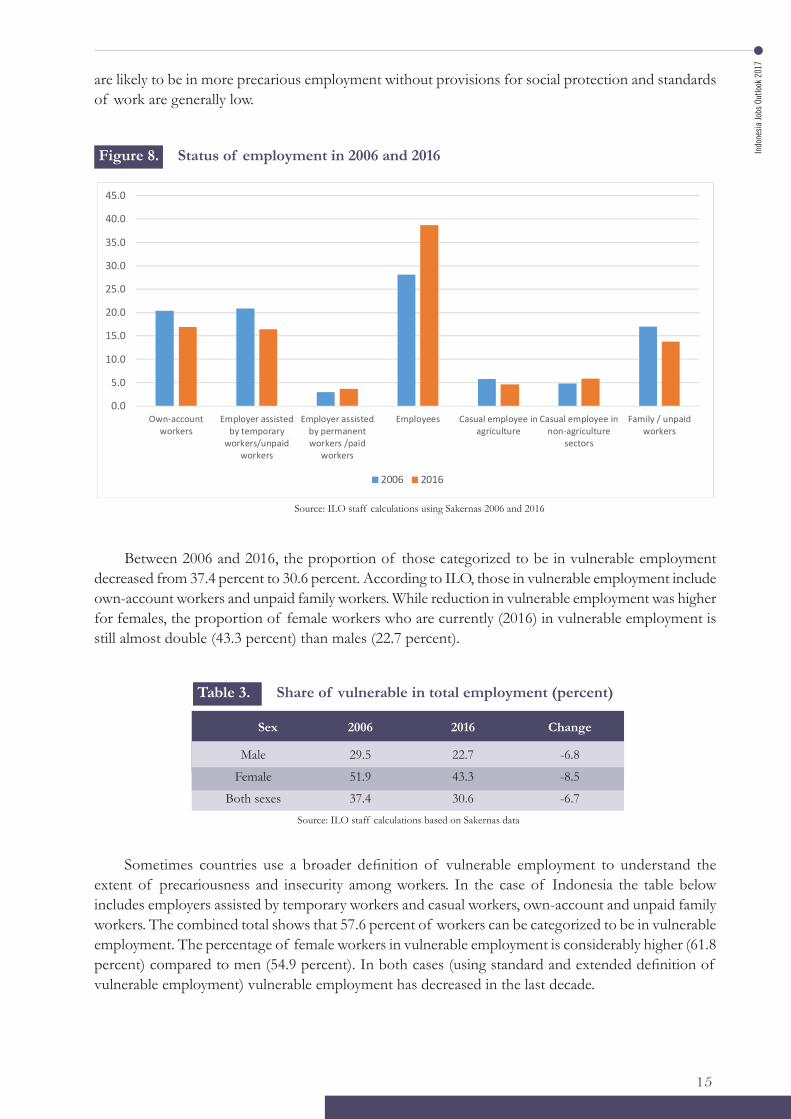
The data show that between 2006 and 2016 the employment situation improved both in terms of jobs added to the economy, and, relatively speaking, the quality of jobs as well. The latter can be supported by the data on the status of employment. The share of employees and employers who are assisted by permanent or paid staff increased while the share of own-account workers, employers assisted by temporary workers, casual employees in agriculture, and family/unpaid workers decreased. It is generally understood that own-account workers and those engaged in temporary or unpaid work are likely to be in more precarious employment without provisions for social protection and standards of work are generally low.
0.0%
5.0%
10.0%
15.0%
20.0%
25.0%
30.0%
35.0%
40.0%
45.0%
0.0
5,000.0
10,000.0
15,000.0
20,000.0
25,000.0
30,000.0
35,000.0
40,000.0
45,000.0
Number (2006) Number (2016) Percent (2006) Percent (2016)
Source: ILO staff calculations using Sakernas 2006 & 2016
The data show that between 2006 and 2016 the employment situation improved both in terms of jobs added to the economy, and, relatively speaking, the quality of jobs as well. The latter can be supported by the data on the status of employment. The share of employees and employers who are assisted by permanent or paid staff increased while the share of own-account workers, employers assisted by temporary workers, casual employees in agriculture, and family/unpaid workers decreased. It is generally understood that own-account workers and those engaged in temporary or unpaid work
Indo
nesi
a Jo
bs O
utlo
ok 2
017
15
are likely to be in more precarious employment without provisions for social protection and standards of work are generally low.
Figure 8. Status of employment in 2006 and 2016
15
Figure 8. Status of employment in 2006 and 2016
Source: ILO staff calculations using Sakernas 2006 and 2016
Between 2006 and 2016, the proportion of those categorized to be in vulnerable employment decreased from 37.4 percent to 30.6 percent. According to ILO, those in vulnerable employment include own-account workers and unpaid family workers. While reduction in vulnerable employment was higher for females, the proportion of female workers who are currently (2016) in vulnerable employment is still almost double (43.3 percent) than males (22.7 percent).
Table 3. Share of vulnerable in total employment (percent)
Sex 2006 2016 Change
Male 29.5 22.7 -6.8
Female 51.9 43.3 -8.5
Both sexes 37.4 30.6 -6.7
Source: ILO staff calculations based on Sakernas data
Sometimes countries use a broader definition of vulnerable employment to understand the extent of precariousness and insecurity among workers. In the case of Indonesia the table below includes employers assisted by temporary workers and casual workers, own-account and unpaid family workers. The combined total shows that 57.6 percent of workers can be categorized to be in vulnerable employment. The percentage of female workers in vulnerable employment is considerably higher (61.8 percent) compared to men (54.9 percent). In both
0.0
5.0
10.0
15.0
20.0
25.0
30.0
35.0
40.0
45.0
Own-accountworkers
Employer assistedby temporary
workers/unpaidworkers
Employer assistedby permanentworkers /paid
workers
Employees Casual employee inagriculture
Casual employee innon-agriculture
sectors
Family / unpaidworkers
2006 2016
Source: ILO staff calculations using Sakernas 2006 and 2016
Between 2006 and 2016, the proportion of those categorized to be in vulnerable employment decreased from 37.4 percent to 30.6 percent. According to ILO, those in vulnerable employment include own-account workers and unpaid family workers. While reduction in vulnerable employment was higher for females, the proportion of female workers who are currently (2016) in vulnerable employment is still almost double (43.3 percent) than males (22.7 percent).
Table 3. Share of vulnerable in total employment (percent)
Sex 2006 2016 Change
Male
Female
Both sexes
29.5
51.9
37.4
22.7
43.3
30.6
-6.8
-8.5
-6.7Source: ILO staff calculations based on Sakernas data
Sometimes countries use a broader definition of vulnerable employment to understand the extent of precariousness and insecurity among workers. In the case of Indonesia the table below includes employers assisted by temporary workers and casual workers, own-account and unpaid family workers. The combined total shows that 57.6 percent of workers can be categorized to be in vulnerable employment. The percentage of female workers in vulnerable employment is considerably higher (61.8 percent) compared to men (54.9 percent). In both cases (using standard and extended definition of vulnerable employment) vulnerable employment has decreased in the last decade.
Indonesia Jobs Outlook 2017
16
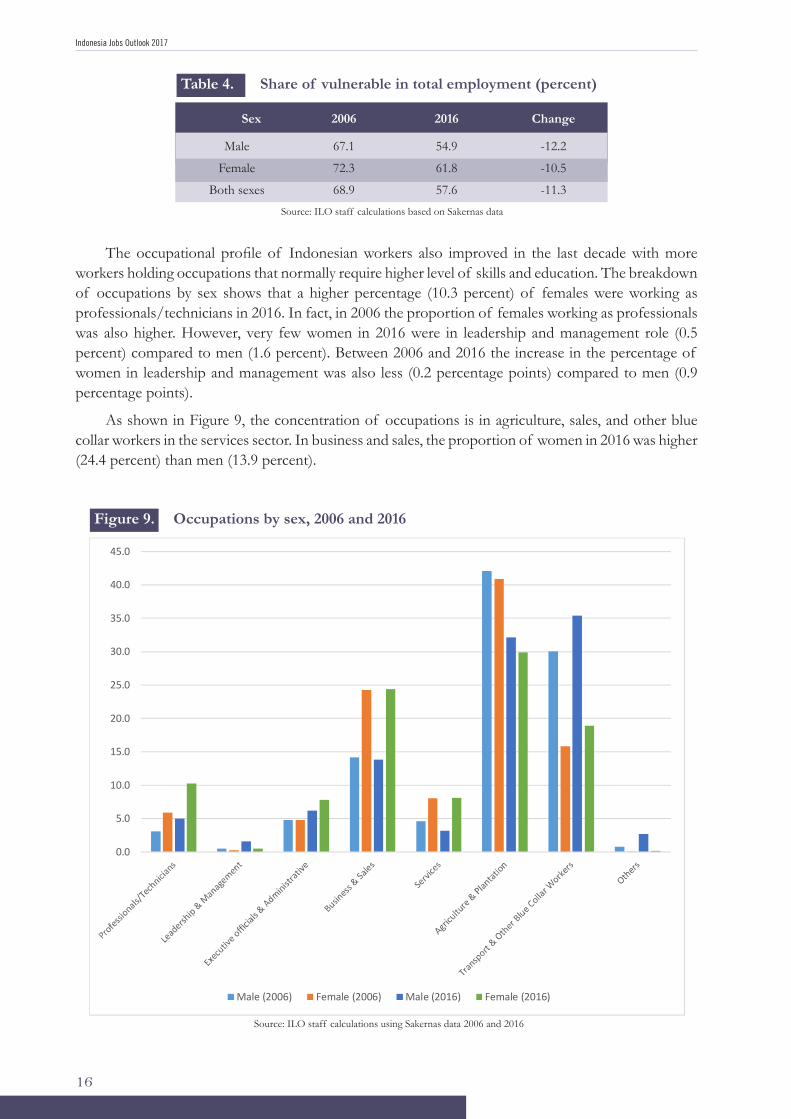
The occupational profile of Indonesian workers also improved in the last decade with more workers holding occupations that normally require higher level of skills and education. The breakdown of occupations by sex shows that a higher percentage (10.3 percent) of females were working as professionals/technicians in 2016. In fact, in 2006 the proportion of females working as professionals was also higher. However, very few women in 2016 were in leadership and management role (0.5 percent) compared to men (1.6 percent). Between 2006 and 2016 the increase in the percentage of women in leadership and management was also less (0.2 percentage points) compared to men (0.9 percentage points).
As shown in Figure 9, the concentration of occupations is in agriculture, sales, and other blue collar workers in the services sector. In business and sales, the proportion of women in 2016 was higher (24.4 percent) than men (13.9 percent).
Table 4. Share of vulnerable in total employment (percent)
Sex 2006 2016 Change
Male
Female
Both sexes
67.1
72.3
68.9
54.9
61.8
57.6
-12.2
-10.5
-11.3Source: ILO staff calculations based on Sakernas data
Figure 9. Occupations by sex, 2006 and 2016
17
Figure 9. Occupations by sex, 2006 and 2016
Source: ILO staff calculations using Sakernas data 2006 and 2016
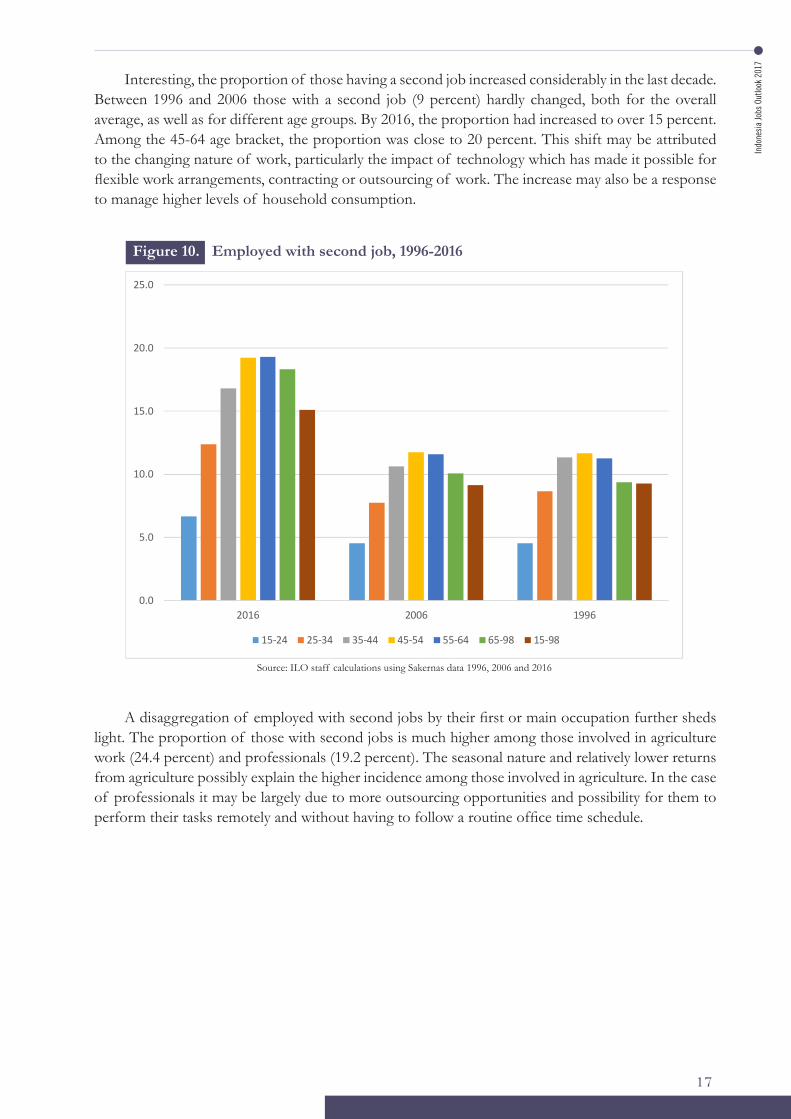
Interesting, the proportion of those having a second job increased considerably in the last decade. Between 1996 and 2006 those with a second job (9 percent) hardly changed, both for the overall average, as well as for different age groups. By 2016, the proportion had increased to over 15 percent. Among the 45-64 age bracket, the proportion was close to 20 percent. This shift may be attributed to the changing nature of work, particularly the impact of technology which has made it possible for flexible work arrangements, contracting or outsourcing of work. The increase may also be a response to manage higher levels of household consumption.
0.0
5.0
10.0
15.0
20.0
25.0
30.0
35.0
40.0
45.0
Male (2006) Female (2006) Male (2016) Female (2016)
Source: ILO staff calculations using Sakernas data 2006 and 2016
Indo
nesi
a Jo
bs O
utlo
ok 2
017
17
Interesting, the proportion of those having a second job increased considerably in the last decade. Between 1996 and 2006 those with a second job (9 percent) hardly changed, both for the overall average, as well as for different age groups. By 2016, the proportion had increased to over 15 percent. Among the 45-64 age bracket, the proportion was close to 20 percent. This shift may be attributed to the changing nature of work, particularly the impact of technology which has made it possible for flexible work arrangements, contracting or outsourcing of work. The increase may also be a response to manage higher levels of household consumption.
Figure 10. Employed with second job, 1996-2016
Source: ILO staff calculations using Sakernas data 1996, 2006 and 2016
18
Figure 10. Employed with second job, 1996-2016
Source: ILO staff calculations using Sakernas data 1996, 2006 and 2016
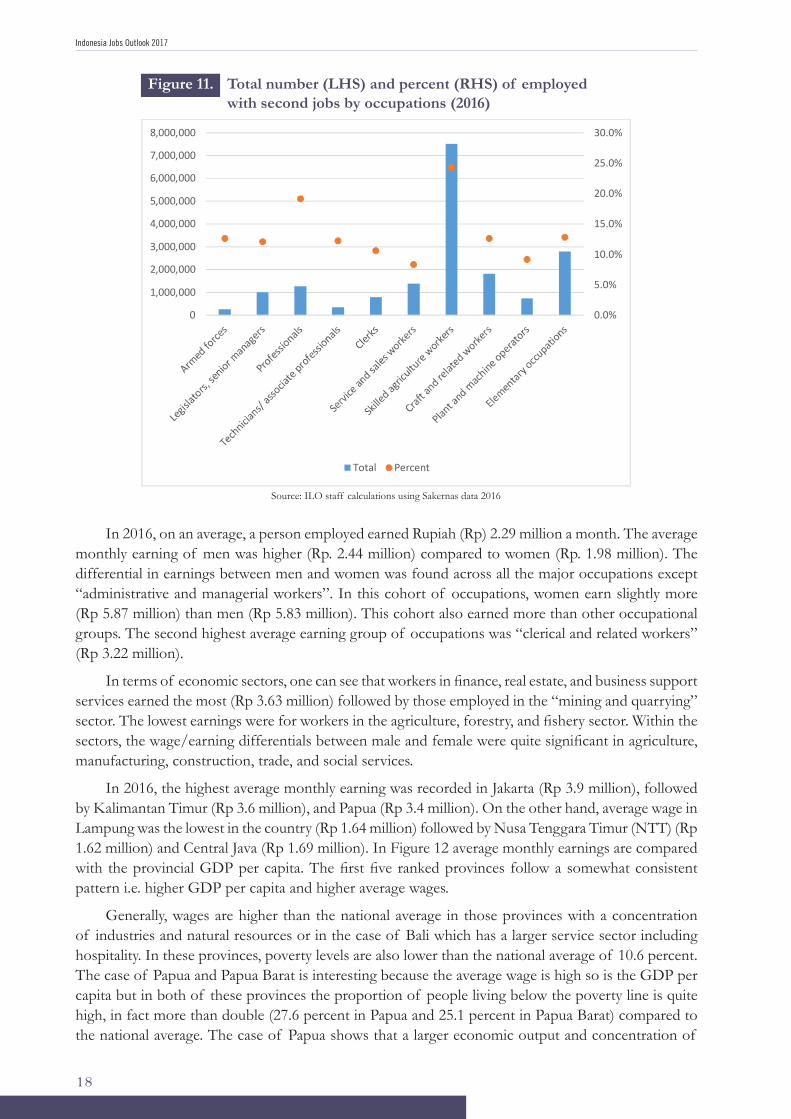
A disaggregation of employed with second jobs by their first or main occupation further sheds light. The proportion of those with second jobs is much higher among those involved in agriculture work (24.4 percent) and professionals (19.2 percent). The seasonal nature and relatively lower returns from agriculture possibly explain the higher incidence among those involved in agriculture. In the case of professionals it may be largely due to more outsourcing opportunities and possibility for them to perform their tasks remotely and without having to follow a routine office time schedule.
0.0
5.0
10.0
15.0
20.0
25.0
2016 2006 1996
15-24 25-34 35-44 45-54 55-64 65-98 15-98
A disaggregation of employed with second jobs by their first or main occupation further sheds light. The proportion of those with second jobs is much higher among those involved in agriculture work (24.4 percent) and professionals (19.2 percent). The seasonal nature and relatively lower returns from agriculture possibly explain the higher incidence among those involved in agriculture. In the case of professionals it may be largely due to more outsourcing opportunities and possibility for them to perform their tasks remotely and without having to follow a routine office time schedule.
Indonesia Jobs Outlook 2017
18
In 2016, on an average, a person employed earned Rupiah (Rp) 2.29 million a month. The average monthly earning of men was higher (Rp. 2.44 million) compared to women (Rp. 1.98 million). The differential in earnings between men and women was found across all the major occupations except “administrative and managerial workers”. In this cohort of occupations, women earn slightly more (Rp 5.87 million) than men (Rp 5.83 million). This cohort also earned more than other occupational groups. The second highest average earning group of occupations was “clerical and related workers” (Rp 3.22 million).
In terms of economic sectors, one can see that workers in finance, real estate, and business support services earned the most (Rp 3.63 million) followed by those employed in the “mining and quarrying” sector. The lowest earnings were for workers in the agriculture, forestry, and fishery sector. Within the sectors, the wage/earning differentials between male and female were quite significant in agriculture, manufacturing, construction, trade, and social services.
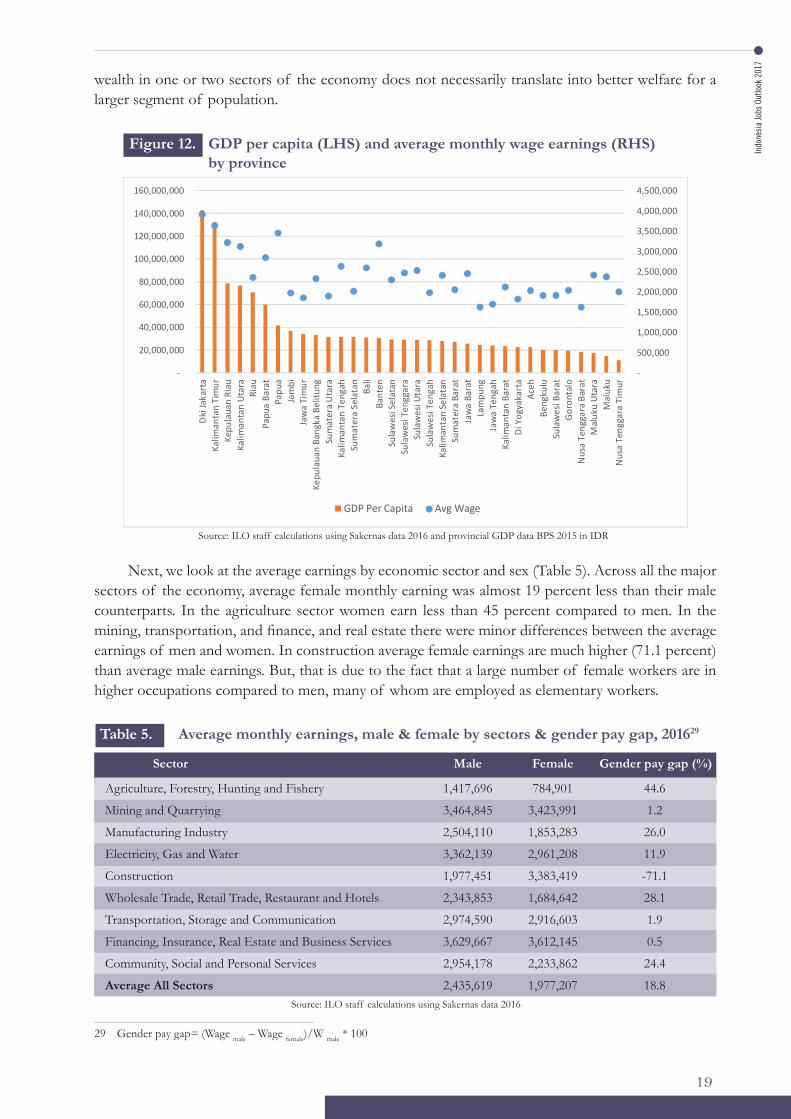
In 2016, the highest average monthly earning was recorded in Jakarta (Rp 3.9 million), followed by Kalimantan Timur (Rp 3.6 million), and Papua (Rp 3.4 million). On the other hand, average wage in Lampung was the lowest in the country (Rp 1.64 million) followed by Nusa Tenggara Timur (NTT) (Rp 1.62 million) and Central Java (Rp 1.69 million). In Figure 12 average monthly earnings are compared with the provincial GDP per capita. The first five ranked provinces follow a somewhat consistent pattern i.e. higher GDP per capita and higher average wages.
Generally, wages are higher than the national average in those provinces with a concentration of industries and natural resources or in the case of Bali which has a larger service sector including hospitality. In these provinces, poverty levels are also lower than the national average of 10.6 percent. The case of Papua and Papua Barat is interesting because the average wage is high so is the GDP per capita but in both of these provinces the proportion of people living below the poverty line is quite high, in fact more than double (27.6 percent in Papua and 25.1 percent in Papua Barat) compared to the national average. The case of Papua shows that a larger economic output and concentration of
Figure 11. Total number (LHS) and percent (RHS) of employed with second jobs by occupations (2016)
19
Figure 11. Total number (LHS) and percent (RHS) of employed with second jobs by occupations (2016)
Source: ILO staff calculations using Sakernas data 2016
In 2016, on an average, a person employed earned Rupiah (Rp) 2.29 million a month. The average monthly earning of men was higher (Rp. 2.44 million) compared to women (Rp. 1.98 million). The differential in earnings between men and women was found across all the major occupations except “administrative and managerial workers”. In this cohort of occupations, women earn slightly more (Rp 5.87 million) than men (Rp 5.83 million). This cohort also earned more than other occupational groups. The second highest average earning group of occupations was “clerical and related workers” (Rp 3.22 million). In terms of economic sectors, one can see that workers in finance, real estate, and business support services earned the most (Rp 3.63 million) followed by those employed in the “mining and quarrying” sector. The lowest earnings were for workers in the agriculture, forestry, and fishery sector. Within the sectors, the wage/earning differentials between male and female were quite significant in agriculture, manufacturing, construction, trade, and social services. In 2016, the highest average monthly earning was recorded in Jakarta (Rp 3.9 million), followed by Kalimantan Timur (Rp 3.6 million), and Papua (Rp 3.4 million). On the other hand, average wage in Lampung was the lowest in the country (Rp 1.64 million) followed by Nusa Tenggara Timur (NTT) (Rp 1.62 million) and Central Java (Rp 1.69). In Figure 12 average monthly earnings are compared with the provincial GDP per capita. The first five ranked
0.0%
5.0%
10.0%
15.0%
20.0%
25.0%
30.0%
0
1,000,000
2,000,000
3,000,000
4,000,000
5,000,000
6,000,000
7,000,000
8,000,000
Total Percent
Source: ILO staff calculations using Sakernas data 2016
Indo
nesi
a Jo
bs O
utlo
ok 2
017
19
wealth in one or two sectors of the economy does not necessarily translate into better welfare for a larger segment of population.
Figure 12. GDP per capita (LHS) and average monthly wage earnings (RHS) by province
Source: ILO staff calculations using Sakernas data 2016 and provincial GDP data BPS 2015 in IDR
20
provinces follow a somewhat consistent pattern i.e. higher GDP per capita and higher average wages. Generally, wages are higher than the national average in those provinces with a concentration of industries and natural resources or in the case of Bali which has a larger service sector including hospitality. In these provinces, poverty levels are also lower than the national average of 10.6 percent. The case of Papua and Papua Barat is interesting because the average wage is high so is the GDP per capita but in both of these provinces the proportion of people living the poverty line is quite high, in fact more than double (27.6 percent in Papua and 25.1 percent in Papua Barat) compared to the national average. The case of Papua shows that a larger economic output and concentration of wealth in one or two sectors of the economy does not necessarily translate into better welfare for a larger segment of population.
Figure 12. GDP per capita (LHS) and average monthly wage earnings (RHS) by province
Source: ILO staff calculations using Sakernas data 2016 and provincial GDP data BPS 2015 in IDR
Next, we look at the average earnings by economic sector and sex (Table 5). Across all the major sectors of the economy, average female monthly earning was almost 19 percent less than their male counterparts. In the agriculture sector women earn less than 45 percent compared to men. In the mining, transportation, and finance, and real estate there were minor differences between the average earnings of men and women. In construction average female earnings are much higher (71.1 percent) than average male earnings. But, that is due to the fact that a large number of female workers are in higher occupations compared to men many of whom are employed as elementary workers.
-
500,000
1,000,000
1,500,000
2,000,000
2,500,000
3,000,000
3,500,000
4,000,000
4,500,000
-
20,000,000
40,000,000
60,000,000
80,000,000
100,000,000
120,000,000
140,000,000
160,000,000D
ki Ja
kart
aKa
liman
tan
Tim
urKe
pula
uan
Riau
Kalim
anta
n U
tara
Riau
Papu
a Ba
rat
Papu
aJa
mbi
Jaw
a Ti
mur
Kepu
laua
n Ba
ngka
Bel
itung
Sum
ater
a U
tara
Kalim
anta
n Te
ngah
Sum
ater
a Se
lata
nBa
liBa
nten
Sula
wes
i Sel
atan
Sula
wes
i Ten
ggar
aSu
law
esi U
tara
Sula
wes
i Ten
gah
Kalim
anta
n Se
lata
nSu
mat
era
Bara
tJa
wa
Bara
tLa
mpu
ngJa
wa
Teng
ahKa
liman
tan
Bara
tD
i Yog
yaka
rta
Aceh
Beng
kulu
Sula
wes
i Bar
atG
oron
talo
Nus
a Te
ngga
ra B
arat
Mal
uku
Uta
raM
aluk
uN
usa
Teng
gara
Tim
ur
GDP Per Capita Avg Wage
Next, we look at the average earnings by economic sector and sex (Table 5). Across all the major sectors of the economy, average female monthly earning was almost 19 percent less than their male counterparts. In the agriculture sector women earn less than 45 percent compared to men. In the mining, transportation, and finance, and real estate there were minor differences between the average earnings of men and women. In construction average female earnings are much higher (71.1 percent) than average male earnings. But, that is due to the fact that a large number of female workers are in higher occupations compared to men, many of whom are employed as elementary workers.
Table 5. Average monthly earnings, male & female by sectors & gender pay gap, 201629
Sector Male Female Gender pay gap (%)
Agriculture, Forestry, Hunting and Fishery
Mining and Quarrying
Manufacturing Industry
Electricity, Gas and Water
Construction
Wholesale Trade, Retail Trade, Restaurant and Hotels
Transportation, Storage and Communication
Financing, Insurance, Real Estate and Business Services
Community, Social and Personal Services
Average All Sectors
1,417,696
3,464,845
2,504,110
3,362,139
1,977,451
2,343,853
2,974,590
3,629,667
2,954,178
2,435,619
784,901
3,423,991
1,853,283
2,961,208
3,383,419
1,684,642
2,916,603
3,612,145
2,233,862
1,977,207
44.6
1.2
26.0
11.9
-71.1
28.1
1.9
0.5
24.4
18.8Source: ILO staff calculations using Sakernas data 2016
29 Gender pay gap= (Wage male – Wage female)/W male * 100
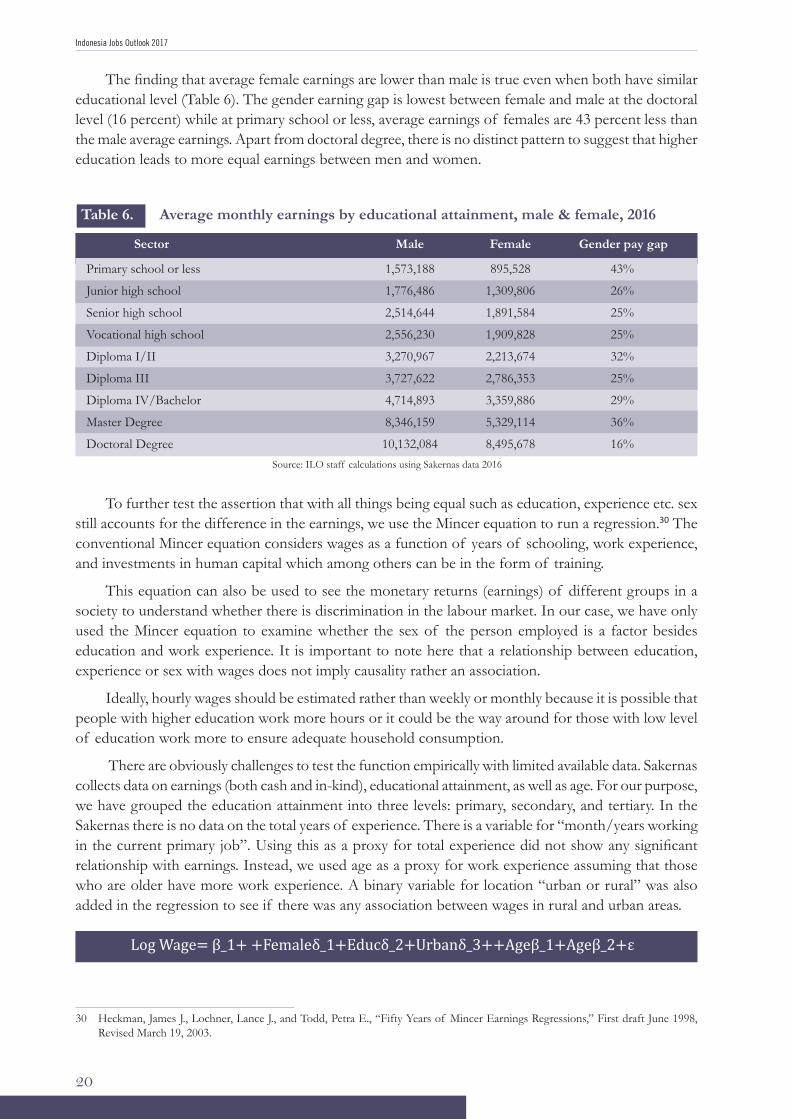
Indonesia Jobs Outlook 2017
20
The finding that average female earnings are lower than male is true even when both have similar educational level (Table 6). The gender earning gap is lowest between female and male at the doctoral level (16 percent) while at primary school or less, average earnings of females are 43 percent less than the male average earnings. Apart from doctoral degree, there is no distinct pattern to suggest that higher education leads to more equal earnings between men and women.
Table 6. Average monthly earnings by educational attainment, male & female, 2016
Sector Male Female Gender pay gap
Primary school or less
Junior high school
Senior high school
Vocational high school
Diploma I/II
Diploma III
Diploma IV/Bachelor
Master Degree
Doctoral Degree
1,573,188
1,776,486
2,514,644
2,556,230
3,270,967
3,727,622
4,714,893
8,346,159
10,132,084
895,528
1,309,806
1,891,584
1,909,828
2,213,674
2,786,353
3,359,886
5,329,114
8,495,678
43%
26%
25%
25%
32%
25%
29%
36%
16%Source: ILO staff calculations using Sakernas data 2016
To further test the assertion that with all things being equal such as education, experience etc. sex still accounts for the difference in the earnings, we use the Mincer equation to run a regression.30 The conventional Mincer equation considers wages as a function of years of schooling, work experience, and investments in human capital which among others can be in the form of training.
This equation can also be used to see the monetary returns (earnings) of different groups in a society to understand whether there is discrimination in the labour market. In our case, we have only used the Mincer equation to examine whether the sex of the person employed is a factor besides education and work experience. It is important to note here that a relationship between education, experience or sex with wages does not imply causality rather an association.
Ideally, hourly wages should be estimated rather than weekly or monthly because it is possible that people with higher education work more hours or it could be the way around for those with low level of education work more to ensure adequate household consumption.
There are obviously challenges to test the function empirically with limited available data. Sakernas collects data on earnings (both cash and in-kind), educational attainment, as well as age. For our purpose, we have grouped the education attainment into three levels: primary, secondary, and tertiary. In the Sakernas there is no data on the total years of experience. There is a variable for “month/years working in the current primary job”. Using this as a proxy for total experience did not show any significant relationship with earnings. Instead, we used age as a proxy for work experience assuming that those who are older have more work experience. A binary variable for location “urban or rural” was also added in the regression to see if there was any association between wages in rural and urban areas.
30 Heckman, James J., Lochner, Lance J., and Todd, Petra E., “Fifty Years of Mincer Earnings Regressions,” First draft June 1998, Revised March 19, 2003.
Log Wage= β_1+ +Femaleδ_1+Educδ_2+Urbanδ_3++Ageβ_1+Ageβ_2+ε
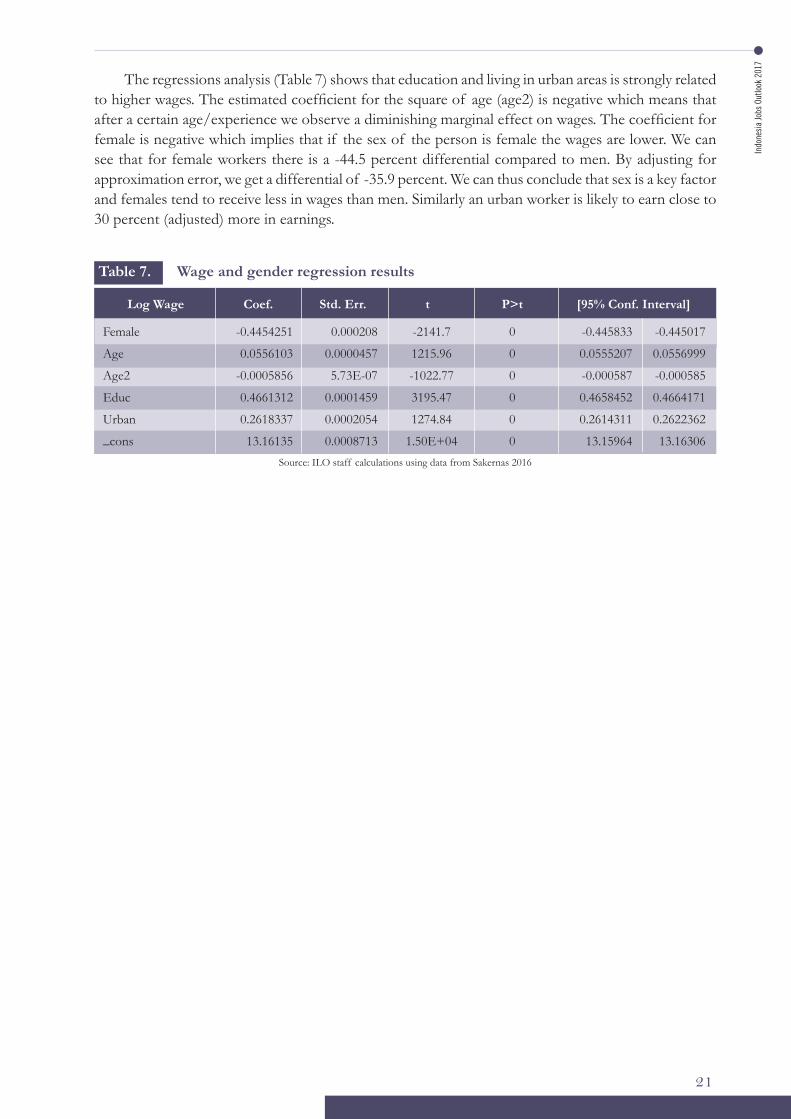
Indo
nesi
a Jo
bs O
utlo
ok 2
017
21
The regressions analysis (Table 7) shows that education and living in urban areas is strongly related to higher wages. The estimated coefficient for the square of age (age2) is negative which means that after a certain age/experience we observe a diminishing marginal effect on wages. The coefficient for female is negative which implies that if the sex of the person is female the wages are lower. We can see that for female workers there is a -44.5 percent differential compared to men. By adjusting for approximation error, we get a differential of -35.9 percent. We can thus conclude that sex is a key factor and females tend to receive less in wages than men. Similarly an urban worker is likely to earn close to 30 percent (adjusted) more in earnings.
Table 7. Wage and gender regression results
Log Wage
Female
Age
Age2
Educ
Urban
_cons
Coef.
-0.4454251
0.0556103
-0.0005856
0.4661312
0.2618337
13.16135
t
-2141.7
1215.96
-1022.77
3195.47
1274.84
1.50E+04
Std. Err.
0.000208
0.0000457
5.73E-07
0.0001459
0.0002054
0.0008713
P>t
0
0
0
0
0
0
[95% Conf. Interval]
-0.445833
0.0555207
-0.000587
0.4658452
0.2614311
13.15964
-0.445017
0.0556999
-0.000585
0.4664171
0.2622362
13.16306Source: ILO staff calculations using data from Sakernas 2016

Indonesia Jobs Outlook 2017
22

Indo
nesi
a Jo
bs O
utlo
ok 2
017
23
THE unemployment rate in Indonesia has continued to fall in the last ten years. In 2006 the unemployment rate was in doubt digits (10.3 percent), but since then it fell gradually and by 2016 the unemployment rate had fallen to 5.6 percent. Among the 15-24 year age group unemployment rate dropped significantly (11.1 percentage points) compared to the overall reduction (4.7 percentage points) in the overall working-age population. The decrease is even sharper for females (15.7 percentage points) compared to the overall average for the 15-24 years old.
Based on the above data, it can be said that labour market situation for young people improved in the last ten years. The unemployment rate among youth (15-24) fell from a high of 30.6 percent in 2006 to 19.4 percent in 2016. It is important to note, however, that the current rate of unemployment among youth is still high compared to countries in the ASEAN region. We will look more into youth unemployment and inactivity in the next section. For now, we will focus on the unemployment for the 15+ old population across the provinces.
In Indonesia, Banten and West Java have the highest rate of unemployment (8.9 percent). These provinces are close to each other and in fact Banten used to be part of West Java. Decentralization and the so called pemekaran (division) led to several new districts and provinces which were established from 2004 onwards. Both Banten and West Java host a number of industrial zones and factories for several large manufacturing companies including multinationals. It is likely that the present slowdown of the economy has contributed to a higher unemployment rate in these two provinces.
Commodity rich provinces such as East Kalimantan and Riau Island have unemployment rate of 8 percent and 7.7 percent, which is well above the national average of 5.6 percent. It is possible that a higher unemployment rate in these provinces mirrors the drop in demand for commodities. Historically though unemployment rate in these provinces was generally higher than the national average.
It is, thus, plausible that owing to the manufacturing prowess and commodities these provinces attracts a fair number of job seekers. Considering many more are actively seeking work, the unemployment rate can go up compared to other provinces where fewer are looking for work. In Banten and West Java cyclical unemployment owing to changes in the manufacturing business cycle may be a factor as well. On the other hand in resource rich provinces seasonal nature of work, such as work on plantations, may be driving up the unemployment rate.
Figure 13 shows four provinces with the highest unemployment rate and the share of employment in the three broad economic sectors. There are some common features. Firstly, the share of employment in industry, trade, and services is higher (except East Kalimantan) than national average of 21.4 percent.
Understanding unemployment
5
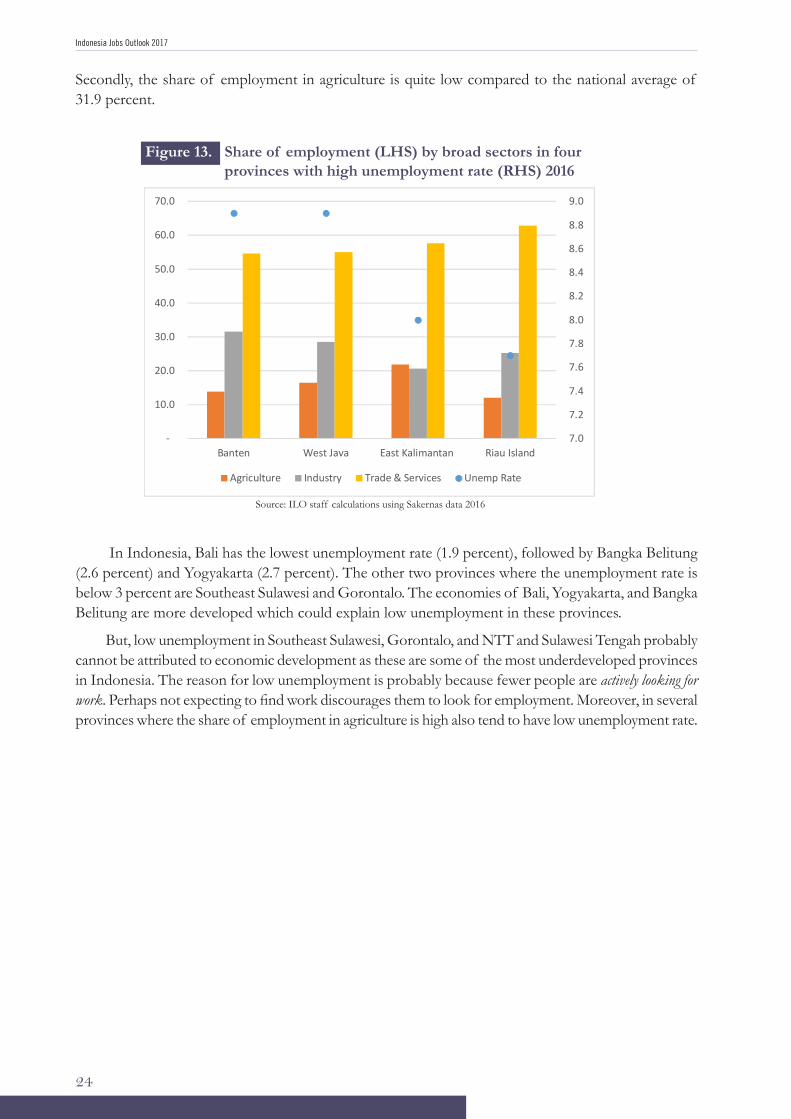
Indonesia Jobs Outlook 2017
24
Secondly, the share of employment in agriculture is quite low compared to the national average of 31.9 percent.
Figure 13. Share of employment (LHS) by broad sectors in four provinces with high unemployment rate (RHS) 2016
Source: ILO staff calculations using Sakernas data 2016
24
It is, thus, plausible that owing to the manufacturing prowess and commodities these provinces attracts a fair number of job seekers. Considering many more are actively seeking work, the unemployment rate can go up compared to other provinces where fewer are looking for work. In Banten and West Java cyclical unemployment owing to changes in the manufacturing business cycle may be a factor as well. On the other hand in resource rich provinces seasonal nature of work, such as on plantations, may be driving up the unemployment rate. Figure 13 shows four provinces with the highest unemployment rate and the share of employment in the three broad economic sectors. There are some common features. Firstly, the share of employment in industry, trade, and services is higher (except East Kalimantan) than national average of 21.4 percent. Secondly, the share of employment in agriculture is quite low compared to the national average of 31.9 percent.
Figure 13. Share of employment (LHS) by broad sectors in four provinces with high unemployment rate (RHS) 2016
Source: ILO staff calculations using Sakernas data 2016
In Indonesia, Bali has the lowest unemployment rate of (1.9 percent), followed by Bangka Belitung (2.6 percent) and Yogyakarta (2.7 percent). The other two provinces where the unemployment rate is below 3 percent are Southeast Sulawesi and Gorontalo. The economies of Bali, Yogyakarta, and Bangka Belitung are more developed which could explain low unemployment in these provinces. But, low unemployment in Southeast Sulawesi, Gorontalo, and NTT and Sulawesi Tengah probably cannot be attributed to economic development as these are some of the most
7.0
7.2
7.4
7.6
7.8
8.0
8.2
8.4
8.6
8.8
9.0
-
10.0
20.0
30.0
40.0
50.0
60.0
70.0
Banten West Java East Kalimantan Riau Island
Agriculture Industry Trade & Services Unemp Rate
In Indonesia, Bali has the lowest unemployment rate (1.9 percent), followed by Bangka Belitung (2.6 percent) and Yogyakarta (2.7 percent). The other two provinces where the unemployment rate is below 3 percent are Southeast Sulawesi and Gorontalo. The economies of Bali, Yogyakarta, and Bangka Belitung are more developed which could explain low unemployment in these provinces.
But, low unemployment in Southeast Sulawesi, Gorontalo, and NTT and Sulawesi Tengah probably cannot be attributed to economic development as these are some of the most underdeveloped provinces in Indonesia. The reason for low unemployment is probably because fewer people are actively looking for work. Perhaps not expecting to find work discourages them to look for employment. Moreover, in several provinces where the share of employment in agriculture is high also tend to have low unemployment rate.

Indo
nesi
a Jo
bs O
utlo
ok 2
017
25
In conclusion, based on the data and analysis presented above, it is clear that employment rate alone is not sufficient to understand the labour market situation. A low unemployment rate does not necessarily mean that labour market conditions are favourable for job seekers. In some cases it can mean fewer job seekers looking for work, perhaps not expecting to find work in the first place. Also, there can be instances when people stop looking for work after a long period of searching (discouraged workers). On the other hand a slightly higher unemployment rate can result from more people joining the labour force as a response to favourable labour market conditions. We have also seen that business cycles and seasonality of work may also be driving up unemployment rate in some provinces.
Source: ILO staff calculations using Sakernas data 2016
Figure 14. Provinces with unemployment rate (left) lower than the national average and share (right) of employment by broad economic sectors (2016)
25
underdeveloped provinces in Indonesia. The reason for low unemployment is probably because fewer people are actively looking for work. Perhaps not expecting to find work discourages them to look for employment. Moreover, in several provinces where the share of employment in agriculture is high also tend to have low unemployment rate.
Figure 14. Provinces with unemployment rate (left) higher than the national average and share (right) of employment by broad economic sectors (2016)
Source: ILO staff calculations using Sakernas data 2016
In conclusion, based on the data and analysis presented above, it is clear that employment rate alone is not sufficient to understand the labour market situation. A low unemployment rate does not necessarily mean that labour market conditions are favourable for job seekers. In some cases it can mean fewer job seekers looking for work, perhaps not expecting to find work in the first place. Also, there can be instances when people stop looking for work after a long period of searching (discouraged workers). On the other hand a slightly higher unemployment rate can result from more people joining the labour force as a response to favourable labour market conditions. We have also seen that business cycles and seasonality of work may also be driving up unemployment rate in some provinces.
6. Youth, employment, and inactivity
Indonesia has a young population. More than half of the population is below 30 years of age. The proportion of population who are aged 65 and above is around 5.3 percent31. According to Sakernas 2016, close to a quarter (23.1 percent) of the working age population were youth
31 https://www.populationpyramid.net/indonesia/2016/
-
1.0
2.0
3.0
4.0
5.0
6.0
-
10.0
20.0
30.0
40.0
50.0
60.0
70.0
Agriculture Industry Trade & Services Unemp Rate

Indonesia Jobs Outlook 2017
26

Indo
nesi
a Jo
bs O
utlo
ok 2
017
27
INDONESIA has a young population. More than half of the population is below 30 years of age. The proportion of population who are aged 65 and above is around 5.3 percent.31 According to Sakernas 2016, close to a quarter (23.1 percent) of the working age population were youth between the ages 15 and 24 years. LFPR of youth was around 48 percent which is below the national average of 66.3 percent. Among the 15-19 old, LFPR is understandably low (28 percent) compared to the age group of 20-24. Generally, a large number of young people from ages 15 to 19 are attending school while a higher proportion of those aged between 20 and 24 may have already made the transition from school to work.
The national average unemployment rate is only 5.6 percent, but it is as high as 19.4 percent in youth. Among male youth the rate is slightly higher (19.8 percent) compared to females (19 percent). Across different educational attainments, the percentage of unemployed with a senior high school (22.4 percent) and vocational high school (24.4 percent) was relatively higher compared to other age groups.
Interesting, the data show that all the 2,127 youth with a master degree in the labour force were unemployed. Most of the unemployed youth with a masters degree were around 23 years old. Considering their age, it is possible that many of them had graduated recently and had just started looking for work. In terms of the national average for all ages, only 1.2 percent of the labour force with a master degree were unemployed. It is thus unlikely that an advanced degree would make it harder for young people to find work. It may simply be the case of just starting the job search and perhaps even waiting for the right job.
Youth, employment, and inactivity
6
31 https://www.populationpyramid.net/indonesia/2016/
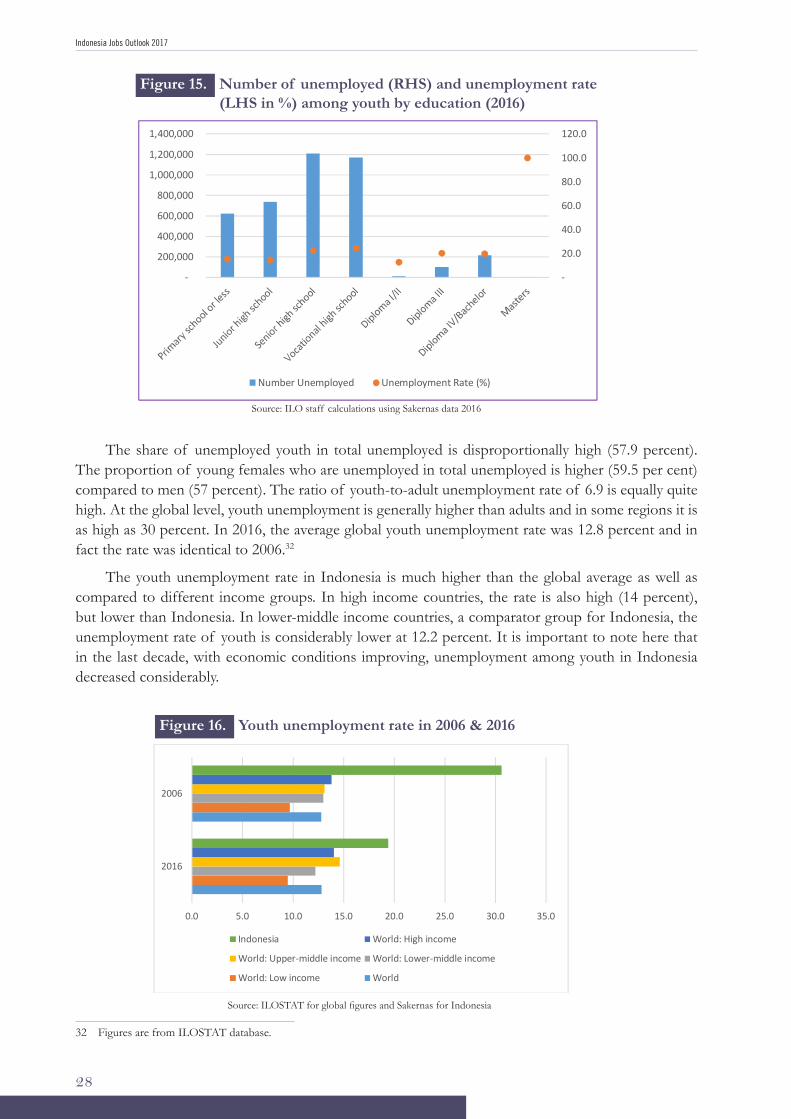
Indonesia Jobs Outlook 2017
28
The share of unemployed youth in total unemployed is disproportionally high (57.9 percent). The proportion of young females who are unemployed in total unemployed is higher (59.5 per cent) compared to men (57 percent). The ratio of youth-to-adult unemployment rate of 6.9 is equally quite high. At the global level, youth unemployment is generally higher than adults and in some regions it is as high as 30 percent. In 2016, the average global youth unemployment rate was 12.8 percent and in fact the rate was identical to 2006.32
The youth unemployment rate in Indonesia is much higher than the global average as well as compared to different income groups. In high income countries, the rate is also high (14 percent), but lower than Indonesia. In lower-middle income countries, a comparator group for Indonesia, the unemployment rate of youth is considerably lower at 12.2 percent. It is important to note here that in the last decade, with economic conditions improving, unemployment among youth in Indonesia decreased considerably.
Figure 15. Number of unemployed (RHS) and unemployment rate (LHS in %) among youth by education (2016)
Source: ILO staff calculations using Sakernas data 2016
26
between the ages 15 and 24 years. LFPR of youth was around 48 percent which is below the national average of 66.3 percent. Among the 15-19 old, LFPR is understandably low (28 percent) compared to the age group of 20-24. Generally, a large number of young people from ages 15 to 19 are attending school while a higher proportion of those aged between 20 and 24 may have already made the transition from school to work.
The national average unemployment rate is only 5.6 percent, but it is as high as 19.4 percent in youth. Among male youth the rate is slightly higher (19.8 percent) compared to females (19 percent). Across different educational attainments, the percentage of unemployed with a senior high school (22.4 percent) and vocational high school (24.4 percent) was relatively higher compared to other age groups.
Interesting, the data show that all the 2,127 youth with a master degree in the labour force were unemployed. Most of the unemployed youth with a masters degree were around 23 years old. Considering their age, it is possible that many of them had graduated recently and had just started looking for work. In terms of the national average for all ages, only 1.2 percent of the labour force with a master degree were unemployed. It is thus unlikely that an advanced degree would make it harder for young people to find work. It may simply be the case of just starting the job search and perhaps even waiting for the right job.
Figure 15. Number of unemployed (RHS) and unemployment rate (LHS in %) among youth by education (2016)
Source: ILO staff calculations using Sakernas data 2016
The share of unemployed youth in total unemployed is disproportionally high (57.9 percent). The proportion of young females who are unemployed in total unemployed is higher (59.5 per cent) compared to men (57 percent). The ratio of youth-to-adult unemployment rate of
-
20.0
40.0
60.0
80.0
100.0
120.0
-
200,000
400,000
600,000
800,000
1,000,000
1,200,000
1,400,000
Number Unemployed Unemployment Rate (%)
Figure 16. Youth unemployment rate in 2006 & 2016
Source: ILOSTAT for global figures and Sakernas for Indonesia
27
6.9 is equally quite high. At the global level, youth unemployment is generally higher than adults and in some regions it is as high as 30 percent. In 2016, the average global youth unemployment rate was 12.8 percent and in fact the rate was identical to 200632.
The youth unemployment rate in Indonesia is much higher than the global average as well as compared to different income groups. In high income countries, the rate is also high (14 percent), but lower than Indonesia. In lower-middle income countries, a comparator group for Indonesia, the unemployment rate of youth is considerably lower at 12.2 percent. It is important to note here that in the last decade, with economic conditions improving, unemployment among youth in Indonesia decreased considerably.
Figure 16. Youth unemployment rate in 2006 & 2016
Source: ILOSTAT for global figures and Sakernas for Indonesia
32 Figures are from ILOSTAT database
0.0 5.0 10.0 15.0 20.0 25.0 30.0 35.0
2016
2006
Indonesia World: High income
World: Upper-middle income World: Lower-middle income
World: Low income World
32 Figures are from ILOSTAT database.
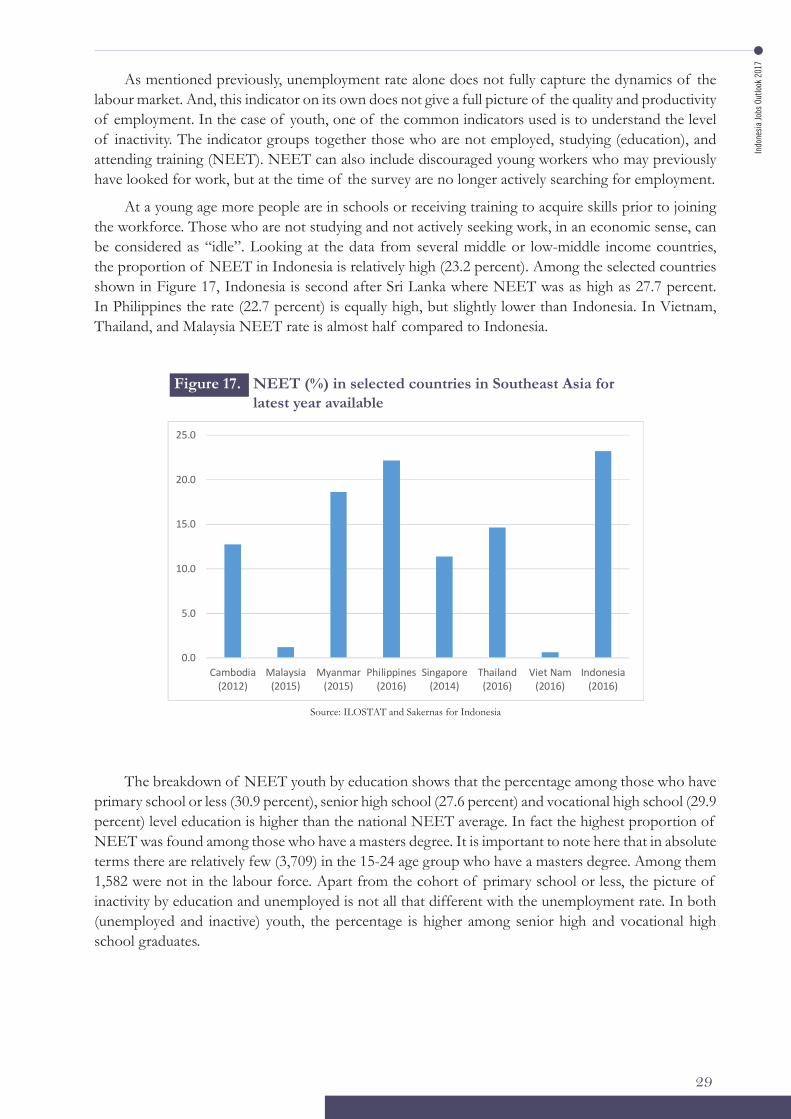
Indo
nesi
a Jo
bs O
utlo
ok 2
017
29
As mentioned previously, unemployment rate alone does not fully capture the dynamics of the labour market. And, this indicator on its own does not give a full picture of the quality and productivity of employment. In the case of youth, one of the common indicators used is to understand the level of inactivity. The indicator groups together those who are not employed, studying (education), and attending training (NEET). NEET can also include discouraged young workers who may previously have looked for work, but at the time of the survey are no longer actively searching for employment.
At a young age more people are in schools or receiving training to acquire skills prior to joining the workforce. Those who are not studying and not actively seeking work, in an economic sense, can be considered as “idle”. Looking at the data from several middle or low-middle income countries, the proportion of NEET in Indonesia is relatively high (23.2 percent). Among the selected countries shown in Figure 17, Indonesia is second after Sri Lanka where NEET was as high as 27.7 percent. In Philippines the rate (22.7 percent) is equally high, but slightly lower than Indonesia. In Vietnam, Thailand, and Malaysia NEET rate is almost half compared to Indonesia.
Source: ILOSTAT and Sakernas for Indonesia
Figure 17. NEET (%) in selected countries in Southeast Asia for latest year available
The breakdown of NEET youth by education shows that the percentage among those who have primary school or less (30.9 percent), senior high school (27.6 percent) and vocational high school (29.9 percent) level education is higher than the national NEET average. In fact the highest proportion of NEET was found among those who have a masters degree. It is important to note here that in absolute terms there are relatively few (3,709) in the 15-24 age group who have a masters degree. Among them 1,582 were not in the labour force. Apart from the cohort of primary school or less, the picture of inactivity by education and unemployed is not all that different with the unemployment rate. In both (unemployed and inactive) youth, the percentage is higher among senior high and vocational high school graduates. 28
As mentioned previously, unemployment rate alone does not fully capture the dynamics of the labour market. And, this indicator on its own does not give a full picture of the quality and productivity of employment. In the case of youth, one of the common indicators used is to understand the level of inactivity. The indicator groups together those who are not employed, studying (education), and attending training (NEET). NEET can also include discouraged young workers who may previously have looked for work, but at the time of the survey are no longer actively searching for employment.
At a young age more people are in schools or receiving training to acquire skills prior to joining the workforce. Those who are not studying and not actively seeking work, in an economic sense, can be considered as “idle”. Looking at the data from several middle or low-middle income countries, the proportion of NEET in Indonesia is relatively high (23.2 percent). Among the selected countries shown in Figure 17, Indonesia is second after Sri Lanka where NEET was as high as 27.7 percent. In Philippines the rate (22.7 percent) is equally high, but slightly lower than Indonesia. In Vietnam, Thailand, and Malaysia NEET rate is almost half compared to Indonesia.
Figure 17. NEET (%) in selected countries in Southeast Asia for latest year available
Source: ILOSTAT and Sakernas for Indonesia
The breakdown of NEET youth by education shows that the percentage among those who have primary school or less (30.9 percent), senior high school (27.6 percent) and vocational high school (29.9 percent) level education is higher than the national NEET average. In fact the highest proportion of NEET was found among those who have a masters degree. It is important to note here that in absolute terms there are relatively few (3,709) in the 15-24 age group who have a masters degree. Among them 1,582 are in the labour force. Apart from the cohort of primary school or less, the picture of inactivity by education and unemployed is
0.0
5.0
10.0
15.0
20.0
25.0
Cambodia(2012)
Malaysia(2015)
Myanmar(2015)
Philippines(2016)
Singapore(2014)
Thailand(2016)
Viet Nam(2016)
Indonesia(2016)
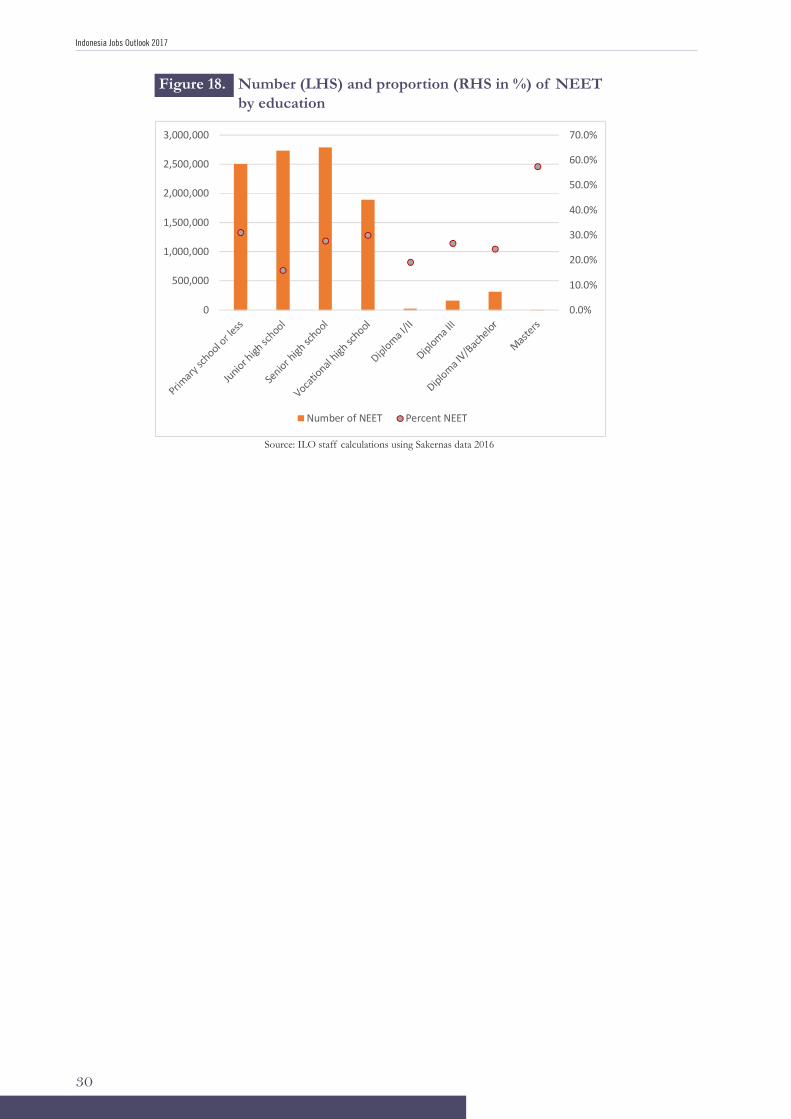
Indonesia Jobs Outlook 2017
30
Figure 18. Number (LHS) and proportion (RHS in %) of NEET by education
29
not all that different with the unemployment rate. In both (unemployed and inactive) youth, the percentage is higher among senior high and vocational high school graduates.
Figure 18. Number (LHS) and proportion (RHS in %) of NEET by education
Source: ILO staff calculations using Sakernas data 2016
0.0%
10.0%
20.0%
30.0%
40.0%
50.0%
60.0%
70.0%
0
500,000
1,000,000
1,500,000
2,000,000
2,500,000
3,000,000
Number of NEET Percent NEET
Source: ILO staff calculations using Sakernas data 2016
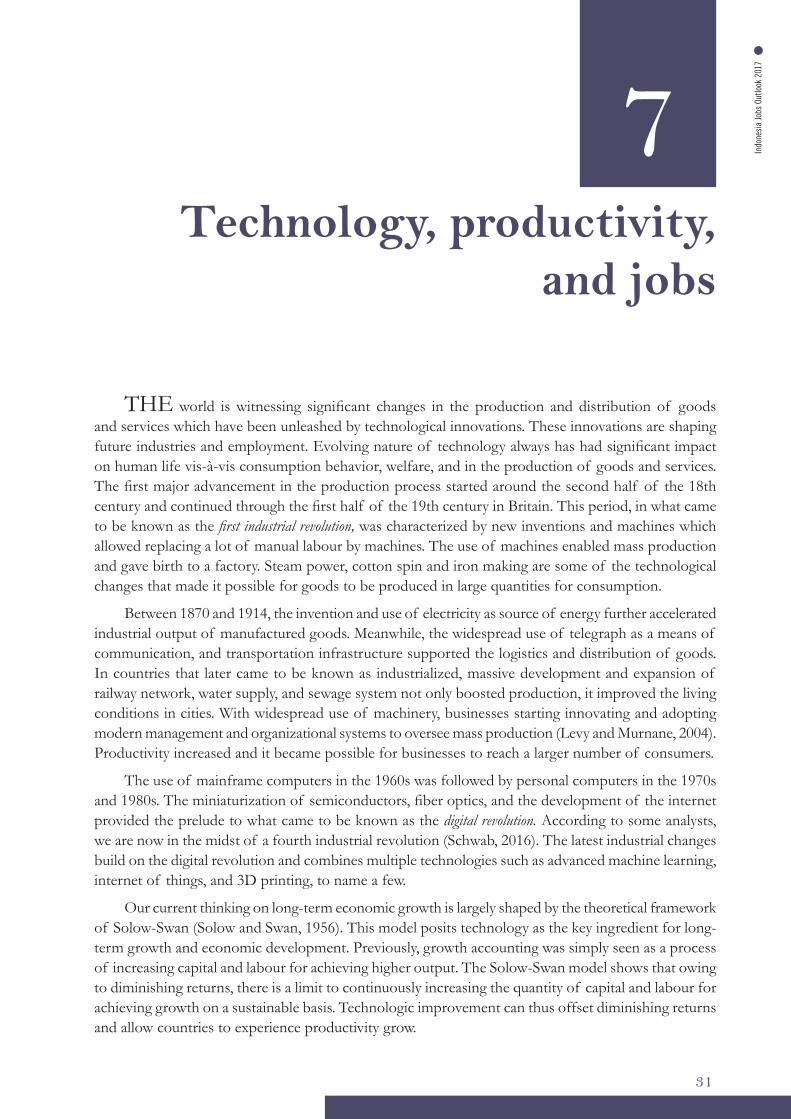
Indo
nesi
a Jo
bs O
utlo
ok 2
017
31
THE world is witnessing significant changes in the production and distribution of goods and services which have been unleashed by technological innovations. These innovations are shaping future industries and employment. Evolving nature of technology always has had significant impact on human life vis-à-vis consumption behavior, welfare, and in the production of goods and services. The first major advancement in the production process started around the second half of the 18th century and continued through the first half of the 19th century in Britain. This period, in what came to be known as the first industrial revolution, was characterized by new inventions and machines which allowed replacing a lot of manual labour by machines. The use of machines enabled mass production and gave birth to a factory. Steam power, cotton spin and iron making are some of the technological changes that made it possible for goods to be produced in large quantities for consumption.
Between 1870 and 1914, the invention and use of electricity as source of energy further accelerated industrial output of manufactured goods. Meanwhile, the widespread use of telegraph as a means of communication, and transportation infrastructure supported the logistics and distribution of goods. In countries that later came to be known as industrialized, massive development and expansion of railway network, water supply, and sewage system not only boosted production, it improved the living conditions in cities. With widespread use of machinery, businesses starting innovating and adopting modern management and organizational systems to oversee mass production (Levy and Murnane, 2004). Productivity increased and it became possible for businesses to reach a larger number of consumers.
The use of mainframe computers in the 1960s was followed by personal computers in the 1970s and 1980s. The miniaturization of semiconductors, fiber optics, and the development of the internet provided the prelude to what came to be known as the digital revolution. According to some analysts, we are now in the midst of a fourth industrial revolution (Schwab, 2016). The latest industrial changes build on the digital revolution and combines multiple technologies such as advanced machine learning, internet of things, and 3D printing, to name a few.
Our current thinking on long-term economic growth is largely shaped by the theoretical framework of Solow-Swan (Solow and Swan, 1956). This model posits technology as the key ingredient for long-term growth and economic development. Previously, growth accounting was simply seen as a process of increasing capital and labour for achieving higher output. The Solow-Swan model shows that owing to diminishing returns, there is a limit to continuously increasing the quantity of capital and labour for achieving growth on a sustainable basis. Technologic improvement can thus offset diminishing returns and allow countries to experience productivity grow.
Technology, productivity, and jobs
7
Indonesia Jobs Outlook 2017
32
As mentioned, technology has always been at the forefront of economic growth and productivity. Increasing capital and labour inputs in the production process alone is not sufficient to maintain growth on a sustainable basis. Productivity is the key driver of growth once a country reaches a limit in deploying its available capital and labour. Recognizing the importance of technology in industrial growth, more and more countries and private sector firms are allocating resources in research and development (R&D).
Technological advancement has contributed towards human welfare, be in terms of new jobs, goods, health care, travel, communication, to name a few. At the same time, technology can be disruptive. It can affect the way labour is employed and companies operate. Arguably, the technological changes in the so called fourth industrial revolution may not necessarily be as drastic as in the past, but the pace of technological improvement and adoption is happening much faster. Previous industrial revolutions took decades to evolve which allowed time for adjustments, especially in the labour market.
7.1 Blessing for job creation?Several studies (Frey & Osborne, 2013); (Tassey, 2014); (Leopold et.al., 2016) suggest that,
broadly speaking, technological improvements can have both positive and negative impact on jobs. When technology takes over, some jobs are lost and workers have to upgrade or learn new skills to remain in the labour market. In some cases technology directly replaces workers while in other cases technology augments human labour. On the output side, technology can increase productivity as well fuel consumer demand for new products, services, and even industries. This expansion can, in turn, create new employment opportunities.
While undoubtedly disruptive in the beginning, technology, in the past, has often paved the way for new industries and occupations. For example, the use of online platforms in Indonesia has resulted in rapid growth of ride-hailing services which, in turn, is creating new work opportunities for people. According to one report, around 250,000 people are contracted by Go-Jek which is one of the leading Indonesian ride hailing services. Some even argue that part of the reason for relatively low unemployment rate in Indonesia is the growth of application based online services.33
In 2017, the Indonesian e-commerce industry is estimated to grow to USD 9.3 billion.34 Online sales could reach 8 percent of the total retail sales by 2020 which currently stand at 1 percent. Despite low digitization across Indonesia’s key sectors, start-ups are growing and spreading. In 2016, the total disclosed funding of start-ups in Indonesia was estimated to have reached USD 1.7 billion (McKinsey, 2016). According to GNP Venture Report, from 4.6 million online shoppers in 2013, the number had grown to 8.7 million by 2016 (Malau, 2016). According to Mckinsey (2016), by embracing digitization the economic growth in Indonesia will further accelerate and by 2025, approximately USD 150 billion can be added annually to the economy.
Online application based platforms is making it possible for people to find work outside the firm or offices. This new form of work called “crowdworking” enables people who need services to connect with those who can provide the required services. These can include house repairs, cleaning, repairing vehicles and so forth. There is evidence from some high income countries such as the USA that alternative work arrangements such as crowdworking is on the rise (Katz & Kreuger, 2017).
33 http://www.thejakartapost.com/news/2016/11/07/ri-sees-unemployment-drop-to-5-61-in-august.html34 http://www.thejakartapost.com/longform/2017/03/03/the-2017-indonesian-startup-popular-sector-forecast.html
Indo
nesi
a Jo
bs O
utlo
ok 2
017
33
With limited data, it is difficult to say how many Indonesians are engaged in crowdworking. The presence of online platforms (e.g. Go-Jek) and number of people using these services does seem to suggest that crowdworking may be on the rise. At minimum, the growth of online job platforms is creating a better interface between employers and jobseekers. This can address frictional unemployment which often results when employers are not able to widely disseminate vacancies and likewise potential job seekers may not have information about available job openings. Internet and social media is thus becoming a common matchmaker in the labour market (Kuhn, 2014).
Furthermore, an online market place is levelling the playing field for small businesses and entrepreneurs. Among others, internet e-commerce platforms such as Tokopedia, Blibli, Bukalapak etc. is enabling small enterprises in Indonesia to market their products directly to the customers. Social media can also help businesses to directly reach their potential customers and promote their products. In absence of any major studies or data on the role of social media in Indonesia, it is difficult to tell to what extent online channels are creating opportunities for small businesses. However, research of small Chinese firms in retail fashion shows that there is greater engagement between small businesses and customers through social media and it can lead to higher sales (Ha et.al, 2016).
When it comes to technological uptake between developing and industrialized economies, it is usually assumed that the former still have a long way to go before reaching the technological frontier. Also, countries with more skilled workforce are generally more receptive to sophisticated technology compared to countries with more unskilled workers (Caselli & Coleman, 2006). With relatively larger supply of (unskilled) labour in developing countries, firms often find it more economical to deploy additional labour rather than to adopt sophisticated technology to replace humans.
However, absorption of technology in developing countries may be changing as firms as well as governments try to become more competitive in a globalized world. For example, the sale of industrial robots which can displace human workers is increasing in developing countries.35 The top 10 countries in terms of sale of industrial robots are mainly industrialized, but that trend may be changing. In 2015, China was the leading destination for industrial robots accounting for 27 percent of the 253,748 robots sold that year. Although the stock of industrial robots in Indonesia remains low, there has been a twenty-fold increase in the sale of robots from 314 in 2005 to 6,265 in 2015 (IFR, 2016).
The rise in the use of robots in Indonesia may be attributed to firms trying to become more competitive and probably not being able to do so through a labor-intensive approach that has characterized production processes in the past. Without data, it is difficult to say how the use of robots is impacting jobs in Indonesia. Understandably, the government considers rapid automation as a challenge which can lead to layoffs, create imbalances, and exacerbate income inequality.36
The productivity and efficiency gains from adoption of technology is not limited to the private sector. Technological advancements are helping governments around the world to overcome physical accessibility. At present many more countries are offering public services through online portals. And, this trend is likely to increase. Instead of people having to spend a lot of time visiting government offices, which can be an issue especially for remote areas with poor accessibility, it is becoming possible for people get these services online. For example, the use of electronic ID cards including biometric identifiers is enabling India to make direct social transfer payments to eligible people to avoid leakages and promote transparency.37 In Indonesia, efforts are being made to have electronic ID cards and digitize more and more public services.
35 http://www.huffingtonpost.com/hal-sirkin/robots-workers-countries_b_9992960.html36 https://asia.nikkei.com/Spotlight/The-Future-of-Asia-2017/Beware-of-robots-says-Indonesian-Vice-President-Kalla37 https://uidai.gov.in/your-aadhaar/about-aadhaar.html
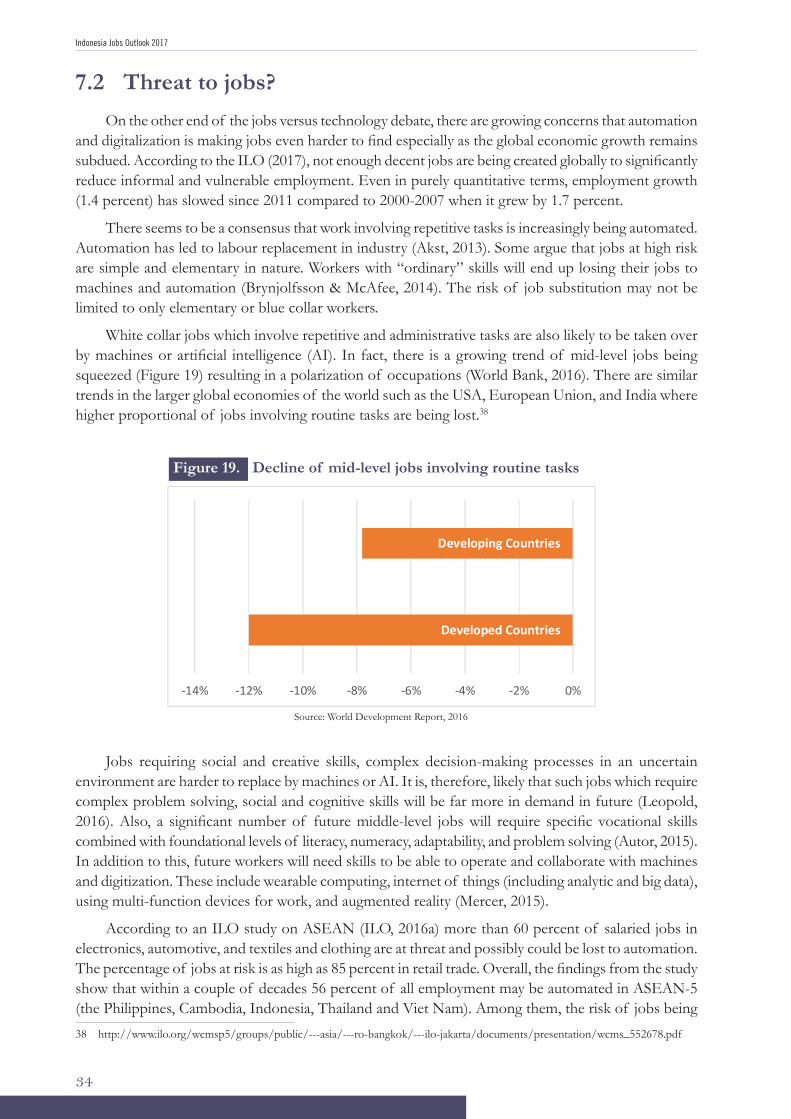
Indonesia Jobs Outlook 2017
34
7.2 Threat to jobs?On the other end of the jobs versus technology debate, there are growing concerns that automation
and digitalization is making jobs even harder to find especially as the global economic growth remains subdued. According to the ILO (2017), not enough decent jobs are being created globally to significantly reduce informal and vulnerable employment. Even in purely quantitative terms, employment growth (1.4 percent) has slowed since 2011 compared to 2000-2007 when it grew by 1.7 percent.
There seems to be a consensus that work involving repetitive tasks is increasingly being automated. Automation has led to labour replacement in industry (Akst, 2013). Some argue that jobs at high risk are simple and elementary in nature. Workers with “ordinary” skills will end up losing their jobs to machines and automation (Brynjolfsson & McAfee, 2014). The risk of job substitution may not be limited to only elementary or blue collar workers.
White collar jobs which involve repetitive and administrative tasks are also likely to be taken over by machines or artificial intelligence (AI). In fact, there is a growing trend of mid-level jobs being squeezed (Figure 19) resulting in a polarization of occupations (World Bank, 2016). There are similar trends in the larger global economies of the world such as the USA, European Union, and India where higher proportional of jobs involving routine tasks are being lost.38
Figure 19. Decline of mid-level jobs involving routine tasks
Source: World Development Report, 2016
34
There seems to be a consensus that work involving repetitive tasks is increasingly being automated. Automation has led to labour replacement in industry (Akst, 2013). Some argue that jobs at high risk are simple and elementary in nature. Workers with “ordinary” skills will end up losing their jobs to machines and automation (Brynjolfsson & McAfee, 2014). The risk of job substitution may not be limited to only elementary or blue collar workers. White collar jobs which involve repetitive and administrative tasks are also likely to be taken over by machines or artificial intelligence (AI). In fact, there is a growing trend of mid-level jobs are being squeezed (Figure 19) resulting in a polarization of occupations (World Bank, 2016). There are similar trends in the larger global economies of the world such as the USA, European Union, and India where higher proportional of jobs involving routine tasks are being lost38.
Figure 19. Decline of mid-level jobs involving routine tasks
Source: World Development Report, 2016
Jobs requiring social and creative skills, complex decision-making processes in an uncertain environment are harder to replace by machines or AI. It is, therefore, likely that such jobs which require complex problem solving, social and cognitive skills will be far more in demand in future (Leopold, 2016). Also, a significant number of future middle-level jobs will require specific vocational skills combined with foundational levels of literacy, numeracy, adaptability, and problem solving (Autor, 2015). In addition to this, future workers will need skills to be able to operate and collaborate with machines and digitization. These include wearable computing, internet of things (including analytic and big data), using multi-function devices for work, and augmented reality (Mercer, 2015). According to an ILO study on ASEAN (ILO, 2016a) more than 60 percent of salaried jobs in electronics, automotive, and textiles and clothing are at threat and possibly could be lost to
38 http://www.ilo.org/wcmsp5/groups/public/---asia/---ro-bangkok/---ilo-jakarta/documents/presentation/wcms_552678.pdf
-14% -12% -10% -8% -6% -4% -2% 0%
Developed Countries
Developing Countries
Jobs requiring social and creative skills, complex decision-making processes in an uncertain environment are harder to replace by machines or AI. It is, therefore, likely that such jobs which require complex problem solving, social and cognitive skills will be far more in demand in future (Leopold, 2016). Also, a significant number of future middle-level jobs will require specific vocational skills combined with foundational levels of literacy, numeracy, adaptability, and problem solving (Autor, 2015). In addition to this, future workers will need skills to be able to operate and collaborate with machines and digitization. These include wearable computing, internet of things (including analytic and big data), using multi-function devices for work, and augmented reality (Mercer, 2015).
According to an ILO study on ASEAN (ILO, 2016a) more than 60 percent of salaried jobs in electronics, automotive, and textiles and clothing are at threat and possibly could be lost to automation. The percentage of jobs at risk is as high as 85 percent in retail trade. Overall, the findings from the study show that within a couple of decades 56 percent of all employment may be automated in ASEAN-5 (the Philippines, Cambodia, Indonesia, Thailand and Viet Nam). Among them, the risk of jobs being 38 http://www.ilo.org/wcmsp5/groups/public/---asia/---ro-bangkok/---ilo-jakarta/documents/presentation/wcms_552678.pdf
Indo
nesi
a Jo
bs O
utlo
ok 2
017
35
automated is highest in Viet Nam (70 percent), followed by the Philippines (57 percent) and closely behind is Indonesia (56 percent). The probability of job losses in Thailand is the lowest (44 percent). The estimations for Indonesia and other selected countries in ASEAN are based on a methodology developed by Frey and Osborne to find out the type of occupations at risk of being replaced by machines and automation. Occupations in ASEAN were characterized by nine variables grouped under three non-automatable tasks requiring perception and manipulation, creative intelligence, and social intelligence.
In their research on 702 occupations in the USA, Frey and Osborne (2013) estimated 47 percent of the jobs were at risk. In another study McKinsey concluded that 45 percent of tasks that workers carry out now could be made obsolete through automation (McKinsey, 2017). Both studies show a very high proportion of occupations being lost. However, Arntz et al. (2016) found that only 9 percent of jobs were at risks in the member states of the Organization of Economic Cooperation and Development (OECD). This study tried to differentiate between tasks within an occupation. Generally, a job or an occupation involves several tasks and it is possible that automation may affect some of these tasks and, therefore, not completely eliminate the occupation. In such a situation an occupation can evolve over time in which some functions or tasks are made redundant while other tasks are added to the same occupation or even leading to an entirely new occupation.
7.3 Looking ahead: technology and firmsTo better understand how Indonesian firms perceive the role of technology and its impact
on businesses, below we present the findings from an enterprise survey. A total of 732 enterprises participated in this survey. ILO commissioned the survey in 2015 as part of a regional report on “ASEAN in Transformation: How technology is changing enterprises and future work”. The purpose of the survey was to understand current developments, and perception of private sector vis-à-vis technology, industrial development, regional integration, and jobs.
The respondents of the survey were 67 percent businesses in the services and 33 percent businesses in manufacturing sector. More than 14 percent were small enterprises employing between 5 and 19 workers, 27 percent were medium enterprises employing between 20 and 99 workers, and 59 percent were large enterprises employing over 100 workers. Nearly 4 percent of the businesses were established before 1950, 30 percent between 1950 and 1989, 51 percent were established between 1990 and 2009, and 15 percent were founded between 2010 and 2015.
About 35 percent of enterprises in Indonesia reported upgrading technology, higher than the ASEAN average of 27 percent (Figure 20, panel a). Moreover, around 34 percent of enterprises in Indonesia delegated responsibility for protecting data, again higher than the ASEAN average of 28 percent. In addition, 20 percent of Indonesian enterprises reported investing in research and development (R&D) and protecting intellectual property (IP).
A higher proportion of manufacturing enterprises conducted technology related activities compared to enterprises in the services sector (Figure 20, panel b). Almost 45 percent of manufacturing enterprises reported protecting data and upgrading technology, compared to about 30 percent of enterprises in the services. Additionally, about 25 percent of manufacturing enterprises reported investing in R&D and protecting IP, compared to less than 20 percent in the case of enterprises in the services sector.
Not surprising that large enterprises scored significantly higher for technology-related functions compared to medium and small enterprises (Figure 20, panel c). Of the total large enterprises, 44 percent protected data, 45 percent upgraded technology, 27 percent invested in R&D and 26 percent protected IP. These results compare to a lower proportion of medium enterprises that protected data and upgraded technology (about 27 percent), and invested in R&D (9 percent). An even lower proportion
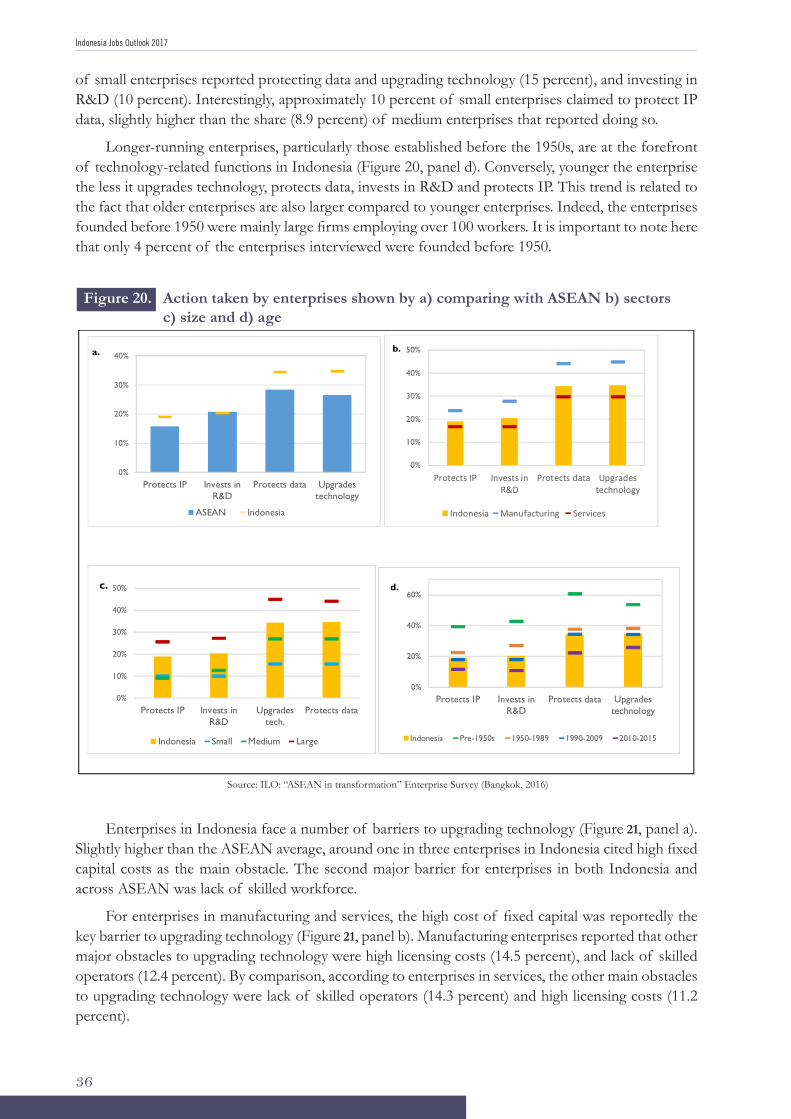
Indonesia Jobs Outlook 2017
36
of small enterprises reported protecting data and upgrading technology (15 percent), and investing in R&D (10 percent). Interestingly, approximately 10 percent of small enterprises claimed to protect IP data, slightly higher than the share (8.9 percent) of medium enterprises that reported doing so.
Longer-running enterprises, particularly those established before the 1950s, are at the forefront of technology-related functions in Indonesia (Figure 20, panel d). Conversely, younger the enterprise the less it upgrades technology, protects data, invests in R&D and protects IP. This trend is related to the fact that older enterprises are also larger compared to younger enterprises. Indeed, the enterprises founded before 1950 were mainly large firms employing over 100 workers. It is important to note here that only 4 percent of the enterprises interviewed were founded before 1950.
Figure 20. Action taken by enterprises shown by a) comparing with ASEAN b) sectors c) size and d) age
37
Figure 20. Action taken by enterprises shown by a) comparing with ASEAN b) sectors c) size and d) age
Source: ILO: “ASEAN in transformation” Enterprise Survey (Bangkok, 2016)
Enterprises in Indonesia face a number of barriers to upgrading technology (
Figure 21, panel a). Slightly higher than the ASEAN average, around one in three enterprises in Indonesia cited high fixed capital costs as the main obstacle. The second major barrier for enterprises in both Indonesia and across ASEAN was lack of skilled workforce.
For enterprises in manufacturing and services, the high cost of fixed capital was reportedly the key barrier to upgrading technology (
Figure 21, panel b). Manufacturing enterprises reported that other major obstacles to upgrading technology were high licensing costs (14.5 percent), and lack of skilled operators (12.4 percent). By comparison, according to enterprises in services, the other main obstacles to upgrading technology were lack of skilled operators (14.3 percent) and high licensing costs (11.2 percent).
0%
10%
20%
30%
40%
Protects IP Invests inR&D
Protects data Upgradestechnology
a.
ASEAN Indonesia
0%
10%
20%
30%
40%
50%
Protects IP Invests inR&D
Protects data Upgradestechnology
b.
Indonesia Manufacturing Services
0%
10%
20%
30%
40%
50%
Protects IP Invests inR&D
Upgradestech.
Protects data
c.
Indonesia Small Medium Large
0%
20%
40%
60%
Protects IP Invests inR&D
Protects data Upgradestechnology
d.
Indonesia Pre-1950s 1950-1989 1990-2009 2010-2015
Source: ILO: “ASEAN in transformation” Enterprise Survey (Bangkok, 2016)
Enterprises in Indonesia face a number of barriers to upgrading technology (Figure 21, panel a). Slightly higher than the ASEAN average, around one in three enterprises in Indonesia cited high fixed capital costs as the main obstacle. The second major barrier for enterprises in both Indonesia and across ASEAN was lack of skilled workforce.
For enterprises in manufacturing and services, the high cost of fixed capital was reportedly the key barrier to upgrading technology (Figure 21, panel b). Manufacturing enterprises reported that other major obstacles to upgrading technology were high licensing costs (14.5 percent), and lack of skilled operators (12.4 percent). By comparison, according to enterprises in services, the other main obstacles to upgrading technology were lack of skilled operators (14.3 percent) and high licensing costs (11.2 percent).
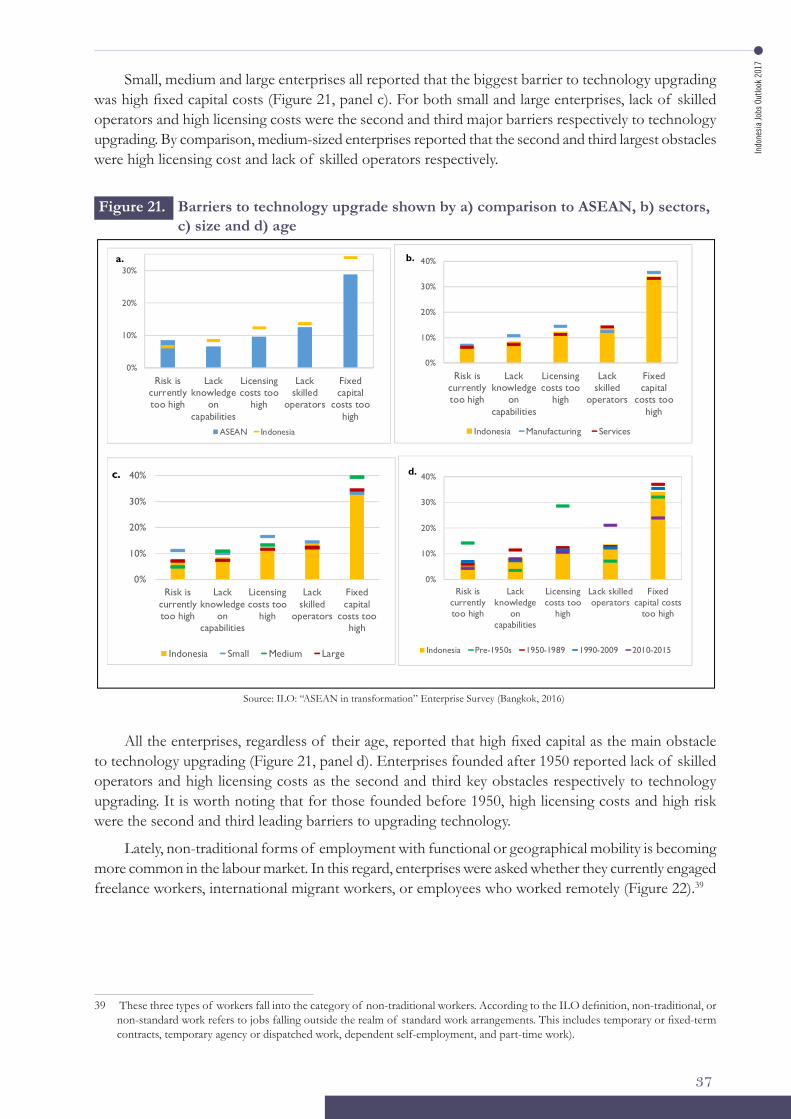
Indo
nesi
a Jo
bs O
utlo
ok 2
017
37
Small, medium and large enterprises all reported that the biggest barrier to technology upgrading was high fixed capital costs (Figure 21, panel c). For both small and large enterprises, lack of skilled operators and high licensing costs were the second and third major barriers respectively to technology upgrading. By comparison, medium-sized enterprises reported that the second and third largest obstacles were high licensing cost and lack of skilled operators respectively.
Figure 21. Barriers to technology upgrade shown by a) comparison to ASEAN, b) sectors, c) size and d) age
Source: ILO: “ASEAN in transformation” Enterprise Survey (Bangkok, 2016)
38
Small, medium and large enterprises all reported that the biggest barrier to technology upgrading was high fixed capital costs ( Figure 21, panel c). For both small and large enterprises, lack of skilled operators and high licensing costs were the second and third major barriers respectively to technology upgrading. By comparison, medium-sized enterprises reported that the second and third largest obstacles were high licensing cost and lack of skilled operators respectively.
Figure 21 . Barriers to technology upgrade shown by a) comparison to ASEAN, b) sectors, c) size and d) age
Source: ILO: “ASEAN in transformation” Enterprise Survey (Bangkok, 2016) All the enterprises, regardless of their age, reported that high fixed capital as the main obstacle to technology upgrading ( Figure 21, panel d). Enterprises founded after 1950 reported lack of skilled operators and high licensing costs as the second and third key obstacles respectively to technology upgrading. It is worth noting that for those founded before 1950, high licensing costs and high risk were the second and third leading barriers to upgrading technology.
0%
10%
20%
30%
Risk iscurrentlytoo high
Lackknowledge
oncapabilities
Licensingcosts too
high
Lackskilled
operators
Fixedcapital
costs toohigh
a.
ASEAN Indonesia
0%
10%
20%
30%
40%
Risk iscurrentlytoo high
Lackknowledge
oncapabilities
Licensingcosts too
high
Lackskilled
operators
Fixedcapital
costs toohigh
b.
Indonesia Manufacturing Services
0%
10%
20%
30%
40%
Risk iscurrentlytoo high
Lackknowledge
oncapabilities
Licensingcosts too
high
Lackskilled
operators
Fixedcapital
costs toohigh
c.
Indonesia Small Medium Large
0%
10%
20%
30%
40%
Risk iscurrentlytoo high
Lackknowledge
oncapabilities
Licensingcosts too
high
Lack skilledoperators
Fixedcapital costs
too high
d.
Indonesia Pre-1950s 1950-1989 1990-2009 2010-2015
All the enterprises, regardless of their age, reported that high fixed capital as the main obstacle to technology upgrading (Figure 21, panel d). Enterprises founded after 1950 reported lack of skilled operators and high licensing costs as the second and third key obstacles respectively to technology upgrading. It is worth noting that for those founded before 1950, high licensing costs and high risk were the second and third leading barriers to upgrading technology.
Lately, non-traditional forms of employment with functional or geographical mobility is becoming more common in the labour market. In this regard, enterprises were asked whether they currently engaged freelance workers, international migrant workers, or employees who worked remotely (Figure 22).39
39 These three types of workers fall into the category of non-traditional workers. According to the ILO definition, non-traditional, or non-standard work refers to jobs falling outside the realm of standard work arrangements. This includes temporary or fixed-term contracts, temporary agency or dispatched work, dependent self-employment, and part-time work).
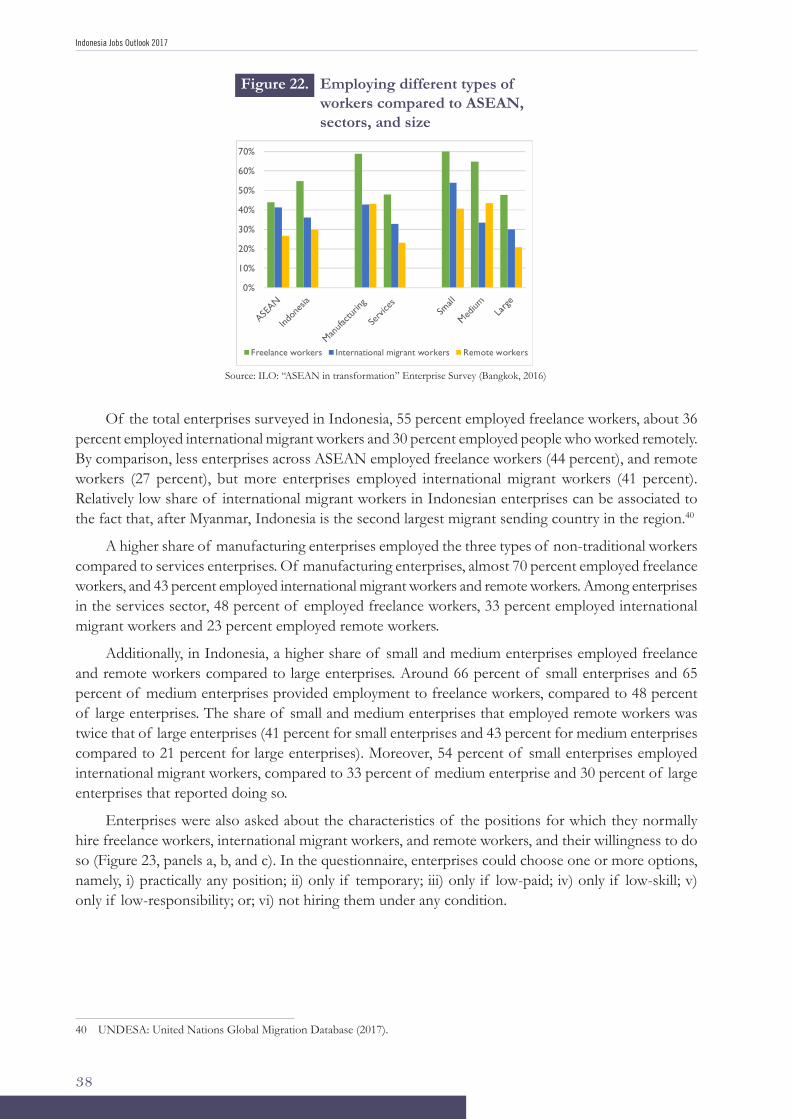
Indonesia Jobs Outlook 2017
38
Of the total enterprises surveyed in Indonesia, 55 percent employed freelance workers, about 36 percent employed international migrant workers and 30 percent employed people who worked remotely. By comparison, less enterprises across ASEAN employed freelance workers (44 percent), and remote workers (27 percent), but more enterprises employed international migrant workers (41 percent). Relatively low share of international migrant workers in Indonesian enterprises can be associated to the fact that, after Myanmar, Indonesia is the second largest migrant sending country in the region.40
A higher share of manufacturing enterprises employed the three types of non-traditional workers compared to services enterprises. Of manufacturing enterprises, almost 70 percent employed freelance workers, and 43 percent employed international migrant workers and remote workers. Among enterprises in the services sector, 48 percent of employed freelance workers, 33 percent employed international migrant workers and 23 percent employed remote workers.
Additionally, in Indonesia, a higher share of small and medium enterprises employed freelance and remote workers compared to large enterprises. Around 66 percent of small enterprises and 65 percent of medium enterprises provided employment to freelance workers, compared to 48 percent of large enterprises. The share of small and medium enterprises that employed remote workers was twice that of large enterprises (41 percent for small enterprises and 43 percent for medium enterprises compared to 21 percent for large enterprises). Moreover, 54 percent of small enterprises employed international migrant workers, compared to 33 percent of medium enterprise and 30 percent of large enterprises that reported doing so.
Enterprises were also asked about the characteristics of the positions for which they normally hire freelance workers, international migrant workers, and remote workers, and their willingness to do so (Figure 23, panels a, b, and c). In the questionnaire, enterprises could choose one or more options, namely, i) practically any position; ii) only if temporary; iii) only if low-paid; iv) only if low-skill; v) only if low-responsibility; or; vi) not hiring them under any condition.
40 UNDESA: United Nations Global Migration Database (2017).
Figure 22. Employing different types of workers compared to ASEAN, sectors, and size
Source: ILO: “ASEAN in transformation” Enterprise Survey (Bangkok, 2016)
39
Lately, non-traditional forms of employment with functional or geographical mobility is becoming more common in the labour market. In this regard, enterprises were asked whether they currently engaged freelance workers, international migrant workers, or employees who worked remotely (Figure 22).39
Figure 22. Employing different types of workers compared to ASEAN, sectors, and size
Source: ILO: “ASEAN in transformation” Enterprise Survey (Bangkok, 2016)
Of the total enterprises surveyed in Indonesia, 55 percent employed freelance workers, about 36 percent employed international migrant workers and 30 percent employed people who worked remotely. By comparison, less enterprises across ASEAN employed freelance workers (44 percent), and remote workers (27 percent), but more enterprises employed international migrant workers (41 percent). Relatively low share of international migrant workers in Indonesian enterprises can be associated to the fact that, after Myanmar, Indonesia is the second largest migrant sending country in the region.40
A higher share of manufacturing enterprises employed the three types of non-traditional workers compared to services enterprises. Of manufacturing enterprises, almost 70 percent employed freelance workers, and 43 percent employed international migrant workers and remote workers. Among enterprises in the services sector, 48 percent of employed freelance workers, 33 percent employed international migrant workers and 23 percent employed remote workers.
Additionally, in Indonesia, a higher share of small and medium enterprises employed freelance and remote workers compared to large enterprises. Around 66 percent of small enterprises and 65 percent of medium enterprises provided employment to freelance
39 These three types of workers fall into the category of non-traditional workers. According to the ILO definition, non-traditional, or non-standard work refers to jobs falling outside the realm of standard work arrangements. This includes temporary or fixed-term contracts, temporary agency or dispatched work, dependent self-employment, and part-time work). 40 UNDESA: United Nations Global Migration Database (2017).
0%
10%
20%
30%
40%
50%
60%
70%
Freelance workers International migrant workers Remote workers
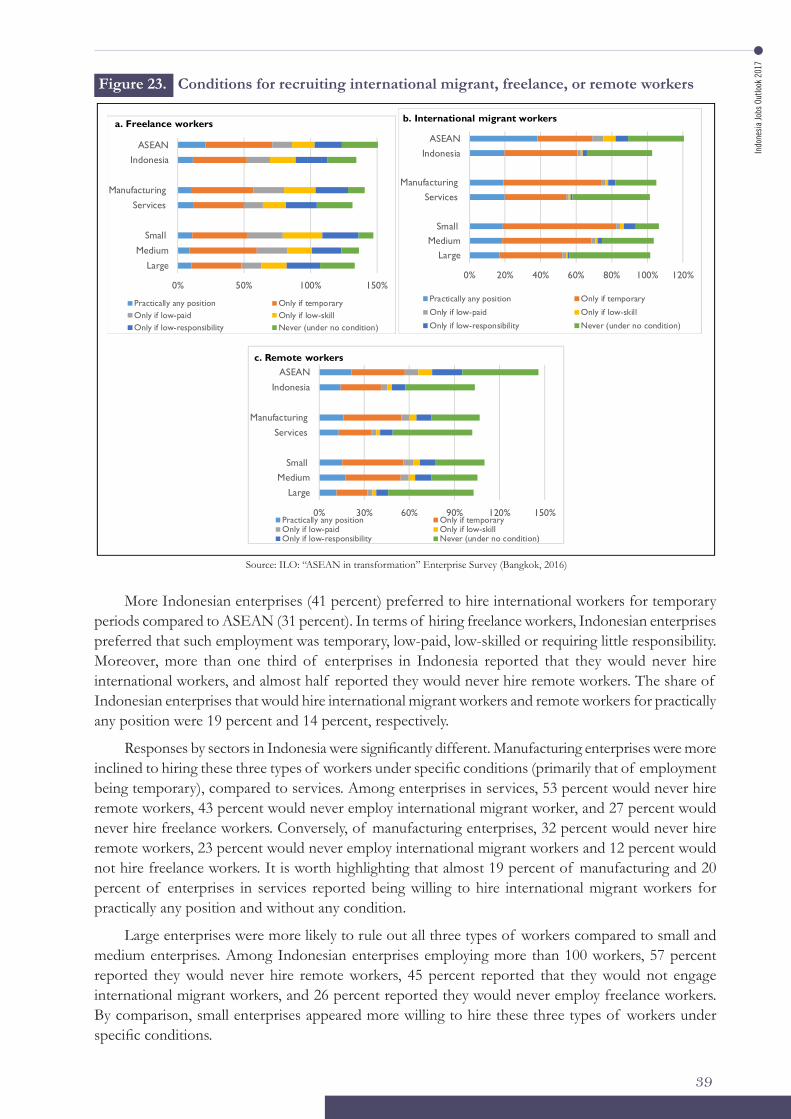
Indo
nesi
a Jo
bs O
utlo
ok 2
017
39
Figure 23. Conditions for recruiting international migrant, freelance, or remote workers
40
workers, compared to 48 percent of large enterprises. The share of small and medium enterprises that employed remote workers was twice that of large enterprises (41 percent for small enterprises and 43 percent for medium enterprises compared to 21 percent for large enterprises). Moreover, 54 percent of small enterprises employed international migrant workers, compared to 33 percent of medium enterprise and 30 percent of large enterprises that reported doing so.
Enterprises were also asked about the characteristics of the positions for which they normally hire freelance workers, international migrant workers, and remote workers, and their willingness to do so (Figure 23, panels a, b, and c). In the questionnaire, enterprises could choose one or more options, namely, i) practically any position; ii) only if temporary; iii) only if low-paid; iv) only if low-skill; v) only if low-responsibility; or; vi) not hiring them under any condition.
Figure 23. Conditions for recruiting international migrant, freelance, or remote workers
Source: ILO: “ASEAN in transformation” Enterprise Survey (Bangkok, 2016)
More Indonesian enterprises (41 percent) preferred to hire international workers for temporary periods compared to ASEAN (31 percent). In terms of hiring freelance workers, Indonesian enterprises preferred that such employment was temporary, low-paid, low-skilled or requiring little responsibility. Moreover, more than one third of enterprises in Indonesia
0% 50% 100% 150%
Large
Medium
Small
Services
Manufacturing
IndonesiaASEAN
a. Freelance workers
Practically any position Only if temporaryOnly if low-paid Only if low-skillOnly if low-responsibility Never (under no condition)
0% 20% 40% 60% 80% 100% 120%
LargeMedium
Small
ServicesManufacturing
IndonesiaASEAN
b. International migrant workers
Practically any position Only if temporary
Only if low-paid Only if low-skill
Only if low-responsibility Never (under no condition)
0% 30% 60% 90% 120% 150%
Large
MediumSmall
Services
Manufacturing
Indonesia
ASEANc. Remote workers
Practically any position Only if temporaryOnly if low-paid Only if low-skillOnly if low-responsibility Never (under no condition)
Source: ILO: “ASEAN in transformation” Enterprise Survey (Bangkok, 2016)
More Indonesian enterprises (41 percent) preferred to hire international workers for temporary periods compared to ASEAN (31 percent). In terms of hiring freelance workers, Indonesian enterprises preferred that such employment was temporary, low-paid, low-skilled or requiring little responsibility. Moreover, more than one third of enterprises in Indonesia reported that they would never hire international workers, and almost half reported they would never hire remote workers. The share of Indonesian enterprises that would hire international migrant workers and remote workers for practically any position were 19 percent and 14 percent, respectively.
Responses by sectors in Indonesia were significantly different. Manufacturing enterprises were more inclined to hiring these three types of workers under specific conditions (primarily that of employment being temporary), compared to services. Among enterprises in services, 53 percent would never hire remote workers, 43 percent would never employ international migrant worker, and 27 percent would never hire freelance workers. Conversely, of manufacturing enterprises, 32 percent would never hire remote workers, 23 percent would never employ international migrant workers and 12 percent would not hire freelance workers. It is worth highlighting that almost 19 percent of manufacturing and 20 percent of enterprises in services reported being willing to hire international migrant workers for practically any position and without any condition.
Large enterprises were more likely to rule out all three types of workers compared to small and medium enterprises. Among Indonesian enterprises employing more than 100 workers, 57 percent reported they would never hire remote workers, 45 percent reported that they would not engage international migrant workers, and 26 percent reported they would never employ freelance workers. By comparison, small enterprises appeared more willing to hire these three types of workers under specific conditions.
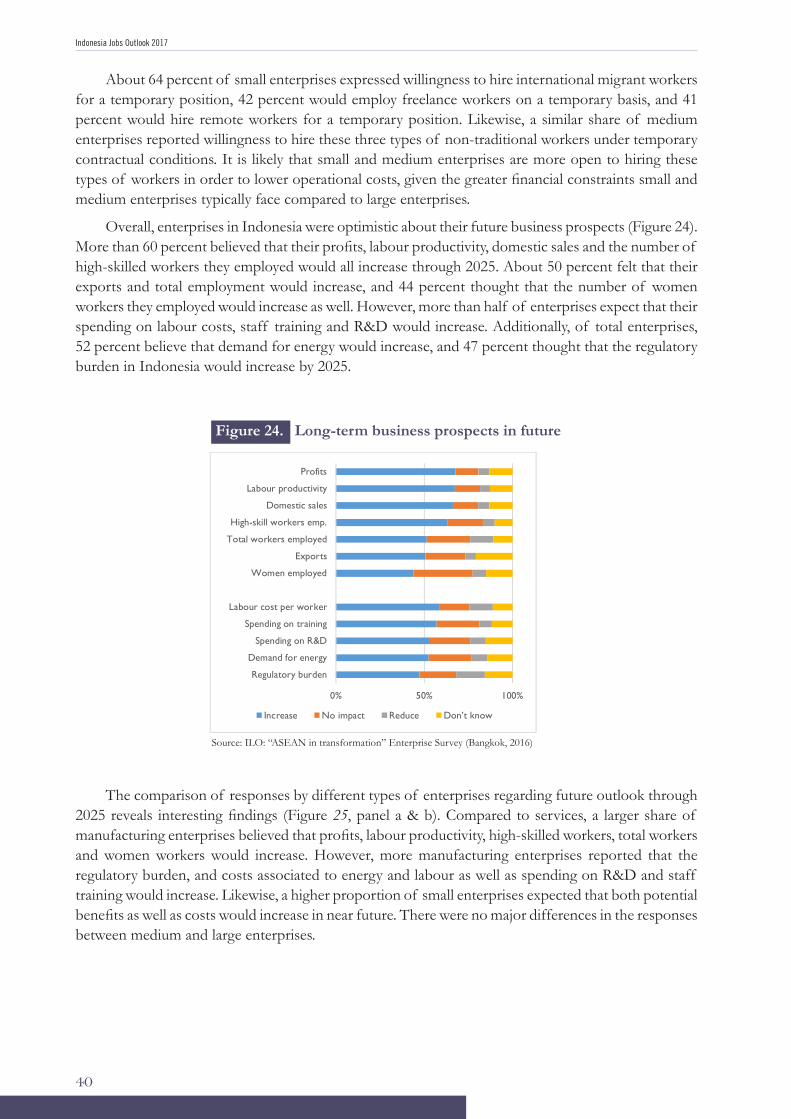
Indonesia Jobs Outlook 2017
40
About 64 percent of small enterprises expressed willingness to hire international migrant workers for a temporary position, 42 percent would employ freelance workers on a temporary basis, and 41 percent would hire remote workers for a temporary position. Likewise, a similar share of medium enterprises reported willingness to hire these three types of non-traditional workers under temporary contractual conditions. It is likely that small and medium enterprises are more open to hiring these types of workers in order to lower operational costs, given the greater financial constraints small and medium enterprises typically face compared to large enterprises.
Overall, enterprises in Indonesia were optimistic about their future business prospects (Figure 24). More than 60 percent believed that their profits, labour productivity, domestic sales and the number of high-skilled workers they employed would all increase through 2025. About 50 percent felt that their exports and total employment would increase, and 44 percent thought that the number of women workers they employed would increase as well. However, more than half of enterprises expect that their spending on labour costs, staff training and R&D would increase. Additionally, of total enterprises, 52 percent believe that demand for energy would increase, and 47 percent thought that the regulatory burden in Indonesia would increase by 2025.
Figure 24. Long-term business prospects in future
42
energy would increase, and 47 percent thought that the regulatory burden in Indonesia would increase by 2025.
Figure 24. Long-term business prospects in future
Source: ILO: “ASEAN in transformation” Enterprise Survey (Bangkok, 2016)
The comparison of responses by different types of enterprises regarding future outlook through 2025 reveals interesting findings (
Figure 25, panel a & b). Compared to services, a larger share of manufacturing enterprises believed that profits, labour productivity, high-skilled workers, total workers and women
0% 50% 100%
Regulatory burden
Demand for energy
Spending on R&D
Spending on training
Labour cost per worker
Women employed
Exports
Total workers employed
High-skill workers emp.
Domestic sales
Labour productivity
Profits
Increase No impact Reduce Don’t know
Source: ILO: “ASEAN in transformation” Enterprise Survey (Bangkok, 2016)
The comparison of responses by different types of enterprises regarding future outlook through 2025 reveals interesting findings (Figure 25, panel a & b). Compared to services, a larger share of manufacturing enterprises believed that profits, labour productivity, high-skilled workers, total workers and women workers would increase. However, more manufacturing enterprises reported that the regulatory burden, and costs associated to energy and labour as well as spending on R&D and staff training would increase. Likewise, a higher proportion of small enterprises expected that both potential benefits as well as costs would increase in near future. There were no major differences in the responses between medium and large enterprises.
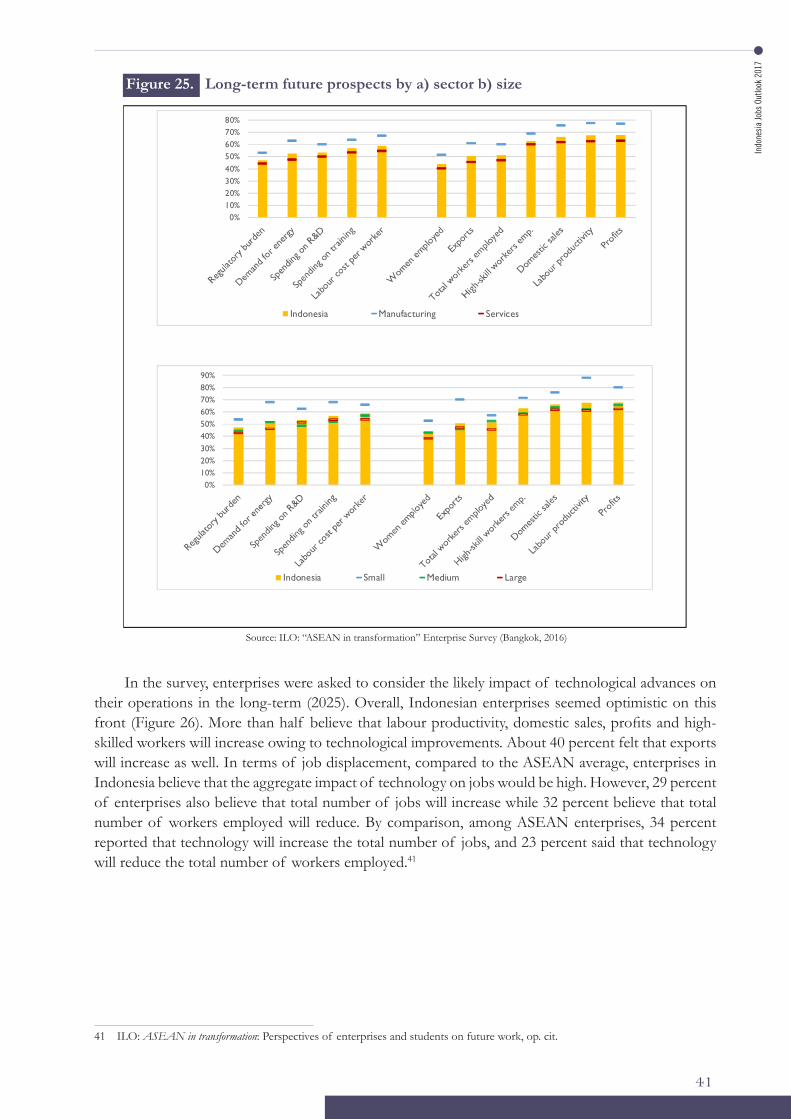
Indo
nesi
a Jo
bs O
utlo
ok 2
017
41
In the survey, enterprises were asked to consider the likely impact of technological advances on their operations in the long-term (2025). Overall, Indonesian enterprises seemed optimistic on this front (Figure 26). More than half believe that labour productivity, domestic sales, profits and high-skilled workers will increase owing to technological improvements. About 40 percent felt that exports will increase as well. In terms of job displacement, compared to the ASEAN average, enterprises in Indonesia believe that the aggregate impact of technology on jobs would be high. However, 29 percent of enterprises also believe that total number of jobs will increase while 32 percent believe that total number of workers employed will reduce. By comparison, among ASEAN enterprises, 34 percent reported that technology will increase the total number of jobs, and 23 percent said that technology will reduce the total number of workers employed.41
Source: ILO: “ASEAN in transformation” Enterprise Survey (Bangkok, 2016)
41 ILO: ASEAN in transformation: Perspectives of enterprises and students on future work, op. cit.
Figure 25. Long-term future prospects by a) sector b) size
44
Figure 25. Long-term future prospects by a) sector b) size
Source: ILO: “ASEAN in transformation” Enterprise Survey (Bangkok, 2016)
In the survey, enterprises were asked to consider the likely impact of technological advances on their operations in the long-term (2025). Overall, Indonesian enterprises seemed optimistic on this front (Figure 26). More than half believe that labour productivity, domestic sales, profits and high-skilled workers will increase owing to technological improvements. About 40 percent felt that exports will increase as well. In terms of job displacement, compared to the ASEAN average, enterprises in Indonesia believe that the aggregate impact of technology on jobs would be high. However, 29 percent of enterprises also believe that total number of jobs will increase while 32 percent believe that total number of workers employed will reduce. By comparison, among ASEAN enterprises, 34 percent reported that
0%10%20%30%40%50%60%70%80%a.
Indonesia Manufacturing Services
0%10%20%30%40%50%60%70%80%90%b.
Indonesia Small Medium Large
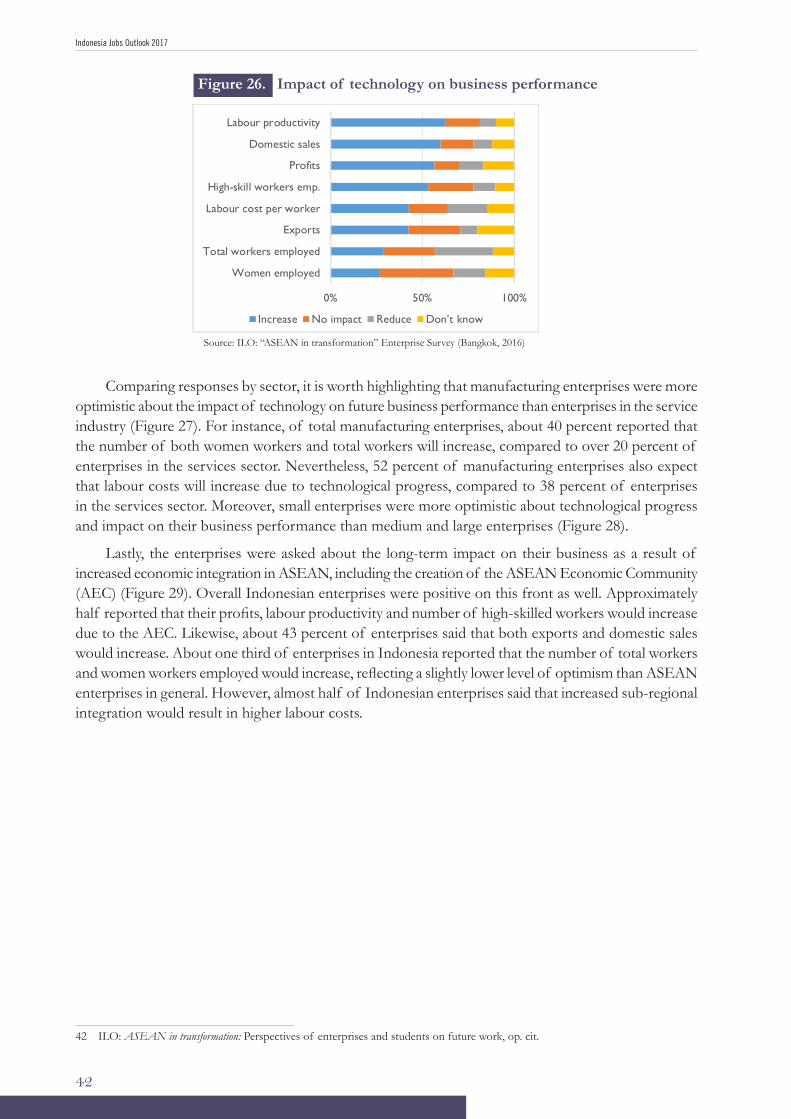
Indonesia Jobs Outlook 2017
42
Comparing responses by sector, it is worth highlighting that manufacturing enterprises were more optimistic about the impact of technology on future business performance than enterprises in the service industry (Figure 27). For instance, of total manufacturing enterprises, about 40 percent reported that the number of both women workers and total workers will increase, compared to over 20 percent of enterprises in the services sector. Nevertheless, 52 percent of manufacturing enterprises also expect that labour costs will increase due to technological progress, compared to 38 percent of enterprises in the services sector. Moreover, small enterprises were more optimistic about technological progress and impact on their business performance than medium and large enterprises (Figure 28).
Lastly, the enterprises were asked about the long-term impact on their business as a result of increased economic integration in ASEAN, including the creation of the ASEAN Economic Community (AEC) (Figure 29). Overall Indonesian enterprises were positive on this front as well. Approximately half reported that their profits, labour productivity and number of high-skilled workers would increase due to the AEC. Likewise, about 43 percent of enterprises said that both exports and domestic sales would increase. About one third of enterprises in Indonesia reported that the number of total workers and women workers employed would increase, reflecting a slightly lower level of optimism than ASEAN enterprises in general. However, almost half of Indonesian enterprises said that increased sub-regional integration would result in higher labour costs.
Figure 26. Impact of technology on business performance
45
technology will increase the total number of jobs, and 23 percent said that technology will reduce the total number of workers employed.41
Figure 26. Impact of technology on business performance
Source: ILO: “ASEAN in transformation” Enterprise Survey (Bangkok, 2016)
Comparing responses by sector, it is worth highlighting that manufacturing enterprises were more optimistic about the impact of technology on future business performance than enterprises in the service industry (Figure 27, panel a). For instance, of total manufacturing enterprises, about 40 percent reported that the number of both women workers and total workers will increase, compared to over 20 percent of enterprises in the services sector. Nevertheless, 52 percent of manufacturing enterprises also expect that labour costs will increase due to technological progress, compared to 38 percent of enterprises in the services sector. Moreover, small enterprises were more optimistic about technological progress and impact on their business performance than medium and large enterprises (
Figure 27, panel b).
41 ILO: ASEAN in transformation: Perspectives of enterprises and students on future work, op. cit.
0% 50% 100%
Women employed
Total workers employed
Exports
Labour cost per worker
High-skill workers emp.
Profits
Domestic sales
Labour productivity
Increase No impact Reduce Don’t know
Source: ILO: “ASEAN in transformation” Enterprise Survey (Bangkok, 2016)
42 ILO: ASEAN in transformation: Perspectives of enterprises and students on future work, op. cit.
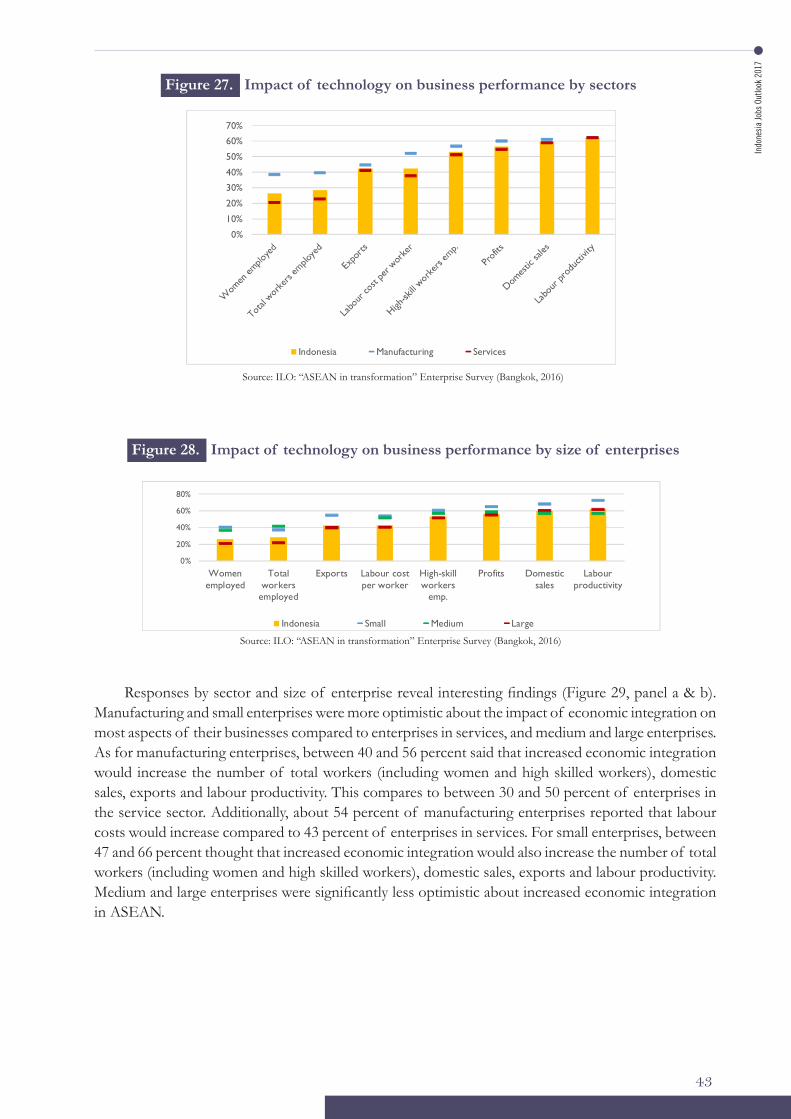
Indo
nesi
a Jo
bs O
utlo
ok 2
017
43
Responses by sector and size of enterprise reveal interesting findings (Figure 29, panel a & b). Manufacturing and small enterprises were more optimistic about the impact of economic integration on most aspects of their businesses compared to enterprises in services, and medium and large enterprises. As for manufacturing enterprises, between 40 and 56 percent said that increased economic integration would increase the number of total workers (including women and high skilled workers), domestic sales, exports and labour productivity. This compares to between 30 and 50 percent of enterprises in the service sector. Additionally, about 54 percent of manufacturing enterprises reported that labour costs would increase compared to 43 percent of enterprises in services. For small enterprises, between 47 and 66 percent thought that increased economic integration would also increase the number of total workers (including women and high skilled workers), domestic sales, exports and labour productivity. Medium and large enterprises were significantly less optimistic about increased economic integration in ASEAN.
Figure 27. Impact of technology on business performance by sectors
Source: ILO: “ASEAN in transformation” Enterprise Survey (Bangkok, 2016)
46
Figure 27. Impact of technology on business performance by a) sectors and b) size of enterprises
Source: ILO: “ASEAN in transformation” Enterprise Survey (Bangkok, 2016)
Lastly, the enterprises were asked about the long-term impact on their business as a result of increased economic integration in ASEAN, including the creation of the ASEAN Economic Community (AEC) (Figure 28). Overall Indonesian enterprises were positive on this front as well. Approximately half reported that their profits, labour productivity and number of high-skilled workers would increase due to the AEC. Likewise, about 43 percent of enterprises said that both exports and domestic sales would increase. About one third of enterprises in Indonesia reported that the number of total workers and women workers employed would increase, reflecting a slightly lower level of optimism than ASEAN enterprises in general.42 However, almost half of Indonesian enterprises said that increased sub-regional integration would result in higher labour costs.
42 ILO: ASEAN in transformation: Perspectives of enterprises and students on future work, op. cit.
0%
10%
20%
30%
40%
50%
60%
70%a.
Indonesia Manufacturing Services
0%
20%
40%
60%
80%
Womenemployed
Totalworkers
employed
Exports Labour costper worker
High-skillworkers
emp.
Profits Domesticsales
Labourproductivity
b.
Indonesia Small Medium Large
Figure 28. Impact of technology on business performance by size of enterprises
46
Figure 27. Impact of technology on business performance by a) sectors and b) size of enterprises
Source: ILO: “ASEAN in transformation” Enterprise Survey (Bangkok, 2016)
Lastly, the enterprises were asked about the long-term impact on their business as a result of increased economic integration in ASEAN, including the creation of the ASEAN Economic Community (AEC) (Figure 28). Overall Indonesian enterprises were positive on this front as well. Approximately half reported that their profits, labour productivity and number of high-skilled workers would increase due to the AEC. Likewise, about 43 percent of enterprises said that both exports and domestic sales would increase. About one third of enterprises in Indonesia reported that the number of total workers and women workers employed would increase, reflecting a slightly lower level of optimism than ASEAN enterprises in general.42 However, almost half of Indonesian enterprises said that increased sub-regional integration would result in higher labour costs.
42 ILO: ASEAN in transformation: Perspectives of enterprises and students on future work, op. cit.
0%
10%
20%
30%
40%
50%
60%
70%a.
Indonesia Manufacturing Services
0%
20%
40%
60%
80%
Womenemployed
Totalworkers
employed
Exports Labour costper worker
High-skillworkers
emp.
Profits Domesticsales
Labourproductivity
b.
Indonesia Small Medium Large
Source: ILO: “ASEAN in transformation” Enterprise Survey (Bangkok, 2016)
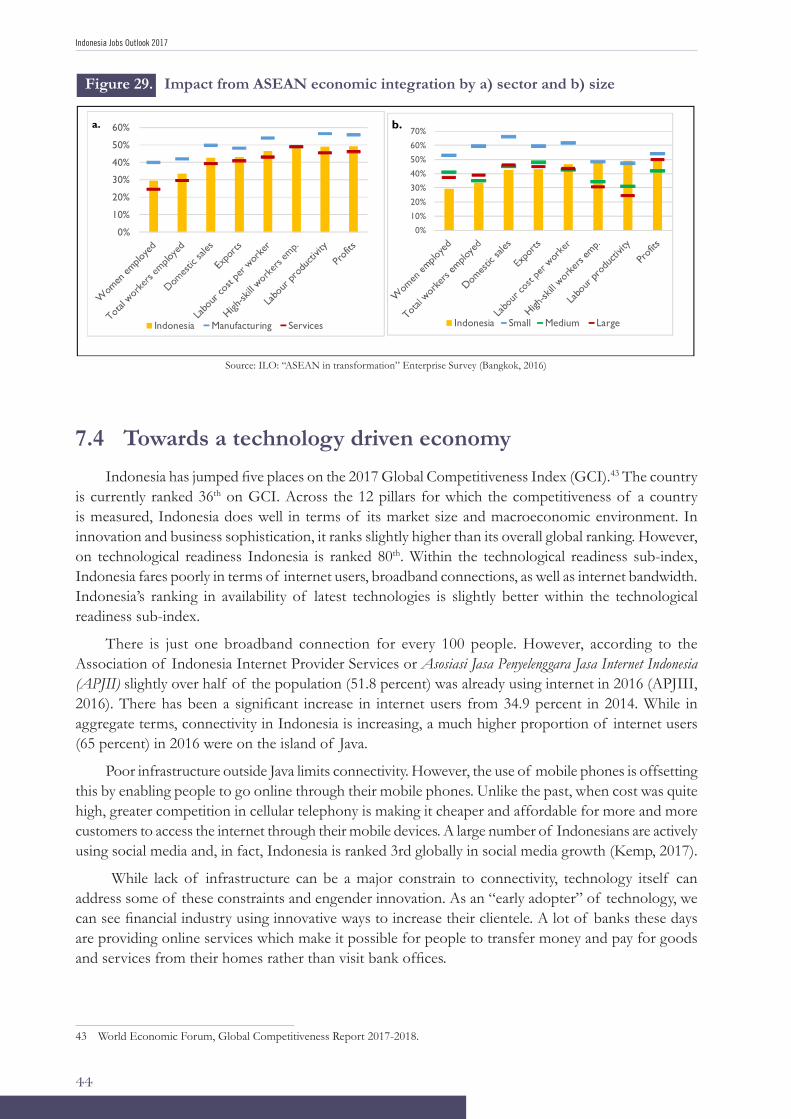
Indonesia Jobs Outlook 2017
44
47
Figure 28. Impact from ASEAN economic integration
Source: ILO: “ASEAN in transformation” Enterprise Survey (Bangkok, 2016)
Responses by sector and size of enterprise reveal interesting findings (Figure 29, panel a & b). Manufacturing and small enterprises were more optimistic about the impact of economic integration on most aspects of their businesses compared to enterprises in services, and medium and large enterprises. As for manufacturing enterprises, between 40 and 56 percent said that increased economic integration would increase the number of total workers (including women and high skilled workers), domestic sales, exports and labour productivity. This compares to between 30 and 50 percent of enterprises in the service sector. Additionally, about 54 percent of manufacturing enterprises reported that labour costs would increase compared to 43 percent of enterprises in services. For small enterprises, between 47 and 66 percent thought that increased economic integration would also increase the number of total workers (including women and high skilled workers), domestic sales, exports and labour productivity. Medium and large enterprises were significantly less optimistic about increased economic integration in ASEAN.
Figure 29. Impact from ASEAN economic integration by a) sector and b) size
Source: ILO: “ASEAN in transformation” Enterprise Survey (Bangkok, 2016)
0% 50% 100%
Women employed
Total workers employed
Domestic sales
Exports
Labour cost per worker
High-skill workers emp.
Labour productivity
Profits
Increase No impact Reduce Don’t know
0%
10%
20%
30%
40%
50%
60%a.
Indonesia Manufacturing Services
0%
10%
20%
30%
40%
50%
60%
70%b.
Indonesia Small Medium Large
Figure 29. Impact from ASEAN economic integration by a) sector and b) size
Source: ILO: “ASEAN in transformation” Enterprise Survey (Bangkok, 2016)
7.4 Towards a technology driven economyIndonesia has jumped five places on the 2017 Global Competitiveness Index (GCI).43 The country
is currently ranked 36th on GCI. Across the 12 pillars for which the competitiveness of a country is measured, Indonesia does well in terms of its market size and macroeconomic environment. In innovation and business sophistication, it ranks slightly higher than its overall global ranking. However, on technological readiness Indonesia is ranked 80th. Within the technological readiness sub-index, Indonesia fares poorly in terms of internet users, broadband connections, as well as internet bandwidth. Indonesia’s ranking in availability of latest technologies is slightly better within the technological readiness sub-index.
There is just one broadband connection for every 100 people. However, according to the Association of Indonesia Internet Provider Services or Asosiasi Jasa Penyelenggara Jasa Internet Indonesia (APJII) slightly over half of the population (51.8 percent) was already using internet in 2016 (APJIII, 2016). There has been a significant increase in internet users from 34.9 percent in 2014. While in aggregate terms, connectivity in Indonesia is increasing, a much higher proportion of internet users (65 percent) in 2016 were on the island of Java.
Poor infrastructure outside Java limits connectivity. However, the use of mobile phones is offsetting this by enabling people to go online through their mobile phones. Unlike the past, when cost was quite high, greater competition in cellular telephony is making it cheaper and affordable for more and more customers to access the internet through their mobile devices. A large number of Indonesians are actively using social media and, in fact, Indonesia is ranked 3rd globally in social media growth (Kemp, 2017).
While lack of infrastructure can be a major constrain to connectivity, technology itself can address some of these constraints and engender innovation. As an “early adopter” of technology, we can see financial industry using innovative ways to increase their clientele. A lot of banks these days are providing online services which make it possible for people to transfer money and pay for goods and services from their homes rather than visit bank offices.
43 World Economic Forum, Global Competitiveness Report 2017-2018.
Indo
nesi
a Jo
bs O
utlo
ok 2
017
45
In fact the marriage between finance and technology has given birth of what are called as the fintech companies. These companies rely primarily on digitalization for their operations. A good example of fintech to overcome poor infrastructure is M-PESA in Kenya. Compared to Indonesia, mobile banking started and expanded much earlier in Kenya which has fewer bank branches in rural areas. M-PESA is one of the leading mobile payment systems in Kenya and already has 2.5 million registered users.44
The rapid growth of ride-hailing services in several cities of Indonesia may also be a response to the poor state of public transportation. Traffic congestion makes online buying more appealing to consumers who prefer to shop from their homes rather than spend a lot of time stuck in the traffic. Also, for Indonesians living in smaller towns and rural areas, away from the shopping malls in cities, online shopping means having access to a greater range of things that they can purchase with a click of their cellular phones.
Based on available information, it appears that digitalization in Indonesia’s trade and services sector seems to be more widespread. Without detailed firm level data, it is difficult to tell the pace of technology uptake in the other sectors of the economy such as manufacturing. As discussed above, the use of industrial robots has increased in Indonesia, albeit from a low base. In several labour intensive sectors of manufacturing such as garments technology uptake is probably less widespread owing to the nature of production which, at least for now, requires humans to perform several tasks which are difficult for machines to do.
Overall though Indonesia’s manufacturing sector is still growing, but the pace of growth and job creation has diminished compared to the period prior to the financial crisis in 1997. Growth in manufacturing has not picked up significantly in Indonesia in the post 1997 period. Between 2003 and 2015 while the economy grew at 5.6 percent annually, the annual growth rate in the manufacturing sector was only 4.9 percent.
Indonesia has lost some of its global market share in manufacturing. Arguably, this has more to do with the investment climate and competitiveness (World Bank, 2012). Before the launch of the current set of business reforms (paket kebijakan), Indonesia was losing its export competitiveness in several niche manufacturing sub-sectors such as furniture, garments and textiles (Kuncoro, 2013). More recently, there are also cases of several large furniture companies relocating to Viet Nam owing to low cost and a more conducive business environment.45
In the global manufacturing value added (MVA), Indonesia is ranked 11th in the world (UNIDO, 2016). Indonesia’s share in global MVA shows a slight increase from 1.55 percent in 2005 to 1.83 percent in 2016. In the same period, for example, China’s global share of MVA more than doubled from 11.6 percent to 24.3 percent. It is important to note here that almost all the countries other than China which are ranked in the top 15 saw their MVA shrink. In other words, the decline in the relative contribution of manufacturing in the economy seems to be a “global phenomenon”.
Based on available evidence, it appears that automation or adoption of sophisticated technology, at least for now, is not the only factor which is slowing the growth of manufacturing or jobs in this sector. According to Rodrik (2015) technology played a less significant role in the premature deindustrialization of several developing countries. Compared to the past, Indonesia is no doubt facing greater competition from China as well as countries like Bangladesh, Vietnam, Cambodia, to name a few which have increased their footprint in low-end manufacturing. It was expected that with the development in China, the so called “sunset industries” will relocate to other emerging markets. But, this shift to emerging markets is not happening in any significant manner yet.
44 http://www.cgap.org/blog/why-has-m-pesa-become-so-popular-kenya45 http://jakartaglobe.id/business/furniture-producers-relocate-vietnam-due-cheap-labor-costs-business-friendly-regulations/
Indonesia Jobs Outlook 2017
46
As discussed in the previous section, the findings from the enterprise survey present a picture of firms in the manufacturing sector being more optimistic about technology. Compared to firms in the services sector, manufacturing firms see a lot of benefits from technology including higher revenue, rising corporate profits as well as labour productivity. Interestingly, more of these firms also expect that the number of workers will grow. The main challenge cited by the businesses vis-à-vis technology is the high investment (fixed) costs. Besides that, manufacturing firms seem to be more concerned about domestic regulatory environment and not so much about economic integration in ASEAN.
The reason that manufacturing is singled out in our technology and jobs discussion is owing to its developmental impact. Historically, manufacturing offered the pathway for low-income countries to reduce their dependency on agriculture (World Bank, 2017). Very few countries have made the transition and industrialized without experiencing a significant increase in the manufacturing output. Manufacturing provided dual benefits: economic growth as well as jobs which often were more productive than agriculture.
Without finding new sources of growth that have the same dual effect as manufacturing, it will be difficult for Indonesia to manage technological upgrading without undermining job creation. An optimistic way of looking at the current challenge is to use the opportunities that technology offers to shape the Indonesian economy in a way that it unleashes productive growth and benefits are spread more equitably among the population.
Indo
nesi
a Jo
bs O
utlo
ok 2
017
47
IN several of the preceding sections of this report we have touched upon human skills. As discussed, future technology will disproportionally impact routine tasks that can be codified and done by computers and machines. Besides fixed costs, finding skilled workers was one of the constraints identified by firms which makes adoption of technology difficult in Indonesia.46
The ability of the workforce to continuously improve their skills will be a key determinant whether technology becomes a blessing or spells doom for jobs. In this section, we will delve deeper to understand available skills and gaps in Indonesia’s human capital.
8.1 Working age population and labour force The total working age population (15yrs +) of Indonesia in 2016 was estimated to be slightly over
189 million people. Between 1996 and 2016 the working-age population increased by over 57 million people. During this period, the labour force, which includes both unemployed and employed, increased by 37.6 million which translates into a net annual increase of approximately 1.8 million people. The labour force participation rate (LFPR) indicates the potential supply of labour from the working-age who can engage in the production of goods and services. In 2016 a total of 125.4 million or 66.3 percent of the working age population was in the labour force. Apart from 2015 when it dropped to 65.8 percent, LFPR in the last two decades has remained somewhat constant, hovering around 66 percent.
As shown in Figure 30, the age group 30-34 has the highest LFPR (95.8 percent). We can see that LFPR for men starts to fall gradually for those aged 35 and above. On the other hand, the peak in LFPR for women is achieved when they are in their early to mid-forties (62.3 percent). The rate drops slightly for the 45-49 age group and then marginally increases again (50-54 years) before it starts to fall. The fact that the participation of women peaks in the forties compared to men can probably be explained by additional domestic and childbearing responsibilities for women. The latter being the case usually for women below 45.
The LFPR pattern for different age groups has remained relatively unchanged over the last two decades. The one noticeable change is the participation rate of 15-19 years old. LFPR for this age group (both male and female) dropped considerably between 1996 and 2016. It dropped approximately 12.7 percentage points. During this period school enrolment rate for different levels increased. On the other hand, the proportion of NEET declined between 1996 (27.1 percent) to 2016 (23.2 percent).
Skills challenge in Indonesia
8
46 ILO, 2016 ASEAN in Transformation Enterprise Survey.
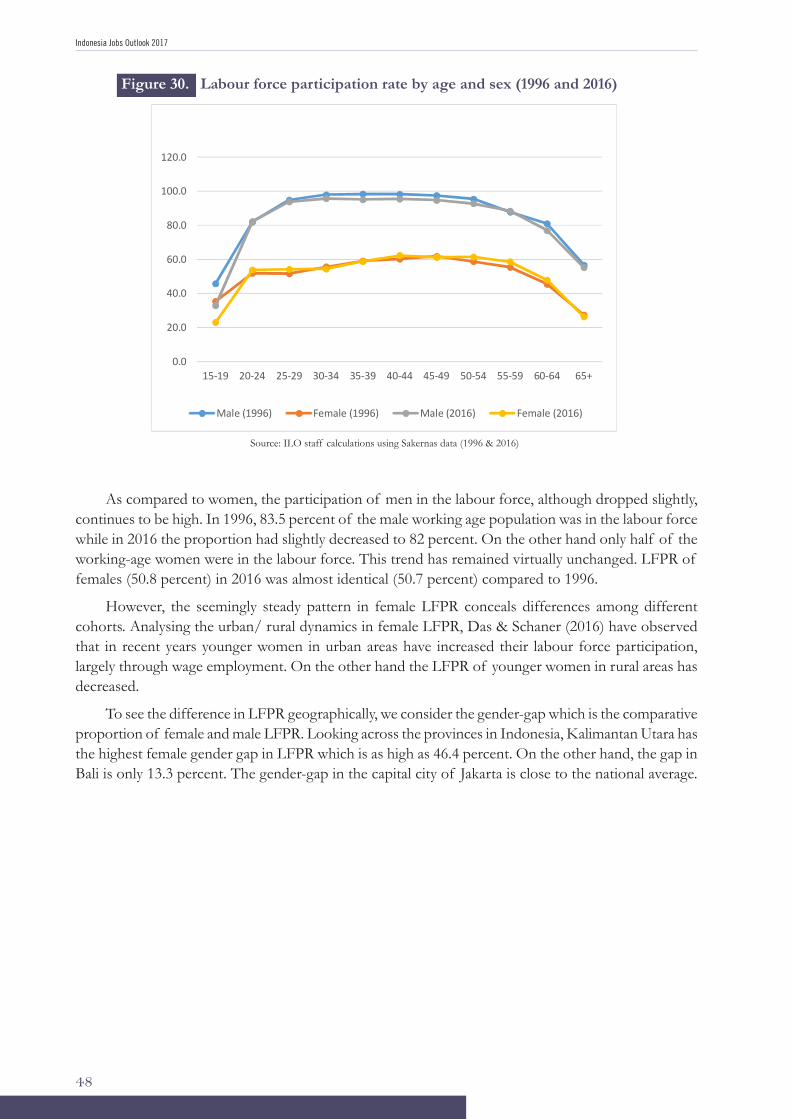
Indonesia Jobs Outlook 2017
48
As compared to women, the participation of men in the labour force, although dropped slightly, continues to be high. In 1996, 83.5 percent of the male working age population was in the labour force while in 2016 the proportion had slightly decreased to 82 percent. On the other hand only half of the working-age women were in the labour force. This trend has remained virtually unchanged. LFPR of females (50.8 percent) in 2016 was almost identical (50.7 percent) compared to 1996.
However, the seemingly steady pattern in female LFPR conceals differences among different cohorts. Analysing the urban/ rural dynamics in female LFPR, Das & Schaner (2016) have observed that in recent years younger women in urban areas have increased their labour force participation, largely through wage employment. On the other hand the LFPR of younger women in rural areas has decreased.
To see the difference in LFPR geographically, we consider the gender-gap which is the comparative proportion of female and male LFPR. Looking across the provinces in Indonesia, Kalimantan Utara has the highest female gender gap in LFPR which is as high as 46.4 percent. On the other hand, the gap in Bali is only 13.3 percent. The gender-gap in the capital city of Jakarta is close to the national average.
52
Figure 30 Labour Force Participation Rate by Age and Sex (1996 and 2016)
Source: ILO staff calculations using Sakernas data (1996 & 2016)
As compared to women, the participation of men in the labour force, although dropped slightly, continues to be high. In 1996, 83.5 percent of the male working age population was in the labour force while in 2016 the proportion had slightly decreased to 82 percent. On the other hand only half of the working-age women were in the labour force. This trend has remained virtually unchanged. LFPR of females (50.8 percent) in 2016 was almost identical (50.7 percent) compared to 1996. However, the seemingly steady pattern in female LFPR conceals differences among different cohorts. Analysing the urban/ rural dynamics in female LFPR, Das & Schaner (2016) have observed that in recent years younger women in urban areas have increased their labour force participation, largely through wage employment. On the other hand the LFPR of younger women in rural areas has decreased. To see the difference in LFPR geographically, we consider the gender-gap which is the comparative proportion of female and male LFPR. Looking across the provinces in Indonesia, Kalimantan Utara has the highest female gender gap in LFPR which is as high as 46.4 percent. On the other hand, the gap in Bali is only 13.3 percent. The gender-gap in the capital city of Jakarta is close to the national average.
0.0
20.0
40.0
60.0
80.0
100.0
120.0
15-19 20-24 25-29 30-34 35-39 40-44 45-49 50-54 55-59 60-64 65+
Male (1996) Female (1996) Male (2016) Female (2016)
Figure 30. Labour force participation rate by age and sex (1996 and 2016)
Source: ILO staff calculations using Sakernas data (1996 & 2016)
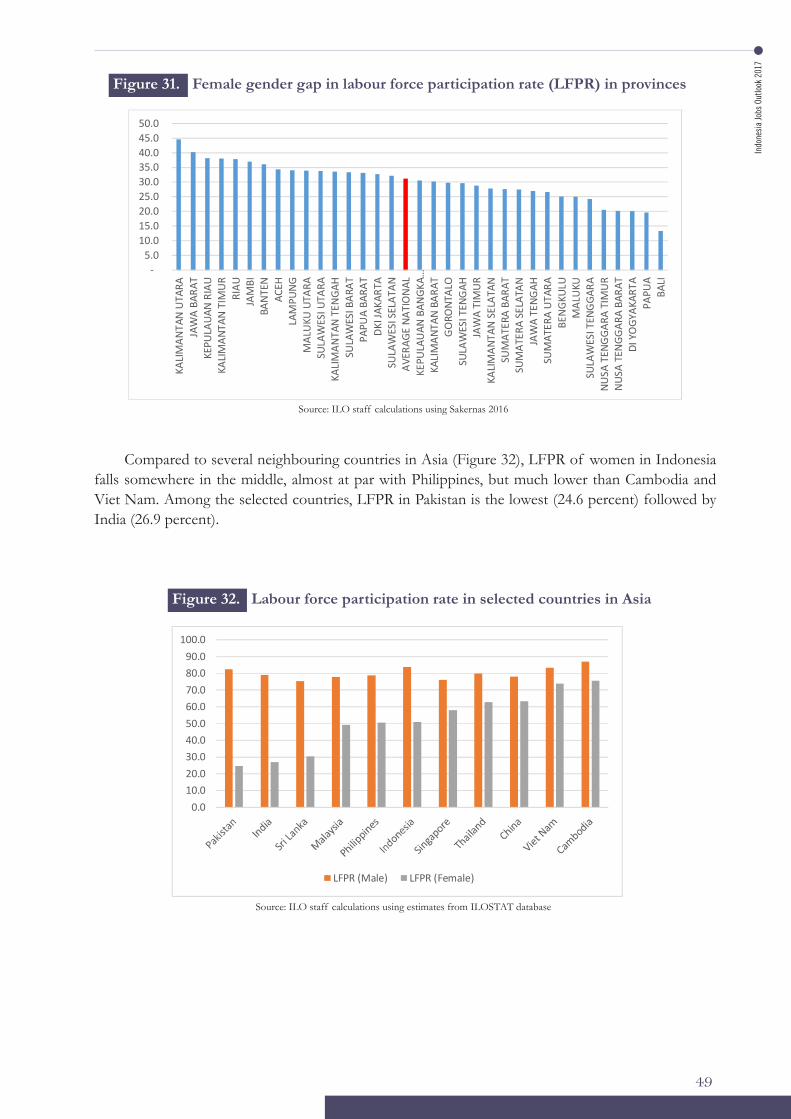
Indo
nesi
a Jo
bs O
utlo
ok 2
017
49
Figure 31. Female gender gap in labour force participation rate (LFPR) in provinces
Figure 32. Labour force participation rate in selected countries in Asia
Source: ILO staff calculations using Sakernas 2016
Source: ILO staff calculations using estimates from ILOSTAT database
53
Figure 31: Female gender gap in labour force participation Rate (LFPR) in provinces
Source: ILO staff calculations using Sakernas 2016
Compared to several neighbouring countries in Asia (Figure 32), LFPR of women in Indonesia falls somewhere in the middle, almost at par with Philippines, but much lower than Cambodia and Viet Nam. Among the selected countries, LFPR in Pakistan is the lowest (24.6 percent) followed by India (26.9 percent).
Figure 32: Labour Force Participation Rate in selected countries in Asia
Source: ILO staff calculations using estimates from ILOSTAT database
- 5.0
10.0 15.0 20.0 25.0 30.0 35.0 40.0 45.0 50.0
KALI
MAN
TAN
UTA
RAJA
WA
BARA
TKE
PULA
UAN
RIA
UKA
LIM
ANTA
N T
IMU
RRI
AUJA
MBI
BAN
TEN
ACEH
LAM
PUN
GM
ALU
KU U
TARA
SULA
WES
I UTA
RAKA
LIM
ANTA
N T
ENGA
HSU
LAW
ESI B
ARAT
PAPU
A BA
RAT
DKI J
AKAR
TASU
LAW
ESI S
ELAT
ANAV
ERAG
E NA
TIO
NAL
KEPU
LAU
AN B
ANGK
A…KA
LIM
ANTA
N B
ARAT
GO
RONT
ALO
SULA
WES
I TEN
GAH
JAW
A TI
MU
RKA
LIM
ANTA
N S
ELAT
ANSU
MAT
ERA
BARA
TSU
MAT
ERA
SELA
TAN
JAW
A TE
NGAH
SUM
ATER
A U
TARA
BEN
GKUL
UM
ALU
KUSU
LAW
ESI T
ENG
GARA
NUSA
TEN
GGA
RA T
IMU
RN
USA
TEN
GGAR
A BA
RAT
DI Y
OGY
AKAR
TAPA
PUA
BALI
0.010.020.030.040.050.060.070.080.090.0
100.0
LFPR (Male) LFPR (Female)
Compared to several neighbouring countries in Asia (Figure 32), LFPR of women in Indonesia falls somewhere in the middle, almost at par with Philippines, but much lower than Cambodia and Viet Nam. Among the selected countries, LFPR in Pakistan is the lowest (24.6 percent) followed by India (26.9 percent).
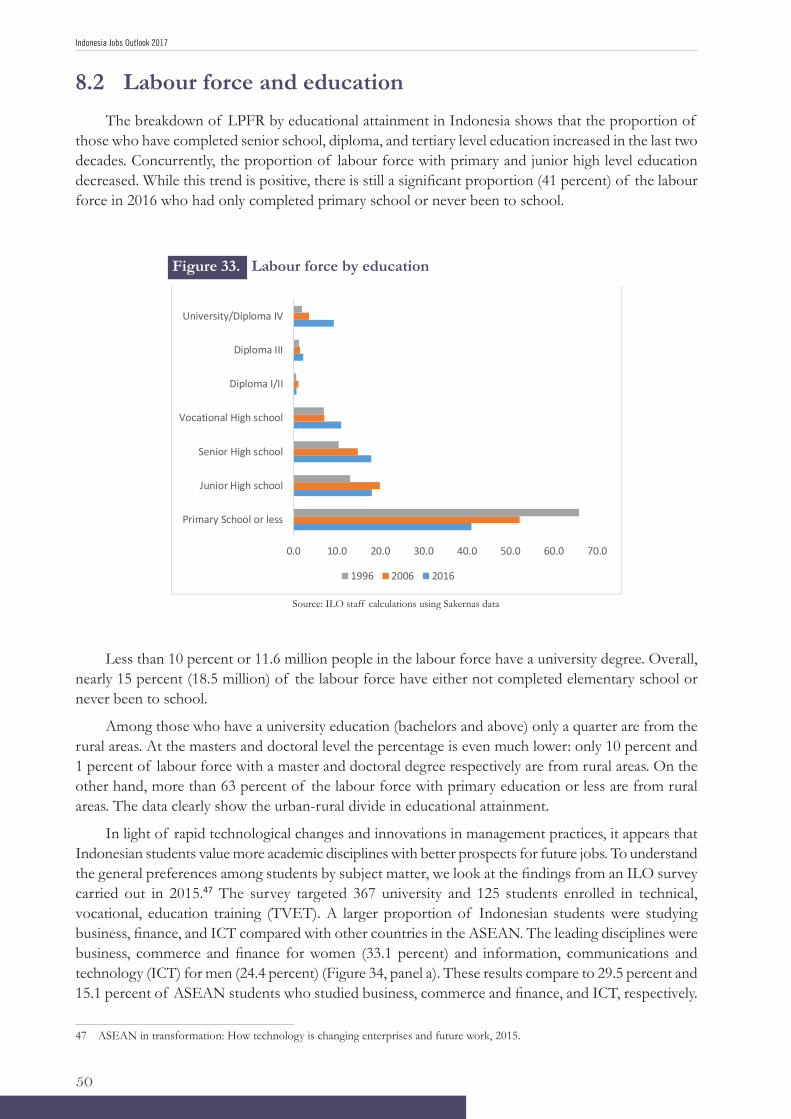
Indonesia Jobs Outlook 2017
50
8.2 Labour force and education The breakdown of LPFR by educational attainment in Indonesia shows that the proportion of
those who have completed senior school, diploma, and tertiary level education increased in the last two decades. Concurrently, the proportion of labour force with primary and junior high level education decreased. While this trend is positive, there is still a significant proportion (41 percent) of the labour force in 2016 who had only completed primary school or never been to school.
54
8.2 Labour force and education The breakdown of LPFR by educational attainment in Indonesia shows that the proportion of those who have completed senior school, diploma, and tertiary level education increased in the last two decades. Concurrently, the proportion of labour force with primary and junior high level education decreased. While this trend is positive, there is still a significant proportion (41 percent) of the labour force in 2016 who had only completed primary school or never been to school.
Figure 33: Labour Force by education
Source: ILO staff calculations using Sakernas data (1996, 2006 & 2016)
Less than 10 percent or 11.6 million people in the labour force have a university degree. Overall, nearly 15 percent (18.5 million) of the labour force have either not completed elementary school or never been to school. Among those who have a university education (bachelors and above) only a quarter are from the rural areas. At the masters and doctoral level the percentage is even much lower: only 10 percent and 1 percent of labour force with a master and doctoral degree respectively are from rural areas. On the other hand, more than 63 percent of the labour force with primary education or less are from rural areas. The data clearly show the urban-rural divide in educational attainment. In light of rapid technological changes and innovations in management practices, it appears that Indonesian students value more academic disciplines with better prospects for future jobs. To understand the general preferences among students by subject matter, we look at
0.0 10.0 20.0 30.0 40.0 50.0 60.0 70.0
Primary School or less
Junior High school
Senior High school
Vocational High school
Diploma I/II
Diploma III
University/Diploma IV
1996 2006 2016
Figure 33. Labour force by education
Source: ILO staff calculations using Sakernas data
Less than 10 percent or 11.6 million people in the labour force have a university degree. Overall, nearly 15 percent (18.5 million) of the labour force have either not completed elementary school or never been to school.
Among those who have a university education (bachelors and above) only a quarter are from the rural areas. At the masters and doctoral level the percentage is even much lower: only 10 percent and 1 percent of labour force with a master and doctoral degree respectively are from rural areas. On the other hand, more than 63 percent of the labour force with primary education or less are from rural areas. The data clearly show the urban-rural divide in educational attainment.
In light of rapid technological changes and innovations in management practices, it appears that Indonesian students value more academic disciplines with better prospects for future jobs. To understand the general preferences among students by subject matter, we look at the findings from an ILO survey carried out in 2015.47 The survey targeted 367 university and 125 students enrolled in technical, vocational, education training (TVET). A larger proportion of Indonesian students were studying business, finance, and ICT compared with other countries in the ASEAN. The leading disciplines were business, commerce and finance for women (33.1 percent) and information, communications and technology (ICT) for men (24.4 percent) (Figure 34, panel a). These results compare to 29.5 percent and 15.1 percent of ASEAN students who studied business, commerce and finance, and ICT, respectively.
47 ASEAN in transformation: How technology is changing enterprises and future work, 2015.
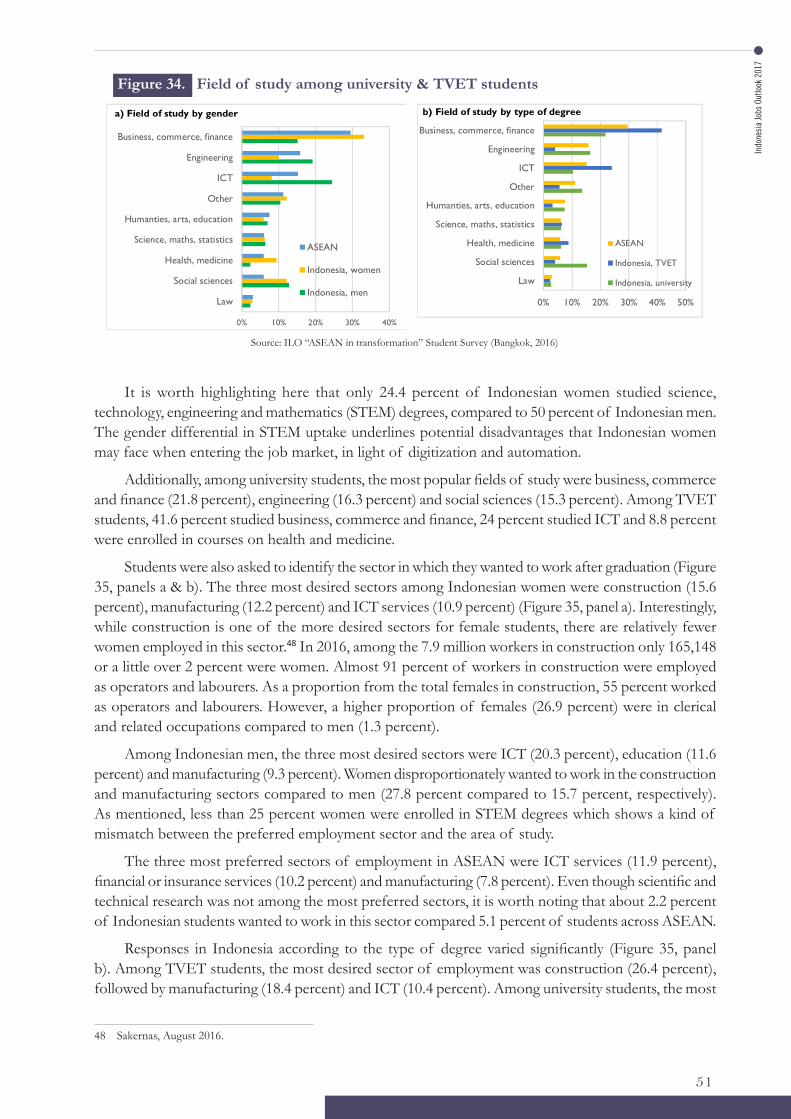
Indo
nesi
a Jo
bs O
utlo
ok 2
017
51
It is worth highlighting here that only 24.4 percent of Indonesian women studied science, technology, engineering and mathematics (STEM) degrees, compared to 50 percent of Indonesian men. The gender differential in STEM uptake underlines potential disadvantages that Indonesian women may face when entering the job market, in light of digitization and automation.
Additionally, among university students, the most popular fields of study were business, commerce and finance (21.8 percent), engineering (16.3 percent) and social sciences (15.3 percent). Among TVET students, 41.6 percent studied business, commerce and finance, 24 percent studied ICT and 8.8 percent were enrolled in courses on health and medicine.
Students were also asked to identify the sector in which they wanted to work after graduation (Figure 35, panels a & b). The three most desired sectors among Indonesian women were construction (15.6 percent), manufacturing (12.2 percent) and ICT services (10.9 percent) (Figure 35, panel a). Interestingly, while construction is one of the more desired sectors for female students, there are relatively fewer women employed in this sector.48 In 2016, among the 7.9 million workers in construction only 165,148 or a little over 2 percent were women. Almost 91 percent of workers in construction were employed as operators and labourers. As a proportion from the total females in construction, 55 percent worked as operators and labourers. However, a higher proportion of females (26.9 percent) were in clerical and related occupations compared to men (1.3 percent).
Among Indonesian men, the three most desired sectors were ICT (20.3 percent), education (11.6 percent) and manufacturing (9.3 percent). Women disproportionately wanted to work in the construction and manufacturing sectors compared to men (27.8 percent compared to 15.7 percent, respectively). As mentioned, less than 25 percent women were enrolled in STEM degrees which shows a kind of mismatch between the preferred employment sector and the area of study.
The three most preferred sectors of employment in ASEAN were ICT services (11.9 percent), financial or insurance services (10.2 percent) and manufacturing (7.8 percent). Even though scientific and technical research was not among the most preferred sectors, it is worth noting that about 2.2 percent of Indonesian students wanted to work in this sector compared 5.1 percent of students across ASEAN.
Responses in Indonesia according to the type of degree varied significantly (Figure 35, panel b). Among TVET students, the most desired sector of employment was construction (26.4 percent), followed by manufacturing (18.4 percent) and ICT (10.4 percent). Among university students, the most
Figure 34. Field of study among university & TVET students
Source: ILO “ASEAN in transformation” Student Survey (Bangkok, 2016)
48 Sakernas, August 2016.
55
the findings from an ILO survey carried out in 2015.47 The survey targeted 367 university and 125 students enrolled in technical, vocational, education training (TVET). A larger proportion of Indonesian students were studying business, finance, and ICT compared with other countries in the ASEAN. The leading disciplines were business, commerce and finance for women (33.1 percent) and information, communications and technology (ICT) for men (24.4 percent) (Figure 34, panel a). These results compare to 29.5 percent and 15.1 percent of ASEAN students who studied business, commerce and finance, and ICT, respectively.
Figure 34. Field of study among university & TVET students
Source: ILO “ASEAN in transformation” Student Survey (Bangkok, 2016)
It is worth highlighting here that only 24.4 percent of Indonesian women studied science, technology, engineering and mathematics (STEM) degrees, compared to 50 percent of Indonesian men. The gender differential in STEM uptake underlines potential disadvantages that Indonesian women may face when entering the job market, in light of digitization and automation.
Additionally, among university students, the most popular fields of study were business, commerce and finance (21.8 percent), engineering (16.3 percent) and social sciences (15.3 percent). Among TVET students, 41.6 percent studied business, commerce and finance, 24 percent studied ICT and 8.8 percent were enrolled in courses on health and medicine. Students were also asked to identify the sector in which they wanted to work after graduation (Figure 35, panels a & b). The three most desired sectors among Indonesian women were construction (15.6 percent), manufacturing (12.2 percent) and ICT services (10.9 percent) (Figure 35, panel a). Interestingly, while construction is one of the more desired sectors for female students, there are relatively fewer women employed in this sector48. In 2016, among
47 ASEAN in transformation: How technology is changing enterprises and future work, 2015. 48 Sakernas, August 2016
0% 10% 20% 30% 40%
Law
Social sciences
Health, medicine
Science, maths, statistics
Humanties, arts, education
Other
ICT
Engineering
Business, commerce, finance
a) Field of study by gender
ASEAN
Indonesia, women
Indonesia, men0% 10% 20% 30% 40% 50%
Law
Social sciences
Health, medicine
Science, maths, statistics
Humanties, arts, education
Other
ICT
Engineering
Business, commerce, finance
b) Field of study by type of degree
ASEAN
Indonesia, TVET
Indonesia, university
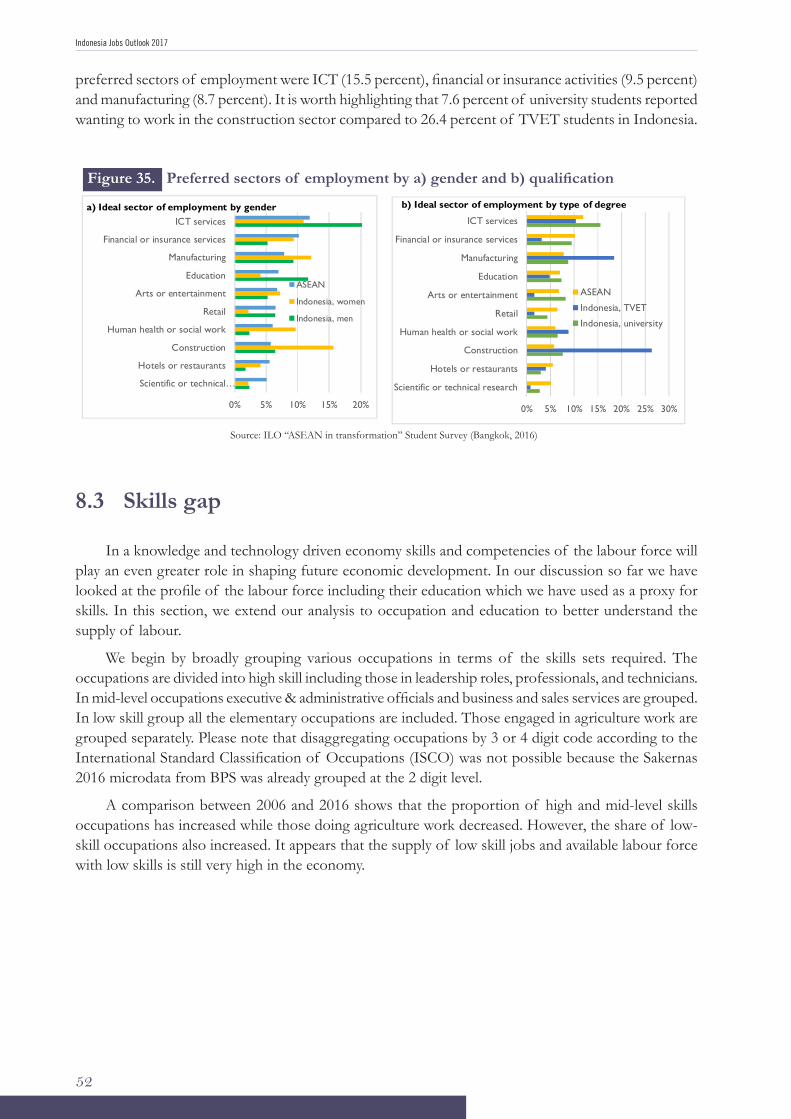
Indonesia Jobs Outlook 2017
52
preferred sectors of employment were ICT (15.5 percent), financial or insurance activities (9.5 percent) and manufacturing (8.7 percent). It is worth highlighting that 7.6 percent of university students reported wanting to work in the construction sector compared to 26.4 percent of TVET students in Indonesia.
Figure 35. Preferred sectors of employment by a) gender and b) qualification
56
the 7.9 million workers in construction only 165,148 or a little over 2 percent were women. Almost 91 percent of workers in construction were employed as operators and labourers. As a proportion from the total females in construction, 55 percent worked as operators and labourers. However, a higher proportion of females (26.9 percent) were in clerical and related occupations compared to men (1.3 percent). Among Indonesian men, the three most desired sectors were ICT (20.3 percent), education (11.6 percent) and manufacturing (9.3 percent). Women disproportionately wanted to work in the construction and manufacturing sectors compared to men (27.8 percent compared to 15.7 percent, respectively). As mentioned, less than 25 percent women were enrolled in STEM degrees which shows a kind of mismatch between the preferred employment sector and the area of study. The three most preferred sectors of employment in ASEAN were ICT services (11.9 percent), financial or insurance services (10.2 percent) and manufacturing (7.8 percent). Even though scientific and technical research was not among the most preferred sectors, it is worth noting that about 2.2 percent of Indonesian students wanted to work in this sector compared 5.1 percent of students across ASEAN. Responses in Indonesia according to the type of degree varied significantly (Figure 35, panel b). Among TVET students, the most desired sector of employment was construction (26.4 percent), followed by manufacturing (18.4 percent) and ICT (10.4 percent). Among university students, the most preferred sectors of employment were ICT (15.5 percent), financial or insurance activities (9.5 percent) and manufacturing (8.7 percent). It is worth highlighting that 7.6 percent of university students reported wanting to work in the construction sector compared to 26.4 percent of TVET students in Indonesia.
Figure 35. Preferred sectors of employment by a) gender and b) qualification
Source: ILO “ASEAN in transformation” Student Survey (Bangkok, 2016)
0% 5% 10% 15% 20% 25% 30%
Scientific or technical research
Hotels or restaurants
Construction
Human health or social work
Retail
Arts or entertainment
Education
Manufacturing
Financial or insurance services
ICT services
b) Ideal sector of employment by type of degree
ASEAN
Indonesia, TVET
Indonesia, university
0% 5% 10% 15% 20%
Scientific or technical…
Hotels or restaurants
Construction
Human health or social work
Retail
Arts or entertainment
Education
Manufacturing
Financial or insurance services
ICT servicesa) Ideal sector of employment by gender
ASEAN
Indonesia, women
Indonesia, men
Source: ILO “ASEAN in transformation” Student Survey (Bangkok, 2016)
8.3 Skills gap
In a knowledge and technology driven economy skills and competencies of the labour force will play an even greater role in shaping future economic development. In our discussion so far we have looked at the profile of the labour force including their education which we have used as a proxy for skills. In this section, we extend our analysis to occupation and education to better understand the supply of labour.
We begin by broadly grouping various occupations in terms of the skills sets required. The occupations are divided into high skill including those in leadership roles, professionals, and technicians. In mid-level occupations executive & administrative officials and business and sales services are grouped. In low skill group all the elementary occupations are included. Those engaged in agriculture work are grouped separately. Please note that disaggregating occupations by 3 or 4 digit code according to the International Standard Classification of Occupations (ISCO) was not possible because the Sakernas 2016 microdata from BPS was already grouped at the 2 digit level.
A comparison between 2006 and 2016 shows that the proportion of high and mid-level skills occupations has increased while those doing agriculture work decreased. However, the share of low-skill occupations also increased. It appears that the supply of low skill jobs and available labour force with low skills is still very high in the economy.
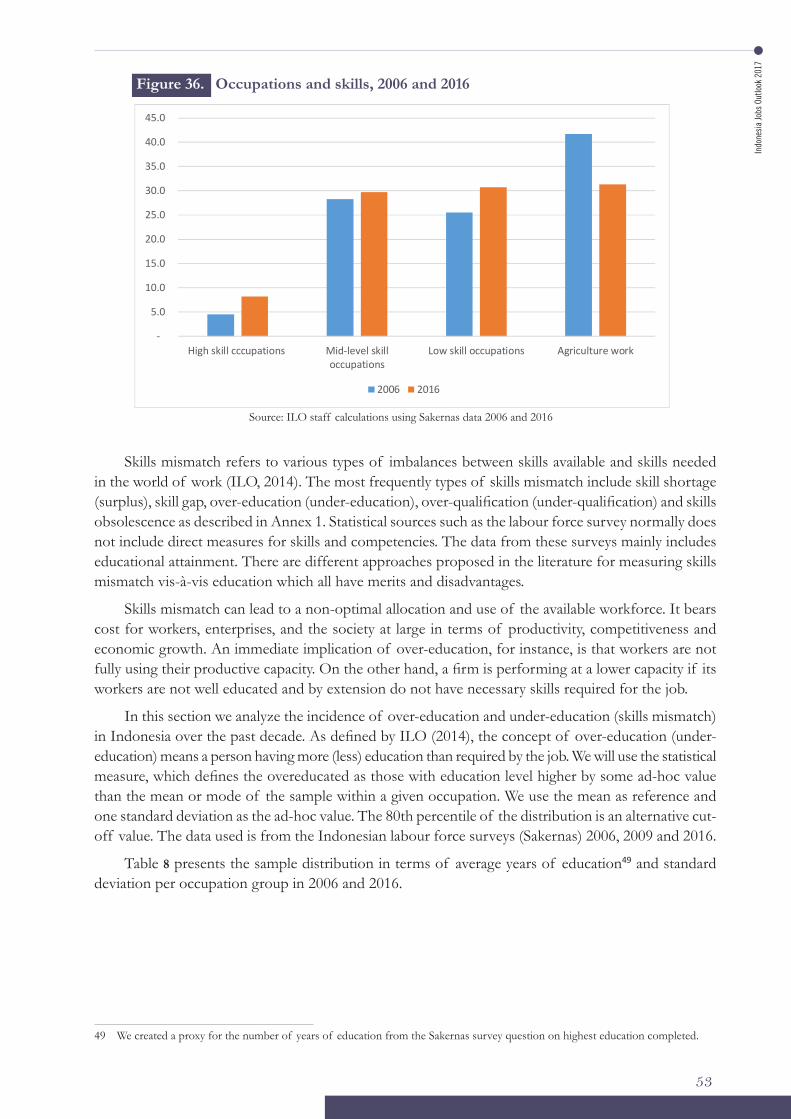
Indo
nesi
a Jo
bs O
utlo
ok 2
017
53
Skills mismatch refers to various types of imbalances between skills available and skills needed in the world of work (ILO, 2014). The most frequently types of skills mismatch include skill shortage (surplus), skill gap, over-education (under-education), over-qualification (under-qualification) and skills obsolescence as described in Annex 1. Statistical sources such as the labour force survey normally does not include direct measures for skills and competencies. The data from these surveys mainly includes educational attainment. There are different approaches proposed in the literature for measuring skills mismatch vis-à-vis education which all have merits and disadvantages.
Skills mismatch can lead to a non-optimal allocation and use of the available workforce. It bears cost for workers, enterprises, and the society at large in terms of productivity, competitiveness and economic growth. An immediate implication of over-education, for instance, is that workers are not fully using their productive capacity. On the other hand, a firm is performing at a lower capacity if its workers are not well educated and by extension do not have necessary skills required for the job.
In this section we analyze the incidence of over-education and under-education (skills mismatch) in Indonesia over the past decade. As defined by ILO (2014), the concept of over-education (under-education) means a person having more (less) education than required by the job. We will use the statistical measure, which defines the overeducated as those with education level higher by some ad-hoc value than the mean or mode of the sample within a given occupation. We use the mean as reference and one standard deviation as the ad-hoc value. The 80th percentile of the distribution is an alternative cut-off value. The data used is from the Indonesian labour force surveys (Sakernas) 2006, 2009 and 2016.
Table 8 presents the sample distribution in terms of average years of education49 and standard deviation per occupation group in 2006 and 2016.
49 We created a proxy for the number of years of education from the Sakernas survey question on highest education completed.
Figure 36. Occupations and skills, 2006 and 2016
57
8.3 Skills gap In a knowledge and technology driven economy skills and competencies of the labour force will play an even greater role in shaping future economic development. In our discussion so far we have looked at the profile of the labour force including their education which we have used as a proxy for skills. In this section, we extend our analysis to occupation and education to better understand the supply of labour. We begin by broadly grouping various occupations in terms of the skills sets required. The occupations are divided into high skill including those in leadership roles, professionals, and technicians. In mid-level occupations executive & administrative officials and business and sales services are grouped. In low skill group all the elementary occupations are included. Those engaged in agriculture work are grouped separately. Please note that disaggregating occupations by 3 or 4 digit code according to the International Standard Classification of Occupations (ISCO) was not possible because the Sakernas 2016 microdata from BPS was already grouped at the 2 digit level. A comparison between 2006 and 2016 shows that the proportion of high and mid-level skills occupations has increased while those doing agriculture work decreased. However, the share of low-skill occupations also increased. It appears that the supply of low skill jobs and available labour force with low skills is still very high in the economy.
Figure 36. Occupations and skills, 2006 and 2016
Source: ILO staff calculations using Sakernas data 2006 and 2016
-
5.0
10.0
15.0
20.0
25.0
30.0
35.0
40.0
45.0
High skill cccupations Mid-level skilloccupations
Low skill occupations Agriculture work
2006 2016
Source: ILO staff calculations using Sakernas data 2006 and 2016

Indonesia Jobs Outlook 2017
54
Between 2006 and 2016 we observe an increase in the average number of years of education for each occupational group. The highest standard deviation (3.7 years) is in the group of service workers (indicating a relatively heterogeneous group) while the lowest deviation is observed within the group of professionals, technicians and related workers (2.2 years).
Overall, in 2006, approximately one in ten employed person can be classified as undereducated. On the other hand around 3 in 10 persons can be classified as overeducated. While under-education has been increasing from 10 percent in 2006 to 17 percent in 2016, over-education has significantly deceased, from 27 percent to 19.2 percent in 2016. The total mismatch, however, remained relatively constant at around 37 percent of total employment.
Table 8. Average years of education (mean) of employed and standard deviation per major occupation group
Occupation
Professionals, technicians, and related workers
Leadership and management
Executive officials, administrative staff and related workers
Business and sales workers
Service workers
Agriculture, Plantation, Animal Husbandry, Fishery, Forestry Workers And Hunters
Transport production operators and blue collar workers
Others
14.1
13.0
12.8
8.2
8.5
5.6
7.8
12.0
26,998
4,682
19,330
80,722
22,284
245,128
112,170
2,725
2.2
3.1
2.6
3.8
3.9
3.4
3.5
1.6
years of educa-tion of the em-ployed (Mean)
years of educa-tion of the em-ployed (Mean)
14.8
13.5
13.3
9.2
8.8
6.5
8.4
11.5
Sample size
Sample size
Standard deviation
Standard deviation
2.2
3.2
2.6
3.6
3.7
3.2
3.3
2.5
6,174
1,109
5,341
13,973
3,723
31,418
21,339
1,342Source: ILO staff calculations using Sakernas 2006 and 2016 (August Series)
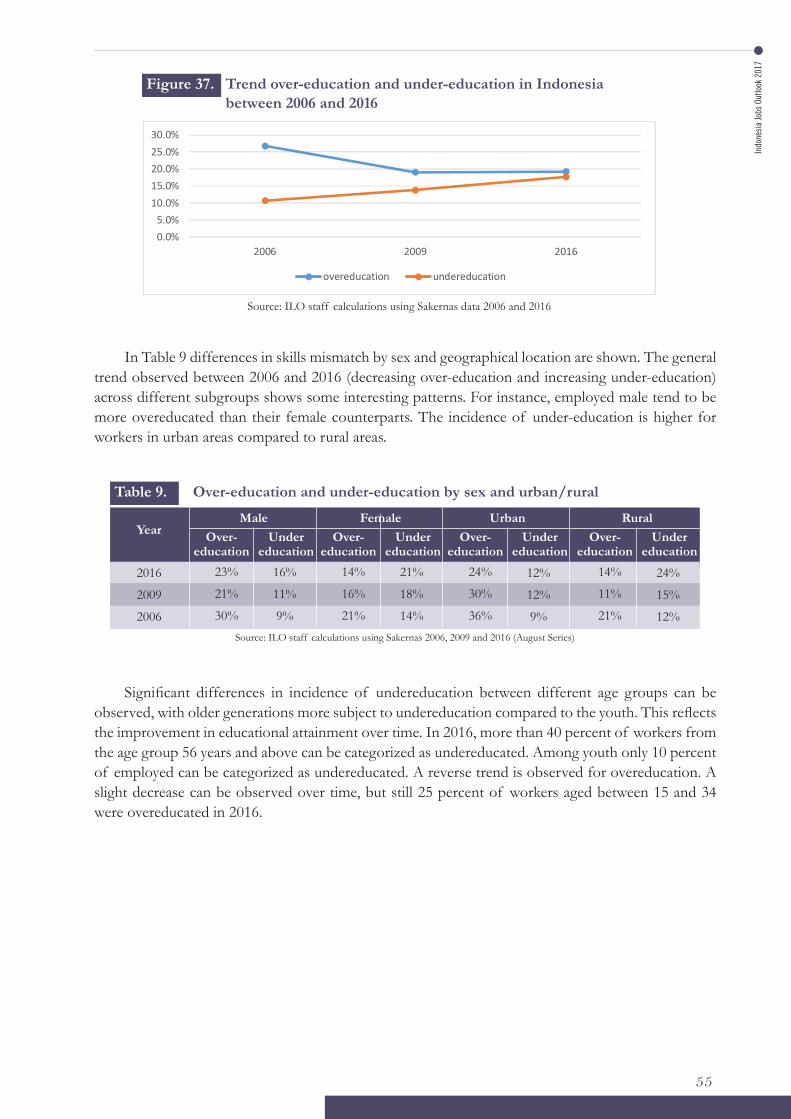
Indo
nesi
a Jo
bs O
utlo
ok 2
017
55
In Table 9 differences in skills mismatch by sex and geographical location are shown. The general trend observed between 2006 and 2016 (decreasing over-education and increasing under-education) across different subgroups shows some interesting patterns. For instance, employed male tend to be more overeducated than their female counterparts. The incidence of under-education is higher for workers in urban areas compared to rural areas.
Figure 37. Trend over-education and under-education in Indonesia between 2006 and 2016
Source: ILO staff calculations using Sakernas data 2006 and 2016
59
Service workers 8.5 3.9 22,284 8.8 3.7 3,723 Agriculture, Plantation, Animal Husbandry, Fishery, Forestry Workers And Hunters 5.6 3.4 245,128 6.5 3.2 31,418 Transport production operators and blue collar workers 7.8 3.5 112,170 8.4 3.3 21,339
Others 12.0 1.6 2,725 11.5 2.5 1,342
Source: ILO staff calculations using Sakernas 2009 and 2016 (August Series)
Between 2006 and 2016 we observe an increase in the average number of years of education for each occupational group. The highest standard deviation (3.7 years) is in the group of service workers (indicating a relatively heterogeneous group) while the lowest deviation is observed within the group of professionals, technicians and related workers (2.2 years). Overall, in 2006, approximately one in ten employed person can be classified as undereducated. On the other hand around 3 in 10 persons can be classified as overeducated. While under-education has been increasing from 10 percent in 2006 to 17 percent in 2016, over-education has significantly deceased, from 27 percent to 19.2 percent in 2016. The total mismatch, however, remained relatively constant at around 37 percent of total employment.
Figure 37. Trend over-education and under-education in Indonesia between 2006 and 2016
Source: ILO staff calculations using Sakernas 2006, 2009 and 2016 (August Series)
In Table 9 differences in skills mismatch by sex and geographical location are shown. The general trend observed between 2006 and 2016 (decreasing over-education and increasing under-education) across different subgroups shows some interesting patterns. For instance, employed male tend to be more overeducated than their female counterparts. The incidence of under-education is higher for workers in urban areas compared to rural areas.
0.0%5.0%
10.0%15.0%20.0%25.0%30.0%
2006 2009 2016
overeducation undereducation
Table 9. Over-education and under-education by sex and urban/rural
YearMale Female Urban Rural
2016
2009
2006
23%
21%
30%
14%
16%
21%
24%
30%
36%
14%
11%
21%
16%
11%
9%
21%
18%
14%
12%
12%
9%
24%
15%
12%
Over- education
Over- education
Over- education
Over- education
Under education
Under education
Under education
Under education
Source: ILO staff calculations using Sakernas 2006, 2009 and 2016 (August Series)
Significant differences in incidence of undereducation between different age groups can be observed, with older generations more subject to undereducation compared to the youth. This reflects the improvement in educational attainment over time. In 2016, more than 40 percent of workers from the age group 56 years and above can be categorized as undereducated. Among youth only 10 percent of employed can be categorized as undereducated. A reverse trend is observed for overeducation. A slight decrease can be observed over time, but still 25 percent of workers aged between 15 and 34 were overeducated in 2016.
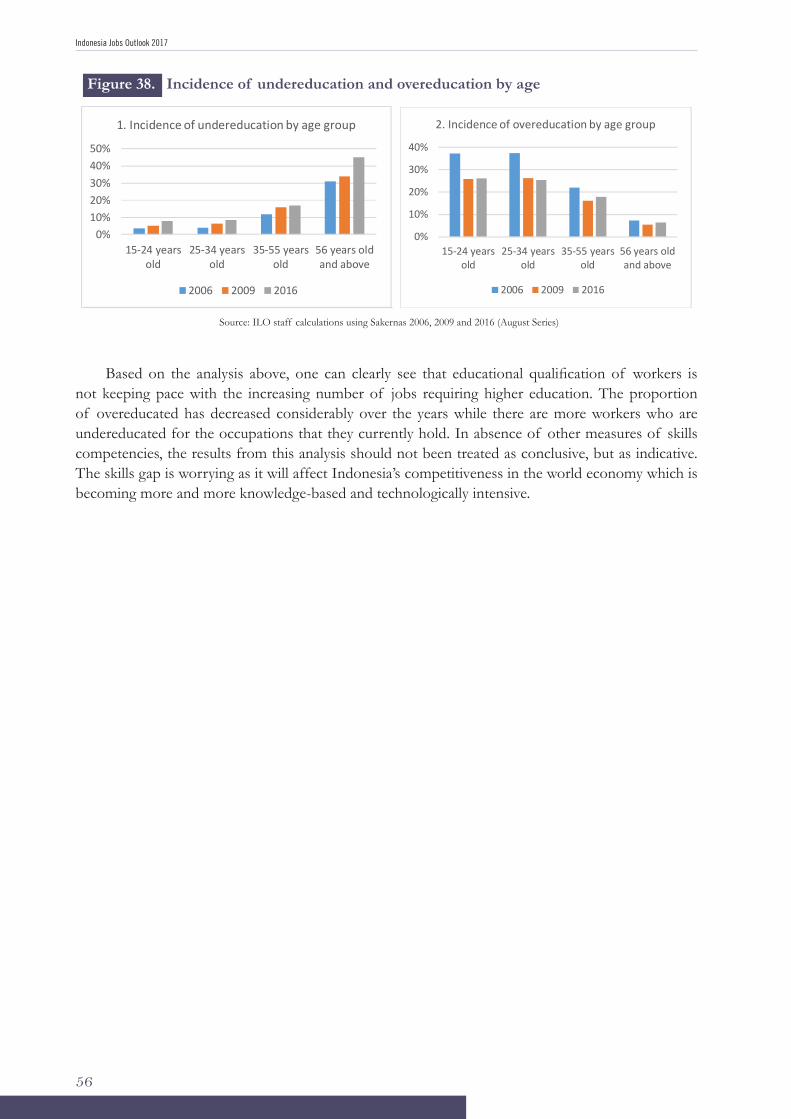
Indonesia Jobs Outlook 2017
56
Based on the analysis above, one can clearly see that educational qualification of workers is not keeping pace with the increasing number of jobs requiring higher education. The proportion of overeducated has decreased considerably over the years while there are more workers who are undereducated for the occupations that they currently hold. In absence of other measures of skills competencies, the results from this analysis should not been treated as conclusive, but as indicative. The skills gap is worrying as it will affect Indonesia’s competitiveness in the world economy which is becoming more and more knowledge-based and technologically intensive.
Figure 38. Incidence of undereducation and overeducation by age
Source: ILO staff calculations using Sakernas 2006, 2009 and 2016 (August Series)
60
Table 9. Over-education and under-education by sex and urban/rural
Year
Male Female Urban Rural
Overducation
Undereducation
Overducation
Undereducation
Overducation
Undereducation
Overducation
Undereducation
2016 23% 16% 14% 21% 24% 12% 14% 24%
2009 21% 11% 16% 18% 30% 12% 11% 15%
2006 30% 9% 21% 14% 36% 9% 21% 12% Source: ILO staff calculations using Sakernas 2006, 2009 and 2016 (August Series)
Significant differences in incidence of undereducation between different age groups can be observed, with older generations more subject to undereducation compared to the youth. This reflects the improvement in educational attainment over time. In 2016, more than 40 percent of workers from the age group 56 years and above can be categorized as undereducated. Among youth only 10 percent of employed can be categorized as undereducated. A reverse trend is observed for overeducation. A slight decrease can be observed over time, but still 25 percent of workers aged between 15 and 34 were overeducated in 2016.
Figure 38. Incidence of undereducation and overeducation by age
Source: ILO staff calculations using Sakernas 2006, 2009 and 2016 (August Series)
0%10%20%30%40%50%
15-24 yearsold
25-34 yearsold
35-55 yearsold
56 years oldand above
1. Incidence of undereducation by age group
2006 2009 2016
0%
10%
20%
30%
40%
15-24 yearsold
25-34 yearsold
35-55 yearsold
56 years oldand above
2. Incidence of overeducation by age group
2006 2009 2016
Indo
nesi
a Jo
bs O
utlo
ok 2
017
57
INDONESIAN economy has maintained a steady momentum amidst an uncertain global climate which has seen a deceleration of growth both in developed and emerging markets. Although emerging countries such as Indonesia are still growing at a reasonable rate, but the pace of growth is not high enough to create sizable number of good and decent jobs. During the 80s and 90s Indonesia went through a major structural transformation, economy diversified with growth and jobs in the non-agriculture sectors such as manufacturing and services. The structural shifts in the economy were accompanied by productivity gains across and within the sectors.
Prior to 1997 when the country was hit by the financial crisis, jobs in industrial sectors such as manufacturing were created more rapidly. With the crisis though that changed and since then Indonesia has not been able to regain its competitiveness and share in the manufacturing sector. The slack in manufacturing jobs was taken over by jobs in trade and services. But, generally, jobs in services- apart from business and professional services- are not as productive as manufacturing. As discussed, the share of manufacturing employment in the last decade (2006-2016) has merely increased by 1.4 percentage points. During this period around 3.7 million jobs were created in the manufacturing sector.
Agriculture still remains the major source of employment for Indonesian workers. However, combined together services and trade employ more than 46 percent of the workers. The trend characterized by the decline in the share of employment in agriculture with possibly further increase in trade and services is likely to continue. It remains to be seen how Indonesia will be able to gain a larger footprint in the manufacturing in the current global environment.
Overall, the quality of employment has improved, albeit slowly. The share of workers in vulnerable employment decreased. In this period one can observe that workers in mid-level and high skills occupations increased. There was an increase of jobs at the executive level, professionals and technicians. In nominal terms wages have also increased. However, wages are not necessarily commensurate with the GDP levels across the provinces. There are also significant wage differentials between men and women. Women are paid less than men even when controlling for education and experience.
Like in several industrialized and emerging economies, the debate on technology and jobs is receiving more and more attention in Indonesia. As discussed in this report, technology has always played a catalytic role in stimulating economic growth and productivity. Often technological progress has caused disruption in the job market, at least in the short-term. What makes the current technological shift different is the pace at which changes are taking place. Also, the worry is that this is happening when global demand is low and there is still plenty of slack in the job market. The technology drivers
Conclusions
9

Indonesia Jobs Outlook 2017
58
such as artificial intelligence, internet-of-things, 3D printing etc. are rapidly converging and likely to have a major impact on the production and consumption of goods and services.
Understandably, these changes are raising concerns about future job opportunities. In Indonesia, from the limited data available, it appears that digitalization is happening faster in services and trade, while technological upgrading in industry is not so widespread apart from the increase in use of industrial robots. In the case of Indonesia, there is also the question of firm size. For smaller enterprises, uptake of technology still entails significant investment and thus it is less costly for them to deploy more labour rather than replace it with machines.
However, in some quarters there are concerns that Indonesian manufacturing sector is quite susceptible to technology and automation. A rise in the purchase of industrial robots suggests more and more firms in Indonesia are moving towards automation. The findings from the ILO ASEAN enterprise survey show that more manufacturing firms are receptive to technological upgrading. Based on various reports and employment data, there is not enough evidence to suggest that technology is causing any significant disruptions in the manufacturing sector or many jobs are being lost owing to technological upgrading in manufacturing sector. Even before the current wave of technological changes, Indonesia was already beginning to lose its position in manufacturing.
Apart from the more obvious benefits for consumers, increasing digitalization is creating new jobs in Indonesia. Technological advancement in e-commerce, on-demand services, and transportation has meant that it is much easier for those seeking services and those who can provide these services to interact in the digital marketplace. There are even claims that this is bringing down the unemployment rate. While one can observe growth of ride- hailing services, and online platforms for buying and selling, without full data, it is difficult to see the net effect on jobs. Moreover, the types of jobs or tasks created in a growing gig economy do not necessarily provide job security to the workers. The jobs in question do offer flexibility, but many workers may not be getting adequate remuneration and there is no social safety or job security.
A growing number of Indonesians are getting connected to the digital space mainly through their hand-held devices. A rapid increase of internet users and very active users of social media, Indonesia is well positioned to benefit from the digital revolution that is unfolding. While there has been progress, the ICT infrastructure is not very developed, especially outside Java. Still, a small portion of private and public investment go for research & development. In technological readiness, Indonesia is placed very low on the GCI. As evidenced from the ASEAN enterprise survey, Indonesia may be faring better than the ASEAN 5 average, but it is still behind leaders in technological readiness such as Singapore and Malaysia.
A clear and emerging trend from technological advancement is that more and more routine tasks are being automated or taken over by machines. Studies have shown that jobs are becoming more polarized. Although estimates vary, it appears that many jobs requiring routine tasks will be replaced by machines. There seems to be consensus that in such an environment of change, skills development and human capital will play an even greater role in the future economic development of Indonesia. As we have seen, while educational attainment among Indonesia workers has improved over the years, many in the labour market have low educational qualifications. Our analysis shows that there are clearly skill gaps which need to be addressed otherwise Indonesia’s future development will be constrained.
Indo
nesi
a Jo
bs O
utlo
ok 2
017
59
Recommendations
10
IT is tempting to offer a whole range of measures for Indonesia to manage the economy and the job market in light of technological advancements. However, considering the limitation of analysis, the report takes a more prudent approach and highlights only a few priorities with a hope that further analysis will be carried out which will take into account the existing policy landscape and the ongoing business and regulatory reforms. Besides that the practicality of executing policy plans that are invariably constrained by fiscal space should also be considered. The following recommendations are, therefore, made as a general guidance for further shaping the existing economic and employment policies.
1. It is important to recognize that resisting technological change will be difficult, if not impossible in a globalized world. It is crucial that technology is seen as means or a driver to achieve higher levels of development. Historically, adoption of technology in the short-term has caused disruption in the labour market. Public policy and programmes should, thus, focus on helping those who are negatively affected or stand to lose from technology. Research has shown that active labour market policies (ALMP) deliver results when carried out to help people to learn new skills and assisting them with job searches. A set of ALMP could be prioritized to enable those who are at the risk of losing their livelihoods owing to technological upgrading.
2. Indonesia needs to pursue a pro-employment industrial policy. The term industrial policy has often generated polarizing views. Often times in this debate, people oppose too much government involvement, especially the difficulty for the government to pick winners. While private sector is not immune from making poor investment decisions, the presence of a market does create the incentives which ensures that loses are minimized and a different course of action can be taken as a response to market signals. There is, however, more consensus on the facilitative role that government can play in shaping industrial development. Government can do it by creating a level playing field, build infrastructure, incentivize private sector investment, and, if needed, provide some support for infant industries. It is in this spirit, that government can tailor its support in the revival of manufacturing as well as growth of new and creative industries.
3. There is strong case for continued public investment in skills development. Indonesia spends 20 percent of its budget on education. However, education outcomes are still low. Future funding should be closely tied to short or medium term outcomes. In other words, the quality of education should improve if Indonesians are to compete with other nations on an equal footing. With the creation of a single economic market in ASEAN, it is urgent that education and skills development programmes are revamped. Education should not be seen as merely getting an academic qualification but as life-long learning which continues at the work place.

Indonesia Jobs Outlook 2017
60
4. An equally strong case can be made for improving access to technology. As noted, while the number of users is increasing there are still a lot of people who, owing to lack of infrastructure and education, are not able to join the digital world. Connectivity will enable people to make use of technology in a way that yields greater benefits for them. In this regard, there is a lot of potential for small enterprises and young entrepreneurs to use technology and overcome obstacles that they normally face. These could be in the form of expanding their market share using online portals and also seek support services including finance and business management.
5. The current labour governance mechanisms may not be sufficient in light of the so called gig economy. A social dialogue involving all the relevant parties should be initiated soon to develop the labour governance architecture for those who fall outside the conventional employee-employer relationship. Furthermore, the ongoing efforts to extend social security coverage should include measures to address the specificities of work in non-standards forms of employment. A strategic alliance, for instance, between social security and tax authority through the establishment of a simplified and unified collection system can help reach more workers, especially in the informal economy. The results of such a scheme being implemented in other countries are indeed promising. Also group membership has the potential to encourage registration and help in the collection of contributions from individual workers. As the classical “shared contribution” model by employers and employees is not applicable to the growing number of workers involved in the “on demand” forms of work, innovative financing options should be explored.
6. Indonesia needs to reassess the efficacy and relevance of its social transfer programmes. There are a range of cash and in-kind social transfers targeting low-income and vulnerable people. In addition to this, the state provides implicit support through subsidies to farmers, fuel, and electricity, to name a few. With the use of electronic identity cards, the country is moving towards cash-based payments. Globally, the idea of a universal basic income (UBI) is gaining more currency as a measure to provide a social safety net for workers against job losses. A number of pilots are being carried out in developed countries such as Finland and Canada. India is also considering to pilot test UBI in addition to the rural employment guarantee scheme which has been running for several years. There are, thus, lessons that Indonesia can draw not only from other countries where new social transfer mechanisms are being tested, but also from its own suite of social protection programmes.
Indo
nesi
a Jo
bs O
utlo
ok 2
017
61
References
ADB : See Asian Development Bank
Asian Development Bank. (2017). Asian Development Outlook (ADO) 2017 Update: sustaining development through public-private partnership. Manila.
Anthonius, M. (2016). Digital economy of Indonesia. Ministry of Communication and Information Technology. Retrieved from http://www.cicc.or.jp/japanese/kouenkai/pdf_ppt/pastfile/h28/161026-03id.pdf.
Akst, D. (2013). Automation anxiety: where have all the jobs gone? The Wilson Quarterly, 37 (3), 60–74. Retrieved from http://www.jstor.org/stable/wilsonq.37.3.06.
Asosiasi Jasa Penyelenggara Jasa Internet Indonesia (APJII). (2016). The penetration and behavior of Indonesian internet users survey.
Arntz, M.T., Gregory, T., and Zierahn, U. (2016). The risk of automation for jobs in OECD countries: a comparative analysis. OECD Social, Employment and Migration Working Papers, No. 189, OECD Publishing, Paris. Retrieved from http://dx.doi.org/10.1787/5jlz9h56dvq7-en
Autor, D.H. (2015). Why are there still so many jobs? The history and future of workplace automation. The Journal of Economic Perspectives, 29 (3), 3 – 30. Retrieved from http://www.jstor.org/stable/43550118.
Badan Pusat Statistik. (2016) Keadaan angkatan kerja di Indonesia Agustus 2016 (Labor Force Situation in Indonesia August 2016). Survei Angkatan Kerja Nasional (Sakernas).
Bhagawati, J. (2011). Manufacturing. The Economist.Com Debate. Retrieved from http://www.columbia.edu/~jb38/papers/pdf/The_Economist_com_Debate_Manufacturing.pdf
Brynjolfsson, E., & McAfee, A. (2014). The Second Machine Age: Work, Progress, and Prosperity in a Time of Brilliant Technologies. W.W Norton.
Das, S., & Schaner, S. (2016). Female labour force participation in Asia: Indonesia case study. ADB Economics Working Paper Series No. 474. Asian Development Bank, Manila. http://digitalcommons.ilr.cornell.edu/cgi/viewcontent.cgi?article=1499&context=intl
Francesco., C., & Wilbur, J.C. (2006). “The world technology frontier. American Economic Review. 96(3), 499-522.
Frey, C. B., & Osborne, M.A. (2013). The future of employment: how susceptible are jobs to computerisation? University of Oxford.
Ha, S., Kankanhalli, A., Kishan, J. S., & Huang, K. W. (2016). Does social media marketing really work for online SMEs? Research Paper. Dublin.
Hallward-Driemeier, M., & Nayyar, G. (2017). Trouble in the making? the future of manufacturing-led development. World Bank, Washington, DC.
Indonesia Jobs Outlook 2017
62
Heckman, J.J., Lochner, L.J., & Todd, P.E. (2003). Fifty years of Mincer earnings regressions. Working Paper. Retrieved from http://athena.sas.upenn.edu/petra/papers/llmincer.pdf
Herrendorf, B., Rogerson, R., & Valentinyi, A. (2011). Growth and structural transformation. Paper prepared for the handbook of economic growth. Retrieved from https://www.imf.org/external/np/seminars/eng/2013/SPR/pdf/rrog2.pdf
International Federation of Robotics (IFR). (2017). World robotics report 2016. Retrieved from https://ifr.org/ifr-press-releases/news/world-robotics-report-2016
ILO: See International Labour Organization
International Labour Organization. (2013). Global Employment Trends for Youth 2013. A generation at risk. Geneva.
International Labour Organization. ILO. (2014). Skills mismatch in Europe, Statistics Brief. Geneva.
International Labour Organization. (2016a). ASEAN in Transformation: how technology is changing enterprises and future work.
International Labour Organization. (2016b). ASEAN in Transformation: perspectives of enterprises and students on future work. Working Paper No 11.
International Labour Organization. (2016c). World Employment and Social Outlook (WESO): Transforming jobs to end poverty. Geneva.
International Labour Organization. (2016d). Technological changes and work in the future: making technology work for all. The Future of Work Centenary Initiative. Retrieved from http://www.ilo.org/wcmsp5/groups/public/---dgreports/---dcomm/documents/publication/wcms_534201.pdf
International Labour Organization. (2017). World Employment and Social Outlook (WESO): Trends. Geneva.
IMF: See International Monetary Fund
International Monetary Fund. (2016). World Economic Outlook 2016. Retrieved from http://www.imf.org/external/pubs/ft/weo/2016/02/
Katz, L.F., & Krueger A.B., 2017. The role of unemployment in the rise in alternative work arrangements. American Economic Review. 107(5): 388–392. Retrieved from https://doi.org/10.1257/aer.p20171092
Katz, L.F., Krueger, A.B. (2016). The rise and nature of alternative work arrangements in the United States 1995-2015. National Bureau of Economic Research, Cambridge. USA. Retrieved from http://www.nber.org/papers/w22667
Kemp, S. (2017). Digital in 2017: Global overview. Retrieved from https://wearesocial.com/special-reports/digital-in-2017-global-overview.
Kementrian Perencanaan Pembangunan Nasional/Badan Perencanaan Pembangunan Nasional. (2014). Rencana pembangunan jangka menengah nasional 2015-2019.
Khatiwada, S., & Lennon, C. (2017). “Structural transformation in resource rich countries: a case of Indonesia and Nigeria. ILO Working Paper (forthcoming).
Kuhn, P.J. (2014). The internet as a labor market matchmaker. IZA World of Labor. Retrieved from https://wol.iza.org/uploads/articles/18/pdfs/internet-as-a-labor-market-matchmaker.pdf
Kuncoro, M. (2013). Indonesia’s textile and its products industry: recent development and challenges. International Journal of Business and Economic Development. 1(3), 60–74.
Indo
nesi
a Jo
bs O
utlo
ok 2
017
63
Leopold, T.A. (2016). The future of jobs employment: skills and workforce strategy for the fourth industrial revolution. World Economic Forum.
Lewis, W.A. (1954). Economic development with unlimited supplies of labor. The Manchester School. 22, 139–91. Retrieved from doi:10.1111/j.1467-9957.1954.tb00021.x.
Levy, F., & Murnane, R. (2004). The new division of labour. Massachusetts’ Benchmark. 7(1).
McKinsey & Company. (2016). Unlocking Indonesia’s Digital Opportunity.
McKinsey & Company. (2017). A future that works: automation, employment, and productivity.
Mercer, 2015. The Future of HR. Mercer, 2015. Center for Advanced Human Resources Studies, Cornell Univeristy, USA. Retrieved from https://www.mercer.com/content/dam/mercer/attachments/north-america/us/the-future-of-hr-mercer.pdf
Rodrik, D. (2015). Premature deindustralization. Economic Working Paper 107. IAS School of Social Science. Princeton, New Jersey.
Sala-i-Martín, X., & Schwab, K. (2017). The global competitiveness report 2017–2018. World Economic Forum.
Schwab, Klaus (2016). The fourth industrial revolution. World Economic Forum.
Solow, R.M. (1956). A contribution to the theory of economic growth”. Quarterly Journal of Economics. Oxford Journals. 70 (1): 65–94. Retrieved from doi:10.2307/1884513.Pdf.
Swan, T.W. (1956). Economic growth and capital accumulation. Economic Record. 32 (2): 334–361. Retrieved from doi:10.1111/j.1475-4932.1956.tb00434.x.
Szirmani, A. (2012). Industralization as an engine of growth in developing countries 1950-2005. Structural Change and Economic Dynamics. 23 (4), 406-420.
Tadjoeddin, M.Z., Auwalin, I., & Chowdhury, A. (2016). Revitalizing Indonesia’s manufacturing: the productivity conundrum. Working Papers in Trade and Development. Arndt-Corden Department of Economics, Crawford School of Public Policy, ANU College of Asia and the Pacific. Retrieved from http://www.crawford.anu.edu.au/acde/publications/
Tassey, G. (2014). Competing in advanced manufacturing: the need for improved growth models and policies. The Journal of Economic Perspectives. 28 (1), 27 – 48. Retrieved from http://www.jstor.org/stable/43193715
World Bank. (2012a). Picking up the pace: reviving growth in Indonesia’s manufacturing sector. The World Bank Office, Jakarta, Indonesia.
World Bank. (2012b). How the macroeconomic environment and investment climate have affected the manufacturing sector. Jakarta, Indonesia.
World Bank. (2016). Digital dividends. World Development Report. 2016. Washington DC, USA.
World Bank. (2017). Global economic prospects, East Asia and the Pacific.

Indonesia Jobs Outlook 2017
64
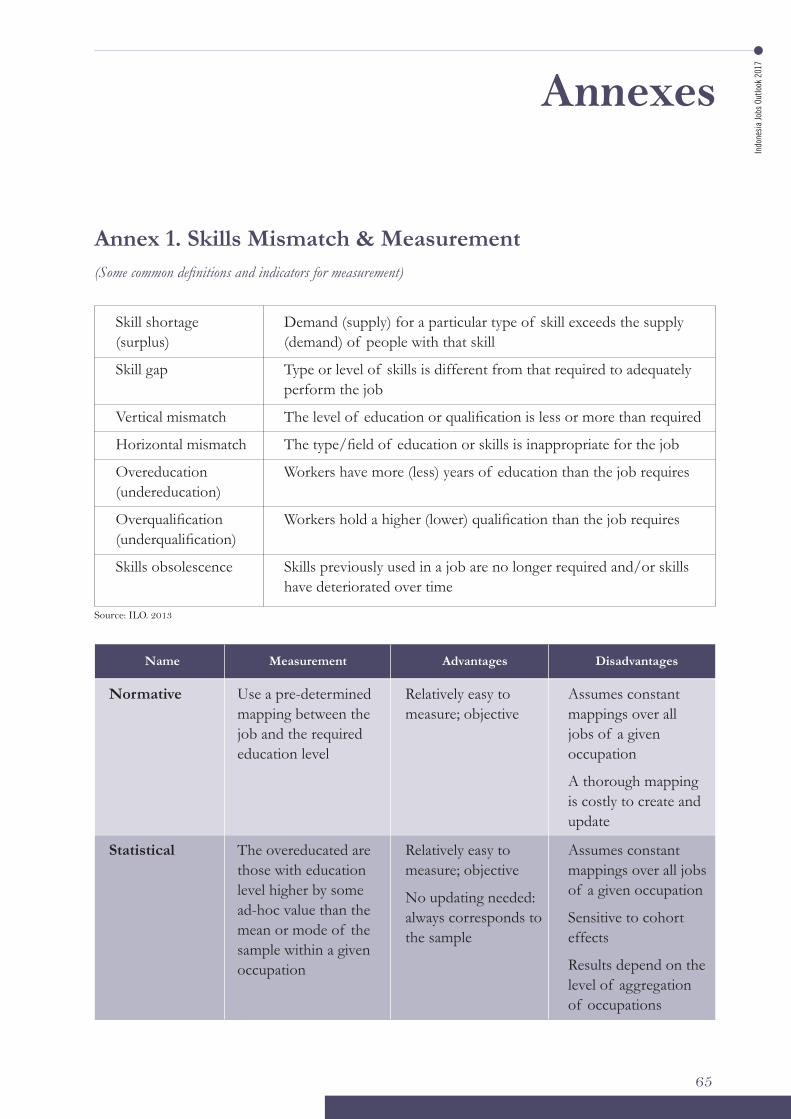
Indo
nesi
a Jo
bs O
utlo
ok 2
017
65
Annexes
Annex 1. Skills Mismatch & Measurement (Some common definitions and indicators for measurement)
Skill shortage (surplus)
Skill gap
Vertical mismatch
Horizontal mismatch
Overeducation (undereducation)
Overqualification (underqualification)
Skills obsolescence
Demand (supply) for a particular type of skill exceeds the supply (demand) of people with that skill
Type or level of skills is different from that required to adequately perform the job
The level of education or qualification is less or more than required
The type/field of education or skills is inappropriate for the job
Workers have more (less) years of education than the job requires
Workers hold a higher (lower) qualification than the job requires
Skills previously used in a job are no longer required and/or skills have deteriorated over time
Source: ILO. 2013
Normative
Statistical
Use a pre-determined mapping between the job and the required education level
The overeducated are those with education level higher by some ad-hoc value than the mean or mode of the sample within a given occupation
Relatively easy to measure; objective
Relatively easy to measure; objective
No updating needed: always corresponds to the sample
Assumes constant mappings over all jobs of a given occupation
A thorough mapping is costly to create and update
Assumes constant mappings over all jobs of a given occupation
Sensitive to cohort effects
Results depend on the level of aggregation of occupations
Name Measurement Advantages Disadvantages
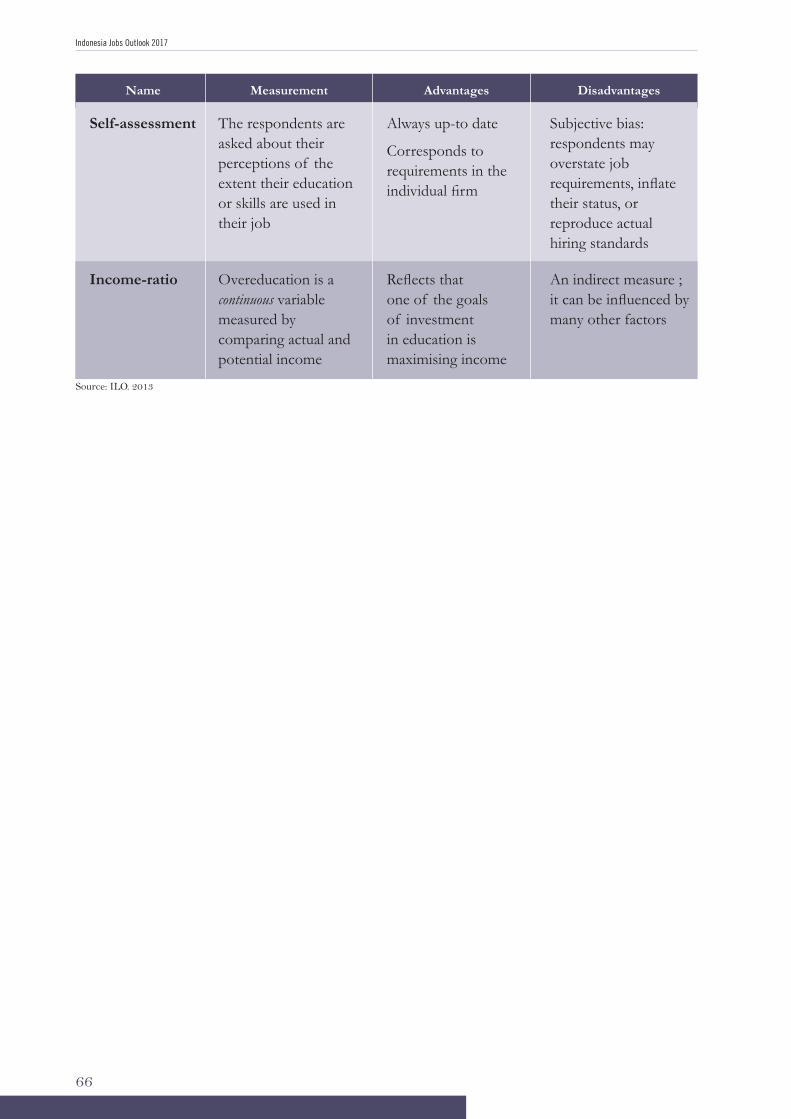
Indonesia Jobs Outlook 2017
66
Self-assessment
Income-ratio
The respondents are asked about their perceptions of the extent their education or skills are used in their job
Overeducation is a continuous variable measured by comparing actual and potential income
Always up-to date
Corresponds to requirements in the individual firm
Reflects that one of the goals of investment in education is maximising income
Subjective bias: respondents may overstate job requirements, inflate their status, or reproduce actual hiring standards
An indirect measure ; it can be influenced by many other factors
Name Measurement Advantages Disadvantages
Source: ILO. 2013
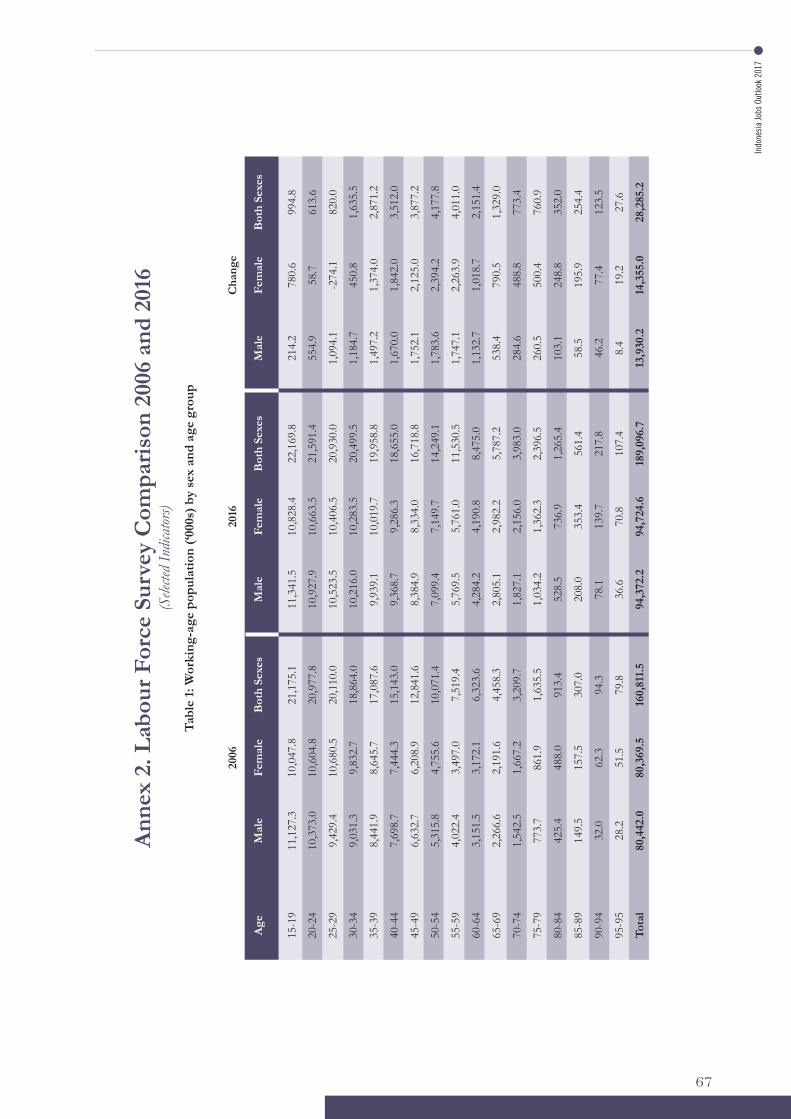
Indo
nesi
a Jo
bs O
utlo
ok 2
017
67
Ann
ex 2
. Lab
our F
orce
Sur
vey
Com
paris
on 2
006
and
2016
(S
electe
d In
dicat
ors)
Tabl
e 1:
Wor
king
-age
pop
ulat
ion
(‘000
s) b
y se
x an
d ag
e gr
oup
Age
M
ale
Mal
eM
ale
Bot
h Se
xes
2006
2016
Cha
nge
Bot
h Se
xes
Bot
h Se
xes
Fem
ale
Fem
ale
Fem
ale
15-1
9
20-2
4
25-2
9
30-3
4
35-3
9
40-4
4
45-4
9
50-5
4
55-5
9
60-6
4
65-6
9
70-7
4
75-7
9
80-8
4
85-8
9
90-9
4
95-9
5
Tota
l
11,1
27.3
10,3
73.0
9,42
9.4
9,03
1.3
8,44
1.9
7,69
8.7
6,63
2.7
5,31
5.8
4,02
2.4
3,15
1.5
2,26
6.6
1,54
2.5
773.
7
425.
4
149.
5
32.0
28.2
80,4
42.0
11,3
41.5
10,9
27.9
10,5
23.5
10,2
16.0
9,93
9.1
9,36
8.7
8,38
4.9
7,09
9.4
5,76
9.5
4,28
4.2
2,80
5.1
1,82
7.1
1,03
4.2
528.
5
208.
0
78.1
36.6
94,3
72.2
214.
2
554.
9
1,09
4.1
1,18
4.7
1,49
7.2
1,67
0.0
1,75
2.1
1,78
3.6
1,74
7.1
1,13
2.7
538.
4
284.
6
260.
5
103.
1
58.5
46.2
8.4
13,9
30.2
21,1
75.1
20,9
77.8
20,1
10.0
18,8
64.0
17,0
87.6
15,1
43.0
12,8
41.6
10,0
71.4
7,51
9.4
6,32
3.6
4,45
8.3
3,20
9.7
1,63
5.5
913.
4
307.
0
94.3
79.8
160,
811.
5
22,1
69.8
21,5
91.4
20,9
30.0
20,4
99.5
19,9
58.8
18,6
55.0
16,7
18.8
14,2
49.1
11,5
30.5
8,47
5.0
5,78
7.2
3,98
3.0
2,39
6.5
1,26
5.4
561.
4
217.
8
107.
4
189,
096.
7
994.
8
613.
6
820.
0
1,63
5.5
2,87
1.2
3,51
2.0
3,87
7.2
4,17
7.8
4,01
1.0
2,15
1.4
1,32
9.0
773.
4
760.
9
352.
0
254.
4
123.
5
27.6
28,2
85.2
10,0
47.8
10,6
04.8
10,6
80.5
9,83
2.7
8,64
5.7
7,44
4.3
6,20
8.9
4,75
5.6
3,49
7.0
3,17
2.1
2,19
1.6
1,66
7.2
861.
9
488.
0
157.
5
62.3
51.5
80,3
69.5
10,8
28.4
10,6
63.5
10,4
06.5
10,2
83.5
10,0
19.7
9,28
6.3
8,33
4.0
7,14
9.7
5,76
1.0
4,19
0.8
2,98
2.2
2,15
6.0
1,36
2.3
736.
9
353.
4
139.
7
70.8
94,7
24.6
780.
6
58.7
-274
.1
450.
8
1,37
4.0
1,84
2.0
2,12
5.0
2,39
4.2
2,26
3.9
1,01
8.7
790.
5
488.
8
500.
4
248.
8
195.
9
77.4
19.2
14,3
55.0
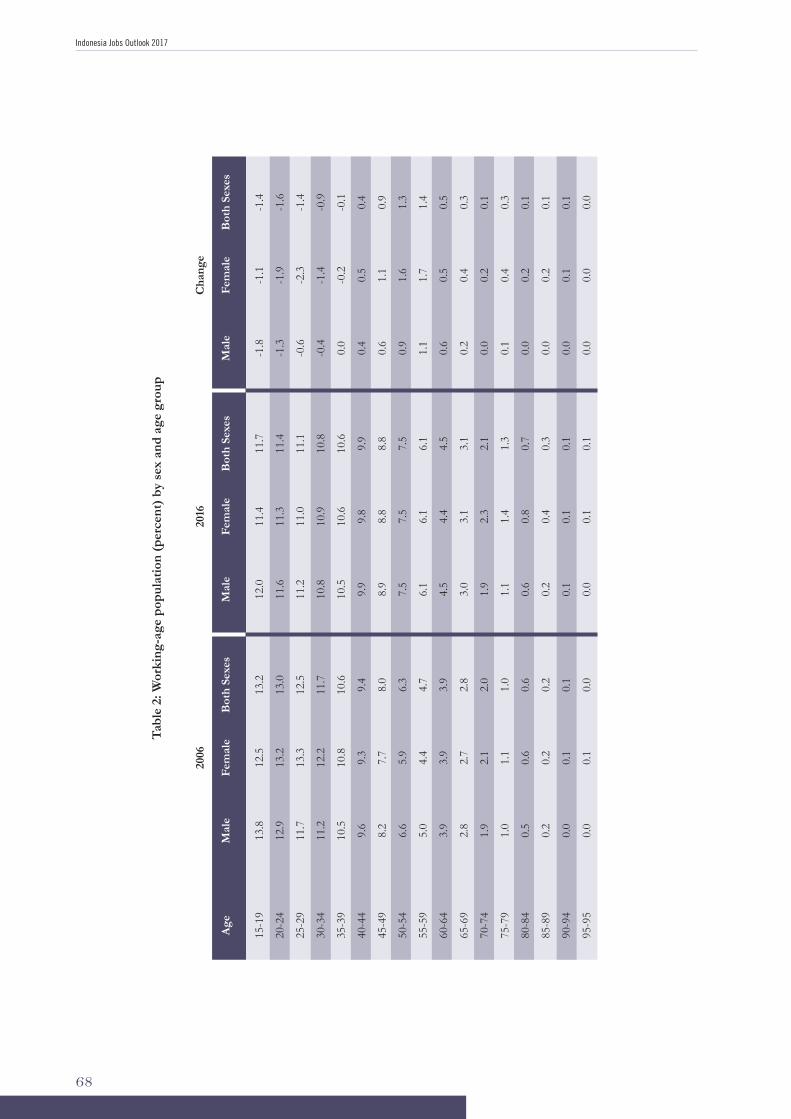
Indonesia Jobs Outlook 2017
68
Tabl
e 2:
Wor
king
-age
pop
ulat
ion
(per
cent
) by
sex
and
age
grou
p
Age
M
ale
Mal
eM
ale
Bot
h Se
xes
2006
2016
Cha
nge
Bot
h Se
xes
Bot
h Se
xes
Fem
ale
Fem
ale
Fem
ale
15-1
9
20-2
4
25-2
9
30-3
4
35-3
9
40-4
4
45-4
9
50-5
4
55-5
9
60-6
4
65-6
9
70-7
4
75-7
9
80-8
4
85-8
9
90-9
4
95-9
5
13.8
12.9
11.7
11.2
10.5
9.6
8.2
6.6
5.0
3.9
2.8
1.9
1.0
0.5
0.2
0.0
0.0
12.0
11.6
11.2
10.8
10.5
9.9
8.9
7.5
6.1
4.5
3.0
1.9
1.1
0.6
0.2
0.1
0.0
-1.8
-1.3
-0.6
-0.4 0.0
0.4
0.6
0.9
1.1
0.6
0.2
0.0
0.1
0.0
0.0
0.0
0.0
13.2
13.0
12.5
11.7
10.6
9.4
8.0
6.3
4.7
3.9
2.8
2.0
1.0
0.6
0.2
0.1
0.0
11.7
11.4
11.1
10.8
10.6
9.9
8.8
7.5
6.1
4.5
3.1
2.1
1.3
0.7
0.3
0.1
0.1
-1.4
-1.6
-1.4
-0.9
-0.1 0.4
0.9
1.3
1.4
0.5
0.3
0.1
0.3
0.1
0.1
0.1
0.0
12.5
13.2
13.3
12.2
10.8
9.3
7.7
5.9
4.4
3.9
2.7
2.1
1.1
0.6
0.2
0.1
0.1
11.4
11.3
11.0
10.9
10.6
9.8
8.8
7.5
6.1
4.4
3.1
2.3
1.4
0.8
0.4
0.1
0.1
-1.1
-1.9
-2.3
-1.4
-0.2 0.5
1.1
1.6
1.7
0.5
0.4
0.2
0.4
0.2
0.2
0.1
0.0
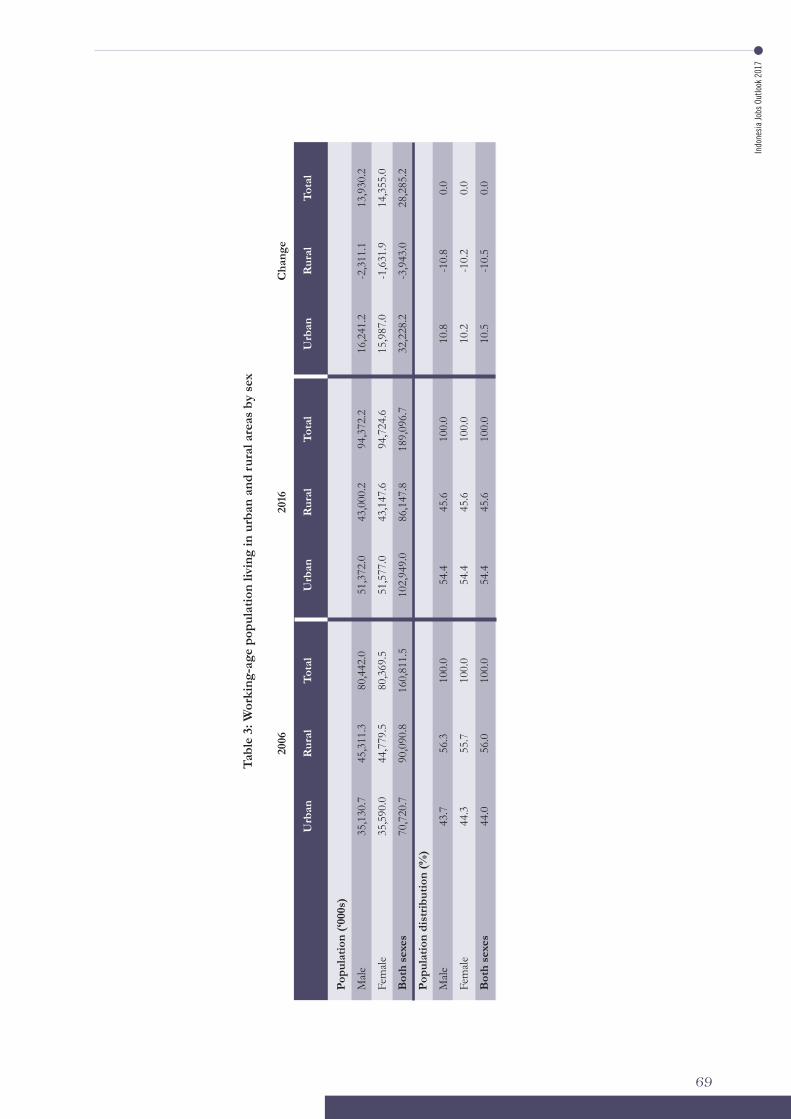
Indo
nesi
a Jo
bs O
utlo
ok 2
017
69
Tabl
e 3:
Wor
king
-age
pop
ulat
ion
livin
g in
urb
an a
nd ru
ral a
reas
by
sex
U
rban
Urb
anU
rban
Tota
l
2006
2016
Cha
nge
Tota
lTo
tal
Rur
alR
ural
Rur
al
Popu
latio
n (‘0
00s)
Mal
e
Fem
ale
Bot
h se
xes
Popu
latio
n di
strib
utio
n (%
)
Mal
e
Fem
ale
Bot
h se
xes
35,1
30.7
35,5
90.0
70,7
20.7
43.7
44.3
44.0
51,3
72.0
51,5
77.0
102,
949.
0
54.4
54.4
54.4
16,2
41.2
15,9
87.0
32,2
28.2
10.8
10.2
10.5
80,4
42.0
80,3
69.5
160,
811.
5
100.
0
100.
0
100.
0
94,3
72.2
94,7
24.6
189,
096.
7
100.
0
100.
0
100.
0
13,9
30.2
14,3
55.0
28,2
85.2
0.0
0.0
0.0
45,3
11.3
44,7
79.5
90,0
90.8
56.3
55.7
56.0
43,0
00.2
43,1
47.6
86,1
47.8
45.6
45.6
45.6
-2,3
11.1
-1,6
31.9
-3,9
43.0
-10.
8
-10.
2
-10.
5
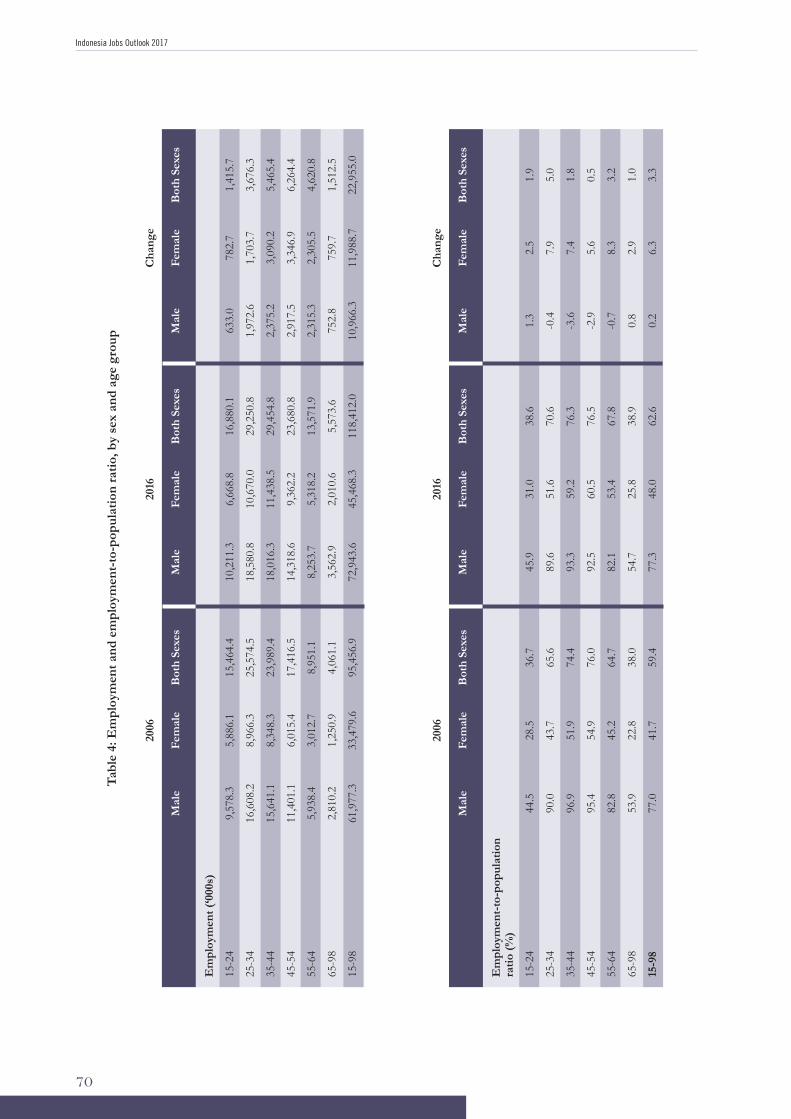
Indonesia Jobs Outlook 2017
70
M
ale
Mal
eM
ale
Bot
h Se
xes
2006
2016
Cha
nge
Bot
h Se
xes
Bot
h Se
xes
Fem
ale
Fem
ale
Fem
ale
Em
ploy
men
t-to
-pop
ulat
ion
ratio
(%)
15-2
4
25-3
4
35-4
4
45-5
4
55-6
4
65-9
8
15-9
8
44.5
90.0
96.9
95.4
82.8
53.9
77.0
45.9
89.6
93.3
92.5
82.1
54.7
77.3
1.3
-0.4
-3.6
-2.9
-0.7 0.8
0.2
36.7
65.6
74.4
76.0
64.7
38.0
59.4
38.6
70.6
76.3
76.5
67.8
38.9
62.6
1.9
5.0
1.8
0.5
3.2
1.0
3.3
28.5
43.7
51.9
54.9
45.2
22.8
41.7
31.0
51.6
59.2
60.5
53.4
25.8
48.0
2.5
7.9
7.4
5.6
8.3
2.9
6.3
Tabl
e 4:
Em
ploy
men
t and
em
ploy
men
t-to
-pop
ulat
ion
ratio
, by
sex
and
age
grou
p
M
ale
Mal
eM
ale
Bot
h Se
xes
2006
2016
Cha
nge
Bot
h Se
xes
Bot
h Se
xes
Fem
ale
Fem
ale
Fem
ale
Em
ploy
men
t (‘0
00s)
15-2
4
25-3
4
35-4
4
45-5
4
55-6
4
65-9
8
15-9
8
9,57
8.3
16,6
08.2
15,6
41.1
11,4
01.1
5,93
8.4
2,81
0.2
61,9
77.3
10,2
11.3
18,5
80.8
18,0
16.3
14,3
18.6
8,25
3.7
3,56
2.9
72,9
43.6
633.
0
1,97
2.6
2,37
5.2
2,91
7.5
2,31
5.3
752.
8
10,9
66.3
15,4
64.4
25,5
74.5
23,9
89.4
17,4
16.5
8,95
1.1
4,06
1.1
95,4
56.9
16,8
80.1
29,2
50.8
29,4
54.8
23,6
80.8
13,5
71.9
5,57
3.6
118,
412.
0
1,41
5.7
3,67
6.3
5,46
5.4
6,26
4.4
4,62
0.8
1,51
2.5
22,9
55.0
5,88
6.1
8,96
6.3
8,34
8.3
6,01
5.4
3,01
2.7
1,25
0.9
33,4
79.6
6,66
8.8
10,6
70.0
11,4
38.5
9,36
2.2
5,31
8.2
2,01
0.6
45,4
68.3
782.
7
1,70
3.7
3,09
0.2
3,34
6.9
2,30
5.5
759.
7
11,9
88.7
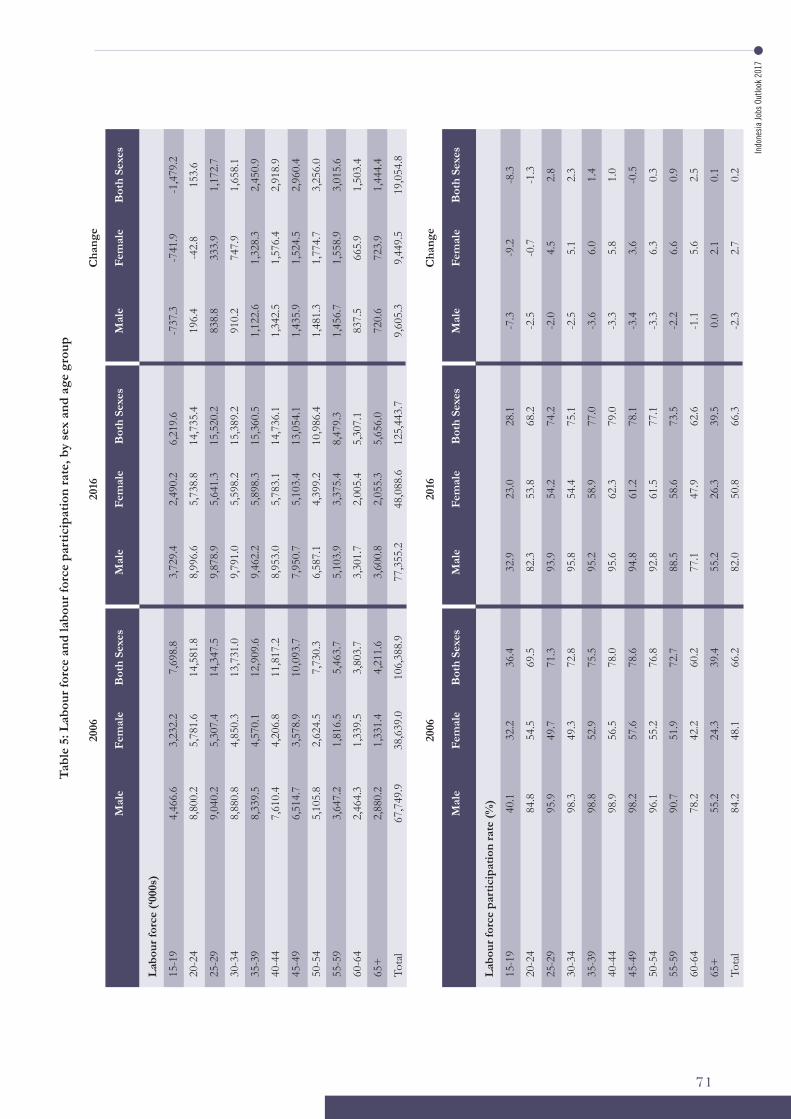
Indo
nesi
a Jo
bs O
utlo
ok 2
017
71
Tabl
e 5:
Lab
our f
orce
and
labo
ur fo
rce
part
icip
atio
n ra
te, b
y se
x an
d ag
e gr
oup
M
ale
Mal
eM
ale
Bot
h Se
xes
2006
2016
Cha
nge
Bot
h Se
xes
Bot
h Se
xes
Fem
ale
Fem
ale
Fem
ale
Labo
ur fo
rce
(‘000
s)
15-1
9
20-2
4
25-2
9
30-3
4
35-3
9
40-4
4
45-4
9
50-5
4
55-5
9
60-6
4
65+
Tota
l
4,46
6.6
8,80
0.2
9,04
0.2
8,88
0.8
8,33
9.5
7,61
0.4
6,51
4.7
5,10
5.8
3,64
7.2
2,46
4.3
2,88
0.2
67,7
49.9
3,72
9.4
8,99
6.6
9,87
8.9
9,79
1.0
9,46
2.2
8,95
3.0
7,95
0.7
6,58
7.1
5,10
3.9
3,30
1.7
3,60
0.8
77,3
55.2
-737
.3
196.
4
838.
8
910.
2
1,12
2.6
1,34
2.5
1,43
5.9
1,48
1.3
1,45
6.7
837.
5
720.
6
9,60
5.3
7,69
8.8
14,5
81.8
14,3
47.5
13,7
31.0
12,9
09.6
11,8
17.2
10,0
93.7
7,73
0.3
5,46
3.7
3,80
3.7
4,21
1.6
106,
388.
9
6,21
9.6
14,7
35.4
15,5
20.2
15,3
89.2
15,3
60.5
14,7
36.1
13,0
54.1
10,9
86.4
8,47
9.3
5,30
7.1
5,65
6.0
125,
443.
7
-1,4
79.2
153.
6
1,17
2.7
1,65
8.1
2,45
0.9
2,91
8.9
2,96
0.4
3,25
6.0
3,01
5.6
1,50
3.4
1,44
4.4
19,0
54.8
3,23
2.2
5,78
1.6
5,30
7.4
4,85
0.3
4,57
0.1
4,20
6.8
3,57
8.9
2,62
4.5
1,81
6.5
1,33
9.5
1,33
1.4
38,6
39.0
2,49
0.2
5,73
8.8
5,64
1.3
5,59
8.2
5,89
8.3
5,78
3.1
5,10
3.4
4,39
9.2
3,37
5.4
2,00
5.4
2,05
5.3
48,0
88.6
-741
.9
-42.
8
333.
9
747.
9
1,32
8.3
1,57
6.4
1,52
4.5
1,77
4.7
1,55
8.9
665.
9
723.
9
9,44
9.5
M
ale
Mal
eM
ale
Bot
h Se
xes
2006
2016
Cha
nge
Bot
h Se
xes
Bot
h Se
xes
Fem
ale
Fem
ale
Fem
ale
Labo
ur fo
rce
part
icip
atio
n ra
te (%
)
15-1
9
20-2
4
25-2
9
30-3
4
35-3
9
40-4
4
45-4
9
50-5
4
55-5
9
60-6
4
65+
Tota
l
40.1
84.8
95.9
98.3
98.8
98.9
98.2
96.1
90.7
78.2
55.2
84.2
32.9
82.3
93.9
95.8
95.2
95.6
94.8
92.8
88.5
77.1
55.2
82.0
-7.3
-2.5
-2.0
-2.5
-3.6
-3.3
-3.4
-3.3
-2.2
-1.1 0.0
-2.3
36.4
69.5
71.3
72.8
75.5
78.0
78.6
76.8
72.7
60.2
39.4
66.2
28.1
68.2
74.2
75.1
77.0
79.0
78.1
77.1
73.5
62.6
39.5
66.3
-8.3
-1.3 2.8
2.3
1.4
1.0
-0.5 0.3
0.9
2.5
0.1
0.2
32.2
54.5
49.7
49.3
52.9
56.5
57.6
55.2
51.9
42.2
24.3
48.1
23.0
53.8
54.2
54.4
58.9
62.3
61.2
61.5
58.6
47.9
26.3
50.8
-9.2
-0.7 4.5
5.1
6.0
5.8
3.6
6.3
6.6
5.6
2.1
2.7
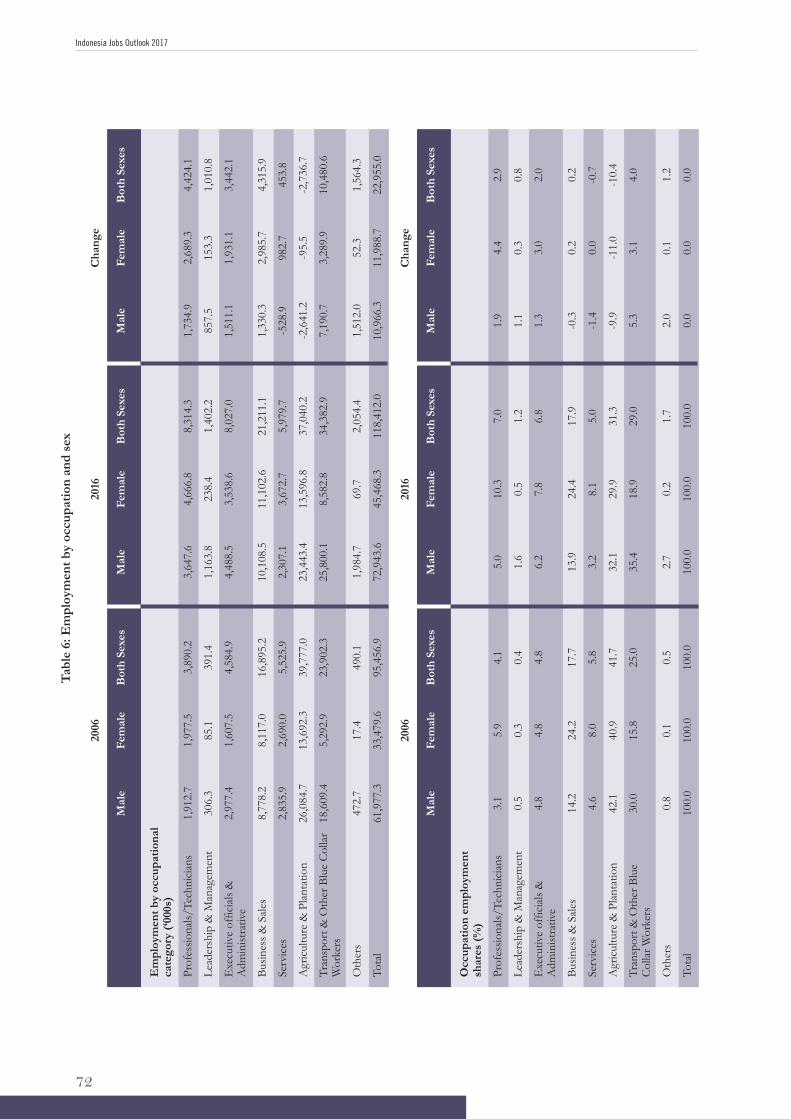
Indonesia Jobs Outlook 2017
72
Tabl
e 6:
Em
ploy
men
t by
occu
patio
n an
d se
x
M
ale
Mal
eM
ale
Bot
h Se
xes
2006
2016
Cha
nge
Bot
h Se
xes
Bot
h Se
xes
Fem
ale
Fem
ale
Fem
ale
Em
ploy
men
t by
occu
patio
nal
cate
gory
(‘00
0s)
Prof
essio
nals/
Tech
nici
ans
Lead
ersh
ip &
Man
agem
ent
Exe
cutiv
e of
ficia
ls &
A
dmin
istra
tive
Busin
ess &
Sal
es
Serv
ices
Agr
icul
ture
& P
lant
atio
n
Tran
spor
t & O
ther
Blu
e C
olla
r W
orke
rs
Oth
ers
Tota
l
1,91
2.7
306.
3
2,97
7.4
8,77
8.2
2,83
5.9
26,0
84.7
18,6
09.4
472.
7
61,9
77.3
3,64
7.6
1,16
3.8
4,48
8.5
10,1
08.5
2,30
7.1
23,4
43.4
25,8
00.1
1,98
4.7
72,9
43.6
1,73
4.9
857.
5
1,51
1.1
1,33
0.3
-528
.9
-2,6
41.2
7,19
0.7
1,51
2.0
10,9
66.3
3,89
0.2
391.
4
4,58
4.9
16,8
95.2
5,52
5.9
39,7
77.0
23,9
02.3
490.
1
95,4
56.9
8,31
4.3
1,40
2.2
8,02
7.0
21,2
11.1
5,97
9.7
37,0
40.2
34,3
82.9
2,05
4.4
118,
412.
0
4,42
4.1
1,01
0.8
3,44
2.1
4,31
5.9
453.
8
-2,7
36.7
10,4
80.6
1,56
4.3
22,9
55.0
1,97
7.5
85.1
1,60
7.5
8,11
7.0
2,69
0.0
13,6
92.3
5,29
2.9
17.4
33,4
79.6
4,66
6.8
238.
4
3,53
8.6
11,1
02.6
3,67
2.7
13,5
96.8
8,58
2.8
69.7
45,4
68.3
2,68
9.3
153.
3
1,93
1.1
2,98
5.7
982.
7
-95.
5
3,28
9.9
52.3
11,9
88.7
M
ale
Mal
eM
ale
Bot
h Se
xes
2006
2016
Cha
nge
Bot
h Se
xes
Bot
h Se
xes
Fem
ale
Fem
ale
Fem
ale
Occ
upat
ion
empl
oym
ent
shar
es (%
)
Prof
essio
nals/
Tech
nici
ans
Lead
ersh
ip &
Man
agem
ent
Exe
cutiv
e of
ficia
ls &
A
dmin
istra
tive
Busin
ess &
Sal
es
Serv
ices
Agr
icul
ture
& P
lant
atio
n
Tran
spor
t & O
ther
Blu
e C
olla
r Wor
kers
Oth
ers
Tota
l
3.1
0.5
4.8
14.2
4.6
42.1
30.0
0.8
100.
0
5.0
1.6
6.2
13.9
3.2
32.1
35.4
2.7
100.
0
1.9
1.1
1.3
-0.3
-1.4
-9.9 5.3
2.0
0.0
4.1
0.4
4.8
17.7
5.8
41.7
25.0 0.5
100.
0
7.0
1.2
6.8
17.9
5.0
31.3
29.0
1.7
100.
0
2.9
0.8
2.0
0.2
-0.7
-10.
4
4.0
1.2
0.0
5.9
0.3
4.8
24.2
8.0
40.9
15.8
0.1
100.
0
10.3
0.5
7.8
24.4
8.1
29.9
18.9
0.2
100.
0
4.4
0.3
3.0
0.2
0.0
-11.
0
3.1
0.1
0.0
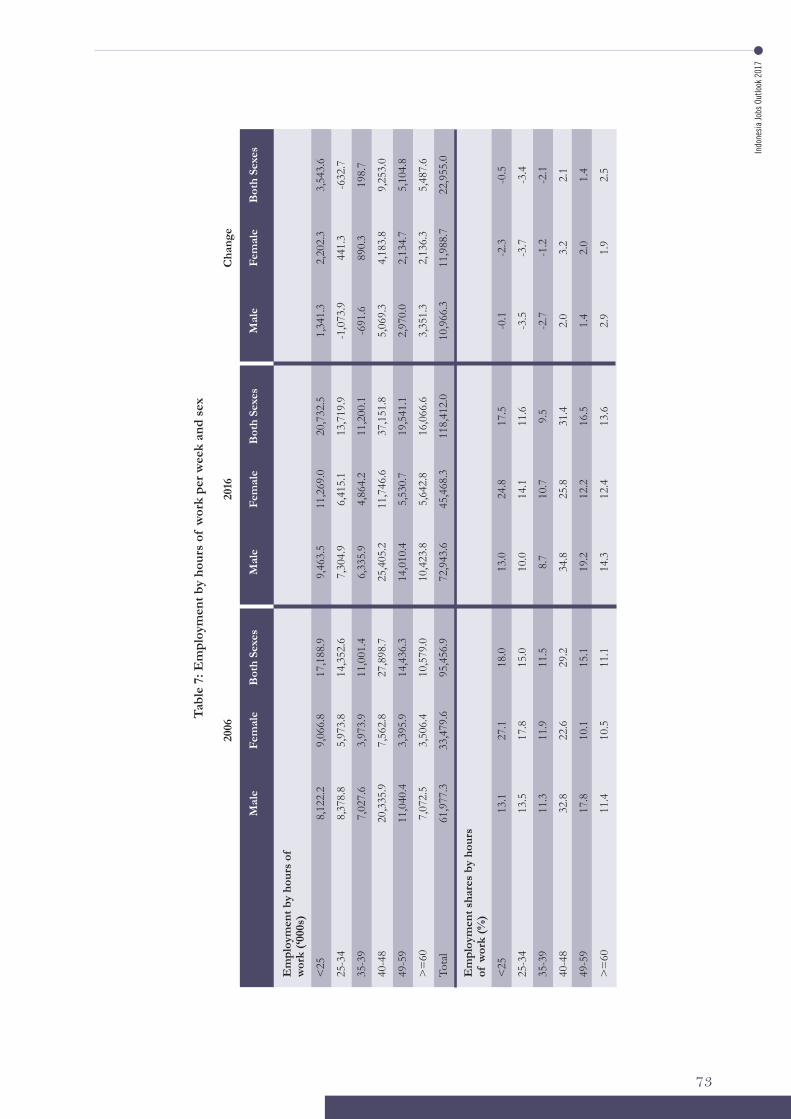
Indo
nesi
a Jo
bs O
utlo
ok 2
017
73
Tabl
e 7:
Em
ploy
men
t by
hour
s of
wor
k pe
r wee
k an
d se
x
M
ale
Mal
eM
ale
Bot
h Se
xes
2006
2016
Cha
nge
Bot
h Se
xes
Bot
h Se
xes
Fem
ale
Fem
ale
Fem
ale
Em
ploy
men
t by
hour
s of
w
ork
(‘000
s)
<25
25-3
4
35-3
9
40-4
8
49-5
9
>=
60
Tota
l
Em
ploy
men
t sha
res
by h
ours
of
wor
k (%
)
<25
25-3
4
35-3
9
40-4
8
49-5
9
>=
60
8,
122.
2
8,37
8.8
7,02
7.6
20,3
35.9
11,0
40.4
7,07
2.5
61,9
77.3
13.1
13.5
11.3
32.8
17.8
11.4
9,46
3.5
7,30
4.9
6,33
5.9
25,4
05.2
14,0
10.4
10,4
23.8
72,9
43.6
13.0
10.0
8.7
34.8
19.2
14.3
1,34
1.3
-1,0
73.9
-691
.6
5,06
9.3
2,97
0.0
3,35
1.3
10,9
66.3
-0.1
-3.5
-2.7 2.0
1.4
2.9
17,1
88.9
14,3
52.6
11,0
01.4
27,8
98.7
14,4
36.3
10,5
79.0
95,4
56.9
18.0
15.0
11.5
29.2
15.1
11.1
20,7
32.5
13,7
19.9
11,2
00.1
37,1
51.8
19,5
41.1
16,0
66.6
118,
412.
0
17.5
11.6
9.5
31.4
16.5
13.6
3,54
3.6
-632
.7
198.
7
9,25
3.0
5,10
4.8
5,48
7.6
22,9
55.0
-0.5
-3.4
-2.1 2.1
1.4
2.5
9,
066.
8
5,97
3.8
3,97
3.9
7,56
2.8
3,39
5.9
3,50
6.4
33,4
79.6
27.1
17.8
11.9
22.6
10.1
10.5
11,2
69.0
6,41
5.1
4,86
4.2
11,7
46.6
5,53
0.7
5,64
2.8
45,4
68.3
24.8
14.1
10.7
25.8
12.2
12.4
2,20
2.3
441.
3
890.
3
4,18
3.8
2,13
4.7
2,13
6.3
11,9
88.7
-2.3
-3.7
-1.2 3.2
2.0
1.9
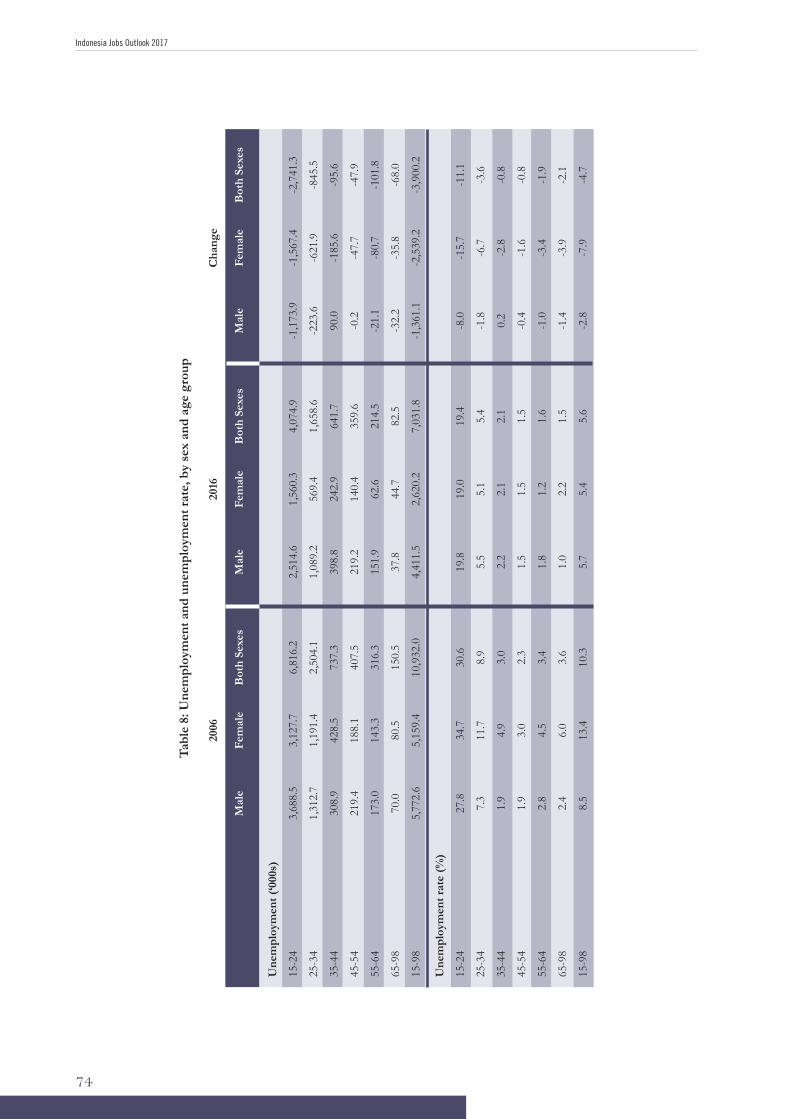
Indonesia Jobs Outlook 2017
74
Tabl
e 8:
Une
mpl
oym
ent a
nd u
nem
ploy
men
t rat
e, b
y se
x an
d ag
e gr
oup
M
ale
Mal
eM
ale
Bot
h Se
xes
2006
2016
Cha
nge
Bot
h Se
xes
Bot
h Se
xes
Fem
ale
Fem
ale
Fem
ale
Une
mpl
oym
ent (
‘000
s)
15-2
4
25-3
4
35-4
4
45-5
4
55-6
4
65-9
8
15-9
8
Une
mpl
oym
ent r
ate
(%)
15-2
4
25-3
4
35-4
4
45-5
4
55-6
4
65-9
8
15-9
8
3,68
8.5
1,31
2.7
308.
9
219.
4
173.
0
70.0
5,77
2.6
27.8
7.3
1.9
1.9
2.8
2.4
8.5
2,51
4.6
1,08
9.2
398.
8
219.
2
151.
9
37.8
4,41
1.5
19.8
5.5
2.2
1.5
1.8
1.0
5.7
-1,1
73.9
-223
.6
90.0
-0.2
-21.
1
-32.
2
-1,3
61.1
-8.0
-1.8 0.2
-0.4
-1.0
-1.4
-2.8
6,81
6.2
2,50
4.1
737.
3
407.
5
316.
3
150.
5
10,9
32.0
30.6
8.9
3.0
2.3
3.4
3.6
10.3
4,07
4.9
1,65
8.6
641.
7
359.
6
214.
5
82.5
7,03
1.8
19.4
5.4
2.1
1.5
1.6
1.5
5.6
-2,7
41.3
-845
.5
-95.
6
-47.
9
-101
.8
-68.
0
-3,9
00.2
-11.
1
-3.6
-0.8
-0.8
-1.9
-2.1
-4.7
3,12
7.7
1,19
1.4
428.
5
188.
1
143.
3
80.5
5,15
9.4
34.7
11.7
4.9
3.0
4.5
6.0
13.4
1,56
0.3
569.
4
242.
9
140.
4
62.6
44.7
2,62
0.2
19.0
5.1
2.1
1.5
1.2
2.2
5.4
-1,5
67.4
-621
.9
-185
.6
-47.
7
-80.
7
-35.
8
-2,5
39.2
-15.
7
-6.7
-2.8
-1.6
-3.4
-3.9
-7.9
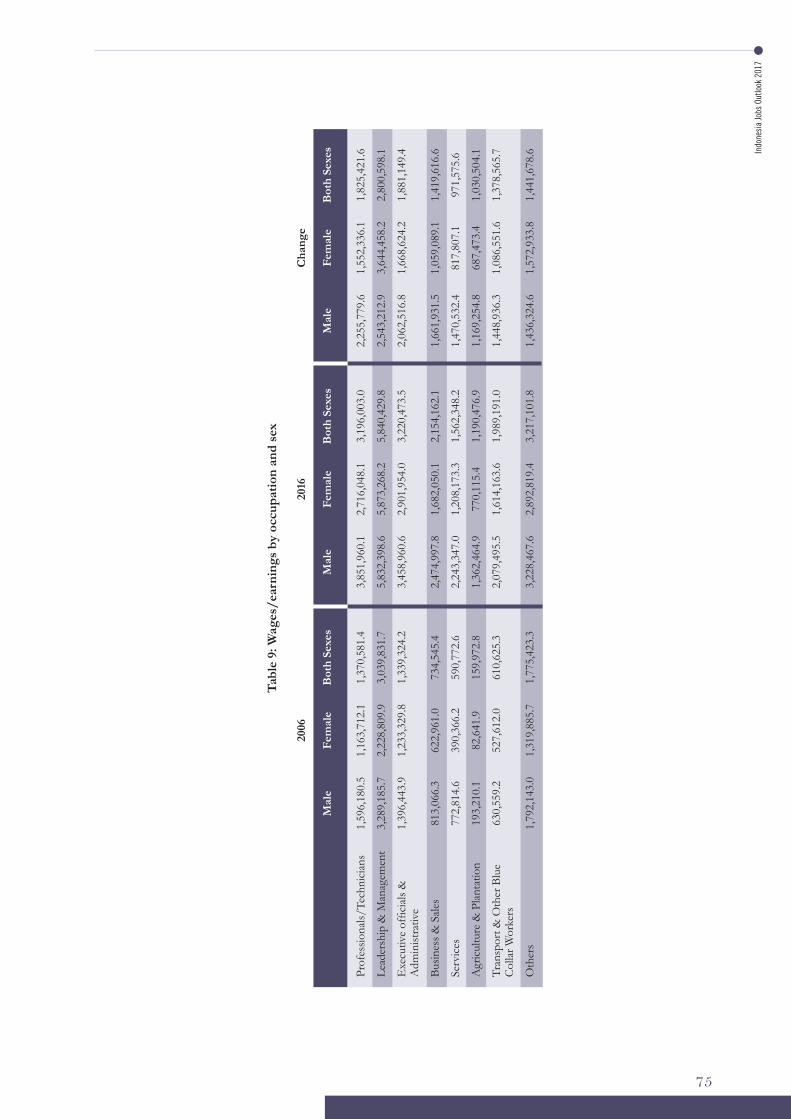
Indo
nesi
a Jo
bs O
utlo
ok 2
017
75
Tabl
e 9:
Wag
es/e
arni
ngs
by o
ccup
atio
n an
d se
x
M
ale
Mal
eM
ale
Bot
h Se
xes
2006
2016
Cha
nge
Bot
h Se
xes
Bot
h Se
xes
Fem
ale
Fem
ale
Fem
ale
Prof
essio
nals/
Tech
nici
ans
Lead
ersh
ip &
Man
agem
ent
Exe
cutiv
e of
ficia
ls &
A
dmin
istra
tive
Busin
ess &
Sal
es
Serv
ices
Agr
icul
ture
& P
lant
atio
n
Tran
spor
t & O
ther
Blu
e C
olla
r Wor
kers
Oth
ers
1,59
6,18
0.5
3,28
9,18
5.7
1,39
6,44
3.9
813,
066.
3
772,
814.
6
193,
210.
1
630,
559.
2
1,79
2,14
3.0
3,85
1,96
0.1
5,83
2,39
8.6
3,45
8,96
0.6
2,47
4,99
7.8
2,24
3,34
7.0
1,36
2,46
4.9
2,07
9,49
5.5
3,22
8,46
7.6
2,25
5,77
9.6
2,54
3,21
2.9
2,06
2,51
6.8
1,66
1,93
1.5
1,47
0,53
2.4
1,16
9,25
4.8
1,44
8,93
6.3
1,43
6,32
4.6
1,37
0,58
1.4
3,03
9,83
1.7
1,33
9,32
4.2
734,
545.
4
590,
772.
6
159,
972.
8
610,
625.
3
1,77
5,42
3.3
3,19
6,00
3.0
5,84
0,42
9.8
3,22
0,47
3.5
2,15
4,16
2.1
1,56
2,34
8.2
1,19
0,47
6.9
1,98
9,19
1.0
3,21
7,10
1.8
1,82
5,42
1.6
2,80
0,59
8.1
1,88
1,14
9.4
1,41
9,61
6.6
971,
575.
6
1,03
0,50
4.1
1,37
8,56
5.7
1,44
1,67
8.6
1,16
3,71
2.1
2,22
8,80
9.9
1,23
3,32
9.8
622,
961.
0
390,
366.
2
82,6
41.9
527,
612.
0
1,31
9,88
5.7
2,71
6,04
8.1
5,87
3,26
8.2
2,90
1,95
4.0
1,68
2,05
0.1
1,20
8,17
3.3
770,
115.
4
1,61
4,16
3.6
2,89
2,81
9.4
1,55
2,33
6.1
3,64
4,45
8.2
1,66
8,62
4.2
1,05
9,08
9.1
817,
807.
1
687,
473.
4
1,08
6,55
1.6
1,57
2,93
3.8