individuals with disabilities education act, 2016 · individuals with disabilities education act,...
TRANSCRIPT

U.S. Department of Education
38th Annual Report to Congress on the Implementation of the
Individuals with Disabilities Education Act, 2016

Discrimination Prohibited
Sec. 504(a) of the Rehabilitation Act of 1973 states that “No otherwise qualified individual with a disability in the United States, as defined in section 7(20), shall, solely by reason of her or his disability, be excluded from the participation in, be denied the benefits of, or be subjected to discrimination under any program or activity receiving Federal financial assistance or under any program or activity conducted by any Executive agency or by the United States Postal Service.” Sec. 601 of the Civil Rights Act of 1964 states that “No person in the United States shall, on the ground of race, color, or national origin, be excluded from participation in, be denied the benefits of, or be subjected to discrimination under any program or activity receiving Federal financial assistance.”

38th Annual Report to Congress on the Implementation of the
Individuals with Disabilities Education Act, 2016
Individuals with Disabilities Education Act: to ensure the free appropriate public education
of all children with disabilities
Office of Special Education and Rehabilitative Services U.S. Department of Education

This report was produced under U.S. Department of Education Contract No. ED-OSE-12-C-0031 with New Editions Consulting, Inc. Richelle Davis served as the contracting officer’s representative. The views expressed herein do not necessarily represent the positions or policies of the Department of Education. No official endorsement by the U.S. Department of Education of any product, commodity, service, or enterprise mentioned in this publication is intended or should be inferred. For the reader’s convenience, this publication contains information about and from outside organizations, including hyperlinks and URLs. Inclusion of such information does not constitute an endorsement by the Department. U.S. Department of Education John B. King, Jr. Secretary Office of Special Education and Rehabilitative Services (OSERS) Sue Swenson Acting Assistant Secretary Office of Special Education Programs (OSEP) Ruth Ryder Acting Director October 2016 This report is in the public domain. Authorization to reproduce it in whole or in part is granted. While permission to reprint this report is not necessary, the citation should be U.S. Department of Education, Office of Special Education and Rehabilitative Services, Office of Special Education Programs, 38th Annual Report to Congress on the Implementation of the Individuals with Disabilities Education Act, 2016, Washington, D.C. 2016. This report is available on the Department’s website at: http://www.ed.gov/about/reports/annual/osep To order copies of this report,
Write to: ED PUBS, Education Publications Center, U.S. Department of Education, P.O. Box 22207, Alexandria, VA 22304. Or fax your request to: 703-605-6794. Or email your request to: [email protected]. Or call in your request toll-free to: 1-877-433-7827 (1-877-4-ED-PUBS). Those who use a telecommunications device for the deaf (TDD) or a teletypewriter (TTY) should call 1-877-576-7734. If 877 service is not available in your area, call 1-800-872-5327 (1-800-USA-LEARN). Or order online at: www.edpubs.gov
Availability of Alternate Formats Requests for documents in alternate formats such as Braille or large print should be submitted to the Alternate Format Center by calling 202-260-0852 or by contacting the 504 coordinator via email at [email protected]. Notice to Limited English Proficient Persons If you have difficulty understanding English, you may request language assistance services for Department information that is available to the public. These language assistance services are available free of charge. If you need more information about interpretation or translation services, please call 1-800-USA-LEARN (1-800-872-5327) (TTY: 1-800-437-0833), or email us at: [email protected]. Or write to: U.S. Department of Education, Information Resource Center, LBJ Education Building, 400 Maryland Ave. SW, Washington, DC 20202. Content Contact: Richelle Davis Phone: 202-245-7401 Email: [email protected]

iii
Contents
Page
List of Exhibits ...................................................................................................................................... vi Preface .................................................................................................................................................. xv Key Findings at the National Level ................................................................................................... xxi Data Sources Used in This Report........................................................................................................ 1 Section I. Summary and Analysis of IDEA Section 618 Data at the National Level ....................... 7
Infants and Toddlers Served Under IDEA, Part C ...................................................................... 9
Numbers and Percentages of Infants and Toddlers Birth Through Age 2 Served Under
IDEA, Part C ..................................................................................................................... 10 Primary Early Intervention Service Settings for Infants and Toddlers Birth Through
Age 2 Served Under IDEA, Part C.................................................................................... 15 Part C Exiting Status for Children Served Under IDEA, Part C ............................................... 17 Dispute Resolution for Infants and Toddlers Served Under IDEA, Part C ............................... 20
Children Ages 3 Through 5 Served Under IDEA, Part B .......................................................... 25
Numbers and Percentages of Children Ages 3 Through 5 Served Under IDEA, Part B ........... 26 Educational Environments for Children Ages 3 Through 5 Served Under IDEA, Part B ........ 29 Special Education Teachers and Paraprofessionals Employed to Serve Children Ages
3 Through 5 Under IDEA, Part B...................................................................................... 32
Students Ages 6 Through 21 Served Under IDEA, Part B ........................................................ 34
Numbers and Percentages of Students Ages 6 Through 21 Served Under IDEA, Part B ......... 35 Educational Environments for Students Ages 6 Through 21 Served Under IDEA,
Part B ................................................................................................................................ 47 Part B Participation and Performance on State Assessments .................................................... 53 Part B Exiting ............................................................................................................................ 60 Special Education Teachers and Paraprofessionals Employed to Serve Students Ages 6
Through 21 Under IDEA, Part B....................................................................................... 66
Children and Students Ages 3 Through 21 Served Under IDEA, Part B ................................. 68
Personnel Employed to Provide Related Services for Children and Students Ages 3 Through 21 Served Under IDEA, Part B .......................................................................... 68
Disciplinary Removals of Children and Students From Their Educational Placements ........... 70 Dispute Resolution for Children and Students Served Under IDEA, Part B ............................. 74 Coordinated Early Intervening Services ................................................................................... 78

iv
Contents (continued)
Page
Section II. Summary and Analysis of IDEA Section 618 Data at the State Level .......................... 81
Introduction ................................................................................................................................... 83
Notes Concerning the Exhibits in Section II ............................................................................... 84
Infants and Toddlers Birth Through Age 2 Served Under IDEA, Part C ................................ 86
Part C Child Count .................................................................................................................... 86 Part C Primary Early Intervention Service Settings .................................................................. 93 Part C Exiting ............................................................................................................................ 96 Part C Dispute Resolution ....................................................................................................... 100
Children Ages 3 Through 5 Served Under IDEA, Part B ........................................................ 104
Part B Child Count .................................................................................................................. 104 Part B Educational Environments ........................................................................................... 110 Part B Personnel ...................................................................................................................... 118
Students Ages 6 Through 21 Served Under IDEA, Part B ...................................................... 121
Part B Child Count .................................................................................................................. 121 Part B Educational Environments ........................................................................................... 137 Part B Participation on State Assessments .............................................................................. 149 Part B Exiting .......................................................................................................................... 157 Part B Personnel ...................................................................................................................... 164
Children and Students Ages 3 Through 21 Served Under IDEA, Part B ............................... 167
Part B Discipline ..................................................................................................................... 167 Part B Dispute Resolution ....................................................................................................... 176
Section III. Findings and Determinations Resulting From Reviews of State Implementation of IDEA ................................................................................................................... 183
Findings and Determinations Resulting From Reviews of State Implementation of IDEA.. 185
The SPP and APR ................................................................................................................... 185 Indicators................................................................................................................................. 186 The Determination Process ..................................................................................................... 191 Enforcement ............................................................................................................................ 202 Determination Status ............................................................................................................... 203 Status of Selected Indicators ................................................................................................... 207 Early Childhood Transition: Part C Indicator 8 ...................................................................... 208 Early Childhood Transition: Part B Indicator 12 .................................................................... 209 Infant and Toddler Outcomes: Part C Indicator 3 ................................................................... 210 Preschool Outcomes: Part B Indicator 7 ................................................................................. 212

v
Contents (continued)
Page
Section IV. Summary of Research Conducted Under Part E of the Education Sciences Reform Act of 2002 ............................................................................................................................. 215 Section V. Summary of Studies and Evaluations Under Section 664 of IDEA ............................. 235 Section VI. Extent and Progress of the Assessment of National Activities ................................... 241 Appendix A. Infants, Toddlers, Children, and Students Served Under IDEA, by Age Group and State ................................................................................................................................. 247 Appendix B. Developmental Delay Data for Children Ages 3 Through 5 and Students Ages 6 Through 9 Served Under IDEA, Part B .............................................................................. 259 Appendix C. IDEA Part B Maintenance of Effort Reduction and Coordinated Early Intervening Services .......................................................................................................................... 267

vi
Exhibits
Page Exhibit 1 Number of infants and toddlers birth through age 2 served under IDEA, Part C,
and percentage of the population served, by year: Fall 2005 through fall 2014 ............... 10
Exhibit 2 Percentage of the population birth through age 2 served under IDEA, Part C, by year and age group: Fall 2005 through fall 2014 .............................................................. 11
Exhibit 3 Number of infants and toddlers birth through age 2 served under IDEA, Part C, and percentage of the population served (risk index), comparison risk index, and risk ratio for infants and toddlers birth through age 2 served under IDEA, Part C, by race/ethnicity: Fall 2014 .............................................................................................. 13
Exhibit 4 Percentage of infants and toddlers birth through age 2 served under IDEA, Part C, by primary early intervention service setting: Fall 2014 ...................................... 15
Exhibit 5 Percentage of infants and toddlers birth through age 2 served under IDEA, Part C, within racial/ethnic groups, by primary early intervention service setting: Fall 2014 ........................................................................................................................... 16
Exhibit 6 Percentage of infants and toddlers birth through age 2 served under IDEA, Part C, by exiting status: 2013–14 .................................................................................... 17
Exhibit 7 Percentage of children served under IDEA, Part C, who reached age 3 and were eligible to exit Part C, by Part B eligibility status: 2013–14 ............................................. 19
Exhibit 8 Percentage of written, signed complaints for infants and toddlers served under IDEA, Part C, by complaint status: 2013–14 .................................................................... 21
Exhibit 9 Percentage of due process complaints for infants and toddlers served under IDEA, Part C, by complaint status: 2013–14 .................................................................... 22
Exhibit 10 Percentage of mediation requests for infants and toddlers served under IDEA, Part C, by request status: 2013–14 .................................................................................... 23
Exhibit 11 Number of children ages 3 through 5 served under IDEA, Part B, and percentage of the population served, by year: Fall 2005 through fall 2014 ........................................ 26
Exhibit 12 Percentage of children ages 3 through 5 served under IDEA, Part B, by disability category: Fall 2014 ........................................................................................................... 27
Exhibit 13 Number of children ages 3 through 5 served under IDEA, Part B, and percentage of the population served (risk index), comparison risk index, and risk ratio for children ages 3 through 5 served under IDEA, Part B, by race/ethnicity: Fall 2014 .................................................................................................................................. 28
Exhibit 14 Percentage of children ages 3 through 5 served under IDEA, Part B, by educational environment: Fall 2014 .................................................................................. 29

vii
Exhibits (continued)
Page Exhibit 15 Percentage of children ages 3 through 5 served under IDEA, Part B, within
racial/ethnic groups, by educational environment: Fall 2014 ........................................... 31
Exhibit 16 Number of full-time equivalent (FTE) special education teachers and number and percentage of FTE highly qualified special education teachers employed to provide special education and related services for children ages 3 through 5 served under IDEA, Part B: Fall 2013 .............................................................................. 32
Exhibit 17 Number of full-time equivalent (FTE) special education paraprofessionals and number and percentage of FTE qualified special education paraprofessionals employed to provide special education and related services for children ages 3 through 5 served under IDEA, Part B: Fall 2013 .............................................................. 33
Exhibit 18 Number of students ages 6 through 21 served under IDEA, Part B, and percentage of the population served, by year: Fall 2005 through fall 2014 ...................... 35
Exhibit 19 Percentage of the population ages 6 through 21 served under IDEA, Part B, by year and age group: Fall 2005 through fall 2014 .............................................................. 36
Exhibit 20 Percentage of students ages 6 through 21 served under IDEA, Part B, by disability category: Fall 2014............................................................................................ 37
Exhibit 21 Percentage of the population ages 6 through 21 served under IDEA, Part B, by year and disability category: Fall 2005 through fall 2014 ................................................ 38
Exhibit 22 Percentage of the population ages 6 through 21 served under IDEA, Part B, reported under the category of autism, by year and age group: Fall 2005 through fall 2014 ............................................................................................................................ 39
Exhibit 23 Percentage of the population ages 6 through 21 served under IDEA, Part B, reported under the category of other health impairments, by year and age group: Fall 2005 through fall 2014............................................................................................... 40
Exhibit 24 Percentage of the population ages 6 through 21 served under IDEA, Part B, reported under the category of specific learning disabilities, by year and age group: Fall 2005 through fall 2014 ................................................................................... 41
Exhibit 25 Number of students ages 6 through 21 served under IDEA, Part B, and percentage of the population served (risk index), comparison risk index, and risk ratio for children ages 6 through 21 served under IDEA, Part B, by race/ethnicity: Fall 2014 ........................................................................................................................... 42
Exhibit 26 Risk ratio for students ages 6 through 21 served under IDEA, Part B, within racial/ethnic groups by disability category: Fall 2014 ...................................................... 44
Exhibit 27 Percentage of students ages 6 through 21 served under IDEA, Part B, within racial/ethnic groups, by disability category: Fall 2014 ..................................................... 46

viii
Exhibits (continued)
Page Exhibit 28 Percentage of students ages 6 through 21 served under IDEA, Part B, by
educational environment: Fall 2014 .................................................................................. 47
Exhibit 29 Percentage of students ages 6 through 21 served under IDEA, Part B, by year and educational environment: Fall 2005 through fall 2014 ..................................................... 48
Exhibit 30 Percentage of students ages 6 through 21 served under IDEA, Part B, within disability category, by educational environment: Fall 2014 ............................................. 50
Exhibit 31 Percentage of students ages 6 through 21 served under IDEA, Part B, within racial/ethnic groups, by educational environment: Fall 2014 ........................................... 51
Exhibit 32 Percentages of students served under IDEA, Part B, in grades 3 through 8 and high school who participated in state math and reading assessments, by assessment type: School year 2013–14 ............................................................................. 53
Exhibit 33 Percentages of students served under IDEA, Part B, in grades 3 through 8 and high school classified as nonparticipants in state math and reading assessments, by nonparticipant category: School year 2013–14 ............................................................ 55
Exhibit 34 Numbers of states assessing students served under IDEA, Part B, in grades 3 through 8 and high school in math and reading and median percentages of those students who were proficient, by assessment type: School year 2013–14 ........................ 57
Exhibit 35 Percentage of students ages 14 through 21 exiting IDEA, Part B, by exit reason: 2013–14 ............................................................................................................................ 60
Exhibit 36 Percentages of students ages 14 through 21 exiting IDEA, Part B, and school, who graduated with a regular high school diploma or dropped out of school, by year: 2004–05 through 2013–14 ....................................................................................... 61
Exhibit 37 Percentage of students ages 14 through 21 exiting IDEA, Part B, and school, who graduated with a regular high school diploma, by year and disability category: 2004–05 through 2013–14 ................................................................................................ 63
Exhibit 38 Percentage of students ages 14 through 21 exiting IDEA, Part B, and school, who dropped out of school, by year and disability category: 2004–05 through 2013–14 ...................................................................................................................................... 65
Exhibit 39 Number of full-time equivalent (FTE) special education teachers and number and percentage of FTE highly qualified special education teachers employed to provide special education and related services for students ages 6 through 21 served under IDEA, Part B: Fall 2013 .............................................................................. 66

ix
Exhibits (continued)
Page Exhibit 40 Number of full-time equivalent (FTE) special education paraprofessionals and
number and percentage of FTE qualified special education paraprofessionals employed to provide special education and related services for students ages 6 through 21 served under IDEA, Part B: Fall 2013 ............................................................ 67
Exhibit 41 Number of full-time equivalent (FTE) personnel and number and percentage of FTE fully certified personnel employed to provide related services for children and students ages 3 through 21 served under IDEA, Part B, by personnel type: Fall 2013 ........................................................................................................................... 68
Exhibit 42 Numbers of children and students ages 3 through 21 who were served under IDEA, Part B; removed from their educational placements for disciplinary purposes; and removed per 10,000 children and students ages 3 through 21 served under IDEA, Part B, by type of disciplinary removal: School year 2013–14 ...................................................................................................................................... 70
Exhibit 43 Numbers of children and students ages 3 through 21 served under IDEA, Part B, who were removed to an interim alternative educational setting and suspended or expelled for more than 10 days per 10,000 children and students ages 3 through 21 served under IDEA, Part B, by disability category and type of disciplinary removal: School year 2013–14 ......................................................................................... 72
Exhibit 44 Percentage of written, signed complaints for children and students served under IDEA, Part B, by complaint status: 2013–14 .................................................................... 75
Exhibit 45 Percentage of due process complaints for children and students served under IDEA, Part B, by complaint status: 2013–14 .................................................................... 76
Exhibit 46 Percentage of mediation requests for children and students served under IDEA, Part B, by request status: 2013–14 .................................................................................... 77
Exhibit 47 Number and percentage of children and students ages 3 through 21 served under IDEA, Part B, in 2014 who received coordinated early intervening services (CEIS) in school years 2011–12, 2012–13, or 2013–14: Fall 2014 .................................. 79
Exhibit 48 Percentage of the population birth through age 2 served under IDEA, Part C, by year and state: Fall 2008 and fall 2014 ............................................................................. 86
Exhibit 49 Percentage of the population birth through age 2 served under IDEA, Part C, for each racial/ethnic group, by state: Fall 2014..................................................................... 89
Exhibit 50 Percentage of infants and toddlers birth through age 2 served under IDEA, Part C, by year, primary early intervention service setting, and state: Fall 2008 and fall 2014 ..................................................................................................................... 93
Exhibit 51 Percentage of infants and toddlers birth through age 2 exiting or continuing in IDEA, Part C, by exiting status and state: 2013–14.......................................................... 96

x
Exhibits (continued)
Page Exhibit 52 Number of written, signed complaints; due process complaints; and mediation
requests for infants and toddlers per 1,000 infants and toddlers birth through age 2 served under IDEA, Part C, by state: 2013–14 ............................................................ 101
Exhibit 53 Percentage of the population ages 3 through 5 served under IDEA, Part B, by year and state: Fall 2008 and fall 2014 ........................................................................... 104
Exhibit 54 Percentage of the population ages 3 through 5 served under IDEA, Part B, for each racial/ethnic group, by state: Fall 2014................................................................... 107
Exhibit 55 Percentage of children ages 3 through 5 served under IDEA, Part B, by educational environment and state: Fall 2014................................................................. 110
Exhibit 56 Percentage of children ages 3 through 5 served under IDEA, Part B, who were limited English proficient, by educational environment and state: Fall 2014 ................. 114
Exhibit 57 Number of full-time equivalent (FTE) special education teachers employed to provide special education and related services for children ages 3 through 5 per 100 children ages 3 through 5 served under IDEA, Part B, by qualification status and state: Fall 2013 ......................................................................................................... 118
Exhibit 58 Percentage of the population ages 6 through 21 served under IDEA, Part B, by year and state: Fall 2008 and fall 2014 ........................................................................... 121
Exhibit 59 Percentage of the population ages 6 through age 21 served under IDEA, Part B, for each racial/ethnic group, by state: Fall 2014 ............................................................. 124
Exhibit 60 Percentage of students ages 6 through 21 served under IDEA, Part B, reported under the category of autism, by year and state: Fall 2008 and fall 2014 ....................... 128
Exhibit 61 Percentage of students ages 6 through 21 served under IDEA, Part B, reported under the category of other health impairments, by year and state: Fall 2008 and fall 2014 .......................................................................................................................... 131
Exhibit 62 Percentage of students ages 6 through 21 served under IDEA, Part B, reported under the category of specific learning disabilities, by year and state: Fall 2008 and fall 2014 ................................................................................................................... 134
Exhibit 63 Percentage of students ages 6 through 21 served under IDEA, Part B, by educational environment and state: Fall 2014................................................................. 137
Exhibit 64 Percentage of students ages 6 through 21 served under IDEA, Part B, who were limited English proficient, by educational environment and state: Fall 2014 ................. 140
Exhibit 65 Percentage of students ages 6 through 21 served under IDEA, Part B, reported under the category of emotional disturbance, by educational environment and state: Fall 2014 ................................................................................................................ 143

xi
Exhibits (continued)
Page Exhibit 66 Percentage of students ages 6 through 21 served under IDEA, Part B, reported
under the category of intellectual disabilities, by educational environment and state: Fall 2014 ................................................................................................................ 146
Exhibit 67 Percentages of students served under IDEA, Part B, in grades 4, 8, and high school who participated in state math assessments, by assessment type and state: School year 2013–14 ...................................................................................................... 149
Exhibit 68 Percentages of students served under IDEA, Part B, in grades 4, 8, and high school who participated in state reading assessments, by assessment type and state: School year 2013–14 ............................................................................................. 153
Exhibit 69 Percentages of students ages 14 through 21 exiting IDEA, Part B, and school who graduated with a regular high school diploma or dropped out of school, by year and state: 2008–09 and 2013–14 ............................................................................. 157
Exhibit 70 Percentage of students ages 14 through 21 exiting IDEA, Part B, by exit reason and state: 2013–14 .......................................................................................................... 161
Exhibit 71 Number of full-time equivalent (FTE) special education teachers employed to provide special education and related services for students ages 6 through 21 per 100 students served under IDEA, Part B, by qualification status and state: Fall 2013 ................................................................................................................................ 164
Exhibit 72 Number of children and students ages 3 through 21 served under IDEA, Part B, removed unilaterally to an interim alternative educational setting by school personnel for drug, weapons, or serious bodily injury offenses per 10,000 children and students ages 3 through 21 served under IDEA, Part B, by state: School year 2013–14 ...................................................................................................... 167
Exhibit 73 Number of children and students ages 3 through 21 served under IDEA, Part B, suspended out of school or expelled for more than 10 days during the school year, per 10,000 children and students ages 3 through 21 served under IDEA, Part B, by state: School year 2013–14 ............................................................................ 170
Exhibit 74 Number of children and students ages 3 through 21 served under IDEA, Part B, reported under the category of emotional disturbance and suspended out of school or expelled for more than 10 days during the school year, per 10,000 children and students ages 3 through 21 served under IDEA, Part B, reported under the category of emotional disturbance, by state: School year 2013–14 ............... 173
Exhibit 75 Numbers of written, signed complaints; due process complaints; and mediation requests for children and students served under IDEA, Part B, per 10,000 children and students ages 3 through 21 served, by state: 2013–14 ............................... 176

xii
Exhibits (continued)
Page Exhibit 76 Number of complaints for children and students served under IDEA, Part B, per
10,000 children and students ages 3 through 21 served, by complaint status and state: 2013–14 ................................................................................................................. 180
Exhibit 77 Compliance and results indicators for determining the extent to which each state met IDEA, Part B, requirements: Federal fiscal year 2013 ............................................ 187
Exhibit 78 Compliance and results indicators for determining the extent to which each state met IDEA, Part C, requirements: Federal fiscal year 2013 ............................................ 190
Exhibit 79 Process for determining the extent to which each state met IDEA, Part B and Part C, requirements: Federal fiscal year 2013 ............................................................... 192
Exhibit 80 States determined to have met IDEA, Part B, requirements, by determination status: Federal fiscal year 2013 ....................................................................................... 204
Exhibit 81 States determined to have met IDEA, Part C, requirements, by determination status: Federal fiscal year 2013 ....................................................................................... 205
Exhibit 82 Number of states determined to have met IDEA, Part B, requirements, by determination status and change in status: Federal fiscal years 2012 and 2013 ............. 206
Exhibit 83 Number of states determined to have met IDEA, Part C, requirements, by determination status and change in status: Federal fiscal years 2012 and 2013 ............. 207
Exhibit 84 Number of states, by percentage of children exiting IDEA, Part C, who received timely transition planning by their third birthday, by sub-indicators of Part C Indicator 8: Federal fiscal year 2013 .............................................................................. 209
Exhibit 85 Number of states, by percentage of children referred to IDEA, Part B, by Part C prior to age 3 who were found eligible for Part B and who had individualized education programs (IEPs) developed and implemented by their third birthday: Federal fiscal year 2013 .................................................................................................. 210
Exhibit 86 Number of states, by percentage of infants and toddlers with IFSPs who were below age expectation for the outcome when entering Part C who demonstrated improvement by age 3 or exit from Part C, by outcome type: Federal fiscal year 2013 ................................................................................................................................ 211
Exhibit 87 Number of states, by percentage of infants and toddlers with IFSPs functioning at age expectation at age 3 or upon exiting Part C, by outcome type: Federal fiscal year 2013......................................................................................................................... 212
Exhibit 88 Number of states, by percentage of children with IEPs who were below age expectation for the outcome when entering Part B who demonstrated improvement by age 6 or exit from Part B, by outcome type: Federal fiscal year 2013 ................................................................................................................................ 213

xiii
Exhibits (continued)
Page Exhibit 89 Number of states, by percentage of children with IEPs functioning at age
expectation at age 6 or upon exiting Part B, by outcome type: Federal fiscal year 2013 ................................................................................................................................ 214
Exhibit A-1 Number and percentage of the population of infants and toddlers birth through age 2 served under IDEA, Part C, and children and students ages 3 through 21 served under IDEA, Part B, by age group and state: Fall 2014 ...................................... 249
Exhibit A-2 Number of infants and toddlers birth through age 2 served under IDEA, Part C, by race/ethnicity and state: Fall 2014 ............................................................................. 252
Exhibit A-3 Number of children ages 3 through 5 served under IDEA, Part B, by race/ethnicity and state: Fall 2014 .................................................................................. 254
Exhibit A-4 Number of students ages 6 through 21 served under IDEA, Part B, by race/ethnicity and state: Fall 2014 .................................................................................. 256
Exhibit B-1 Number of states reporting children ages 3 through 5 served under IDEA, Part B, under the category of developmental delay and percentage of the population ages 3 through 5 served under IDEA, Part B, reported under the category of developmental delay, by year: Fall 2005 through fall 2014 ............................................ 262
Exhibit B-2 Number of states reporting students ages 6 through 9 served under IDEA, Part B, under the category of developmental delay and percentage of the population ages 6 through 9 served under IDEA, Part B, reported under the category of developmental delay, by year: Fall 2005 through fall 2014 ............................................ 263
Exhibit B-3 States reporting children ages 3 through 5 and students ages 6 through 9 served under IDEA, Part B, under the category of developmental delay, by state: Fall 2014 ................................................................................................................................ 264
Exhibit C-1 Number of students who received coordinated early intervening services (CEIS) and number and percentage of local education agencies (LEAs) or educational service agencies (ESAs) that were required to use 15 percent of IDEA sections 611 and 619 funds for CEIS due to significant disproportionality or that voluntarily used up to 15 percent of IDEA sections 611 and 619 funds reserved for CEIS, by state: School year 2013–14 ........................................................................ 270
Exhibit C-2 Number and percentage of local education agencies (LEAs) or educational service agencies (ESAs) that met the IDEA, Part B, requirements under 34 C.F.R. section 300.600(a)(2), had an increase in IDEA section 611 allocations, and took the maintenance of effort (MOE) reduction pursuant to IDEA section 613(a)(2)(C) in school year 2013–14 by state ................................................................ 272


xv
Preface
Since enactment of the Education for All Handicapped Children Act of 1975, Public Law (P.L.) 94-142, the secretary of the U.S. Department of Education (secretary) [and predecessor, the commissioner of education at the U.S. Department of Health, Education, and Welfare] has been required to transmit to Congress an annual report to inform Congress and the public of the progress being made in implementing the act. The annual reports to Congress reflect a history of persistent commitment and effort to expand educational opportunities for children with disabilities.
In December 2004, Congress reauthorized the Individuals with Disabilities Education Act (IDEA)
(P.L. 108-446), which was signed into law in the same month. The provisions of IDEA became effective on July 1, 2005, with the exception of some of the elements pertaining to the definition of a “highly qualified teacher”∗ that took effect upon the signing of the act. With reauthorization of IDEA, the nation reaffirmed its commitment to improving the early intervention and educational results and functional outcomes for infants, toddlers, children, and youths with disabilities (collectively this group may be referred to in this report as children with disabilities).
The 38th Annual Report to Congress on the Implementation of the Individuals with Disabilities
Education Act, 2016† describes our nation’s progress in (1) providing a free appropriate public education (FAPE) for children with disabilities under IDEA, Part B and early intervention services to infants and toddlers with disabilities and their families under IDEA, Part C, (2) ensuring that the rights of these children with disabilities and their parents are protected, (3) assisting states and localities in providing for the education of all children with disabilities, and (4) assessing the effectiveness of efforts to educate children with disabilities. The report focuses on the children and students with disabilities being served under IDEA, Part C or B, nationally and at the state level. In particular, Part C of IDEA provides funds to states to assist them in developing and implementing statewide, comprehensive, coordinated, multidisciplinary interagency systems to make early intervention services available to all eligible children from birth through age 2 with disabilities and their families, whereas Part B of IDEA provides funds to states to assist them in making FAPE available to eligible children ages 3 through 21 with disabilities who
∗ When referring to a “highly qualified teacher,” the term “highly qualified” has the meaning given the term in section 9101 of
the Elementary and Secondary Education Act of 1965, as amended (ESEA). For a highly qualified special education teacher, the term “highly qualified” has the same meaning given the term in ESEA, as amended, except that such term also includes the requirements described in section 602(10)(B) of IDEA, and the option for teachers to meet the requirements of section 9101 of ESEA, as amended, by meeting the requirements of section 602(10)(C) or (D) of IDEA [see 20 U.S.C. section 1401(10)].
† The year in the title reflects the U.S. Department of Education’s target year for submitting the report to Congress. The most current findings are based on data collected from July 2013 through December 2014. These data have been available to the public prior to their presentation in this report. Subsequent references to this report and previously published annual reports will be abbreviated: they will not include “on the Implementation of the Individuals with Disabilities Education Act.”

xvi
are in need of special education and related services. Throughout this report, infants and toddlers served under IDEA, Part C; children served under IDEA, Part B; and students served under IDEA, Part B, refer to individuals with disabilities who receive services under IDEA, Part C or Part B. “Special education services,” which is referenced throughout this report, is a term that is synonymous with services provided under IDEA, Part B. Similarly, “early intervention services” is a term used synonymously with services provided under IDEA, Part C.
This 38th Annual Report to Congress, 2016 follows the 37th Annual Report to Congress, 2015 in
sequence and format, and it continues to focus on IDEA results and accountability. Similar to the 37th Annual Report to Congress, 2015, the 38th Annual Report to Congress, 2016 contains six major sections that address the five annual report requirements contained in section 664(d) of IDEA. The sections are: (1) a summary and analysis of IDEA section 618 data at the national level; (2) a summary and analysis of IDEA section 618 data at the state level;‡ (3) a summary and analysis of the U.S. Department of Education’s (Department’s) findings and determinations regarding the extent to which states are meeting the requirements of IDEA, Parts B and C; (4) a summary of special education research conducted under Part E of the Education Sciences Reform Act of 2002; (5) a summary of national special education studies and evaluations conducted under sections 664(a) and (c) of IDEA; and (6) a summary of the extent and progress of the assessment of national activities, which focus on determining the effectiveness of IDEA and improving its implementation.
The content of this report differs from that of the 37th Annual Report to Congress, 2015 in the
following ways: (1) the most recent data presented in this report represent the reporting periods associated with fall 2014 or school year 2013–14, and (2) where data are presented for a 10-year period, the oldest data are associated with fall 2005.
A summary of each of the six sections and three appendices that make up the 38th Annual Report
to Congress, 2016 follows.
Section I. Summary and Analysis of IDEA Section 618 Data at the National Level
Section I contains national data pertinent to Parts C and B of IDEA. It contains four subsections. The four subsections focus on infants and toddlers served under IDEA, Part C; children ages 3 through 5
‡ Section 618 data consist of (1) the number of infants and toddlers served under IDEA, Part C; the settings in which they
receive program services; information on the transition at age 3 out of Part C; and dispute resolution information and (2) the number of children and students served under IDEA, Part B; the environments in which they receive education; their participation in and performance on state assessments; information on their exiting special education services; the personnel employed to provide educational services to them; disciplinary actions that affect them; and dispute resolution information.

xvii
served under IDEA, Part B; students ages 6 through 21 served under IDEA, Part B; and children and students ages 3 through 21 served under IDEA, Part B. The exhibits provide information about the characteristics of children and students receiving services under Parts C and B, their disabilities, the settings in which they receive services, their participation in and performance on state assessments, their exits from Part C and Part B programs, their disciplinary removals, and their legal disputes. Also addressed are the characteristics of the personnel employed to provide special education and related services for the children and students. The data presented in the exhibits and discussed in the bulleted text represent the 50 states, the District of Columbia, the Commonwealth of Puerto Rico (Puerto Rico herein), and the four outlying areas of American Samoa, Guam, the Commonwealth of the Northern Mariana Islands (the Northern Mariana Islands herein), and the Virgin Islands. In addition, the exhibits that concern special education and related services provided under IDEA, Part B, include data for Bureau of Indian Education (BIE) schools operated or funded by the U.S. Department of the Interior and the three freely associated states: the Federated States of Micronesia, the Republic of Palau, and the Republic of the Marshall Islands.
Section II. Summary and Analysis of IDEA Section 618 Data at the State Level
Section II contains state-level data regarding Part C and Part B of IDEA. This section is organized into four subsections. The first subsection presents information about infants and toddlers served under IDEA, Part C, while the second and third subsections present information about children ages 3 through 5 and students ages 6 through 21 served under IDEA, Part B, respectively. The fourth subsection provides information about children and students ages 3 through 21 served under IDEA, Part B. The four subsections address questions about the characteristics of children and students receiving services under Parts C and B, their disabilities, the settings in which they receive services, their participation in state assessments, their exits from Part C and Part B programs, their disciplinary removals, and their legal disputes. Also addressed are the characteristics of the personnel employed to provide special education and related services for the children and students. The data presented in exhibits and discussed in the bulleted text represent the 50 states, the District of Columbia, BIE schools, and Puerto Rico.
Section III. Findings and Determinations Resulting From Reviews of State Implementation of IDEA
Sections 616(d) and 642 of IDEA require the secretary to make an annual determination as to the extent to which each state’s Part B and Part C programs are meeting the requirements of IDEA. To fulfill this requirement, the secretary considers each state’s State Performance Plan (SPP)/Annual Performance Report (APR). Based on the information provided by the state in the SPP/APR, information obtained through monitoring reviews, and any other public information made available, the secretary determines if

xviii
the state meets the requirements and purposes of IDEA, needs assistance in implementing the requirements, needs intervention in implementing the requirements, or needs substantial intervention in implementing the requirements. In June 2015, the Department issued the determination letters on implementation of IDEA for federal fiscal year (FFY) 2013 to 60 state education agencies (SEAs) for Part B and to 56 state lead agencies for Part C. Section III presents the results of the determinations.
Section IV. Summary of Research Conducted Under Part E of the Education Sciences Reform Act of 2002
When Congress reauthorized IDEA in December 2004, it amended the Education Sciences Reform Act of 2002 (P.L. 107-279) by adding a new Part E to that act. The new Part E established the National Center for Special Education Research (NCSER) as part of the Institute of Education Sciences (IES). NCSER began operation on July 1, 2005. As specified in section 175(b) of the Education Sciences Reform Act of 2002, NCSER’s mission is to
• Sponsor research to expand knowledge and understanding of the needs of infants, toddlers,
and children with disabilities in order to improve the developmental, educational, and transitional results of such individuals;
• Sponsor research to improve services provided under, and support the implementation of, IDEA [20 United States Code (U.S.C.) section 1400 et seq.]; and
• Evaluate the implementation and effectiveness of IDEA in coordination with the National Center for Education Evaluation and Regional Assistance.
Section IV of this report describes the research projects funded by grants made during FFY 2015 (October 1, 2014, through September 30, 2015) by NCSER under Part E of the Education Sciences Reform Act of 2002.
Section V. Summary of Studies and Evaluations Under Section 664 of IDEA
In the December 2004 reauthorization of IDEA, Congress required the secretary to delegate to the director of IES responsibility to carry out studies and evaluations under sections 664(a), (b), and (c) of IDEA. As specified in section 664(a) of IDEA, IES, either directly or through grants, contracts, or cooperative agreements awarded to eligible entities on a competitive basis, assesses the progress in the implementation of IDEA, including the effectiveness of state and local efforts to provide (1) FAPE to children with disabilities and (2) early intervention services to infants and toddlers with disabilities and infants and toddlers who would be at risk of having substantial developmental delays if early intervention services were not provided to them. As specified in section 664(c) of IDEA, IES is required to carry out a national study or studies that will inform efforts to ensure accountability for students who are held to

xix
alternate achievement standards. This section describes the studies and evaluations authorized by sections 664(a) and (c) of IDEA and supported by IES during FFY 2015 (October 1, 2014, through September 30, 2015).
Section VI. Extent and Progress of the Assessment of National Activities
Under section 664(b) of IDEA (as amended in 2004), the secretary is responsible for carrying out a “national assessment” of activities supported by federal funds under IDEA. As delegated by the secretary, IES is carrying out this national assessment to (1) determine the effectiveness of IDEA in achieving the law’s purpose; (2) provide timely information to the president, Congress, the states, local education agencies (LEAs), and the public on how to implement IDEA more effectively; and (3) provide the president and Congress with information that will be useful in developing legislation to achieve the purposes of IDEA more effectively. The national assessment is designed to address specific research questions that focus on (1) the implementation and impact of programs assisted under IDEA in addressing developmental and academic outcomes for children with disabilities, (2) identification for early intervention and special education, (3) early intervention and special education services, and (4) early intervention and special education personnel. Studies funded in FFY 2015 that contribute to the national assessment are described in Section VI.
Appendix A. Infants, Toddlers, Children, and Students Served Under IDEA, by Age Group and State
Appendix A presents the numbers and percentages of the resident population represented by the infants and toddlers birth through age 2 served under IDEA, Part C in 2014 in each state, the District of Columbia, Puerto Rico, and the four outlying areas (American Samoa, the Northern Mariana Islands, Guam, and the Virgin Islands) and children ages 3 through 5 served under IDEA, Part B, and students ages 6 through 21 served under IDEA, Part B, in 2014 in each state, the District of Columbia, BIE schools, Puerto Rico, the four outlying areas, and the three freely associated states (the Federated States of Micronesia, the Republic of Palau, and the Republic of the Marshall Islands). It also presents the number of children served in each state, the District of Columbia, BIE schools, Puerto Rico, the four outlying areas, and the three freely associated states by race/ethnicity.

xx
Appendix B. Developmental Delay Data for Children Ages 3 Through 5 and Students Ages 6 Through 9 Served Under IDEA, Part B
Appendix B presents information about the children ages 3 through 5 and students ages 6 through 9 served under IDEA, Part B, under the category of developmental delay.§ Exhibits B-1 and B-2 provide data on the percentages of resident populations in the 50 states, the District of Columbia, and Puerto Rico represented by the children ages 3 through 5 and students ages 6 through 9 served under IDEA, Part B, who were reported under the category of developmental delay, respectively, in each year, 2005 through 2014. Exhibit B-3 identifies whether each state, the District of Columbia, BIE schools, Puerto Rico, the four outlying areas, and the three freely associated states reported any children ages 3 through 5 or any students ages 6 through 9 under the developmental delay category in 2014.
Appendix C. IDEA, Part B Maintenance of Effort Reduction and Coordinated Early Intervening Services
Appendix C presents state-level information on the number of students who received coordinated early intervening services (CEIS) and number and percentage of LEAs and educational service agencies (ESAs) that were required to use 15 percent of IDEA sections 611 and 619 funds for CEIS due to significant disproportionality or that voluntarily used up to 15 percent of IDEA sections 611 and 619 funds for CEIS. In addition, state-level data are presented on the number and percentage of LEAs and ESAs that met the IDEA, Part B, requirements under 34 Code of Federal Regulations (C.F.R.) section 300.600(a)(2) and had an increase in IDEA, Part B section 611 allocations and took the maintenance of effort (MOE) reduction pursuant to IDEA section 613(a)(2)(C) in school year 2013–14.
§ This descriptor and other section 618 data descriptors in this report are italicized within exhibits, text, and notes to clarify that
the reference is to a grouping of data.

xxi
Key Findings at the National Level
The 38th Annual Report to Congress, 2016 showcases data collected from states. The report also includes information from studies, evaluations, and databases of the Institute of Education Sciences and U.S. Census Bureau. Some key findings from Section I of the report, “Summary and Analysis of IDEA, Section 618 Data at the National Level” follow. To more completely understand the meaning and context for each of the findings featured below, the reader is advised to review the exhibit cited and the additional associated bulleted text.
Infants and Toddlers Served Under IDEA, Part C
• In 2014, there were 350,581 infants and toddlers birth through age 2 served under IDEA, Part C. Of those infants and toddlers, 346,394 were served in the 50 states and the District of Columbia. This number represented 2.9 percent of the birth-through-age-2 population in the 50 states and the District of Columbia (Exhibit 1).
• From 2005 through 2014, the percentage of the resident population of infants and toddlers birth through age 2 served under IDEA, Part C, increased from 2.5 percent to 2.9 percent. The percentage of 2-year-olds in the resident population of infants and toddlers served under IDEA, Part C, either increased from the previous year or was approximately the same as in the previous year from 2005 through 2012. Between 2012 and 2013, the percentage decreased from 4.7 percent to 4.6 percent. However, the percentage increased to 4.9 in 2014. The percentage of 1-year-olds in the resident population of infants and toddlers served under IDEA, Part C, either increased from the previous year or was approximately the same as in the previous year from 2005 through 2010. Between 2010 and 2011, the percentage decreased from 2.7 percent to 2.6 percent and remained at that level in 2012. In 2013, the percentage again reached 2.7 percent and it remained there in 2014. From 2005 through 2014, approximately 1 percent of the infants and toddlers under 1 year old in the resident population were served under Part C (Exhibit 2).
• Native Hawaiian or Other Pacific Islander and White infants and toddlers had risk ratios of 1.4 and 1.2, respectively, indicating that infants and toddlers in each of these racial/ethnic groups were slightly more likely than those in all other racial/ethnic groups combined to be served under IDEA, Part C. American Indian or Alaska Native, Asian, and Black or African American infants and toddlers and infants and toddlers associated with two or more racial/ethnic groups had risk ratios of 0.9, 0.8, 0.9, and 0.7, respectively, indicating that infants and toddlers in each of these groups were slightly less likely than those in all other racial/ethnic groups combined to be served under IDEA, Part C. Hispanic/Latino infants and toddlers, with a risk ratio of 1, were as likely to be served under Part C as the infants and toddlers of all other racial/ethnic groups combined (Exhibit 3).
• In 2014, 88.1 percent of infants and toddlers served under Part C received their early intervention services primarily in the home. The category of community-based setting was reported as the primary early intervention setting for 7.6 percent of those served under Part C. Consequently, 95.6 percent of infants and toddlers served under IDEA, Part C, in 2014 received their early intervention services primarily in natural environments, which are defined as the home or a community-based setting (Exhibit 4).

xxii
• In 2014, home was the primary early intervention service setting for more than 84 percent of the infants and toddlers birth through age 2 served under IDEA, Part C, in each racial/ethnic group. The largest percentage of infants and toddlers served under IDEA, Part C, who received early intervention services in a community-based setting was associated with American Indian or Alaska Native children (13.1 percent), while the smallest percentage served in this setting was associated with Native Hawaiian or Other Pacific Islander children (5.2 percent) (Exhibit 5).
• Of the Part C exiting statuses in 2013–14, Part B eligible, exiting Part C accounted for the largest percentage of infants and toddlers (38.1 percent). An additional 3.1 percent of the infants and toddlers were found to be eligible for Part B but continued to receive services under Part C. No longer eligible for Part C prior to reaching age 3 was the second most prevalent category of exiting status, as it accounted for 13.8 percent of the infants and toddlers. Withdrawal by parent (or guardian) and Part B eligibility not determined accounted for 12.1 percent and 11.2 percent, respectively (Exhibit 6).
• In 2013–14, 61.2 percent of children served under IDEA, Part C, who reached age 3 were determined to be Part B eligible, exiting Part C. An additional 4.9 percent of these children were found to be eligible for Part B but continued to receive services under Part C. Eligibility for Part B was not determined for 17.9 percent of the children served under IDEA, Part C, who had reached age 3. The remaining 16 percent of the children served under Part C who had reached age 3 exited Part C and were determined to be not eligible for Part B. The children who were not eligible for Part B included those who exited with referrals to other programs (11.0 percent) and those who exited with no referrals (5.0 percent) (Exhibit 7).
• During 2013–14, a total of 113 written, signed complaints were received through the dispute resolution process for infants and toddlers birth through age 2 served under IDEA, Part C. A report was issued for 88 (77.9 percent) of the complaints, while 24 (21.2 percent) of the complaints were withdrawn or dismissed. Only 1 (0.9 percent) of the complaints that were received during the reporting period was pending or unresolved by the end of the period (Exhibit 8).
• A total of 96 due process complaints were received during 2013–14 through the dispute resolution process for infants and toddlers birth through age 2 served under IDEA, Part C. For 80 (83.3 percent) of the due process complaints received during the reporting period, the complaint was withdrawn or dismissed. For 8 (8.3 percent) of the due process complaints received, a hearing was conducted, and a written legal decision was issued. For the remaining 8 complaints (8.3 percent), a hearing was still pending as of the end of the reporting period (Exhibit 9).
• During 2013–14, a total of 168 mediation requests were received through the dispute resolution process for infants and toddlers birth through age 2 served under IDEA, Part C. A mediation was conducted before the end of the reporting period for 90 (53.6 percent) of the mediation requests received. The mediation that was held in 13 (7.7 percent) of these cases was related to a due process complaint, while the session held in 77 (45.8 percent) of these cases was not related to a due process complaint. Of the 78 mediation requests received that did not result in a mediation being held by the end of the reporting period, 76 had been withdrawn, dismissed, or otherwise ended without a mediation being held. The remaining 2 were still pending at the end of the reporting period (Exhibit 10).

xxiii
Children Ages 3 Through 5 Served Under IDEA, Part B
• In 2014, 753,697 children ages 3 through 5 in 2014 were served under Part B. Of these children, 736,170 were served in the 50 states, the District of Columbia, and Bureau of Indian Education (BIE) schools. This number represented 6.1 percent of the resident population ages 3 through 5. Between 2005 and 2014, the number of children ages 3 through 5 served under IDEA, Part B, in the states for which data were available increased from 704,087 to 753,697. This addition of 49,610 children represented a 7 percent increase in the number of children served. In 2005, the percentage of the resident population ages 3 through 5 served under IDEA, Part B, was 5.9 percent. The percentage remained at 5.9 through 2006 but fell to 5.8 percent in 2007. In 2009, the percentage reached 5.9 percent again, and it remained there until 2012, when the percentage reached 6 percent. In 2014, the percentage increased to 6.1 percent (Exhibit 11).
• In 2014, the most prevalent disability category of children ages 3 through 5 served under IDEA, Part B, was speech or language impairments (43.7 percent). The next most common disability category was developmental delay (37.0 percent), followed by autism (8.9 percent). The children ages 3 through 5 represented by the category “Other disabilities combined” accounted for the remaining 10.5 percent of children served under IDEA, Part B (Exhibit 12).
• In 2014, American Indian or Alaska Native, Native Hawaiian or Other Pacific Islander, and White children ages 3 through 5 had risk ratios above 1 (i.e., 1.4, 1.5, and 1.2, respectively). This indicates that the children in each of these groups were more likely to be served under Part B than were children ages 3 through 5 in all other racial/ethnic groups combined. Black or African American children ages 3 through 5, with a risk ratio of 1, were as likely to be served under Part B as the children ages 3 through 5 in all other racial/ethnic groups combined. Asian and Hispanic/Latino children ages 3 through 5 and children ages 3 through 5 associated with two or more racial/ethnic groups, with risk ratios of less than 1 (i.e., 0.7, 0.9, and 0.8, respectively), were less likely to be served under Part B than children ages 3 through 5 in all other racial/ethnic groups combined (Exhibit 13).
• In 2014, a total of 65.8 percent of children ages 3 through 5 served under IDEA, Part B, were in a regular early childhood program for some amount of their time in school. Of the four categories representing children who attended a regular early childhood program, the category of attending a regular early childhood program at least 10 hours per week and receiving the majority of hours of special education and related services in the regular early childhood program accounted for the largest percentage of children. Moreover, as this category accounted for 38.2 percent of all children ages 3 through 5 served under IDEA, Part B, it represented more children than any other educational environment category. A separate class accounted for 23 percent of children ages 3 through 5 served under IDEA, Part B, making it the second most prevalent educational environment. Collectively the environments of separate school, residential facility, and home (which are represented by the category “Other environments”), accounted for only 4.8 percent of the children ages 3 through 5 served under IDEA, Part B. The educational environment for the remaining students, representing only 6.4 percent of the children ages 3 through 5 served under IDEA, Part B, was a service provider location or some other location (Exhibit 14).
• In 2014, a regular early childhood program for some amount of the time spent in school was the educational environment for the majority of children ages 3 through 5 served under IDEA, Part B, in each racial/ethnic group. The category of attending a regular early childhood program at least 10 hours per week and receiving the majority of hours of special education

xxiv
and related services in the regular early childhood program accounted for the largest percentage of children who attended a regular early childhood program for every racial/ethnic group. Moreover, for every racial/ethnic group, this category accounted for a larger percentage of the children than did any other category of educational environment. In particular, this environment accounted for 48.9 percent of American Indian or Alaska Native children, 33.2 percent of Asian children, 39.2 percent of Black or African American children, 40.8 percent of Hispanic/Latino children, 35.4 percent of Native Hawaiian or Other Pacific Islander children, 36.8 percent of White children, and 37.4 percent of the children associated with two or more racial/ethnic groups. A separate class was the second most prevalent educational environment for children ages 3 through 5 served under IDEA, Part B, for each racial/ethnic group, except American Indian or Alaska Native children. A slightly larger percentage of American Indian or Alaska Native children (19.9 percent) attended a regular early childhood program for at least 10 hours per week but received the majority of hours of special education and related services in another location than attended a separate class (17.3 percent) (Exhibit 15).
• In 2013, a total of 38,633, or 94.5 percent, of the 40,869 full-time equivalent (FTE) special education teachers who were employed to provide special education and related services for children ages 3 through 5 under IDEA, Part B, were highly qualified (Exhibit 16).
• In 2013, a total of 45,081, or 95.8 percent, of the 47,039 FTE special education paraprofessionals who were employed to provide special education and related services for children ages 3 through 5 under IDEA, Part B, were qualified (Exhibit 17).
Students Ages 6 Through 21 Served Under IDEA, Part B
• In 2014, a total of 5,944,241students ages 6 through 21 were served under IDEA, Part B. Of these students, 5,825,505 were served in the 49 states for which data were available, the District of Columbia, and BIE schools. This number represented 8.7 percent of the resident population ages 6 through 21.The total number of students ages 6 through 21 served under IDEA, Part B, in 2005 was 6,109,569. In each year between 2005 through 2011, the number of students served was less than in the previous year. However, more students were served under Part B in 2012 and in each subsequent year through 2014. In 2005, 9 percent of the resident population ages 6 through 21 were served under Part B. Between 2005 and 2010, the percentage of the population served gradually decreased to 8.4 percent. The percentage served remained at 8.4 percent until 2013, when it increased to 8.5 percent. In 2014, the percentage increased to 8.7 percent (Exhibit 18).
• The percentage of the resident population ages 6 through 21 served under IDEA, Part B, in 2005 was 9.0 percent. Thereafter, the percentage stayed the same or slightly decreased, reaching a low of 8.4 percent in 2010. The percentage remained at 8.4 until 2013 when it increased to 8.5. In 2014, the percentage increased to 8.7. Between 2005 and 2011, the percentage of the population ages 6 through 11 served under IDEA, Part B, decreased gradually from 11.5 percent to 10.6 percent. The percentage increased in each year thereafter and reached 11.1 percent in 2014. The percentage of the population ages 12 through 17 served under Part B decreased gradually from 11.5 percent to 10.8 percent between 2005 and 2010, where it stayed until 2014 when the percentage reached 11 percent. The percentage of the population ages 18 through 21 served under Part B, was 1.9 percent in each year from 2005 through 2008, and 2 percent in each year from 2009 through 2014 (Exhibit 19).

xxv
• In 2014, the most prevalent disability category of students ages 6 through 21 served under IDEA, Part B, was specific learning disabilities (39.2 percent). The next most common disability category was speech or language impairments (17.6 percent), followed by other health impairments (14.4 percent), autism (8.6 percent), intellectual disabilities (7.0 percent), and emotional disturbance (5.9 percent). Students ages 6 through 21 in “Other disabilities combined” accounted for the remaining 7.3 percent of students ages 6 through 21 served under IDEA, Part B (Exhibit 20).
• The percentage of the resident population ages 6 through 21 served under IDEA, Part B, reported under each of three disability categories changed by more than two-tenths of a percentage point between 2005 and 2014. The percentages of the population reported under autism and other health impairments both increased by 0.5 of a percentage point and the percentage of the population reported under specific learning disabilities decreased by 0.7 of a percentage point (Exhibit 21).
• Between 2005 and 2014, the percentage of the resident population ages 6 through 21 served under IDEA, Part B, that was reported under the category of autism increased gradually from 0.3 percent to 0.8 percent. Between 2005 and 2014, the percentages of the populations ages 6 through 11, 12 through 17, and 18 through 21 served under IDEA, Part B, that were reported under the category of autism all increased. Specifically, the percentages of these three age groups that were reported under the category of autism were 124 percent, 213 percent, and 236 percent larger in 2014 than in 2005, respectively (Exhibit 22).
• From 2005 through 2014, the percentage of the resident population ages 6 through 21 served under IDEA, Part B, that was reported under the category of other health impairments increased gradually from 0.8 percent to 1.3 percent. The percentages of the populations ages 6 through 11, 12 through 17, and 18 through 21 served under IDEA, Part B, that were reported under the category of other health impairments were 43 percent, 55 percent, and 95 percent larger in 2014 than in 2005, respectively (Exhibit 23).
• From 2005 through 2014, the percentage of the resident population ages 6 through 21 served under IDEA, Part B, that was reported under the category of specific learning disabilities decreased from 4.1 percent to 3.4 percent. The percentages of the populations ages 6 through 11, 12 through 17, and 18 through 21 served under IDEA, Part B, that were reported under the category of specific learning disabilities were 16 percent, 16 percent, and 8 percent smaller in 2014 than in 2005, respectively (Exhibit 24).
• In 2014, American Indian or Alaska Native, Black or African American, and Native Hawaiian or Other Pacific Islander children ages 6 through 21 had risk ratios above 1 (i.e., 1.7, 1.4, and 1.6, respectively). This indicates that the children in each group were more likely to be served under Part B than were the children ages 6 through 21 in all other racial/ethnic groups combined. Asian and White children ages 6 through 21 as well as children ages 6 through 21 associated with two or more racial/ethnic groups, with risk ratios of less than 1 (i.e., 0.5, 0.9, and 0.9, respectively), were less likely to be served under Part B than were the children ages 6 through 21 in all other racial/ethnic groups combined. Hispanic/Latino children ages 6 through 21, with a risk ratio of 1 were as likely to be served under Part B as children ages 6 through 21 in all other racial/ethnic groups combined (Exhibit 25).

xxvi
• In 2014, American Indian or Alaska Native students, Black or African American students, and Native Hawaiian or Other Pacific Islander students ages 6 through 21 were more likely to be served under IDEA, Part B, than were students ages 6 through 21 in all other racial/ethnic groups combined (1.68, 1.41, and 1.59, respectively). Asian students, White students, and students associated with two or more races ages 6 through 21 were less likely to be served under IDEA, Part B, than were students ages 6 through 21 in all other racial/ethnic groups combined (0.47, 0.90, and 0.87, respectively). Hispanic/Latino students were about as likely to be served under IDEA, Part B, as were students ages 6 through 21 in all other racial/ethnic groups combined (1.01). American Indian or Alaska Native students ages 6 through 21 were 4.09 times more likely to be served under IDEA, Part B, for developmental delay than students ages 6 through 21 in all other racial/ethnic groups combined. The risk ratio for American Indian or Alaska Native students ages 6 through 21 was larger than the risk ratio for the students ages 6 through 21 in all other racial/ethnic groups combined for all disability categories except autism (0.94). Asian students ages 6 through 21 were 1.11 and 1.17 times more likely to be served under IDEA, Part B, for autism and hearing impairments, respectively, than were students ages 6 through 21 in all other racial/ethnic groups combined. The risk ratio for Asian students ages 6 through 21 was smaller than the risk ratio for the students ages 6 through 21 in all other racial/ethnic groups combined for each of the other disability categories. Black or African American students ages 6 through 21 were 2.08 and 2.22 times more likely to be served under IDEA, Part B, for emotional disturbance and intellectual disabilities, respectively, than were the students ages 6 through 21 in all other racial/ethnic groups combined. The risk ratio for Black or African American students ages 6 through 21 was larger than the risk ratio for the students ages 6 through 21 in all other racial/ethnic groups combined for every disability category except autism (0.99), deaf-blindness (0.76), and orthopedic impairments (0.86). Hispanic or Latino students ages 6 through 21 were 1.04, 1.35, 1.21, 1.31, and 1.08 times more likely to be served under IDEA, Part B, for deaf-blindness, hearing impairments, orthopedic impairments, specific learning disabilities, and speech and language impairments, respectively, than were students ages 6 through 21 in all other racial/ethnic groups combined. Native Hawaiian or Other Pacific Islander students ages 6 through 21 were 3.4, 2.35, and 2.71 times more likely to be served under IDEA, Part B, for deaf-blindness, developmental delay, and hearing impairments, respectively, than were students ages 6 through 21 in all other racial/ethnic groups combined. The risk ratio for Native Hawaiian or Other Pacific Islander students ages 6 through 21 was larger than the risk ratio for the students ages 6 through 21 in all other racial/ethnic groups combined for every other disability category as well. White students ages 6 through 21 were 1.16, 1.1, 1.11, 1.28, and 1.29 times more likely to be served under IDEA, Part B, for autism, deaf-blindness, multiple disabilities, other health impairments, and traumatic brain injury, respectively, than were students ages 6 through 21 in all other racial/ethnic groups combined. Students associated with two or more races ages 6 through 21 were 1.24 and 1.19 times more likely to be served under IDEA, Part B, for developmental delay and emotional disturbance, respectively, than were students ages 6 through 21 in all other racial/ethnic groups combined. The risk ratio for students associated with two or more races ages 6 through 21 was smaller than the risk ratio for the students ages 6 through 21 in all other racial/ethnic groups combined for every other disability category (Exhibit 26).
• For the students ages 6 through 21 served under IDEA, Part B, in 2014, specific learning disabilities was the most prevalent disability category for every racial/ethnic group. In particular, this disability category accounted for 45.4 percent of American Indian or Alaska Native students, 25.7 percent of Asian students, 41.1 percent of Black or African American students, 47.4 percent of Hispanic/Latino students, 50.7 percent of Native Hawaiian or Other Pacific Islander students, 35 percent of White students, and 34.4 percent of the children

xxvii
associated with two or more racial/ethnic groups. Speech or language impairments was the second or third most prevalent category for students ages 6 through 21 in every racial/ethnic group. The students served in this disability category accounted for 14.7 percent of American Indian or Alaska Native students, 25.4 percent of Asian students, 13.4 percent of Black or African American students, 19 percent of Hispanic/Latino students, 10.4 percent of Native Hawaiian or Other Pacific Islander students, 18.3 percent of White students, and 18.1 percent of the students associated with two or more racial/ethnic groups (Exhibit 27).
• In 2014, a total of 94.7 percent of students ages 6 through 21 served under IDEA, Part B, were educated in regular classrooms for at least some portion of the school day. More than 60 percent of students ages 6 through 21 served under IDEA, Part B (62.6 percent), were educated inside the regular class 80% or more of the day. A total of 18.6 percent of students ages 6 through 21 served under IDEA, Part B, were educated inside the regular class no more than 79% of the day and no less than 40% of the day, and 13.5 percent were educated inside the regular class less than 40% of the day. Only 5.3 percent of students ages 6 through 21 served under IDEA, Part B, were educated outside of the regular classroom in “Other environments” (Exhibit 28).
• From 2005 through 2014, the percentage of students ages 6 through 21 served under IDEA, Part B, educated inside the regular class 80% or more of the day increased from 53.6 percent to 62.6 percent. The percentage of students ages 6 through 21 served under IDEA, Part B, educated inside the regular class no more than 79% of the day and no less than 40% of the day decreased from 25.8 percent in 2005 to 18.6 percent in 2014. Similarly, the percentage of these students educated inside the regular class less than 40% of the day decreased from 16.6 percent to 13.5 percent between these years. The percentage of students ages 6 through 21 served under IDEA, Part B, educated in “Other environments” increased from 4 percent in 2005 to 5.3 percent in 2014. However, it had also accounted for as much as 5.3 percent in 2007 and 2009 (Exhibit 29).
• In 2014, the percentage of students ages 6 through 21 served under IDEA, Part B, in each educational environment varied by disability category. More than 8 in 10 students reported under the category of speech or language impairments (86.8 percent) were educated inside the regular class 80% or more of the day. Only 16.9 percent of students reported under the category of intellectual disabilities and 13.4 percent of students reported under the category of multiple disabilities were educated inside the regular class 80% or more of the day. Almost one-half of students reported under the category of intellectual disabilities (49.2 percent) and students reported under the category of multiple disabilities (46.0 percent) were educated inside the regular class less than 40% of the day. In 2014, larger percentages of students reported under the categories of deaf-blindness (29.0 percent) and multiple disabilities (24.3 percent) than students reported under other disability categories were educated in “Other environments” (Exhibit 30).
• In 2014 for each racial/ethnic group, the largest percentage of students ages 6 through 21 served under IDEA, Part B, was educated inside the regular class 80% or more of the day. The students who were educated inside the regular class 80% or more of the day accounted for at least 50 percent of the students in each of the racial/ethnic groups. The percentages of students in the racial/ethnic groups who were educated inside the regular class 80% or more of the day ranged from 54.9 percent to 65.3 percent. The category inside the regular class no more than 79% of the day and no less than 40% of the day accounted for between 16.5 and 26.3 percent of the students within each racial/ethnic group. In contrast, less than 20 percent of the students within each racial/ethnic group, except for Asian students (21.0 percent), were

xxviii
educated inside the regular class less than 40% of the day. “Other environments” accounted for less than 6 percent of the students within each racial/ethnic group (Exhibit 31).
• In school year 2013–14, between 41.3 and 48.5 percent of students served under IDEA, Part B, in each of grades 3 through 8 and high school participated in a regular assessment based on grade-level academic achievement standards with accommodations in math. Between 21 and 28.4 percent of students served under IDEA, Part B, in each of grades 3 through 8 participated in a regular assessment based on grade-level academic achievement standards without accommodations in math. In contrast, 37.9 percent of students served under IDEA, Part B, in high school participated in a regular assessment based on grade-level academic achievement standards without accommodations in math. Between 10.5 and 11.8 percent of students served under IDEA, Part B, in each of grades 3 through 8 participated in a field test of a regular assessment based on grade-level academic achievement standards in math. In contrast, only 1 percent of students served under IDEA, Part B, in high school participated in a field test of a regular assessment based on grade-level academic achievement standards in math. Of all students who participated in some type of alternate assessment in math in school year 2013–14, larger percentages of these students in each of grades 3 through 8 and high school took an alternate assessment based on alternate academic achievement standards than the other three types of alternate tests (Exhibit 32).
• In school year 2013–14, between 40.8 and 45.3 percent of students served under IDEA, Part B, in each of grades 3 through 8 and high school participated in a regular assessment based on grade-level academic achievement standards with accommodations in reading. Between 24.2 and 37.1 percent of students served under IDEA, Part B, in each of grades 3 through 8 and high school participated in a regular assessment based on grade-level academic achievement standards without accommodations in reading. Between 10.5 and 11.8 percent of students served under IDEA, Part B, in each of grades 3 through 8 participated in a field test of a regular assessment based on grade-level academic achievement standards in reading. In contrast, only 0.9 percent of students served under IDEA, Part B, in high school participated in a field test of a regular assessment based on grade-level academic achievement standards in reading. Of the students in each of grades 3 through 8 and high school who participated in some type of alternate assessment in reading in school year 2013–14, a larger percentage took an alternate assessment based on alternate academic achievement standards than the other three types of alternate tests (Exhibit 32).
• No more than 4.26 percent of students served under IDEA, Part B, who were expected to take a math assessment in each of grades 3 through 8 in school year 2013–14 were classified as nonparticipants. Similarly, no more than 3.94 percent of students served under IDEA, Part B, who were expected to take a reading assessment in each of grades 3 through 8 in school year 2013–14 were classified as nonparticipants. Larger percentages of the students served under IDEA, Part B, in high school in school year 2013–14 were classified as nonparticipants for both the math assessment (6.14 percent) and the reading assessment (6.29 percent). Of the three nonparticipant categories, students who did not take any assessment accounted for more of the nonparticipants in each grade in both math and reading. However, the percentage only exceeded 4 percent for high school students expected to be assessed in math (5.20 percent) and high school students expected to be assessed in reading (4.90 percent) (Exhibit 33).
• In school year 2013–14, between 47 and 48 of the 59 jurisdictions (i.e., the 50 states, the District of Columbia, Puerto Rico, the four outlying areas, and the three freely associated states) administered a regular assessment based on grade-level academic achievement standards in math to some students served under IDEA, Part B, in each of grades 3 through 8

xxix
and high school and had non-suppressed data. The median percentage of students served under IDEA, Part B, in grade 3, grade 4, and grade 5 who were found to be proficient with these math tests was 36.1 percent, 34.4 percent and 27.4 percent, respectively. The median percentage of students in grade 6 through high school who were found to be proficient with these tests was in a range from 16.8 percent to 20.1 percent. An alternate assessment based on grade-level academic achievement standards for math was not administered by any jurisdiction to students served under IDEA, Part B, in each of grades 3 through 8 and high school. An alternate assessment based on modified academic achievement standards for math was administered to some students served under IDEA, Part B, in each of grades 3 through 8 and high school by 8 to 11 jurisdictions. The median percentage of students served under IDEA, Part B, in each of grades 3 through 7 who were found to be proficient with these math tests was in a range from 46.5 percent to 56.8 percent. The median percentage of students in each of grade 8 and high school who were found to be proficient with these tests was 37.5 percent and 35.7 percent, respectively. Non-suppressed data were available for between 50 and 52 jurisdictions that administered an alternate assessment based on alternate academic achievement standards for math to some students served under IDEA, Part B, in each of grades 3 through 8 and high school. The median percentage of students served under IDEA, Part B, in each grade who were found to be proficient with these math tests was in a range from 70.2 percent to 72.6 percent (Exhibit 34).
• In school year 2013–14, between 47 and 49 of the 59 jurisdictions (i.e., the 50 states, the District of Columbia, Puerto Rico, the four outlying areas, and the three freely associated states) administered a regular assessment based on grade-level academic achievement standards in reading to some students served under IDEA, Part B, in each of grades 3 through 8 and high school and had non-suppressed data. The median percentages of these students who were found to be proficient with these reading tests ranged from 23.1 percent to 32.1 percent. An alternate assessment based on grade-level academic achievement standards for reading was administered by one jurisdiction to some students served under IDEA, Part B, in each of grades 3 through 8 and by no jurisdiction to students served under IDEA, Part B, in high school. An alternate assessment based on modified academic achievement standards for reading was administered by 7 to 11 jurisdictions to some students served under IDEA, Part B, in each of grades 3 through 8 and high school. The median percentage of students served under IDEA, Part B, in each grade except grade 6 who were found to be proficient with these reading tests was in a range from 54.5 percent to 62.2 percent. The median percentage of students served under IDEA, Part B, in grade 6 who were found to be proficient with these reading tests was 43.4 percent. Non-suppressed data were available for 48 to 53 jurisdictions that administered an alternate assessment based on alternate academic achievement standards for reading to some students served under IDEA, Part B, in each of grades 3 through 8 and high school. The median percentage of students served under IDEA, Part B, in each grade who were found to be proficient with these reading tests was in a range from 71 percent to 75.7 percent (Exhibit 34).
• Of the seven exit reason categories, graduated with a regular high school diploma accounted for the largest percentage of students ages 14 through 21 who exited special education in 2013–14 (42.1 percent), followed by moved, known to be continuing in education (27.2 percent) and dropped out (11.8 percent) (Exhibit 35).
• In 2013–14, a total of 66.1 percent of the students ages 14 through 21 who exited IDEA, Part B, and school graduated with a regular high school diploma; an additional 18.5 percent dropped out. From 2004–05 through 2013–14, the percentage of students who exited special education and school by having graduated with a regular high school diploma increased from

xxx
54.4 percent to 66.1 percent. From 2004–05 through 2013–14, the percentage of students who exited special education and school by having dropped out decreased from 28.3 percent to 18.5 percent (Exhibit 36).
• From 2004–05 through 2013–14, the graduation percentage increased for students who exited IDEA, Part B, and school in all disability categories. Increases of at least 10 percentage points were associated with the following five disability categories: emotional disturbance (14.6 percentage points), speech or language impairments (12.9 percentage points), specific learning disabilities (11.2 percentage points), other health impairments (10.3 percent points), and autism (10.0 percentage points). In every year from 2004–05 through 2013–14, except 2006–07, the disability category of visual impairments was associated with the largest graduation percentage. The students reported under the category of intellectual disabilities had the smallest graduation percentages from 2004–05 through 2013–14 (Exhibit 37).
• From 2004–05 through 2013–14, the dropout percentage decreased for students in each disability category who exited IDEA, Part B, and school. The decreases were most notable for students reported under the categories of emotional disturbance (-13.0 percentage points) and speech or language impairments (-11.8 percentage points). In each year from 2004–05 through 2013–14, a larger percentage of the students reported under the category of emotional disturbance exited special education and school by dropping out. In fact in each year, the dropout percentage was no less than 35 percent, which was substantially larger than the dropout percentage for any other disability category (Exhibit 38).
• In 2013, a total of 355,570, or 93.9 percent, of the 378,614 FTE special education teachers who provided special education and related services for students ages 6 through 21 under IDEA, Part B, were highly qualified (Exhibit 39).
• In 2013, a total of 400,040, or 96 percent, of the 416,798 FTE special education paraprofessionals who provided special education and related services for students ages 6 through 21 under IDEA, Part B, were qualified (Exhibit 40).
Children and Students Ages 3 Through 21 Served Under IDEA, Part B
• In 2013, a total of 98.3 percent of all FTE personnel who were employed to provide related services for children and students ages 3 through 21 served under IDEA, Part B, were fully certified. Ten of the 11 categories of FTE related services personnel had full certification percentages of 95 percent or more. Interpreters had the smallest full certification percentage (92.2 percent), while nearly all psychologists (99.1 percent) were fully certified (Exhibit 41).
• During school year 2013–14, 9,296 children and students ages 3 through 21 served under IDEA, Part B, in the states for which data were available were removed unilaterally to an interim alternative educational setting by school personnel for offenses involving drugs, weapons, or serious bodily injury. Given that 6,580,819 children and students ages 3 through 21 were served under Part B in 2013, in the states for which data were available, this type of action occurred with only 14 children and students for every 10,000 children and students who were served under Part B in 2013. Only 490 children and students ages 3 through 21 served under IDEA, Part B, or 1 for every 10,000 children and students served in 2013, in the states for which data were available were removed to an interim alternative educational setting by a hearing officer for likely injury to themselves or others in school year 2013–14. There were 52,554 children and students ages 3 through 21 served under IDEA, Part B, or 80 for every 10,000 children and students served in 2013, in the states for which data were

xxxi
available who received out-of-school suspensions or expulsions for more than 10 cumulative days in school year 2013–14. There were 25,225 children and students ages 3 through 21 served under IDEA, Part B, or 38 for every 10,000 children and students served in 2013, in the states for which data were available who received in-school suspensions for more than 10 cumulative days in school year 2013–14 (Exhibit 42).
• For every 10,000 children and students ages 3 through 21 served under IDEA, Part B, reported under the category of emotional disturbance in 2013, there were 50 children and students removed unilaterally to an interim alternative educational setting by school personnel for offenses involving drugs, weapons, or serious bodily during school year 2013–14. The ratio for the children and students reported under each of the other disability categories was less than 22 per 10,000 children and students served. Without regard for disability category, for every 10,000 children and students ages 3 through 21 served under IDEA, Part B, in 2013, no more than 4 children and students were removed by a hearing officer for likely injury during school year 2013–14. For every 10,000 children and students ages 3 through 21 served under IDEA, Part B, reported under the category of emotional disturbance in 2013, there were 357 children and students who received out-of-school suspensions or expulsions for more than 10 cumulative days during school year 2013–14. The ratio for the children and students reported under each of the other disability categories was less than 140 per 10,000 children and students. For every 10,000 children and students ages 3 through 21 served under IDEA, Part B, reported under the category of emotional disturbance in 2013, there were 120 children and students who received in-school suspensions for more than 10 cumulative days during school year 2013–14. The ratio for the children and students reported under each of the other disability categories was less than 71 per 10,000 children and students (Exhibit 43).
• During 2013–14, a total of 4,997 written, signed complaints were received through the dispute resolution process for children and students ages 3 through 21 served under IDEA, Part B. A report was issued for 3,043 (60.9 percent) of the complaints, while 1,845 (36.9 percent) of the complaints were withdrawn or dismissed. A total of 109 (2.2 percent) of the complaints that were received during the 2013–14 reporting period were pending or unresolved by the end of the period (Exhibit 44).
• A total of 18,011 due process complaints were received during 2013–14 through the dispute resolution process for children and students served under IDEA, Part B. For 11,222 (62.3 percent) of the due process complaints received during the 2013–14 reporting period, a resolution was achieved without a hearing. For 2,813 (15.6 percent) of the due process complaints received, a hearing was conducted, and a written legal decision was issued. For 3,976 (22.1 percent) of the due process complaints received, a resolution was still pending at the end of the reporting period (Exhibit 45).
• During 2013–14, a total of 9,688 mediation requests were received through the dispute resolution process for children and students served under IDEA, Part B. For 3,425 (35.4 percent) of the mediation requests received, a mediation related to a due process complaint was conducted. For 2,610 (26.9 percent) of the mediation requests received, a mediation that was not related to a due process complaint was conducted. For 801 requests (8.3 percent), a mediation session was still pending as of the end of the 2013–14 reporting period. The remaining 2,852 mediation requests (29.4 percent) were withdrawn or otherwise not to be held by the end of the reporting period (Exhibit 46).

xxxii
A total of 153,113 or 2.3 percent of the 6,688,361 children and students ages 3 through 21 served under Part B in 2014 by the states for which data were available, the District of Columbia, Puerto Rico, three outlying areas, and the three freely associated states received CEIS in school year(s) 2011–12, 2012–13, or 2013–14 (Exhibit 47).

1
Data Sources Used in This Report
This 38th Annual Report to Congress, 2016 contains data obtained from the U.S. Department of Education’s (Department’s) EDFacts Data Warehouse (EDW). Other data sources used in this report include the Department’s Institute of Education Sciences (IES), the Office of Special Education Program’s (OSEP’s) Regional Resource Center Program, and the U.S. Census Bureau. Brief descriptions of these data sources1 follow below. Further information about each data source can be found at the website referenced at the end of each description. Unless otherwise specified, each URL provided below was accessed in fall 2015.
EDFacts Data Warehouse
Data Collections
The text and exhibits contained in the 38th Annual Report to Congress, 2016 were developed primarily from data in the Department’s EDFacts Data Warehouse (EDW). EDW is a repository for performance data collected across offices in the Department. It contains all of the data states are required to collect under section 618 of the Individuals with Disabilities Education Act (IDEA). The state data that are in EDW are obtained each year through a set of data collections that were approved by the Office of Management and Budget (OMB). Each data collection concerns a distinct domain of information. The data collections for the data that are primarily featured in this report concern:
• The number of infants and toddlers served under Part C of IDEA and the number of children
and students served under Part B of IDEA,
• The settings in which Part C program services and environments in which Part B education services are received,
• The exiting status of infants and toddlers from Part C and the reasons students exit from Part B,
• Part C and Part B legal disputes and their resolution status,
• Participation in and performance on state assessments in math and reading by students served under Part B,
• The personnel employed to provide special education and related services for children and students under Part B, and
• Disciplinary actions for Part B program participants.
1 When a data source referenced in the report is a website, the accompanying access date refers to the time when the data were
originally gathered from EDW for preparing the exhibits or summaries that appear herein.

2
In addition, this report presents some data on IDEA, Part B maintenance of effort (MOE) reductions and coordinated early intervening services (CEIS), which are also maintained in EDW.
The chart below shows the collection and reporting schedule for the most current data regarding
each of the domains presented in this report.
Program Data collection domain Collection date Date due to OSEP
Part C Child count State-designated date between Oct. 1, 2014, and Dec. 1, 2014
April 1, 2015
Program settings State-designated date between Oct. 1, 2014, and Dec. 1, 2014
April 1, 2015
Exiting Cumulative for state-determined 12-month reporting period, 2013–14
Nov. 5, 2014
Dispute resolution Cumulative for July 1, 2013–June 30, 2014
Nov. 5, 2014
Part B Child count State-designated date between Oct. 1, 2014, and Dec. 1, 2014
April 1, 2015
Educational environments State-designated date between Oct. 1, 2014, and Dec. 1, 2014
April 1, 2015
Assessment State determined testing date for school year 2013–14
Dec. 17, 2014
Exiting Cumulative for July 1, 2013–June 30, 2014
Nov. 5, 2014
Personnel State-designated date between Oct. 1, 2013, and Dec. 1, 2013
Nov. 5, 2014
Discipline Cumulative for school year 2013–14 Nov. 5, 2014 Dispute resolution Cumulative for
July 1, 2013–June 30, 2014 Nov. 5, 2014
MOE reduction and CEIS FFYs 2011 and 2012 and school years 2011–12, 2012–13, and 2013–14
May 7, 2015
As shown in the chart, the data collections regarding the domains related to Part C child count
and program settings, and Part B child count, educational environments, assessment, and personnel concern measurements at a particular point in time. The data collected under each of these domains concern a specific group of the Part C or Part B program participants. Except in the case of the Part B assessment data, the group is defined in terms of the program participants’ ages on the date that the state collects the data. The group of participants regarding the Part B assessment data collection is defined as all students with individualized education programs who are enrolled in grades 3 through 8 and the high school grade in which the assessment is administered by the state on the testing date.

3
The data collections for Part C and Part B exits and Part B disciplinary actions are also associated with a specific group defined by the participants’ ages, but they are cumulative as they concern what happens to the group during a period of time, either a school year or a 12-month period defined by a starting date and ending date. The data collections for Part C and Part B dispute resolution are also cumulative as they concern any complaint that was made during a 12-month period, defined by a starting date and ending date. The complaints concern all program participants during that time period as opposed to a specific group of participants defined by the participants’ ages or grades.
Most of Part C and Part B data presented in this report are discussed in terms of the participants’
ages used to identify the group being represented. For example, an exhibit may present data for infants and toddlers birth through age 2, children ages 3 through 5, or students ages 6 through 21. The titles of exhibits identify the group(s) represented by the data. In addition, the titles of exhibits are worded to indicate the point in time or time period represented by the corresponding data collections. Specifically, the exhibits contain data that were collected by states at a particular point in time (e.g., Part C child count and program settings) have titles that refer to fall of the particular year or span of years considered. Similarly, the exhibits that contain data collected over the course of a school year (e.g., Part B discipline) or during a particular 12-month period (e.g., Part B exiting) have titles that indicate the school year(s) or the 12-month period(s) represented (e.g., 2013–14).
Unlike the other data derived from EDW that are presented in this report, most of the IDEA,
Part B, MOE reduction and CEIS data do not specifically concern and cannot be related to individual participants in the Part C or Part B programs. In general, these data provide information on the percentage of the available reduction taken by local education agencies (LEAs) and educational service agencies (ESAs) pursuant to IDEA section 613(a)(2)(C) and the use of IDEA, Part B funds to provide CEIS to children who are not currently identified as needing special education and related services, but who need additional academic and behavioral support to succeed in a general education environment. Since the focus of this report has always been, and continues to be, to provide a description of the participants in the IDEA program, some of the IDEA, Part B, MOE reduction and CEIS data, with one exception, are presented in Appendix C. The exception is that prior receipt of CEIS is examined as a characteristic of the Part B participants. It should be noted that like the Part B assessment data, these data are collected in terms of grades (i.e., children in kindergarten through grade 12), not age.
The most recent data examined in the 38th Annual Report to Congress, 2016 were submitted
directly by all states to EDW through the Education Data Exchange Network (EDEN), which was developed as part of the Department’s EDFacts initiative to consolidate the collection of kindergarten through grade 12 education program information about states, districts, and schools.

4
All Part C, Part B, MOE reduction, and CEIS data in this report were tabulated from data files maintained in EDW, which is not accessible to the public, rather than from published reports. Consequently, EDW is cited as the source for these data in the notes that accompany the exhibits. Given that these data are based on data collection forms that were approved by the OMB, the citations also provide the OMB approval number for each of the forms.
Many of the exhibits in this report present only Part B or Part C data for the most current
reporting period considered (i.e., fall 2014; school year 2013–14). However, some exhibits present data for multiple years. The data presented for the most current reporting period were accessed from files prepared as of fall 2015. The data for fall 2013 and school year 2012–13 were prepared as of fall 2014 and the data for fall 2012 and for school year 2011–12 were prepared as of fall 2013. The data for previous time periods were derived from files that were prepared at different points in time, but in no instance less than one year after the date of the original submission by the state to ensure that the state had a chance to update the data. The use of files with updated data allowed for the possibility that problematic data in the files originally submitted by states that may not have had a notable impact on the statistics for the nation as a whole, but might have incorrectly distinguished a state, were detected and corrected. The source notes for the exhibits in this report indicate when each data file used was accessed and provide the address for the website on which a set of Excel files containing all of the data is available. Along with the actual data records, each Excel file presents the date on which the file was created and, if appropriate, the dates on which the data were revised and updated. This approach ensures that the data presented in the report are available, and the source notes present the necessary information about the data as succinctly as possible. Additional tables and data related to the Part C and Part B data collections are also available at http://www2.ed.gov/programs/osepidea/618-data/index.html.
Many of the data categories associated with the domains of information considered in this report
comprise a set of subcategories. Some of these subcategories require detailed descriptors.2 These descriptors are italicized within exhibit titles, text, and notes to clarify that the reference is to an actual subcategory or classification.
Changes in Data Categories and Subcategories
The most current Part C and Part B data examined in this report were collected using the same categories and corresponding subcategories that were used to collect the most current data examined in 2 In regard to the subcategories of data for Part B, please note that Rosa’s Law (P.L. 111-256, enacted on Oct. 5, 2010), amended
IDEA and other federal laws to replace the term “mental retardation” with the term “intellectual disabilities.” Therefore, the U.S. Department of Education refers to the disability subcategory “intellectual disabilities” rather than “mental retardation” in this report.

5
the 37th Annual Report to Congress, 2015 ̧with one exception: the categories used to account for the types of assessments in math and reading that were administered by the states needed to be modified to accommodate the fact that a number of states field tested a version of a regular assessment based on grade-level academic achievement standards, a version of an alternate assessment based on alternate academic achievement standards, or both.
Institute of Education Sciences
The Institute of Education Sciences (IES), established under the Education Sciences Reform Act of 2002, is the research arm of the Department. The work of IES is carried out through its four centers: the National Center for Education Research, the National Center for Education Statistics, the National Center for Education Evaluation and Regional Assistance, and the National Center for Special Education Research. IES sponsors research nationwide to expand knowledge of what works for students from preschool through postsecondary education, including interventions for special education students and young children and their families receiving early intervention services. It collects and analyzes statistics on the condition of education, conducts long-term longitudinal studies and surveys, supports international assessments, and carries out the National Assessment of Educational Progress.
IES data in this report were obtained from IES published reports and an IES database on funded
research grants. More information about IES is available at http://ies.ed.gov. U.S. Census Bureau
Each year, the Population Estimates Program of the U.S. Census Bureau publishes estimates of the resident population for each state and county. These estimates exclude (1) residents of outlying areas of American Samoa, Guam, the Northern Mariana Islands, and the Virgin Islands, as well as the freely associated states of the Federated States of Micronesia, the Republic of Palau, and the Republic of the Marshall Islands; (2) members of the Armed Forces on active duty stationed outside the United States; (3) military dependents living abroad; and (4) other U.S. citizens living abroad. The population estimates are produced by age, sex, race, and Hispanic origin. The state population estimates are solely the sum of the county population estimates. The reference date for county estimates is July 1.
Estimates are used as follows: (1) in determining federal funding allocations, (2) in calculating
percentages for vital rates and per capita time series, (3) as survey controls, and (4) in monitoring recent demographic changes. More information about how population estimates are used and produced is available at: http://www.census.gov/popest/data/intercensal/index.html.

6
In this report, annual resident population estimates for the 50 states and the District of Columbia were used to determine the percentages of the resident population served under IDEA, Part C and Part B, and to develop comparisons and conduct data analyses. When available, annual resident population estimates for Puerto Rico were also used.
As the race/ethnicity categories used by the Census Bureau are not the same as those that were
used by the Department, the following set of rules was used to allocate the resident population data from the Census into the seven categories of race/ethnicity used by the Department. The populations for all of the Census categories referencing “Hispanic,” regardless of race, were combined and assigned to the category “Hispanic/Latino.” The populations for the Census categories of “White alone not Hispanic,” “Black alone not Hispanic,” “American Indian or Alaska Native alone not Hispanic,” “Asian alone not Hispanic,” “Native Hawaiian and Other Pacific Islander alone not Hispanic,” and “Two or more races, not Hispanic” were assigned to the categories “White,” “Black or African American,” “American Indian or Alaska Native,” “Asian,” “Native Hawaiian or Other Pacific Islander,” and “Two or more races,” respectively.
Specific population data estimates used in this report are available at
http://www2.ed.gov/about/reports/annual/osep/index.html. More information about the U.S. Census Bureau is available at http://www.census.gov.

Section I
Summary and Analysis of IDEA Section 618 Data at the National Level


9
Infants and Toddlers Served Under IDEA, Part C
The Education of the Handicapped Act Amendments of 1986 established the Early Intervention Program for Infants and Toddlers with Disabilities under Part H (now Part C) of IDEA. Providing early intervention services to children with disabilities as early as birth through age 2 and their families helps to improve child developmental outcomes that are critical to educational success. Early intervention services are designed to identify and meet children’s needs in five developmental areas: physical development, cognitive development, communication development, social or emotional development, and adaptive development. The early intervention program assists states in developing and implementing a statewide, comprehensive, coordinated, and multidisciplinary interagency system to make early intervention services available for all infants and toddlers with disabilities and their families.
An infant or toddler with a disability is defined as an individual under 3 years of age who needs
early intervention services because the individual is experiencing a developmental delay in one or more of the five developmental areas listed above or has a diagnosed physical or mental condition that has a high probability of resulting in developmental delay [see IDEA, section 632(5)(A)]. States have the authority to define the level of developmental delay needed for Part C eligibility [see IDEA, section 635(a)(1)]. States also have the authority to define other Part C eligibility criteria. For example, at a state’s discretion, infants or toddlers with a disability may also include (1) individuals younger than 3 years of age who would be at risk of having substantial developmental delay if they did not receive early intervention services, and (2) children 3 years of age and older with disabilities who are eligible to receive preschool services under IDEA Part B, Section 619 until such children are eligible to enter kindergarten3 or an earlier timeframe, consistent with 34 CFR §303.211 [see IDEA, section 632(5)(B)]. The decisions that states make regarding these options may explain some of the differences found between states with respect to their Part C data.
The Part C exhibits that follow present data for the infants and toddlers with disabilities who were
served in the 50 states and the District of Columbia (DC). Where indicated in the notes, the exhibits include data from Puerto Rico (PR) and the four outlying areas of American Samoa, Guam, the Northern Mariana Islands, and the Virgin Islands that receive Part C funds. Data about infants and toddlers with disabilities that are contacted or identified through tribal entities that receive Part C funds through the
3 Most of the Part C data concern infants and toddlers birth through age 2 as Part C is designed primarily to serve them.
Nevertheless, a small number of children age 3 and older do participate in Part C. For example in 2012, 1,047 children age 3 or older participated in Part C.

10
Bureau of Indian Education (BIE),4 for which reporting is required by the U.S. Department of the Interior to the U.S. Department of Education, are not represented in these exhibits. Numbers and Percentages of Infants and Toddlers Birth Through Age 2 Served Under IDEA, Part C
How many infants and toddlers birth through age 2 received early intervention services, and how has the percentage of infants and toddlers birth through age 2 served under IDEA, Part C, changed over time?
Exhibit 1. Number of infants and toddlers birth through age 2 served under IDEA, Part C, and percentage of the population served, by year: Fall 2005 through fall 2014
Year
Total served under Part C (birth through age 2)
Resident population birth through age 2 in the 50 states and DC
Percentagea of resident population birth through age 2
served under Part C in the 50 states and DC
In the 50 states, DC, PR, and the
four outlying areas In the 50 states
and DC 2005 299,048 294,714 11,944,057 2.5 2006 304,510 299,848 12,001,981 2.5 2007 321,925 316,761 12,123,691 2.6 2008 342,985 337,706 12,237,637 2.8 2009 348,604 343,203 12,185,386 2.8 2010 342,821 337,185 11,990,542 2.8 2011 336,895 331,636 11,937,319 2.8 2012 333,982 329,859 11,904,557 2.8 2013 339,071 335,023 11,886,860 2.8 2014 350,581 346,394 11,868,245 2.9 aPercentage was calculated by dividing the number of infants and toddlers birth through age 2 served under IDEA, Part C, in the year by the estimated U.S. resident population birth through age 2 for that year, then multiplying the result by 100. SOURCE: U.S. Department of Education, EDFacts Metadata and Process System (EMAPS), OMB #1820-0557: “IDEA Part C Child Count and Settings Collection,” 2005–14. U.S. Department of Commerce, U.S. Census Bureau. “Intercensal Estimates of the Resident Population by Single Year of Age and Sex for States and the United States: April 1, 2000 to July 1, 2014,” 2005–14. Data for 2005 through 2010 were accessed spring 2012. Data for 2011 were accessed fall 2012. Data for 2012 were accessed fall 2013. Data for 2013 were accessed fall 2014. Data for 2014 were accessed fall 2015. For actual data used, go to http://www2.ed.gov/about/reports/annual/osep/index.html.
• In 2014, there were 350,581 infants and toddlers birth through age 2 served under IDEA, Part C. Of those infants and toddlers, 346,394 were served in the 50 states and the District of Columbia. This number represented 2.9 percent of the birth-through-age-2 population in the 50 states and the District of Columbia.
4 The BIE receives IDEA, Part C, funds under IDEA section 643(b) and reports separately every two years (or biennially) under
IDEA section 643(b)(5) on the number of children contacted and served under IDEA, Part C, and reports annually under .34 C.F.R. section 303.731(e)(3) on the amount and dates of each payment distributed to tribal entities and the names of the tribal entities. Beginning with the biennial report submitted after July 1, 2012, under 34 C.F.R. section 303.731(e)(1) and (2), tribal entities must submit to BIE (and BIE provides to the Department) as part of its report under IDEA section 643(b)(5) on the number of children contacted and served under IDEA Part C an assurance that the tribal entities have provided child find information to the state lead agency in the state where the children reside to ensure an unduplicated child count.

11
• Between 2005 and 2014, the total number of infants and toddlers served under IDEA, Part C, increased from 299,048 to 350,581. This addition of 51,533 infants and toddlers represented a 17.2 percent increase in the number of infants and toddlers served.
• In 2005, 2.5 percent of the population of infants and toddlers birth through age 2 in the 50 states and the District of Columbia were served under Part C. By 2008 and in each year thereafter through 2013, 2.8 percent of this population were served under Part C. In 2014, 2.9 percent of this population were served under Part C.
How have the percentages of resident populations birth through age 2 served under IDEA, Part C, changed over time?
Exhibit 2. Percentage of the population birth through age 2 served under IDEA, Part C, by year and age group: Fall 2005 through fall 2014
0.0
1.0
2.0
3.0
4.0
5.0
6.0
2005 2006 2007 2008 2009 2010 2011 2012 2013 2014
Percent
Year
2 years old
Birth through age 2
1 year old
Under 1 year old
NOTE: Percentage was calculated by dividing the number of infants and toddlers in the age group served under IDEA, Part C, in the year by the estimated U.S. resident population in the age group for that year, then multiplying the result by 100. SOURCE: U.S. Department of Education, EDFacts Metadata and Process System (EMAPS), OMB #1820-0557: “IDEA Part C Child Count and Settings Collection,” 2005–14. U.S. Department of Commerce, U.S. Census Bureau. “Intercensal Estimates of the Resident Population by Single Year of Age and Sex for States and the United States: April 1, 2000 to July 1, 2014,” 2005–14. These data are for the 50 states and DC. Data for 2005 through 2010 were accessed spring 2012. Data for 2011 were accessed fall 2012. Data for 2012 were accessed fall 2013. Data for 2013 were accessed fall 2014. Data for 2014 were accessed fall 2015. For actual data used, go to http://www2.ed.gov/about/reports/annual/osep/index.html.

12
• From 2005 through 2014, the percentage of the resident population of infants and toddlers birth through age 2 served under IDEA, Part C, increased from 2.5 percent to 2.9 percent.
• The percentage of 2-year-olds in the resident population of infants and toddlers served under IDEA, Part C, either increased from the previous year or was approximately the same as in the previous year from 2005 through 2012. Between 2012 and 2013, the percentage decreased from 4.7 percent to 4.6 percent. However, the percentage increased to 4.9 in 2014.
• The percentage of 1-year-olds in the resident population of infants and toddlers served under IDEA, Part C, either increased from the previous year or was approximately the same as in the previous year from 2005 through 2010. Between 2010 and 2011, the percentage decreased from 2.7 percent to 2.6 percent and remained at that level in 2012. In 2013, the percentage again reached 2.7 percent, and it remained there in 2014.
• From 2005 through 2014, approximately 1 percent of the infants and toddlers under 1 year old in the resident population were served under Part C.

13
For infants and toddlers birth through age 2, how did the percentage of the resident population of a particular racial/ethnic group that was served under IDEA, Part C, compare to the percentage served of the resident population of all infants and toddlers in all other racial/ethnic groups combined?
Exhibit 3. Number of infants and toddlers birth through age 2 served under IDEA, Part C, and percentage of the population served (risk index), comparison risk index, and risk ratio for infants and toddlers birth through age 2 served under IDEA, Part C, by race/ethnicity: Fall 2014
Race/ethnicity Child counta
in 49 states and DC
Resident population
birth through age
2 in 49 states and DC
Risk indexb
(%)
Risk index for all other racial/ethnic
groups combinedc
(%) Risk ratiod Total 309,499 10,364,562 3.0 † †
American Indian or Alaska Native 2,655 95,122 2.8 3.0 0.9 Asian 9,823 417,583 2.4 3.0 0.8 Black or African American 42,850 1,560,319 2.7 3.0 0.9 Hispanic/Latino 66,457 2,260,726 2.9 3.0 1.0 Native Hawaiian or Other Pacific
Islander 753 18,652 4.0 3.0 1.4 White 176,390 5,523,798 3.2 2.7 1.2 Two or more races 10,572 488,362 2.2 3.0 0.7 † Not applicable. aChild count is the number of infants and toddlers birth through age 2 served under IDEA, Part C, in the racial/ethnic group(s). Data on race/ethnicity for most of the 36,895 infants and toddlers served under Part C in California were suppressed. Therefore, these data were excluded. However, as race/ethnicity data were suppressed for only 218 infants and toddlers served under Part C in 12 other states, the total number of infants and toddlers served under Part C in each racial/ethnic group for which some data were suppressed in each of these states was estimated by distributing the unallocated count for each state equally to the race/ethnicity categories that were suppressed. Due to rounding, the sum of the counts for the racial/ethnic groups may not equal the total for all racial/ethnic groups. bPercentage of the population served may be referred to as the risk index. It was calculated by dividing the number of infants and toddlers birth through age 2 served under IDEA, Part C, in the racial/ethnic group by the estimated U.S. resident population birth through age 2 in the racial/ethnic group, then multiplying the result by 100. cRisk index for all other racial/ethnic groups combined (i.e., children who are not in the racial/ethnic group of interest) was calculated by dividing the number of infants and toddlers birth through age 2 served under IDEA, Part C, in all of the other racial/ethnic groups by the estimated U.S. resident population birth through age 2 in all of the other racial/ethnic groups, then multiplying the result by 100. dRisk ratio compares the proportion of a particular racial/ethnic group served under IDEA, Part C, to the proportion served among the other racial/ethnic groups combined. For example, if racial/ethnic group X has a risk ratio of 2 for receipt of early intervention services, then that group’s likelihood of receiving early intervention services is twice as great as for all of the other racial/ethnic groups combined. Risk ratio was calculated by dividing the risk index for the racial/ethnic group by the risk index for all the other racial/ethnic groups combined. SOURCE: U.S. Department of Education, EDFacts Metadata and Process System (EMAPS), OMB #1820-0557: “IDEA Part C Child Count and Settings Collection,” 2014. These data are for the 49 states and DC. Data were suppressed for California. U.S. Department of Commerce, U.S. Census Bureau. “Intercensal Estimates of the Resident Population by Single Year of Age, Sex, Race and Hispanic Origin for States and the United States: April 1, 2000 to July 1, 2014,” 2014. These data are for the 49 states and DC. Data for California were excluded. Data were accessed fall 2015. For actual data used, go to http://www2.ed.gov/about/reports/annual/osep/index.html.
14
• Native Hawaiian or Other Pacific Islander and White infants and toddlers had risk ratios of 1.4 and 1.2, respectively, indicating that infants and toddlers in each of these racial/ethnic groups were slightly more likely than those in all other racial/ethnic groups combined to be served under IDEA, Part C.
• American Indian or Alaska Native, Asian, and Black or African American infants and toddlers and infants and toddlers associated with two or more racial/ethnic groups had risk ratios of 0.9, 0.8, 0.9, and 0.7, respectively, indicating that infants and toddlers in each of these groups were slightly less likely than those in all other racial/ethnic groups combined to be served under IDEA, Part C.
• Hispanic/Latino infants and toddlers, with a risk ratio of 1, were as likely to be served under Part C as the infants and toddlers of all other racial/ethnic groups combined.

15
Primary Early Intervention Service Settings for Infants and Toddlers Birth Through Age 2 Served Under IDEA, Part C
Part C of IDEA mandates that early intervention services be provided, to the maximum extent appropriate, in settings that are considered natural environments, which could be a child’s home or community settings where typically developing children are present. A multidisciplinary team, including the child’s parent(s), determines the primary service setting that is included on the child’s individualized family service plan (IFSP).
What were the primary early intervention service settings for infants and toddlers birth through age 2 served under IDEA, Part C?
Exhibit 4. Percentage of infants and toddlers birth through age 2 served under IDEA, Part C, by primary early intervention service setting: Fall 2014
Homea (88.1%)
Community-based settingb (7.6%)
Other settingc (4.4%)
aHome refers to the principal residence of the eligible child’s family or caregivers. bCommunity-based setting refers to settings in which children without disabilities are usually found. The community-based settings include, but are not limited to, child care centers (including family day care), preschools, regular nursery schools, early childhood centers, libraries, grocery stores, parks, restaurants, and community centers (e.g., YMCA, Boys and Girls Clubs). cOther setting refers to settings other than home or community-based setting in which early intervention services are provided. These include, but are not limited to, services provided in a hospital, residential facility, clinic, and early intervention center/class for children with disabilities. Additionally, this category should be used if the only services provided were to a family member; counseling, family training, and home visits are examples of such services. NOTE: Percentage was calculated by dividing the number of infants and toddlers birth through age 2 served under IDEA, Part C, in the primary service setting by the total number of infants and toddlers birth through age 2 served under IDEA, Part C, in all the primary service settings, then multiplying the result by 100. Due to rounding, it may not be possible to reproduce the value presented in the exhibit from the sum of the percentages associated with the individual categories. SOURCE: U.S. Department of Education, EDFacts Metadata and Process System (EMAPS), OMB #1820-0557: “IDEA Part C Child Count and Settings Collection,” 2014. These data are for the 50 states, DC, PR, and the four outlying areas. Data were accessed fall 2015. For actual data used, go to http://www2.ed.gov/about/reports/annual/osep/index.html.

16
• In 2014, 88.1 percent of infants and toddlers served under Part C received their early intervention services primarily in the home.
• The category of community-based setting was reported as the primary early intervention setting for 7.6 percent of those served under Part C. Consequently, 95.6 percent of infants and toddlers served under IDEA, Part C, in 2014 received their early intervention services primarily in natural environments, which are defined as the home or a community-based setting.
How did infants and toddlers birth through age 2 served under IDEA, Part C, within racial/ethnic groups differ by primary early intervention service settings?
Exhibit 5. Percentage of infants and toddlers birth through age 2 served under IDEA, Part C, within racial/ethnic groups, by primary early intervention service setting: Fall 2014
86.6
89.1
89.2
89.7
87.1
85.9
84.3
8.6
6.6
5.2
6.7
8.5
9.3
13.1
4.8
4.3
5.6
3.7
4.4
4.8
2.6
0 20 40 60 80 100
Two or more races
White
Native Hawaiian or Other Pacific Islander
Hispanic/Latino
Black or African American
Asian
American Indian or Alaska Native
Percent
Race/ethnicity
Homea Community-based settingb Other settingc
aHome refers to the principal residence of the eligible infant’s or toddler’s family or caregivers. bCommunity-based setting refers to settings in which children without disabilities are usually found. Community-based settings include, but are not limited to, child care centers (including family day care), preschools, regular nursery schools, early childhood centers, libraries, grocery stores, parks, restaurants, and community centers (e.g., YMCA, Boys and Girls Clubs). cOther setting refers to settings other than home or community-based setting in which early intervention services are provided. These include, but are not limited to, services provided in a hospital, residential facility, clinic, and early intervention center/class for children with disabilities. NOTE: Percentage was calculated by dividing the number of infants and toddlers birth through age 2 served under IDEA, Part C, in the racial/ethnic group and primary service setting by the total number of infants and toddlers birth through age 2 served under IDEA, Part C, in the racial/ethnic group and all the primary service settings, then multiplying the result by 100. The sum of bar percentages may not total 100 because of rounding. The total number of infants and toddlers excludes 31,241 infants and toddlers for whom race information was not available. SOURCE: U.S. Department of Education, EDFacts Metadata and Process System (EMAPS), OMB #1820-0557: “IDEA Part C Child Count and Settings Collection,” 2014. These data are for the 50 states, DC, PR, and the four outlying areas. Data were accessed fall 2015. For actual data used, go to http://www2.ed.gov/about/reports/annual/osep/index.html.

17
• In 2014, home was the primary early intervention service setting for more than 84 percent of the infants and toddlers birth through age 2 served under IDEA, Part C, in each racial/ethnic group. The largest percentage of infants and toddlers served under IDEA, Part C, who received early intervention services in a community-based setting was associated with American Indian or Alaska Native children (13.1 percent), while the smallest percentage served in this setting was associated with Native Hawaiian or Other Pacific Islander children (5.2 percent).
Part C Exiting Status for Children Served Under IDEA, Part C
What were the exiting statuses of infants and toddlers birth through age 2 who exited Part C or reached age 3?
Exhibit 6. Percentage of infants and toddlers birth through age 2 served under IDEA, Part C, by exiting status: 2013–14
Part B eligible, exiting Part C
(38.1%)
Part B eligible, continuing in Part C (3.1%)
Not eligible for Part B, exit with referrals to other
programs (6.8%)
Part B eligibility not determineda
(11.2%)
No longer eligible for Part C prior to reaching age 3
(13.8%)
Withdrawal by parent (or guardian) (12.1%)
Attempts to contact
unsuccessful (7.6%)
Other exiting categoriesb
(7.3%)
aThe Part B eligibility not determined category comprises children who were referred for Part B evaluation at the time they were eligible to exit Part C, but for whom the Part B eligibility determination had not yet been made or reported, and children for whom parents did not consent to transition planning. b“Other exiting categories” includes not eligible for Part B, exit with no referrals (3.1 percent); deceased (0.3 percent); and moved out of state (3.9 percent). NOTE: The U.S. Department of Education collects Part C data on 10 categories of exiting: five categories that speak to Part B eligibility (i.e., Part B eligible, exiting Part C; Part B eligible, continuing in Part C; not eligible for Part B, exit with referrals to other programs; not eligible for Part B, exit with no referrals; and Part B eligibility not determined) and five categories that do not speak to Part B eligibility (i.e., no longer eligible for Part C prior to reaching age 3, deceased, moved out of state, withdrawal by parent [or guardian], and attempts to contact unsuccessful). The 10 categories are mutually exclusive. Part B eligibility status refers to eligibility for Part B preschool services under section 619 (Preschool Grants program) of IDEA. Percentage was calculated by dividing the number of infants and toddlers birth through age 2 served under IDEA, Part C, in the exiting category by the total number of infants and toddlers birth through age 2 served under IDEA, Part C, in all the exiting categories, then multiplying the result by 100. Data are from a cumulative 12-month reporting period, which may have varied from state to state.

18
• Of the Part C exiting statuses in 2013–14, Part B eligible, exiting Part C accounted for the largest percentage of infants and toddlers (38.1 percent). An additional 3.1 percent of the infants and toddlers were found to be eligible for Part B but continued to receive services under Part C.
• No longer eligible for Part C prior to reaching age 3 was the second most prevalent category of exiting status, as it accounted for 13.8 percent of the infants and toddlers.
• Withdrawal by parent (or guardian) and Part B eligibility not determined accounted for 12.1 percent and 11.2 percent, respectively.
SOURCE: U.S. Department of Education, EDFacts Metadata and Process System (EMAPS), OMB #1820-0557: “IDEA Part C Exiting Collection,” 2013–14. These data are for 49 states, DC, PR, and the four outlying areas. Data for South Carolina were not available. Data were accessed fall 2015. For actual data used, go to http://www2.ed.gov/about/reports/annual/osep/index.html.

19
What were the Part B eligibility statuses of children served under Part C, when they reached age 3?
Exhibit 7. Percentage of children served under IDEA, Part C, who reached age 3 and were eligible to exit Part C, by Part B eligibility status: 2013–14
Part B eligible, exiting Part C
(61.2%)
Part B eligible, continuing in
Part C (4.9%)
Not eligible for Part B, exit with referrals to other
programs (11.0%)
Not eligible for Part B, exit with
no referrals (5.0%)
Part B eligibility not determineda
(17.9%)
aThe Part B eligibility not determined category comprises children who were referred for Part B evaluation at the time they were eligible to exit Part C, but for whom the Part B eligibility determination had not yet been made or reported, and children for whom parents did not consent to transition planning. NOTE: The U.S. Department of Education collects Part C data on 10 categories of exiting: five categories that speak to Part B eligibility (i.e., Part B eligible, exiting Part C; Part B eligible, continuing in Part C; not eligible for Part B, exit with referrals to other programs; not eligible for Part B, exit with no referrals; and Part B eligibility not determined) and five categories that do not speak to Part B eligibility (i.e., no longer eligible for Part C prior to reaching age 3, deceased, moved out of state, withdrawal by parent [or guardian], and attempts to contact unsuccessful). The 10 categories are mutually exclusive. For data on all 10 categories, see exhibit 6. Part B eligibility status refers to eligibility for Part B preschool services under section 619 (Preschool Grants program) of IDEA. Percentage was calculated by dividing the number of children served under IDEA, Part C, who reached age 3 and were in the Part B eligibility status exiting category by the total number of children served under IDEA, Part C, who reached age 3 and were in the five Part B eligibility status exiting categories, then multiplying the result by 100. Data are from a cumulative 12-month reporting period, which may have varied from state to state. SOURCE: U.S. Department of Education, EDFacts Metadata and Process System (EMAPS), OMB #1820-0557: “IDEA Part C Exiting Collection,” 2013–14. These data are for 49 states, DC, PR, and the four outlying areas. Data for South Carolina were not available. Data were accessed fall 2015. For actual data used, go to http://www2.ed.gov/about/reports/annual/osep/index.html.
• In 2013–14, 61.2 percent of children served under IDEA, Part C, who reached age 3 were determined to be Part B eligible, exiting Part C. An additional 4.9 percent of these children were found to be eligible for Part B but continued to receive services under Part C.
• Eligibility for Part B was not determined for 17.9 percent of the children served under IDEA, Part C, who had reached age 3.

20
• The remaining 16 percent of the children served under Part C who had reached age 3 exited Part C and were determined to be not eligible for Part B. The children who were not eligible for Part B included those who exited with referrals to other programs (11.0 percent) and those who exited with no referrals (5.0 percent).
Dispute Resolution for Infants and Toddlers Served Under IDEA, Part C
To protect the interests of children served under IDEA, Part C, and their families, IDEA requires public agencies to implement a formal set of procedural safeguards for children served under IDEA, Part C. Among these procedural safeguards are three formal options for registering and resolving disputes. One of these options is a written, signed complaint. Any individual or organization can file a written, signed complaint alleging a violation of any Part C requirement by a local early intervention service provider or the state lead agency. A second option available to parents and public agencies is a due process complaint. By filing a due process complaint, a parent may request a due process hearing5 regarding any matter relating to a proposal or a refusal to initiate or change the identification, evaluation, or placement of their infant or toddler with a disability or to the provision of early intervention services to such child or the child’s family. Mediation is a third option available through which parents and early intervention service providers, including public agencies, can try to resolve disputes and reach an agreement about any matter under Part C of IDEA, including matters arising prior to the filing of a due process complaint. The agreements reached through the mediation process are legally binding and enforceable. For more information about these and other procedural safeguards, go to http://ectacenter.org/topics/procsafe/procsafe.asp.
Unlike the other Part C data collections, which are associated with a specific group of Part C
participants defined by the participants’ ages, the Part C dispute resolution data collection is associated with all infants and toddlers served under IDEA, Part C. These infants and toddlers may include individuals who are 3 years or older and eligible under Part B but whose parents elect for them to continue receiving Part C services, as states have the authority to define an “infant or toddler with a disability” to include individuals under 3 years of age and individuals 3 years of age and older [see IDEA, section 632(5)(B) and 34 C.F.R. 303.21(c)] and serve them under Part C until the beginning of the school year following the child’s third or fourth birthday or until the child is eligible to enter kindergarten [see IDEA, section 635(c) and 34 C.F.R. 303.211]. The Part C legal disputes and resolution data represent all complaints associated with these three state-level dispute resolution mechanisms under Part C during the 12 months during which the data were collected.
5 A due process hearing is designed to be a fair, timely, and impartial procedure for resolving disputes that arise from parents
and public agencies regarding the identification and evaluation of, or provision of early intervention services to, children referred to IDEA, Part C.

21
What were the statuses of the written, signed complaints that alleged a violation of a requirement of Part C of IDEA?
Exhibit 8. Percentage of written, signed complaints for infants and toddlers served under IDEA, Part C, by complaint status: 2013–14
Complaints with reports issueda
(77.9%)
Complaints withdrawn or dismissedb
(21.2%)
Complaints pendingc (0.9%)
aA complaint with report issued refers to a written decision that was provided by the state lead agency to the complainant regarding alleged violations of a requirement of Part C of IDEA. bA complaint withdrawn or dismissed refers to a written, signed complaint that was withdrawn by the complainant for any reason or that was determined by the state lead agency to be resolved by the complainant and the early intervention service provider or state lead agency through mediation or other dispute resolution means and no further action by the state lead agency was required to resolve the complaint or a complaint dismissed by the state lead agency for any reason, including that the complaint did not include all of the required content. cA complaint pending is a written, signed complaint that is either still under investigation or the state lead agency’s written decision has not been issued. NOTE: A written, signed complaint is a signed document with specific content requirements that is submitted to a state lead agency by an individual or organization (i.e., complainant) that alleges a violation of a requirement of Part C of IDEA or 34 C.F.R. 303, including cases in which some required content is absent from the document. Only 20 states reported one or more written, signed complaints. Percentage was calculated by dividing the number of complaints in the status category by the total number of written, signed complaints, then multiplying the result by 100. Percentage was based on a total of 113 written, signed complaints. Data are from the reporting period between July 1, 2013, and June 30, 2014. SOURCE: U.S. Department of Education, EDFacts Metadata and Process System (EMAPS), OMB #1820-0678: “IDEA Part C Dispute Resolution Survey,” 2013–14. These data are for the 50 states, DC, PR, and the four outlying areas. Data were accessed fall 2015. For actual data used, go to http://www2.ed.gov/about/reports/annual/osep/index.html.
• During 2013–14, a total of 113 written, signed complaints were received through the dispute resolution process for infants and toddlers birth through age 2 served under IDEA, Part C.
• A report was issued for 88 (77.9 percent) of the complaints, while 24 (21.2 percent) of the complaints were withdrawn or dismissed. Only 1 (0.9 percent) of the complaints that were received during the reporting period was pending or unresolved by the end of the period.

22
What were the statuses of the due process complaints made by parties that alleged a violation of a requirement of Part C of IDEA?
Exhibit 9. Percentage of due process complaints for infants and toddlers served under IDEA, Part C, by complaint status: 2013–14
Due process complaints
withdrawn or dismisseda
(83.3%)
Due process complaints that
resulted in hearings fully adjudicatedb
(8.3%)
Due process complaints that were hearings
pendingc (8.3%)
aA due process complaint that was withdrawn or dismissed (including resolved without a hearing) is a complaint that has not resulted in a fully adjudicated due process hearing and is also not under consideration by a hearing officer. Such complaints can include those resolved through a mediation agreement or through a resolution meeting settlement agreement, those settled by some other agreement between the parties (i.e., parent and the public agency) prior to completion of the hearing, those withdrawn by the parent, those rejected by the hearing officer as without cause, and those not fully adjudicated for other reasons. bA hearing is fully adjudicated when a hearing officer conducts a due process hearing, reaches a final decision regarding matters of law and fact, and issues a written decision to the parties. cA due process complaint that is a hearing pending is a request for a due process hearing that has not yet been scheduled, is scheduled but has not yet been conducted, or has been conducted but is not yet fully adjudicated. NOTE: A due process complaint is a filing by a parent, early intervention service provider, or state lead agency to initiate an impartial due process hearing on matters related to the identification, evaluation, or placement of an infant or toddler with a disability or to the provision of appropriate early intervention services to such child. Only nine states reported one or more due process complaints. Percentage was calculated by dividing the number of due process complaints in the status category by the total number of due process complaints, then multiplying the result by 100. Percentage was based on a total of 96 due process complaints. Data are from the reporting period between July 1, 2013, and June 30, 2014. SOURCE: U.S. Department of Education, EDFacts Metadata and Process System (EMAPS), OMB #1820-0678: “IDEA Part C Dispute Resolution Survey,” 2013–14. These data are for the 50 states, DC, PR, and the four outlying areas. Data were accessed fall 2015. For actual data used, go to http://www2.ed.gov/about/reports/annual/osep/index.html.
• A total of 96 due process complaints were received during 2013–14 through the dispute resolution process for infants and toddlers birth through age 2 served under IDEA, Part C.

23
• For 80 (83.3 percent) of the due process complaints received during the reporting period, the complaint was withdrawn or dismissed. For eight (8.3 percent) of the due process complaints received, a hearing was conducted, and a written legal decision was issued. For the remaining eight complaints (8.3 percent), a hearing was still pending as of the end of the reporting period.
What were the statuses of the mediation requests made by parties that alleged a violation of a requirement of Part C of IDEA?
Exhibit 10. Percentage of mediation requests for infants and toddlers served under IDEA, Part C, by request status: 2013–14
Mediations held related to due
process complaintsa
(7.7%)
Mediations held not related to due
process complaintsb
(45.8%)
Mediations withdrawn or not
heldc (45.2%)
Mediations pendingd (1.2%)
aA mediation held related to due process complaint is a process that was conducted by a qualified and impartial mediator to resolve a disagreement between parties that was initiated by the filing of a due process complaint or included issues that were the subject of a due process complaint. bA mediation held not related to due process complaint is a process that was conducted by a qualified and impartial mediator to resolve a disagreement between parties to a dispute involving any matter under Part C of IDEA that was not initiated by the filing of a due process complaint or did not include issues that were the subject of a due process complaint. cA mediation that has been withdrawn or not held is a request for mediation that did not result in a mediation being conducted by a qualified and impartial mediator. This includes requests that were withdrawn, requests that were dismissed, requests where one party refused to mediate, and requests that were settled by some agreement other than a mediation agreement between the parties. dA mediation pending is a request for mediation that has not yet been scheduled or is scheduled but has not yet been held. NOTE: A mediation request is a request by a party to a dispute involving any matter under Part C of IDEA for the parties to meet with a qualified and impartial mediator to resolve the dispute(s). Only seven states reported one or more mediation requests. Percentage was calculated by dividing the number of mediation requests in the status category by the total number of mediation requests, then multiplying the result by 100. Percentage was based on a total of 168 mediation requests. Data are from the reporting period between July 1, 2013, and June 30, 2014. SOURCE: U.S. Department of Education, EDFacts Metadata and Process System (EMAPS), OMB #1820-0678: “IDEA Part C Dispute Resolution Survey,” 2013–14. These data are for the 50 states, DC, PR, and the four outlying areas. Data were accessed fall 2015. For actual data used, go to http://www2.ed.gov/about/reports/annual/osep/index.html.

24
• During 2013–14, a total of 168 mediation requests were received through the dispute resolution process for infants and toddlers birth through age 2 served under IDEA, Part C.
• A mediation was conducted before the end of the reporting period for 90 (53.6 percent) of the mediation requests received. The mediation that was held in 13 (7.7 percent) of these cases was related to a due process complaint, while the session held in 77 (45.8 percent) of these cases was not related to a due process complaint. Of the 78 mediation requests received that did not result in a mediation being held by the end of the reporting period, 76 had been withdrawn, dismissed, or otherwise ended without a mediation being held. The remaining two were still pending at the end of the reporting period.

25
Children Ages 3 Through 5 Served Under IDEA, Part B
Under Part B of IDEA, the secretary provides funds to states to assist them in providing a free appropriate public education (FAPE) to children ages 3 through 21 with disabilities who are in need of special education and related services. The Preschool Grants for Children with Disabilities program (IDEA, section 619) supplements funding available for children ages 3 through 5 with disabilities under the Grants to States program (IDEA, section 611). To be eligible for funding under the Preschool Grants for Children with Disabilities program and the Grants to States program for children ages 3 through 5, a state must make FAPE available to all children ages 3 through 5 with disabilities residing in the state.
IDEA, Part B, has four primary purposes: • To ensure that all children with disabilities have FAPE available to them and receive special
education and related services designed to meet their individual needs,
• To ensure that the rights of children with disabilities and their parents are protected,
• To assist states and localities to provide for the education of all children with disabilities, and
• To assess and ensure the effectiveness of efforts to educate children with disabilities.
In general, the exhibits presenting Part B data in this section represent the 50 states; the District of Columbia (DC); the Bureau of Indian Education (BIE) schools; Puerto Rico (PR); the four outlying areas of American Samoa, Guam, the Northern Mariana Islands, and the Virgin Islands; and the three freely associated states of the Federated States of Micronesia, the Republic of Palau, and the Republic of the Marshall Islands.6,7 As there are some exceptions, such as the exhibits that present Part B data with data about the residential population, each exhibit is accompanied by a note that identifies the particular jurisdictions that are represented. In this section, there are occasional references to “special education services.” The term is synonymous with services provided under IDEA, Part B.
6 Although BIE schools do not receive funds under IDEA, Part B, section 619, BIE schools may report 5-year-old children who
are enrolled in elementary schools for American Indian children operated or funded by BIE and who receive services funded under IDEA, Part B, section 611(h)(1)(A).
7 The four outlying areas and the three freely associated states do not receive funds under IDEA, Part B, section 619. However, they may report children ages 3 through 5 who receive services funded under IDEA, Part B, section 611(b)(1)(A).

26
Numbers and Percentages of Children Ages 3 Through 5 Served Under IDEA, Part B
How have the number and percentage of children ages 3 through 5 served under IDEA, Part B, changed over time?
Exhibit 11. Number of children ages 3 through 5 served under IDEA, Part B, and percentage of the population served, by year: Fall 2005 through fall 2014
Year
Total served under Part B (ages 3 through 5)
Resident population ages 3 through 5 in the
50 states and DCb
Percentagec of resident population ages 3 through 5 served
under Part B in the 50 states, DC,
and BIE schools
In the 50 states, DC, BIE schools,
PR, and the four outlying areasa
In the 50 states, DC, and BIE
schools 2005 704,087 698,938 11,866,471 5.9 2006 714,384 706,635 11,987,484 5.9 2007 709,136 698,931 11,975,329 5.8 2008 709,004 700,296 12,037,364 5.8 2009 731,832 716,569 12,129,397 5.9 2010 735,245 720,740 12,255,590 5.9 2011 745,954 730,558 12,312,888 5.9 2012 750,131 736,195 12,203,162 6.0 2013 745,336 729,703 12,078,921 6.0 2014 753,697 736,170 12,013,496 6.1 aIn 2012, data for children served by the three freely associated states were included. In 2013, data for children served by two freely associated states were included; data were not available for the Federated States of Micronesia. In 2014, data for children served by the three freely associated states were included. bChildren served through BIE schools are included in the population estimates of the individual states in which they reside. cPercentage was calculated by dividing the number of children ages 3 through 5 served under IDEA, Part B, in the year by the estimated U.S. resident population ages 3 through 5 for that year, then multiplying the result by 100. SOURCE: U.S. Department of Education, EDFacts Data Warehouse (EDW), OMB #1875-0240: “IDEA Part B Child Count and Educational Environments Collection,” 2005–14. For 2007 and 2008, data for Vermont were not available. For 2010, 2012, and 2013, data for Wyoming were not available. For 2011 and 2013, data for BIE schools were not available. U.S. Department of Commerce, U.S. Census Bureau. “Intercensal Estimates of the Resident Population by Single Year of Age and Sex for States and the United States: April 1, 2000 to July 1, 2014,” 2005–14. For 2007 and 2008, data for Vermont were excluded. For 2010, 2012, and 2013, data for Wyoming were excluded. Data for 2005 through 2010 were accessed spring 2012. Data for 2011 were accessed fall 2012. Data for 2012 were accessed fall 2013. Data for 2013 were accessed fall 2014. Data for 2014 were accessed fall 2015. For actual data used, go to http://www2.ed.gov/about/reports/annual/osep/index.html.
• In 2014, 753,697 children ages 3 through 5 in 2014 were served under Part B. Of these children, 736,170 were served in the 50 states, the District of Columbia, and Bureau of Indian Education (BIE) schools. This number represented 6.1 percent of the resident population ages 3 through 5. Between 2005 and 2014, the number of children ages 3 through 5 served under IDEA, Part B, in the states for which data were available increased from 704,087 to 753,697. This addition of 49,610 children represented a 7 percent increase in the number of children served.

27
• In 2005, the percentage of the resident population ages 3 through 5 served under IDEA, Part B, was 5.9 percent. The percentage remained at 5.9 through 2006 but fell to 5.8 percent in 2007. In 2009, the percentage reached 5.9 percent again, and it remained there until 2012, when the percentage reached 6 percent. In 2014, the percentage increased to 6.1 percent.
How did the percentage of children ages 3 through 5 served under IDEA, Part B, vary by disability category?
Exhibit 12. Percentage of children ages 3 through 5 served under IDEA, Part B, by disability category: Fall 2014
Speech or language
impairments (43.7%)
Developmental delaya
(37.0%)
Autism (8.9%)
Other disabilities combinedb
(10.5%)
aStates’ use of the developmental delay category is optional for children ages 3 through 9 and is not applicable to children older than 9 years of age. For more information on children ages 3 through 5 reported under the category of developmental delay and states with differences in developmental delay reporting practices, see exhibits B-1 and B-3 in Appendix B. b“Other disabilities combined” includes deaf-blindness (less than 0.05 percent), emotional disturbance (0.4 percent), hearing impairments (1.2 percent), intellectual disabilities (1.9 percent), multiple disabilities (1.1 percent), orthopedic impairments (0.8 percent), other health impairments (3.1 percent), specific learning disabilities (1.4 percent), traumatic brain injury (0.1 percent), and visual impairments (0.4 percent). Due to rounding, it may not be possible to reproduce the value presented in the exhibit for this combination from the sum of the percentages associated with these individual categories. NOTE: Percentage was calculated by dividing the number of children ages 3 through 5 served under IDEA, Part B, in the disability category by the total number of children ages 3 through 5 served under IDEA, Part B, then multiplying the result by 100. SOURCE: U.S. Department of Education, EDFacts Data Warehouse (EDW), OMB #1875-0240: “IDEA Part B Child Count and Educational Environments Collection,” 2014. These data are for 50 states, BIE schools, DC, PR, the four outlying areas, and the three freely associated states. Data were accessed fall 2015. For actual data used, go to http://www2.ed.gov/about/reports/annual/osep/index.html.

28
• In 2014, the most prevalent disability category of children ages 3 through 5 served under IDEA, Part B, was speech or language impairments (43.7 percent). The next most common disability category was developmental delay (37.0 percent), followed by autism (8.9 percent).
• The children ages 3 through 5 represented by the category “Other disabilities combined” accounted for the remaining 10.5 percent of children served under IDEA, Part B.
How did the percentage of the resident population ages 3 through 5 served under IDEA, Part B, for a particular racial/ethnic group compare to the percentage of the resident population served for all other racial/ethnic groups combined?
Exhibit 13. Number of children ages 3 through 5 served under IDEA, Part B, and percentage of the population served (risk index), comparison risk index, and risk ratio for children ages 3 through 5 served under IDEA, Part B, by race/ethnicity: Fall 2014
Race/ethnicity Child counta in the 50
states and DC
Resident population
ages 3 through 5 in the 50 states
and DCb Risk indexc
(%)
Risk index for all other racial/ethnic
groups combinedd
(%) Risk ratioe Total 736,170 12,013,496 6.1 † †
American Indian or Alaska Native 8,831 102,206 8.6 6.1 1.4
Asian 25,908 572,142 4.5 6.2 0.7 Black or African American 102,471 1,653,343 6.2 6.1 1.0 Hispanic/Latino 172,783 3,104,071 5.6 6.3 0.9 Native Hawaiian or Other
Pacific Islander 2,251 23,903 9.4 6.1 1.5 White 396,052 6,001,226 6.6 5.7 1.2 Two or more races 27,874 556,605 5.0 6.2 0.8 † Not applicable. aChild count is the number of children ages 3 through 5 served under IDEA, Part B, in the racial/ethnic group(s). bChildren served through BIE schools are included in the population estimates of the individual states in which they reside. cPercentage of the population served may be referred to as the risk index. It was calculated by dividing the number of children ages 3 through 5 served under IDEA, Part B, in the racial/ethnic group by the estimated U.S. resident population ages 3 through 5 in the racial/ethnic group, then multiplying the result by 100. dRisk index for all other racial/ethnic groups combined (i.e., children who are not in the racial/ethnic group of interest) was calculated by dividing the number of children ages 3 through 5 served under IDEA, Part B, in all of the other racial/ethnic groups by the estimated U.S. resident population ages 3 through 5 in all of the other racial/ethnic groups, then multiplying the result by 100. eRisk ratio compares the proportion of a particular racial/ethnic group served under IDEA, Part B, to the proportion served among the other racial/ethnic groups combined. For example, if racial/ethnic group X has a risk ratio of 2 for receipt of special education services, then that group’s likelihood of receiving special education services is twice as great as for all of the other racial/ethnic groups combined. Risk ratio was calculated by dividing the risk index for the racial/ethnic group by the risk index for all the other racial/ethnic groups combined. SOURCE: U.S. Department of Education, EDFacts Data Warehouse (EDW), OMB #1875-0240: “IDEA Part B Child Count and Educational Environments Collection,” 2014. These data are for the 50 states, DC, and BIE schools. U.S. Department of Commerce, U.S. Census Bureau. “Intercensal Estimates of the Resident Population by Single Year of Age, Sex, Race, and Hispanic Origin for States and the United States: April 1, 2000 to July 1, 2014,” 2014. Data were accessed fall 2015. For actual data used, go to http://www2.ed.gov/about/reports/annual/osep/index.html.

29
• In 2014, American Indian or Alaska Native, Native Hawaiian or Other Pacific Islander, and White children ages 3 through 5 had risk ratios above 1 (i.e., 1.4, 1.5, and 1.2, respectively). This indicates that the children in each of these groups were more likely to be served under Part B than were children ages 3 through 5 in all other racial/ethnic groups combined.
• Black or African American children ages 3 through 5, with a risk ratio of 1, were as likely to be served under Part B as the children ages 3 through 5 in all other racial/ethnic groups combined.
• Asian and Hispanic/Latino children ages 3 through 5 and children ages 3 through 5 associated with two or more racial/ethnic groups, with risk ratios of less than 1 (i.e., 0.7, 0.9, and 0.8, respectively), were less likely to be served under Part B than children ages 3 through 5 in all other racial/ethnic groups combined.
Educational Environments for Children Ages 3 Through 5 Served Under IDEA, Part B
In what educational environments were children ages 3 through 5 served under IDEA, Part B?
Exhibit 14. Percentage of children ages 3 through 5 served under IDEA, Part B, by educational environment: Fall 2014
Regular early childhood
programa at least 10 hrs/wk and
majority (38.2%)
Regular early childhood
programa at least 10 hrs/wk, majority
elsewhere (17.1%)
Regular early childhood
programa less than 10 hrs/wk and majority
(5.5%)
Regular early childhood
programa less than 10 hrs/wk,
majority elsewhere
(4.9%)
Separate classb (23.0%)
Service provider location or some other locationc
(6.4%)
Other environmentsd
(4.8%)
aRegular early childhood program includes at least 50 percent of children without disabilities (i.e., children without individualized education programs). Regular early childhood programs include, but are not limited to, Head Start, kindergarten, preschool classes offered to an eligible pre-kindergarten population by the public school system, private kindergartens or preschools, and group child development center or child care. bSeparate class refers to a special education program in a class that includes less than 50 percent children without disabilities.

30
• In 2014, a total of 65.8 percent of children ages 3 through 5 served under IDEA, Part B, were in a regular early childhood program for some amount of their time in school.
• Of the four categories representing children who attended a regular early childhood program, the category of attending a regular early childhood program at least 10 hours per week and receiving the majority of hours of special education and related services in the regular early childhood program accounted for the largest percentage of children. Moreover, as this category accounted for 38.2 percent of all children ages 3 through 5 served under IDEA, Part B, it represented more children than any other educational environment category.
• A separate class accounted for 23 percent of children ages 3 through 5 served under IDEA, Part B, making it the second most prevalent educational environment.
• Collectively the environments of separate school, residential facility, and home (which are represented by the category “Other environments”), accounted for only 4.8 percent of the children ages 3 through 5 served under IDEA, Part B.
• The educational environment for the remaining students, representing only 6.4 percent of the children ages 3 through 5 served under IDEA, Part B, was a service provider location or some other location.
cService provider location refers to a situation in which a child receives all special education and related services from a service provider or in some location not in any of the other categories, including a regular early childhood program or special education program in a separate class, separate school, or residential facility. This does not include children who receive special education and related services in the home. An example is a situation in which a child receives only speech instruction, and it is provided in a clinician’s office. d“Other environments” consists of separate school (2.6 percent), residential facility (less than 0.05 percent), and home (2.1 percent). NOTE: Percentage was calculated by dividing the number of children ages 3 through 5 served under IDEA, Part B, in the educational environment by the total number of children ages 3 through 5 served under IDEA, Part B, in all the educational environments, then multiplying the result by 100. The sum may not total 100 percent because of rounding. SOURCE: U.S. Department of Education, EDFacts Data Warehouse (EDW), OMB #1875-0240: “IDEA Part B Child Count and Educational Environments Collection,” 2014. These data are for the 50 states, DC, PR, BIE schools, the four outlying areas, and the three freely associated states. Data were accessed fall 2015. For actual data used, go to http://www2.ed.gov/about/reports/annual/osep/index.html.

31
How did children ages 3 through 5 served under IDEA, Part B, within racial/ethnic groups differ by educational environments?
Exhibit 15. Percentage of children ages 3 through 5 served under IDEA, Part B, within racial/ethnic groups, by educational environment: Fall 2014
Race/ethnicity
2.6 17.3 3.6
American Indian or Alaska Native 48.9 19.9 4.6 3.2
5.9 31.4 5.9
Asian 33.2 12.8 5.5 5.2
4.6 25.2 3.3
Black or African American 39.2 17.9 4.2 5.6
3.8 25.0 7.2 Hispanic/Latino 40.8 13.4 4.7 5.1
8.5 26.1 6.2
Native Hawaiian or Other Pacific Islander 35.4 13.2 4.5 6.0
5.5 20.8 7.1
White 36.8 19.0 6.2 4.5
5.1 25.6 5.4
Two or more races 37.4 16.6 5.7 4.2
0 20 40 60 80 100Percent
Regular early childhood programa at least 10 hours/week (hrs/wk) and majority
Regular early childhood programa at least 10 hrs/wk, majority elsewhere
Regular early childhood programa less than 10 hrs/wk and majority
Regular early childhood programa less than 10 hrs/wk, majority elsewhere
Separate classb
Service provider location or other locationc
Other environmentsd
aRegular early childhood program includes a majority (i.e., at least 50 percent) of children without disabilities (i.e., children without individualized education programs). Regular early childhood programs include, but are not limited to, Head Start, kindergarten, preschool classes offered to an eligible pre-kindergarten population by the public school system, private kindergartens or preschools, and group child development center or child care. bSeparate class refers to a special education program in a class that includes less than 50 percent children without disabilities. cService provider location refers to a situation in which a child receives all special education and related services from a service provider or in some location not in any of the other categories, including a regular early childhood program or special education program in a separate class, separate school, or residential facility. This does not include children who receive special education and related services in the home. An example is a situation in which a child receives only speech instruction, and it is provided in a clinician’s office. d“Other environments” consists of separate school, residential facility, and home. NOTE: Percentage was calculated for each racial/ethnic group by dividing the number of children ages 3 through 5 served under IDEA, Part B, in the educational environment by the total number of children ages 3 through 5 served under IDEA, Part B, in all the educational environments, then multiplying the result by 100. The sum of the row percentages may not total 100 because of rounding. SOURCE: U.S. Department of Education, EDFacts Data Warehouse (EDW), OMB #1875-0240: “IDEA Part B Child Count and Educational Environments Collection,” 2014. These data are for the 50 states, DC, PR, BIE schools, the four outlying areas, and the three freely associated states. Data were accessed fall 2015. For actual data used, go to http://www2.ed.gov/about/reports/annual/osep/index.html.

32
• In 2014, a regular early childhood program for some amount of the time spent in school was the educational environment for the majority of children ages 3 through 5 served under IDEA, Part B, in each racial/ethnic group.
• The category of attending a regular early childhood program at least 10 hours per week and receiving the majority of hours of special education and related services in the regular early childhood program accounted for the largest percentage of children who attended a regular early childhood program for every racial/ethnic group. Moreover, for every racial/ethnic group, this category accounted for a larger percentage of the children than did any other category of educational environment. In particular, this environment accounted for 48.9 percent of American Indian or Alaska Native children, 33.2 percent of Asian children, 39.2 percent of Black or African American children, 40.8 percent of Hispanic/Latino children, 35.4 percent of Native Hawaiian or Other Pacific Islander children, 36.8 percent of White children, and 37.4 percent of the children associated with two or more racial/ethnic groups.
• A separate class was the second most prevalent educational environment for children ages 3 through 5 served under IDEA, Part B, for each racial/ethnic group, except American Indian or Alaska Native children. A slightly larger percentage of American Indian or Alaska Native children (19.9 percent) attended a regular early childhood program for at least 10 hours per week but received the majority of hours of special education and related services in another location than attended a separate class (17.3 percent).
Special Education Teachers and Paraprofessionals Employed to Serve Children Ages 3 Through 5 Under IDEA, Part B
To what extent were full-time equivalent teachers who were employed to provide special education and related services for children ages 3 through 5 served under IDEA, Part B, highly qualified?
Exhibit 16. Number of full-time equivalent (FTE) special education teachers and number and percentage of FTE highly qualified special education teachers employed to provide special education and related services for children ages 3 through 5 served under IDEA, Part B: Fall 2013
Year Total number FTE employed
Number FTE highly qualifieda
Percentageb FTE highly qualified
2013 40,869 38,633 94.5 aSpecial education teachers reported as highly qualified met the state standard for highly qualified based on the criteria identified in 20 U.S.C. section 1401(10). For highly qualified special education teachers, the term “highly qualified” has the same meaning given the term in section 9101 of the Elementary and Secondary Education Act of 1965, as amended (ESEA), except that such term also includes the requirements described in section 602(10)(B) of IDEA and the option for teachers to meet the requirements of section 9101 of ESEA, by meeting the requirements of section 602(10)(C) or (D) of IDEA [20 U.S.C. section 1401(10)]. In states where teachers who work with children ages 3 through 5 were not included in the state’s definition of highly qualified, teachers were considered highly qualified if they were (1) personnel who held appropriate state certification or licensure for the position held or (2) personnel who held positions for which no state certification or licensure requirements existed. bPercentage was calculated by dividing the number of FTE highly qualified special education teachers employed to provide special education and related services for children ages 3 through 5 served under IDEA, Part B, by the total number of FTE special education teachers employed to provide special education and related services for children ages 3 through 5 served under IDEA, Part B, then multiplying the result by 100. SOURCE: U.S. Department of Education, EDFacts Data Warehouse (EDW), OMB #1875-0240: “IDEA Part B Personnel Collection,” 2013. These data are for 49 states, DC, BIE schools, PR, the four outlying areas, and the three freely associated states. Data were not available for Idaho. Data were accessed fall 2015. For actual data used, go to http://www2.ed.gov/about/reports/annual/osep/index.html.

33
• In 2013, a total of 38,633, or 94.5 percent, of the 40,869 full-time equivalent (FTE) special education teachers who were employed to provide special education and related services for children ages 3 through 5 under IDEA, Part B, were highly qualified.
To what extent were full-time equivalent paraprofessionals who were employed to provide special education and related services for children ages 3 through 5 served under IDEA, Part B, qualified?
Exhibit 17. Number of full-time equivalent (FTE) special education paraprofessionals and number and percentage of FTE qualified special education paraprofessionals employed to provide special education and related services for children ages 3 through 5 served under IDEA, Part B: Fall 2013
Year Total number
FTE employed Number
FTE qualifieda Percentageb
FTE qualified 2013 47,039 45,081 95.8 aSpecial education paraprofessionals reported as qualified (1) met the state standard for qualified based on the criteria identified in 20 U.S.C. section 1412(a)(14)(B), or (2) if paraprofessionals were not included in the state’s definition of qualified, either held appropriate state certification or licensure for the position held or held positions for which no state certification or licensure requirements existed. bPercentage was calculated by dividing the number of FTE qualified special education paraprofessionals employed to provide special education and related services for children ages 3 through 5 served under IDEA, Part B, by the total number of FTE special education paraprofessionals employed to provide special education and related services for children ages 3 through 5 served under IDEA, Part B, then multiplying the result by 100. NOTE: Paraprofessionals are employees who provide instructional support, including those who (1) provide one-on-one tutoring if such tutoring is scheduled at a time when a student would not otherwise receive instruction from a teacher; (2) assist with classroom management, such as organizing instructional and other materials; (3) provide instructional assistance in a computer laboratory; (4) conduct parental involvement activities; (5) provide support in a library or media center; (6) act as a translator; or (7) provide instructional support services under the direct supervision of a teacher. SOURCE: U.S. Department of Education, EDFacts Data Warehouse (EDW), OMB #1875-0240: “IDEA Part B Personnel Collection,” 2013. These data are for 49 states, DC, BIE schools, PR, the four outlying areas, and the three freely associated states. Data were not available for Idaho. Data were accessed fall 2015. For actual data used, go to http://www2.ed.gov/about/reports/annual/osep/index.html.
• In 2013, a total of 45,081, or 95.8 percent, of the 47,039 FTE special education paraprofessionals who were employed to provide special education and related services for children ages 3 through 5 under IDEA, Part B, were qualified.

34
Students Ages 6 Through 21 Served Under IDEA, Part B
Since the 1975 passage of the Education for All Handicapped Children Act (P.L. 94-142), the U.S. Department of Education has collected data on the number of children served under the law. Early collections of data on the number of children served under Part B of IDEA focused on nine disability categories. Through the subsequent years and multiple reauthorizations of the act, the disability categories have been expanded to 13 and revised, and new data collections have been required.
In 1997, the law was reauthorized with several major revisions (IDEA Amendments of 1997;
P.L. 105-17). The reauthorization allowed states the option of using the developmental delay category8 for children ages 3 through 9. Another revision was the requirement that race/ethnicity data be collected on the number of children served.
In general, the exhibits presenting Part B data in this section represent the 50 states; the District of
Columbia (DC); the Bureau of Indian Education (BIE) schools; Puerto Rico (PR); the four outlying areas of American Samoa, Guam, the Northern Mariana Islands, and the Virgin Islands; and the three freely associated states of the Federated States of Micronesia, the Republic of Palau, and the Republic of the Marshall Islands.9,10 As there are some exceptions, such as the exhibits that present Part B data with data about residential population, each exhibit is accompanied by a note that identifies the particular jurisdictions that are represented. There are occasional references to “special education services” in this section, and this term is synonymous with services provided under IDEA, Part B.
8 States’ use of the developmental delay category is optional for children ages 3 through 9 and is not applicable to children older
than 9 years of age. For more information on students ages 6 through 9 reported under the category of developmental delay, see Appendix B.
9 Although BIE schools do not receive funds under IDEA, Part B, section 619, BIE schools may report 5-year-old children who are enrolled in elementary schools for American Indian children operated or funded by BIE and who receive services funded under IDEA, Part B, section 611(h)(1)(A).
10 The four outlying areas and the three freely associated states do not receive funds under IDEA, Part B, section 619. However, the outlying areas may report children ages 3 through 5 who receive services funded under IDEA, Part B, section 611(b)(1)(A).

35
Numbers and Percentages of Students Ages 6 Through 21 Served Under IDEA, Part B
How have the number and percentage of students ages 6 through 21 served under IDEA, Part B, changed over time?
Exhibit 18. Number of students ages 6 through 21 served under IDEA, Part B, and percentage of the population served, by year: Fall 2005 through fall 2014
Year
Total served under Part B (ages 6 through 21) Resident
population ages 6 through 21
in the 50 states and DCb
Percentagec of resident population
ages 6 through 21 served under Part B in the 50 states, DC,
and BIE schools
In the 50 states, DC, BIE schools, PR, and the four
outlying areasa
In the 50 states, DC, and BIE
schools 2005 6,109,569 6,021,462 66,586,587 9.0 2006 6,081,890 5,986,644 66,841,838 9.0 2007 5,999,205 5,903,959 66,993,376 8.8 2008 5,889,849 5,789,806 67,243,169 8.6 2009 5,882,157 5,770,718 67,656,650 8.5 2010 5,822,808 5,705,466 67,788,496 8.4 2011 5,789,884 5,670,680 67,783,391 8.4 2012 5,823,844 5,699,640 67,543,992 8.4 2013 5,847,624 5,734,393 67,272,586 8.5 2014 5,944,241 5,825,505 67,039,493 8.7 aIn 2012, data for the students served by the three freely associated states were included. In 2013, data for the students served by two freely associated states were included; data were not available for the Federated States of Micronesia. In 2014, data for the students served by the three freely associated states were included. bStudents served through BIE schools are included in the population estimates of the individual states in which they reside. cPercentage was calculated by dividing the number of students ages 6 through 21 served under IDEA, Part B, in the year by the estimated U.S. resident population ages 6 through 21 for that year, then multiplying the result by 100. SOURCE: U.S. Department of Education, EDFacts Data Warehouse (EDW), OMB #1875-0240: “IDEA Part B Child Count and Educational Environments Collection,” 2005–14. For 2007 and 2008, data for Vermont were not available. For 2010, data for Wyoming were not available. For 2011, data for BIE schools were not available. For 2013, data for BIE schools and American Samoa were not available. For 2014, data for Wyoming and American Samoa were not available. U.S. Department of Commerce, U.S. Census Bureau. “Intercensal Estimates of the Resident Population by Single Year of Age and Sex for States and the United States: April 1, 2000 to July 1, 2014,” 2005–14. For 2007 and 2008, data for Vermont were excluded. For 2010 and 2014, data for Wyoming were excluded. Data for 2005 through 2010 were accessed spring 2012. Data for 2011 were accessed fall 2012. Data for 2012 were accessed fall 2013. Data for 2013 were accessed fall 2014. Data for 2014 were accessed fall 2015. For actual data used, go to http://www2.ed.gov/about/reports/annual/osep/index.html.
• In 2014, a total of 5,944,241students ages 6 through 21 were served under IDEA, Part B. Of these students, 5,825,505 were served in the 49 states for which data were available, the District of Columbia, and BIE schools. This number represented 8.7 percent of the resident population ages 6 through 21.
• The total number of students ages 6 through 21 served under IDEA, Part B, in 2005 was 6,109,569. In each year between 2005 through 2011, the number of students served was less than in the previous year. However, more students were served under Part B in 2012 and in each subsequent year through 2014.

36
• In 2005, 9 percent of the resident population ages 6 through 21 were served under Part B. Between 2005 and 2010, the percentage of the population served gradually decreased to 8.4 percent. The percentage served remained at 8.4 percent until 2013, when it increased to 8.5 percent. In 2014, the percentage increased to 8.7 percent.
How have the percentages of resident populations ages 6 through 21 served under IDEA, Part B, changed over time?
Exhibit 19. Percentage of the population ages 6 through 21 served under IDEA, Part B, by year and age group: Fall 2005 through fall 2014
0
2
4
6
8
10
12
14
2005 2006 2007 2008 2009 2010 2011 2012 2013 2014
Percent
Year
18 through 21
6 through 21
6 through 11
12 through 17
NOTE: Percentage was calculated by dividing the number of students in the age group served under IDEA, Part B, in the year by the estimated U.S. resident population in the age group for that year, then multiplying the result by 100. SOURCE: U.S. Department of Education, EDFacts Data Warehouse (EDW), OMB #1875-0240: “IDEA Part B Child Count and Educational Environments Collection,” 2005–14. These data are for the 50 states, DC, and BIE schools with the following exceptions. For 2007 and 2008, data for Vermont were not available. For 2010 and 2014, data for Wyoming were not available. For 2011 and 2013, data for BIE schools were not available. U.S. Department of Commerce, U.S. Census Bureau. “Intercensal Estimates of the Resident Population by Single Year of Age and Sex for States and the United States: April 1, 2000 to July 1, 2014,” 2005–14. These data are for the 50 states and DC with the following exceptions. For 2007 and 2008, data for Vermont were excluded. For 2010 and 2014, data for Wyoming were excluded. Students served through BIE schools are included in the population estimates of the individual states in which they reside. Data for 2005 through 2010 were accessed spring 2012. Data for 2011 were accessed fall 2012. Data for 2012 were accessed fall 2013. Data for 2013 were accessed fall 2014. Data for 2014 were accessed fall 2015. For actual data used, go to http://www2.ed.gov/about/reports/annual/osep/index.html.
• The percentage of the resident population ages 6 through 21 served under IDEA, Part B, in 2005 was 9.0 percent. Thereafter, the percentage stayed the same or slightly decreased, reaching a low of 8.4 percent in 2010. The percentage remained at 8.4 until 2013 when it increased to 8.5. In 2014, the percentage increased to 8.7.

37
• Between 2005 and 2011, the percentage of the population ages 6 through 11 served under IDEA, Part B, decreased gradually from 11.5 percent to 10.6 percent. The percentage increased in each year thereafter and reached 11.1 percent in 2014. The percentage of the population ages 12 through 17 served under Part B decreased gradually from 11.5 percent to 10.8 percent between 2005 and 2010, where it stayed until 2014 when the percentage reached 11 percent. The percentage of the population ages 18 through 21 served under Part B, was 1.9 percent in each year from 2005 through 2008, and 2 percent in each year from 2009 through 2014.
For what disabilities were students ages 6 through 21 served under IDEA, Part B?
Exhibit 20. Percentage of students ages 6 through 21 served under IDEA, Part B, by disability category: Fall 2014
Specific learning disabilities
(39.2%)
Speech or language
impairments (17.6%)
Other health impairments
(14.4%)
Autism (8.6%)
Intellectual disabilities
(7.0%)
Emotional disturbance
(5.9%)
Other disabilities combineda
(7.3%)
a“Other disabilities combined” includes deaf-blindness (less than 0.05 percent), developmental delay (2.4 percent), hearing impairments (1.1 percent), multiple disabilities (2.1 percent), orthopedic impairments (0.8 percent), traumatic brain injury (0.4 percent), and visual impairments (0.4 percent). NOTE: Percentage was calculated by dividing the number of students ages 6 through 21 served under IDEA, Part B, in the disability category by the total number of students ages 6 through 21 served under IDEA, Part B, then multiplying the result by 100. SOURCE: U.S. Department of Education, EDFacts Data Warehouse (EDW), OMB #1875-0240: “IDEA Part B Child Count and Educational Environments Collection,” 2014. These data are for 49 states, DC, PR, three outlying areas, and the three freely associated states. Data were not available for Wyoming and American Samoa. Data were accessed fall 2015. For actual data used, go to http://www2.ed.gov/about/reports/annual/osep/index.html.
• In 2014, the most prevalent disability category of students ages 6 through 21 served under IDEA, Part B, was specific learning disabilities (39.2 percent). The next most common disability category was speech or language impairments (17.6 percent), followed by other

38
health impairments (14.4 percent), autism (8.6 percent), intellectual disabilities (7.0 percent), and emotional disturbance (5.9 percent).
• Students ages 6 through 21 in “Other disabilities combined” accounted for the remaining 7.3 percent of students ages 6 through 21 served under IDEA, Part B.
How have the percentages of the resident population ages 6 through 21 served under IDEA, Part B, for particular disabilities changed over time?
Exhibit 21. Percentage of the population ages 6 through 21 served under IDEA, Part B, by year and disability category: Fall 2005 through fall 2014
Disabilitya 2005 2006 2007 2008 2009 2010 2011 2012 2013 2014
All disabilities below 8.9 8.8 8.7 8.5 8.4 8.3 8.2 8.2 8.3 8.5 Autism 0.3 0.3 0.4 0.4 0.5 0.5 0.6 0.7 0.7 0.8 Deaf-blindness # # # # # # # # # # Emotional disturbance 0.7 0.7 0.7 0.6 0.6 0.6 0.5 0.5 0.5 0.5 Hearing impairments 0.1 0.1 0.1 0.1 0.1 0.1 0.1 0.1 0.1 0.1 Intellectual disabilities 0.8 0.8 0.7 0.7 0.7 0.6 0.6 0.6 0.6 0.6 Multiple disabilities 0.2 0.2 0.2 0.2 0.2 0.2 0.2 0.2 0.2 0.2 Orthopedic impairments 0.1 0.1 0.1 0.1 0.1 0.1 0.1 0.1 0.1 0.1 Other health impairments 0.8 0.9 0.9 1.0 1.0 1.0 1.1 1.1 1.2 1.3 Specific learning disabilities 4.1 4.0 3.8 3.7 3.6 3.5 3.4 3.4 3.4 3.4 Speech or language
impairments 1.7 1.7 1.7 1.6 1.6 1.6 1.5 1.5 1.5 1.5 Traumatic brain injury # # # # # # # # # # Visual impairments # # # # # # # # # # # Percentage was non-zero, but less than 0.05 or 5/100 of 1 percent. aStates’ use of the developmental delay category is optional for children ages 3 through 9 and is not applicable to children older than 9 years of age. Because the category is optional and the exhibit presents percentages that are based on the estimated U.S. resident population ages 6 through 21, the developmental delay category is not included in this exhibit. For information on the percentages of the population ages 6 through 9 reported under the category of developmental delay and states with differences in developmental delay reporting practices, see exhibits B-2 and B-3 in Appendix B. NOTE: Percentage was calculated by dividing the number of students ages 6 through 21 served under IDEA, Part B, in the disability category in the year by the estimated U.S. resident population ages 6 through 21 for that year, then multiplying the result by 100. SOURCE: U.S. Department of Education, EDFacts Data Warehouse (EDW), OMB #1875-0240: “IDEA Part B Child Count and Educational Environments Collection,” 2005–14. These data are for the 50 states, DC, and BIE schools with the following exceptions. For 2007 and 2008, data for Vermont were not available. For 2010 and 2014, data for Wyoming were not available. For 2011 and 2013, data for BIE schools were not available. U.S. Department of Commerce, U.S. Census Bureau. “Intercensal Estimates of the Resident Population by Single Year of Age and Sex for States and the United States: April 1, 2000 to July 1, 2014,” 2005–14. These data are for the 50 states and DC with the following exceptions. For 2007 and 2008, data for Vermont were excluded. For 2010 and 2014, data for Wyoming were excluded. Students served through BIE schools are included in the population estimates of the individual states in which they reside. Data for 2005 through 2010 were accessed spring 2012. Data for 2011 were accessed fall 2012. Data for 2012 were accessed fall 2013. Data for 2013 were accessed fall 2014. Data for 2014 were accessed fall 2015. For actual data used, go to http://www2.ed.gov/about/reports/annual/osep/index.html.
• The percentage of the resident population ages 6 through 21 served under IDEA, Part B, reported under each of three disability categories changed by more than two-tenths of a percentage point between 2005 and 2014. The percentages of the population reported under autism and other health impairments both increased by 0.5 of a percentage point and the

39
percentage of the population reported under specific learning disabilities decreased by 0.7 of a percentage point.
How have the percentages of resident populations ages 6 through 21 served under IDEA, Part B, that were reported under the category of autism changed over time?
Exhibit 22. Percentage of the population ages 6 through 21 served under IDEA, Part B, reported under the category of autism, by year and age group: Fall 2005 through fall 2014
0.0
0.2
0.4
0.6
0.8
1.0
1.2
2005 2006 2007 2008 2009 2010 2011 2012 2013 2014
Percent
Year
18 through 21
12 through 17
6 through 21
6 through 11
NOTE: Percentage was calculated by dividing the number of students in the age group served under IDEA, Part B, reported under the category of autism in the year by the estimated U.S. resident population in the age group for that year, then multiplying the result by 100. This graph is scaled to demonstrate the change in the percentage of the population represented by students reported under the category of autism. The slope cannot be compared with the slopes of exhibits 23 and 24. SOURCE: U.S. Department of Education, EDFacts Data Warehouse (EDW), OMB #1875-0240: “IDEA Part B Child Count and Educational Environments Collection,” 2005–14. These data are for the 50 states, DC, and BIE schools with the following exceptions. For 2007 and 2008, data for Vermont were not available. For 2010 and 2014, data for Wyoming were not available. For 2011 and 2013, data for BIE schools were not available. U.S. Department of Commerce, U.S. Census Bureau. “Intercensal Estimates of the Resident Population by Single Year of Age and Sex for States and the United States: April 1, 2000 to July 1, 2014,” 2005–14. These data are for the 50 states and DC with the following exceptions. For 2007 and 2008, data for Vermont were excluded. For 2010 and 2014, data for Wyoming were excluded. Students served through BIE schools are included in the population estimates of the individual states in which they reside. Data for 2005 through 2010 were accessed spring 2012. Data for 2011 were accessed fall 2012. Data for 2012 were accessed fall 2013. Data for 2013 were accessed fall 2014. Data for 2014 were accessed fall 2015. For actual data used, go to http://www2.ed.gov/about/reports/annual/osep/index.html.
• Between 2005 and 2014, the percentage of the resident population ages 6 through 21 served under IDEA, Part B, that was reported under the category of autism increased gradually from 0.3 percent to 0.8 percent.

40
• Between 2005 and 2014, the percentages of the populations ages 6 through 11, 12 through 17, and 18 through 21 served under IDEA, Part B, that were reported under the category of autism all increased. Specifically, the percentages of these three age groups that were reported under the category of autism were 124 percent, 213 percent, and 236 percent larger in 2014 than in 2005, respectively.
How have the percentages of resident populations ages 6 through 21 served under IDEA, Part B, that were reported under the category of other health impairments changed over time?
Exhibit 23. Percentage of the population ages 6 through 21 served under IDEA, Part B, reported under the category of other health impairments, by year and age group: Fall 2005 through fall 2014
0.0
0.2
0.4
0.6
0.8
1.0
1.2
1.4
1.6
1.8
2.0
2005 2006 2007 2008 2009 2010 2011 2012 2013 2014
Percent
Year
18 through 21
6 through 21
6 through 11
12 through 17
NOTE: Percentage was calculated by dividing the number of students in the age group served under IDEA, Part B, reported under the category of other health impairments in the year by the estimated U.S. resident population in the age group for that year, then multiplying the result by 100. This graph is scaled to demonstrate the change in the percentage of the population represented by students reported under the category of other health impairments. The slope cannot be compared with the slopes of exhibits 22 and 24. SOURCE: U.S. Department of Education, EDFacts Data Warehouse (EDW), OMB #1875-0240: “IDEA Part B Child Count and Educational Environments Collection,” 2005–14. These data are for the 50 states, DC, and BIE schools with the following exceptions. For 2007 and 2008, data for Vermont were not available. For 2010 and 2014, data for Wyoming were not available. For 2011 and 2013, data for BIE schools were not available. U.S. Department of Commerce, U.S. Census Bureau. “Intercensal Estimates of the Resident Population by Single Year of Age and Sex for States and the United States: April 1, 2000 to July 1, 2014,” 2005–14. These data are for the 50 states and DC with the following exceptions. For 2007 and 2008, data for Vermont were excluded. For 2010 and 2014, data for Wyoming were excluded. Students served through BIE schools are included in the population estimates of the individual states in which they reside. Data for 2005 through 2010 were accessed spring 2012. Data for 2011 were accessed fall 2012. Data for 2012 were accessed fall 2013. Data for 2013 were accessed fall 2014. Data for 2014 were accessed fall 2015. For actual data used, go to http://www2.ed.gov/about/reports/annual/osep/index.html.

41
• From 2005 through 2014, the percentage of the resident population ages 6 through 21 served under IDEA, Part B, that was reported under the category of other health impairments increased gradually from 0.8 percent to 1.3 percent.
• The percentages of the populations ages 6 through 11, 12 through 17, and 18 through 21 served under IDEA, Part B, that were reported under the category of other health impairments were 43 percent, 55 percent, and 95 percent larger in 2014 than in 2005, respectively.
How have the percentages of resident populations ages 6 through 21 served under IDEA, Part B, that were reported under the category of specific learning disabilities changed over time?
Exhibit 24. Percentage of the population ages 6 through 21 served under IDEA, Part B, reported under the category of specific learning disabilities, by year and age group: Fall 2005 through fall 2014
0
1
2
3
4
5
6
7
2005 2006 2007 2008 2009 2010 2011 2012 2013 2014
Percent
Year
18 through 21
6 through 11
6 through 21
12 through 17
NOTE: Percentage was calculated by dividing the number of students in the age group served under IDEA, Part B, reported under the category of specific learning disabilities in the year by the estimated U.S. resident population in the age group for that year, then multiplying the result by 100. This graph is scaled to demonstrate the change in the percentage of the population represented by students reported under the category of specific learning disabilities. The slope cannot be compared with the slopes of exhibits 22 and 23. SOURCE: U.S. Department of Education, EDFacts Data Warehouse (EDW), OMB #1875-0240: “IDEA Part B Child Count and Educational Environments Collection,” 2005–14. These data are for the 50 states, DC, and BIE schools with the following exceptions. For 2007 and 2008, data for Vermont were not available. For 2010 and 2014, data for Wyoming were not available. For 2011 and 2013, data for BIE schools were not available. U.S. Department of Commerce, U.S. Census Bureau. “Intercensal Estimates of the Resident Population by Single Year of Age and Sex for States and the United States: April 1, 2000 to July 1, 2014,” 2005–14. These data are for the 50 states and DC with the following exceptions. For 2007 and 2008, data for Vermont were excluded. For 2010 and 2014, data for Wyoming were excluded. Students served through BIE schools are included in the population estimates of the individual states in which they reside. Data for 2005 through 2010 were accessed spring 2012. Data for 2011 were accessed fall 2012. Data for 2012 were accessed fall 2013. Data for 2013 were accessed fall 2014. Data for 2014 were accessed fall 2015. For actual data used, go to http://www2.ed.gov/about/reports/annual/osep/index.html.

42
• From 2005 through 2014, the percentage of the resident population ages 6 through 21 served under IDEA, Part B, that was reported under the category of specific learning disabilities decreased from 4.1 percent to 3.4 percent.
• The percentages of the populations ages 6 through 11, 12 through 17, and 18 through 21 served under IDEA, Part B, that were reported under the category of specific learning disabilities were 16 percent, 16 percent, and 8 percent smaller in 2014 than in 2005, respectively.
How did the percentage of the resident population ages 6 through 21 served under IDEA, Part B, for a particular racial/ethnic group compare to the percentage of the resident population served for all other racial/ethnic groups combined?
Exhibit 25. Number of students ages 6 through 21 served under IDEA, Part B, and percentage of the population served (risk index), comparison risk index, and risk ratio for children ages 6 through 21 served under IDEA, Part B, by race/ethnicity: Fall 2014
Race/ethnicity Child counta in the 50
states and DC
Resident population
ages 6 through 21 in
the 50 states and DCb
Risk indexc
(%)
Risk index for all other racial/ethnic
groups combinedd
(%) Risk
ratioe Total 5,825,505 67,039,493 8.7 † †
American Indian or Alaska Native 83,772 577,849 14.5 8.6 1.7 Asian 135,332 3,218,227 4.2 8.9 0.5 Black or African American 1,097,252 9,456,868 11.6 8.2 1.4 Hispanic/Latino 1,359,140 15,532,699 8.8 8.7 1.0 Native Hawaiian or Other Pacific
Islander 17,873 129,903 13.8 8.7 1.6 White 2,954,032 35,773,300 8.3 9.2 0.9 Two or more races 178,104 2,350,647 7.6 8.7 0.9 † Not applicable. aChild count is the number of children ages 6 through 21 served under IDEA, Part B, in the racial/ethnic group(s). bChildren served through BIE schools are included in the population estimates of the individual states in which they reside. cPercentage of the population served may be referred to as the risk index. It was calculated by dividing the number of children ages 6 through 21 served under IDEA, Part B, in the racial/ethnic group by the estimated U.S. resident population ages 6 through 21 in the racial/ethnic group, then multiplying the result by 100. dRisk index for all other racial/ethnic groups combined (i.e., children who are not in the racial/ethnic group of interest) was calculated by dividing the number of children ages 6 through 21 served under IDEA, Part B, in all of the other racial/ethnic groups by the estimated U.S. resident population ages 6 through 21 in all of the other racial/ethnic groups, then multiplying the result by 100. eRisk ratio compares the proportion of a particular racial/ethnic group served under IDEA, Part B, to the proportion served among the other racial/ethnic groups combined. For example, if racial/ethnic group X has a risk ratio of 2 for receipt of special education services, then that group’s likelihood of receiving special education services is twice as great as for all of the other racial/ethnic groups combined. Risk ratio was calculated by dividing the risk index for the racial/ethnic group by the risk index for all the other racial/ethnic groups combined. SOURCE: U.S. Department of Education, EDFacts Data Warehouse (EDW), OMB #1875-0240: “IDEA Part B Child Count and Educational Environments Collection,” 2014. These data are for 49 states, DC, and BIE schools. Data for Wyoming were not available. U.S. Department of Commerce, U.S. Census Bureau. “Intercensal Estimates of the Resident Population by Single Year of Age, Sex, Race, and Hispanic Origin for States and the United States: April 1, 2000 to July 1, 2014,” 2014. These data are for 49 states, DC, and BIE schools. Data for Wyoming were excluded. Data were accessed fall 2015. For actual data used, go to http://www2.ed.gov/about/reports/annual/osep/index.html.

43
• In 2014, American Indian or Alaska Native, Black or African American, and Native Hawaiian or Other Pacific Islander children ages 6 through 21 had risk ratios above 1 (i.e., 1.7, 1.4, and 1.6, respectively). This indicates that the children in each group were more likely to be served under Part B than were the children ages 6 through 21 in all other racial/ethnic groups combined.
• Asian and White children ages 6 through 21 as well as children ages 6 through 21 associated with two or more racial/ethnic groups, with risk ratios of less than 1 (i.e., 0.5, 0.9, and 0.9, respectively), were less likely to be served under Part B than were the children ages 6 through 21 in all other racial/ethnic groups combined.
• Hispanic/Latino children ages 6 through 21, with a risk ratio of 1 were as likely to be served under Part B as children ages 6 through 21 in all other racial/ethnic groups combined.

44
How did the percentage of the resident population ages 6 through 21 served under IDEA, Part B, for a particular racial/ethnic group and within the different disability categories compare to the percentage of the resident population served for all other racial/ethnic groups combined?
Exhibit 26. Risk ratio for students ages 6 through 21 served under IDEA, Part B, within racial/ethnic groups by disability category: Fall 2014
Disability American Indian or
Alaska Native Asian
Black or African
American Hispanic/
Latino
Native Hawaiian or Other
Pacific Islander White
Two or more races
All disabilities 1.68 0.47 1.41 1.01 1.59 0.90 0.87 Autism 0.94 1.11 0.99 0.79 1.32 1.16 0.97 Deaf-blindness! 2.31 0.81 0.76 1.04 3.40 1.10 0.79 Developmental delaya 4.09 0.41 1.68 0.69 2.35 0.91 1.24 Emotional disturbance 1.68 0.18 2.08 0.61 1.30 0.96 1.19 Hearing impairments 1.35 1.17 1.03 1.35 2.71 0.76 0.77 Intellectual disabilities 1.58 0.50 2.22 0.94 1.64 0.70 0.71 Multiple disabilities 1.90 0.63 1.36 0.73 1.94 1.11 0.72 Orthopedic
impairments 1.01 0.88 0.86 1.21 1.50 0.97 0.76 Other health
impairments 1.39 0.28 1.38 0.63 1.38 1.28 0.97 Specific learning
disabilities 1.96 0.31 1.51 1.31 1.88 0.73 0.76 Speech or language
impairments 1.40 0.69 1.02 1.08 1.09 0.99 0.90 Traumatic brain injury 1.70 0.51 1.09 0.71 1.59 1.29 0.90 Visual impairments 1.51 0.92 1.12 0.97 1.78 0.98 0.80 ! Interpret data with caution. There were 24 American Indian or Alaska Native students, 48 Asian students, 135 Black or African American students, 290 Hispanic or Latino students, 8 Native Hawaiian students, 680 White students, and 34 students associated with two or more races reported in the deaf-blindness category. aStates’ use of the developmental delay category is optional for children ages 3 through 9 and is not applicable to children older than 9 years of age. NOTE: Risk ratio compares the proportion of a particular racial/ethnic group served under IDEA, Part B, to the proportion served among the other racial/ethnic groups combined. For example, if racial/ethnic group X has a risk ratio of 2 for receipt of special education services, then that group’s likelihood of receiving special education services is twice as great as for all of the other racial/ethnic groups combined. Risk ratio was calculated by dividing the risk index for the racial/ethnic group by the risk index for all the other racial/ethnic groups combined. SOURCE: U.S. Department of Education, EDFacts Data Warehouse (EDW), OMB #1875-0240: “IDEA Part B Child Count and Educational Environments Collection,” 2014. These data are for 49 states, DC, and BIE schools. Data for Wyoming were not available. U.S. Department of Commerce, U.S. Census Bureau. “Intercensal Estimates of the Resident Population by Single Year of Age, Sex, Race, and Hispanic Origin for States and the United States: April 1, 2000 to July 1, 2014,” 2014. These data are for 49 states, DC, and BIE schools. Data for Wyoming were excluded. Data were accessed fall 2015. For actual data used, go to http://www2.ed.gov/about/reports/annual/osep/index.html.
• In 2014, American Indian or Alaska Native students, Black or African American students, and Native Hawaiian or Other Pacific Islander students ages 6 through 21 were more likely to be served under IDEA, Part B, than were students ages 6 through 21 in all other racial/ethnic groups combined (1.68, 1.41, and 1.59, respectively). Asian students, White students, and students associated with two or more races ages 6 through 21 were less likely to be served

45
under IDEA, Part B, than were students ages 6 through 21 in all other racial/ethnic groups combined (0.47, 0.90, and 0.87, respectively). Hispanic/Latino students were about as likely to be served under IDEA, Part B, as were students ages 6 through 21 in all other racial/ethnic groups combined (1.01).
• American Indian or Alaska Native students ages 6 through 21 were 4.09 times more likely to be served under IDEA, Part B, for developmental delay than students ages 6 through 21 in all other racial/ethnic groups combined. The risk ratio for American Indian or Alaska Native students ages 6 through 21 was larger than the risk ratio for the students ages 6 through 21 in all other racial/ethnic groups combined for all disability categories except autism (0.94).
• Asian students ages 6 through 21 were 1.11 and 1.17 times more likely to be served under IDEA, Part B, for autism and hearing impairments, respectively, than were students ages 6 through 21 in all other racial/ethnic groups combined. The risk ratio for Asian students ages 6 through 21 was smaller than the risk ratio for the students ages 6 through 21 in all other racial/ethnic groups combined for each of the other disability categories.
• Black or African American students ages 6 through 21 were 2.08 and 2.22 times more likely to be served under IDEA, Part B, for emotional disturbance and intellectual disabilities, respectively, than were the students ages 6 through 21 in all other racial/ethnic groups combined. The risk ratio for Black or African American students ages 6 through 21 was larger than the risk ratio for the students ages 6 through 21 in all other racial/ethnic groups combined for every disability category except autism (0.99), deaf-blindness (0.76), and orthopedic impairments (0.86).
• Hispanic or Latino students ages 6 through 21 were 1.04, 1.35, 1.21, 1.31, and 1.08 times more likely to be served under IDEA, Part B, for deaf-blindness, hearing impairments, orthopedic impairments, specific learning disabilities, and speech and language impairments, respectively, than were students ages 6 through 21 in all other racial/ethnic groups combined.
• Native Hawaiian or Other Pacific Islander students ages 6 through 21 were 3.4, 2.35, and 2.71 times more likely to be served under IDEA, Part B, for deaf-blindness, developmental delay, and hearing impairments, respectively, than were students ages 6 through 21 in all other racial/ethnic groups combined. The risk ratio for Native Hawaiian or Other Pacific Islander students ages 6 through 21 was larger than the risk ratio for the students ages 6 through 21 in all other racial/ethnic groups combined for every other disability category as well.
• White students ages 6 through 21 were 1.16, 1.1, 1.11, 1.28, and 1.29 times more likely to be served under IDEA, Part B, for autism, deaf-blindness, multiple disabilities, other health impairments, and traumatic brain injury, respectively, than were students ages 6 through 21 in all other racial/ethnic groups combined.
• Students ages 6 through 21 associated with two or more races were 1.24 and 1.19 times more likely to be served under IDEA, Part B, for developmental delay and emotional disturbance, respectively, than were students ages 6 through 21 in all other racial/ethnic groups combined. The risk ratio for students ages 6 through 21 associated with two or more races was smaller than the risk ratio for the students ages 6 through 21 in all other racial/ethnic groups combined for every other disability category.

46
How did the percentages of students ages 6 through 21 served under IDEA, Part B, in the disability categories differ for the racial/ethnic groups?
Exhibit 27. Percentage of students ages 6 through 21 served under IDEA, Part B, within racial/ethnic groups, by disability category: Fall 2014
Disability American Indian or
Alaska Native Asian
Black or African
American Hispanic/
Latino
Native Hawaiian or Other
Pacific Islander White
Two or more races
All disabilities 100.0 100.0 100.0 100.0 100.0 100.0 100.0 Autism 5.0 20.1 6.5 6.9 6.3 9.8 9.8 Deaf-blindness # # # # 0.1 # # Developmental delaya 5.8 2.1 2.8 1.7 3.5 2.4 3.4 Emotional disturbance 5.9 2.3 8.0 3.7 4.4 6.1 8.0 Hearing impairments 0.9 2.8 0.9 1.4 2.3 1.1 1.0 Intellectual disabilities 6.6 7.4 10.0 6.5 6.3 6.2 5.8 Multiple disabilities 2.4 2.9 2.1 1.6 2.8 2.4 1.8 Orthopedic impairments 0.5 1.4 0.5 0.9 0.8 0.8 0.7 Other health impairments 12.0 8.5 14.1 10.3 11.2 16.9 16.0 Specific learning
disabilities 45.4 25.7 41.1 47.4 50.7 35.0 34.4 Speech or language
impairments 14.7 25.4 13.4 19.0 10.4 18.3 18.1 Traumatic brain injury 0.4 0.5 0.4 0.3 0.4 0.5 0.5 Visual impairments 0.4 0.8 0.4 0.4 0.9 0.4 0.4 # Percentage was non-zero, but less than 0.05 or 5/100 of 1 percent. aStates’ use of the developmental delay category is optional for children ages 3 through 9 and is not applicable to children older than 9 years of age. For more information on students ages 6 through 9 reported under the category of developmental delay and states with differences in developmental delay reporting practices, see exhibits B-2 and B-3 in Appendix B. NOTE: Percentage was calculated by dividing the number of students ages 6 through 21 served under IDEA, Part B, in the racial/ethnic group and disability category by the total number of students ages 6 through 21 served under IDEA, Part B, in the racial/ethnic group and all disability categories, then multiplying the result by 100. The sum of column percentages may not total 100 because of rounding. SOURCE: U.S. Department of Education, EDFacts Data Warehouse (EDW), OMB #1875-0240: “IDEA Part B Child Count and Educational Environments Collection,” 2014. These data are for 49 states, DC, BIE schools, PR, three outlying areas, and the three freely associated states. Data were not available for Wyoming and American Samoa. Data were accessed fall 2015. For actual data used, go to http://www2.ed.gov/about/reports/annual/osep/index.html.
• For the students ages 6 through 21 served under IDEA, Part B, in 2014, specific learning disabilities was the most prevalent disability category for every racial/ethnic group. In particular, this disability category accounted for 45.4 percent of American Indian or Alaska Native students, 25.7 percent of Asian students, 41.1 percent of Black or African American students, 47.4 percent of Hispanic/Latino students, 50.7 percent of Native Hawaiian or Other Pacific Islander students, 35 percent of White students, and 34.4 percent of the children associated with two or more racial/ethnic groups.
• Speech or language impairments was the second or third most prevalent category for students ages 6 through 21 in every racial/ethnic group. The students served in this disability category accounted for 14.7 percent of American Indian or Alaska Native students, 25.4 percent of Asian students, 13.4 percent of Black or African American students, 19 percent of Hispanic/

47
Latino students, 10.4 percent of Native Hawaiian or Other Pacific Islander students, 18.3 percent of White students, and 18.1 percent of the students associated with two or more racial/ethnic groups.
Educational Environments for Students Ages 6 Through 21 Served Under IDEA, Part B
To what extent were students served under IDEA, Part B, educated with their peers without disabilities?
Exhibit 28. Percentage of students ages 6 through 21 served under IDEA, Part B, by educational environment: Fall 2014
Inside the regular classa 80% or
more of the dayb (62.6%)
Inside the regular classa 40% to
79% of the day (18.6%)
Inside the regular classa less than 40% of the day
(13.5%)
Other environmentsc
(5.3%)
aPercentage of day spent inside the regular class is defined as the number of hours the student spends each day inside the regular classroom, divided by the total number of hours in the school day (including lunch, recess, and study periods), multiplied by 100. bStudents who received special education and related services outside the regular classroom for less than 21 percent of the school day were classified in the inside the regular class 80% or more of the day category. c“Other environments” consists of separate school (2.9 percent), residential facility (0.3 percent), homebound/hospital environment (0.4 percent), correctional facilities (0.2 percent), and parentally placed in private schools (1.4 percent). NOTE: Percentage was calculated by dividing the number of students ages 6 through 21 served under IDEA, Part B, in the educational environment by the total number of students ages 6 through 21 served under IDEA, Part B, in all educational environments, then multiplying the result by 100. Due to rounding, it may not be possible to reproduce the value presented in the exhibit from the sum of the percentages associated with the individual categories. SOURCE: U.S. Department of Education, EDFacts Data Warehouse (EDW), OMB #1875-0240: “IDEA Part B Child Count and Educational Environments Collection,” 2014. These data are for 49 states, DC, BIE schools, PR, three outlying areas, and the three freely associated states. Data were not available for Wyoming and American Samoa. Data were accessed fall 2015. For actual data used, go to http://www2.ed.gov/about/reports/annual/osep/index.html.
• In 2014, a total of 94.7 percent of students ages 6 through 21 served under IDEA, Part B, were educated in regular classrooms for at least some portion of the school day.

48
• More than 60 percent of students ages 6 through 21 served under IDEA, Part B (62.6 percent), were educated inside the regular class 80% or more of the day.
• A total of 18.6 percent of students ages 6 through 21 served under IDEA, Part B, were educated inside the regular class no more than 79% of the day and no less than 40% of the day, and 13.5 percent were educated inside the regular class less than 40% of the day.
• Only 5.3 percent of students ages 6 through 21 served under IDEA, Part B, were educated outside of the regular classroom in “Other environments.”
How have the educational environments of students served under IDEA, Part B, changed over time?
Exhibit 29. Percentage of students ages 6 through 21 served under IDEA, Part B, by year and educational environment: Fall 2005 through fall 2014
0
10
20
30
40
50
60
70
2005 2006 2007 2008 2009 2010 2011 2012 2013 2014
Percent
Year
Inside the regular classa less than 40% of the day
Inside the regular classa 40% to 79% of the day
Inside the regular classa 80% or more of the dayb
Other environmentsc
aPercentage of day spent inside the regular class is defined as the number of hours the student spends each day inside the regular classroom, divided by the total number of hours in the school day (including lunch, recess, and study periods), multiplied by 100. bStudents who received special education and related services outside the regular classroom for less than 21 percent of the school day were classified in the inside the regular class 80% or more of the day category. c“Other environments” is calculated by subtracting the sum of students in the three categories concerning regular class from the total number of students reported in all categories. The categories that are not related to regular class consist of separate school, residential facility, homebound/hospital environment, correctional facilities, and parentally placed in private schools. NOTE: Percentage was calculated by dividing the number of students ages 6 through 21 served under IDEA, Part B, in the educational environment in the year by the total number of students ages 6 through 21 served under IDEA, Part B, in all educational environments for that year, then multiplying the result by 100. SOURCE: U.S. Department of Education, EDFacts Data Warehouse (EDW), OMB #1875-0240: “IDEA Part B Child Count and Educational Environments Collection,” 2005–14. These data are for the 50 states, DC, BIE schools, PR, and the four outlying areas with the following exceptions. For 2007 and 2008, data for Vermont were not available. For 2010, data for Wyoming were not available. For 2011, data for BIE schools were not available. For 2012, data for the three freely associated states were included. For 2013, data for BIE schools and American Samoa were not available, but data for the Republic of Palau and the

49
• From 2005 through 2014, the percentage of students ages 6 through 21 served under IDEA, Part B, educated inside the regular class 80% or more of the day increased from 53.6 percent to 62.6 percent.
• The percentage of students ages 6 through 21 served under IDEA, Part B, educated inside the regular class no more than 79% of the day and no less than 40% of the day decreased from 25.8 percent in 2005 to 18.6 percent in 2014. Similarly, the percentage of these students educated inside the regular class less than 40% of the day decreased from 16.6 percent to 13.5 percent between these years.
• The percentage of students ages 6 through 21 served under IDEA, Part B, educated in “Other environments” increased from 4 percent in 2005 to 5.3 percent in 2014. However, it had also accounted for as much as 5.3 percent in 2007 and 2009.
Republic of the Marshall Islands were available. For 2014, data for Wyoming and American Samoa were not available, but data for the Federated States of Micronesia, the Republic of Palau, and the Republic of the Marshall Islands were available. Data for 2005 through 2010 were accessed spring 2012. Data for 2011 were accessed fall 2012. Data for 2012 were accessed fall 2013. Data for 2013 were accessed fall 2014. Data for 2014 were accessed fall 2015. For actual data used, go to http://www2.ed.gov/about/reports/annual/osep/index.html.

50
How did educational environments differ by disability category?
Exhibit 30. Percentage of students ages 6 through 21 served under IDEA, Part B, within disability category, by educational environment: Fall 2014
Disability Percentage of day inside the regular classa
80% or more of the dayb
40% to 79% of the day
Less than 40% of the day
Other environmentsc
All disabilities 62.6 18.6 13.5 5.3 Autism 39.9 18.0 32.8 9.2 Deaf-blindness 23.2 13.4 34.4 29.0 Developmental delayd 63.7 19.1 15.7 1.5 Emotional disturbance 46.2 17.6 18.8 17.5 Hearing impairments 60.2 15.5 11.6 12.8 Intellectual disabilities 16.9 26.3 49.2 7.6 Multiple disabilities 13.4 16.4 46.0 24.3 Orthopedic impairments 54.5 15.9 21.8 7.9 Other health impairments 65.4 21.0 9.3 4.3 Specific learning disabilities 69.2 23.0 5.8 2.0 Speech or language impairments 86.8 5.1 4.3 3.8 Traumatic brain injury 49.9 22.2 19.6 8.3 Visual impairments 66.3 12.3 10.3 11.1 aPercentage of day spent inside the regular class is defined as the number of hours the student spends each day inside the regular classroom, divided by the total number of hours in the school day (including lunch, recess, and study periods), multiplied by 100. bStudents who received special education and related services outside the regular classroom for less than 21 percent of the school day were classified in the inside the regular class 80% or more of the day category. c“Other environments” consists of separate school, residential facility, homebound/hospital environment, correctional facilities, and parentally placed in private schools. dStates’ use of the developmental delay category is optional for children ages 3 through 9 and is not applicable to children older than 9 years of age. For more information on students ages 6 through 9 reported under the category of developmental delay and states with differences in developmental delay reporting practices, see exhibits B-2 and B-3 in Appendix B. NOTE: Percentage was calculated by dividing the number of students ages 6 through 21 served under IDEA, Part B, in the disability category and the educational environment by the total number of students ages 6 through 21 served under IDEA, Part B, in the disability category and all educational environments for that year, then multiplying the result by 100. The sum of row percentages may not total 100 because of rounding. SOURCE: U.S. Department of Education, EDFacts Data Warehouse (EDW), OMB #1875-0240: “IDEA Part B Child Count and Educational Environments Collection,” 2014. These data are for 49 states, DC, BIE schools, PR, three outlying areas, and the three freely associated states. Data were not available for Wyoming and American Samoa. Data were accessed fall 2015. For actual data used, go to http://www2.ed.gov/about/reports/annual/osep/index.html.
• In 2014, the percentage of students ages 6 through 21 served under IDEA, Part B, in each educational environment varied by disability category.
• More than 8 in 10 students reported under the category of speech or language impairments (86.8 percent) were educated inside the regular class 80% or more of the day.
• Only 16.9 percent of students reported under the category of intellectual disabilities and 13.4 percent of students reported under the category of multiple disabilities were educated inside the regular class 80% or more of the day.

51
• Almost one-half of students reported under the category of intellectual disabilities (49.2 percent) and students reported under the category of multiple disabilities (46.0 percent) were educated inside the regular class less than 40% of the day.
• In 2014, larger percentages of students reported under the categories of deaf-blindness (29.0 percent) and multiple disabilities (24.3 percent) than students reported under other disability categories were educated in “Other environments.”
To what extent were students with disabilities in different racial/ethnic groups being educated with their peers without disabilities?
Exhibit 31. Percentage of students ages 6 through 21 served under IDEA, Part B, within racial/ethnic groups, by educational environment: Fall 2014
63.8
65.3
54.9
61.6
57.4
56.7
63.8
18.6
18.2
26.3
18.6
19.6
16.5
22.7
13.1
10.8
15.0
15.8
17.1
21.0
10.6
4.4
5.8
3.8
4.0
5.9
5.8
3.0
0 20 40 60 80 100
Two or more races
White
Native Hawaiian or Other Pacific Islander
Hispanic/Latino
Black or African American
Asian
American Indian or Alaska Native
Percent
Race/ethnicity
Inside the regular classa 80% or more of the dayb Inside the regular classa 40% to 79% of the day Inside the regular classa less than 40% of the day Other environmentsc
aPercentage of day spent inside the regular class is defined as the number of hours the student spends each day inside the regular classroom, divided by the total number of hours in the school day (including lunch, recess, and study periods), multiplied by 100. bStudents who received special education and related services outside the regular classroom for less than 21 percent of the school day were classified in the inside the regular class 80% or more of the day category. c“Other environments” includes separate school, residential facility, homebound/hospital environment, correctional facilities, and parentally placed in private schools. NOTE: Percentage was calculated by dividing the number of students ages 6 through 21 served under IDEA, Part B, in the racial/ethnic group and educational environment by the total number of students ages 6 through 21 served under IDEA, Part B, in the racial/ethnic group and all the educational environments, then multiplying the result by 100. The sum of bar percentages may not total 100 because of rounding. SOURCE: U.S. Department of Education, EDFacts Data Warehouse (EDW), OMB #1875-0240: “IDEA Part B Child Count and Educational Environments Collection,” 2014. These data are for 49 states, DC, BIE schools, PR, three outlying areas, and the three freely associated states. Data were not available for Wyoming and American Samoa. Data were accessed fall 2015. For actual data used, go to http://www2.ed.gov/about/reports/annual/osep/index.html.

52
• In 2014 for each racial/ethnic group, the largest percentage of students ages 6 through 21 served under IDEA, Part B, was educated inside the regular class 80% or more of the day. The students who were educated inside the regular class 80% or more of the day accounted for at least 50 percent of the students in each of the racial/ethnic groups. The percentages of students in the racial/ethnic groups who were educated inside the regular class 80% or more of the day ranged from 54.9 percent to 65.3 percent.
• The category inside the regular class no more than 79% of the day and no less than 40% of the day accounted for between 16.5 and 26.3 percent of the students within each racial/ethnic group. In contrast, less than 20 percent of the students within each racial/ethnic group, except for Asian students (21.0 percent), were educated inside the regular class less than 40% of the day.
• “Other environments” accounted for less than 6 percent of the students within each racial/ethnic group.

53
Part B Participation and Performance on State Assessments
What percentages of students served under IDEA, Part B, participated in regular and alternate state math and reading assessments?
Exhibit 32. Percentages of students served under IDEA, Part B, in grades 3 through 8 and high school who participated in state math and reading assessments, by assessment type: School year 2013–14
Content area and student grade level
Regular assessment (grade-level standards)a Alternate assessmentb
With accommodations
Without accommodations
Field test
Grade- level
standardsc Modified
standardsd
Alternate standardse
non-field test
Alternate standardse Field test
Math Grade 3f 44.9 28.4 11.4 # 4.2 8.7 0.1 Grade 4g 47.7 23.8 11.6 0.0 5.8 8.6 0.1 Grade 5h 48.5 21.2 11.8 # 7.1 8.9 0.1 Grade 6i 48.5 21.0 11.2 # 7.1 9.1 0.1 Grade 7h 48.0 21.3 10.6 # 7.1 9.2 0.1 Grade 8i 47.4 21.3 10.5 # 7.2 9.3 0.1 High schooli 41.3 37.9 1.0 # 4.1 9.4 0.1
Readingj Grade 3k 41.1 31.3 11.4 0.1 4.8 8.7 0.1 Grade 4l 43.7 27.3 11.6 # 6.2 8.7 0.1 Grade 5m 45.3 24.2 11.8 # 7.3 8.9 0.1 Grade 6n 45.3 24.2 11.2 # 7.1 9.1 0.1 Grade 7m 44.8 24.9 10.7 # 7.0 9.2 0.1 Grade 8n 44.6 24.8 10.5 # 6.9 9.2 0.1 High schooln 40.8 37.1 0.9 # 5.9 8.9 0.1
# Percentage was non-zero, but less than 0.05 or 5/100 of 1 percent. aRegular assessment based on grade-level academic achievement standards is an assessment that is designed to measure the student’s knowledge and skills in a particular subject matter based on academic achievement content for the grade in which the student is enrolled. bAlternate assessment is an assessment that is designed to measure the performance of students who are unable to participate in regular assessments even with accommodations. The student’s individualized education program (IEP) team makes the determination of whether a student is able to take the regular assessment. cAlternate assessment based on grade-level academic achievement standards is an alternate assessment that is designed to measure the academic achievement of students with disabilities based on the same grade-level achievement standards measured by the state’s regular assessment. Such assessments are available to students who the IEP team determines cannot participate in all or part of the state assessments under paragraph (a)(1) of 34 C.F.R. section 200.6, even with appropriate accommodations. This assessment must yield results for the grade in which the student is enrolled in at least reading/language arts, mathematics, and, since the 2007–08 school year, science, except as provided in 34 C.F.R. section 200.6(a)(2)(ii)(B). dAlternate assessment based on modified academic achievement standards is an alternate assessment that is designed to measure the academic achievement of students with disabilities who access the general grade-level curriculum, but whose disabilities have precluded them from achieving grade-level proficiency and who (as determined by the IEP team) are not expected to achieve grade-level proficiency within the year covered by the IEP. eAlternate assessment based on alternate academic achievement standards is an alternate assessment that is designed to measure the academic achievement of students with the most significant cognitive disabilities. This assessment may yield results that measure the achievement standards that the state has defined under 34 C.F.R. section 200.1(d).

54
• In school year 2013–14, between 41.3 and 48.5 percent of students served under IDEA, Part B, in each of grades 3 through 8 and high school participated in a regular assessment based on grade-level academic achievement standards with accommodations in math. Between 21 and 28.4 percent of students served under IDEA, Part B, in each of grades 3 through 8 participated in a regular assessment based on grade-level academic achievement standards without accommodations in math. In contrast, 37.9 percent of students served under IDEA, Part B, in high school participated in a regular assessment based on grade-level academic achievement standards without accommodations in math. Between 10.5 and 11.8 percent of students served under IDEA, Part B, in each of grades 3 through 8 participated in a field test of a regular assessment based on grade-level academic achievement standards in math. In contrast, only 1 percent of students served under IDEA, Part B, in high school participated in a field test of a regular assessment based on grade-level academic achievement standards in math.
• Of all students who participated in some type of alternate assessment in math in school year 2013–14, larger percentages of these students in each of grades 3 through 8 and high school took an alternate assessment based on alternate academic achievement standards than the other three types of alternate tests.
• In school year 2013–14, between 40.8 and 45.3 percent of students served under IDEA, Part B, in each of grades 3 through 8 and high school participated in a regular assessment based on grade-level academic achievement standards with accommodations in reading. Between 24.2 and 37.1 percent of students served under IDEA, Part B, in each of grades 3 through 8 and high school participated in a regular assessment based on grade-level academic achievement standards without accommodations in reading. Between 10.5 and 11.8 percent of students served under IDEA, Part B, in each of grades 3 through 8 participated in a field test of a regular assessment based on grade-level academic achievement standards in reading. In contrast, only 0.9 percent of students served under IDEA, Part B, in high school participated in a field test of a regular assessment based on grade-level academic achievement standards in reading.
fNo students in this grade were assessed in math by the Federated States of Micronesia, Kansas, or the Republic of Palau. gNo students in this grade were assessed in math by Kansas or the Republic of the Marshall Islands. hNo students in this grade were assessed in math by the Federated States of Micronesia, Kansas, the Republic of Palau, or the Republic of the Marshall Islands. iNo students in this grade were assessed in math by Kansas. jPercentages of students who participated in the regular reading assessments include students with limited English proficiency served under IDEA, Part B, who, at the time of the reading assessments, had been in the United States fewer than 12 months and took the English language proficiency tests in place of the regular reading assessments. In the case of Puerto Rico, language proficiency is determined with regard to Spanish. kNo students in this grade were assessed in reading by the Federated States of Micronesia, Kansas, or the Republic of Palau. lNo students in this grade were assessed in reading by the Federated States of Micronesia, Kansas, or the Republic of the Marshall Islands. mNo students in this grade were assessed in reading by the Federated States of Micronesia, Kansas, the Republic of Palau, or the Republic of the Marshall Islands. nNo students in this grade were assessed in reading by Kansas. NOTE: Percentage was calculated by dividing the number of students served under IDEA, Part B, in the grade level who participated in the specific content area assessment and received a valid score and achievement level by the sum of the students served under IDEA, Part B, who participated in an assessment and students served under IDEA, Part B, who did not participate in an assessment, then multiplying the result by 100. Suppressed data were excluded. SOURCE: U.S. Department of Education, EDFacts Data Warehouse (EDW), OMB #1875-0240: “IDEA Part B Assessment Collection,” 2013–14. These data are for the 50 states, DC, PR, the four outlying areas, and the three freely associated states with the exceptions noted above and BIE schools. Data were accessed fall 2015. For actual data used, go to http://www2.ed.gov/about/reports/annual/osep/index.html.

55
• Of the students in each of grades 3 through 8 and high school who participated in some type of alternate assessment in reading in school year 2013–14, a larger percentage took an alternate assessment based on alternate academic achievement standards than the other three types of alternate tests.
What percentages of students served under IDEA, Part B, were classified as nonparticipants in state math and reading assessments?
Exhibit 33. Percentages of students served under IDEA, Part B, in grades 3 through 8 and high school classified as nonparticipants in state math and reading assessments, by nonparticipant category: School year 2013–14
Content area and student grade level
Students whose assessment results
were invalida
Students who took an out-of-
level testb
Students who did not take any
assessmentc Total Math
Grade 3d 0.20 0.00 2.19 2.39 Grade 4e 0.22 0.01 2.18 2.41 Grade 5f 0.27 0.01 2.19 2.47 Grade 6g 0.28 0.01 2.80 3.09 Grade 7f 0.32 0.01 3.26 3.58 Grade 8g 0.41 0.01 3.84 4.26 High schoolg 0.93 0.01 5.20 6.14
Reading
Grade 3h 0.23 0.03 2.12 2.38 Grade 4i 0.26 0.03 2.13 2.42 Grade 5j 0.28 0.01 2.10 2.39 Grade 6k 0.32 0.02 2.59 2.93 Grade 7j 0.36 0.02 2.97 3.35 Grade 8k 0.43 0.01 3.49 3.94 High schoolk 0.85 0.55 4.90 6.29
aStudents whose assessment results were invalid were students whose assessment results could not be used for reporting assessment performance to the Office of Special Education Programs/Department of Education due to problems in the testing process and/or changes in testing materials that resulted in a score deemed by the state to not yield a valid evaluation of a student’s level of achievement on grade-level content. Students whose test results were determined to be invalid are counted as nonparticipants. bStudents who took an out-of-level test were students who took an assessment that was at a grade level below which the students were enrolled during the reporting period. Students who are tested out of level are considered nonparticipants because out-of-grade-level tests do not result in a valid score. Note that out-of-level testing is not in accordance with the Elementary and Secondary Education Act, as specified in 34 C.F.R. section 200.1(b)(2). This category is included in this report only to ensure that all students with individualized education programs (IEPs) are fully accounted. States are expected to eliminate the out-of-level testing practice as required by statute. cStudents who did not take any assessment included students who received parental exemptions, students who were absent, and students who did not take any assessment for other reasons (e.g., exemptions due to a medical emergency, expulsion, or suspension). dNo students in this grade were assessed in math by the Federated States of Micronesia, Kansas, or the Republic of Palau. eNo students in this grade were assessed in math by Kansas or the Republic of the Marshall Islands. fNo students in this grade were assessed in math by the Federated States of Micronesia, Kansas, the Republic of Palau, or the Republic of the Marshall Islands. gNo students in this grade were assessed in math by Kansas.

56
• No more than 4.26 percent of students served under IDEA, Part B, who were expected to take a math assessment in each of grades 3 through 8 in school year 2013–14 were classified as nonparticipants. Similarly, no more than 3.94 percent of students served under IDEA, Part B, who were expected to take a reading assessment in each of grades 3 through 8 in school year 2013–14 were classified as nonparticipants. Larger percentages of the students served under IDEA, Part B, in high school in school year 2013–14 were classified as nonparticipants for both the math assessment (6.14 percent) and the reading assessment (6.29 percent).
• Of the three nonparticipant categories, students who did not take any assessment accounted for more of the nonparticipants in each grade in both math and reading. However, the percentage only exceeded 4 percent for high school students expected to be assessed in math (5.20 percent) and high school students expected to be assessed in reading (4.90 percent).
hNo students in this grade were assessed in reading by the Federated States of Micronesia, Kansas, or the Republic of Palau. iNo students in this grade were assessed in reading by the Federated States of Micronesia, Kansas, or the Republic of the Marshall Islands. jNo students in this grade were assessed in reading by the Federated States of Micronesia, Kansas, the Republic of Palau, or the Republic of the Marshall Islands. kNo students in this grade were assessed in reading by Kansas. NOTE: Percentage was calculated by dividing the number of students served under IDEA, Part B, in the grade level, content area, and nonparticipant category by the sum of the students served under IDEA, Part B, who participated in an assessment and students served under IDEA, Part B, who did not participate in an assessment, then multiplying the result by 100. Suppressed data were excluded. SOURCE: U.S. Department of Education, EDFacts Data Warehouse (EDW), OMB #1875-0240: “IDEA Part B Assessment Collection,” 2013–14. These data are for the 50 states, DC, PR, the four outlying areas, and the three freely associated states with the exceptions noted above and BIE schools. Data were accessed fall 2015. For actual data used, go to http://www2.ed.gov/about/reports/annual/osep/index.html.

57
What percentages of students served under IDEA, Part B, were found to be proficient with state math and reading assessments?
Exhibit 34. Numbers of states assessing students served under IDEA, Part B, in grades 3 through 8 and high school in math and reading and median percentages of those students who were proficient, by assessment type: School year 2013–14
Regular assessment
(grade-level standards)a
Alternate assessmentb Grade-level standardsc Modified standardsd Alternate standardse
Content area and student grade level Number
of states
Median percent
students proficient
Number of states
Median percent
students proficient
Number of states
Median percent
students proficient
Number of states
Median percent
students proficient
Math Grade 3fg 48 36.1 0 — 9 49.1 52 71.1 Grade 4hg 48 34.4 0 — 10 56.1 52 71.2 Grade 5ij 48 27.4 0 — 11 56.8 50 72.6 Grade 6kj 48 20.1 0 — 11 51.9 52 70.6 Grade 7ig 47 18.5 0 — 10 46.5 51 70.2 Grade 8kg 47 16.8 0 — 11 37.5 50 70.6 High schoolkl 48 18.7 0 — 8 35.7 50 70.4
Readingm Grade 3no 48 32.1 1 — 9 62.2 52 71.0 Grade 4po 48 29.0 1 — 10 59.0 52 73.0 Grade 5qr 47 29.1 1 — 11 59.8 51 74.1 Grade 6sr 48 25.0 1 — 11 43.4 53 71.7 Grade 7qr 47 23.1 1 — 11 55.0 51 72.1 Grade 8sr 47 23.3 1 — 11 56.5 50 75.7 High schoolst 49 25.0 0 — 7 54.5 48 71.4
— Median percentage cannot be calculated. aRegular assessment based on grade-level academic achievement standards is an assessment that is designed to measure the student’s knowledge and skills in a particular subject matter based on academic achievement content for the grade in which the student is enrolled. bAlternate assessment is an assessment that is designed to measure the performance of students who are unable to participate in regular assessments even with accommodations. The student’s individualized education program (IEP) team makes the determination of whether a student is able to take the regular assessment. cAlternate assessment based on grade-level academic achievement standards is an alternate assessment that is designed to measure the academic achievement of students with disabilities based on the same grade-level achievement standards measured by the state’s regular assessment. dAlternate assessment based on modified academic achievement standards is an alternate assessment that is designed to measure the academic achievement of students with disabilities who access the general grade-level curriculum, but whose disabilities have precluded them from achieving grade-level proficiency and who (as determined by the IEP team) are not expected to achieve grade-level proficiency within the year covered by the IEP. eAlternate assessment based on alternate academic achievement standards is an alternate assessment that is designed to measure the academic achievement of students with the most significant cognitive disabilities. This assessment may yield results that measure the achievement standards that the state has defined under 34 C.F.R. section 200.1(d). fNo students in this grade were assessed in math by the Federated States of Micronesia, Kansas, or the Republic of Palau. gSome students participated in a field test version of an assessment test in math in the following states: California, Connecticut, Idaho, Illinois, Maryland, Massachusetts, Mississippi, Montana, Oregon, South Dakota, Washington, and Wyoming.

58
• In school year 2013–14, between 47 and 48 of the 59 jurisdictions (i.e., the 50 states, the District of Columbia, Puerto Rico, the four outlying areas, and the three freely associated states) administered a regular assessment based on grade-level academic achievement standards in math to some students served under IDEA, Part B, in each of grades 3 through 8 and high school and had non-suppressed data. The median percentage of students served under IDEA, Part B, in grade 3, grade 4, and grade 5 who were found to be proficient with these math tests was 36.1 percent, 34.4 percent, and 27.4 percent, respectively. The median percentage of students in grade 6 through high school who were found to be proficient with these tests was in a range from 16.8 percent to 20.1 percent.
• An alternate assessment based on grade-level academic achievement standards for math was not administered by any jurisdiction to some students served under IDEA, Part B, in each of grades 3 through 8 and high school.
hNo students in this grade were assessed in math by Kansas or the Republic of the Marshall Islands. iNo students in this grade were assessed in math by the Federated States of Micronesia, Kansas, the Republic of Palau, or the Republic of the Marshall Islands. jSome students participated in a field test version of an assessment test in math in the following states: California, Connecticut, Idaho, Illinois, Maryland, Massachusetts, Mississippi, Montana, Oregon, South Dakota, Vermont, Washington, and Wyoming. kNo students in this grade were assessed in math by Kansas. lSome students participated in a field test version of an assessment test in math in the following states: Connecticut, Idaho, Illinois, Maryland, Massachusetts, Mississippi, Montana, Oregon, South Dakota, Washington, and Wyoming. mPercentages of students who participated in the regular reading assessments include students with limited English proficiency served under IDEA, Part B, who, at the time of the reading assessments, had been in the United States fewer than 12 months and took the English language proficiency tests in place of the regular reading assessments. In the case of Puerto Rico, language proficiency is determined with regard to Spanish. nNo students in this grade were assessed in reading by the Federated States of Micronesia, Kansas, or the Republic of Palau. oSome students participated in a field test version of an assessment test in reading in the following states: California, Connecticut, Idaho, Illinois, Iowa, Maryland, Massachusetts, Mississippi, Montana, Oregon, South Dakota, Vermont, Washington, and Wyoming. pNo students in this grade were assessed in reading by the Federated States of Micronesia, Kansas, or the Republic of the Marshall Islands. qNo students in this grade were assessed in reading by the Federated States of Micronesia, Kansas, the Republic of Palau, or the Republic of the Marshall Islands. rSome students participated in a field test version of an assessment test in reading in the following states: California, Connecticut, Idaho, Illinois, Iowa, Maryland, Massachusetts, Mississippi, Montana, Oregon, South Dakota, Washington, and Wyoming. sNo students in this grade were assessed in reading by Kansas. tSome students participated in a field test version of an assessment test in reading in the following states: Connecticut, Idaho, Illinois, Iowa, Maryland, Massachusetts, Mississippi, Montana, Oregon, South Dakota, Washington, and Wyoming. NOTE: “Students who were proficient” were students whom states considered proficient for purposes of Adequate Yearly Progress as reported under the Elementary and Secondary Education Act of 1965, as amended (ESEA). Median percentage represents the mid-point of the percentages calculated for all of the states for which non-suppressed data were available. The percentage for each state was calculated by dividing the number of students served under IDEA, Part B, in the grade level who were proficient in the specific content area assessment in the state by the total number of students served under IDEA, Part B, in the grade level who participated in the specific content area assessment and received a valid score and achievement level in the state, then multiplying the result by 100. SOURCE: U.S. Department of Education, EDFacts Data Warehouse (EDW), OMB #1875-0240: “IDEA Part B Assessment Collection,” 2013–14. These data are for the 50 states, DC, PR, the four outlying areas, and the three freely associated states with the exceptions noted above and BIE schools. Data were accessed fall 2015. For actual data used, go to http://www2.ed.gov/about/reports/annual/osep/index.html.

59
• An alternate assessment based on modified academic achievement standards for math was administered to some students served under IDEA, Part B, in each of grades 3 through 8 and high school by 8 to 11 jurisdictions. The median percentage of students served under IDEA, Part B, in each of grades 3 through 7 who were found to be proficient with these math tests was in a range from 46.5 percent to 56.8 percent. The median percentage of students in each of grade 8 and high school who were found to be proficient with these tests was 37.5 percent and 35.7 percent, respectively.
• Non-suppressed data were available for between 50 and 52 jurisdictions that administered an alternate assessment based on alternate academic achievement standards for math to some students served under IDEA, Part B, in each of grades 3 through 8 and high school. The median percentage of students served under IDEA, Part B, in each grade who were found to be proficient with these math tests was in a range from 70.2 percent to 72.6 percent.
• In school year 2013–14, between 47 and 49 of the 59 jurisdictions (i.e., the 50 states, the District of Columbia, Puerto Rico, the four outlying areas, and the three freely associated states) administered a regular assessment based on grade-level academic achievement standards in reading to some students served under IDEA, Part B, in each of grades 3 through 8 and high school and had non-suppressed data. The median percentages of these students who were found to be proficient with these reading tests ranged from 23.1 percent to 32.1 percent.
• An alternate assessment based on grade-level academic achievement standards for reading was administered by one jurisdiction to some students served under IDEA, Part B, in each of grades 3 through 8 and by no jurisdiction to students served under IDEA, Part B, in high school.
• An alternate assessment based on modified academic achievement standards for reading was administered by 7 to 11 jurisdictions to some students served under IDEA, Part B, in each of grades 3 through 8 and high school. The median percentage of students served under IDEA, Part B, in each grade except grade 6 who were found to be proficient with these reading tests was in a range from 54.5 percent to 62.2 percent. The median percentage of students served under IDEA, Part B, in grade 6 who were found to be proficient with these reading tests was 43.4 percent.
• Non-suppressed data were available for 48 to 53 jurisdictions that administered an alternate assessment based on alternate academic achievement standards for reading to some students served under IDEA, Part B, in each of grades 3 through 8 and high school. The median percentage of students served under IDEA, Part B, in each grade who were found to be proficient with these reading tests was in a range from 71 percent to 75.7 percent.
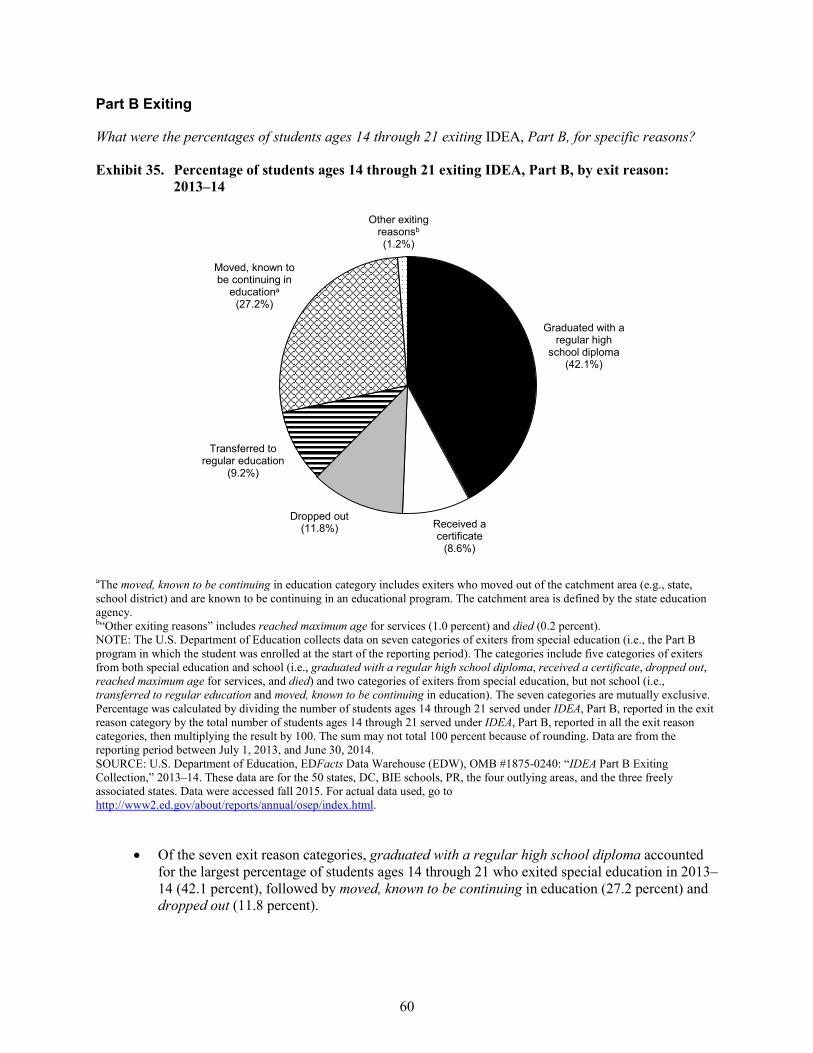
60
Part B Exiting
What were the percentages of students ages 14 through 21 exiting IDEA, Part B, for specific reasons?
Exhibit 35. Percentage of students ages 14 through 21 exiting IDEA, Part B, by exit reason: 2013–14
Graduated with a regular high
school diploma (42.1%)
Received a certificate
(8.6%)
Dropped out (11.8%)
Transferred to regular education
(9.2%)
Moved, known to be continuing in
educationa (27.2%)
Other exiting reasonsb (1.2%)
aThe moved, known to be continuing in education category includes exiters who moved out of the catchment area (e.g., state, school district) and are known to be continuing in an educational program. The catchment area is defined by the state education agency. b“Other exiting reasons” includes reached maximum age for services (1.0 percent) and died (0.2 percent). NOTE: The U.S. Department of Education collects data on seven categories of exiters from special education (i.e., the Part B program in which the student was enrolled at the start of the reporting period). The categories include five categories of exiters from both special education and school (i.e., graduated with a regular high school diploma, received a certificate, dropped out, reached maximum age for services, and died) and two categories of exiters from special education, but not school (i.e., transferred to regular education and moved, known to be continuing in education). The seven categories are mutually exclusive. Percentage was calculated by dividing the number of students ages 14 through 21 served under IDEA, Part B, reported in the exit reason category by the total number of students ages 14 through 21 served under IDEA, Part B, reported in all the exit reason categories, then multiplying the result by 100. The sum may not total 100 percent because of rounding. Data are from the reporting period between July 1, 2013, and June 30, 2014. SOURCE: U.S. Department of Education, EDFacts Data Warehouse (EDW), OMB #1875-0240: “IDEA Part B Exiting Collection,” 2013–14. These data are for the 50 states, DC, BIE schools, PR, the four outlying areas, and the three freely associated states. Data were accessed fall 2015. For actual data used, go to http://www2.ed.gov/about/reports/annual/osep/index.html.
• Of the seven exit reason categories, graduated with a regular high school diploma accounted for the largest percentage of students ages 14 through 21 who exited special education in 2013–14 (42.1 percent), followed by moved, known to be continuing in education (27.2 percent) and dropped out (11.8 percent).

61
How have graduation and dropout percentages for students exiting IDEA, Part B, and school changed over time?
Exhibit 36. Percentages of students ages 14 through 21 exiting IDEA, Part B, and school, who graduated with a regular high school diploma or dropped out of school, by year: 2004–05 through 2013–14
0
10
20
30
40
50
60
70
2004-05 2005-06 2006-07 2007-08 2008-09 2009-10 2010-11 2011-12 2012-13 2013-14
Percent
Year
Graduated with a regular high school diplomaa
Dropped outb
aGraduated with a regular high school diploma refers to students ages 14 through 21 served under IDEA, Part B, who exited an educational program through receipt of a high school diploma identical to that for which students without disabilities were eligible. These were students with disabilities who met the same standards for graduation as those for students without disabilities. As defined in 34 C.F.R. section 300.102(a)(3)(iv), “the term regular high school diploma does not include an alternative degree that is not fully aligned with the State’s academic standards, such as a certificate or a general educational development credential (GED).” bDropped out refers to students ages 14 through 21 served under IDEA, Part B, who were enrolled at the start of the reporting period, were not enrolled at the end of the reporting period, and did not exit special education through any other basis (see seven exit reason categories described below). Starting in 2004–05, the category moved, not known to be continuing, used in previous years, was eliminated, and exiters who moved and were not known to be continuing in an education program were added to the dropped out category. NOTE: The U.S. Department of Education collects data on seven categories of exiters from special education (i.e., the Part B program in which the student was enrolled at the start of the reporting period). The categories include five categories of exiters from both special education and school (i.e., graduated with a regular high school diploma, received a certificate, dropped out, reached maximum age for services, and died) and two categories of exiters from special education, but not school (i.e., transferred to regular education and moved, known to be continuing in education). The seven categories are mutually exclusive. This exhibit provides percentages for only two categories of exiters from both special education and school (i.e., graduated with a regular high school diploma and dropped out). For data on all seven categories of exiters, see exhibit 35. Percentage was calculated by dividing the number of students ages 14 through 21 served under IDEA, Part B, reported in the exit reason category (i.e., graduated with a regular high school diploma or dropped out) for the year by the total number of students ages 14 through 21 served under IDEA, Part B, reported in the five exit-from-both-special education-and-school categories for that year, then multiplying the result by 100. The percentages of students who exited special education and school by graduating or dropping out as required under IDEA and included in this report are not comparable to the graduation and dropout rates required under the Elementary and Secondary Education Act of 1965, as amended (ESEA). The data used to calculate percentages of students who exited special education and school by graduating or dropping out are different from those used to calculate graduation and dropout rates. In particular, states often use data such as the number of students who graduated in four years with a regular high

62
• In 2013–14, a total of 66.1 percent of the students ages 14 through 21 who exited IDEA, Part B, and school graduated with a regular high school diploma; an additional 18.5 percent dropped out.
• From 2004–05 through 2013–14, the percentage of students who exited special education and school by having graduated with a regular high school diploma increased from 54.4 percent to 66.1 percent.
• From 2004–05 through 2013–14, the percentage of students who exited special education and school by having dropped out decreased from 28.3 percent to 18.5 percent.
school diploma and the number of students who entered high school four years earlier to determine their graduation and dropout rates under ESEA. For 2004–05, data are from a cumulative 12-month reporting period, which may have varied from state to state. For 2005–06 through 2013–14, data are from the reporting period between July 1 and June 30 of the referenced year. SOURCE: U.S. Department of Education, EDFacts Data Warehouse (EDW), OMB #1875-0240: “IDEA Part B Exiting Collection,” 2004–05 through 2013–14. These data are for the 50 states, DC, BIE schools, PR, and the four outlying areas with the following exceptions. For 2004–05, data for Washington and DC were not available. For 2005–06, data for DC were not available. For 2006–07, data for Vermont and Washington were not available. For 2007–08, data for Texas, Vermont, and DC were not available. For 2008–09, data for Vermont were not available. For 2010–11 and 2012–13, data for BIE schools were not available. For 2011–12, 2012–13, and 2013–14, data for the three freely associated states were included. Data for 2004–05 through 2009–10 were accessed spring 2012. Data for 2010–11 were accessed fall 2012. Data for 2011–12 were accessed fall 2013. Data for 2012–13 were accessed fall 2014. Data for 2013–14 were accessed fall 2015. For actual data used, go to http://www2.ed.gov/about/reports/annual/osep/index.html.

63
How have graduation percentages changed over time for students with different disabilities exiting IDEA, Part B, and school?
Exhibit 37. Percentage of students ages 14 through 21 exiting IDEA, Part B, and school, who graduated with a regular high school diploma, by year and disability category: 2004–05 through 2013–14
Disability 2004–05
2005–06
2006–07
2007–08
2008–09
2009–10
2010–11
2011–12
2012–13
2013–14
All disabilities 54.4 56.7 56.0 59.0 60.6 62.6 63.6 63.9 65.1 66.1 Autism 55.6 57.7 58.8 63.2 64.4 66.2 64.8 64.6 64.2 65.5 Deaf-blindnessa 53.7 64.5 74.3 56.8 63.6 60.0 51.6 47.0 56.1 52.0 Emotional disturbance 40.1 43.4 42.7 45.6 47.4 49.9 52.3 51.1 53.8 54.7 Hearing impairments 69.6 68.9 67.0 69.7 71.7 71.8 73.1 73.4 72.1 74.2 Intellectual disabilities 35.1 37.2 37.6 37.6 38.7 40.7 39.9 40.3 42.7 40.8 Multiple disabilities 43.1 44.6 45.5 45.7 48.1 47.6 47.2 48.6 45.5 46.0 Orthopedic
impairments 62.0 62.0 59.9 62.0 61.2 62.8 62.3 61.8 63.2 65.6 Other health
impairments 61.9 63.6 62.4 66.5 67.3 69.2 70.0 69.9 71.1 72.1 Specific learning
disabilities 59.6 61.7 60.7 64.2 65.5 67.4 68.4 68.8 70.1 70.8 Speech or language
impairments 64.9 67.4 66.5 66.6 68.3 70.3 72.6 74.6 76.2 77.8 Traumatic brain injury 62.8 65.0 62.6 64.9 67.9 68.0 67.7 68.6 69.0 69.2 Visual impairments 72.4 72.1 69.7 77.1 75.0 77.9 78.6 77.1 76.8 78.2 aPercentages are based on fewer than 200 students exiting special education and school. NOTE: Graduated with a regular high school diploma refers to students ages 14 through 21 served under IDEA, Part B, who exited an educational program through receipt of a high school diploma identical to that for which students without disabilities were eligible. These were students with disabilities who met the same standards for graduation as those for students without disabilities. As defined in 34 C.F.R. section 300.102(a)(3)(iv), “the term regular high school diploma does not include an alternative degree that is not fully aligned with the State’s academic standards, such as a certificate or a general educational development credential (GED).” The U.S. Department of Education collects data on seven categories of exiters from special education (i.e., the Part B program in which the student was enrolled at the start of the reporting period). The categories include five categories of exiters from both special education and school (i.e., graduated with a regular high school diploma, received a certificate, dropped out, reached maximum age for services, and died) and two categories of exiters from special education, but not school (i.e., transferred to regular education and moved, known to be continuing in education). The seven categories are mutually exclusive. This exhibit provides percentages for only one category of exiters from both special education and school (i.e., graduated with a regular high school diploma). For data on all seven categories of exiters, see exhibit 35. Percentage was calculated by dividing the number of students ages 14 through 21 served under IDEA, Part B, reported under the disability category who graduated with a regular high school diploma for the year by the total number of students ages 14 through 21 served under IDEA, Part B, reported under the disability category in the five exit-from-both-special education-and-school categories for that year, then multiplying the result by 100. The percentages of students who exited special education and school by graduating as required under IDEA and included in this report are not comparable to the graduation rates required under the Elementary and Secondary Education Act of 1965, as amended (ESEA). The data used to calculate percentages of students who exited special education and school by graduating are different from those used to calculate graduation rates. In particular, states often use data such as the number of students who graduated in four years with a regular high school diploma and the number of students who entered high school four years earlier to determine their graduation rates under ESEA. For 2004–05, data are from a cumulative 12-month reporting period, which may have varied from state to state. For 2005–06 through 2013–14, data are from the reporting period between July 1 and June 30 of the referenced year. SOURCE: U.S. Department of Education, EDFacts Data Warehouse (EDW), OMB #1875-0240: “IDEA Part B Exiting Collection,” 2004–05 through 2013–14. These data are for the 50 states, DC, BIE schools, PR, and the four outlying areas with the following exceptions. For 2004–05, data for Washington and DC were not available. For 2005–06, data for DC were not available. For 2006–07, data for Vermont and Washington were not available. For 2007–08, data for Texas, Vermont, and DC were not available. For 2008–09, data for Vermont were not available. For 2010–11 and 2012–13, data for BIE schools were not

64
• From 2004–05 through 2013–14, the graduation percentage increased for students who exited IDEA, Part B, and school in all disability categories. Increases of at least 10 percentage points were associated with the following five disability categories: emotional disturbance (14.6 percentage points), speech or language impairments (12.9 percentage points), specific learning disabilities (11.2 percentage points), other health impairments (10.3 percentage points), and autism (10.0 percentage points).
• In every year from 2004–05 through 2013–14, except 2006–07, the disability category of visual impairments was associated with the largest graduation percentage. The students reported under the category of intellectual disabilities had the smallest graduation percentages from 2004–05 through 2013–14.
available. For 2011–12, 2012–13, and 2013–14, data for the three freely associated states were included. Data for 2004–05 through 2009–10 were accessed spring 2012. Data for 2010–11 were accessed fall 2012. Data for 2011–12 were accessed fall 2013. Data for 2012–13 were accessed fall 2014. Data for 2013–14 were accessed fall 2015. For actual data used, go to http://www2.ed.gov/about/reports/annual/osep/index.html.

65
How have dropout percentages changed over time for students with different disabilities exiting IDEA, Part B, and school?
Exhibit 38. Percentage of students ages 14 through 21 exiting IDEA, Part B, and school, who dropped out of school, by year and disability category: 2004–05 through 2013–14
Disability 2004–05
2005–06
2006–07
2007–08
2008–09
2009–10
2010–11
2011–12
2012–13
2013–14
All disabilities 28.3 26.3 25.7 24.6 22.4 21.1 20.1 20.5 18.8 18.5 Autism 10.8 9.2 7.2 7.0 6.2 6.6 6.3 7.3 7.1 7.3 Deaf-blindnessa 20.0 9.2 8.2 9.5 9.1 13.3 15.1 14.5 14.6 12.8 Emotional disturbance 48.2 45.0 44.8 43.3 40.6 38.7 37.0 38.1 35.4 35.2 Hearing impairments 13.1 13.5 13.0 11.1 10.5 10.2 10.2 10.2 9.5 9.4 Intellectual disabilities 24.5 22.3 22.2 21.5 19.8 19.2 18.5 18.8 17.9 16.8 Multiple disabilities 21.0 18.6 19.1 17.6 14.9 13.9 13.1 15.8 15.2 14.2 Orthopedic
impairments 14.5 11.6 13.3 13.1 13.6 12.4 11.5 11.4 10.7 11.0 Other health
impairments 24.7 23.6 23.2 22.4 20.4 19.1 18.4 19.2 18.1 17.6 Specific learning
disabilities 26.8 25.3 24.5 23.6 21.4 20.2 19.4 19.9 18.0 18.1 Speech or language
impairments 25.2 22.7 20.7 20.5 18.8 17.0 16.0 15.6 14.5 13.4 Traumatic brain injury 18.5 15.1 15.4 14.6 13.2 12.5 11.4 12.3 11.1 12.2 Visual impairments 11.3 11.5 11.2 9.6 9.6 8.4 8.5 7.3 8.0 6.4 aPercentages are based on fewer than 200 students exiting special education and school. NOTE: Dropped out refers to students ages 14 through 21 served under IDEA, Part B, who were enrolled at the start of the reporting period, were not enrolled at the end of the reporting period, and did not exit special education through any other basis (see seven exit reason categories described below). Starting in 2004–05, the category moved, not known to be continuing, used in previous years, was eliminated, and exiters who moved and were not known to be continuing in an education program were added to the dropped out category. The U.S. Department of Education collects data on seven categories of exiters from special education (i.e., the Part B program in which the student was enrolled at the start of the reporting period). The categories include five categories of exiters from both special education and school (i.e., graduated with a regular high school diploma, received a certificate, dropped out, reached maximum age for services, and died) and two categories of exiters from special education, but not school (i.e., transferred to regular education and moved, known to be continuing in education). The seven categories are mutually exclusive. This exhibit provides percentages for only one category of exiters from both special education and school (i.e., dropped out). For data on all seven categories of exiters, see exhibit 35. Percentage was calculated by dividing the number of students ages 14 through 21 served under IDEA, Part B, reported under the disability category who dropped out for the year by the total number of students ages 14 through 21 served under IDEA, Part B, reported under the disability category in the five exit-from-both-special education-and-school categories for that year, then multiplying the result by 100. The percentages of students who exited special education and school by dropping out as required under IDEA and included in this report are not comparable to the dropout rates required under the Elementary and Secondary Education Act of 1965, as amended (ESEA). The data used to calculate percentages of students who exited special education and school by dropping out are different from those used to calculate dropout rates. In particular, states often use data such as the number of students who graduated in four years with a regular high school diploma and the number of students who entered high school four years earlier to determine their dropout rates under ESEA. For 2004–05, data are from a cumulative 12-month reporting period, which may have varied from state to state. For 2005–06 through 2013–14, data are from the reporting period between July 1 and June 30 of the referenced year. SOURCE: U.S. Department of Education, EDFacts Data Warehouse (EDW), OMB #1875-0240: “IDEA Part B Exiting Collection,” 2004–05 through 2013–14. These data are for the 50 states, DC, BIE schools, PR, and the four outlying areas with the following exceptions. For 2004–05, data for Washington and DC were not available. For 2005–06, data for DC were not available. For 2006–07, data for Vermont and Washington were not available. For 2007–08, data for Texas, Vermont, and DC were not available. For 2008–09, data for Vermont were not available. For 2010–11, data for BIE schools were not available. For 2011–12, 2012–13, and 2013–14, data for the three freely associated states were included. Data for 2004–05 through 2009–10 were accessed spring 2012. Data for 2010–11 were accessed fall 2012. Data for 2011–12 were accessed fall 2013. Data for 2012–13 were accessed fall 2014. Data for 2013–14 were accessed fall 2015. For actual data used, go to http://www2.ed.gov/about/reports/annual/osep/index.html.

66
• From 2004–05 through 2013–14, the dropout percentage decreased for students in each disability category who exited IDEA, Part B, and school. The decreases were most notable for students reported under the categories of emotional disturbance (-13.0 percentage points) and speech or language impairments (-11.8 percentage points).
• In each year from 2004–05 through 2013–14, a larger percentage of the students reported under the category of emotional disturbance exited special education and school by dropping out. In fact in each year, the dropout percentage was no less than 35 percent, which was substantially larger than the dropout percentage for any other disability category.
Special Education Teachers and Paraprofessionals Employed to Serve Students Ages 6 Through 21 Under IDEA, Part B
To what extent were full-time equivalent teachers who were employed to provide special education and related services for students ages 6 through 21 served under IDEA, Part B, highly qualified?
Exhibit 39. Number of full-time equivalent (FTE) special education teachers and number and percentage of FTE highly qualified special education teachers employed to provide special education and related services for students ages 6 through 21 served under IDEA, Part B: Fall 2013
Year Total number FTE employed
Number FTE highly qualifieda
Percentageb FTE highly qualified
2013 378,614 355,570 93.9 aSpecial education teachers reported as highly qualified met the state standard for highly qualified based on the criteria identified in 20 U.S.C. section 1401(10). For highly qualified special education teachers, the term “highly qualified” has the same meaning given the term in section 9101 of the Elementary and Secondary Education Act of 1965, as amended (ESEA), except that such term also includes the requirements described in section 602(10)(B) of IDEA, and the option for teachers to meet the requirements of section 9101 of ESEA, by meeting the requirements of section 602(10)(C) or (D) of IDEA [20 U.S.C. section 1401(10)]. bPercentage was calculated by dividing the number of FTE highly qualified special education teachers employed to provide special education and related services for students ages 6 through 21 served under IDEA, Part B, by the total number of FTE special education teachers employed to provide special education and related services for students ages 6 through 21 served under IDEA, Part B, then multiplying the result by 100. SOURCE: U.S. Department of Education, EDFacts Data Warehouse (EDW), OMB #1875-0240: “IDEA Part B Personnel Collection,” 2013. These data are for the 50 states, DC, BIE schools, PR, the four outlying areas, and the three freely associated states. Data were accessed fall 2015. For actual data used, go to http://www2.ed.gov/about/reports/annual/osep/index.html.
• In 2013, a total of 355,570, or 93.9 percent, of the 378,614 FTE special education teachers who provided special education and related services for students ages 6 through 21 under IDEA, Part B, were highly qualified.

67
To what extent were full-time equivalent paraprofessionals who were employed to provide special education and related services for students ages 6 through 21 served under IDEA, Part B, qualified?
Exhibit 40. Number of full-time equivalent (FTE) special education paraprofessionals and number and percentage of FTE qualified special education paraprofessionals employed to provide special education and related services for students ages 6 through 21 served under IDEA, Part B: Fall 2013
Year Total number FTE employed
Number FTE qualifieda
Percentageb FTE qualified
2013 416,798 400,040 96.0 aSpecial education paraprofessionals reported as qualified (1) met the state standard for qualified based on the criteria identified in 20 U.S.C. section 1412(14)(B) or (2) if no state standard for qualified paraprofessionals existed, either held appropriate state certification or licensure for the position held or held positions for which no state certification or licensure requirements existed. bPercentage was calculated by dividing the number of FTE qualified special education paraprofessionals employed to provide special education and related services for students ages 6 through 21 served under IDEA, Part B, by the total number of FTE special education paraprofessionals employed to provide special education and related services for students ages 6 through 21 served under IDEA, Part B, then multiplying the result by 100. NOTE: Paraprofessionals are employees who provide instructional support, including those who: (1) provide one-on-one tutoring if such tutoring is scheduled at a time when a student would not otherwise receive instruction from a teacher; (2) assist with classroom management, such as organizing instructional and other materials; (3) provide instructional assistance in a computer laboratory; (4) conduct parental involvement activities; (5) provide support in a library or media center; (6) act as a translator; or (7) provide instructional support services under the direct supervision of a teacher. SOURCE: U.S. Department of Education, EDFacts Data Warehouse (EDW), OMB #1875-0240: “IDEA Part B Personnel Collection,” 2013. These data are for the 50 states, DC, BIE schools, PR, the four outlying areas, and the three freely associated states. Data were accessed fall 2015. For actual data used, go to http://www2.ed.gov/about/reports/annual/osep/index.html.
• In 2013, a total of 400,040, or 96 percent, of the 416,798 FTE special education paraprofessionals who provided special education and related services for students ages 6 through 21 under IDEA, Part B, were qualified.

68
Children and Students Ages 3 Through 21 Served Under IDEA, Part B
Personnel Employed to Provide Related Services for Children and Students Ages 3 Through 21 Served Under IDEA, Part B
In 2013, the 50 states; the District of Columbia (DC); Bureau of Indian Education (BIE) schools; Puerto Rico (PR); the outlying areas of American Samoa, Guam, the Northern Mariana Islands, and the Virgin Islands; and the three freely associated states of the Federated States of Micronesia, the Republic of Palau, and the Republic of the Marshall Islands were asked to report the numbers of full-time equivalent fully certified and not fully certified personnel employed to provide related services for children and students ages 3 through 21 served under IDEA, Part B. Personnel who were fully certified for the position either held appropriate state certification or licensure for the position held or held positions for which no state certification or licensure requirements existed.
To what extent were full-time equivalent personnel who were employed to provide related services for children and students ages 3 through 21 served under IDEA, Part B, fully certified?
Exhibit 41. Number of full-time equivalent (FTE) personnel and number and percentage of FTE fully certified personnel employed to provide related services for children and students ages 3 through 21 served under IDEA, Part B, by personnel type: Fall 2013
Personnel category Total number FTE employed
Number FTE fully certified
Percentagea FTE fully certified
Total 206,209 202,703 98.3 Audiologists 1,323 1,295 97.9 Counselors and Rehabilitation Counselors 16,336 16,113 98.6 Interpreters 6,644 6,124 92.2 Medical/Nursing Service Staff 17,398 17,035 97.9 Occupational Therapists 20,905 20,539 98.2 Orientation and Mobility Specialists 1,521 1,489 97.9 Physical Education Teachers and Recreation
and Therapeutic Recreation Specialists 14,416 14,095 97.8 Physical Therapists 8,917 8,732 97.9 Psychologists 34,996 34,697 99.1 Social Workers 17,267 17,081 98.9 Speech-Language Pathologists 66,487 65,504 98.5 aPercentage was calculated by dividing the number of FTE fully certified personnel employed to provide related services for children and students ages 3 through 21 served under IDEA, Part B, by the total number of FTE personnel (fully certified and not fully certified) employed to provide related services for children and students ages 3 through 21 served under IDEA, Part B, then multiplying the result by 100. NOTE: Not all states use all 11 related services personnel categories. The term “related services” refers to transportation and such developmental, corrective, and other supportive services as are required to assist a child with a disability to benefit from special education. Related services include speech-language pathology and audiology services; interpreting services; psychological services; physical and occupational therapy; recreation, including therapeutic recreation; early identification and assessment of

69
• In 2013, a total of 98.3 percent of all FTE personnel who were employed to provide related services for children and students ages 3 through 21 served under IDEA, Part B, were fully certified.
• Ten of the 11 categories of FTE related services personnel had full certification percentages of 95 percent or more. Interpreters had the smallest full certification percentage (92.2 percent), while nearly all psychologists (99.1 percent) were fully certified.
disabilities in children; counseling services, including rehabilitation counseling; orientation and mobility services; medical services for diagnostic or evaluation purposes; school health services and school nurse services; social work services in schools; and parent counseling and training. Related services do not include a medical device that is surgically implanted, the optimization of that device’s functioning (e.g., mapping), maintenance of that device, or the replacement of that device [34 C.F.R. section 300.34(a) and (b)(1)]. SOURCE: U.S. Department of Education, EDFacts Data Warehouse (EDW), OMB #1875-0240: “IDEA Part B Personnel Collection,” 2013. These data are for the 50 states, DC, BIE schools, PR, the four outlying areas, and the three freely associated states. Data were accessed fall 2015. For actual data used, go to http://www2.ed.gov/about/reports/annual/osep/index.html.

70
Disciplinary Removals of Children and Students From Their Educational Placements
For school year 2013–14, the 50 states, the District of Columbia, BIE schools, Puerto Rico, the four outlying areas, and the three freely associated states were asked to report information on children and students ages 3 through 21 served under IDEA, Part B, who were removed from their educational placements for disciplinary reasons.
How many children and students ages 3 through 21 served under IDEA, Part B, were removed to an interim alternative educational setting and suspended or expelled for more than 10 days during the school year?
Exhibit 42. Numbers of children and students ages 3 through 21 who were served under IDEA, Part B; removed from their educational placements for disciplinary purposes; and removed per 10,000 children and students ages 3 through 21 served under IDEA, Part B, by type of disciplinary removal: School year 2013–14
Type of disciplinary removal Number serveda
Number disciplinedb
Number disciplined per 10,000
servedc Removed to an interim alternative educational settingd
Removed unilaterally by school personnele for drugs, weapons, or serious bodily injuryf 6,580,819 9,296 14
Removed by hearing officer for likely injuryg 6,562,102 490 1 Suspended or expelled >10 days during school yearh
Received out-of-school suspensions or expulsionsf 6,580,819 52,554 80 Received in-school suspensionsf 6,580,819 25,225 38
aExcludes counts from states that did not have data available for the disciplinary removal category. bThe number reported within each of the four disciplinary categories is an unduplicated count of children and students. However, children and students who were involved in two or more incidents may be reported in more than one disciplinary category. cRatio was calculated by dividing the number of children and students ages 3 through 21 served under IDEA, Part B, in the disciplinary removal category by the total number of children and students ages 3 through 21 served under IDEA, Part B, then multiplying the result by 10,000. The numerator is based on data from the entire 2013–14 school year, whereas the denominator is based on point-in-time data from fall 2013. dAn appropriate setting determined by the child’s/student’s individualized education program (IEP) team in which the child/student is placed for no more than 45 school days. This setting enables the child/student to continue to progress in the general curriculum; to continue to receive the services and modifications, including those described in the child’s/student’s current IEP; and to meet the goals set out in the IEP. Setting includes services and modifications to address the problem behavior and to prevent the behavior from recurring. eInstances in which school personnel (not the IEP team) order the removal of children and students with disabilities from their current educational placement to an appropriate interim alternative educational setting for not more than 45 school days. fData for American Samoa, BIE schools, the Federated States of Micronesia, and Wyoming were excluded for this disciplinary removal category. gData for American Samoa, BIE schools, the Federated States of Micronesia, and Wyoming were excluded, and data for Delaware were not available for this disciplinary removal category. hThe children and students reported in this category are those subject to multiple short-term suspensions/expulsions summing to more than 10 days during the school year, those subject to single suspension(s)/expulsion(s) over 10 days during the school year, and those subject to both.

71
• During school year 2013–14, 9,296 children and students ages 3 through 21 served under IDEA, Part B, in the states for which data were available were removed unilaterally to an interim alternative educational setting by school personnel for offenses involving drugs, weapons, or serious bodily injury. Given that 6,580,819 children and students ages 3 through 21 were served under Part B in 2013, in the states for which data were available, this type of action occurred with only 14 children and students for every 10,000 children and students who were served under Part B in 2013.
• Only 490 children and students ages 3 through 21 served under IDEA, Part B, or 1 for every 10,000 children and students served in 2013, in the states for which data were available were removed to an interim alternative educational setting by a hearing officer for likely injury to themselves or others in school year 2013–14.
• There were 52,554 children and students ages 3 through 21 served under IDEA, Part B, or 80 for every 10,000 children and students served in 2013, in the states for which data were available who received out-of-school suspensions or expulsions for more than 10 cumulative days in school year 2013–14.
• There were 25,225 children and students ages 3 through 21 served under IDEA, Part B, or 38 for every 10,000 children and students served in 2013, in the states for which data were available who received in-school suspensions for more than 10 cumulative days in school year 2013–14.
SOURCE: U.S. Department of Education, EDFacts Data Warehouse (EDW), OMB #1875-0240: “IDEA Part B Discipline Collection,” 2013–14. These data are for the 50 states, DC, BIE schools, PR, the four outlying areas, and the three freely associated states with the exceptions noted above. Data were accessed fall 2015. U.S. Department of Education, EDFacts Data Warehouse (EDW), OMB #1875-0240: “IDEA Part B Child Count and Educational Environments Collection,” 2013. These data are for 49 states, DC, PR, three outlying areas, and two freely associated states. Data for Wyoming, BIE schools, American Samoa, and the Federated States of Micronesia were not available. Data were accessed fall 2014. For actual data used, go to http://www2.ed.gov/about/reports/annual/osep/index.html.

72
How did the numbers of children and students ages 3 through 21 served under IDEA, Part B, who were removed to an interim alternative educational setting or suspended or expelled for more than 10 days, per 10,000 children and students ages 3 through 21 served, vary by disability category?
Exhibit 43. Numbers of children and students ages 3 through 21 served under IDEA, Part B, who were removed to an interim alternative educational setting and suspended or expelled for more than 10 days per 10,000 children and students ages 3 through 21 served under IDEA, Part B, by disability category and type of disciplinary removal: School year 2013–14
Disability
Removed to an interim alternative educational settinga
Suspended or expelled >10 days during school yearb
Removed unilaterally by
school personnelc for
drugs, weapons, or serious bodily
injuryd
Removed by hearing officer
for likely injurye
Received out-of-school
suspensions or expulsionsd
Received in-school
suspensionsd All disabilities 14 1 80 38
Autism 4 # 14 5 Deaf-blindness 7 0 0 0 Developmental delayf 1 0 6 1 Emotional disturbance 50 4 357 120 Hearing impairments 8 # 25 16 Intellectual disabilities 8 # 65 32 Multiple disabilities 5 1 31 10 Orthopedic impairments 3 # 22 5 Other health impairments 21 1 139 70 Specific learning disabilities 20 1 94 52 Speech or language impairments 2 # 13 7 Traumatic brain injury 10 0 47 15 Visual impairments 5 0 24 12 # Ratio was non-zero, but smaller than 5 per 100,000. aAn appropriate setting determined by the child’s/student’s individualized education program (IEP) team in which the child/student is placed for no more than 45 school days. This setting enables the child/student to continue to progress in the general curriculum; to continue to receive the services and modifications, including those described in the child’s/student’s current IEP; and to meet the goals set out in the IEP. Setting includes services and modifications to address the problem behavior and to prevent the behavior from recurring. bThe children and students reported in this category are those subject to multiple short-term suspensions/expulsions summing to more than 10 days during the school year, those subject to single suspension(s)/expulsion(s) over 10 days during the school year, and those subject to both. cInstances in which school personnel (not the IEP team) order the removal of children and students with disabilities from their current educational placement to an appropriate interim alternative educational setting for not more than 45 school days. dData for American Samoa, BIE schools, the Federated States of Micronesia, and Wyoming were excluded for this disciplinary removal category. eData for American Samoa, BIE schools, the Federated States of Micronesia, and Wyoming were excluded, and data for Delaware were not available for this disciplinary removal category. fStates’ use of the developmental delay category is optional for children ages 3 through 9 and is not applicable to children older than 9 years of age.

73
• For every 10,000 children and students ages 3 through 21 served under IDEA, Part B, reported under the category of emotional disturbance in 2013, there were 50 children and students removed unilaterally to an interim alternative educational setting by school personnel for offenses involving drugs, weapons, or serious bodily during school year 2013–14. The ratio for the children and students reported under each of the other disability categories was less than 22 per 10,000 children and students served.
• Without regard for disability category, for every 10,000 children and students ages 3 through 21 served under IDEA, Part B, in 2013, no more than 4 children and students were removed by a hearing officer for likely injury during school year 2013–14.
• For every 10,000 children and students ages 3 through 21 served under IDEA, Part B, reported under the category of emotional disturbance in 2013, there were 357 children and students who received out-of-school suspensions or expulsions for more than 10 cumulative days during school year 2013–14. The ratio for the children and students reported under each of the other disability categories was less than 140 per 10,000 children and students.
• For every 10,000 children and students ages 3 through 21 served under IDEA, Part B, reported under the category of emotional disturbance in 2013, there were 120 children and students who received in-school suspensions for more than 10 cumulative days during school year 2013–14. The ratio for the children and students reported under each of the other disability categories was less than 71 per 10,000 children and students.
NOTE: The ratio reported within each of the four disciplinary categories is based on an unduplicated count of children and students. However, children and students who were involved in two or more incidents may be reported in more than one disciplinary category. Ratio was calculated by dividing the number of children and students ages 3 through 21 served under IDEA, Part B, reported under the disability category for the disciplinary removal category by the total number of children and students ages 3 through 21 served under IDEA, Part B, reported under the disability category, then multiplying the result by 10,000. The numerator is based on data from the entire 2013–14 school year, whereas the denominator is based on point-in-time data from fall 2013. The denominator for the disability category of deaf-blindness for each type of disciplinary action is fewer than 1,600 children and students ages 3 through 21 served under IDEA, Part B. The denominator for each of the other disability categories for each type of disciplinary action exceeded 26,000 children and students. SOURCE: U.S. Department of Education, EDFacts Data Warehouse (EDW), OMB #1875-0240: “IDEA Part B Discipline Collection,” 2013–14. These data are for the 50 states, DC, BIE schools, PR, the four outlying areas, and the three freely associated states with the exceptions noted above. Data were accessed fall 2015. U.S. Department of Education, EDFacts Data Warehouse (EDW), OMB #1875-0240: “IDEA Part B Child Count and Educational Environments Collection,” 2013. These data are for 49 states, DC, PR, three outlying areas, and two freely associated states. Data for Wyoming, BIE schools, American Samoa, and the Federated States of Micronesia were not available. Data were accessed fall 2014. For actual data used, go to http://www2.ed.gov/about/reports/annual/osep/index.html.

74
Dispute Resolution for Children and Students Served Under IDEA, Part B
To protect the interests of children and students served under IDEA, Part B, the law requires states to implement a formal set of procedural safeguards for children and students served under IDEA, Part B. Among these procedural safeguards are three formal options for registering and resolving disputes. One of these options is a written, signed complaint. Any individual or organization can file a written, signed complaint alleging a violation of any Part B requirement by a school district, the state education agency (SEA), or any other public agency. A second option available to parents, school districts, or other public agencies is a due process complaint. By filing a due process complaint, a parent or public agency may request a due process hearing11 regarding any matter relating to a proposal or a refusal to initiate or change the identification, evaluation, or educational placement of a child with a disability, or the provision of a free appropriate public education (FAPE) to the child. Mediation is a third option available through which parents and school districts can try to resolve disputes and reach an agreement about any matter under Part B of IDEA, including matters arising prior to the filing of a due process complaint. The agreements reached through the mediation process are legally binding and enforceable. For more information about these and other procedural safeguards, go to http://ectacenter.org/topics/procsafe/procsafe.asp.
Unlike the other Part B data collections, which are associated with a specific group of Part B
participants defined by the participants’ ages, the Part B dispute resolution data collection is associated with all children and students served under IDEA, Part B. These children and students include individuals ages 3 through 21, as well as older individuals, as states have the option of serving students 22 years of age and older. The Part B legal disputes and resolution data represent all complaints associated with any participant in Part B during the 12 months during which the data were collected.
11 A due process hearing is designed to be a fair, timely, and impartial procedure for resolving disputes that arise from parents
and public agencies regarding the education of children and students served under IDEA, Part B.

75
What were the statuses of the written, signed complaints that alleged a violation of a requirement of Part B of IDEA?
Exhibit 44. Percentage of written, signed complaints for children and students served under IDEA, Part B, by complaint status: 2013–14
Complaints with reports issueda
(60.9%)
Complaints withdrawn or dismissedb
(36.9%)
Complaints pendingc (2.2%)
aA complaint with a report issued refers to a written decision that was provided by the state education agency (SEA) to the complainant and public agency regarding alleged violations of a requirement of Part B of IDEA. bA complaint withdrawn or dismissed refers to a written, signed complaint that was withdrawn by the complainant for any reason or that was determined by the SEA to be resolved by the complainant and the public agency through mediation or other dispute resolution means, and no further action by the SEA was required to resolve the complaint, or a complaint dismissed by the SEA for any reason, including that the complaint did not include all required content. cA complaint pending is a written, signed complaint that is either still under investigation or the SEA’s written decision has not been issued. NOTE: A written, signed complaint is a signed document with specific content requirements that is submitted to the SEA by an individual or organization (i.e., complainant) that alleges a violation of a requirement of Part B of IDEA or 34 C.F.R. section 300, including cases in which some required content is absent from the document. Percentage was calculated by dividing the number of complaints in the status category by the total number of written, signed complaints, and then multiplying the result by 100. All 50 states, DC, BIE schools, PR, and three outlying areas reported one or more complaints. Percentage was based on a total of 4,997 written, signed complaints. Data are from the reporting period between July 1, 2013, and June 30, 2014. SOURCE: U.S. Department of Education, EDFacts Metadata and Process System (EMAPS), OMB #1820-0677: “IDEA Part B Dispute Resolution Survey,” 2013–14. These data are for the 50 states, DC, BIE schools, PR, the four outlying areas, and the three freely associated states. Data were accessed fall 2015. For actual data used, go to http://www2.ed.gov/about/reports/annual/osep/index.html.
• During 2013–14, a total of 4,997 written, signed complaints were received through the dispute resolution process for children and students ages 3 through 21 served under IDEA, Part B.
• A report was issued for 3,043 (60.9 percent) of the complaints, while 1,845 (36.9 percent) of the complaints were withdrawn or dismissed. A total of 109 (2.2 percent) of the complaints that were received during the 2013–14 reporting period were pending or unresolved by the end of the period.
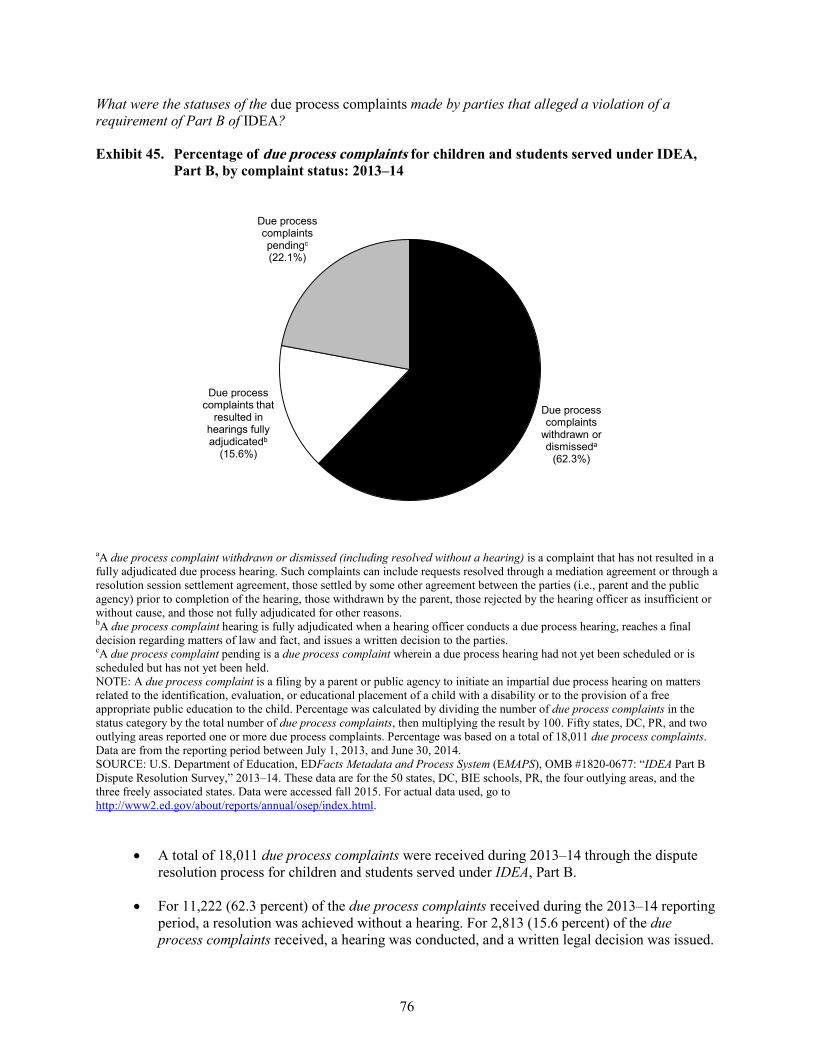
76
What were the statuses of the due process complaints made by parties that alleged a violation of a requirement of Part B of IDEA?
Exhibit 45. Percentage of due process complaints for children and students served under IDEA, Part B, by complaint status: 2013–14
Due process complaints
withdrawn or dismisseda
(62.3%)
Due process complaints that
resulted in hearings fully adjudicatedb
(15.6%)
Due process complaints pendingc (22.1%)
aA due process complaint withdrawn or dismissed (including resolved without a hearing) is a complaint that has not resulted in a fully adjudicated due process hearing. Such complaints can include requests resolved through a mediation agreement or through a resolution session settlement agreement, those settled by some other agreement between the parties (i.e., parent and the public agency) prior to completion of the hearing, those withdrawn by the parent, those rejected by the hearing officer as insufficient or without cause, and those not fully adjudicated for other reasons. bA due process complaint hearing is fully adjudicated when a hearing officer conducts a due process hearing, reaches a final decision regarding matters of law and fact, and issues a written decision to the parties. cA due process complaint pending is a due process complaint wherein a due process hearing had not yet been scheduled or is scheduled but has not yet been held. NOTE: A due process complaint is a filing by a parent or public agency to initiate an impartial due process hearing on matters related to the identification, evaluation, or educational placement of a child with a disability or to the provision of a free appropriate public education to the child. Percentage was calculated by dividing the number of due process complaints in the status category by the total number of due process complaints, then multiplying the result by 100. Fifty states, DC, PR, and two outlying areas reported one or more due process complaints. Percentage was based on a total of 18,011 due process complaints. Data are from the reporting period between July 1, 2013, and June 30, 2014. SOURCE: U.S. Department of Education, EDFacts Metadata and Process System (EMAPS), OMB #1820-0677: “IDEA Part B Dispute Resolution Survey,” 2013–14. These data are for the 50 states, DC, BIE schools, PR, the four outlying areas, and the three freely associated states. Data were accessed fall 2015. For actual data used, go to http://www2.ed.gov/about/reports/annual/osep/index.html.
• A total of 18,011 due process complaints were received during 2013–14 through the dispute resolution process for children and students served under IDEA, Part B.
• For 11,222 (62.3 percent) of the due process complaints received during the 2013–14 reporting period, a resolution was achieved without a hearing. For 2,813 (15.6 percent) of the due process complaints received, a hearing was conducted, and a written legal decision was issued.

77
For 3,976 (22.1 percent) of the due process complaints received, a resolution was still pending at the end of the reporting period.
What were the statuses of the mediation requests made by parties that alleged a violation of a requirement of Part B of IDEA?
Exhibit 46. Percentage of mediation requests for children and students served under IDEA, Part B, by request status: 2013–14
Mediations held related to due
process complaintsa
(35.4%)
Mediations held not related to due
process complaintsb
(26.9%)
Mediations withdrawn or not
heldc (29.4%)
Mediations pendingd (8.3%)
aA mediation held related to due process complaint is a process that was conducted by a qualified and impartial mediator to resolve a disagreement between a parent and public agency that was initiated by the filing of a due process complaint or included issues that were the subject of a due process complaint. bA mediation held not related to due process complaint is a process that was conducted by a qualified and impartial mediator to resolve a disagreement between a parent and public agency that was not initiated by the filing of a due process complaint or did not include issues that were the subject of a due process complaint. cA mediation withdrawn or not held is a request for mediation that did not result in a mediation being conducted by a qualified and impartial mediator. This includes mediation requests that were withdrawn, mediation requests that were dismissed, requests where one party refused to mediate, and requests that were settled by some agreement other than a mediation agreement between the parties. dA mediation pending is a request for mediation that has not yet been scheduled or is scheduled but has not yet been held. NOTE: A mediation request is a request by a party to a dispute involving any matter under Part B of IDEA for the parties to meet with a qualified and impartial mediator to resolve the dispute(s). Percentage was calculated by dividing the number of mediation requests in the status category by the total number of mediation requests, then multiplying the result by 100. Forty-nine states, DC, BIE schools, and PR reported one or more mediation request. Percentage was based on a total of 9,688 mediation requests. Data are from the reporting period between July 1, 2013, and June 30, 2014. SOURCE: U.S. Department of Education, EDFacts Metadata and Process System (EMAPS), OMB #1820-0677: “IDEA Part B Dispute Resolution Survey,” 2013–14. These data are for the 50 states, DC, BIE schools, PR, the four outlying areas, and the three freely associated states. Data were accessed fall 2015. For actual data used, go to http://www2.ed.gov/about/reports/annual/osep/index.html.

78
• During 2013–14, a total of 9,688 mediation requests were received through the dispute resolution process for children and students served under IDEA, Part B. For 3,425 (35.4 percent) of the mediation requests received, a mediation related to a due process complaint was conducted. For 2,610 (26.9 percent) of the mediation requests received, a mediation that was not related to a due process complaint was conducted. For 801 requests (8.3 percent), a mediation session was still pending as of the end of the 2013–14 reporting period. The remaining 2,852 mediation requests (29.4 percent) were withdrawn or otherwise not to be held by the end of the reporting period.
Coordinated Early Intervening Services
The Individuals with Disabilities Education Act (IDEA) was amended to allow, and sometimes require, local education agencies (LEAs) to use funds provided under Part B of IDEA for coordinated early intervening services (CEIS). This provision, which is found in section 613(f) of the IDEA (20 U.S.C. section 1413(f)) and the regulations in 34 C.F.R. section 300.226 permits LEAs to use Part B funds to develop and provide CEIS for students who are currently not identified as needing special education. The rationale for using IDEA funds for CEIS is based on research showing that the earlier a child’s learning problems or difficulties are identified, the more quickly and effectively the problems and difficulties can be addressed and the greater the chances that the child’s problems will be ameliorated or decreased in severity. Conversely, the longer a child goes without assistance, the longer the remediation time and the more intense and costly services might be.
An LEA can use up to 15 percent of the amount it receives under Part B of IDEA, less any
amount reduced by the LEA pursuant to 34 C.F.R. section 300.205 (adjustment to local fiscal efforts), to develop and implement CEIS. However, an LEA is required to reserve 15 percent of the amount of funds available for CEIS if there is significant disproportionality based on race or ethnicity with respect to the identification of children with disabilities; the identification of children in specific disability categories; the placement of children with disabilities in particular educational settings; or the incidence, duration, and type of disciplinary actions, including suspensions and expulsions (CEIS Guidance, http://www2.ed.gov/policy/speced/guid/idea/ceis.html).

79
How many of the children and students ages 3 through 21 served under IDEA, Part B, in 2014 received coordinated early intervening services (CEIS) in the current or previous two school years?
Exhibit 47. Number and percentage of children and students ages 3 through 21 served under IDEA, Part B, in 2014 who received coordinated early intervening services (CEIS) in school years 2011–12, 2012–13, or 2013–14: Fall 2014
Year
Children and students served under Part B who received CEIS in school year(s)
2011–12, 2012–13, or 2013–14 Number Percentagea
2014 153,113 2.3 aPercentage was calculated by dividing the number of children and students ages 3 through 21 served under Part B in 2014 who received CEIS services anytime during school year(s) 2011–12, 2012–13, or 2013–14, by the number of children and students ages 3 through 21 served under Part B in 2014, then multiplying the result by 100. SOURCE: U.S. Department of Education, EDFacts Metadata and Process System (EMAPS), OMB #1820-0689: “IDEA Part B Maintenance of Effort (MOE) Reduction and Coordinated Early Intervening Services (CEIS),” 2014. U.S. Department of Education, EDFacts Data Warehouse (EDW), OMB #1875-0240: “IDEA Part B Child Count and Educational Environments Collection,” 2014. These data are for 49 states, DC, PR, three outlying areas, and the three freely associated states. Data were not available for Wyoming, BIE schools, and American Samoa. Data were accessed fall 2015. For actual data used, go to http://www2.ed.gov/about/reports/annual/osep/index.html.
• A total of 153,113 or 2.3 percent of the 6,688,361 children and students ages 3 through 21 served under Part B in 2014 by the states for which data were available, the District of Columbia, Puerto Rico, three outlying areas, and the three freely associated states received CEIS in school year(s) 2011–12, 2012–13, or 2013–14, prior to being served under Part B.


Section II
Summary and Analysis of IDEA Section 618 Data at the State Level


83
Introduction
This section of the 38th Annual Report to Congress, 2016 addresses a set of questions developed by the U.S. Department of Education based on information requests made by the public. Consequently, this section shows the breadth and depth of information available and offers an examination of data elements addressing areas of particular interest.
The discussion in this section offers a different perspective from that presented in Section I,
where the discussion features counts, percentages, and ratios that represent the nation as a whole. The measures in Section I for Parts B and C represent the 50 states, the District of Columbia, Puerto Rico, and the outlying areas of American Samoa, Guam, the Northern Mariana Islands, and the Virgin Islands; for Part B only, the measures usually also represent the Bureau of Indian Education (BIE) schools and the three freely associated states: the Federated States of Micronesia, the Republic of Palau, and the Republic of the Marshall Islands. In contrast, the discussion in this section reflects a state-level perspective that features comparisons among the states for which data were available. The measures presented in this section do not include counts; they include only percentages and ratios and thereby provide a common basis for comparing the states. For Parts B and C, these measures are based on data for the 50 states, the District of Columbia, and Puerto Rico; for Part B only, the measures usually also represent BIE schools. They are referred to collectively as “All states,” and individually by the term “state” in the exhibits and discussion. Consequently, the discussion may refer to as many as 53 individual “states” in total.
The objective of the analyses in this section is to examine similarities and differences among and
within states for specific time periods. For some elements, data for two time periods for each state are presented and examined. In these cases, the analysis focuses on comparing data for the two time periods presented to determine what, if any, substantial change occurred. The more recent (comparison) time periods depicted in the state-level data exhibits are consistent with the more recent time periods depicted in the national level data exhibits found in Section I. Earlier (baseline) time periods were selected for exhibits in this section based on data availability and the comparability of the data categories or definitions (see “Data Sources Used in This Report”).
As was the case in Section I, any reference in this section to “early intervention services” is
synonymous with services provided under IDEA, Part C.
84
Notes Concerning the Exhibits in Section II
The following will assist readers of this section: 1. Majority is defined as greater than 50 percent.
2. Exhibits presenting statistics based on resident population measures include data for Puerto Rico except when cross-tabulated by race/ethnicity since the U.S. Census’ annual resident population estimates by race/ethnicity exclude residents of Puerto Rico. In addition, such exhibits concerning Part B information include data for BIE schools. Specifically, these exhibits include data for BIE schools in the measure presented for “all states.” They cannot, however, display data specifically for BIE schools. The reason is that the resident population relevant for BIE schools, which have no distinct geographic boundaries, is dispersed throughout all of the states and counted as part of the resident populations of the individual states.
3. The four outlying areas and three freely associated states are not included in the exhibits in this section because data were frequently not available due to cell suppression or data were not reported. For example, the U.S. Census’ annual population estimates exclude residents of these jurisdictions even though the most recent decennial census (collected in 2010) did include residents of the four outlying areas. The unavailability of annual population data results in an inability to calculate associated percentages.
4. The suppression of numerical data results in an inability to calculate associated percentages. Suppression of certain data occurs to limit disclosure of personally identifiable information consistent with federal law. Under IDEA section 618(b)(1), the data collected by the U.S. Department of Education (Department) under IDEA section 618(a) must be publicly reported by each state in a manner that does not result in the disclosure of data identifiable to individual children. Additionally, under 34 C.F.R. section 99.35(a)(1) of the Family Educational Rights and Privacy Act (FERPA) regulations, authorized representatives of the secretary may have access to education records in connection with an audit or evaluation of federal or state-supported education programs or for the enforcement of or compliance with federal legal requirements that relate to those programs. However, under 34 C.F.R. section 99.35(b)(1) of the FERPA regulations, information collected by authorized representatives of the secretary for these purposes must be protected in a manner that does not permit personal identification of individuals by anyone other than those officials. Only those officials may make further disclosures in accordance with the requirements in 34 C.F.R. section 99.33(b). It

85
is the policy of the Department to be consistent with the provisions of IDEA and FERPA privacy statutes and regulations. Each office in the Department has different purposes for its data collections. Therefore, each office develops its own approach to data presentation that ensures the protection of privacy while meeting the purposes of the data collection and the Department’s Information Quality Guidelines, which were developed as required by the Office of Management and Budget. The 2003–04 data presented in the 28th Annual Report to Congress, 2006 were the first data in these reports to which OSEP applied its cell suppression policy.
In preparing this report, OSEP determined that certain numbers required for calculating the percentages in the exhibits that follow would be suppressed in order to avoid the identification of children and students through data publication. In general, counts of one to three children or students were suppressed. In addition, other counts were suppressed when needed to prevent the calculation of another suppressed number. When counts were suppressed for a state, percentages and ratios that required those counts could not be calculated. In most cases, however, national counts that were used to calculate the national percentages and ratios presented for “All states” in the exhibits that follow were not suppressed.

86
Infants and Toddlers Birth Through Age 2 Served Under IDEA, Part C
Part C Child Count
How did the states compare with regard to the percentage of the resident population of infants and toddlers birth through age 2 served under IDEA, Part C, in 2014, and how did the percentages change between 2008 and 2014?
Exhibit 48. Percentage of the population birth through age 2 served under IDEA, Part C, by year and state: Fall 2008 and fall 2014
State 2008 2014
Percent change between 2008
and 2014a All states 2.8 2.9 5.4
Alabama 1.6 1.7 9.1 Alaska 1.9 2.2 15.8 Arizona 2.0 2.1 4.8 Arkansas 2.4 1.0 -59.1 California 2.6 2.4 -7.5 Colorado 2.3 3.4 49.2 Connecticut 3.8 4.1 8.4 Delaware 2.5 2.9 15.3 District of Columbia 1.5 2.4 59.2 Florida 2.0 2.1 4.3 Georgia 1.3 2.1 55.4 Hawaii 6.9 2.7 -60.1 Idaho 2.6 2.7 2.8 Illinois 3.7 4.4 20.2 Indiana 3.7 3.8 2.1 Iowa 2.9 3.0 1.4 Kansas 2.8 3.9 39.2 Kentucky 2.9 2.7 -8.5 Louisiana 2.1 2.3 11.9 Maine 2.3 2.3 -0.1 Maryland 3.3 3.5 5.1 Massachusetts 6.7 8.8 30.9 Michigan 2.7 2.6 -4.9 Minnesota 2.1 2.6 23.2 Mississippi 1.6 1.7 1.5 Missouri 1.6 2.4 49.5 Montana 2.0 1.9 -6.0 Nebraska 1.8 1.9 6.3 Nevada 1.8 2.7 55.8 New Hampshire 3.3 5.0 52.8 New Jersey 3.0 3.6 17.6 See notes at end of exhibit.

87
Exhibit 48. Percentage of the population birth through age 2 served under IDEA, Part C, by year and state: Fall 2008 and fall 2014―Continued
State 2008 2014
Percent change between 2008
and 2014a New Mexico 5.0 6.3 24.9 New York 4.4 4.0 -9.2 North Carolina 2.4 2.8 13.9 North Dakota 3.6 3.9 6.6 Ohio 3.4 2.5 -27.1 Oklahoma 1.9 1.6 -12.9 Oregon 1.8 2.6 43.9 Pennsylvania 3.8 4.3 12.3 Puerto Rico 3.5 3.2 -6.9 Rhode Island 5.0 6.4 28.4 South Carolina 2.4 2.1 -11.6 South Dakota 3.2 3.5 7.1 Tennessee 1.8 1.8 4.3 Texas 2.3 2.1 -11.2 Utah 2.0 2.6 29.4 Vermont 4.0 4.4 9.3 Virginia 2.1 2.9 39.7 Washington 1.9 2.5 31.2 West Virginia 4.2 5.1 20.1 Wisconsin 2.8 2.8 0.8 Wyoming 4.6 5.4 15.9 aPercent change was calculated for each state and “All states” by subtracting the percentage for 2008 from the percentage for 2014, dividing the difference by the percentage for 2008, and then multiplying the result by 100. Due to rounding, it may not be possible to reproduce the percent change from the values presented in the exhibit. NOTE: Percentage for each state was calculated by dividing the number of infants and toddlers birth through age 2 served under IDEA, Part C, by the state in the year by the estimated U.S. resident population birth through age 2 in the state for that year, then multiplying the result by 100. Percentage for “All states” was calculated for all states with available data by dividing the number of infants and toddlers birth through age 2 served under IDEA, Part C, by all states in the year by the estimated U.S. resident population birth through age 2 in all states for that year, then multiplying the result by 100. SOURCE: U.S. Department of Education, EDFacts Metadata and Process System (EMAPS), OMB #1820-0557: “IDEA Part C Child Count and Settings Collection,” 2008 and 2014. U.S. Department of Commerce, U.S. Census Bureau. “State Single Year of Age and Sex Population Estimates: April 1, 2000 to July 1, 2014—RESIDENT,” 2008 and 2014. Data for 2008 were accessed spring 2012. Data for 2014 were accessed fall 2015. For actual data used, go to http://www2.ed.gov/about/reports/annual/osep/index.html.
• In 2014, 2.9 percent of infants and toddlers birth through age 2 in the resident population in “All states” were served under IDEA, Part C. The percentages served in the 52 individual states ranged from 1 percent to 8.8 percent. The percentage was less than 2 percent in the following seven states: Montana (1.9 percent), Nebraska (1.9 percent), Tennessee (1.8 percent), Alabama (1.7 percent), Mississippi (1.7 percent), Oklahoma (1.6 percent), and Arkansas (1.0 percent). The percentage was larger than 5 percent in the following five states: Massachusetts (8.8 percent), New Mexico (6.4 percent), Rhode Island (6.4 percent), Wyoming (5.4 percent), and West Virginia (5.1 percent).

88
• In 2008, 2.8 percent of infants and toddlers birth through age 2 in the resident population in “All states” were served under IDEA, Part C.
• For 39 of the 52 states, the percentage of the population served increased between 2008 and 2014. For 17 of those states, the increase represented a percent change of more than 20 percent. The percent change increase exceeded 50 percent in the following four states: the District of Columbia (59.2 percent), Nevada (55.8 percent), Georgia (55.4 percent), and New Hampshire (52.8 percent).
• For 13 of the 52 states, the percentage of the population served decreased between 2008 and 2014. However, the decrease represented a percent change of less than 20 percent in each of the states except Ohio, Arkansas, and Hawaii, where the percentage served decreased by 27.1 percent, 59.1 percent, and 60.1 percent, respectively.

89
How did the states compare with regard to the percentage of the resident population birth through age 2 within each racial/ethnic group who were served under IDEA, Part C, in 2014?
Exhibit 49. Percentage of the population birth through age 2 served under IDEA, Part C, for each racial/ethnic group, by state: Fall 2014
State American Indian or
Alaska Native Asian
Black or African
American Hispanic/
Latino
Native Hawaiian or Other
Pacific Islander White
Two or more races
All states 2.8 2.4 2.7 2.9 4.0 3.2 2.2 Alabama 1.3 1.9 1.7 1.5 0.0 1.8 1.8 Alaska 4.1 1.1 1.4 1.6 1.2 2.0 2.0 Arizona 2.3 1.2 2.1 1.8 3.7 2.5 1.0 Arkansas 0.6 0.7 1.3 0.6 0.7 1.0 0.6 California 1.9 2.1 3.0 x x x x Colorado 1.1 2.6 3.3 3.3 2.3 3.7 2.2 Connecticut 3.5 2.5 3.8 5.0 27.3 4.2 2.1 Delaware x x 3.1 3.1 0.0 2.9 2.4 District of Columbia x x 2.6 3.0 x 1.9 2.0 Florida 3.0 1.5 2.3 2.4 2.3 1.9 1.7 Georgia 1.7 1.6 2.6 0.9 3.9 2.4 0.5 Hawaii x 4.0 x 1.3 3.0 6.4 1.2 Idaho 2.7 2.2 2.9 2.1 5.6 2.8 3.4 Illinois 2.4 2.6 4.0 5.1 3.3 4.6 3.0 Indiana 1.1 2.4 3.4 4.0 4.3 3.9 2.9 Iowa 4.5 2.5 3.5 3.5 7.0 2.8 3.7 Kansas 2.4 2.8 3.5 3.8 11.1 4.1 3.4 Kentucky 3.1 2.5 2.1 2.6 3.5 2.7 3.0 Louisiana 0.4 1.3 2.7 1.5 0.0 2.2 2.1 Maine 2.6 0.7 1.7 x x 2.5 1.0 Maryland 2.6 3.1 3.4 3.2 8.8 3.9 2.5 Massachusetts 8.3 6.5 10.0 10.1 8.2 8.7 7.3 Michigan 3.6 1.3 2.7 2.2 6.2 2.8 1.3 Minnesota 5.1 1.9 2.6 2.9 2.6 2.6 2.2 Mississippi x 2.2 1.8 1.1 x 1.7 1.1 Missouri 0.8 1.8 2.7 2.0 3.2 2.5 1.8 Montana 2.6 x x 0.5 0.0 1.8 2.3 Nebraska 2.6 x 1.4 1.5 x 2.1 1.3 Nevada 2.0 2.1 3.1 2.6 2.6 3.1 2.4 New Hampshire x 3.8 4.9 2.6 x 5.4 6.3 New Jersey 2.3 2.5 2.8 3.9 19.1 3.9 4.1 New Mexico 5.0 3.2 6.9 7.2 4.9 5.5 3.0 New York 2.6 2.9 3.0 3.5 15.2 5.2 1.1 See notes at end of exhibit.

90
Exhibit 49. Percentage of the population birth through age 2 served under IDEA, Part C, for each racial/ethnic group, by state: Fall 2014―Continued
State American Indian or
Alaska Native Asian
Black or African
American Hispanic/
Latino
Native Hawaiian or Other
Pacific Islander White
Two or more races
North Carolina 2.8 1.8 3.2 2.5 2.3 2.9 1.3 North Dakota 4.8 4.0 3.8 1.2 11.8 3.8 2.1 Ohio 4.8 2.0 2.4 1.5 15.3 2.6 2.3 Oklahoma 1.0 1.7 1.3 1.6 4.7 1.8 1.3 Oregon 1.6 2.0 2.1 2.6 1.0 2.8 1.2 Pennsylvania 4.0 3.1 4.6 4.3 4.4 4.3 5.8 Rhode Island x 3.0 5.9 6.8 x 6.5 5.4 South Carolina x 1.7 2.4 2.1 x 2.0 1.8 South Dakota 4.3 2.8 1.9 2.1 11.5 3.5 3.2 Tennessee 1.4 1.8 1.7 1.3 6.5 2.0 1.7 Texas 0.8 1.2 1.6 2.2 3.3 2.3 0.6 Utah 2.7 2.0 2.2 2.7 2.5 2.6 1.6 Vermont 0.0 4.3 4.4 1.2 0.0 4.4 5.7 Virginia 1.3 2.1 2.6 2.2 2.5 3.2 3.6 Washington 3.7 2.1 2.7 2.5 3.3 2.5 2.0 West Virginia 2.7 3.0 3.4 5.1 21.4 5.2 3.9 Wisconsin x 1.5 3.5 3.4 x 2.8 2.3 Wyoming 6.0 x 3.4 4.6 x 5.5 4.4 x Percentage cannot be calculated because data were suppressed to limit disclosure. NOTE: Percentage for each state was calculated by dividing the number of infants and toddlers birth through age 2 served under IDEA, Part C, reported in the racial/ethnic group by the state by the estimated U.S. resident population birth through age 2 of the racial/ethnic group in the state, then multiplying the result by 100. Percentage for “All states” was calculated by dividing the number of infants and toddlers birth through age 2 served under IDEA, Part C, reported in the racial/ethnic group by all states by the estimated U.S. resident population birth through age 2 of the racial/ethnic group in all states, then multiplying the result by 100. Data for most infants and toddlers in California were suppressed; therefore, these data were excluded. However, as race/ethnicity was suppressed for only 218 infants and toddlers served under Part C in 12 other states, the total number of infants and toddlers served under Part C in each racial/ethnic group for which some data were suppressed in each of these states was estimated by distributing the unallocated count for each state equally to the race/ethnicity categories that were suppressed. SOURCE: U.S. Department of Education, EDFacts Metadata and Process System (EMAPS), OMB #1820-0557: “IDEA Part C Child Count and Settings Collection,” 2014. Data for California and Puerto Rico were excluded. U.S. Department of Commerce, U.S. Census Bureau. “Intercensal Estimates of the Resident Population by Single Year of Age and Sex for States and the United States: April 1, 2000 to July 1, 2014,” 2014. Data for California were excluded, and data for Puerto Rico were not available. Data were accessed fall 2015. For actual data used, go to http://www2.ed.gov/about/reports/annual/osep/index.html.
• Larger percentages of the resident population birth through age 2 who were Native Hawaiian or Other Pacific Islander and White than any other racial/ethnic group were served under IDEA, Part C, in the 50 states (“All states”) for which data were available. Specifically, 4 percent of the resident population that was Native Hawaiian or Other Pacific Islander and 3.2 percent of the resident population that was White were served under Part C. In contrast, a smaller percentage of the resident population associated with the racial/ethnic group representing infants and toddlers reported under two or more racial/ethnic groups than any other racial/ethnic group was served under IDEA, Part C, in “All states.” Specifically, 2.2 percent of those who were associated with two or more racial/ethnic groups were served under Part C.

91
• In 2014, 2.8 percent of the resident population birth through age 2 who were American Indian or Alaska Native were served under Part C in “All states.” The percentages ranged from zero percent to 8.3 percent in 43 individual states for which non-suppressed data were available. The percentage was 5 percent or more in three states: Massachusetts (8.3 percent), Wyoming (6.0 percent), and Minnesota (5.1 percent). In contrast, less than 1 percent was served in the following five states: Missouri (0.8 percent), Texas (0.8 percent), Arkansas (0.6 percent), Louisiana (0.4 percent), and Vermont (0.0 percent).
• In 2014, 2.4 percent of the resident population birth through age 2 who were Asian were served under Part C in “All states.” The percentages ranged from 0.7 percent to 6.5 percent in the 46 individual states for which non-suppressed data were available. The percentage was 4 or more percent in the following four states: Massachusetts (6.5 percent), Vermont (4.3 percent), Hawaii (4.0 percent), and North Dakota (4.0 percent). In contrast, less than 1 percent was served in the following two states: Arkansas (0.7 percent) and Maine (0.7 percent).
• In 2014, 2.7 percent of the resident population birth through age 2 who were Black or African American were served under Part C in “All states.” The percentages ranged from 1.3 to 10 percent in the 49 individual states for which non-suppressed data were available. In the following three states, the percentage was more than 5 percent: Massachusetts (10.0 percent), New Mexico (6.9 percent), and Rhode Island (5.9 percent). In contrast, the percentage was less than 2 percent in 10 states.
• In 2014, 2.9 percent of the resident population birth through age 2 who were Hispanic/Latino were served under Part C in “All states.” The percentages ranged from 0.5 to 10.1 percent in the 49 individual states for which non-suppressed data were available. The percentage was larger than 6 percent in the following three states: Massachusetts (10.1 percent), New Mexico (7.2 percent), and Rhode Island (6.8 percent). In contrast, the percentage was less than 1 percent in Georgia (0.9 percent), Arkansas (0.6 percent), and Montana (0.5 percent).
• In 2014, 4 percent of the resident population birth through age 2 who were Native Hawaiian or Other Pacific Islander were served under Part C in “All states.” The percentages ranged from zero to 27.3 percent in the 41 states for which non-suppressed data were available. The percentage was larger than 10 percent in eight states, including Connecticut in which more than 25 percent (27.3 percent) were served. In contrast, the percentage was zero in the following five states: Alabama, Delaware, Louisiana, Montana, and Vermont.
• In 2014, 3.2 percent of the resident population birth through age 2 who were White were served under Part C in “All states.” The percentages ranged from 1 to 8.7 percent in the 50 individual states for which non-suppressed data were available. The percentage was larger than 5 percent in the following eight states: Massachusetts (8.7 percent), Rhode Island (6.5 percent), Hawaii (6.4 percent), New Mexico (5.5 percent), Wyoming (5.5 percent), New Hampshire (5.4 percent), New York (5.2 percent) and West Virginia (5.2 percent). In contrast, the percentage was less than 2 percent in the following seven states: the District of Columbia (1.9 percent), Florida (1.9 percent), Alabama (1.8 percent), Montana (1.8 percent), Oklahoma (1.8 percent), Mississippi (1.7 percent), and Arkansas (1.0 percent).
• In 2014, 2.2 percent of the resident population birth through age 2 who were associated with two or more racial/ethnic groups were served under Part C in “All states.” The percentages ranged from 0.6 to 7.3 percent in the 50 individual states for which non-suppressed data were available. The percentage was 5 percent or more in the following five states: Massachusetts (7.3 percent), New Hampshire (6.3 percent), Pennsylvania (5.8 percent), Vermont

92
(5.7 percent), and Rhode Island (5.4 percent). In contrast, the percentage was less than 1 percent in the following three states: Arkansas (0.6 percent), Texas (0.6 percent), and Georgia (0.5 percent).

93
Part C Primary Early Intervention Service Settings
How did the states compare with regard to the distribution of infants and toddlers birth through age 2 served under IDEA, Part C, by primary early intervention service settings in 2014, and how did the distributions change between 2008 and 2014?
Exhibit 50. Percentage of infants and toddlers birth through age 2 served under IDEA, Part C, by year, primary early intervention service setting, and state: Fall 2008 and fall 2014
State
2008 2014
Homea
Community-based
settingb Other
settingc Homea
Community-based
settingb Other
settingc All states 86.1 5.7 8.1 88.1 7.6 4.4
Alabama 78.7 9.4 11.8 93.6 6.1 0.2 Alaska 88.5 7.3 4.2 92.5 6.8 0.7 Arizona 75.5 0.5 24.0 98.0 0.2 1.8 Arkansas 17.4 24.2 58.4 36.6 37.8 25.5 California 82.3 3.9 13.7 81.4 12.8 5.8 Colorado 97.0 1.8 1.2 99.1 0.8 0.1 Connecticut 95.1 4.6 0.3 96.8 3.2 # Delaware 78.9 11.0 10.1 85.2 10.2 4.6 District of Columbia 38.5 43.4 18.1 77.8 21.1 1.1 Florida 52.7 8.2 39.1 73.9 10.0 16.1 Georgia 98.5 0.4 1.1 99.0 0.7 0.3 Hawaii 91.6 2.8 5.6 85.1 4.7 10.3 Idaho 94.0 2.7 3.3 90.8 8.4 0.8 Illinois 88.1 4.2 7.8 80.4 7.7 11.9 Indiana 93.6 4.9 1.5 92.3 5.0 2.7 Iowa 96.1 2.5 1.5 96.7 2.2 1.1 Kansas 95.5 3.0 1.5 97.1 2.7 0.2 Kentucky 87.7 11.8 0.5 96.9 2.8 0.3 Louisiana 96.7 3.1 0.2 97.9 1.8 0.2 Maine 72.4 18.0 9.6 96.4 3.5 0.1 Maryland 83.9 8.4 7.7 82.5 15.1 2.5 Massachusetts 88.0 10.4 1.6 78.1 21.7 0.2 Michigan 85.3 8.0 6.7 87.2 7.8 5.0 Minnesota 91.2 3.3 5.5 94.4 2.9 2.7 Mississippi 85.0 6.2 8.8 81.4 11.8 6.8 Missouri 92.7 5.4 2.0 94.1 5.3 0.6 Montana 91.8 7.1 1.1 97.9 1.6 0.4 Nebraska 85.7 7.2 7.0 92.2 6.2 1.7 Nevada 97.8 1.9 0.2 83.1 3.3 13.6 New Hampshire 95.5 0.9 3.6 93.7 5.2 1.1 New Jersey 92.5 6.2 1.2 92.1 7.7 0.2 New Mexico 76.8 21.4 1.9 83.9 14.8 1.4 New York 90.1 2.5 7.4 90.2 3.5 6.3 See notes at end of exhibit.

94
Exhibit 50. Percentage of infants and toddlers birth through age 2 served under IDEA, Part C, by year, primary early intervention service setting, and state: Fall 2008 and fall 2014—Continued
State
2008 2014
Homea
Community-based
settingb Other
settingc Homea
Community-based
settingb Other
settingc North Carolina 90.2 8.8 1.0 92.3 7.2 0.5 North Dakota 98.4 1.0 0.6 98.9 1.0 0.2 Ohio 86.6 3.6 9.8 80.8 5.5 13.7 Oklahoma 95.1 2.9 2.0 94.0 2.3 3.7 Oregon 90.3 2.9 6.8 93.0 3.5 3.6 Pennsylvania 97.6 2.0 0.4 97.0 2.9 0.1 Puerto Rico 85.1 x x 83.4 16.5 0.1 Rhode Island 84.4 6.6 9.0 94.9 1.8 3.3 South Carolina 83.2 0.8 16.1 92.2 5.5 2.3 South Dakota 80.8 18.4 0.8 80.7 19.2 0.1 Tennessee 72.9 17.1 10.0 72.0 8.5 19.5 Texas 94.5 5.1 0.4 96.0 3.5 0.5 Utah 67.4 3.2 29.3 92.8 2.6 4.6 Vermont 85.0 12.7 2.4 80.0 17.4 2.6 Virginia 75.4 4.4 20.3 87.9 4.9 7.2 Washington 66.8 16.0 17.3 78.1 16.3 5.5 West Virginia 97.6 2.4 0.0 97.1 2.9 0.0 Wisconsin 90.8 3.9 5.3 92.2 6.7 1.1 Wyoming 77.2 x x 72.5 26.0 1.6 # Percentage was non-zero, but less than 0.05 or 5/100 of 1 percent. x Percentage cannot be calculated because data were suppressed to limit disclosure. aHome refers to the principal residence of the eligible infant’s or toddler’s family or caregivers. bCommunity-based setting refers to settings in which children without disabilities are usually found. The community-based settings include, but are not limited to, child care centers (including family day care), preschools, regular nursery schools, early childhood centers, libraries, grocery stores, parks, restaurants, and community centers (e.g., YMCA, Boys and Girls Clubs). cOther setting refers to settings other than home or community-based setting in which early intervention services are provided. These include, but are not limited to, services provided in a hospital, residential facility, clinic, and early intervention center/class for children with disabilities. NOTE: Percentage for each state was calculated by dividing the number of infants and toddlers birth through age 2 served under IDEA, Part C, by the state who were reported in the primary service setting in the year by the total number of infants and toddlers birth through age 2 served under IDEA, Part C, by the state in the year, then multiplying the result by 100. Percentage for “All states” was calculated by dividing the number of infants and toddlers birth through age 2 served under IDEA, Part C, by all states who were reported in the primary service setting in the year by the total number of infants and toddlers birth through age 2 served under IDEA, Part C, by all states in the year, then multiplying the result by 100. Percentage for “All states” includes suppressed data. The sum of row percentages for a year may not total 100 because of rounding. SOURCE: U.S. Department of Education, EDFacts Metadata and Process System (EMAPS), OMB #1820-0557: “IDEA Part C Child Count and Settings Collection,” 2008 and 2014. Data for 2008 were accessed spring 2012. Data for 2014 were accessed fall 2015. For actual data used, go to http://www2.ed.gov/about/reports/annual/osep/index.html.
• The percentages of infants and toddlers birth through age 2 served under IDEA, Part C, primarily in a home, a community-based setting, and some other setting by “All states” in 2014, were 88.1 percent, 7.6 percent, and 4.4 percent, respectively. In 2008, the values were 86.1 percent, 5.7 percent, and 8.1 percent being primarily served in a home, a community-based setting, and some other setting, respectively.

95
• Home was the primary setting for 90 percent or more of infants and toddlers served under IDEA, Part C, by 31 states in 2014. In addition, more than 50 percent of infants and toddlers in every state except Arkansas were served in a home. In Arkansas, home was the primary setting for only 36.6 percent of infants and toddlers, while a community-based setting was the primary setting for 37.8 percent of the infants and toddlers.
• In 2008, home was the primary setting for 90 percent or more of infants and toddlers served under IDEA, Part C, by 24 states. In addition, more than 50 percent of infants and toddlers in every state except Arkansas and the District of Columbia were served in a home. In the District of Columbia, a community-based setting was the most prevalent primary setting, accounting for 43.4 percent of the infants and toddlers served. In Arkansas, other setting was the most prevalent primary setting, accounting for 58.4 percent of the infants and toddlers served.

96
Part C Exiting
How did the states compare with regard to the percentage of infants and toddlers birth through age 2 exiting or continuing in IDEA, Part C, by exiting status in 2013–14?
Exhibit 51. Percentage of infants and toddlers birth through age 2 exiting or continuing in IDEA, Part C, by exiting status and state: 2013–14
State
No longer eligible for
Part C prior to reaching
age 3
Part B eligible, exiting Part C
Part B eligible,
continuing in Part C
Not eligible for Part B,
exit with referrals to other
programs
Not eligible for Part B,
exit with no referrals
Part B eligibility
not determineda Deceased
Moved out of state
Withdrawal by parent
(or guardian)
Attempts to contact
unsuccessful All states 13.8 38.1 3.1 6.8 3.1 11.2 0.3 3.9 12.1 7.5
Alabama 15.5 39.3 0.0 2.5 3.7 4.8 0.4 4.2 18.3 11.3 Alaska 13.2 36.7 0.0 3.7 5.8 4.9 0.5 9.0 12.4 13.8 Arizona 5.9 40.7 0.0 4.7 3.5 15.7 0.7 4.5 13.0 11.2 Arkansas 11.6 14.8 0.0 4.7 1.9 5.4 0.2 1.8 56.5 3.2 California 7.8 43.6 0.0 18.4 0.0 17.4 0.3 1.5 8.3 2.7 Colorado 15.0 40.9 0.0 8.2 4.7 10.7 0.2 6.4 9.0 4.8 Connecticut 8.8 47.1 0.0 5.9 4.5 8.0 0.1 4.6 13.2 7.9 Delaware 14.2 45.8 0.0 7.4 3.6 5.8 0.3 5.9 9.6 7.4 District of Columbia 16.5 37.6 0.0 4.4 6.8 11.8 0.0 7.6 5.7 9.5 Florida 9.8 42.2 0.0 3.3 1.7 21.3 0.4 3.6 8.0 9.8 Georgia 0.0 43.9 0.0 4.3 2.7 9.6 1.0 6.8 12.1 19.6 Hawaii 12.1 29.2 0.0 6.8 3.9 14.5 0.2 8.9 16.0 8.4 Idaho 22.2 29.9 0.0 6.2 3.7 8.7 0.3 6.9 11.6 10.4 Illinois 18.0 41.5 0.0 6.6 0.5 12.3 0.2 3.0 9.6 8.3 Indiana 24.9 30.7 0.0 4.2 6.1 11.2 0.2 2.8 18.2 1.5 Iowa 8.4 33.8 0.0 19.6 2.9 0.5 0.2 3.8 22.7 8.1 Kansas 16.5 50.8 0.0 3.1 2.8 5.5 0.4 5.7 9.5 5.6 Kentucky 14.5 52.1 0.0 5.0 7.6 7.2 0.3 5.0 1.9 6.4 Louisiana 19.0 41.5 0.0 3.8 2.4 7.2 0.7 4.2 12.4 8.7 See notes at end of exhibit.

97
Exhibit 51. Percentage of infants and toddlers birth through age 2 exiting or continuing in IDEA, Part C, by exiting status and state: 2013–14—Continued
State
No longer eligible for
Part C prior to reaching
age 3
Part B eligible, exiting Part C
Part B eligible,
continuing in Part C
Not eligible for Part B,
exit with referrals to other
programs
Not eligible for Part B,
exit with no referrals
Part B eligibility
not determineda Deceased
Moved out of state
Withdrawal by parent
(or guardian)
Attempts to contact
unsuccessful Maine 11.5 55.4 0.0 0.3 5.4 2.6 0.4 3.2 14.0 7.1 Maryland 28.0 14.9 30.2 1.1 0.7 2.9 0.3 4.2 9.8 7.8 Massachusetts 16.9 41.8 0.0 6.7 1.1 0.0 0.2 4.2 14.7 14.4 Michigan 15.1 34.6 0.0 3.0 6.8 3.4 0.3 7.3 16.4 13.0 Minnesota 7.2 59.0 0.0 7.8 8.0 0.6 0.4 3.6 11.3 2.1 Mississippi 10.5 43.7 0.0 3.5 4.4 15.0 0.6 4.4 10.7 7.0 Missouri 3.8 57.0 0.0 6.0 8.7 3.6 0.6 5.7 11.1 3.6 Montana 13.9 31.8 0.0 7.4 5.3 9.5 0.3 9.0 13.4 9.5 Nebraska 11.7 31.5 40.9 1.7 1.5 0.0 0.4 3.0 5.3 4.2 Nevada 8.2 41.9 0.0 2.5 1.4 15.7 0.6 7.5 12.0 10.1 New Hampshire 20.3 42.8 0.0 6.6 4.3 4.9 0.4 4.8 9.1 6.8 New Jersey 13.7 38.5 0.0 9.4 4.0 14.2 0.2 2.9 12.7 4.5 New Mexico 11.9 28.6 0.0 6.6 5.8 7.9 0.2 10.1 15.2 13.8 New York 11.3 32.4 26.7 1.2 2.5 17.1 0.2 2.5 4.1 2.0 North Carolina 8.7 34.2 0.0 3.4 6.2 18.4 0.6 4.8 13.8 10.0 North Dakota 0.0 37.9 0.0 16.4 2.5 5.3 0.7 12.8 18.2 6.4 Ohio 14.8 40.0 0.0 7.3 6.1 4.7 0.5 3.0 12.8 10.8 Oklahoma 12.6 31.2 0.0 2.1 1.1 14.6 0.4 5.2 17.4 15.3 Oregon 9.3 59.3 0.0 0.2 4.9 0.3 0.3 5.2 11.5 8.9 Pennsylvania 27.2 39.0 0.0 2.8 4.0 9.4 0.3 3.2 6.2 7.9 Puerto Rico 30.1 10.8 0.0 # # 33.1 0.2 3.3 9.1 13.3 Rhode Island 20.6 36.1 0.0 8.5 3.7 5.9 # 4.5 9.6 11.0 South Carolina x x x x x x x x x x South Dakota 7.9 50.9 0.0 15.1 4.4 1.5 0.3 6.5 8.2 5.2 See notes at end of exhibit.

98
Exhibit 51. Percentage of infants and toddlers birth through age 2 exiting or continuing in IDEA, Part C, by exiting status and state: 2013–14—Continued
State
No longer eligible for
Part C prior to reaching
age 3
Part B eligible, exiting Part C
Part B eligible,
continuing in Part C
Not eligible for Part B,
exit with referrals to other
programs
Not eligible for Part B,
exit with no referrals
Part B eligibility
not determineda Deceased
Moved out of state
Withdrawal by parent
(or guardian)
Attempts to contact
unsuccessful Tennessee 9.8 37.3 0.0 4.6 4.2 16.8 0.5 5.7 13.7 7.4 Texas 14.4 30.3 0.0 5.7 1.8 10.2 0.4 3.7 22.8 10.8 Utah 10.9 42.3 0.0 2.1 5.4 9.0 0.3 5.1 20.5 4.3 Vermont 17.3 62.3 0.0 1.5 2.2 0.4 0.4 4.8 3.6 7.6 Virginia 17.7 29.5 0.0 7.4 11.7 5.5 0.4 5.7 13.6 8.5 Washington 7.2 43.6 0.0 7.3 5.9 5.1 0.3 5.7 17.9 7.3 West Virginia 20.5 27.8 0.0 5.6 3.5 15.0 0.1 5.6 15.1 7.0 Wisconsin 18.7 43.4 0.0 3.6 3.1 11.1 0.3 2.2 11.9 5.9 Wyoming 22.2 44.8 0.0 4.9 3.5 0.9 0.3 8.7 5.8 8.9 # Percentage was non-zero, but less than 0.05 or 5/100 of 1 percent. x Percentage cannot be calculated because data were suppressed to limit disclosure. aThe Part B eligibility not determined category comprises children who were referred for Part B evaluation at the time they were eligible to exit Part C, but for whom the Part B eligibility determination had not yet been made or reported and children for whom parents did not consent to transition planning. NOTE: The U.S. Department of Education collects Part C data on 10 exit status categories: five categories that speak to Part B eligibility (i.e., Part B eligible, exiting Part C; Part B eligible, continuing in Part C; not eligible for Part B, exit with referrals to other programs; not eligible for Part B, exit with no referrals; and Part B eligibility not determined) and five categories that do not speak to Part B eligibility (i.e., no longer eligible for Part C prior to reaching age 3, deceased, moved out of state, withdrawal by parent [or guardian], and attempts to contact unsuccessful). The 10 categories are mutually exclusive. Percentage for each state was calculated by dividing the number of infants and toddlers birth through age 2 served under IDEA, Part C, by the state who were reported in the exiting category by the total number of infants and toddlers birth through age 2 served under IDEA, Part C, by the state who were reported in all the exiting categories, then multiplying the result by 100. Percentage for “All states” was calculated for all states with available non-suppressed data by dividing the number of infants and toddlers birth through age 2 served under IDEA, Part C, by all states who were reported in the exiting category by the total number of infants and toddlers birth through age 2 served under IDEA, Part C, by all states who were reported in all the exiting categories, then multiplying the result by 100. The sum of row percentages may not total 100 because of rounding. Data are from a cumulative 12-month reporting period, which may have varied from state to state. SOURCE: U.S. Department of Education, EDFacts Metadata and Process System (EMAPS), OMB #1820-0557: “IDEA Part C Exiting Collection,” 2013–14. Data were accessed fall 2015. For actual data used, go to http://www2.ed.gov/about/reports/annual/osep/index.html.

99
• In 2013–14, the most prevalent Part C exit status was Part B eligible, exiting Part C. This exit status accounted for 38.1 percent of the infants and toddlers birth through age 2 exiting Part C in “All states.” This exit status also was associated with the largest percentage in 47 of the 51 states for which non-suppressed data were available. In eight of those states, this reason accounted for the majority of exits. In Vermont, the value was larger than 60 percent (62.3 percent).
• The category of no longer eligible for Part C prior to reaching age 3 accounted for the second largest percentage of exits for “All states,” but it represented only 13.8 percent of the exits. Moreover, this category did not account for the largest percentage of exits in any state.
• In Nebraska and Maryland, the most prevalent Part C exit status, accounting for 40.9 percent and 30.2 percent of the exits, respectively, was Part B eligible, continuing in Part C.
• In Arkansas, the most prevalent Part C exit status, accounting for 56.5 percent of the exits, was withdrawn by parent (or guardian).
• In Puerto Rico, the most prevalent Part C exit status, accounting for 33.1 percent of exits, was Part B eligibility not determined.

100
Part C Dispute Resolution
Unlike the other Part C data collections, which are associated with a specific group of Part C participants defined by the participants’ ages, the Part C dispute resolution data collection is associated with all infants and toddlers served under IDEA, Part C. These infants and toddlers may include individuals who are 3 years or older and eligible under Part B but whose parents elect for them to continue receiving Part C services, as states have the authority to define an “infant or toddler with a disability” to include individuals under 3 years of age and individuals 3 years of age and older [see IDEA, section 632(5)(B) and 34 C.F.R. 303.21(c)] and serve them under Part C until the beginning of the school year following the child’s third or fourth birthday or until the child is eligible to enter kindergarten [see IDEA, section 635(c) and 34 C.F.R. 303.211]. The Part C legal disputes and resolution data represent all complaints associated with any participant in Part C during the 12 months during which the data were collected. Nevertheless, since infants and toddlers birth through age 2 served under IDEA, Part C, account for nearly all of the participants in Part C in all states, the count for infants and toddlers birth through age 2 served as of the state-designated date for the year was deemed a meaningful basis for creating a ratio by which to compare the volume of Part C disputes that occurred in the individual states during the year. For an overview of the Part C dispute resolution process, see the Section I discussion of these same data at the national level.
How did the states compare with regard to the following ratios in 2013–14:
1. the number of written, signed complaints for infants and toddlers served under IDEA, Part C, per 1,000 infants and toddlers birth through age 2 served;
2. the number of due process complaints for infants and toddlers served under IDEA, Part C, per 1,000 infants and toddlers birth through age 2 served; and
3. the number of mediation requests for infants and toddlers served under IDEA, Part C, per 1,000 infants and toddlers birth through age 2 served?

101
Exhibit 52. Number of written, signed complaints; due process complaints; and mediation requests for infants and toddlers per 1,000 infants and toddlers birth through age 2 served under IDEA, Part C, by state: 2013–14
State Written, signed
complaintsa Due process complaintsb
Mediation requestsc
Per 1,000 infants and toddlers served All states 0.3 0.3 0.5
Alabama 0.0 0.0 0.0 Alaska 0.0 0.0 0.0 Arizona 2.6 0.6 0.0 Arkansas 0.7 0.0 0.0 California 0.5 1.6 1.7 Colorado 0.0 0.0 0.0 Connecticut 0.4 0.0 0.0 Delaware 0.0 0.0 0.0 District of Columbia 0.0 3.9 3.9 Florida 0.1 0.0 0.0 Georgia 0.0 0.0 0.0 Hawaii 0.0 0.0 0.0 Idaho 0.0 0.0 0.0 Illinois 0.5 # 0.0 Indiana 0.4 0.0 0.0 Iowa 0.0 0.0 0.0 Kansas 0.0 0.0 0.0 Kentucky 1.0 0.0 0.0 Louisiana 4.3 0.0 0.0 Maine 0.0 0.0 1.2 Maryland 0.4 0.1 0.4 Massachusetts 0.1 0.0 0.0 Michigan 0.0 0.0 0.0 Minnesota 0.0 0.0 0.0 Mississippi 0.0 0.0 0.0 Missouri 0.2 0.0 0.0 Montana 0.0 0.0 0.0 Nebraska 0.0 0.0 0.0 Nevada 1.6 0.0 0.0 New Hampshire 0.0 0.0 0.0 New Jersey 0.3 0.1 0.1 New Mexico 0.0 0.0 0.0 New York 0.7 1.0 3.6 North Carolina 0.1 0.0 0.0 North Dakota 0.0 0.0 0.0 Ohio 0.0 0.0 0.0 Oklahoma 0.0 0.0 0.0 Oregon 0.0 0.0 0.0 Pennsylvania 0.1 0.0 0.0 See notes at end of exhibit.

102
Exhibit 52. Number of written, signed complaints; due process complaints; and mediation requests for infants and toddlers per 1,000 infants and toddlers birth through age 2 served under IDEA, Part C, by state: 2013–14—Continued
State Written, signed
complaintsa Due process complaintsb
Mediation requestsc
Per 1,000 infants and toddlers served Puerto Rico 0.0 0.0 0.0 Rhode Island 0.0 0.0 0.0 South Carolina 0.8 0.0 0.0 South Dakota 0.0 0.0 0.0 Tennessee 0.5 0.2 0.0 Texas 0.0 0.0 0.0 Utah 0.0 0.0 0.0 Vermont 0.0 0.0 0.0 Virginia 0.0 0.1 0.0 Washington 0.0 0.0 0.0 West Virginia 0.3 0.0 0.0 Wisconsin 0.0 0.0 0.2 Wyoming 0.0 0.0 0.0 aA written, signed complaint is a signed document with specific content requirements that is submitted to a state lead agency by an individual or organization that alleges a violation of a requirement of Part C of IDEA. The total number of written, signed complaints in 2013–14 was 113. bA due process complaint is a filing by any party to initiate a due process hearing on matters related to the identification, evaluation, or early intervention setting of a child with a disability or to the provision of early intervention services to such child. The total number of due process complaints in 2013–14 was 96. cA mediation request is a request by a party to a dispute involving any matter under Part C of IDEA to meet with a qualified and impartial mediator to resolve the dispute. The total number of mediation requests in 2013–14 was 168. NOTE: Ratio for each state was calculated by dividing the number of written, signed complaints; hearing requests; or mediation requests reported by the state by the total number of infants and toddlers birth through age 2 served under IDEA, Part C, by the state, then multiplying the result by 1,000. Ratio for “All states” was calculated for all states with available data by dividing the number of written, signed complaints; hearing requests; or mediation requests reported by all states by the total number of infants and toddlers birth through age 2 served under IDEA, Part C, by all states, then multiplying the result by 1,000. The numerator is based on data from the reporting period between July 1, 2013, and June 30, 2014, whereas the denominator is based on point-in-time data from fall 2013. SOURCE: U.S. Department of Education, EDFacts Metadata and Process System (EMAPS), OMB #1820-0678: “IDEA Part C Dispute Resolution Survey,” 2013–14. Data were accessed fall 2015. U.S. Department of Education, EDFacts Metadata and Process System (EMAPS), OMB #1820-0557: “IDEA Part C Child Count and Settings Collection,” 2013. Data were accessed fall 2014. For actual data used, go to http://www2.ed.gov/about/reports/annual/osep/index.html.
• In 2013–14, there were 0.3 written, signed complaints per 1,000 infants and toddlers birth through age 2 served under IDEA, Part C, in “All states.” However, the ratios were zero in 32 states and larger than 1 per 1,000 infants and toddlers served in only the following three states: Louisiana (4.3 per 1,000 infants and toddlers), Arizona (2.6 per 1,000 infants and toddlers), and Nevada (1.6 per 1,000 infants and toddlers).
• In 2013–14, there were 0.3 due process complaints per 1,000 infants and toddlers birth through age 2 served under IDEA, Part C, in “All states.” However, the ratios were zero in 43 states and larger than 1 per 1,000 infants and toddlers served in only the following two states: the District of Columbia (3.9 per 1,000 infants and toddlers) and California (1.6 per 1,000 infants and toddlers).

103
• In 2013–14, there was 0.5 mediation request per 1,000 infants and toddlers birth through age 2 served under IDEA, Part C, in “All states.” However, the ratios were zero in 45 states and larger than 1 per 1,000 infants and toddlers served in only the following four states: the District of Columbia (3.9 per 1,000 infants and toddlers), New York (3.6 per 1,000 infants and toddlers), California (1.7 per 1,000 infants and toddlers), and Maine (1.2 per 1,000 infants and toddlers).

104
Children Ages 3 Through 5 Served Under IDEA, Part B
Part B Child Count
How did the states compare with regard to the percentage of the resident population of children ages 3 through 5 served under IDEA, Part B, in 2014, and how did the percentages change between 2008 and 2014?
Exhibit 53. Percentage of the population ages 3 through 5 served under IDEA, Part B, by year and state: Fall 2008 and fall 2014
State 2008 2014
Percent change between 2008
and 2014a All states 5.8 6.2 6.9
Alabama 3.9 4.0 0.7 Alaska 6.6 6.3 -4.7 Arizona 5.1 5.7 12.4 Arkansas 10.6 11.2 5.4 California 4.7 5.1 8.6 Colorado 5.5 6.1 11.4 Connecticut 6.1 7.2 17.0 Delaware 6.7 6.1 -9.5 District of Columbia 3.1 6.2 96.7 Florida 5.3 5.8 10.9 Georgia 3.9 4.4 10.4 Hawaii 5.0 4.4 -11.0 Idaho 5.6 4.7 -16.7 Illinois 7.2 7.8 8.3 Indiana 7.2 7.0 -2.2 Iowa 5.1 5.3 5.3 Kansas 8.3 9.6 15.0 Kentucky 11.9 10.3 -13.2 Louisiana 5.3 5.2 -0.6 Maine 8.5 8.7 2.3 Maryland 5.6 5.9 4.8 Massachusetts 7.3 7.6 4.6 Michigan 6.5 5.9 -9.0 Minnesota 6.8 7.3 7.3 Mississippi 7.2 7.8 7.9 Missouri 6.6 7.3 10.5 Montana 5.4 4.4 -20.0 Nebraska 5.8 6.9 19.3 Nevada 5.5 7.8 41.2 New Hampshire 6.5 8.3 28.8 New Jersey 4.5 5.6 24.6 See notes at end of exhibit.
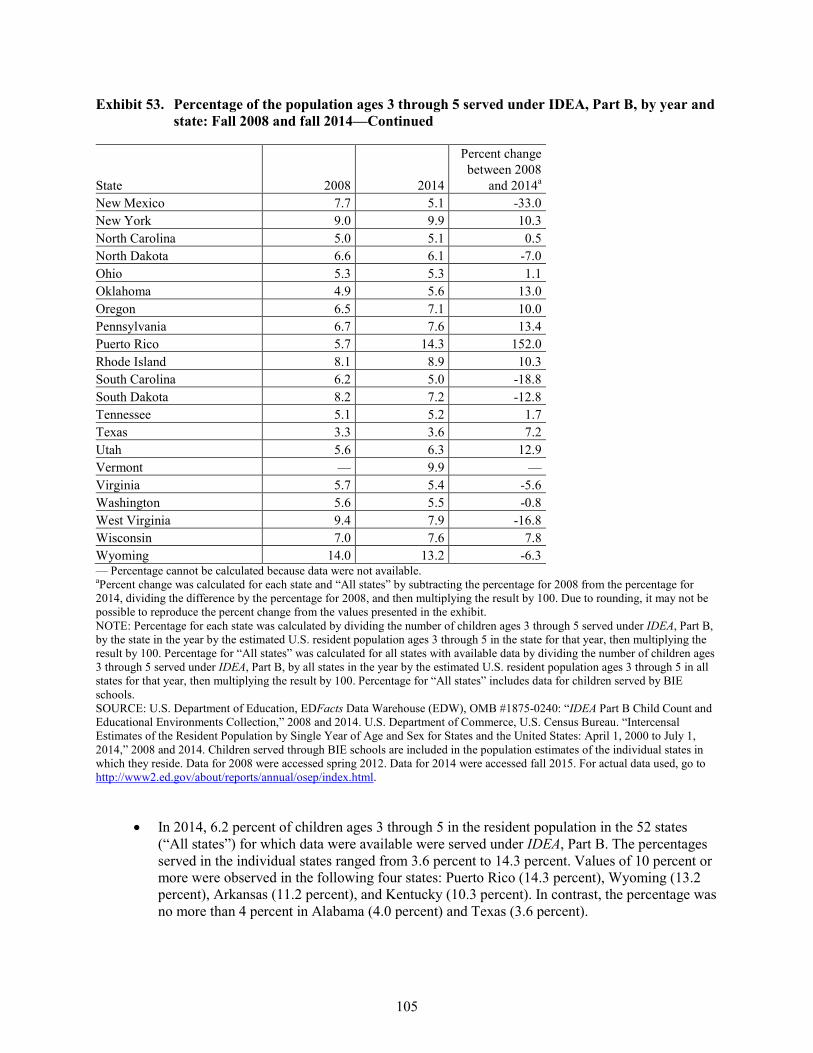
105
Exhibit 53. Percentage of the population ages 3 through 5 served under IDEA, Part B, by year and state: Fall 2008 and fall 2014—Continued
State 2008 2014
Percent change between 2008
and 2014a New Mexico 7.7 5.1 -33.0 New York 9.0 9.9 10.3 North Carolina 5.0 5.1 0.5 North Dakota 6.6 6.1 -7.0 Ohio 5.3 5.3 1.1 Oklahoma 4.9 5.6 13.0 Oregon 6.5 7.1 10.0 Pennsylvania 6.7 7.6 13.4 Puerto Rico 5.7 14.3 152.0 Rhode Island 8.1 8.9 10.3 South Carolina 6.2 5.0 -18.8 South Dakota 8.2 7.2 -12.8 Tennessee 5.1 5.2 1.7 Texas 3.3 3.6 7.2 Utah 5.6 6.3 12.9 Vermont — 9.9 — Virginia 5.7 5.4 -5.6 Washington 5.6 5.5 -0.8 West Virginia 9.4 7.9 -16.8 Wisconsin 7.0 7.6 7.8 Wyoming 14.0 13.2 -6.3 — Percentage cannot be calculated because data were not available. aPercent change was calculated for each state and “All states” by subtracting the percentage for 2008 from the percentage for 2014, dividing the difference by the percentage for 2008, and then multiplying the result by 100. Due to rounding, it may not be possible to reproduce the percent change from the values presented in the exhibit. NOTE: Percentage for each state was calculated by dividing the number of children ages 3 through 5 served under IDEA, Part B, by the state in the year by the estimated U.S. resident population ages 3 through 5 in the state for that year, then multiplying the result by 100. Percentage for “All states” was calculated for all states with available data by dividing the number of children ages 3 through 5 served under IDEA, Part B, by all states in the year by the estimated U.S. resident population ages 3 through 5 in all states for that year, then multiplying the result by 100. Percentage for “All states” includes data for children served by BIE schools. SOURCE: U.S. Department of Education, EDFacts Data Warehouse (EDW), OMB #1875-0240: “IDEA Part B Child Count and Educational Environments Collection,” 2008 and 2014. U.S. Department of Commerce, U.S. Census Bureau. “Intercensal Estimates of the Resident Population by Single Year of Age and Sex for States and the United States: April 1, 2000 to July 1, 2014,” 2008 and 2014. Children served through BIE schools are included in the population estimates of the individual states in which they reside. Data for 2008 were accessed spring 2012. Data for 2014 were accessed fall 2015. For actual data used, go to http://www2.ed.gov/about/reports/annual/osep/index.html.
• In 2014, 6.2 percent of children ages 3 through 5 in the resident population in the 52 states (“All states”) for which data were available were served under IDEA, Part B. The percentages served in the individual states ranged from 3.6 percent to 14.3 percent. Values of 10 percent or more were observed in the following four states: Puerto Rico (14.3 percent), Wyoming (13.2 percent), Arkansas (11.2 percent), and Kentucky (10.3 percent). In contrast, the percentage was no more than 4 percent in Alabama (4.0 percent) and Texas (3.6 percent).

106
• In 2008, 5.8 percent of children ages 3 through 5 in the resident population in the 51 states (“All states”) for which data were available were served under IDEA, Part B.
• In 33 of the 51 states for which data were available for both 2008 and 2014, the percentage of the resident population served under IDEA, Part B, increased between the two years. However, the increase represented a percent change of 20 percent or more in only the following five states: Puerto Rico (152.0 percent), the District of Columbia (96.7 percent), Nevada (41.2 percent), New Hampshire (28.8 percent), and New Jersey (24.6 percent).
• In 17 of the 51 states for which data were available for both 2008 and 2014, the percentage of the population served decreased between the two years. However, the decrease represented a percent change of 10 percent or more in only the following eight states: New Mexico (-33.0 percent), Montana (-20.0 percent), South Carolina (-18.8 percent), West Virginia (-16.8 percent), Idaho (-16.7 percent), Kentucky (-13.2 percent), South Dakota (-12.8 percent), and Hawaii (-11.0 percent).

107
How did the states compare with regard to the percentage of the resident population ages 3 through 5 within each racial/ethnic group who were served under IDEA, Part B, in 2014?
Exhibit 54. Percentage of the population ages 3 through 5 served under IDEA, Part B, for each racial/ethnic group, by state: Fall 2014
State American Indian or
Alaska Native Asian
Black or African
American Hispanic/
Latino
Native Hawaiian or Other
Pacific Islander White
Two or more races
All states 8.6 4.5 6.2 5.6 9.4 6.6 5.0 Alabama 2.3 4.0 3.9 2.4 5.8 4.3 2.8 Alaska 9.0 3.8 5.6 4.6 8.3 5.9 6.2 Arizona 6.0 4.3 4.6 5.8 7.8 6.0 4.4 Arkansas 5.6 5.0 17.1 8.5 5.5 10.7 3.8 California 5.6 4.2 5.6 5.2 4.5 5.1 5.2 Colorado 8.0 5.4 5.8 6.7 7.8 5.9 5.2 Connecticut 4.6 5.3 7.4 8.4 11.0 6.9 5.6 Delaware 6.5 4.3 6.5 6.6 11.1 6.2 3.1 District of Columbia 0.0 3.7 7.8 7.7 12.5 2.2 2.3 Florida 5.2 4.1 6.7 5.9 9.7 5.5 4.9 Georgia 4.6 3.2 4.7 3.6 7.0 4.5 3.9 Hawaii 3.5 4.5 3.7 4.0 9.3 4.8 2.6 Idaho 7.4 3.7 2.7 1.4 2.7 4.9 18.0 Illinois 33.4 5.4 6.5 6.7 42.9 8.9 7.6 Indiana 5.2 4.6 5.5 6.6 7.9 7.4 8.0 Iowa 6.1 3.8 6.7 4.9 9.0 5.4 5.1 Kansas 12.8 6.7 8.6 8.1 17.9 10.3 8.0 Kentucky 8.6 6.2 9.1 7.7 8.3 10.9 8.4 Louisiana 5.1 3.3 6.0 3.0 15.5 5.2 3.5 Maine 11.0 4.6 6.3 4.7 0.0 9.1 5.5 Maryland 10.1 4.8 6.3 5.9 14.7 5.9 4.4 Massachusetts 9.3 5.8 8.1 8.7 8.4 7.5 6.4 Michigan 8.2 4.2 5.4 5.0 16.7 6.3 4.1 Minnesota 11.5 5.2 7.3 8.2 12.3 7.2 7.2 Mississippi 1.9 6.7 8.1 3.5 17.5 8.2 4.6 Missouri 6.4 5.6 7.3 5.4 5.7 7.7 5.4 Montana 6.3 3.7 3.2 2.6 0.0 4.3 3.0 Nebraska 13.8 5.5 6.3 5.8 16.9 7.3 6.1 Nevada 8.8 4.2 10.8 7.4 12.6 7.9 7.6 New Hampshire 8.2 5.6 11.3 7.3 56.3 8.7 1.9 New Jersey 7.1 4.5 5.2 6.2 31.1 5.8 3.7 New Mexico 5.3 3.6 6.1 5.0 8.3 5.8 2.5 New York 16.3 6.2 9.4 10.4 21.3 10.7 5.3 North Carolina 10.4 3.6 6.0 4.5 7.6 5.0 3.2 See notes at end of exhibit.

108
Exhibit 54. Percentage of the population ages 3 through 5 served under IDEA, Part B, for each racial/ethnic group, by state: Fall 2014—Continued
State American Indian or
Alaska Native Asian
Black or African
American Hispanic/
Latino
Native Hawaiian or Other
Pacific Islander White
Two or more races
North Dakota 7.5 5.9 7.7 4.5 36.4 6.1 4.6 Ohio 2.7 4.3 4.0 4.1 10.2 5.8 4.8 Oklahoma 10.0 3.4 4.3 3.5 11.7 6.1 3.3 Oregon 7.2 5.2 8.7 7.7 6.8 7.2 4.7 Pennsylvania 6.7 5.2 8.3 7.4 7.4 7.6 7.8 Rhode Island 25.1 6.1 8.5 7.7 16.7 9.8 6.4 South Carolina 4.9 3.2 5.8 4.1 4.1 4.8 4.9 South Dakota 10.0 5.0 3.7 4.9 22.2 7.2 5.5 Tennessee 6.8 5.0 4.9 3.6 5.7 5.7 2.7 Texas 9.1 3.1 3.4 3.6 4.3 3.7 3.0 Utah 11.9 4.7 5.5 5.5 6.8 6.6 2.8 Vermont 7.3 6.7 13.5 6.0 12.5 10.4 1.6 Virginia 7.8 4.2 5.9 5.3 142.4 5.2 4.5 Washington 5.9 4.0 5.4 6.2 4.2 5.5 5.6 West Virginia 2.9 4.9 6.4 6.2 5.9 8.2 4.6 Wisconsin 10.5 4.5 8.7 9.0 21.5 7.4 5.6 Wyoming 15.0 10.4 10.9 11.4 15.4 13.6 10.3 NOTE: Percentage for each state was calculated by dividing the number of children ages 3 through 5 served under IDEA, Part B, by the state who were reported in the racial/ethnic group by the estimated U.S. resident population ages 3 through 5 of the racial/ethnic group in the state, then multiplying the result by 100. Percentage for “All states” was calculated for all states with available data by dividing the number of children ages 3 through 5 served under IDEA, Part B, by all states who were reported in the racial/ethnic group by the estimated U.S. resident population ages 3 through 5 in the racial/ethnic group in all states, then multiplying the result by 100. SOURCE: U.S. Department of Education, EDFacts Data Warehouse (EDW), OMB #1875-0240: “IDEA Part B Child Count and Educational Environments Collection,” 2014. Data for Puerto Rico were excluded. U.S. Department of Commerce, U.S. Census Bureau. “Intercensal Estimates of the Resident Population by Single Year of Age and Sex for States and the United States: April 1, 2000 to July 1, 2014,” 2014. Children served through BIE schools are included in the population estimates of the individual states in which they reside. Data for Puerto Rico were not available. Data were accessed fall 2015. For actual data used, go to http://www2.ed.gov/about/reports/annual/osep/index.html.
• In 2014, a larger percentage of the resident population ages 3 through 5 who were Native Hawaiian or Other Pacific Islander than of the resident populations of the other racial/ethnic groups was served under IDEA, Part B, in the 51 states (“All states”) for which data were available. Specifically, 9.4 percent of the resident population who were Native Hawaiian or Other Pacific Islander were served under Part B. In contrast, only 4.5 percent of the resident population who were Asian in “All states” were served under IDEA, Part B.
• In 2014, 8.6 percent of the resident population who were American Indian or Alaska Native were served under Part B in “All states.” The percentages ranged from zero to 33.4 percent in the 51 individual states for which non-suppressed data were available. The percentage was more than 20 percent in the following two states: Illinois (33.4 percent) and Rhode Island (25.1 percent). In contrast, the percentage was less than 4 percent in the following six states: Hawaii (3.5 percent),

109
West Virginia (2.9 percent), Ohio (2.7 percent), Alabama (2.3 percent), Mississippi (1.9 percent), and the District of Columbia (0.0 percent).
• In 2014, 4.5 percent of the resident population ages 3 through 5 who were Asian were served under Part B in “All states.” The percentages ranged from 3.1 to 10.4 percent in the 51 individual states for which non-suppressed data were available. The percentage was 6 percent or more in the following seven states: Wyoming (10.4 percent), Kansas (6.7 percent), Mississippi (6.7 percent), Vermont (6.7 percent), Kentucky (6.2 percent), New York (6.2 percent), and Rhode Island (6.1 percent). In contrast, the percentage was less than 4 percent in 12 states.
• In 2014, 6.2 percent of the resident population ages 3 through 5 who were Black or African American were served under Part B in “All states.” The percentages ranged from 2.7 to 17.1 percent in the 51 individual states. In the following five states, the percentage was more than 10 percent: Arkansas (17.1 percent), Vermont (13.5 percent), New Hampshire (11.3 percent), Wyoming (10.9 percent), and Nevada (10.8 percent). In contrast, the percentage was less than 4 percent in the following six states: Alabama (3.9 percent), Hawaii (3.7 percent), South Dakota (3.7 percent), Texas (3.4 percent), Montana (3.2 percent), and Idaho (2.7 percent).
• In 2014, 5.6 percent of the resident population ages 3 through 5 who were Hispanic/Latino were served under Part B in “All states.” The percentages ranged from 1.4 to 11.4 percent in the 51 individual states. In the following three states, the percentage was 9 percent or more: Wyoming (11.4 percent), New York (10.4 percent), and Wisconsin (9.0 percent). In contrast, the percentage was less than 3 percent in the following three states: Montana (2.6 percent), Alabama (2.4 percent), and Idaho (1.4 percent).
• In 2014, 9.4 percent of the resident population ages 3 through 5 who were Native Hawaiian or Other Pacific Islander were served under Part B in “All states.” The percentages ranged from zero to 56.3 percent12 in the 51 states for which non-suppressed data were available. The percentage was 30 percent or more in the following four states: New Hampshire (56.3 percent), Illinois (42.9 percent), North Dakota (36.4 percent), and New Jersey (31.1 percent). In contrast, the percentage was less than 3 percent in the following three states: Idaho (2.7 percent), Maine (0.0 percent), and Montana (0.0 percent).
• In 2014, 6.6 percent of the resident population ages 3 through 5 who were White were served under Part B in “All states.” The percentages ranged from 2.2 percent to 13.6 percent in the 51 individual states. The percentage was 10 percent or more in the following six states: Wyoming (13.6 percent), Kentucky (10.9 percent), Arkansas (10.7 percent), New York (10.7 percent), Vermont (10.4 percent), and Kansas (10.3 percent). In contrast, the percentage was less than 4 percent in the following two states: Texas (3.7 percent) and the District of Columbia (2.2 percent).
• In 2014, 5 percent of the resident population ages 3 through 5 who were associated with two or more racial/ethnic groups were served under Part B in “All states.” The percentages ranged from 1.6 percent to 18 percent in the 51 individual states for which non-suppressed data were available. In the following two states, the percentage was 10 percent or more: Idaho (18.0 percent) and Wyoming (10.3 percent). In contrast, the percentage was less than 2 percent in the following two states: New Hampshire (1.9 percent) and Vermont (1.6 percent).
12 The percentage calculated for Virginia is anomalous and, therefore, not identified as the upper bound of the range. The
estimated resident population of Native Hawaiian or Other Pacific Islander children ages 3 through 5 in Virginia was only 257 children and was less than the number of children ages 3 through 5 who were served under Part B and were identified as Native Hawaiian or Other Pacific Islander in Virginia (366 children).

110
Part B Educational Environments
How did the states compare with regard to the distribution of children ages 3 through 5 served under IDEA, Part B, by educational environment in 2014?
Exhibit 55. Percentage of children ages 3 through 5 served under IDEA, Part B, by educational environment and state: Fall 2014
State
Regular early childhood programa
Separate classb
Separate schoolb
Residential facilityb Home
Service provider locationc
At least 10 hours per week and majority
At least 10 hours per
week, majority
elsewhere
Less than 10 hours per week and majority
Less than 10 hours per
week, majority
elsewhere All states 38.1 17.2 5.5 4.9 23.0 2.6 # 2.1 6.4
Alabama 43.4 31.0 6.0 2.8 4.0 0.9 0.2 2.0 9.7 Alaska 27.6 19.5 2.2 1.9 41.0 1.0 0.0 1.8 5.1 Arizona 43.3 2.4 8.5 1.0 41.5 0.4 0.0 0.2 2.7 Arkansas 26.0 40.9 # 0.2 1.6 28.1 0.1 0.3 2.7 BIE schools 97.1 0.0 1.7 0.0 1.0 0.0 0.2 0.0 0.0 California 35.6 7.4 7.7 4.3 29.6 3.1 0.1 3.7 8.5 Colorado 83.4 7.5 3.0 0.5 4.2 1.1 0.0 0.1 0.1 Connecticut 70.4 6.2 3.8 0.5 13.1 1.3 # 0.2 4.5 Delaware 48.9 10.8 1.3 3.3 24.4 8.0 0.1 0.3 2.8 District of Columbia 48.8 44.4 0.2 1.3 2.2 2.2 0.0 0.0 1.0 Florida 20.8 13.1 6.2 5.2 47.4 3.8 # 0.5 3.1 Georgia 42.0 20.3 2.2 4.9 23.7 0.4 # 1.8 4.7 Hawaii 20.9 6.8 7.8 34.1 28.2 0.2 0.0 0.4 1.6 Idaho 20.7 8.9 8.9 4.1 44.3 7.4 # 0.2 5.5 Illinois 33.1 22.5 2.3 4.0 26.2 2.9 # 0.2 8.8 Indiana 35.2 8.2 4.9 3.6 31.6 2.2 # 0.4 13.9 Iowa 31.4 41.4 3.0 8.5 6.9 0.2 0.0 0.8 7.8 Kansas 28.2 20.3 9.6 6.3 33.9 0.1 0.0 1.3 0.3 Kentucky 63.2 23.7 2.9 3.4 3.6 0.5 # 0.4 2.2 Louisiana 23.5 48.1 0.7 15.9 3.4 0.1 0.0 4.9 3.4 See notes at end of exhibit.
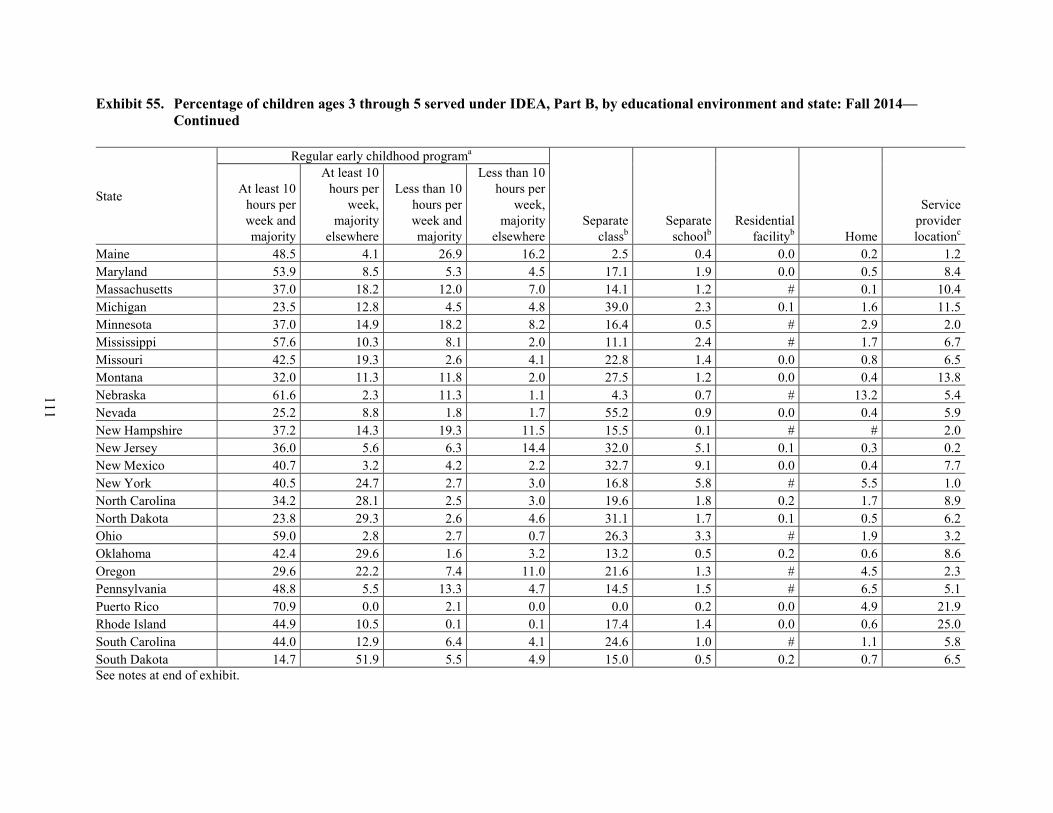
111
Exhibit 55. Percentage of children ages 3 through 5 served under IDEA, Part B, by educational environment and state: Fall 2014—Continued
State
Regular early childhood programa
Separate classb
Separate schoolb
Residential facilityb Home
Service provider locationc
At least 10 hours per week and majority
At least 10 hours per
week, majority
elsewhere
Less than 10 hours per week and majority
Less than 10 hours per
week, majority
elsewhere Maine 48.5 4.1 26.9 16.2 2.5 0.4 0.0 0.2 1.2 Maryland 53.9 8.5 5.3 4.5 17.1 1.9 0.0 0.5 8.4 Massachusetts 37.0 18.2 12.0 7.0 14.1 1.2 # 0.1 10.4 Michigan 23.5 12.8 4.5 4.8 39.0 2.3 0.1 1.6 11.5 Minnesota 37.0 14.9 18.2 8.2 16.4 0.5 # 2.9 2.0 Mississippi 57.6 10.3 8.1 2.0 11.1 2.4 # 1.7 6.7 Missouri 42.5 19.3 2.6 4.1 22.8 1.4 0.0 0.8 6.5 Montana 32.0 11.3 11.8 2.0 27.5 1.2 0.0 0.4 13.8 Nebraska 61.6 2.3 11.3 1.1 4.3 0.7 # 13.2 5.4 Nevada 25.2 8.8 1.8 1.7 55.2 0.9 0.0 0.4 5.9 New Hampshire 37.2 14.3 19.3 11.5 15.5 0.1 # # 2.0 New Jersey 36.0 5.6 6.3 14.4 32.0 5.1 0.1 0.3 0.2 New Mexico 40.7 3.2 4.2 2.2 32.7 9.1 0.0 0.4 7.7 New York 40.5 24.7 2.7 3.0 16.8 5.8 # 5.5 1.0 North Carolina 34.2 28.1 2.5 3.0 19.6 1.8 0.2 1.7 8.9 North Dakota 23.8 29.3 2.6 4.6 31.1 1.7 0.1 0.5 6.2 Ohio 59.0 2.8 2.7 0.7 26.3 3.3 # 1.9 3.2 Oklahoma 42.4 29.6 1.6 3.2 13.2 0.5 0.2 0.6 8.6 Oregon 29.6 22.2 7.4 11.0 21.6 1.3 # 4.5 2.3 Pennsylvania 48.8 5.5 13.3 4.7 14.5 1.5 # 6.5 5.1 Puerto Rico 70.9 0.0 2.1 0.0 0.0 0.2 0.0 4.9 21.9 Rhode Island 44.9 10.5 0.1 0.1 17.4 1.4 0.0 0.6 25.0 South Carolina 44.0 12.9 6.4 4.1 24.6 1.0 # 1.1 5.8 South Dakota 14.7 51.9 5.5 4.9 15.0 0.5 0.2 0.7 6.5 See notes at end of exhibit.

112
Exhibit 55. Percentage of children ages 3 through 5 served under IDEA, Part B, by educational environment and state: Fall 2014—Continued
State
Regular early childhood programa
Separate classb
Separate schoolb
Residential facilityb Home
Service provider locationc
At least 10 hours per week and majority
At least 10 hours per
week, majority
elsewhere
Less than 10 hours per week and majority
Less than 10 hours per
week, majority
elsewhere Tennessee 23.7 25.1 2.8 4.2 34.9 0.7 # 0.4 8.2 Texas 28.5 32.7 2.1 8.1 15.8 0.1 # 0.7 11.9 Utah 18.1 9.8 14.3 3.1 42.5 2.2 0.0 0.2 9.8 Vermont 67.3 7.4 9.3 1.4 2.3 0.1 0.1 5.7 6.4 Virginia 23.0 13.8 5.3 18.7 28.3 0.3 0.1 2.7 7.9 Washington 21.6 20.5 4.8 3.4 38.5 1.5 # 0.4 9.2 West Virginia 29.6 51.6 0.9 2.1 7.0 0.1 0.1 1.1 7.5 Wisconsin 32.0 33.8 3.2 5.8 18.1 0.4 # 1.8 5.0 Wyoming 40.7 4.5 15.5 1.4 25.7 8.2 0.0 1.2 2.8 # Percentage was non-zero, but less than 0.05 or 5/100 of 1 percent. aRegular early childhood program includes a majority (i.e., at least 50 percent) of children without disabilities (i.e., children without individualized education programs). Regular early childhood programs include, but are not limited to, Head Start, kindergarten, preschool classes offered to an eligible pre-kindergarten population by the public school system, private kindergartens or preschools, and group child development center or child care. bSeparate class, separate school, and residential facility are categories of special education programs that include less than 50 percent children without disabilities. cService provider location refers to a situation in which a child receives all special education and related services from a service provider or in some location not in any of the other categories, including a regular early childhood program or special education program in a separate class, separate school, or residential facility. This does not include children who receive special education and related services in the home. An example is a situation in which a child receives only speech instruction, and it is provided in a clinician’s office. NOTE: Percentage for each state was calculated by dividing the number of children ages 3 through 5 served under IDEA, Part B, by the state who were reported in the educational environment by the total number of children ages 3 through 5 served under IDEA, Part B, by the state, then multiplying the result by 100. Percentage for “All states” was calculated for all states with available data by dividing the number of children ages 3 through 5 served under IDEA, Part B, by all states who were reported in the educational environment by the total number of children ages 3 through 5 served under IDEA, Part B, by all states, then multiplying the result by 100. SOURCE: U.S. Department of Education, EDFacts Data Warehouse (EDW), OMB #1875-0240: “IDEA Part B Child Count and Educational Environments Collection,” 2014. Data were accessed fall 2015. For actual data used, go to http://www2.ed.gov/about/reports/annual/osep/index.html.

113
• In 2014, the educational environment category of attending a regular early childhood program at least 10 hours per week and receiving the majority of hours of special education and related services in the regular early childhood program accounted for the largest percentage of children ages 3 to 5 served under IDEA, Part B, in the 53 states (“All states”) for which data were available. Specifically, the percentage associated with this category for “All states” was 38.1 percent. The category that accounted for the second largest percentage of students in “All states” was separate class, which accounted for 23 percent of the children.
• In 34 individual states, the educational environment category of attending a regular early childhood program at least 10 hours per week and receiving the majority of hours of special education and related services in the regular early childhood program accounted for a larger percentage of children than any other category. In 10 of those states, this category accounted for a majority of the children. In the following four states, this category accounted for more than 70 percent of the children: BIE schools (97.1 percent), Colorado (83.4 percent), Puerto Rico (70.9 percent), and Connecticut (70.4 percent).
• In 11 states, the educational environment category representing children who attended a separate class accounted for a larger percentage of children than any other category. The percentage of children accounted for by a separate class was less than a majority in all of these states except Nevada, in which 55.2 percent were accounted for by this category.
• In seven states, the educational environment category of attending a regular early childhood program at least 10 hours per week and receiving the majority of hours of special education and related services in some other location accounted for a larger percentage of children than any other category. The percentage represented a majority of the children in only two states: South Dakota (51.9 percent) and West Virginia (51.6 percent).
• The category of attending a regular early childhood program less than 10 hours per week and receiving the majority of hours of special education and related services in some other location accounted for more children than any other category in Hawaii (34.1 percent).

114
How did the states compare with regard to the distribution of children ages 3 through 5 served under IDEA, Part B, who were limited English proficient, by educational environment in 2014?
Exhibit 56. Percentage of children ages 3 through 5 served under IDEA, Part B, who were limited English proficient, by educational environment and state: Fall 2014
State
Regular early childhood programa
Separate classb
Separate schoolb
Residential facilityb Home
Service provider locationc
At least 10 hours per week and majority
At least 10 hours per
week, majority
elsewhere
Less than 10 hours per week and majority
Less than 10 hours per
week, majority
elsewhere All states 43.3 17.1 5.2 3.4 21.6 2.2 # 2.1 5.1
Alabama 42.5 34.2 8.2 2.7 5.5 0.0 0.0 0.0 6.8 Alaska 37.8 12.2 2.7 0.0 44.6 0.0 0.0 1.4 1.4 Arizona 79.6 0.0 20.4 0.0 0.0 0.0 0.0 0.0 0.0 Arkansas 35.1 13.5 0.0 0.0 0.6 49.4 0.0 0.0 1.3 BIE schools 0.0 0.0 0.0 0.0 0.0 0.0 0.0 0.0 0.0 California 37.5 6.3 8.2 3.5 28.6 2.8 0.1 4.2 8.8 Colorado 79.4 9.5 1.6 0.4 7.7 1.1 0.0 0.1 0.2 Connecticut 90.6 2.9 0.0 0.0 5.1 1.4 0.0 0.0 0.0 Delaware 61.2 16.5 1.0 1.0 20.4 0.0 0.0 0.0 0.0 District of Columbia 49.6 43.8 0.4 1.5 3.5 0.0 0.0 0.0 1.2 Florida 23.2 14.2 4.3 4.6 49.6 1.9 0.0 0.4 1.8 Georgia 46.9 28.3 3.0 8.0 11.8 0.0 0.0 0.0 1.9 Hawaii 44.7 7.1 5.9 10.6 31.8 0.0 0.0 0.0 0.0 Idaho 31.9 12.5 4.2 2.8 43.1 0.0 0.0 0.0 5.6 Illinois 59.1 8.4 0.6 0.5 22.5 6.3 # 0.1 2.4 Indiana 70.4 3.5 1.4 0.3 18.6 0.0 0.0 0.0 5.8 Iowa 24.5 62.7 0.0 3.6 7.3 0.0 0.0 0.0 1.8 Kansas 0.0 0.0 0.0 0.0 0.0 0.0 0.0 0.0 0.0 Kentucky 62.9 30.2 1.5 3.0 1.5 1.0 0.0 0.0 0.0 Louisiana 16.1 69.9 — 8.6 3.2 — — — 2.2 Maine 97.8 0.3 0.4 0.7 0.1 0.5 0.0 0.1 0.1 See notes at end of exhibit.

115
Exhibit 56. Percentage of children ages 3 through 5 served under IDEA, Part B, who were limited English proficient, by educational environment and state: Fall 2014—Continued
State
Regular early childhood programa
Separate classb
Separate schoolb
Residential facilityb Home
Service provider locationc
At least 10 hours per week and majority
At least 10 hours per
week, majority
elsewhere
Less than 10 hours per week and majority
Less than 10 hours per
week, majority
elsewhere Maryland 63.0 7.1 1.4 0.8 19.2 0.6 0.0 2.0 5.9 Massachusetts 27.2 26.6 17.2 4.1 20.3 0.6 0.0 0.0 4.1 Michigan 24.3 20.1 4.1 3.9 31.2 1.1 0.2 0.4 14.7 Minnesota 46.9 15.7 7.5 4.3 20.6 0.0 0.0 4.3 0.5 Mississippi 61.9 4.8 16.7 0.0 9.5 7.1 0.0 0.0 0.0 Missouri 87.9 10.0 0.5 0.0 1.6 0.0 0.0 0.0 0.0 Montana 28.6 0.0 28.6 0.0 42.9 0.0 0.0 0.0 0.0 Nebraska 77.9 6.6 10.5 1.7 1.7 0.6 0.0 1.1 0.0 Nevada 46.4 11.6 1.2 1.4 37.4 0.0 0.0 0.3 1.7 New Hampshire 8.8 14.7 2.9 8.8 61.8 0.0 0.0 0.0 2.9 New Jersey 57.9 8.1 8.8 13.3 10.7 0.8 0.2 0.2 0.2 New Mexico 64.2 1.9 11.3 1.9 17.0 0.0 0.0 0.0 3.8 New York 58.7 32.3 0.0 0.5 6.8 1.7 0.0 0.0 0.0 North Carolina 39.4 27.8 2.4 2.5 24.3 0.5 0.3 0.5 2.4 North Dakota 44.4 33.3 0.0 0.0 11.1 0.0 0.0 0.0 11.1 Ohio 59.8 6.4 4.5 0.4 23.9 3.8 0.0 0.0 1.1 Oklahoma 25.3 46.2 0.5 3.2 23.1 0.5 0.0 0.0 1.1 Oregon 35.6 18.0 7.0 6.4 21.4 2.3 # 6.3 2.9 Pennsylvania 46.6 4.1 8.3 2.2 21.8 1.2 # 10.2 5.5 Puerto Ricod 100.0 0.0 0.0 0.0 0.0 0.0 — 0.0 0.0 Rhode Island 48.9 6.4 0.0 0.0 8.5 2.1 0.0 0.0 34.0 South Carolina 37.0 15.4 5.0 4.9 20.4 0.4 0.0 0.8 16.1 South Dakota 22.2 72.2 0.0 0.0 5.6 0.0 0.0 0.0 0.0 Tennessee 44.4 11.1 0.0 0.0 33.3 0.0 0.0 0.0 11.1 See notes at end of exhibit.

116
Exhibit 56. Percentage of children ages 3 through 5 served under IDEA, Part B, who were limited English proficient, by educational environment and state: Fall 2014—Continued
State
Regular early childhood programa
Separate classb
Separate schoolb
Residential facilityb Home
Service provider locationc
At least 10 hours per week and majority
At least 10 hours per
week, majority
elsewhere
Less than 10 hours per week and majority
Less than 10 hours per
week, majority
elsewhere Texas 36.4 46.2 1.7 3.8 3.0 0.0 0.0 0.3 8.6 Utah 45.5 31.3 4.0 1.5 17.8 0.0 0.0 0.0 0.0 Vermont 100.0 0.0 0.0 0.0 0.0 0.0 0.0 0.0 0.0 Virginia 40.0 27.1 0.6 23.6 6.4 0.0 0.0 0.1 2.2 Washington 28.1 39.8 5.9 1.3 22.9 0.3 0.0 0.0 1.7 West Virginia 33.3 66.7 0.0 0.0 0.0 0.0 0.0 0.0 0.0 Wisconsin 39.9 38.1 1.8 1.4 14.0 0.0 0.2 0.2 4.5 Wyoming 53.9 3.9 9.8 1.0 17.6 12.7 — 1.0 — — Percentage cannot be calculated because data were not available. # Percentage was non-zero, but less than 0.05 or 5/100 of 1 percent. aRegular early childhood program includes a majority (i.e., at least 50 percent) of children without disabilities (i.e., children without individualized education programs). Regular early childhood programs include, but are not limited to, Head Start, kindergarten, preschool classes offered to an eligible pre-kindergarten population by the public school system, private kindergartens or preschools, and group child development center or child care. bSeparate class, separate school, and residential facility are categories of special education programs that include less than 50 percent children without disabilities. cService provider location refers to a situation in which a child receives all special education and related services from a service provider or in some location not in any of the other categories, including a regular early childhood program or special education program in a separate class, separate school, or residential facility. This does not include children who receive special education and related services in the home. An example is a situation in which a child receives only speech instruction, and it is provided in a clinician’s office. dLimited Spanish proficiency is the analogous measure for Puerto Rico. NOTE: Percentage for each state was calculated by dividing the number of children ages 3 through 5 served under IDEA, Part B, who were limited English proficient (LEP) and reported in the educational environment by the state by the total number of children ages 3 through 5 served under IDEA, Part B, who were LEP by the state, then multiplying the result by 100. Percentage for “All states” was calculated for all states with available data by dividing the number of children ages 3 through 5 served under IDEA, Part B, who were LEP and reported in the educational environment by all states by the total number of children ages 3 through 5 served under IDEA, Part B, who were LEP by all states, then multiplying the result by 100. SOURCE: U.S. Department of Education, EDFacts Data Warehouse (EDW), OMB #1875-0240: “IDEA Part B Child Count and Educational Environments Collection,” 2014. Data were accessed fall 2015. For actual data used, go to http://www2.ed.gov/about/reports/annual/osep/index.html.

117
• In 2014, the educational environment category of attending a regular early childhood program at least 10 hours per week and receiving the majority of hours of special education and related services in the regular early childhood program accounted for the largest percentage of children ages 3 to 5 who were limited English proficient (LEP) served under IDEA, Part B, in the 51 states (“All states”) that reported some children who were LEP and for which data were available. Specifically, the percentage associated with this category for “All states” was 43.3 percent. The category that accounted for the second largest percentage of students in “All states” was separate class, which accounted for 21.6 percent of the children.
• In 37 individual states, the educational environment category attending a regular early childhood program at least 10 hours per week and receiving the majority of hours of special education and related services in the regular early childhood program accounted for a larger percentage of children who were LEP than any other category. In 19 of those states, the category accounted for a majority of the children who were LEP. In the following four of those states, the percentage was larger than 90 percent: Puerto Rico (100 percent), Vermont (100 percent), Maine (97.8 percent), and Connecticut (90.6 percent).
• In seven states, the educational environment category of attending a regular early childhood program at least 10 hours per week and receiving the majority of hours of special education and related services in some other location accounted for a larger percentage of children who were LEP than any other category. The category accounted for a majority of the children in the following four states: South Dakota (72.2 percent), Louisiana (69.9 percent), West Virginia (66.7 percent), and Iowa (62.7 percent).
• In six states, the educational environment category representing children who attended a separate class accounted for a larger percentage of children who were LEP than any other category. However, a separate class accounted for less than 50 percent of the children who were LEP in all but one of these states: New Hampshire (61.8 percent).
• The educational environment category representing children who attended a separate school accounted for a larger percentage of children who were LEP than any other category in Arkansas (49.4 percent).

118
Part B Personnel
How did the states compare with regard to the following ratios in 2013:
1. the number of all full-time equivalent (FTE) special education teachers employed to provide special education and related services for children ages 3 through 5 per 100 children ages 3 through 5 served under IDEA, Part B;
2. the number of FTE highly qualified special education teachers employed to provide special education and related services for children ages 3 through 5 per 100 children ages 3 through 5 served under IDEA, Part B; and
3. the number of FTE not highly qualified special education teachers employed to provide special education and related services for children ages 3 through 5 per 100 children ages 3 through 5 served under IDEA, Part B?
Exhibit 57. Number of full-time equivalent (FTE) special education teachers employed to provide special education and related services for children ages 3 through 5 per 100 children ages 3 through 5 served under IDEA, Part B, by qualification status and state: Fall 2013
State All FTE special
education teachers
FTE highly qualifieda special
education teachers
FTE not highly qualified special
education teachers Per 100 children served
All states 5.5 5.2 0.3 Alabama 4.4 4.3 0.2 Alaska 4.2 3.7 0.5 Arizona 4.6 4.4 0.2 Arkansas 4.2 3.8 0.4 BIE schools — — — California 3.1 3.0 0.1 Colorado 3.2 2.9 0.3 Connecticut 6.1 6.1 0.0 Delaware 0.0 0.0 0.0 District of Columbia 9.5 9.4 0.1 Florida 19.3 18.2 1.1 Georgia 5.2 4.5 0.7 Hawaii 9.9 9.5 0.4 Idaho 3.3 — 3.3 Illinois 4.1 4.1 0.1 Indiana 0.6 # 0.6 Iowa 8.5 8.5 0.0 Kansas 4.5 4.5 0.0 Kentucky 2.4 2.4 # Louisiana 6.0 5.8 0.2 Maine 1.5 1.5 0.0 Maryland 5.8 5.4 0.4 See notes at end of exhibit.

119
Exhibit 57. Number of full-time equivalent (FTE) special education teachers employed to provide special education and related services for children ages 3 through 5 per 100 children ages 3 through 5 served under IDEA, Part B, by qualification status and state: Fall 2013—Continued
State All FTE special
education teachers
FTE highly qualifieda special
education teachers
FTE not highly qualified special
education teachers Per 100 children served
Massachusetts 6.7 6.5 0.2 Michigan 3.4 3.4 # Minnesota 4.9 4.8 0.2 Mississippi 1.0 1.0 0.0 Missouri 6.8 6.6 0.2 Montana 4.1 3.9 0.2 Nebraska 3.7 3.5 0.2 Nevada 5.8 4.2 1.6 New Hampshire 5.6 5.6 0.0 New Jersey 7.7 5.7 2.0 New Mexico 8.3 8.3 0.0 New York 7.0 6.9 0.1 North Carolina 5.0 4.9 0.1 North Dakota 5.0 5.0 0.0 Ohio 6.3 6.0 0.3 Oklahoma 4.9 4.9 # Oregon 1.3 1.2 0.1 Pennsylvania 3.6 3.6 # Puerto Rico 5.3 4.2 1.1 Rhode Island 3.9 3.8 0.1 South Carolina 7.4 7.2 0.2 South Dakota 4.6 4.4 0.2 Tennessee 4.4 3.9 0.5 Texas 5.9 5.8 # Utah 3.3 3.0 0.3 Vermont 7.1 6.7 0.4 Virginia 3.6 3.5 0.1 Washington 4.0 3.9 # West Virginia 6.3 5.4 0.9 Wisconsin 3.8 3.7 0.1 Wyoming — — — — Ratio cannot be calculated because data were not available. # Ratio was non-zero, but smaller than 5 per 10,000. aSpecial education teachers reported as highly qualified met the state standard for highly qualified based on the criteria identified in 20 U.S.C. section 1401(10). For highly qualified special education teachers, the term “highly qualified” has the same meaning given the term in section 9101 of the Elementary and Secondary Education Act of 1965, as amended (ESEA), except that such term also includes the requirements described in section 602(10)(B) of IDEA, and the option for teachers to meet the requirements of section 9101 of ESEA, by meeting the requirements of section 602(10)(C) or (D) of IDEA [20 U.S.C. section 1401(10)]. In states where teachers who work with children ages 3 through 5 were not included in the state’s definition of highly qualified, teachers were considered highly qualified if they were (1) personnel who held appropriate state certification or licensure for the position held or (2) personnel who held positions for which no state certification or licensure requirements existed.

120
• In 2013, there were 5.5 FTE special education teachers (including those who were highly qualified and not highly qualified) employed to provide special education and related services for children ages 3 through 5 served under IDEA, Part B, per 100 children ages 3 through 5 served under IDEA, Part B, in the 51 states (“All states”) for which data were available. Ratios of 8 or more FTE special education teachers per 100 children were observed in the following five states: Florida (19.3 FTEs per 100 children), Hawaii (9.9 FTEs per 100 children), the District of Columbia (9.5 FTEs per 100 children) Iowa (8.5 FTEs per 100 children), and New Mexico (8.3 FTEs per 100 children). In contrast, the following two states had ratios of less than 1 FTE per 100 children: Indiana (0.6 FTE per 100 children) and Delaware (0.0 FTE per 100 children).
• In 2013, there were 5.2 FTE highly qualified special education teachers employed in the 50 states (“All states”) for which data were available to provide special education and related services for children ages 3 through 5 per 100 children ages 3 through 5 served under IDEA, Part B. A ratio of 8 or more FTE highly qualified special education teachers per 100 children was observed for five states. Those states were Florida (18.2 FTEs per 100 children), Hawaii (9.5 FTEs per 100 children), the District of Columbia (9.4 FTEs per 100 children), Iowa (8.5 FTEs per 100 children), and New Mexico (8.3 FTEs per 100 children). Yet a ratio smaller than 1 FTE highly qualified special education teacher per 100 children was found for the following two states: Indiana (less than .05 FTE per 100 children) and Delaware (0.0 FTE per 100 children).
• In 2013, there was 0.3 FTE not highly qualified special education teachers employed in the 51 states (“All states”) to provide special education and related services for children ages 3 through 5 per 100 children ages 3 through 5 served under IDEA, Part B. The ratio was smaller than 1 FTE per 100 children for all but the following five states: Idaho (3.3 FTEs per 100 children), New Jersey (2.0 FTEs per 100 children), Nevada (1.6 FTEs per 100 children), Florida (1.1 FTEs per 100 children), and Puerto Rico (1.1 FTEs per 100 children).
NOTE: Ratio for each state was calculated by dividing the number of all FTE special education teachers, FTE highly qualified special education teachers, or FTE not highly qualified special education teachers employed to provide special education and related services for children ages 3 through 5 by the state by the total number of children ages 3 through 5 served under IDEA, Part B, by the state, then multiplying the result by 100. Ratio for “All states” was calculated for all states with available data by dividing the number of all FTE special education teachers, FTE highly qualified special education teachers, or FTE not highly qualified special education teachers employed to provide special education and related services for children ages 3 through 5 by all states by the total number of children ages 3 through 5 served under IDEA, Part B, by all states, then multiplying the result by 100. SOURCE: U.S. Department of Education, EDFacts Data Warehouse (EDW), OMB #1875-0240: “IDEA Part B Personnel Collection,” 2013. Data for Wyoming and BIE schools were excluded. Data were accessed fall 2015. U.S. Department of Education, EDFacts Data Warehouse (EDW), OMB #1875-0240: “IDEA Part B Child Count and Educational Environments Collection,” 2013. Data for Wyoming and BIE schools were not available. Data were accessed fall 2014. For actual data used, go to http://www2.ed.gov/about/reports/annual/osep/index.html.

121
Students Ages 6 Through 21 Served Under IDEA, Part B
Part B Child Count
How did the states compare with regard to the percentage of the resident population ages 6 through 21 served under IDEA, Part B, in 2014, and how did the percentages change between 2008 and 2014?
Exhibit 58. Percentage of the population ages 6 through 21 served under IDEA, Part B, by year and state: Fall 2008 and fall 2014
State 2008 2014
Percent change between 2008
and 2014a All states 8.6 8.8 1.6
Alabama 7.2 7.4 2.4 Alaska 9.6 9.8 2.5 Arizona 7.8 7.9 1.9 Arkansas 8.3 8.5 2.5 California 7.1 7.6 7.7 Colorado 6.8 7.1 4.7 Connecticut 7.9 8.5 7.4 Delaware 8.8 9.5 8.3 District of Columbia 9.3 9.8 5.3 Florida 9.5 8.8 -7.5 Georgia 7.5 7.9 5.8 Hawaii 6.6 6.2 -6.2 Idaho 6.6 6.6 1.4 Illinois 9.9 9.4 -4.9 Indiana 10.7 10.5 -2.1 Iowa 9.2 8.5 -7.7 Kansas 8.7 8.9 2.6 Kentucky 9.5 8.8 -7.5 Louisiana 7.5 7.0 -6.8 Maine 11.1 11.5 4.0 Maryland 7.4 7.4 0.7 Massachusetts 11.0 11.1 0.2 Michigan 9.2 8.5 -7.9 Minnesota 9.2 9.6 3.9 Mississippi 8.1 8.5 6.0 Missouri 9.0 8.5 -5.7 Montana 7.6 7.5 -1.9 Nebraska 9.8 9.9 1.5 Nevada 7.4 7.8 4.7 New Hampshire 9.6 9.6 -0.2 New Jersey 11.3 11.7 4.1 New Mexico 8.6 9.6 11.3 See notes at end of exhibit.

122
Exhibit 58. Percentage of the population ages 6 through 21 served under IDEA, Part B, by year and state: Fall 2008 and fall 2014—Continued
State 2008 2014
Percent change between 2008
and 2014a New York 9.3 10.8 15.3 North Carolina 8.3 8.4 1.2 North Dakota 8.1 7.5 -8.0 Ohio 9.5 9.6 0.4 Oklahoma 10.5 11.4 8.4 Oregon 8.9 9.4 5.1 Pennsylvania 9.9 10.4 5.4 Puerto Rico 10.7 14.9 40.3 Rhode Island 10.6 9.3 -11.5 South Carolina 9.2 9.0 -1.7 South Dakota 8.5 8.8 3.3 Tennessee 7.9 8.7 10.9 Texas 7.1 6.5 -8.4 Utah 8.0 8.8 8.9 Vermont — 9.5 — Virginia 8.9 8.5 -4.3 Washington 7.9 8.3 5.9 West Virginia 11.3 11.2 -0.6 Wisconsin 8.9 8.6 -3.0 Wyoming 9.9 — — — Percentage cannot be calculated because data were not available. aPercent change was calculated for each state and “All states” by subtracting the percentage for 2008 from the percentage for 2014, dividing the difference by the percentage for 2008, and then multiplying the result by 100. Due to rounding, it may not be possible to reproduce the percent change from the values presented in the exhibit. NOTE: Percentage for each state was calculated by dividing the number of children ages 6 through 21 served under IDEA, Part B, by the state in the year by the estimated U.S. resident population ages 6 through 21 in the state for that year, then multiplying the result by 100. Percentage for “All states” was calculated for all states with available data by dividing the number of children ages 6 through 21 served under IDEA, Part B, by all states in the year by the estimated U.S. resident population ages 6 through 21 in all states for that year, then multiplying the result by 100. Percentage for “All states” includes data for children served by BIE schools. SOURCE: U.S. Department of Education, EDFacts Data Warehouse (EDW), OMB #1875-0240: “IDEA Part B Child Count and Educational Environments Collection,” 2008 and 2014. U.S. Department of Commerce, U.S. Census Bureau. “Intercensal Estimates of the Resident Population by Single Year of Age and Sex for States and the United States: April 1, 2000 to July 1, 2014,” 2008 and 2014. Children served through BIE schools are included in the population estimates of the individual states in which they reside. Data for 2008 were accessed spring 2012. Data for 2014 were accessed fall 2015. For actual data used, go to http://www2.ed.gov/about/reports/annual/osep/index.html.
• In 2014, 8.8 percent of the resident population ages 6 through 21 in the 51 states (“All states”) for which data were available were served under IDEA, Part B. The percentages observed for the individual states, ranged from 6.2 percent to 14.9 percent. In the following six states, the percentage was larger than 11 percent: Puerto Rico (14.9 percent), New Jersey (11.7 percent), Maine (11.5 percent), Oklahoma (11.4 percent), West Virginia (11.2 percent), and Massachusetts (11.1 percent). In the following three states, less than 7 percent of the resident population was served: Idaho (6.6 percent), Texas (6.5 percent), and Hawaii (6.2 percent).

123
• In 2008, 8.6 percent of the resident population ages 6 through 21 in the 51 states (“All states”) for which data were available were served under IDEA, Part B.
• In 30 of the 50 individual states for which data were available for both 2008 and 2014, the percentage of the resident population ages 6 through 21 served under IDEA, Part B, increased between the two years. The increase represented a percent change of more than 10 percent in the following four states: Puerto Rico (40.3 percent), New York (15.3 percent), New Mexico (11.3 percent), and Tennessee (10.9 percent).
• In 17 of the 50 individual states for which data were available for both 2008 and 2014, the percentage of the population ages 6 through 21 served decreased between the two years. However, the decrease represented a percent change of more than 8 percent in only Rhode Island (-11.5 percent) and Texas (-8.4 percent).

124
How did the states compare with regard to the percentage of the resident population ages 6 through 21 within each racial/ethnic group who were served under IDEA, Part B, in 2014?
Exhibit 59. Percentage of the population ages 6 through age 21 served under IDEA, Part B, for each racial/ethnic group, by state: Fall 2014
State American Indian or
Alaska Native Asian
Black or African
American Hispanic/
Latino
Native Hawaiian or Other
Pacific Islander White
Two or more races
All states 14.4 4.2 11.6 8.7 13.7 8.2 7.6 Alabama 9.5 3.1 9.3 5.5 8.6 6.8 5.2 Alaska 16.6 5.8 10.4 7.8 13.6 8.3 9.3 Arizona 10.2 3.9 11.4 8.1 9.1 7.5 5.5 Arkansas 8.0 4.6 11.0 7.7 8.4 8.1 5.7 BIE schools — — — — — — — California 14.4 4.0 12.7 8.3 9.0 7.2 5.2 Colorado 12.7 3.9 10.4 8.7 8.4 6.2 6.7 Connecticut 13.0 3.9 12.6 10.9 14.8 7.4 6.3 Delaware 16.1 3.7 14.2 10.2 9.3 7.8 5.6 District of Columbia 6.6 2.0 14.2 9.9 28.1 1.8 2.3 Florida 11.8 4.1 11.1 8.7 12.5 7.9 9.1 Georgia 7.1 3.4 9.2 7.8 9.0 7.2 8.9 Hawaii 13.1 4.8 6.3 4.4 22.9 5.6 1.8 Idaho 12.8 4.5 10.3 2.8 8.9 6.5 30.6 Illinois 34.1 4.1 12.8 8.8 43.6 8.9 10.9 Indiana 15.0 3.7 13.2 9.3 11.8 10.2 15.9 Iowa 14.5 3.7 17.0 10.6 14.2 7.8 10.7 Kansas 12.9 4.5 12.8 9.0 11.0 8.6 10.4 Kentucky 6.7 3.9 10.9 7.7 6.1 8.8 8.1 Louisiana 7.1 2.6 9.3 4.4 8.0 5.9 4.5 Maine 18.2 6.4 13.5 9.9 24.2 11.7 7.9 Maryland 11.0 3.4 10.0 8.0 15.2 6.2 5.8 Massachusetts 17.9 4.8 14.3 15.2 25.8 10.3 10.7 Michigan 12.7 3.4 11.2 7.9 24.7 8.2 6.9 Minnesota 20.4 6.8 15.3 11.8 13.2 8.7 10.0 Mississippi 3.6 3.9 9.7 4.7 5.7 8.2 4.3 Missouri 10.5 4.4 11.7 6.7 7.1 8.3 6.4 Montana 12.5 4.1 11.8 7.0 23.2 7.0 5.5 Nebraska 19.5 5.7 15.3 11.7 12.3 9.1 11.8 Nevada 15.4 2.9 11.8 7.5 11.2 7.7 8.0 New Hampshire 13.7 3.8 15.0 8.6 41.5 10.0 1.8 New Jersey 8.6 5.2 15.1 11.8 46.1 12.2 5.1 New Mexico 10.4 4.5 11.9 10.2 11.9 8.3 6.2 See notes at end of exhibit.

125
Exhibit 59. Percentage of the population ages 6 through age 21 served under IDEA, Part B, for each racial/ethnic group, by state: Fall 2014—Continued
State American Indian or
Alaska Native Asian
Black or African
American Hispanic/
Latino
Native Hawaiian or Other
Pacific Islander White
Two or more races
New York 20.5 5.3 15.0 14.1 40.5 9.0 5.3 North Carolina 11.2 3.5 11.3 8.3 9.0 7.3 9.2 North Dakota 11.5 3.4 10.5 8.2 25.0 7.2 4.4 Ohio 8.8 3.5 12.9 8.5 10.9 9.1 11.3 Oklahoma 17.6 4.5 15.5 9.5 12.2 11.2 6.3 Oregon 16.0 4.5 14.3 10.8 10.1 9.0 9.2 Pennsylvania 13.7 4.2 13.7 11.3 16.5 9.9 11.8 Rhode Island 21.9 3.7 12.2 11.8 21.3 8.5 9.1 South Carolina 7.9 3.8 12.0 7.5 8.0 7.6 10.4 South Dakota 12.2 5.6 12.2 8.7 12.9 8.2 7.5 Tennessee 9.0 4.2 11.0 7.6 8.9 8.5 4.5 Texas 9.6 3.0 8.8 6.8 8.3 5.7 6.2 Utah 15.8 4.1 13.9 10.3 9.2 8.5 6.0 Vermont 23.7 3.7 14.0 4.1 21.1 9.9 3.2 Virginia 9.8 4.6 11.6 10.1 12.9 7.4 8.4 Washington 12.2 4.3 12.1 10.2 7.7 7.9 8.4 West Virginia 7.1 3.7 12.8 6.3 13.3 11.5 7.2 Wisconsin 15.9 6.0 15.7 9.7 18.9 7.7 7.9 Wyoming — — — — — — — — Percentage cannot be calculated because data were not available. NOTE: Percentage for each state was calculated by dividing the number of students ages 6 through 21 served under IDEA, Part B, by the state who were reported in the racial/ethnic group by the estimated U.S. resident population ages 6 through 21 of the racial/ethnic group in the state, then multiplying the result by 100. Percentage for “All states” was calculated for all states with available data by dividing the number of students ages 6 through 21 served under IDEA, Part B, by all states who were reported in the racial/ethnic group by the estimated U.S. resident population ages 6 through 21 in the racial/ethnic group in all states, then multiplying the result by 100. Percentage for “All states” includes data for BIE schools. SOURCE: U.S. Department of Education, EDFacts Data Warehouse (EDW), OMB #1875-0240: “IDEA Part B Child Count and Educational Environments Collection,” 2014. Data for Puerto Rico were excluded. U.S. Department of Commerce, U.S. Census Bureau. “Intercensal Estimates of the Resident Population by Single Year of Age and Sex for States and the United States: April 1, 2000 to July 1, 2014,” 2014. Data for Puerto Rico were not available. Children served through BIE schools are included in the population estimates of the individual states in which they reside. Data were accessed fall 2015. For actual data used, go to http://www2.ed.gov/about/reports/annual/osep/index.html.
• Larger percentages of the resident population ages 6 through 21 who were American Indian or Alaska Native and who were Native Hawaiian or Other Pacific Islander than of the resident populations of the other racial/ethnic groups were served under IDEA, Part B, in the 50 states (“All states”) for which data were available. Specifically, 14.4 percent of the resident population who were American Indian or Alaska Native and 13.7 percent of the resident population who were Native Hawaiian or Other Pacific Islander were served under Part B. In contrast, only 4.2 percent of the resident population who were Asian in “All states” were served under IDEA, Part B.

126
• In 2014, 14.4 percent of the resident population ages 6 through 21 who were American Indian or Alaska Native were served under Part B in the 50 states (“All states)” for which data were available. The percentages ranged from 3.6 to 34.1 percent in the individual states. In the following five states, the percentage was larger than 20 percent: Illinois (34.1 percent), Vermont (23.7 percent), Rhode Island (21.9 percent), New York (20.5 percent), and Minnesota (20.4 percent). In contrast, the percentage was less than 7 percent in the following three states: Kentucky (6.7 percent), the District of Columbia (6.6 percent), and Mississippi (3.6 percent).
• In 2014, 4.2 percent of the resident population ages 6 through 21 who were Asian were served under Part B in the 50 states (“All states”) for which data were available. The percentages ranged from 2 to 6.8 percent in the individual states. The percentage was larger than 6 percent in only Minnesota (6.8 percent) and Maine (6.4 percent). In contrast, the percentage was less than 3 percent in the following three states: Nevada (2.9 percent), Louisiana (2.6 percent), and the District of Columbia (2.0 percent).
• In 2014, 11.6 percent of the resident population ages 6 through 21 who were Black or African American were served under Part B in the 50 states (“All states”) for which data were available. The percentages ranged from 6.3 to 17 percent in the individual states. In the following six states, the percentage was larger than 15 percent: Iowa (17.0 percent), Wisconsin (15.7 percent), Oklahoma (15.5 percent), Minnesota (15.3 percent), Nebraska (15.3 percent), and New Jersey (15.1 percent). In contrast, the percentage was less than 9 percent in the following two states: Texas (8.8 percent) and Hawaii (6.3 percent).
• In 2014, 8.7 percent of the resident population ages 6 through 21 who were Hispanic/Latino were served under Part B in the 50 states (“All states”) for which data were available. The percentages ranged from 2.8 to 15.2 percent in the individual states. In the following seven states, the percentage was more than 11 percent: Massachusetts (15.2 percent), New York (14.1 percent), Minnesota (11.8 percent), New Jersey (11.8 percent), Rhode Island (11.8 percent), Nebraska (11.7 percent), and Pennsylvania (11.3 percent). In contrast, the percentage was less than 5 percent in the following five states: Mississippi (4.7 percent), Hawaii (4.4 percent), Louisiana (4.4 percent), Vermont (4.1 percent), and Idaho (2.8 percent).
• In 2014, 13.7 percent of the resident population ages 6 through 21 who were Native Hawaiian or Other Pacific Islander were served under Part B in the 50 states (“All states”) for which data were available. The percentages ranged from 5.7 to 46.1 percent in the individual states. The percentage was more than 30 percent in the following four states: New Jersey (46.1 percent), Illinois (43.6 percent), New Hampshire (41.5 percent), and New York (40.5 percent). In contrast, the percentage was less than 7 percent in Kentucky (6.1 percent) and Mississippi (5.7 percent).
• In 2014, 8.2 percent of the resident population ages 6 through 21 who were White were served under Part B in the 50 states (“All states”) for which data were available. The percentages ranged from 1.8 to 12.2 percent in the individual states. The percentage was 11 percent or more in the following four states: New Jersey (12.2 percent), Maine (11.7 percent), West Virginia (11.5 percent), and Oklahoma (11.2 percent). In contrast, the percentage was less than 6 percent in Louisiana (5.9 percent), Texas (5.7 percent), Hawaii (5.6 percent), and the District of Columbia (1.8 percent).
• In 2014, 7.6 percent of the resident population ages 6 through 21 who were associated with multiple races were served under Part B in the 50 states (“All states”) for which data were available. The percentages ranged from 1.8 to 30.6 percent in the individual states. In the

127
following five states, the percentage was 11 percent or more: Idaho (30.6 percent), Indiana (15.9 percent), Nebraska (11.8 percent), Pennsylvania (11.8 percent), and Ohio (11.3 percent). In contrast, the percentage was less than 3 percent in the following three states: the District of Columbia (2.3 percent), Hawaii (1.8 percent), and New Hampshire (1.8 percent).

128
How did the states compare with regard to the percentage of students ages 6 through 21 served under IDEA, Part B, who were reported under the category of autism in 2014, and how did the percentages change between 2008 and 2014?
Exhibit 60. Percentage of students ages 6 through 21 served under IDEA, Part B, reported under the category of autism, by year and state: Fall 2008 and fall 2014
State 2008 percent
2014 percent
Change between 2008 and 2014a
Percent change between 2008
and 2014b All states 5.0 8.6 3.7 73.9
Alabama 3.9 7.8 3.9 98.9 Alaska 3.7 6.8 3.2 86.2 Arizona 4.7 8.6 3.9 82.0 Arkansas 4.0 7.0 3.1 77.8 BIE schools 1.1 3.0 1.9 180.4 California 7.0 11.7 4.7 67.7 Colorado 3.3 6.6 3.3 97.8 Connecticut 7.3 11.4 4.1 57.1 Delaware 4.3 7.0 2.6 60.4 District of Columbia 3.1 6.4 3.3 107.0 Florida 3.6 8.5 4.9 138.7 Georgia 5.3 8.4 3.0 56.5 Hawaii 5.5 7.9 2.4 42.4 Idaho 6.0 9.6 3.6 59.6 Illinois 4.3 7.7 3.5 81.1 Indiana 5.9 9.0 3.1 51.4 Iowa 1.1 1.1 # -0.3 Kansas 3.4 5.9 2.5 74.3 Kentucky 3.1 6.4 3.2 102.5 Louisiana 3.3 6.0 2.8 85.4 Maine 6.1 9.2 3.1 50.4 Maryland 7.4 10.5 3.1 41.8 Massachusetts 5.2 9.6 4.5 86.2 Michigan 5.8 8.9 3.2 54.8 Minnesota 10.5 14.1 3.6 34.6 Mississippi 2.4 6.4 4.0 168.3 Missouri 4.7 8.7 4.0 83.3 Montana 2.8 3.9 1.1 37.8 Nebraska 3.7 6.7 3.0 82.0 Nevada 5.6 10.8 5.2 93.8 New Hampshire 4.5 8.8 4.3 96.9 New Jersey 4.4 7.7 3.3 75.7 New Mexico 2.4 5.1 2.7 112.1 New York 4.5 6.9 2.4 53.4 North Carolina 5.1 8.4 3.3 65.7 North Dakota 4.0 7.2 3.2 79.1 See notes at end of exhibit.

129
Exhibit 60. Percentage of students ages 6 through 21 served under IDEA, Part B, reported under the category of autism, by year and state: Fall 2008 and fall 2014—Continued
State 2008 percent
2014 percent
Change between 2008 and 2014a
Percent change between 2008
and 2014b Ohio 4.7 8.3 3.6 77.0 Oklahoma 2.5 4.8 2.3 90.4 Oregon 9.3 11.4 2.1 22.4 Pennsylvania 5.2 9.7 4.5 86.7 Puerto Rico 1.4 3.0 1.6 109.7 Rhode Island 5.4 10.1 4.7 88.0 South Carolina 2.9 6.4 3.5 123.2 South Dakota 3.8 5.2 1.4 36.7 Tennessee 3.8 6.5 2.7 71.9 Texas 5.5 10.7 5.3 96.6 Utah 4.8 7.2 2.4 49.6 Vermont — 7.9 — — Virginia 5.3 10.7 5.4 101.6 Washington 5.6 8.9 3.3 58.4 West Virginia 2.5 4.5 2.0 77.6 Wisconsin 5.7 9.4 3.8 66.1 Wyoming 3.6 — — — — Percentage cannot be calculated because data were not available. # Percentage was non-zero, but less than 0.05 or 5/100 of 1 percent. aChange between 2008 and 2014 was calculated for each state and “All states” by subtracting the percentage for 2008 from the percentage for 2014. Due to rounding, it may not be possible to reproduce the difference from the values presented in the exhibit. bPercent change between 2008 and 2014 was calculated for each state and “All states” by subtracting the percentage for 2008 from the percentage for 2014, dividing the difference by the percentage for 2008, then multiplying the result by 100. Due to rounding, it may not be possible to reproduce the percent change from the values presented in the exhibit. NOTE: Percentage for each state was calculated by dividing the number of students ages 6 through 21 served under IDEA, Part B, by the state under the category of autism in the year by the total number of students ages 6 through 21 served under IDEA, Part B, by the state in that year, then multiplying the result by 100. Percentage for “All states” was calculated for all states with available data by dividing the number of students ages 6 through 21 served under IDEA, Part B, by all states under the category of autism in the year by the total number of students ages 6 through 21 served under IDEA, Part B, by all states in that year, then multiplying the result by 100. SOURCE: U.S. Department of Education, EDFacts Data Warehouse (EDW), OMB #1875-0240: “IDEA Part B Child Count and Educational Environments Collection,” 2008 and 2014. Data for 2008 were accessed spring 2012. Data for 2014 were accessed fall 2015. For actual data used, go to http://www2.ed.gov/about/reports/annual/osep/index.html.
• In 2014, a total of 8.6 percent of students ages 6 through 21 served under IDEA, Part B, in the
52 states (“All states”) for which data were available were reported under the category of autism. More than 11 percent of the students served in the following nine states were reported under the category of autism: Minnesota (14.1 percent), California (11.7 percent), Connecticut (11.4 percent), Oregon (11.4 percent), Nevada (10.8 percent), Texas (10.7 percent), Virginia (10.7 percent), Maryland (10.5 percent), and Rhode Island (10.1 percent). However, less than 4 percent of the students served in the following four states were reported under the category of autism: Montana (3.9 percent), BIE schools (3.0 percent), Puerto Rico (3.0 percent), and Iowa (1.1 percent).

130
• In 2008, a total of 5 percent of students ages 6 through 21 served under IDEA, Part B, in the 52 states (“All states”) for which data were available were reported under the category of autism.
• The percentage of students ages 6 through 21 served under IDEA, Part B, who were reported under the category of autism was larger in 2014 than in 2008 in 50 of the 51 states for which data for both time periods were available. The sole exception was Iowa, in which 1.1 percent of the students served in both years were reported under the category of autism.
• The percent change for 43 of the 50 states in which a larger percentage of the students ages 6 through 21 served under IDEA, Part B, were reported under the category of autism in 2014 than in 2008 exceeded 50 percent. Moreover, a percentage increase of more than 100 percent was found in nine states, including BIE schools (180.4 percent) and Mississippi (168.3 percent).

131
How did the states compare with regard to the percentage of students ages 6 through 21 served under IDEA, Part B, who were reported under the category of other health impairments in 2014, and how did the percentages change between 2008 and 2014?
Exhibit 61. Percentage of students ages 6 through 21 served under IDEA, Part B, reported under the category of other health impairments, by year and state: Fall 2008 and fall 2014
State 2008 percent
2014 percent
Change between 2008 and 2014a
Percent change between 2008
and 2014b All states 11.0 14.4 3.4 31.1
Alabama 8.2 13.5 5.3 63.8 Alaska 11.9 15.6 3.7 31.5 Arizona 6.7 9.0 2.3 34.3 Arkansas 15.3 19.5 4.3 27.8 BIE schools 6.1 8.6 2.5 40.7 California 7.8 11.4 3.6 46.7 Colorado — 4.5 — — Connecticut 18.5 21.3 2.8 14.8 Delaware 12.5 13.0 0.5 4.4 District of Columbia 4.9 14.4 9.4 190.2 Florida 6.7 9.9 3.2 47.9 Georgia 15.6 16.3 0.7 4.4 Hawaii 15.1 16.6 1.5 10.2 Idaho 10.9 18.8 7.9 72.0 Illinois 9.0 12.5 3.5 38.8 Indiana 7.5 12.7 5.2 69.4 Iowa 0.1 0.1 # -3.2 Kansas 12.5 12.6 0.1 0.8 Kentucky 17.6 16.6 -1.0 -5.9 Louisiana 12.3 14.0 1.7 14.2 Maine 18.6 21.5 2.9 15.8 Maryland 16.3 18.9 2.6 15.9 Massachusetts 7.5 12.9 5.4 72.2 Michigan 9.0 12.8 3.8 42.6 Minnesota 14.2 16.4 2.2 15.6 Mississippi 10.4 17.8 7.4 70.7 Missouri 14.5 20.3 5.7 39.3 Montana 10.8 12.7 1.9 17.8 Nebraska 13.1 14.5 1.4 10.9 Nevada 7.3 10.0 2.7 37.1 New Hampshire 17.7 19.8 2.1 12.0 New Jersey 13.5 19.7 6.2 45.6 New Mexico 7.9 9.2 1.3 15.9 New York 13.6 16.2 2.6 19.3 North Carolina 17.3 19.3 2.0 11.3 North Dakota 12.5 15.4 2.9 23.2 See notes at end of exhibit.

132
Exhibit 61. Percentage of students ages 6 through 21 served under IDEA, Part B, reported under the category of other health impairments, by year and state: Fall 2008 and fall 2014—Continued
State 2008 percent
2014 percent
Change between 2008 and 2014a
Percent change between 2008
and 2014b Ohio 10.7 15.9 5.1 47.9 Oklahoma 10.7 15.3 4.6 42.5 Oregon 13.0 16.2 3.2 24.2 Pennsylvania 7.1 13.3 6.3 88.4 Puerto Rico 6.5 15.4 8.9 137.2 Rhode Island 17.1 16.7 -0.5 -2.8 South Carolina 9.7 13.6 3.9 40.6 South Dakota 10.4 14.4 4.0 38.7 Tennessee 11.0 12.9 2.0 17.9 Texas 12.7 13.5 0.7 5.8 Utah 6.9 9.4 2.4 35.4 Vermont — 17.9 — — Virginia 18.1 21.5 3.3 18.4 Washington 19.5 20.5 1.0 5.3 West Virginia 11.9 15.5 3.6 30.0 Wisconsin 14.1 19.3 5.2 36.7 Wyoming 14.3 — — — — Percentage cannot be calculated because data were not available. # Percentage was non-zero, but less than 0.05 or 5/100 of 1 percent. aChange between 2008 and 2014 was calculated for each state and “All states” by subtracting the percentage for 2008 from the percentage for 2014. Due to rounding, it may not be possible to reproduce the difference from the values presented in the exhibit. bPercent change between 2008 and 2014 was calculated for each state and “All states” by subtracting the percentage for 2008 from the percentage for 2014, dividing the difference by the percentage for 2008, then multiplying the result by 100. Due to rounding, it may not be possible to reproduce the percent change from the values presented in the exhibit. NOTE: Percentage for each state was calculated by dividing the number of students ages 6 through 21 served under IDEA, Part B, by the state under the category of other health impairments in the year by the total number of students ages 6 through 21 served under IDEA, Part B, by the state in that year, then multiplying the result by 100. Percentage for “All states” was calculated for all states with available data by dividing the number of students ages 6 through 21 served under IDEA, Part B, by all states under the category of other health impairments in the year by the total number of students ages 6 through 21 served under IDEA, Part B, by all states in that year, then multiplying the result by 100. SOURCE: U.S. Department of Education, EDFacts Data Warehouse (EDW), OMB #1875-0240: “IDEA Part B Child Count and Educational Environments Collection,” 2008 and 2014. Data for 2008 were accessed spring 2012. Data for 2014 were accessed fall 2015. For actual data used, go to http://www2.ed.gov/about/reports/annual/osep/index.html.
• In 2014, 14.4 percent of the students ages 6 through 21 served under IDEA, Part B, in the 52 states (“All states”) for which data were available were reported under the category of other health impairments. However, less than 9 percent of the students served in the following three states were reported under the category of other health impairments: BIE schools (8.6 percent), Colorado (4.5 percent), and Iowa (0.1 percent). In contrast, more than 20 percent of the students served in the following five states were reported under the category of other health impairments: Maine (21.5 percent), Virginia (21.5 percent), Connecticut (21.3 percent), Washington (20.5 percent), and Missouri (20.3 percent).

133
• In 2008, 11 percent of students ages 6 through 21 served under IDEA, Part B, in the 51 states (“All states”) for which data were available were reported under the category of other health impairments.
• In 47 of the 50 states for which data were available for both years, the percentage of students reported under the category of other health impairments was larger in 2014 than in 2008. The percentage of children served in 2008 was larger than the percentage of children served in 2014 for only two states (i.e., Rhode Island and Kentucky) and the difference in both cases was no more than 1 percentage point.
• Percent changes of more than 30 percent were observed for 25 of the states for which an increase was found between 2008 and 2014. Included among these states were the following two in which the increase was larger than 100 percent: the District of Columbia (190.2 percent) and Puerto Rico (137.2 percent).

134
How did the states compare with regard to the percentage of students ages 6 through 21 served under IDEA, Part B, who were reported under the category of specific learning disabilities in 2014, and how did the percentages change between 2008 and 2014?
Exhibit 62. Percentage of students ages 6 through 21 served under IDEA, Part B, reported under the category of specific learning disabilities, by year and state: Fall 2008 and fall 2014
State 2008 percent
2014 percent
Change between 2008 and 2014a
Percent change between 2008
and 2014b All states 42.9 39.1 -3.7 -8.7
Alabama 50.0 42.4 -7.6 -15.2 Alaska 47.4 43.9 -3.5 -7.4 Arizona 50.4 45.7 -4.7 -9.4 Arkansas 37.5 33.7 -3.8 -10.2 BIE schools 55.5 52.3 -3.2 -5.7 California 47.8 44.6 -3.1 -6.5 Colorado 41.5 46.0 4.5 10.8 Connecticut 35.9 36.0 0.2 0.5 Delaware 53.8 49.5 -4.3 -7.9 District of Columbia 45.7 36.7 -8.9 -19.6 Florida 47.4 41.8 -5.6 -11.8 Georgia 31.3 36.6 5.2 16.7 Hawaii 47.7 48.0 0.3 0.6 Idaho 37.1 26.1 -11.0 -29.6 Illinois 46.2 40.2 -6.0 -13.0 Indiana 37.7 35.7 -2.0 -5.3 Iowa 60.3 60.4 0.1 0.1 Kansas 41.6 41.6 # 0.1 Kentucky 15.4 18.7 3.2 20.8 Louisiana 33.0 34.0 1.0 3.0 Maine 33.2 32.2 -1.0 -3.1 Maryland 36.5 33.6 -2.9 -7.9 Massachusetts 39.3 28.2 -11.0 -28.1 Michigan 41.1 35.7 -5.3 -13.0 Minnesota 28.9 26.9 -2.0 -7.0 Mississippi 39.6 24.4 -15.2 -38.5 Missouri 34.0 27.8 -6.3 -18.4 Montana 47.5 32.7 -14.8 -31.2 Nebraska 34.6 35.7 1.1 3.2 Nevada 57.5 51.3 -6.2 -10.7 New Hampshire 44.0 37.7 -6.2 -14.2 New Jersey 40.5 35.9 -4.6 -11.4 New Mexico 45.3 47.4 2.1 4.6 New York 41.9 38.5 -3.4 -8.1 North Carolina 37.1 40.8 3.8 10.1 North Dakota 36.1 35.9 -0.2 -0.5 See notes at end of exhibit.

135
Exhibit 62. Percentage of students ages 6 through 21 served under IDEA, Part B, reported under the category of specific learning disabilities, by year and state: Fall 2008 and fall 2014—Continued
State 2008 percent
2014 percent
Change between 2008 and 2014a
Percent change between 2008
and 2014b Ohio 42.4 41.3 -1.1 -2.7 Oklahoma 47.9 40.7 -7.2 -15.0 Oregon 39.3 35.8 -3.5 -8.8 Pennsylvania 52.0 44.2 -7.9 -15.1 Puerto Rico 59.2 47.9 -11.3 -19.1 Rhode Island 41.7 38.2 -3.4 -8.3 South Carolina 48.6 45.6 -3.0 -6.2 South Dakota 41.3 40.2 -1.1 -2.7 Tennessee 41.1 40.7 -0.4 -0.9 Texas 47.6 39.4 -8.2 -17.3 Utah 49.2 48.2 -1.0 -2.0 Vermont — 31.4 — — Virginia 39.3 36.8 -2.5 -6.4 Washington 39.6 38.3 -1.4 -3.4 West Virginia 32.9 32.3 -0.7 -2.1 Wisconsin 35.0 28.8 -6.2 -17.8 Wyoming 38.1 — — — — Percentage cannot be calculated because data were not available. # Percentage was non-zero, but less than 0.05 or 5/100 of 1 percent. aChange between 2008 and 2014 was calculated for each state and “All states” by subtracting the percentage for 2008 from the percentage for 2014. Due to rounding, it may not be possible to reproduce the difference from the values presented in the exhibit. bPercent change between 2008 and 2014 was calculated for each state and “All states” by subtracting the percentage for 2008 from the percentage for 2014, dividing the difference by the percentage for 2008, then multiplying the result by 100. Due to rounding, it may not be possible to reproduce the percent change from the values presented in the exhibit. NOTE: Percentage for each state was calculated by dividing the number of students ages 6 through 21 served under IDEA, Part B, by the state under the category of specific learning disabilities in the year by the total number of students ages 6 through 21 served under IDEA, Part B, by the state in that year, then multiplying the result by 100. Percentage for “All states” was calculated for all states with available data by dividing the number of students ages 6 through 21 served under IDEA, Part B, by all states under the category of specific learning disabilities in the year by the total number of students ages 6 through 21 served under IDEA, Part B, by all states in that year, then multiplying the result by 100. SOURCE: U.S. Department of Education, EDFacts Data Warehouse (EDW), OMB #1875-0240: “IDEA Part B Child Count and Educational Environments Collection,” 2008 and 2014. Data for 2008 were accessed spring 2012. Data for 2014 were accessed fall 2015. For actual data used, go to http://www2.ed.gov/about/reports/annual/osep/index.html.
• In 2014, a total of 39.1 percent of students ages 6 through 21 served under IDEA, Part B, in the 52 states (“All states”) for which data were available were reported under the category of specific learning disabilities. The percentages of students reported under the category of specific learning disabilities by the individual states ranged from 18.7 percent to 60.4 percent. The percentages for the following three states were larger than 50 percent: Iowa (60.4 percent), BIE schools (52.3 percent), and Nevada (51.3 percent). In contrast, the percentages for the following seven states were less than 30 percent: Wisconsin (28.2 percent), Massachusetts (28.2 percent), Missouri (27.8 percent), Minnesota (26.9 percent), Idaho (26.1 percent), Mississippi (24.4 percent), and Kentucky (18.7 percent).

136
• In 2008, 42.9 percent of the students ages 6 through 21 served under IDEA, Part B, in the 52 states (“All states”) for which data were available were reported under the category of specific learning disabilities.
• The percentage of students reported under the category of specific learning disabilities was larger in 2008 than in 2014 in 40 of the 51 states for which data were available for both time periods. For all 11 of the states in which the percentage in 2008 was not larger than the percentage in 2014, the difference was less than 6 percentage points. Moreover, the difference represented a percentage increase of less than 10 percent in each state except Kentucky (20.8 percent), Georgia (16.7 percent), Colorado (10.8 percent), and North Carolina (10.1 percent).
• While the percentage of students reported under the category of specific learning disabilities decreased in 40 states between 2008 and 2014, the difference between the percentage reported in 2008 and the percentage reported in 2014 was less than 10 percent for all but the following five states: Mississippi (-15.2 percent), Montana (-14.8 percent), Puerto Rico (-11.3 percent), Idaho (-11.0 percent), and Massachusetts (-11.0 percent). Moreover, the decrease for only the following four of these states represented a percent change larger than 20 percent: Mississippi (-38.5 percent), Montana (-31.2 percent), Idaho (-29.6 percent), and Massachusetts (-28.1 percent).

137
Part B Educational Environments
How did the states compare with regard to the distribution of students ages 6 through 21 served under IDEA, Part B, by educational environment in 2014?
Exhibit 63. Percentage of students ages 6 through 21 served under IDEA, Part B, by educational environment and state: Fall 2014
State
Inside the regular classa
Separate schoolc
Residential facilityc
Homebound/ hospitald
Correctional facilitye
Parentally placed in
private schoolf
80% or more of the dayb
40% to 79% of the day
Less than 40% of the day
All states 62.6 18.6 13.5 2.9 0.3 0.4 0.2 1.4 Alabama 83.6 6.2 7.0 1.4 1.0 0.3 0.1 0.4 Alaska 77.5 13.4 6.0 2.2 0.4 0.2 0.3 0.1 Arizona 63.6 19.0 14.8 1.7 0.1 0.3 0.3 0.2 Arkansas 52.5 30.8 13.6 1.0 0.9 0.5 0.2 0.6 BIE schools 73.9 19.8 5.6 0.2 0.3 0.2 0.0 # California 53.4 20.1 22.0 3.2 0.1 0.3 0.3 0.5 Colorado 72.8 17.2 7.0 1.8 0.4 0.2 0.2 0.3 Connecticut 68.7 16.7 5.2 7.5 0.6 0.4 0.3 0.8 Delaware 67.7 11.7 15.1 4.7 0.1 0.6 0.1 # District of Columbia 54.4 17.9 15.2 10.9 0.6 # 0.7 0.4 Florida 73.2 8.6 12.7 2.9 0.2 0.7 0.7 0.9 Georgia 64.7 18.2 14.5 1.6 0.3 0.2 0.2 0.3 Hawaii 36.9 41.5 20.1 0.6 0.1 0.3 0.2 0.2 Idaho 60.8 27.0 10.1 0.9 0.2 0.1 0.6 0.3 Illinois 53.0 26.0 13.2 5.7 0.5 0.2 0.1 1.4 Indiana 70.5 12.8 10.6 1.0 0.5 0.6 0.2 3.9 Iowa 64.9 23.2 8.6 1.1 0.7 0.1 0.5 1.0 Kansas 69.3 20.1 6.7 1.9 0.3 0.1 0.3 1.3 Kentucky 73.2 16.0 8.2 0.6 0.4 0.7 0.1 0.8 Louisiana 61.3 22.8 14.3 0.3 0.1 0.8 0.2 0.0 Maine 56.4 29.6 10.7 2.5 0.5 0.1 # 0.2 Maryland 68.9 9.7 13.1 6.5 0.1 0.2 0.3 1.1 Massachusetts 61.4 16.6 14.3 6.0 0.6 0.1 0.1 0.8 Michigan 65.9 15.9 11.1 4.7 0.1 0.2 0.5 1.5 Minnesota 60.5 23.4 10.1 3.9 0.1 0.2 0.1 1.6 Mississippi 64.3 17.8 14.4 0.9 0.5 0.6 # 1.4 Missouri 57.6 27.2 8.9 3.0 # 0.6 0.5 2.0 Montana 46.8 38.4 12.7 0.5 0.7 0.1 0.2 0.5 Nebraska 76.1 12.0 6.4 1.7 0.3 0.3 # 3.3 Nevada 63.8 19.8 14.5 1.2 # 0.3 0.3 0.2 New Hampshire 72.3 15.7 8.5 2.1 0.5 0.1 # 0.9 New Jersey 44.9 26.7 16.1 7.1 0.2 0.3 0.1 4.6 New Mexico 50.6 28.3 19.6 0.5 0.2 0.2 0.1 0.4 New York 57.8 11.7 19.8 5.4 0.5 0.3 0.2 4.4 See notes at end of exhibit.

138
Exhibit 63. Percentage of students ages 6 through 21 served under IDEA, Part B, by educational environment and state: Fall 2014—Continued
State
Inside the regular classa
Separate schoolc
Residential facilityc
Homebound/ hospitald
Correctional facilitye
Parentally placed in
private schoolf
80% or more of the dayb
40% to 79% of the day
Less than 40% of the day
North Carolina 66.5 17.5 13.7 1.1 0.2 0.6 0.1 0.3 North Dakota 74.6 16.9 5.1 0.6 0.9 0.2 0.1 1.7 Ohio 61.4 19.4 11.3 3.1 0.1 0.6 0.2 3.8 Oklahoma 65.9 22.9 9.5 0.3 0.4 0.6 0.1 0.3 Oregon 72.9 14.0 10.6 1.0 0.1 0.3 0.3 0.8 Pennsylvania 62.0 23.2 9.5 4.3 0.4 0.2 0.1 0.4 Puerto Rico 81.1 3.8 6.0 1.7 0.0 1.2 0.1 6.1 Rhode Island 71.1 9.6 12.5 4.4 0.6 0.1 0.3 1.5 South Carolina 58.3 21.3 17.8 0.6 0.3 0.9 0.4 0.4 South Dakota 68.4 22.1 5.5 0.8 1.1 0.2 0.2 1.6 Tennessee 70.1 16.5 10.7 0.9 0.3 0.6 0.1 0.9 Texas 67.5 16.7 14.3 0.5 0.2 0.5 0.1 0.2 Utah 58.1 26.8 12.4 2.3 0.1 0.2 0.1 0.0 Vermont 74.9 12.5 6.3 4.6 1.0 0.2 0.1 0.5 Virginia 62.8 21.2 11.0 3.0 0.4 0.7 0.4 0.6 Washington 53.5 31.8 13.3 0.6 0.1 0.1 0.1 0.4 West Virginia 63.9 25.3 8.0 0.2 0.5 1.1 0.2 0.8 Wisconsin 65.1 22.0 9.6 1.0 0.2 0.2 0.4 1.5 Wyoming — — — — — — — — # Percentage was non-zero, but less than 0.05 or 5/100 of 1 percent. — Percentage cannot be calculated because data were not available. aPercentage of day spent inside the regular class is defined as the number of hours the student spends each day inside the regular classroom, divided by the total number of hours in the school day (including lunch, recess, and study periods), multiplied by 100. bStudents who received special education and related services outside the regular classroom for less than 21 percent of the school day were classified in the inside the regular class 80% or more of the day category. cSeparate school and residential facility are categories that include children with disabilities who receive special education and related services, at public expense, for greater than 50 percent of the school day in public or private separate day schools or residential facilities. dHomebound/hospital is a category that includes children with disabilities who receive special education and related services in hospital programs or homebound programs. eCorrectional facilities is a category that includes children with disabilities who receive special education and related services in short-term detention facilities or correctional facilities. fParentally placed in private schools is a category that includes children with disabilities who have been enrolled by their parents or guardians in regular parochial or other private schools and whose basic education is paid through private resources and who receive special education and related services, at public expense, from a local education agency or intermediate educational unit under a service plan. NOTE: Percentage for each state was calculated by dividing the number of students ages 6 through 21 served under IDEA, Part B, by the state who were reported in the educational environment by the total number of students ages 6 through 21 served under IDEA, Part B, by the state, then multiplying the result by 100. Percentage for “All states” was calculated by dividing the number of students ages 6 through 21 served under IDEA, Part B, by all states who were reported in the educational environment by the total number of students ages 6 through 21 served under IDEA, Part B, by all states, then multiplying the result by 100. SOURCE: U.S. Department of Education, EDFacts Data Warehouse (EDW), OMB #1875-0240: “IDEA Part B Child Count and Educational Environments Collection,” 2014. Data were accessed fall 2015. For actual data used, go to http://www2.ed.gov/about/reports/annual/osep/index.html.

139
• In 2014, a total of 62.6 percent of students ages 6 through 21 served under IDEA, Part B, in the 52 states (“All states”) for which data were available were educated inside the regular class 80% or more of the day.
• In 51 of the 52 individual states, a larger percentage of students was accounted for by the category of inside the regular class 80% or more of the day than any other educational environment category. Moreover, in 49 of these states, a majority of such students were educated inside the regular class 80% or more of the day. In four of those states, this category accounted for more than 75 percent of such students. The states were Alabama (83.6 percent), Puerto Rico (81.1 percent), Alaska (77.5 percent), and Nebraska (76.1percent). The only state that deviated from this pattern was Hawaii. In Hawaii, the most prevalent category was inside the regular class no more than 79% of the day and no less than 40% of the day, which accounted for 41.5 percent of such students.

140
How did the states compare with regard to the distribution of students ages 6 through 21 served under IDEA, Part B, who were limited English proficient, by educational environment in 2014?
Exhibit 64. Percentage of students ages 6 through 21 served under IDEA, Part B, who were limited English proficient, by educational environment and state: Fall 2014
State
Inside the regular classa
Separate schoolc
Residential facilityc
Homebound/ hospitald
Correctional facilitye
Parentally placed in
private schoolf
80% or more of the dayb
40% to 79% of the day
Less than 40% of the day
All states 58.6 22.3 17.0 1.6 # 0.2 0.1 0.2 Alabama 81.9 9.4 8.0 0.4 0.1 0.1 0.0 0.1 Alaska 80.6 14.7 3.0 1.4 0.2 # 0.1 0.0 Arizona 71.7 20.5 7.7 0.1 0.0 # 0.0 # Arkansas 56.0 29.4 13.9 0.1 0.2 0.3 0.0 0.1 BIE schools 74.3 19.8 5.5 0.1 0.1 0.1 — — California 50.3 23.2 23.8 2.0 # 0.3 0.2 0.1 Colorado 74.1 18.2 6.7 0.4 0.1 0.2 # 0.2 Connecticut 73.6 18.7 4.5 2.8 # 0.1 0.0 0.2 Delaware 66.4 15.6 14.8 3.0 0.0 0.1 0.0 0.0 District of Columbia 70.3 15.6 10.7 3.2 0.0 0.0 0.1 0.0 Florida 82.9 7.8 8.1 0.5 0.1 0.3 0.1 0.2 Georgia 62.1 26.5 11.1 0.2 0.0 0.1 # # Hawaii 23.2 49.4 25.7 1.1 0.1 0.4 0.2 0.0 Idaho 53.0 37.6 9.0 0.2 0.0 0.1 0.1 0.1 Illinois 47.4 33.6 15.6 3.2 0.1 # # 0.1 Indiana 69.6 15.6 11.5 0.4 0.1 0.3 0.0 2.5 Iowa — — — — — — — — Kansas — — — — — — — — Kentucky 69.1 21.3 8.6 0.4 0.2 0.1 0.0 0.2 Louisiana 60.9 25.1 13.8 0.1 0.0 0.1 0.0 0.0 Maine 54.7 30.0 13.6 1.8 0.0 0.0 0.0 0.0 Maryland 73.5 9.5 14.6 2.1 0.1 0.1 0.0 0.1 Massachusetts 55.5 18.7 22.6 2.9 # 0.1 0.1 0.2 Michigan 71.1 16.8 9.4 1.9 # 0.1 # 0.7 Minnesota 60.3 27.4 10.1 1.5 0.0 0.2 0.0 0.5 Mississippi 61.8 21.0 16.3 0.3 0.1 0.4 0.0 0.0 Missouri 60.2 29.3 9.6 0.8 0.0 0.1 0.0 0.1 Montana 43.0 46.5 10.0 0.2 0.2 0.0 0.2 0.0 Nebraska 85.4 11.5 2.2 0.0 0.1 0.2 0.0 0.6 Nevada 61.5 27.4 10.9 0.1 0.0 0.1 # # New Hampshire 68.9 15.4 12.6 2.0 0.2 0.0 0.0 0.8 New Jersey 46.5 27.3 23.6 1.6 0.1 0.1 # 0.9 New Mexico 44.1 32.9 22.6 0.1 # 0.1 # 0.1 New York 50.1 11.4 32.7 5.5 # 0.1 # 0.1 North Carolina 64.3 21.9 12.7 0.7 0.1 0.2 # 0.0 North Dakota 66.1 27.6 5.7 0.0 0.0 0.3 0.0 0.3 See notes at end of exhibit.

141
Exhibit 64. Percentage of students ages 6 through 21 served under IDEA, Part B, who were limited English proficient, by educational environment and state: Fall 2014—Continued
State
Inside the regular classa
Separate schoolc
Residential facilityc
Homebound/ hospitald
Correctional facilitye
Parentally placed in
private schoolf
80% or more of the dayb
40% to 79% of the day
Less than 40% of the day
Ohio 56.9 28.0 12.5 1.1 # 0.3 # 1.3 Oklahoma 56.7 30.9 11.8 0.1 0.1 0.4 0.0 0.1 Oregon 76.3 15.3 8.2 0.1 # 0.1 # 0.1 Pennsylvania 48.8 36.5 13.2 1.4 0.1 0.1 0.0 # Puerto Rico 86.1 3.8 8.5 1.3 — 0.0 0.0 0.2 Rhode Island 82.9 7.4 8.4 0.7 0.1 0.1 0.0 0.2 South Carolina 59.3 22.6 16.2 0.4 # 0.5 0.1 0.9 South Dakota 56.9 33.7 7.2 0.4 0.7 0.0 0.2 0.9 Tennessee 68.0 21.2 9.7 0.5 0.0 0.3 # 0.2 Texas 71.7 18.9 9.0 0.1 # 0.3 # # Utah 50.4 36.9 11.5 1.0 # 0.1 # 0.0 Vermont 72.8 18.4 5.1 3.2 0.6 0.0 0.0 0.0 Virginia 52.9 33.9 11.1 1.8 # 0.2 # # Washington 53.3 38.9 7.6 # — # # # West Virginia 60.5 32.0 6.0 0.0 0.0 1.0 0.0 0.5 Wisconsin 68.0 23.2 7.7 0.2 0.2 0.1 0.1 0.5 Wyoming — — — — — — — — # Percentage was non-zero, but less than 0.05 or 5/100 of 1 percent. — Percentage cannot be calculated because data were not available. aPercentage of day spent inside the regular class is defined as the number of hours the student spends each day inside the regular classroom, divided by the total number of hours in the school day (including lunch, recess, and study periods), multiplied by 100. bStudents who received special education and related services outside the regular classroom for less than 21 percent of the school day were classified in the inside the regular class 80% or more of the day category. cSeparate school and residential facility are categories that include children with disabilities who receive special education and related services, at public expense, for greater than 50 percent of the school day in public or private separate day schools or residential facilities. dHomebound/hospital is a category that includes children with disabilities who receive special education and related services in hospital programs or homebound programs. eCorrectional facilities is a category that includes children with disabilities who receive special education and related services in short-term detention facilities or correctional facilities. fParentally placed in private schools is a category that includes children with disabilities who have been enrolled by their parents or guardians in regular parochial or other private schools and whose basic education is paid through private resources and who receive special education and related services, at public expense, from a local education agency or intermediate educational unit under a service plan. NOTE: Percentage for each state was calculated by dividing the number of students ages 6 through 21 served under IDEA, Part B, who were limited English proficient (LEP) and reported in the educational environment by the state by the total number of students ages 6 through 21 served under IDEA, Part B, who were LEP by the state, then multiplying the result by 100. Percentage for “All states” was calculated by dividing the number of students ages 6 through 21 served under IDEA, Part B, who were LEP and reported in the educational environment by all states by the total number of students ages 6 through 21 served under IDEA, Part B, who were LEP by all states, then multiplying the result by 100. In the case of Puerto Rico, language proficiency is determined with regard to Spanish. SOURCE: U.S. Department of Education, EDFacts Data Warehouse (EDW), OMB #1875-0240: “IDEA Part B Child Count and Educational Environments Collection,” 2014. Data were accessed fall 2015. For actual data used, go to http://www2.ed.gov/about/reports/annual/osep/index.html.

142
• In 2014, a total of 58.6 percent of the students ages 6 through 21 who were limited English proficient (LEP) and served under IDEA, Part B, in the 50 states (“All states”) for which data were available were educated inside the regular class 80% or more of the day.
• In 48 individual states, the educational environment category of inside the regular class 80% or more of the day accounted for the largest percentage of the students ages 6 through 21 who were LEP and served under IDEA, Part B. In 44 of those states, this educational environment accounted for a majority of such students. In the following six states, more than 80 percent of such students were in this environment: Puerto Rico (86.1 percent), Nebraska (85.4 percent), Florida (82.9 percent), Rhode Island (82.9 percent), Alabama (81.9 percent), and Alaska (80.6 percent).
• The category of inside the regular class no more than 79% of the day and no less than 40% of the day was the most prevalent educational environment category for Hawaii and Montana, accounting for 49.4 percent and 46.5 percent of students who were LEP, respectively.

143
How did the states compare with regard to the distribution of students ages 6 through 21 served under IDEA, Part B, reported under the category of emotional disturbance, by educational environment in 2014?
Exhibit 65. Percentage of students ages 6 through 21 served under IDEA, Part B, reported under the category of emotional disturbance, by educational environment and state: Fall 2014
State
Inside the regular classa
Separate schoolc
Residential facilityc
Homebound/ hospitald
Correctional facilitye
Parentally placed in
private schoolf
80% or more of the dayb
40% to 79% of the day
Less than 40% of the day
All states 46.2 17.6 18.8 13.1 1.5 1.1 1.5 0.3 Alabama 70.9 8.0 5.1 6.3 7.7 1.6 0.3 0.1 Alaska 60.6 14.0 8.8 11.9 2.3 0.0 2.4 0.0 Arizona 39.9 16.2 28.7 12.1 0.6 0.5 2.0 # Arkansas 30.8 29.9 23.2 6.2 5.4 2.8 1.5 0.1 BIE schools 69.9 21.2 7.0 1.0 0.7 0.3 — — California 27.5 16.2 31.0 19.8 2.4 0.9 1.9 0.2 Colorado 53.8 15.9 14.7 10.3 2.7 0.6 1.9 0.1 Connecticut 39.6 13.7 11.4 29.4 3.0 1.6 1.1 0.1 Delaware 44.6 13.2 23.2 15.2 1.5 2.0 0.3 0.1 District of Columbia 35.7 11.1 26.4 20.1 2.8 0.1 3.5 0.3 Florida 45.3 13.0 24.4 10.8 0.2 0.3 5.5 0.4 Georgia 53.4 16.4 15.2 11.8 1.7 0.4 1.1 # Hawaii 34.1 32.0 26.8 2.4 1.3 1.4 2.1 0.1 Idaho 49.3 23.5 14.2 7.5 0.1 0.1 5.2 0.0 Illinois 32.3 21.2 15.4 26.9 2.9 0.4 0.7 0.2 Indiana 55.9 14.4 18.6 4.2 2.4 2.3 1.1 1.1 Iowa 65.0 23.2 8.6 1.1 0.7 # 0.5 1.0 Kansas 50.7 19.4 12.3 13.6 0.8 0.1 2.9 0.1 Kentucky 55.0 18.9 17.2 3.1 2.5 2.1 1.3 0.0 Louisiana 46.3 25.8 21.8 0.4 0.5 2.4 2.8 0.0 Maine 44.4 23.6 19.0 10.4 2.1 0.4 # # Maryland 44.1 11.7 18.4 23.3 0.1 0.4 1.9 # Massachusetts 41.5 11.4 19.9 24.6 1.3 0.3 0.6 0.3 Michigan 54.1 16.5 14.3 10.0 0.7 0.5 3.4 0.4 Minnesota 53.9 21.1 12.1 11.6 # 0.4 0.6 0.3 Mississippi 54.5 25.1 12.0 3.8 2.8 1.7 0.1 0.1 Missouri 43.2 27.4 12.4 11.5 # 2.4 2.6 0.5 Montana 40.3 34.1 16.3 2.6 4.6 0.4 1.6 0.1 Nebraska 68.2 10.8 9.4 9.3 1.3 0.2 0.2 0.6 Nevada 50.0 20.0 21.8 6.2 0.0 0.4 1.6 0.0 New Hampshire 59.2 16.7 12.4 9.2 2.0 0.0 # 0.5 New Jersey 31.6 20.8 19.0 24.6 1.1 1.8 0.9 0.2 New Mexico 37.2 22.8 35.0 1.3 1.9 0.4 1.4 0.1 New York 31.1 11.1 30.3 20.3 3.1 1.6 1.2 1.3 North Carolina 51.0 19.6 22.0 3.0 0.2 3.2 1.1 # See notes at end of exhibit.

144
Exhibit 65. Percentage of students ages 6 through 21 served under IDEA, Part B, reported under the category of emotional disturbance, by educational environment and state: Fall 2014—Continued
State
Inside the regular classa
Separate schoolc
Residential facilityc
Homebound/ hospitald
Correctional facilitye
Parentally placed in
private schoolf
80% or more of the dayb
40% to 79% of the day
Less than 40% of the day
North Dakota 69.8 14.0 7.7 2.7 4.7 0.7 0.5 0.0 Ohio 39.8 18.3 19.5 17.2 0.8 2.6 1.1 0.6 Oklahoma 52.2 23.4 17.6 1.2 2.3 2.5 0.7 # Oregon 56.0 15.3 19.6 6.2 # 0.8 1.8 0.3 Pennsylvania 46.6 20.3 13.5 16.6 1.8 0.3 0.8 # Puerto Rico 79.4 3.6 12.1 1.0 — 1.3 0.1 2.5 Rhode Island 40.8 7.9 26.7 18.8 4.0 0.3 1.2 0.3 South Carolina 34.8 22.1 30.9 2.5 1.2 5.3 3.2 0.1 South Dakota 62.0 24.7 9.6 0.6 2.1 0.2 0.6 0.2 Tennessee 49.5 18.3 20.4 7.2 2.3 1.9 0.3 0.1 Texas 64.6 17.1 14.6 1.8 0.1 1.1 0.7 # Utah 41.6 26.6 25.9 3.2 0.8 1.2 0.8 0.0 Vermont 58.6 10.1 10.6 16.2 3.8 0.2 0.3 0.1 Virginia 47.0 18.7 10.9 16.6 2.3 2.1 2.2 0.2 Washington 40.4 30.2 21.4 5.6 0.6 0.2 1.5 0.1 West Virginia 48.1 30.0 12.6 0.2 2.9 4.4 1.8 0.0 Wisconsin 60.4 19.8 14.0 2.4 0.7 0.7 1.8 0.2 Wyoming — — — — — — — — # Percentage was non-zero, but less than 0.05 or 5/100 of 1 percent. — Percentage cannot be calculated because data were not available. aPercentage of day spent inside the regular class is defined as the number of hours the student spends each day inside the regular classroom, divided by the total number of hours in the school day (including lunch, recess, and study periods), multiplied by 100. bStudents who received special education and related services outside the regular classroom for less than 21 percent of the school day were classified in the inside the regular class 80% or more of the day category. cSeparate school and residential facility are categories that include children with disabilities who receive special education and related services, at public expense, for greater than 50 percent of the school day in public or private separate day schools or residential facilities. dHomebound/hospital is a category that includes children with disabilities who receive special education and related services in hospital programs or homebound programs. eCorrectional facilities is a category that includes children with disabilities who receive special education and related services in short-term detention facilities or correctional facilities. fParentally placed in private school is a category that includes children with disabilities who have been enrolled by their parents or guardians in regular parochial or other private schools and whose basic education is paid through private resources and who receive special education and related services, at public expense, from a local education agency or intermediate educational unit under a service plan. NOTE: Percentage for each state was calculated by dividing the number of students ages 6 through 21 served under IDEA, Part B, by the state under the category of emotional disturbance who were reported in the educational environment by the total number of students ages 6 through 21 served under IDEA, Part B, by the state under the category of emotional disturbance, then multiplying the result by 100. Percentage for “All states” was calculated for all states with available data by dividing the number of students ages 6 through 21 served under IDEA, Part B, by all states under the category of emotional disturbance who were reported in the educational environment by the total number of students ages 6 through 21 served under IDEA, Part B, by all states under the category of emotional disturbance, then multiplying the result by 100. SOURCE: U.S. Department of Education, EDFacts Data Warehouse (EDW), OMB #1875-0240: “IDEA Part B Child Count and Educational Environments Collection,” 2014. Data were accessed fall 2015. For actual data used, go to http://www2.ed.gov/about/reports/annual/osep/index.html.

145
• In 2014, inside the regular class for 80% or more of the day accounted for a larger percentage (46.2 percent) of the students ages 6 through 21 served under IDEA, Part B, reported under the category of emotional disturbance in the 52 states (“All states”) for which data were available than any other category of educational environment. Moreover, this environment accounted for the largest percentage of students in 51 of the individual states. The percentage exceeded 50 percent in 23 states, including the following two states, in which the percentage exceeded 70 percent: Puerto Rico (79.4 percent) and Alabama (70.9 percent).
• The educational environment category of inside the regular class less than 40% of the day accounted for the largest percentage of students ages 6 through 21 served under IDEA, Part B, reported under the category of emotional disturbance in California (31.0 percent).

146
How did the states compare with regard to the distribution of students ages 6 through 21 served under IDEA, Part B, reported under the category of intellectual disabilities, by educational environment in 2014?
Exhibit 66. Percentage of students ages 6 through 21 served under IDEA, Part B, reported under the category of intellectual disabilities, by educational environment and state: Fall 2014
State
Inside the regular classa
Separate schoolc
Residential facilityd
Homebound/ hospitald
Correctional facilitye
Parentally placed in
private schoolf
80% or more of the dayb
40% to 79% of the day
Less than 40% of the day
All states 16.9 26.3 49.2 6.3 0.3 0.5 0.2 0.3 Alabama 43.4 20.3 31.5 3.3 1.1 0.3 0.0 0.1 Alaska 42.9 19.4 26.9 10.4 0.2 0.0 0.2 0.0 Arizona 7.2 16.8 72.5 2.8 # 0.6 0.2 # Arkansas 10.7 40.7 44.9 1.2 1.9 0.4 0.1 0.1 BIE schools 25.4 41.6 31.6 0.3 0.9 — — 0.3 California 6.1 15.0 69.5 8.6 0.1 0.5 0.1 0.1 Colorado 14.2 48.7 34.2 2.4 0.2 0.2 # 0.1 Connecticut 36.1 43.8 11.0 8.3 0.3 0.2 0.3 # Delaware 13.2 16.3 56.6 12.6 0.3 0.8 0.1 0.0 District of Columbia 8.9 19.6 46.4 23.5 0.8 0.0 0.5 0.3 Florida 15.5 12.6 56.6 13.3 0.1 0.6 0.5 0.8 Georgia 19.2 21.6 56.3 1.5 0.5 0.7 0.2 0.1 Hawaii 8.9 30.4 60.0 0.2 0.3 0.2 0.0 0.1 Idaho 14.3 44.4 39.7 0.8 0.1 0.2 0.4 0.1 Illinois 4.8 29.0 49.7 15.5 0.5 0.2 0.1 0.2 Indiana 27.8 26.4 42.8 0.8 0.3 0.7 0.2 0.9 Iowa 64.9 23.2 8.6 1.1 0.7 0.1 0.5 1.0 Kansas 15.5 43.1 35.8 4.4 0.6 0.1 0.3 0.3 Kentucky 42.3 35.2 20.6 0.5 0.3 0.9 0.1 0.2 Louisiana 18.2 33.5 46.3 0.2 0.3 1.2 0.2 0.0 Maine 8.0 36.4 52.3 2.9 0.3 0.1 0.0 0.0 Maryland 14.6 18.9 57.8 8.0 0.1 0.2 0.3 0.1 Massachusetts 12.4 20.6 58.2 6.4 1.1 0.1 0.1 1.0 Michigan 15.3 22.5 43.5 17.4 0.2 0.1 0.5 0.4 Minnesota 8.0 38.0 44.1 8.8 0.1 0.4 # 0.6 Mississippi 13.2 19.8 64.8 0.6 1.3 0.4 0.0 # Missouri 8.5 46.6 35.4 8.0 # 0.7 0.5 0.3 Montana 7.9 46.2 44.8 0.2 0.2 0.0 0.0 0.7 Nebraska 30.2 29.2 35.4 3.9 0.3 0.4 0.1 0.6 Nevada 5.2 17.4 73.9 3.0 0.0 0.5 0.2 0.0 New Hampshire 18.8 28.1 46.2 3.1 0.9 0.1 0.0 2.8 New Jersey 5.2 23.0 54.6 15.7 0.3 0.3 # 0.9 New Mexico 9.8 21.0 68.3 0.1 0.5 0.3 0.1 0.0 New York 6.0 15.7 56.1 21.1 0.4 0.2 0.1 0.5 See notes at end of exhibit.

147
Exhibit 66. Percentage of students ages 6 through 21 served under IDEA, Part B, reported under the category of intellectual disabilities, by educational environment and state: Fall 2014—Continued
State
Inside the regular classa
Separate schoolc
Residential facilityd
Homebound/ hospitald
Correctional facilitye
Parentally placed in
private schoolf
80% or more of the dayb
40% to 79% of the day
Less than 40% of the day
North Carolina 15.3 26.1 53.7 4.0 0.2 0.7 0.1 # North Dakota 13.2 54.2 29.9 0.8 1.3 0.1 0.0 0.4 Ohio 32.7 38.6 25.8 1.3 0.1 0.4 0.4 0.8 Oklahoma 16.5 37.4 44.8 0.1 0.4 0.6 0.1 0.1 Oregon 14.0 32.0 52.0 1.2 0.0 0.3 # 0.3 Pennsylvania 10.3 33.7 45.3 9.5 0.6 0.3 0.1 0.1 Puerto Rico 45.7 4.6 33.1 14.0 — 0.8 0.3 1.5 Rhode Island 21.4 22.3 50.1 5.3 0.8 0.1 0.0 0.0 South Carolina 6.7 17.7 71.4 1.7 0.4 1.6 0.4 0.1 South Dakota 14.6 57.5 22.9 2.1 2.2 0.0 0.1 0.6 Tennessee 14.7 21.8 58.9 2.6 0.5 0.9 0.1 0.4 Texas 12.8 25.4 59.4 1.7 0.1 0.5 # 0.1 Utah 6.4 24.4 60.1 8.6 # 0.3 0.1 0.0 Vermont 42.7 34.0 18.5 3.8 0.7 0.0 0.0 0.3 Virginia 12.5 30.9 50.8 4.2 0.4 0.8 0.2 0.1 Washington 5.1 32.3 61.8 0.4 # 0.1 # 0.3 West Virginia 21.9 48.0 27.8 0.1 0.4 1.6 0.2 # Wisconsin 14.2 36.9 44.8 3.1 0.3 0.3 0.2 0.2 Wyoming — — — — — — — — # Percentage was non-zero, but less than 0.05 or 5/100 of 1 percent. — Percentage cannot be calculated because data were not available. aPercentage of day spent inside the regular class is defined as the number of hours the student spends each day inside the regular classroom, divided by the total number of hours in the school day (including lunch, recess, and study periods), multiplied by 100. bStudents who received special education and related services outside the regular classroom for less than 21 percent of the school day were classified in the inside the regular class 80% or more of the day category. cSeparate school and residential facility are categories that include children with disabilities who receive special education and related services, at public expense, for greater than 50 percent of the school day in public or private separate day schools or residential facilities. dHomebound/hospital is a category that includes children with disabilities who receive special education and related services in hospital programs or homebound programs. eCorrectional facilities is a category that includes children with disabilities who receive special education and related services in short-term detention facilities or correctional facilities. fParentally placed in private schools is a category that includes children with disabilities who have been enrolled by their parents or guardians in regular parochial or other private schools and whose basic education is paid through private resources and who receive special education and related services, at public expense, from a local education agency or intermediate educational unit under a service plan. NOTE: Percentage for each state was calculated by dividing the number of students ages 6 through 21 served under IDEA, Part B, by the state under the category of intellectual disabilities who were reported in the educational environment by the total number of students ages 6 through 21 served under IDEA, Part B, by the state under the category of intellectual disabilities, then multiplying the result by 100. Percentage for “All states” was calculated by dividing the number of students ages 6 through 21 served under IDEA, Part B, by all states under the category of intellectual disabilities who were reported in the educational environment by the total number of students ages 6 through 21 served under IDEA, Part B, by all states under the category of intellectual disabilities, then multiplying the result by 100. SOURCE: U.S. Department of Education, EDFacts Data Warehouse (EDW), OMB #1875-0240: “IDEA Part B Child Count and Educational Environments Collection,” 2014. Data were accessed fall 2015. For actual data used, go to http://www2.ed.gov/about/reports/annual/osep/index.html.

148
• In 2014, a larger percentage (49.2 percent) of the students ages 6 through 21 served under IDEA, Part B, who were reported under the category of intellectual disabilities in the 52 states (“All states”) for which data were available were educated inside the regular class less than 40% of the day than in any other category of educational environment. Moreover, this environment accounted for the largest percentage of students in 35 of the individual states. The percentage exceeded 50 percent in 23 states, including the following three states in which the percentage exceeded 70 percent: Nevada (73.9 percent), Arizona (72.5 percent), and South Carolina (71.4 percent).
• The educational environment category of inside the regular class no more than 79% of the day and no less than 40% of the day accounted for the largest percentage of students ages 6 through 21 served under IDEA, Part B, reported under the category of intellectual disabilities in 11 states. The percentage of students accounted for by this category exceeded 50 percent in South Dakota (57.5 percent) and North Dakota (54.2 percent).
• In six states, the educational environment category of inside the regular class 80% or more of the day accounted for the largest percentage of students ages 6 through 21 served under IDEA, Part B, reported under the category of intellectual disabilities. The six states were: Iowa (64.9 percent), Puerto Rico (45.7 percent), Alabama (43.4 percent), Alaska (42.9 percent), Vermont (42.7 percent), and Kentucky (42.3 percent).

149
Part B Participation on State Assessments
How did the states compare with regard to the percentages of students served under IDEA, Part B, in grades 4, 8, and high school who participated in state math assessments, by assessment type in school year 2013–14?
Exhibit 67. Percentages of students served under IDEA, Part B, in grades 4, 8, and high school who participated in state math assessments, by assessment type and state: School year 2013–14
State
Regular assessment (grade-level standards)a
Alternate assessmentb Grade-level standardsc Modified standardsd Alternate standardse
Grade 4 Grade 8 High
school Grade 4 Grade 8 High
school Grade 4 Grade 8 High
school Grade 4 Grade 8 High
school All states 85.1 82.7 85.6 0.0 # # 5.9 7.6 4.4 9.0 9.8 10.0
Alabama 90.9 89.6 89.5 — — — — — — 9.1 10.4 10.5 Alaska 92.8 91.4 92.5 — — — — — — 7.2 8.6 7.5 Arizona 91.3 90.5 90.0 — — — — — — 8.7 9.5 10.0 Arkansas 87.6 85.5 57.4 — — — — — — 12.4 14.5 42.6 BIE schools — — — — — — — — — — — — California 92.3 92.0 90.8 — — — — — — 7.7 8.0 9.2 Colorado 90.4 90.4 90.5 — — — — — — 9.6 9.6 9.5 Connecticut 86.6 87.4 83.3 — — — 1.6 2.2 2.8 11.8 10.4 13.9 Delaware 91.8 91.0 88.5 — — — — — — 8.2 9.0 11.5 District of Columbia 92.8 91.8 96.3 — — — — — — 7.2 8.2 3.7 Florida 90.4 88.6 86.7 — — — — — — 9.6 11.4 13.3 Georgia 73.7 62.9 89.3 — — — 18.1 26.1 — 8.1 11.0 10.7 Hawaii 90.8 94.0 95.7 — — — — — — 9.2 6.0 4.3 Idaho 90.9 89.0 89.8 — — — — — — 9.1 11.0 10.2 Illinois 91.8 91.2 89.1 — — — — — — 8.2 8.8 10.9 Indiana 75.9 73.5 87.8 — — — 17.5 16.5 0.0 6.5 10.0 12.2 Iowa 94.3 94.1 93.9 — — — — — — 5.7 5.9 6.1 Kansas — — — — — — — — — — — — Kentucky 92.7 89.5 86.3 — — — — — — 7.3 10.5 13.7 Louisiana 63.9 44.9 87.3 — — — 29.4 45.4 — 6.7 9.7 12.7 Maine 90.8 90.4 89.5 — — — — — — 9.2 9.6 10.5 See notes at end of exhibit.

150
Exhibit 67. Percentages of students served under IDEA, Part B, in grades 4, 8, and high school who participated in state math assessments, by assessment type and state: School year 2013–14—Continued
State
Regular assessment (grade-level standards)a
Alternate assessmentb Grade-level standardsc Modified standardsd Alternate standardse
Grade 4 Grade 8 High
school Grade 4 Grade 8 High
school Grade 4 Grade 8 High
school Grade 4 Grade 8 High
school Maryland 92.1 90.1 55.2 — — — — — 33.7 7.9 9.9 11.1 Massachusetts 90.6 91.0 92.7 0.0 # 0.1 — — — 9.4 9.0 7.2 Michigan 64.2 61.6 79.3 — — — 20.2 21.2 0.0 15.6 17.2 20.7 Minnesota 91.1 64.3 73.8 — — — — 25.0 14.9 8.9 10.8 11.3 Mississippi 89.0 87.0 90.1 — — — — — — 11.0 13.0 9.9 Missouri 90.5 88.8 88.8 — — — — — — 9.5 11.2 11.2 Montana 92.0 91.6 89.3 — — — — — — 8.0 8.4 10.7 Nebraska 91.9 89.3 88.3 — — — — — — 8.1 10.7 11.7 Nevada 88.7 91.0 91.3 — — — — — — 11.3 9.0 8.7 New Hampshire 94.2 94.5 100.0 — — — — — — 5.8 5.5 0.0 New Jersey 92.9 92.4 92.5 — — — — — — 7.1 7.6 7.5 New Mexico 93.4 92.5 93.4 — — — — — — 6.6 7.5 6.6 New York 91.4 90.5 91.4 — — — — — — 8.6 9.5 8.6 North Carolina 76.5 69.9 75.0 — — — 16.5 21.6 17.1 7.0 8.5 7.9 North Dakota 74.3 69.9 71.7 — — — 16.2 21.9 17.8 9.5 8.2 10.6 Ohio 87.6 87.6 89.0 — — — — — — 12.4 12.4 11.0 Oklahoma 91.8 92.3 90.5 — — — — — 0.1 8.2 7.7 9.4 Oregon 87.0 88.6 89.2 — — — — — — 13.0 11.4 10.8 Pennsylvania 89.8 89.7 90.1 — — — — — — 10.2 10.3 9.9 Puerto Rico 97.0 96.5 95.4 — — — — — — 3.0 3.5 4.6 Rhode Island 92.6 93.6 94.4 — — — — — — 7.4 6.4 5.6 South Carolina 93.5 95.7 94.0 — — — — — — 6.5 4.3 6.0 South Dakota 90.2 86.8 82.9 — — — — — — 9.8 13.2 17.1 Tennessee 69.5 60.3 88.9 — — — 23.2 29.7 — 7.2 10.0 11.1 Texas 52.2 46.3 59.9 — — — 35.8 42.6 32.1 12.1 11.0 8.0 Utah 93.2 89.7 99.9 — — — — — — 6.8 10.3 0.1 See notes at end of exhibit.

151
Exhibit 67. Percentages of students served under IDEA, Part B, in grades 4, 8, and high school who participated in state math assessments, by assessment type and state: School year 2013–14—Continued
State
Regular assessment (grade-level standards)a
Alternate assessmentb Grade-level standardsc Modified standardsd Alternate standardse
Grade 4 Grade 8 High
school Grade 4 Grade 8 High
school Grade 4 Grade 8 High
school Grade 4 Grade 8 High
school Vermont 93.5 95.2 97.0 — — — — — — 6.5 4.8 3.0 Virginia 82.2 81.5 94.4 0.0 0.0 — 9.3 8.3 1.9 8.5 10.2 3.7 Washington 92.0 92.4 91.2 — — — — — — 8.0 7.6 8.8 West Virginia 92.1 89.8 88.3 — — — — — — 7.9 10.2 11.7 Wisconsin 90.4 89.6 90.8 — — — — — — 9.6 10.4 9.2 Wyoming 94.3 93.7 87.5 — — — — — — 5.7 6.3 12.5 — Percentage cannot be calculated because data were not available. # Percentage was non-zero, but less than 0.05 or 5/100 of 1 percent. aRegular assessment based on grade-level academic achievement standards is an assessment that is designed to measure the student’s knowledge and skills in a particular subject matter based on academic achievement content for the grade in which the student is enrolled. Students who participated in a field test of a regular assessment are included with those who participated in a non-field test of a regular assessment. bAlternate assessment is an assessment that is designed to measure the performance of students who are unable to participate in regular assessments even with accommodations. The student’s individualized education program (IEP) team makes the determination of whether a student is able to take the regular assessment. cAlternate assessment based on grade-level academic achievement standards is an alternate assessment that is designed to measure the academic achievement of students with disabilities based on the same grade-level achievement standards measured by the state’s regular assessment. dAlternate assessment based on modified academic achievement standards is an alternate assessment that is designed to measure the academic achievement of students with disabilities who access the general grade-level curriculum, but whose disabilities have precluded them from achieving grade-level proficiency and who (as determined by the IEP team) are not expected to achieve grade-level proficiency within the year covered by the IEP. eAlternate assessment based on alternate academic achievement standards is an alternate assessment that is designed to measure the academic achievement of students with the most significant cognitive disabilities. This assessment may yield results that measure the achievement standards that the state has defined under 34 C.F.R. section 200.1(d). Students who participated in a field test of an alternate assessment based on alternate academic achievement standards are included with those who participated in a non-field test of an alternate assessment based on alternate academic achievement standards. NOTE: Percentage for each state was calculated by dividing the number of students served under IDEA, Part B, by the state who were in the grade level and participated in the specific content area assessment and received a valid score and achievement level by the sum of the students served under IDEA, Part B, by the state who participated in an assessment and students served under IDEA, Part B, by the state who did not participate in an assessment, then multiplying the result by 100. Percentage for “All states” was calculated for all states for which data were available by dividing the number of students served under IDEA, Part B, by all states who were in the grade level and participated in the specific content area assessment and received a valid score and achievement level by the sum of the students served under IDEA, Part B, by all states who participated in an assessment and students served under IDEA, Part B, by all states who did not participate in an assessment, then multiplying the result by 100. SOURCE: U.S. Department of Education, EDFacts Data Warehouse (EDW), OMB #1875-0240: “IDEA Part B Assessment Collection,” 2013–14. Data were accessed fall 2015. For actual data used, go to http://www2.ed.gov/about/reports/annual/osep/index.html.

152
• A regular assessment based on grade-level academic achievement standards in math was administered by all of the states for which data were available to some students in grade 4 (51 states), some students in grade 8 (51 states), and some students in high school (51 states). An alternate assessment based on grade-level academic achievement standards was not administered to any students in grade 4 by the two states for which data were available, but was administered to some students in grade 8 by one of the two states for which data were available and to some students in high school by the one state for which data were available. An alternate assessment based on modified academic achievement standards was administered to some students in grade 4 by all 10 of the states for which data were available, some students in grade 8 by all 11 of the states for which data were available, and some students in high school by eight of the 10 states for which data were available. An alternate assessment based on alternate academic achievement standards was administered by all of the states for which data were available to some students in grade 4 (51 states) and some students in grade 8 (51 states) and by 50 of the 51 states for which data were available to some students in high school.
• Of the four types of state math assessments, a regular assessment based on grade-level academic achievement standards was taken by larger percentages of the students with disabilities in “All states” for which data were available in grade 4 (85.1 percent), grade 8 (82.7 percent), and high school (85.6 percent).
• Compared to the other types of state math assessments, a regular assessment based on grade-level academic achievement standards was also taken by a larger percentage of students with disabilities in grade 4 in all 51 individual states, in grade 8 in 50 of the 51 individual states, and in high school in all 51 individual states. An alternate assessment based on modified academic achievement standards was the most prevalent type of assessment taken by students with disabilities in grade 8 in Louisiana (45.4 percent).

153
How did the states compare with regard to the percentages of students served under IDEA, Part B, in grades 4, 8, and high school who participated in state reading assessments, by assessment type and student grade level in 2013–14?
Exhibit 68. Percentages of students served under IDEA, Part B, in grades 4, 8, and high school who participated in state reading assessments, by assessment type and state: School year 2013–14
State
Regular assessment (grade-level standards)a
Alternate assessmentb Grade-level standardsc Modified standardsd Alternate standardse
Grade 4 Grade 8 High
school Grade 4 Grade 8 High
school Grade 4 Grade 8 High
school Grade 4 Grade 8 High
school All states 84.6 83.2 84.2 # # # 6.3 7.2 6.3 9.0 9.7 9.5
Alabama 90.9 89.6 89.5 — — — — — — 9.1 10.4 10.5 Alaska 92.7 91.4 92.5 — — — — — — 7.3 8.6 7.5 Arizona 91.3 90.5 90.1 — — — — — — 8.7 9.5 9.9 Arkansas 87.6 85.5 76.8 — — — — — — 12.4 14.5 23.2 BIE schools — — — — — — — — — — — — California 92.3 92.0 91.1 — — — — — — 7.7 8.0 8.9 Colorado 90.3 90.3 90.5 — — — — — — 9.7 9.7 9.5 Connecticut 86.1 87.5 83.7 — — — 2.1 2.2 2.4 11.8 10.3 14.0 Delaware 91.8 91.0 88.2 — — — — — — 8.2 9.0 11.8 District of Columbia 92.7 91.8 96.3 — — — — — — 7.3 8.2 3.7 Florida 90.4 88.5 88.4 — — — — — — 9.6 11.5 11.6 Georgia 76.6 70.9 87.7 — — — 15.3 18.1 — 8.1 11.0 12.3 Hawaii 91.0 93.9 96.0 — — — — — — 9.0 6.1 4.0 Idaho 90.6 89.1 90.1 — — — — — — 9.4 10.9 9.9 Illinois 91.8 91.2 89.1 — — — — — — 8.2 8.8 10.9 Indiana 75.3 72.6 87.7 — — — 18.1 17.4 0.0 6.6 10.0 12.3 Iowa 94.1 94.2 93.9 — — — — — — 5.9 5.8 6.1 Kansas — — — — — — — — — — — — Kentucky 92.7 89.5 88.8 — — — — — — 7.3 10.5 11.2 Louisiana 62.9 45.4 86.7 — — — 30.4 44.9 — 6.7 9.7 13.3 Maine 90.7 90.3 89.5 — — — — — — 9.3 9.7 10.5 Maryland 92.1 90.1 56.4 — — — — — 32.1 7.9 9.9 11.5 See notes at end of exhibit.

154
Exhibit 68. Percentages of students served under IDEA, Part B, in grades 4, 8, and high school who participated in state reading assessments, by assessment type and state: School year 2013–14—Continued
State
Regular assessment (grade-level standards)a
Alternate assessmentb Grade-level standardsc Modified standardsd Alternate standardse
Grade 4 Grade 8 High
school Grade 4 Grade 8 High
school Grade 4 Grade 8 High
school Grade 4 Grade 8 High
school Massachusetts 90.4 91.5 92.7 # # 0.1 — — — 9.6 8.5 7.2 Michigan 58.5 61.5 79.5 — — — 25.2 21.6 0.0 16.3 17.0 20.5 Minnesota 90.7 66.9 75.5 — — — — 22.6 14.2 9.3 10.6 10.3 Mississippi 88.9 87.0 90.0 — — — — — — 11.1 13.0 10.0 Missouri 90.5 89.2 89.2 — — — — — — 9.5 10.8 10.8 Montana 92.0 91.6 89.5 — — — — — — 8.0 8.4 10.5 Nebraska 91.9 89.6 88.6 — — — — — — 8.1 10.4 11.4 Nevada 88.7 90.8 91.3 — — — — — — 11.3 9.2 8.7 New Hampshire 94.2 94.6 100.0 — — — — — — 5.8 5.4 0.0 New Jersey 92.8 92.5 92.6 — — — — — — 7.2 7.5 7.4 New Mexico 93.2 92.4 93.4 — — — — — — 6.8 7.6 6.6 New York 91.5 90.8 90.9 — — — — — — 8.5 9.2 9.1 North Carolina 74.0 68.0 74.0 — — — 19.0 23.5 18.2 7.0 8.5 7.8 North Dakota 68.1 67.3 72.1 — — — 21.9 24.9 18.0 10.0 7.9 9.9 Ohio 87.6 87.7 89.0 — — — — — — 12.4 12.3 11.0 Oklahoma 91.9 92.5 90.5 — — — — — # 8.1 7.5 9.4 Oregon 84.9 89.7 89.6 — — — — — — 15.1 10.3 10.4 Pennsylvania 89.8 89.7 90.1 — — — — — — 10.2 10.3 9.9 Puerto Rico 97.0 96.5 95.4 — — — — — — 3.0 3.5 4.6 Rhode Island 92.6 93.7 94.4 — — — — — — 7.4 6.3 5.6 South Carolina 93.4 95.7 94.0 — — — — — — 6.6 4.3 6.0 South Dakota 90.1 86.8 82.9 — — — — — — 9.9 13.2 17.1 Tennessee 69.3 60.4 89.7 — — — 23.5 29.7 — 7.2 9.9 10.3 Texas 48.6 48.5 64.9 — — — 39.3 40.6 27.9 12.1 10.9 7.3 Utah 93.2 89.9 89.0 — — — — — — 6.8 10.1 11.0 Vermont 93.0 95.2 97.1 — — — — — — 7.0 4.8 2.9 See notes at end of exhibit.

155
Exhibit 68. Percentages of students served under IDEA, Part B, in grades 4, 8, and high school who participated in state reading assessments, by assessment type and state: School year 2013–14—Continued
State
Regular assessment (grade-level standards)a
Alternate assessmentb Grade-level standardsc Modified standardsd Alternate standardse
Grade 4 Grade 8 High
school Grade 4 Grade 8 High
school Grade 4 Grade 8 High
school Grade 4 Grade 8 High
school Virginia 81.2 84.5 89.0 1.3 0.1 — 9.0 6.4 2.1 8.5 9.0 8.9 Washington 91.9 92.5 100.0 — — — — — — 8.1 7.5 x West Virginia 92.1 89.9 88.3 — — — — — — 7.9 10.1 11.7 Wisconsin 90.4 89.6 90.8 — — — — — — 9.6 10.4 9.2 Wyoming 94.3 93.7 87.5 — — — — — — 5.7 6.3 12.5 — Percentage cannot be calculated because data were not available. # Percentage was non-zero, but less than 0.05 or 5/100 of 1 percent. x Data suppressed to limit disclosure. aRegular assessment based on grade-level academic achievement standards is an assessment that is designed to measure the student’s knowledge and skills in a particular subject matter based on academic achievement standards appropriate to the student’s grade level. Students who participated in a field test of a regular assessment are included with those who participated in a non-field test of a regular assessment. bAlternate assessment is an assessment that is designed to measure the performance of students who are unable to participate in general large-scale assessments even with accommodations. The student’s individualized education program (IEP) team makes the determination of whether a student is able to take the regular assessment. cAlternate assessment based on grade-level academic achievement standards is an alternate assessment that is designed to measure the academic achievement of students with disabilities based on the same grade-level achievement standards measured by the state’s regular assessment. dAlternate assessment based on modified academic achievement standards is an alternate assessment that is designed to measure the academic achievement of students with disabilities who access the general grade-level curriculum, but whose disabilities have precluded them from achieving grade-level proficiency and who (as determined by the IEP team) are not expected to achieve grade-level proficiency within the year covered by the IEP. eAlternate assessment based on alternate academic achievement standards is an alternate assessment that is designed to measure the academic achievement of students with the most significant cognitive disabilities. This assessment may yield results that measure the achievement standards that the state has defined under 34 C.F.R. section 200.1(d). Students who participated in a field test of an alternate assessment based on alternate academic achievement standards are included with those who participated in a non-field test of an alternate assessment based on alternate academic achievement standards. NOTE: Percentage for each state was calculated by dividing the number of students served under IDEA, Part B, by the state who were in the grade level and participated in the specific content area assessment and received a valid score and achievement level by the sum of the students served under IDEA, Part B, by the state who participated in an assessment and students served under IDEA, Part B, by the state who did not participate in an assessment, then multiplying the result by 100. Percentage for “All states” was calculated for all states for which data were available by dividing the number of students served under IDEA, Part B, by all states who were in the grade level and participated in the specific content area assessment and received a valid score and achievement level by the sum of the students served under IDEA, Part B, by all states who participated in an assessment and students served under IDEA, Part B, by all states who did not participate in an assessment, then multiplying the result by 100.The students who participated in the regular reading assessments include students with limited English proficiency served under IDEA, Part B, who at the time of the reading assessments, had been in the United States fewer than 12 months and took the English language proficiency tests in place of the regular reading assessments. In the case of Puerto Rico, language proficiency is determined with regard to Spanish. SOURCE: U.S. Department of Education, EDFacts Data Warehouse (EDW), OMB #1875-0240: “IDEA Part B Assessment Collection,” 2013–14. Data were accessed fall 2015. For actual data used, go to http://www2.ed.gov/about/reports/annual/osep/index.html.

156
• A regular assessment based on grade-level academic achievement standards in reading was administered by all 51 states for which data were available to some students in each of grades 4 and 8 and high school. An alternate assessment based on grade-level academic achievement standards was administered to some students in each of grades 4 and 8 by the two states for which data were available and to some students in high school by the only state for which data were available. An alternate assessment based on modified academic achievement standards was administered to some students in grade 4 by all of the 10 states for which data were available, some students in grade 8 by all of the 11 states for which data were available, and some students in high school by eight of the 10 states for which data were available. An alternate assessment based on alternate academic achievement standards was administered by all 51 of the states for which data were available to some students in each of grades 4 and 8, and by 50 of the 51 states for which data were available to some students in high school.
• Of the four types of state reading assessments, a regular assessment based on grade-level academic achievement standards was taken by larger percentages of the students with disabilities in “All states” in grade 4 (84.6 percent), grade 8 (83.2 percent), and high school (84.2 percent).
• Compared to the other types of reading assessments, a regular assessment based on grade-level academic achievement standards was taken by a larger percentage of students with disabilities in each of grades 4 and 8 and high school in all 51 of the individual states for which data were available.

157
Part B Exiting
How did the states compare with regard to the percentages of students ages 14 through 21 served under IDEA, Part B, exiting IDEA, Part B, and school by graduating or dropping out in 2013–14, and how did the percentages change between 2008–09 and 2013–14?
Exhibit 69. Percentages of students ages 14 through 21 exiting IDEA, Part B, and school who graduated with a regular high school diploma or dropped out of school, by year and state: 2008–09 and 2013–14
State 2008–09 2013–14 Change between 2008–09
and 2013–14a Percent change between 2008–09 and 2013–14b
Graduatedc Dropped outd Graduatedc Dropped outd Graduatedc Dropped outd Graduatedc Dropped outd All states 60.6 22.4 66.1 18.4 5.5 -3.9 9.1 -17.6
Alabama 33.5 12.7 75.6 10.7 42.1 -1.9 125.7 -15.4 Alaska 52.6 31.7 48.0 34.8 -4.6 3.1 -8.8 9.7 Arizona 78.2 21.0 75.3 24.1 -2.8 3.1 -3.6 14.6 Arkansas 81.2 16.2 85.1 12.0 3.9 -4.2 4.7 -25.9 BIE schools 35.6 53.3 x x — — — — California 49.4 23.1 50.7 17.5 1.3 -5.6 2.7 -24.1 Colorado 60.1 33.0 69.8 25.4 9.7 -7.6 16.1 -23.0 Connecticut 75.8 18.7 84.2 13.6 8.3 -5.1 11.0 -27.4 Delaware 59.0 33.4 82.1 11.8 23.1 -21.6 39.1 -64.6 District of Columbia 44.2 48.2 62.0 30.0 17.8 -18.2 40.2 -37.7 Florida 49.8 24.0 59.9 19.2 10.1 -4.8 20.3 -19.9 Georgia 40.5 27.9 44.7 28.8 4.2 0.9 10.3 3.3 Hawaii 80.5 2.8 75.9 17.4 -4.6 14.6 -5.7 530.2 Idaho 43.5 20.4 74.1 20.7 30.6 0.2 70.2 1.1 Illinois 77.9 19.1 79.8 16.0 1.8 -3.1 2.3 -16.1 Indiana 58.5 26.8 77.1 6.9 18.6 -19.9 31.7 -74.1 Iowa 67.0 28.8 80.4 17.5 13.4 -11.2 19.9 -39.0 Kansas 74.2 23.5 83.5 15.2 9.3 -8.3 12.6 -35.4 Kentucky 72.1 18.7 76.2 12.2 4.2 -6.5 5.8 -34.8 Louisiana 27.2 43.5 48.3 27.6 21.1 -15.8 77.7 -36.5 Maine 73.9 23.6 78.4 18.6 4.6 -5.0 6.2 -21.3 See notes at end of exhibit.

158
Exhibit 69. Percentages of students ages 14 through 21 exiting IDEA, Part B, and school who graduated with a regular high school diploma or dropped out of school, by year and state: 2008–09 and 2013–14—Continued
State 2008–09 2013–14 Change between 2008–09
and 2013–14a Percent change between 2008–09 and 2013–14b
Graduatedc Dropped outd Graduatedc Dropped outd Graduatedc Dropped outd Graduatedc Dropped outd Maryland 62.3 24.8 67.5 20.5 5.2 -4.3 8.3 -17.5 Massachusetts 70.7 21.6 72.0 17.0 1.3 -4.6 1.8 -21.3 Michigan 66.2 31.4 65.6 26.8 -0.6 -4.5 -0.9 -14.5 Minnesota 89.0 10.7 88.3 10.7 -0.7 -0.1 -0.8 -0.8 Mississippi 24.3 13.4 31.2 9.9 6.9 -3.5 28.3 -26.3 Missouri 74.6 24.1 83.8 14.2 9.3 -10.0 12.4 -41.3 Montana 73.6 24.6 76.4 22.5 2.8 -2.1 3.8 -8.7 Nebraska 79.9 15.4 84.3 12.9 4.4 -2.5 5.5 -16.3 Nevada 28.3 35.0 31.2 48.2 2.9 13.2 10.2 37.6 New Hampshire 72.1 20.9 82.0 7.8 9.9 -13.1 13.7 -62.6 New Jersey 79.5 18.3 84.9 12.5 5.3 -5.8 6.7 -31.5 New Mexico 63.9 13.8 31.7 23.7 -32.2 9.9 -50.3 71.9 New York 52.4 25.6 66.3 18.0 13.9 -7.7 26.5 -29.9 North Carolina 58.2 31.9 71.8 22.9 13.6 -9.0 23.4 -28.2 North Dakota 68.3 27.4 72.6 21.3 4.3 -6.1 6.3 -22.4 Ohio 47.1 11.3 46.7 16.7 -0.4 5.4 -0.9 47.8 Oklahoma 77.1 22.2 80.9 18.6 3.7 -3.6 4.8 -16.2 Oregon 46.7 25.4 43.8 28.9 -2.8 3.5 -6.1 13.7 Pennsylvania 87.3 11.1 86.0 12.2 -1.3 1.1 -1.5 9.9 Puerto Rico 59.4 33.0 58.1 35.0 -1.3 2.0 -2.2 6.2 Rhode Island 71.4 22.4 82.6 9.1 11.2 -13.3 15.7 -59.3 South Carolina 40.4 52.5 45.7 40.5 5.3 -12.0 13.2 -22.8 South Dakota 78.2 18.7 76.5 21.2 -1.7 2.5 -2.2 13.2 Tennessee 66.0 12.3 76.3 9.5 10.3 -2.8 15.6 -22.5 Texas 47.5 20.7 57.2 15.5 9.7 -5.2 20.5 -25.0 Utah 68.5 21.8 52.6 42.0 -15.9 20.1 -23.3 92.1 Vermont — — 75.3 20.9 — — — — See notes at end of exhibit.

159
Exhibit 69. Percentages of students ages 14 through 21 exiting IDEA, Part B, and school who graduated with a regular high school diploma or dropped out of school, by year and state: 2008–09 and 2013–14—Continued
State 2008–09 2013–14 Change between 2008–09
and 2013–14a Percent change between 2008–09 and 2013–14b
Graduatedc Dropped outd Graduatedc Dropped outd Graduatedc Dropped outd Graduatedc Dropped outd Virginia 47.3 14.2 55.0 9.6 7.7 -4.6 16.3 -32.6 Washington 68.7 27.3 74.3 22.0 5.6 -5.3 8.2 -19.4 West Virginia 65.9 25.5 75.5 13.3 9.5 -12.2 14.4 -47.9 Wisconsin 75.3 20.5 76.4 18.5 1.2 -2.0 1.6 -10.0 Wyoming 54.8 35.6 58.2 30.1 3.5 -5.5 6.3 -15.4 x Data suppressed to limit disclosure. — Percentage cannot be calculated because data were not available. aChange between 2008–09 and 2013–14 was calculated for each state and “All states” by subtracting the percentage for 2008–09 from the percentage for 2013–14. Due to rounding, it may not be possible to reproduce the difference from the values presented in the exhibit. bPercent change between 2008–09 and 2013–14 was calculated for each state and “All states” by subtracting the percentage for 2008–09 from the percentage for 2013–14, dividing the difference by the percentage for 2008–09, then multiplying the result by 100. Due to rounding, it may not be possible to reproduce the percent change from the values presented in the exhibit. cGraduated with a regular high school diploma refers to students ages 14 through 21 served under IDEA, Part B, who exited an educational program through receipt of a high school diploma identical to that for which students without disabilities were eligible. These were students with disabilities who met the same standards for graduation as those for students without disabilities. dDropped out refers to students ages 14 through 21 served under IDEA, Part B, who were enrolled at the start of the reporting period, were not enrolled at the end of the reporting period, and did not exit special education through any other basis, such as moved, known to be continuing. NOTE: The U.S. Department of Education collects data on seven categories of exiters from special education (i.e., the Part B program in which the student was enrolled at the start of the reporting period). The categories include five categories of exiters from both special education and school (i.e., graduated with a regular high school diploma, received a certificate, dropped out, reached maximum age for services, and died) and two categories of exiters from special education, but not school (i.e., transferred to regular education and moved, known to be continuing in education). The seven categories are mutually exclusive. This exhibit provides percentages for only two categories of exiters from both special education and school (i.e., graduated with a regular high school diploma and dropped out). For data on all seven categories of exiters, see exhibit 70. Percentage for each state was calculated by dividing the number of students ages 14 through 21 served under IDEA, Part B, by the state who were reported in the exit reason category for the year by the total number of students ages 14 through 21 served under IDEA, Part B, by the state who were reported in the five exit-from-both-special education-and-school categories for that year, then multiplying the result by 100. Percentage for “All states” was calculated for all states with available data by dividing the number of students ages 14 through 21 served under IDEA, Part B, by all states who were reported in the exit reason category for the year by the total number of students ages 14 through 21 served under IDEA, Part B, by all states who were reported in the five exit-from-both-special education-and-school categories for that year, then multiplying the result by 100. The percentages of students who exited special education and school by graduating and dropping out included in this report are not comparable to the graduation and dropout rates required under the Elementary and Secondary Education Act of 1965, as amended (ESEA). The factors used to calculate percentages of students who exited special education and school by graduating and dropping out are different from those used to calculate graduation and dropout rates. In particular, states often rely on factors such as the number of students who graduated in four years with a regular high school diploma and the number of students who entered high school four years earlier to determine their graduation and dropout rates under ESEA. For 2008–09, data are from the reporting period between July 1, 2008, and June 30, 2009. For 2013–14, data are from the reporting period between July 1, 2013, and June 30, 2014. SOURCE: U.S. Department of Education, EDFacts Data Warehouse (EDW), OMB #1875-0240: “IDEA Part B Exiting Collection,” 2008–09 and 2013–14. Data for 2008–09 were accessed spring 2012. Data for 2013–14 were accessed fall 2015. For actual data used, go to http://www2.ed.gov/about/reports/annual/osep/index.html.

160
• In 2013–14, a total of 66.1 percent of students ages 14 through 21 who exited services under IDEA, Part B, and school in the 52 states (“All states”) for which data were available graduated with a regular high school diploma. In the following three states, less than 40 percent of the students who exited services under IDEA, Part B, and school graduated with a regular high school diploma: New Mexico (31.7 percent), Mississippi (31.2 percent), and Nevada (31.2 percent). In contrast, more than 80 percent of such students graduated with a regular high school diploma in 13 states, including the following three states in which the value exceeded 85 percent: Minnesota (88.3 percent), Pennsylvania (86.0 percent), and Arkansas (85.1 percent).
• In 2008–09, a total of 60.6 percent of students ages 14 through 21 who exited services under IDEA, Part B, and school in the 52 states (“All states”) for which data were available graduated with a regular high school diploma.
• In 39 of the 51 states for which data were available for both 2008–09 and 2013–14, the percentage of students who exited IDEA, Part B, and school who graduated with a regular high school diploma increased. Of those 39 states, the following eight were associated with a percent change increase larger than 25 percent: Alabama (125.7 percent), Louisiana (77.7 percent), Idaho (70.2 percent), the District of Columbia (40.2 percent), Delaware (39.1 percent), Indiana (31.7 percent), Mississippi (28.3 percent), and New York (26.5 percent). In contrast, the percent change decrease was larger than 20 percent in two of the 12 states in which the percentage of students who exited IDEA, Part B, and school who graduated with a regular high school diploma decreased. The two states were New Mexico (-50.3 percent) and Utah (-23.3 percent).
• In 2013–14, a total of 18.4 percent of students ages 14 through 21 who exited services under IDEA, Part B, and school in the 52 states (“All states”) for which data were available dropped out. The percentages for the individual states ranged from 6.9 percent to 48.2 percent. In the following six states, less than 10 percent dropped out: Mississippi (9.9 percent), Virginia (9.6 percent), Tennessee (9.5 percent), Rhode Island (9.1 percent), New Hampshire (7.8 percent), and Indiana (6.9 percent). Yet in the following three states, more than 40 percent dropped out: Nevada (48.2 percent), Utah (42.0 percent), and South Carolina (40.5 percent).
• In 2008–09, a total of 22.4 percent of students ages 14 through 21 who exited services under IDEA, Part B, and school in the 52 states (“All states”) for which data were available dropped out.
• In 38 of the 51 states for which data were available for both 2008–09 and 2013–14, the percentage of students who exited IDEA, Part B, and school who dropped out decreased. Of those 38 states, the following four were associated with a percent change decrease of more than 50 percent: Indiana (-74.1 percent), Delaware (-64.6 percent), New Hampshire (-62.6 percent), and Rhode Island (-59.3 percent). A percent change increase of more than 50 percent was found for the following three of the 13 states for which an increase in the percentage of dropouts was found: Hawaii (530.2 percent), Utah (92.1 percent), and New Mexico (71.9 percent).

161
How did the states compare with regard to the percentage of students ages 14 through 21 who exited special education for specific reasons in 2013–14?
Exhibit 70. Percentage of students ages 14 through 21 exiting IDEA, Part B, by exit reason and state: 2013–14
State
Graduated with a
regular diploma
Received a certificate
Dropped out
Reached maximum
age Died
Transferred to regular education
Moved, known to be
continuing All states 42.1 8.6 11.7 1.0 0.2 9.2 27.2
Alabama 46.8 7.2 6.7 1.1 0.2 6.7 31.3 Alaska 33.2 11.1 24.1 0.6 0.2 11.7 19.1 Arizona 47.2 — 15.1 0.1 0.3 9.8 27.6 Arkansas 43.7 1.0 6.2 0.1 0.3 5.7 43.0 BIE schools x x x — — x x California 30.3 16.5 10.5 2.2 0.3 8.4 31.9 Colorado 36.4 1.0 13.3 1.2 0.2 13.2 34.6 Connecticut 61.9 0.4 10.0 1.0 0.2 17.4 9.1 Delaware 43.1 2.4 6.2 0.6 0.2 5.7 41.8 District of Columbia 48.7 6.1 23.6 0.0 0.2 5.8 15.6 Florida 32.6 11.0 10.5 — 0.3 6.8 38.9 Georgia 30.6 18.0 19.7 — 0.2 5.2 26.3 Hawaii 53.6 4.5 12.2 — 0.2 21.0 8.4 Idaho 34.3 0.3 9.6 2.0 0.2 27.2 26.5 Illinois 54.1 0.7 10.8 2.0 0.2 9.4 22.8 Indiana 66.5 12.4 6.0 1.0 0.3 5.3 8.5 Iowa 53.3 — 11.6 1.1 0.3 24.9 8.8 Kansas 46.4 — 8.4 0.5 0.2 12.0 32.5 Kentucky 41.0 5.1 6.6 0.8 0.3 8.6 37.6 Louisiana 35.0 16.2 20.0 0.8 0.4 17.4 10.2 Maine 53.2 1.1 12.6 0.6 0.3 14.8 17.4 Maryland 42.2 6.7 12.8 0.6 0.2 11.3 26.2 Massachusetts 56.1 4.8 13.3 3.5 0.2 10.8 11.2 Michigan 36.2 4.0 14.8 — 0.2 4.1 40.7 Minnesota 70.9 — 8.6 0.6 0.3 7.6 12.1 Mississippi 23.8 44.5 7.5 0.2 0.3 4.3 19.3 Missouri 53.5 0.1 9.1 1.0 0.3 12.0 24.1 Montana 51.1 — 15.0 0.3 0.5 7.4 25.8 Nebraska 59.0 0.5 9.0 0.9 0.6 24.5 5.5 Nevada 20.3 12.0 31.4 1.2 0.2 5.0 29.8 New Hampshire 53.4 5.4 5.1 1.1 0.1 25.0 9.8 New Jersey 63.0 — 9.3 1.7 0.2 6.0 19.8 New Mexico 21.6 30.0 16.2 0.3 0.1 5.3 26.5 New York 41.0 8.9 11.1 0.7 0.1 5.9 32.4 North Carolina 45.9 2.7 14.7 0.5 0.2 9.1 26.9 North Dakota 35.5 — 10.4 3.0 0.0 15.7 35.4 See notes at end of exhibit.

162
Exhibit 70. Percentage of students ages 14 through 21 exiting IDEA, Part B, by exit reason and state: 2013–14—Continued
State
Graduated with a
regular diploma
Received a certificate
Dropped out
Reached maximum
age Died
Transferred to regular education
Moved, known to be
continuing Ohio 25.4 19.5 9.1 0.2 0.2 1.6 44.1 Oklahoma 41.1 — 9.5 # 0.3 5.7 43.4 Oregon 21.5 11.1 14.1 2.0 0.2 13.2 37.9 Pennsylvania 53.1 0.1 7.6 0.8 0.2 6.8 31.4 Puerto Rico 47.0 3.4 28.3 1.9 0.3 4.5 14.6 Rhode Island 42.1 0.2 4.6 3.9 0.1 11.3 37.8 South Carolina 26.9 5.0 23.8 2.8 0.2 7.4 33.9 South Dakota 35.3 — 9.8 0.6 0.5 31.6 22.3 Tennessee 42.6 6.8 5.3 0.8 0.2 5.8 38.4 Texas 41.8 19.5 11.3 0.1 0.3 13.0 14.0 Utah 40.5 2.1 32.3 1.8 0.3 6.9 16.1 Vermont 42.8 0.7 11.9 1.2 0.3 23.7 19.5 Virginia 35.0 22.3 6.1 0.2 0.2 19.7 16.5 Washington 58.5 1.3 17.4 1.4 0.1 15.3 5.9 West Virginia 46.1 6.5 8.1 # 0.3 8.4 30.5 Wisconsin 56.3 1.9 13.6 1.7 0.2 21.3 5.1 Wyoming 32.2 4.6 16.6 1.7 0.2 11.9 32.8 — Percentage cannot be calculated because data were not available. x Data suppressed to limit disclosure. # Ratio was non-zero, but smaller than 5 per 10,000. NOTE: The U.S. Department of Education collects data on seven categories of exiters from special education (i.e., the Part B program in which the student was enrolled at the start of the reporting period). The categories include five categories of exiters from both special education and school (i.e., graduated with a regular high school diploma, received a certificate, dropped out, reached maximum age for services, and died) and two categories of exiters from special education, but not school (i.e., transferred to regular education and moved, known to be continuing in education). The seven categories are mutually exclusive. Percentage for each state was calculated by dividing the number of students ages 14 through 21 served under IDEA, Part B, by the state who were reported in the exit reason category by the total number of students ages 14 through 21 served under IDEA, Part B, by the state who were reported in all the exiting categories, then multiplying the result by 100. Percentage for “All states” was calculated for all states with available data by dividing the number of students ages 14 through 21 served under IDEA, Part B, by all states who were reported in the exit reason category by the total number of students ages 14 through 21 served under IDEA, Part B, by all states who were reported in all the exiting categories, then multiplying the result by 100. Data are from the reporting period between July 1, 2013, and June 30, 2014. SOURCE: U.S. Department of Education, EDFacts Data Warehouse (EDW), OMB #1875-0240: “IDEA Part B Exiting Collection,” 2013–14. Data were accessed fall 2015. For actual data used, go to http://www2.ed.gov/about/reports/annual/osep/index.html.
• In 2013–14, a total of 42.1 percent of students ages 14 through 21 exiting IDEA, Part B, in the 52 states (“All states”) for which data were available graduated with a regular high school diploma. The percentage for this exit reason category was larger than that for each of the other exit reason categories. The prevalence of this category is underscored by the finding that in 41 individual states, this category was associated with the largest percentage of students who exited special education. In 16 of those states, this category represented a majority of the students who exited special education. In the following four of those states, the percentage was more than 60 percent: Minnesota (70.9 percent), Indiana (66.5 percent), New Jersey (63.0 percent), and Connecticut (61.9 percent).

163
• The second most prevalent exit reason, accounting for 27.2 percent of students ages 14 through 21 who exited special education in “All states” in 2013–14, was moved, known to be continuing in education. In eight of the 52 individual states, this category was associated with the largest percentage of students who exited special education. In the following three states, more than 40 percent of the students who exited special education were associated with this exit reason category: Ohio (44.1 percent), Oklahoma (43.4 percent), and Michigan (40.7 percent).
• The exit reason received a certificate represented the largest percentage of the students ages 14 through 21 served under IDEA, Part B, who exited special education in 2013–14 in two states: Mississippi (44.5 percent) and New Mexico (30.0 percent).
• The exit reason dropped out represented the largest percentage of the students ages 14 through 21 served under IDEA, Part B, who exited special education in 2013–14 in one state: Nevada (31.4 percent).

164
Part B Personnel
How did the states compare with regard to the following ratios in 2013:
1. the number of all full-time equivalent (FTE) special education teachers employed to provide special education and related services for students ages 6 through 21 per 100 students served under IDEA, Part B;
2. the number of FTE highly qualified special education teachers employed to provide special education and related services for students ages 6 through 21 per 100 students served under IDEA, Part B; and
3. the number of FTE not highly qualified special education teachers employed to provide special education and related services for students ages 6 through 21 per 100 students served under IDEA, Part B?
Exhibit 71. Number of full-time equivalent (FTE) special education teachers employed to provide special education and related services for students ages 6 through 21 per 100 students served under IDEA, Part B, by qualification status and state: Fall 2013
State All FTE special
education teachers
FTE highly qualifieda special
education teachers
FTE not highly qualified special
education teachers Per 100 students served
All states 6.5 6.1 0.4 Alabama 7.0 6.7 0.3 Alaska 6.6 5.7 0.9 Arizona 5.4 5.3 0.2 Arkansas 7.4 6.7 0.7 BIE schools — — — California 3.3 3.1 0.1 Colorado 6.5 6.2 0.3 Connecticut 8.4 8.4 # Delaware 2.8 2.5 0.3 District of Columbia 15.3 13.7 1.6 Florida 1.8 1.6 0.2 Georgia 9.7 9.5 0.2 Hawaii 11.5 10.3 1.3 Idaho 10.0 2.2 7.8 Illinois 8.6 8.1 0.5 Indiana 0.8 0.8 # Iowa 9.3 9.3 0.0 Kansas 7.5 5.2 2.3 Kentucky 7.8 7.7 0.1 Louisiana 7.5 7.0 0.5 Maine 6.9 6.4 0.5 Maryland 8.8 8.2 0.5 Massachusetts 5.1 4.8 0.3 See notes at end of exhibit.

165
Exhibit 71. Number of full-time equivalent (FTE) special education teachers employed to provide special education and related services for students ages 6 through 21 per 100 students served under IDEA, Part B, by qualification status and state: Fall 2013—Continued
State All FTE special
education teachers
FTE highly qualifieda special
education teachers
FTE not highly qualified special
education teachers Per 100 students served
Michigan 6.4 6.4 # Minnesota 7.2 6.8 0.4 Mississippi 8.9 8.8 # Missouri 7.4 7.1 0.3 Montana 6.0 4.8 1.2 Nebraska 6.4 6.0 0.4 Nevada 6.2 5.5 0.7 New Hampshire 8.5 8.5 0.0 New Jersey 7.4 5.9 1.5 New Mexico 5.0 4.9 0.1 New York 15.1 14.8 0.4 North Carolina 5.6 5.5 0.1 North Dakota 7.7 7.7 0.0 Ohio 6.2 6.1 0.1 Oklahoma 3.3 3.2 # Oregon 3.9 3.8 0.1 Pennsylvania 7.5 7.4 0.1 Puerto Rico 4.5 3.3 1.2 Rhode Island 8.2 8.1 # South Carolina 6.5 6.2 0.3 South Dakota 6.3 6.2 0.1 Tennessee 6.3 5.9 0.4 Texas 4.7 4.7 0.1 Utah 4.4 4.0 0.3 Vermont 9.8 9.6 0.2 Virginia 7.3 5.4 1.9 Washington 4.8 4.7 0.2 West Virginia 7.3 6.0 1.4 Wisconsin 7.3 7.0 0.3 Wyoming 5.1 4.9 0.2 — Percentage cannot be calculated because data were not available. # Ratio was non-zero, but smaller than 5 per 10,000 students. aSpecial education teachers reported as highly qualified met the state standard for highly qualified based on the criteria identified in 20 U.S.C. section 1401(10). For highly qualified special education teachers, the term “highly qualified” has the same meaning given the term in section 9101 of the Elementary and Secondary Education Act of 1965, as amended (ESEA), except that such term also includes the requirements described in section 602(10)(B) of IDEA, and the option for teachers to meet the requirements of section 9101 of ESEA, by meeting the requirements of section 602(10)(C) or (D) of IDEA [20 U.S.C. section 1401(10)]. NOTE: Ratio for each state was calculated by dividing the number of all FTE special education teachers, FTE highly qualified special education teachers, or FTE not highly qualified special education teachers employed to provide special education and related services for students ages 6 through 21 by the state by the total number of students ages 6 through 21 served under IDEA, Part B, by the state, then multiplying the result by 100. Ratio for “All states” was calculated by dividing the number of all FTE

166
• In 2013, there were 6.5 FTE special education teachers (including those who were highly qualified and those who were not highly qualified) employed by the 52 states (“All states”) for which data were available to provide special education and related services for students ages 6 through 21 served under IDEA, Part B, per 100 students ages 6 through 21 served under IDEA, Part B.
• A ratio of 10 or more FTE special education teachers per 100 students was found for the District of Columbia (15.3 FTEs per 100 students), New York (15.1 FTEs per 100 students), Hawaii (11.5 FTEs per 100 students), and Idaho (10.0 FTEs per 100 students). In contrast, a ratio smaller than 3 FTE special education teachers per 100 students was found for the following three states: Delaware (2.8 FTEs per 100 students), Florida (1.8 FTEs per 100 students), and Indiana (0.8 FTE per 100 students).
• In 2013, there were 6.1 FTE highly qualified special education teachers employed by “All states” to provide special education and related services for students ages 6 through 21 per 100 students ages 6 through 21 served under IDEA, Part B. A ratio of 9 or more highly qualified FTE special education teachers per 100 students was found for the following six states: New York (14.8 FTEs per 100 students), the District of Columbia (13.7 FTEs per 100 students), Hawaii (10.3 FTEs per 100 students), Vermont (9.6 FTEs per 100 students), Georgia (9.5 FTEs per 100 students), and Iowa (9.3 FTEs per 100 students). In contrast, a ratio smaller than 3 FTE highly qualified special education teachers per 100 students was found for the following four states: Delaware (2.5 FTEs per 100 students), Idaho (2.2 FTEs per 100 students), Florida (1.6 FTEs per 100 students), and Indiana (0.8 FTE per 100 students).
• In 2013, there was 0.4 FTE not highly qualified special education teacher employed by “All states” to provide special education and related services for students ages 6 through 21 per 100 students ages 6 through 21 served under IDEA, Part B. The ratio was smaller than 2 FTE not highly qualified special education teacher per 100 students for all but the following two states: Idaho (7.8 FTEs per 100 students), and Kansas (2.3 FTEs per 100 students).
special education teachers, FTE highly qualified special education teachers, or FTE not highly qualified special education teachers employed to provide special education and related services for students ages 6 through 21 by all states by the total number of students ages 6 through 21 served under IDEA, Part B, by all states, then multiplying the result by 100. SOURCE: U.S. Department of Education, EDFacts Data Warehouse (EDW), OMB #1875-0240: “IDEA Part B Personnel Collection,” 2013. Data for BIE schools were excluded. Data were accessed fall 2015. U.S. Department of Education, EDFacts Data Warehouse (EDW), OMB #1875-0240: “IDEA Part B Child Count and Educational Environments Collection,” 2013. Data for BIE schools were not available. Data were accessed fall 2014. For actual data used, go to http://www2.ed.gov/about/reports/annual/osep/index.html.

167
Children and Students Ages 3 Through 21 Served Under IDEA, Part B
Part B Discipline
How did the states compare with regard to the number of children and students ages 3 through 21 served under IDEA, Part B, who were removed unilaterally to an interim alternative educational setting by school personnel for drug, weapons, or serious bodily injury offenses during school year 2013–14?
Exhibit 72. Number of children and students ages 3 through 21 served under IDEA, Part B, removed unilaterally to an interim alternative educational setting by school personnel for drug, weapons, or serious bodily injury offenses per 10,000 children and students ages 3 through 21 served under IDEA, Part B, by state: School year 2013–14
State
Number removed to an interim alternative educational settinga by school personnel per 10,000
children and students servedb All states 14
Alabama 18 Alaska 1 Arizona 3 Arkansas # BIE schools — California 1 Colorado 9 Connecticut 1 Delaware 4 District of Columbia 15 Florida 3 Georgia 12 Hawaii 0 Idaho 0 Illinois 1 Indiana 42 Iowa 1 Kansas 65 Kentucky 6 Louisiana 16 Maine 1 Maryland 2 Massachusetts 1 Michigan # Minnesota 1 Mississippi 12 Missouri 11 Montana 38 Nebraska 4 See notes at end of exhibit.

168
Exhibit 72. Number of children and students ages 3 through 21 served under IDEA, Part B, removed unilaterally to an interim alternative educational setting by school personnel for drug, weapons, or serious bodily injury offenses per 10,000 children and students ages 3 through 21 served under IDEA, Part B, by state: School year 2013–14—Continued
State
Number removed to an interim alternative educational settinga by school personnel per 10,000
children and students servedb Nevada 4 New Hampshire # New Jersey 2 New Mexico 5 New York 14 North Carolina 9 North Dakota 8 Ohio 3 Oklahoma 16 Oregon 1 Pennsylvania 47 Puerto Rico # Rhode Island 1 South Carolina 6 South Dakota 10 Tennessee 36 Texas 74 Utah 1 Vermont 3 Virginia 3 Washington 33 West Virginia 1 Wisconsin # Wyoming — — Ratio cannot be calculated because data were not available. # Ratio was non-zero, but smaller than 5 per 100,000 children and students. aAn appropriate setting determined by the child’s/student’s individualized education program (IEP) team in which the child/student is placed for no more than 45 school days. This setting enables the child/student to continue to progress in the general curriculum; to continue to receive services and modifications, including those described in the child’s/student’s current IEP; and to meet the goals set out in the IEP. Setting includes services and modifications to address the problem behavior and to prevent the behavior from recurring. bInstances in which school personnel (not the IEP team) order the removal of children and students with disabilities from their current educational placement to an appropriate interim alternative educational setting (IAES) for not more than 45 school days. NOTE: Ratio for each state was calculated by dividing the number of children and students ages 3 through 21 served under IDEA, Part B, by the state who were removed to an IAES by school personnel for drug, weapons, or serious bodily injury offenses by the total number of children and students ages 3 through 21 served under IDEA, Part B, by the state, then multiplying the result by 10,000. Ratio for “All states” was calculated for all states with available data by dividing the number of children and students ages 3 through 21 served under IDEA, Part B, by all states who were removed to an IAES by school personnel for drug, weapons, or serious bodily injury offenses by the total number of children and students ages 3 through 21 served under IDEA, Part B, by all states, then multiplying the result by 10,000. The numerator is based on data from the entire 2013–14 school year, whereas the denominator is based on point-in-time data from fall 2013.

169
• For every 10,000 children and students ages 3 through 21 served under IDEA, Part B, in 2013 by the 51 states (“All states”) for which data were available, 14 children and students were removed unilaterally to an interim alternative educational setting by school personnel and not by the IEP team for offenses involving drugs, weapons, or serious bodily injury to others in school year 2013–14.
• The numbers of children and students ages 3 through 21 served under IDEA, Part B, who were removed unilaterally to an interim alternative educational setting by school personnel and not the IEP team for drug, weapons, or serious bodily injury offenses during school year 2013–14 per 10,000 children and students ages 3 through 21 served under IDEA, Part B, in 2013 in the 51 states for which data were available ranged from zero to 74. No more than one child or student was removed to an interim alternative educational setting by school personnel for these offenses in 19 states, including Hawaii and Idaho, in which no child or student was removed. In contrast, more than 60 children and students were removed to an interim alternative educational setting by school personnel for such offenses for every 10,000 children and students who were served in two states: Texas (74 per 10,000 children and students) and Kansas (65 per 10,000 children and students).
SOURCE: U.S. Department of Education, EDFacts Data Warehouse (EDW), OMB #1875-0240: “IDEA Part B Discipline Collection,” 2013–14. Data were accessed fall 2015. U.S. Department of Education, EDFacts Data Warehouse (EDW), OMB #1875-0240: “IDEA Part B Child Count and Educational Environments Collection,” 2013. Data were accessed fall 2014. For actual data used, go to http://www2.ed.gov/about/reports/annual/osep/index.html.

170
How did the states compare with regard to the number of children and students ages 3 through 21 served under IDEA, Part B, who were suspended out of school or expelled for more than 10 days during school year 2013–14?
Exhibit 73. Number of children and students ages 3 through 21 served under IDEA, Part B, suspended out of school or expelled for more than 10 days during the school year, per 10,000 children and students ages 3 through 21 served under IDEA, Part B, by state: School year 2013–14
State
Number suspended out of school or expelled for more
than 10 days per 10,000 children and students serveda
All states 80 Alabama 48 Alaska 151 Arizona 53 Arkansas 77 BIE schools — California 40 Colorado 60 Connecticut 156 Delaware 32 District of Columbia 56 Florida 108 Georgia 45 Hawaii 86 Idaho # Illinois 46 Indiana 90 Iowa 30 Kansas 42 Kentucky 9 Louisiana 70 Maine 18 Maryland 91 Massachusetts 79 Michigan 159 Minnesota 55 Mississippi 85 Missouri 151 Montana 27 Nebraska 152 Nevada 166 New Hampshire 64 New Jersey 38 New Mexico 56 See notes at end of exhibit.

171
Exhibit 73. Number of children and students ages 3 through 21 served under IDEA, Part B, suspended out of school or expelled for more than 10 days during the school year, per 10,000 children and students ages 3 through 21 served under IDEA, Part B, by state: School year 2013–14—Continued
State
Number suspended out of school or expelled for more
than 10 days per 10,000 children and students serveda
New York 89 North Carolina 162 North Dakota 16 Ohio 117 Oklahoma 95 Oregon 56 Pennsylvania 41 Puerto Rico # Rhode Island 48 South Carolina 142 South Dakota 45 Tennessee 151 Texas 62 Utah 7 Vermont 48 Virginia 190 Washington 138 West Virginia 141 Wisconsin 65 Wyoming — — Ratio cannot be calculated because data were not available. # Ratio was non-zero, but smaller than 5 per 100,000 children and students. aThe children and students reported in this category are those subject to multiple short-term suspensions/expulsions summing to more than 10 days during the school year, those subject to single suspension(s)/expulsion(s) over 10 days during the school year, and those subject to both. NOTE: Ratio for each state was calculated by dividing the number of children and students ages 3 through 21 served under IDEA, Part B, by the state who were suspended out of school or expelled for more than 10 days by the total number of children and students ages 3 through 21 served under IDEA, Part B, by the state, then multiplying the result by 10,000. Ratio for “All states” was calculated for all states with available data by dividing the number of children and students ages 3 through 21 served under IDEA, Part B, by all states who were suspended out of school or expelled for more than 10 days by the total number of children and students ages 3 through 21 served under IDEA, Part B, by all states, then multiplying the result by 10,000. The numerator is based on data from the entire 2013–14 school year, whereas the denominator is based on point-in-time data from fall 2013. SOURCE: U.S. Department of Education, EDFacts Data Warehouse (EDW), OMB #1875-0240: “IDEA Part B Discipline Collection,” 2013–14. Data were accessed fall 2015. U.S. Department of Education, EDFacts Data Warehouse (EDW), OMB #1875-0240: “IDEA Part B Child Count and Educational Environments Collection,” 2013. Data were accessed fall 2014. For actual data used, go to http://www2.ed.gov/about/reports/annual/osep/index.html.
• For every 10,000 children and students ages 3 through 21 served under IDEA, Part B, in 2013 by the 51 states (“All states”) for which data were available, 80 children and students were suspended out of school or expelled for more than 10 days during school year 2013–14.

172
• The numbers of children and students ages 3 through 21 served under IDEA, Part B, who were suspended out of school or expelled for more than 10 days during school year 2013–14 per 10,000 children and students ages 3 through 21 served under IDEA, Part B, in 2013 in the 51 individual states for which data were available ranged from less than 1 to 190. In the following four states, fewer than 10 children and students were suspended or expelled out of school for more than 10 days for every 10,000 children and students served: Kentucky (9 per 10,000 children and students), Utah (7 per 10,000 children and students), Idaho (less than 1 per 10,000 children and students), and Puerto Rico (less than 1 per 10,000 children and students). In contrast, more than 150 children and students were suspended out of school or expelled for more than 10 days during school year 2013–14 for every 10,000 children and students served in 2013 in nine states, including Virginia, in which the ratio was 190 per 10,000 children and students.

173
How did the states compare with regard to the number of children and students ages 3 through 21 served under IDEA, Part B, reported under the category of emotional disturbance, who were suspended out of school or expelled for more than 10 days during school year 2013–14?
Exhibit 74. Number of children and students ages 3 through 21 served under IDEA, Part B, reported under the category of emotional disturbance and suspended out of school or expelled for more than 10 days during the school year, per 10,000 children and students ages 3 through 21 served under IDEA, Part B, reported under the category of emotional disturbance, by state: School year 2013–14
State
Number suspended out of school or expelled for more than 10 days per 10,000 children and
students serveda All states 358
Alabama 136 Alaska 824 Arizona 202 Arkansas 335 BIE schools — California 221 Colorado 287 Connecticut 570 Delaware 263 District of Columbia 181 Florida 644 Georgia 180 Hawaii 292 Idaho — Illinois 183 Indiana 399 Iowa 30 Kansas 222 Kentucky 49 Louisiana 380 Maine 74 Maryland 448 Massachusetts 301 Michigan 638 Minnesota 271 Mississippi 442 Missouri 697 Montana 110 Nebraska 1,174 Nevada 752 New Hampshire 299 New Jersey 212 See notes at end of exhibit.

174
Exhibit 74. Number of children and students ages 3 through 21 served under IDEA, Part B, reported under the category of emotional disturbance and suspended out of school or expelled for more than 10 days during the school year, per 10,000 children and students ages 3 through 21 served under IDEA, Part B, reported under the category of emotional disturbance, by state: School year 2013–14—Continued
State
Number suspended out of school or expelled for more than 10 days per 10,000 children and
students serveda New Mexico 297 New York 404 North Carolina 991 North Dakota 70 Ohio 478 Oklahoma 427 Oregon 199 Pennsylvania 177 Puerto Rico 0 Rhode Island 261 South Carolina 700 South Dakota 130 Tennessee 568 Texas 272 Utah 50 Vermont 111 Virginia 743 Washington 750 West Virginia 822 Wisconsin 237 Wyoming — — Ratio cannot be calculated because data were not available. aThe children and students reported in this category are those subject to multiple short-term suspensions/expulsions summing to more than 10 days during the school year, those subject to single suspension(s)/expulsion(s) over 10 days during the school year, and those subject to both. NOTE: Ratio for each state was calculated by dividing the number of children and students ages 3 through 21 served under IDEA, Part B, by the state under the category of emotional disturbance who were suspended out of school or expelled for more than 10 days by the total number of children and students ages 3 through 21 served under IDEA, Part B, by the state under the category of emotional disturbance, then multiplying the result by 10,000. Ratio for “All states” was calculated for all states with available data by dividing the number of children and students ages 3 through 21 served under IDEA, Part B, by all states under the category of emotional disturbance who were suspended out of school or expelled for more than 10 days by the total number of children and students ages 3 through 21 served under IDEA, Part B, by all states under the category of emotional disturbance, then multiplying the result by 10,000. The numerator is based on data from the entire 2013–14 school year, whereas the denominator is based on point-in-time data from fall 2013. SOURCE: U.S. Department of Education, EDFacts Data Warehouse (EDW), OMB #1875-0240: “IDEA Part B Discipline Collection,” 2013–14. Data were accessed fall 2015. U.S. Department of Education, EDFacts Data Warehouse (EDW), OMB #1875-0240: “IDEA Part B Child Count and Educational Environments Collection,” 2013. Data were accessed fall 2014. For actual data used, go to http://www2.ed.gov/about/reports/annual/osep/index.html.

175
• For every 10,000 children and students ages 3 through 21 served under IDEA, Part B, reported under the category of emotional disturbance in 2013 by the 50 states (“All states”) for which data were available, 358 children and students were suspended out of school or expelled for more than 10 days during school year 2013–14.
• The numbers of children and students ages 3 through 21 served under IDEA, Part B, reported under the category of emotional disturbance who were suspended out of school or expelled for more than 10 days during school year 2013–14 per 10,000 children and students ages 3 through 21 served under IDEA, Part B, reported under the category of emotional disturbance in 2013, in the 50 individual states for which data were available, ranged from zero to 1,174. Fewer than 50 out every 10,000 such children and students served in 2013 were suspended or expelled for more than 10 days during school year 2013–14 in the following three states: Kentucky (49 per 10,000 children and students), Iowa (30 per 10,000 children and students), and Puerto Rico (zero per 10,000 children and students). In contrast, more than 800 such children and students were suspended out of school or expelled for more than 10 days during school year 2013–14 for every 10,000 such children and students served in 2013 in Nebraska (1,174 per 10,000 children and students), North Carolina (991 per 10,000 children and students), Alaska (824 per 10,000 children and students), and West Virginia (822 per 10,000 children and students).

176
Part B Dispute Resolution
Unlike the other Part B data collections, which are associated with a specific group of Part B participants defined by the participants’ ages, the Part B dispute resolution data collection is associated with all children and students served under IDEA, Part B. These children and students include individuals ages 3 through 21, as well as older individuals, as states have the option of serving students 22 years of age and older. The Part B legal disputes and resolution data represent all complaints associated with any participant in Part B during the 12 months during which the data were collected. Nevertheless, since children and students ages 3 through 21 served under IDEA, Part B, account for nearly all of the participants in Part B in all states, the count for children and students ages 3 through 21 served as of the state-designated date for the year was deemed a meaningful basis for creating a ratio by which to compare the volume of Part B disputes that occurred in the individual states during the year. For an overview of the Part B dispute resolution process, see the discussion of these same data at the national level in Section I.
How did the states compare with regard to the following ratios in 2013–14:
1. the number of written, signed complaints for children and students served under IDEA, Part B, per 10,000 children and students ages 3 through 21 served;
2. the number of due process complaints for children and students served under IDEA, Part B, per 10,000 children and students ages 3 through 21 served; and
3. the number of mediation requests for children and students served under IDEA, Part B, per 10,000 children and students ages 3 through 21 served?
Exhibit 75. Numbers of written, signed complaints; due process complaints; and mediation requests for children and students served under IDEA, Part B, per 10,000 children and students ages 3 through 21 served, by state: 2013–14
State Written, signed
complaintsa Due process complaintsb
Mediation requestsc
Per 10,000 children and students served All states 8 27 15
Alabama 2 23 12 Alaska 5 2 3 Arizona 6 5 5 Arkansas 3 7 8 BIE schools — — — California 15 48 52 Colorado 2 2 6 Connecticut 28 33 48 Delaware 6 10 4 District of Columbia 18 543 7 See notes at end of exhibit.

177
Exhibit 75. Numbers of written, signed complaints; due process complaints; and mediation requests for children and students served under IDEA, Part B, per 10,000 children and students ages 3 through 21 served, by state: 2013–14—Continued
State Written, signed
complaintsa Due process complaintsb
Mediation requestsc
Per 10,000 children and students served Florida 3 5 2 Georgia 5 6 4 Hawaii 12 41 7 Idaho 9 1 5 Illinois 3 10 6 Indiana 7 4 4 Iowa 2 2 5 Kansas 5 1 2 Kentucky 2 1 1 Louisiana 4 1 1 Maine 7 7 18 Maryland 11 22 25 Massachusetts 22 35 62 Michigan 13 3 4 Minnesota 6 2 5 Mississippi 9 1 2 Missouri 6 5 3 Montana 5 1 0 Nebraska 1 # 1 Nevada 2 19 1 New Hampshire 13 11 11 New Jersey 10 45 33 New Mexico 9 8 9 New York 6 141 8 North Carolina 6 2 4 North Dakota 2 3 1 Ohio 8 5 6 Oklahoma 3 2 2 Oregon 5 3 5 Pennsylvania 8 24 9 Puerto Rico 2 196 71 Rhode Island 7 16 27 South Carolina 4 2 1 South Dakota 3 1 1 Tennessee 6 5 2 Texas 7 7 8 Utah 3 1 1 Vermont 6 10 19 Virginia 8 3 7 Washington 6 8 7 See notes at end of exhibit.

178
Exhibit 75. Numbers of written, signed complaints; due process complaints; and mediation requests for children and students served under IDEA, Part B, per 10,000 children and students ages 3 through 21 served, by state: 2013–14—Continued
State Written, signed
complaintsa Due process complaintsb
Mediation requestsc
Per 10,000 children and students served West Virginia 8 5 4 Wisconsin 5 2 6 Wyoming — — — # Ratio was non-zero, but smaller than 5 per 100,000 children and students. — Ratio cannot be calculated because data were not available. aA written, signed complaint is a signed document with specific content requirements that is submitted to a state education agency by an individual or organization that alleges a violation of a requirement of Part B of IDEA. The total number of written, signed complaints in 2013–14 was 4,970. bA due process complaint is a filing by any party to initiate a due process hearing on matters related to the identification, evaluation, or educational placement of a child with a disability, or to the provision of free appropriate public education to such child. The total number of hearing requests in 2013–14 was 17,998. cA mediation request is a request by a party to a dispute involving any matter under Part B of IDEA to meet with a qualified and impartial mediator to resolve the dispute. The total number of mediation requests in 2013–14 was 9,679. NOTE: Ratio for each state was calculated by dividing the number of written, signed complaints; due process complaints; or mediation requests reported by the state by the total number of children and students ages 3 through 21 served under IDEA, Part B, by the state, then multiplying the result by 10,000. Ratio for “All states” was calculated for all states with available data by dividing number of written, signed complaints; due process complaints; or mediation requests reported by all states by the total number of children and students ages 3 through 21 served under IDEA, Part B, by all states, then multiplying the result by 10,000. The numerator is based on data from the reporting period between July 1, 2013, and June 30, 2014, whereas the denominator is based on point-in-time data from fall 2013. SOURCE: U.S. Department of Education, EDFacts Metadata and Process System (EMAPS), OMB #1820-0677: “IDEA Part B Dispute Resolution Survey,” 2013–14. Data for BIE schools were excluded. Data were accessed fall 2015. U.S. Department of Education, EDFacts Data Warehouse (EDW), OMB #1875-0240: “IDEA Part B Child Count and Educational Environments Collection,” 2013. Data were accessed fall 2014. For actual data used, go to http://www2.ed.gov/about/reports/annual/osep/index.html.
• In 2013–14, there were 8 written, signed complaints per 10,000 children and students ages 3 through 21 served under IDEA, Part B, in the 51 states (“All states”) for which data were available. The ratios in the individual states ranged from 1 per 10,000 children and students in Nebraska to more than 20 per 10,000 children and students in Connecticut (28 per 10,000 children and students) and Massachusetts (22 per 10,000 children and students).
• In 2013–14, there were 27 due process complaints per 10,000 children and students ages 3 through 21 served under IDEA, Part B, in the 51 states (“All states”) for which data were available. The ratio was larger than 50 due process complaints per 10,000 children and students in only the following three of the individual states: the District of Columbia (543 per 10,000 children and students), Puerto Rico (196 per 10,000 children and students), and New York (141 per 10,000 children and students). In contrast, the ratio was no larger than 1 per 10,000 children and students in the following nine states: Idaho, Kansas, Kentucky, Louisiana, Mississippi, Montana, Nebraska, South Dakota, and Utah.
• In 2013–14, there were 15 mediation requests per 10,000 children and students ages 3 through 21 served under IDEA, Part B, in the 51 states (“All states”) for which data were available. A ratio larger than 40 mediation requests per 10,000 children and students was found for Puerto Rico (71 per 10,000 children and students), Massachusetts (62 per 10,000 children and students), California (52 per 10,000 children and students), and Connecticut (48 per 10,000 children and students). In

179
contrast, the ratio was no larger than 1 per 10,000 children and students in the following nine states: Kentucky, Louisiana, Montana, Nebraska, Nevada, North Dakota, South Carolina, South Dakota, and Utah.

180
How did the states compare with regard to the following ratios in 2013–14:
1. the number of written, signed complaints with reports issued for children and students served under IDEA, Part B, per 10,000 children and students ages 3 through 21 served;
2. the number of written, signed complaints withdrawn or dismissed for children and students served under IDEA, Part B, per 10,000 children and students ages 3 through 21 served;
3. the number of fully adjudicated due process complaints for children and students served under IDEA, Part B, per 10,000 children and students ages 3 through 21 served; and
4. the number of due process complaints resolved without a hearing for children and students served under IDEA, Part B, per 10,000 children and students ages 3 through 21 served?
Exhibit 76. Number of complaints for children and students served under IDEA, Part B, per 10,000 children and students ages 3 through 21 served, by complaint status and state: 2013–14
State Complaints with reports issueda
Complaints withdrawn or
dismissedb
Fully adjudicated due process complaintsc
Due process complaints resolved
without hearingd Per 10,000 children and students served
All states 5 3 4 17 Alabama 1 # 1 17 Alaska 5 0 0 2 Arizona 4 2 # 4 Arkansas 1 2 1 6 BIE schools — — — — California 10 5 2 35 Colorado 1 # # 2 Connecticut 15 13 1 25 Delaware 4 3 0 10 District of Columbia 16 1 208 269 Florida 2 1 # 4 Georgia 4 1 1 5 Hawaii 5 7 5 25 Idaho 7 3 0 1 Illinois 2 1 # 7 Indiana 4 3 # 3 Iowa 1 1 # 1 Kansas 3 2 # 1 Kentucky 1 1 0 1 Louisiana 2 3 0 1 Maine 1 6 0 7 Maryland 7 3 1 16 Massachusetts 14 7 1 19 Michigan 9 3 # 3 Minnesota 5 1 # 1 See notes at end of exhibit.

181
Exhibit 76. Number of complaints for children and students served under IDEA, Part B, per 10,000 children and students ages 3 through 21 served, by complaint status and state: 2013–14—Continued
State Complaints with reports issueda
Complaints withdrawn or
dismissedb
Fully adjudicated due process complaintsc
Due process complaints resolved
without hearingd Per 10,000 children and students served
Mississippi 6 3 0 1 Missouri 5 1 1 4 Montana 4 1 1 0 Nebraska 1 # 0 # Nevada # 1 0 15 New Hampshire 6 7 2 9 New Jersey 5 3 2 29 New Mexico 5 4 # 7 New York 4 2 18 85 North Carolina 4 2 0 2 North Dakota 1 1 0 1 Ohio 4 3 # 5 Oklahoma 2 1 # 2 Oregon 2 2 # 2 Pennsylvania 3 5 2 17 Puerto Rico 1 1 109 71 Rhode Island 5 1 # 15 South Carolina 2 2 # 1 South Dakota 2 1 1 1 Tennessee 4 1 # 4 Texas 3 4 # 5 Utah 2 0 # 1 Vermont 2 4 2 8 Virginia 3 4 # 3 Washington 5 1 1 5 West Virginia 4 5 # 5 Wisconsin 4 1 # 2 Wyoming — — — — — Ratio cannot be calculated because data were not available. # Ratio was non-zero, but smaller than 5 per 100,000 children and students. aA complaint with report issued refers to a written decision that was provided by the state education agency to the complainant and local education agency regarding alleged violations of a requirement of Part B of IDEA. The total number of complaints with reports issued in 2013–14 was 3,024. bA complaint withdrawn or dismissed refers to a written, signed complaint that was withdrawn by the complainant for any reason or that was determined by the state education agency to be resolved by the complainant and the public agency through mediation or other dispute resolution means, and no further action by the state education agency was required to resolve the complaint. The total number of complaints withdrawn or dismissed in 2013–14 was 1,837. cA due process complaint is fully adjudicated when a hearing officer conducts a hearing, decides matters of law, and issues a written decision to the parent/guardian and public agency. The total number of fully adjudicated due process complaints in 2013–14 was 2,813. dA due process complaint resolved without a hearing is a hearing request that was not fully adjudicated and was not under consideration by a hearing officer. The total number of hearing requests resolved without a hearing in 2013–14 was 11,210.

182
• In 2013–14, there were 5 written, signed complaints with reports issued per 10,000 children and students ages 3 through 21 served under IDEA, Part B, in the 51 states (“All states”) for which data were available. The ratio was at least 10 per 10,000 children and students in only the following four states: the District of Columbia (16 per 10,000 children and students), Connecticut (15 per 10,000 children and students), Massachusetts (14 per 10,000 children and students), and California (10 per 10,000 children and students). In contrast, the ratio was no more than 1 per 10,000 children and students in the following 10 states: Alabama, Arkansas, Colorado, Iowa, Kentucky, Maine, Nebraska, Nevada, North Dakota, and Puerto Rico.
• In 2013–14, there were 3 written, signed complaints withdrawn or dismissed per 10,000 children and students ages 3 through 21 served under IDEA, Part B, in the 51 states (“All states”) for which data were available. The ratio was zero in Alaska and Utah and larger than 5 per 10,000 in only the following five states: Connecticut (13 per 10,000 children and students), Hawaii (7 per 10,000 children and students), Massachusetts (7 per 10,000 children and students), New Hampshire (7 per 10,000 children and students), and Maine (6 per 10,000 children and students).
• In 2013–14, there were 4 fully adjudicated due process complaints per 10,000 children and students ages 3 through 21 served under IDEA, Part B, in the 51 states (“All states”) for which data were available. The ratio was zero in 11 states and larger than 5 per 10,000 in only the following three states: the District of Columbia (208 per 10,000 children and students), Puerto Rico (109 per 10,000 children and students), and New York (18 per 10,000 children and students).
• In 2013–14, there were 17 due process complaints resolved without a hearing per 10,000 children and students ages 3 through 21 served under IDEA, Part B, in the 51 states (“All states”) for which data were available. The ratio was no more than 1 per 10,000 in 13 states. In contrast, the ratio was larger than 30 per 10,000 in the following four states: the District of Columbia (269 per 10,000 children and students), New York (85 per 10,000 children and students), Puerto Rico (71 per 10,000 children and students), and California (35 per 10,000 children and students).
NOTE: A written, signed complaint is a signed document with specific content requirements that is submitted to a state education agency by an individual or organization that alleges a violation of a requirement of Part B of IDEA. A hearing request is a filing by any party to initiate a due process hearing on matters related to the identification, evaluation, or educational placement of a child with a disability or to the provision of free appropriate public education to such child. Ratio for each state was calculated by dividing the number of complaints with reports issued, complaints withdrawn or dismissed, fully adjudicated due process complaints, or due process complaints resolved without a hearing reported by the state by the total number of children and students ages 3 through 21 served under IDEA, Part B, by the state, then multiplying the result by 10,000. Ratio for “All states” was calculated for all states with available data by dividing the number of complaints with reports issued, complaints withdrawn or dismissed, fully adjudicated due process complaints, or due process complaints resolved without a hearing reported by all states by the total number of children and students ages 3 through 21 served under IDEA, Part B, by all states, then multiplying the result by 10,000. The numerator is based on data from the reporting period between July 1, 2013, and June 30, 2014, whereas the denominator is based on point-in-time data from fall 2013. SOURCE: U.S. Department of Education, EDFacts Metadata and Process System (EMAPS), OMB #1820-0677: “IDEA Part B Dispute Resolution Survey,” 2013–14. Data for Wyoming and BIE schools were excluded. Data were accessed fall 2015. U.S. Department of Education, EDFacts Data Warehouse (EDW), OMB #1875-0240: “IDEA Part B Child Count and Educational Environments Collection,” 2013. Data for Wyoming and BIE schools were not available. Data were accessed fall 2014. For actual data used, go to http://www2.ed.gov/about/reports/annual/osep/index.html.

Section III
Findings and Determinations Resulting From Reviews of State Implementation of IDEA


185
Findings and Determinations Resulting From Reviews of State Implementation of IDEA
Section 616(a)(1)(A) of IDEA requires the secretary of the U.S. Department of Education (Department) to monitor the implementation of IDEA through oversight of general supervision by the states and through the State Performance Plans (SPP) described in section 616(b). To fulfill these requirements, the Office of Special Education Programs (OSEP), on behalf of the secretary, has implemented the Continuous Improvement and Focused Monitoring System (CIFMS), which focuses resources on critical compliance and performance areas in IDEA. Under IDEA sections 616(d) and 642, the Department performs an annual review of each state’s SPP and the associated Annual Performance Report (APR) (collectively, the SPP/APR) under Parts B and C of IDEA and other publicly available information to make an annual determination of the extent to which the state is meeting the requirements and purposes of Parts B and C of IDEA. The SPPs/APRs and the Department’s annual determinations are components of CIFMS.
The SPP and APR
Sections 616(b) and 642 of IDEA require each state to have in place an SPP for evaluating the state’s efforts to implement the requirements and purposes of IDEA and describing how the state will improve its implementation of IDEA. The original SPP that each state submitted in 2005 covered a period of six years for federal fiscal year (FFY) 2005 through FFY 2010 and was made up of quantifiable indicators (20 under Part B and 14 under Part C), established by the secretary under sections 616(a)(3) and 642 of IDEA, which measured either compliance with specific statutory or regulatory provisions of IDEA (compliance indicators) or results and outcomes for children with disabilities and their families (results indicators). SPPs were submitted in December 2005 by each state education agency (SEA) under Part B and by each state lead agency under Part C. Each SPP includes measurable and rigorous targets and improvement activities for each indicator. The original SPP was extended for two years for FFYs 2011 and 2012. On February 2, 2015, each state was required to submit a new SPP that covers the six-year period for FFYs 2013 through 2018, and includes a new indicator, the State Systemic Improvement Plan that is part of OSEP’s Results Driven Accountability Framework.
Every February, pursuant to sections 616(b)(2)(C)(ii)(II) and 642 of IDEA, each state must
submit an APR that documents its progress or slippage toward meeting the measurable and rigorous targets established for each indicator in the SPP for a specific FFY. In February 2015, each state submitted an SPP/APR under Part B and Part C to OSEP for the FFY 2013 APR reporting period (i.e., July 1, 2013, through June 30, 2014). Beginning with the FFY 2013 SPP/APR, each state was required to
186
submit its SPP/APR online using the SPP/APR module on GRADS 360. This section examines and summarizes the states’ performance during FFY 2013 under both Parts B and C of IDEA.
Please note that throughout this section, the term “states” is used to reference all of the
jurisdictions that submitted FFY 2013 SPPs/APRs. The jurisdictions include the 50 states, the District of Columbia (DC), Puerto Rico (PR), and the four outlying areas of American Samoa, Guam, the Northern Mariana Islands, and the Virgin Islands, all of which reported separately on Part B and Part C. In addition, for Part B, the Bureau of Indian Education (BIE) as well as the three freely associated states of the Federated States of Micronesia, the Republic of Palau, and the Republic of the Marshall Islands submitted SPPs/APRs. Thus, unless stated otherwise, the discussion and exhibits in this section concern the 56 states for Part C and 60 states for Part B.
Indicators
The secretary established, with broad stakeholder input, 20 indicators for Part B (nine compliance indicators, 10 results indicators, and one results/compliance indicator) and 14 indicators for Part C (seven compliance indicators and seven results indicators) for the original SPP/APR. Exhibits 77 and 78 explain the measurement that was in place during the FFY 2013 reporting period for each Part B and Part C indicator on which states were required to report and identify whether each indicator is a compliance or a results indicator.

187
Exhibit 77. Compliance and results indicators for determining the extent to which each state met IDEA, Part B, requirements: Federal fiscal year 2013
Indicator Measurement Type of indicator
B1 – Graduation Percent of youths with individualized education programs (IEPs) graduating from high school with a regular diploma.
Results
B2 – Dropout Percent of youths with IEPs dropping out of high school. Results B3 – Assessment Participation and performance of children with IEPs on
statewide assessments: (a) percent of districts with a disability subgroup that met the state’s minimum “n” size that met the state’s annual yearly progress/annual measurable objective (AYP/AMO) targets for the disability subgroup; (b) participation rate for children with IEPs; and (c) proficiency rate for children with IEPs against grade-level, modified, and alternate academic achievement standards.
Results
B4 – Suspension/ Expulsion
Rates of suspension and expulsion: (A) percent of districts that had a significant discrepancy in the rate of suspensions and expulsions of greater than 10 days in a school year for children with IEPs; and (B) percent of districts that had: (a) a significant discrepancy, by race or ethnicity, in the rate of suspensions and expulsions of greater than 10 days in a school year for children with IEPs; and (b) policies, procedures, or practices that contribute to the significant discrepancy and do not comply with requirements relating to the development and implementation of IEPs, the use of positive behavioral interventions and supports, and procedural safeguards.
B-4 (A) Results B-4 (B) Compliance
B5 – School Age Least Restrictive Environment (LRE)
Percent of children ages 6 through 21 with IEPs served: (a) inside the regular class 80 percent or more of the day; (b) inside the regular class less than 40 percent of the day; and (c) in separate schools, residential facilities, or homebound/hospital placements.
Results
B6 – Preschool LRE Percent of children ages 3 through 5 with IEPs attending a (a) regular early childhood program and receiving the majority of special education and related services in the regular early childhood program; and (b) separate special education class, separate school, or residential facility.
Results
B7 – Preschool Outcomes
Percent of preschool children ages 3 through 5 with IEPs who demonstrated improved: (a) positive social-emotional skills (including social relationships); (b) acquisition and use of knowledge and skills (including early language/ communication and early literacy); and (c) use of appropriate behaviors to meet their needs.
Results
B8 – Parent Involvement
Percent of parents with a child receiving special education services who reported that schools facilitated parent involvement as a means of improving services and results for children with disabilities.
Results
See notes at end of exhibit.

188
Exhibit 77. Compliance and results indicators for determining the extent to which each state met IDEA, Part B, requirements: Federal fiscal year 2013—Continued
Indicator Measurement Type of indicator
B9 – Disproportionality (Child with a Disability)
Percent of districts with disproportionate representation of racial and ethnic groups in special education and related services that was the result of inappropriate identification.
Compliance
B10 – Disproportionality (Disability Category)
Percent of districts with disproportionate representation of racial and ethnic groups in specific disability categories that was the result of inappropriate identification.
Compliance
B11 – Child Find Percent of children, who were evaluated within 60 days of receiving parental consent for initial evaluation or, if the state establishes a timeframe within which the evaluation must be conducted, within that timeframe.
Compliance
B12 – Early Childhood Transition
Percent of children referred by Part C prior to age 3, who were found eligible for Part B, and who had an IEP developed and implemented by their third birthdays.
Compliance
B13 – Secondary Transition
Percent of youths ages 16 and above with IEPs with an IEP that included appropriate measurable postsecondary goals that were annually updated and based upon an age appropriate transition assessment; transition services, including courses of study, that would reasonably enable the student to meet those postsecondary goals; and annual IEP goals related to the student’s transition services needs. There also must have been evidence that the student was invited to the IEP Team meeting where transition services were to be discussed and evidence that, if appropriate, a representative of any participating agency was invited to the IEP Team meeting with the prior consent of the parent or student who had reached the age of majority.
Compliance
B14 – Post-school Outcomes
Percent of youths who were no longer in secondary school, had IEPs in effect at the time they left school, and were: (a) enrolled in higher education within one year of leaving high school; (b) enrolled in higher education or competitively employed within one year of leaving high school; or (c) enrolled in higher education or in some other postsecondary education or training program, or competitively employed or in some other employment within one year of leaving high school.
Results
B15 – Hearing Requests
Percent of hearing requests that went to resolution sessions that were resolved through resolution session settlement agreements.
Results
B16 – Mediations Percent of mediations held that resulted in mediation agreements.
Results
See notes at end of exhibit.

189
Exhibit 77. Compliance and results indicators for determining the extent to which each state met IDEA, Part B, requirements: Federal fiscal year 2013—Continued
Indicator Measurement Type of indicator
B17 – State Systematic Improvement Plan (SSIP)
The state’s SPP/APR included an SSIP that was a comprehensive, ambitious, yet achievable multi-year plan for improving results for children with disabilities. The SSIP was to include three phases: (1) Analysis, (2) Plan, and (3) Implementation and Evaluation. The measurement calls for the examination of data aligned with the State-Identified Measurable Result(s) for five years from FFY 2014 through FFY 2018 relative to FFY 2013, the baseline period, regarding the state’s performance in terms of measurable and rigorous targets.
Results
NOTE: The FFY 2013 APR reporting period was from July 1, 2013, through June 30, 2014. For FFY 2013, the indicators were renumbered as the previous Indicator B15 (General Supervision) and Indicator B20 (State-Reported Data) were removed and a new Indicator B17 (SSIP) was introduced. SOURCE: U.S. Department of Education, Office of Special Education Programs, OMB #1820-0624: “Part B State Performance Plan (SPP) and Annual Performance Report (APR): Part B Indicator Measurement Table,” 2013–14. Available at: http://www2.ed.gov/policy/speced/guid/idea/bapr/2015/partbmeasurementtable5-14-14.pdf (accessed July 31, 2015).

190
Exhibit 78. Compliance and results indicators for determining the extent to which each state met IDEA, Part C, requirements: Federal fiscal year 2013
Indicator Measurement Type of indicator
C1 – Early Intervention Services in a Timely Manner
Percent of infants and toddlers with individualized family service plans (IFSPs) who received the early intervention services on their IFSPs in a timely manner.
Compliance
C2 – Settings Percent of infants and toddlers with IFSPs who primarily received early intervention services in the home or community-based settings.
Results
C3 – Infant and Toddler Outcomes
Percent of infants and toddlers with IFSPs who demonstrated improved: (a) positive social-emotional skills (including social relationships); (b) acquisition and use of knowledge and skills (including early language/ communication); and (c) use of appropriate behaviors to meet their needs.
Results
C4 – Family Outcomes
Percent of families participating in Part C who reported that early intervention services had helped the family: (a) know their rights, (b) effectively communicate their children’s needs, and (c) help their children develop and learn.
Results
C5 – Child Find: Birth to One
Percent of infants and toddlers birth to 1 with IFSPs compared to national data.
Results
C6 – Child Find: Birth to Three
Percent of infants and toddlers birth to 3 with IFSPs compared to national data.
Results
C7 – 45-day Timeline Percent of eligible infants and toddlers with IFSPs for whom an initial evaluation and initial assessment and an initial IFSP meeting were conducted within Part C’s 45-day timeline.
Compliance
C8 – Early Childhood Transition
The percentage of toddlers with disabilities exiting Part C with timely transition planning for whom the Lead Agency had: (a) developed an IFSP with transition steps and services at least 90 days, and at the discretion of all parties, not more than nine months, prior to the toddler’s third birthday; (b) notified (consistent with any opt-out policy adopted by the state) the state education agency (SEA) and the local education agency (LEA) where the toddler resided at least 90 days prior to the toddler’s third birthday for toddlers potentially eligible for Part B preschool services; and (c) conducted the transition conference held with the approval of the family at least 90 days, and at the discretion of all parties, not more than nine months, prior to the toddler’s third birthday for toddlers potentially eligible for Part B preschool services.
Compliance
C9 – Hearing Requests
Percent of hearing requests that went to resolution sessions that were resolved through resolution session settlement agreements (applicable if Part B due process procedures were adopted).
Results
See notes at end of exhibit.

191
Exhibit 78. Compliance and results indicators for determining the extent to which each state met IDEA, Part C, requirements: Federal fiscal year 2013—Continued
Indicator Measurement Type of indicator
C10 – Mediations Percent of mediations held that resulted in mediation agreements.
Results
C11 – State Systematic Improvement Plan (SSIP)
The state’s SPP/APR included an SSIP that was a comprehensive, ambitious, yet achievable multi-year plan for improving results for infants and toddlers with disabilities and their families. The SSIP was to include three phases: (1) Analysis, (2) Plan, and (3) Implementation and Evaluation. The measurement calls for the examination of aligned with the State-Identified Measurable Result(s) data for five years from FFY 2014 through FFY 2018 relative to FFY 2013, the baseline period, regarding the state’s performance in terms of measurable and rigorous targets.
Results
NOTE: The FFY 2013 APR reporting period was from July 1, 2013, through June 30, 2014. For FFY 2013, the indicators were renumbered as the previous Indicator C9 (General Supervision) and Indicator C14 (State-Reported Data) were removed and a new Indicator C11 (SSIP) was introduced. SOURCE: U.S. Department of Education, Office of Special Education Programs, OMB #1820-0578: “Part C State Performance Plan (SPP) and Annual Performance Report (APR): Part C Indicator Measurement Table,” 2013–14. Available at http://www2.ed.gov/policy/speced/guid/idea/capr/2015/parteasurementtable5-14-14.pdf (accessed July 31, 2015).
The Determination Process
Sections 616(d)(2)(A) and 642 of IDEA require the secretary to make an annual determination as to the extent to which each state is meeting the requirements of Parts B and C of IDEA. The secretary determines if a state:
• Meets the requirements and purposes of IDEA,
• Needs assistance in implementing the requirements of IDEA,
• Needs intervention in implementing the requirements of IDEA, or
• Needs substantial intervention in implementing the requirements of IDEA.
Exhibit 79 presents the key components in the determination process.

192
Exhibit 79. Process for determining the extent to which each state met IDEA, Part B and Part C, requirements: Federal fiscal year 2013
December 2005: States submitted State Performance Plans (SPPs)a
February 2015: States submitted new SPPs for FFYs 2013 through
2018 and FFY 2013 APRs
Secretary reviewed FFY 2013 SPPs/APRs and considered multiple
additional factors in making determinations
June 2015: Secretary released determinations based on data reported in FFY 2013 SPPs/
APRs and other available data
Secretary took specific enforcement actions
Special Conditions
State single-audit findings
Information obtained through monitoring visits
Other public information made
available
aIn December 2005, each state submitted an SPP that covered a period of six years for FFY 2005 through 2010. Sections 616(b)(1)(C) and 642 require each state to review its SPP under Part B and Part C at least once every six years and submit any amendments to the secretary. Each state is also required to post the most current SPP on its state website. Since December 2005, most states have revised their SPP at least once. The original SPP was extended for two years for FFYs 2011 and 2012. States were required to submit a new SPP/APR for FFYs 2013 through 2018 on February 2, 2015. NOTE: In June 2014, the secretary issued determinations based on data reported in the FFY 2012 APR and other available data. A discussion of those determinations is found in the 37th Annual Report to Congress, 2015. SOURCE: Information taken from U.S. Department of Education, Office of Special Education Programs, “OSEP Memo 15-06 to State Education Agency Directors of Special Education and State Data Managers dated December 23, 2014.” Available at: http://www2.ed.gov/policy/speced/guid/idea/bapr/2015/index.html (accessed July 31, 2015). “OSEP Memo 15-05 to Lead Agency Directors, Part C Coordinators and State Interagency Coordinating Council Chairpersons dated December 23, 2014. Available at http://www2.ed.gov/policy/speced/guid/idea/capr/2015/index.html (accessed July 31, 2015).
Since 2007, the Department has made an annual determination for each state under Part B and
Part C of the IDEA and based each state’s determination on the totality of the state’s data in its SPP/APR and other publicly available information about the state, including any information about outstanding compliance issues. For the years 2007 through 2012, the Department used specific factors in making determinations, including considering (1) state data in any one compliance indicator if it reflected very low performance, (2) whether the state lacked valid and reliable data for that indicator, and (3) the state’s

193
inability to correct longstanding noncompliance that had been the subject of continuing Departmental enforcement actions such as special conditions on the state’s grant. In making each state’s determination under Parts B and C in 2013, the Department used a Compliance Matrix that reflected the totality of the state’s compliance data instead of one particular factor. However in making this transition to a matrix approach in 2013 to consider multiple factors, the Department also applied the prior single factor approach such that no state would receive a lower determination under the 2013 Compliance Matrix approach than it would have had in the 2012 single-factor approach.
For the first time in 2014, as part of its new accountability framework, called Results-Driven
Accountability (RDA), the Department used both compliance and results data in making Part B determinations, giving each equal weight in making a state’s determination. Specifically, the Department considered the totality of information available about a state, including information related to the participation of children with disabilities on regular statewide assessments; the proficiency gap between children with disabilities and all children on regular statewide assessments; the participation and performance of children with disabilities on the National Assessment of Educational Progress (NAEP); the state’s FFY 2012 SPP/APR; information from monitoring and other public information, such as the Special Conditions on the state’s grant award under Part B; and other issues related to state compliance with IDEA. The Department used this Compliance Matrix and this Results Matrix, in making the 2014 Part B determinations for most states in June 2014. The exceptions were the BIE, American Samoa, the Northern Mariana Islands, the Federated States of Micronesia, Guam, the Republic of the Marshall Islands, the Republic of Palau, and the Virgin Islands as Department did not have sufficient results data to use when making the 2014 Part B determinations. Therefore, the Department used only compliance data when making 2014 Part B determinations for these entities.
In making the 2014 Part C determination for each state, the Department also considered the
totality of the information available about the state. Specifically, the information included the state’s FFY 2012 SPP/APR; information from monitoring and other public information, such as Special Conditions on the state’s grant award under Part C; and other issues related to state compliance with IDEA. However, in making each state’s 2014 Part C determination, the Department used only a Compliance Matrix as results data were not taken into consideration.
In making the Part B and Part C determinations for most states in 2015, the Department used both
a Compliance Matrix and a Results Matrix in the context of the RDA framework. Below are more detailed descriptions of the processes used to make the Part B and Part C determinations in June 2015.

194
2015 Part B Determinations
As it did in 2014, the Department used both a Compliance Matrix and a Results Matrix in the context of the RDA framework in making the Part B determinations in 2015. Specifically, the Department considered the totality of information available about a state, including information related to the participation of children with disabilities on regular statewide assessments; the participation and performance of children with disabilities on the NAEP; exiting data on children with disabilities who dropped out and children with disabilities who graduated with a regular high school diploma; the state’s FFY 2013 SPP/APR; information from monitoring and other public information, such as the Special Conditions on the state’s grant award under Part B; and other issues related to state compliance with IDEA. As was the case in 2014, the Department was not able to use both compliance and results data in making the 2015 Part B determination for the BIE, American Samoa, the Northern Mariana Islands, the Federated States of Micronesia, Guam, the Republic of the Marshall Islands, the Republic of Palau, and the Virgin Islands as sufficient results data were not available. Since the elements considered in the Compliance Matrix used for these entities were also different from the ones considered for the other states, the determination process used for each of these groups is discussed separately below.
Part B Compliance Matrix for States With Sufficient Results Data
The Compliance Matrix used for each of the states with sufficient results data considered the following data:
1. The state’s FFY 2013 data for Part B Compliance Indicators 4B, 9, 10, 11, 12, and 13
(including whether the state reported valid and reliable data for each indicator) and, if the FFY 2013 data that the state reported under Indicators 11, 12, and 13 reflected compliance between 90 percent and 95 percent (or, for Indicators 4B, 9, and 10, were between 5 percent and 10 percent), whether the state demonstrated correction of all findings of noncompliance that it had identified in FFY 2012 under such indicators;
2. The timeliness and accuracy of data reported by the state under sections 616 and 618 of IDEA;
3. The state’s FFY 2013 data, reported under section 618 of IDEA, for the timeliness of state complaint and due process hearing decisions;
4. Whether the Department imposed Special Conditions on the state’s FFY 2014 IDEA Part B grant award and those Special Conditions were in effect at the time of the 2015 determination, and the number of years for which the state’s Part B grant award had been subject to Special Conditions; and
5. Whether there were any findings of noncompliance identified in FFY 2011 or earlier by either the Department or the state that the state had not yet corrected.

195
Using the Compliance Matrix, a state was assigned a score of 0, 1, or 2 for each of the compliance indicators in item one above and for the additional factors listed in items two through five above. Using the cumulative possible number of points as the denominator, and using the actual points the state received in its scoring under these factors as the numerator, the Compliance Matrix reflected a Compliance Performance Score.
Part B Results Matrix for States With Sufficient Results Data
The Results Matrix used for each of the states with sufficient results data considered the following data:
1. The percentages of fourth-grade children with disabilities participating in regular statewide
assessments in math and reading;
2. The percentages of eighth-grade children with disabilities participating in regular statewide assessments in math and reading;
3. The percentages of fourth-grade children with disabilities scoring at basic or above on the NAEP in math and reading;
4. The percentages of fourth-grade children with disabilities included in NAEP testing in math and reading;
5. The percentages of eighth-grade children with disabilities scoring at basic or above on the NAEP in math and reading;
6. The percentages of eighth-grade children with disabilities included in NAEP testing in math and reading;
7. The percentage of children with disabilities exiting school by dropping out; and
8. The percentage of children with disabilities exiting school by graduating with a regular high school diploma.
Using the Results Matrix, a state was assigned a score as follows for the results elements listed above.
• Each state’s participation rate on regular statewide assessments was assigned a score of 2, 1,
or 0 based on an analysis of the participation rates across all states and whether the state administered an alternate assessment based on modified academic achievement standards. For a state that did not administer an alternate assessment based on modified academic achievement standards, a score of 2 was assigned if at least 90 percent of children with disabilities participated in the regular statewide assessment; a score of 1 was assigned if the participation rate for children with disabilities was 81 percent to 89 percent; a score of 0 was assigned if the participation rate for children with disabilities was 80 percent or less. For a state that administered an alternate assessment based on modified academic achievement

196
standards, a score of 2 was assigned if the participation rate of children with disabilities was 70 percent or greater; a score of 1 was assigned if the participation rate of children with disabilities was 61 percent to 69 percent; a score of 0 was assigned if the participation rate of children with disabilities was 60 percent or less.
• Each state’s NAEP score (basic and above) was rank-ordered. The top third of states received a score of 2; the middle third of states received a score of 1; the bottom third of states received a score of 0.
• Each state’s NAEP inclusion rate was assigned a score of either 0 or 1 based on whether the state’s NAEP inclusion rate for children with disabilities was “higher than or not significantly different from the National Assessment Governing Board [NAGB] goal of 85 percent.” Standard error estimates were reported with the inclusion rates of children with disabilities and taken into account in determining if a state’s inclusion rate was higher than or not significantly different from the NAGB goal of 85 percent.
• A state’s data on the percentage of children with disabilities who exited school by dropping out were rank-ordered. The top third of states (i.e., those with the lowest percentage) received a score of 2; the middle third of states received a score of 1; and the bottom third of states (i.e., those with the highest percentage) received a score of 0.
• A state’s data on the percentage of children with disabilities who exited school by graduating with a regular high school diploma were rank-ordered. The top third of states (i.e., those with the highest percentage) received a score of 2; the middle third of states received a score of 1; the bottom third of states (i.e., those with the lowest percentage) received a score of 0.
Using the cumulative possible number of points as the denominator, and using the actual points the state received in its scoring under the results elements as the numerator, the Results Matrix reflected a Results Score.
Part B RDA Scoring for States With Sufficient Results Data
For each of the states with sufficient results data, the RDA Percentage was calculated by adding 50 percent of the state’s Results Score and 50 percent of the state’s Compliance Score. The state’s RDA Percentage was used to calculate the 2015 Part B determination as follows:
1. Meets Requirements: A state’s 2015 RDA Determination was Meets Requirements if the
RDA Percentage was at least 80 percent, unless the Department had imposed Special Conditions on the state’s last three IDEA Part B grant awards (i.e., for FFYs 2012, 2013, and 2014), and those Special Conditions were in effect at the time of the 2015 determination.
2. Needs Assistance: A state’s 2015 RDA Determination was Needs Assistance if the RDA percentage was at least 60 percent, but less than 80 percent. A state also would be Needs Assistance if its RDA percentage was 80 percent or above, but the Department had imposed Special Conditions on the state’s last three IDEA Part B grant awards (i.e., for FFYs 2012, 2013, and 2014), and those Special Conditions were in effect at the time of the 2015 determination.

197
3. Needs Intervention: A state’s 2015 RDA Determination was Needs Intervention if the RDA percentage was less than 60 percent.
4. Needs Substantial Intervention: The Department did not make a determination of Needs Substantial Intervention for any state in 2015.
Part B Compliance Matrix and RDA Scoring for States Without Sufficient Results Data
As noted above, sufficient results data were not available for the BIE, American Samoa, the Northern Mariana Islands, the Federated States of Micronesia, Guam, the Republic of the Marshall Islands, the Republic of Palau, and the Virgin Islands at the time the 2015 determinations were being made. Hence, the Department used only a Compliance Matrix to make the 2015 determinations for each of these entities. The Compliance Matrix used for these entities took into account the following data:
1. The state’s FFY 2013 data for Part B Compliance Indicators 11 and 13, and where applicable,
Indicator 12 (including whether the state reported valid and reliable data for each indicator); and, if the FFY 2013 data that the state reported under those indicators reflected compliance between 90 percent and 95percent, whether the state demonstrated correction of all findings of noncompliance it had identified in FFY 2012 under such indicators;
2. The timeliness and accuracy of data reported by the state under sections 616 and 618 of the IDEA;
3. The state’s FFY 2013 data, reported under section 618 of the IDEA, for the timeliness of state complaint and due process hearing decisions;
4. Whether the Department imposed Special Conditions on the state’s FFY 2015 IDEA Part B grant award and those Special Conditions were in effect at the time of the 2015 determination, and the number of years for which the state’s Part B grant award had been subject to Special Conditions; and
5. Whether there were any findings of noncompliance identified in FFY 2011 or earlier by either the Department or the state that the state has not yet corrected.
Using the Compliance Matrix, a state was assigned a score of 0, 1, or 2 for each of the compliance indicators in item 1 above and for the additional factors listed in items 2 through 5 above. Using the cumulative possible number of points as the denominator, and using the actual points the state received in its scoring under these factors as the numerator, the Department calculated the Compliance Matrix percentage that was used to assign the 2015 determination, as follows:

198
1. Meets Requirements: A state’s 2015 determination was Meets Requirements if the matrix percentage was at least 90 percent, unless the Department imposed Special Conditions on the state’s last three IDEA Part B grant awards (i.e., FFYs 2012, 2013, and 2014), and those Special Conditions were in effect at the time of the Department’s 2015 determination.
2. Needs Assistance: A state’s 2015 determination was Needs Assistance if the matrix percentage was at least 75 percent, but less than 90 percent, or was below 75 percent, but the state did not meet the criteria for Needs Intervention set forth below. A state was also Needs Assistance if its matrix percentage was at least 90 percent, but the Department had imposed Special Conditions on the state’s last three IDEA Part B grant awards (i.e., for FFYs 2012, 2013, and 2014), and those Special Conditions were in effect at the time of the Department’s 2015 determination.
3. Needs Intervention: A state’s 2015 determination was Needs Intervention if the matrix percentage was less than 75 percent, and the state met one or more of the following criteria:
a. Compliance was below 50 percent for one or more of the following Compliance Indicators (11, 12, or 13) or timely state complaint decisions or timely due process hearing decisions;
b. The state provided no data or did not provide valid and reliable data for the following Compliance Indicators: 11, 12, or 13; or
c. The state had been subject to Special Conditions for multiple years for failing to comply with key IDEA requirements; the noncompliance had been long-standing; the state’s data in response to the Department’s FFY 2014 Special Conditions demonstrated continued noncompliance; and those Special Conditions were in effect at the time of the Department’s 2015 determination.
4. Needs Substantial Intervention: The Department did not make a determination of Needs Substantial Intervention for any state in 2015.
2015 Part C Determinations
In 2015 as part of its RDA framework, the Department used for the first time both compliance and results data in making each state’s Part C determination under sections 616(d) and 642 of the IDEA for the state’s early intervention program. Specifically, the Department considered the totality of the information available about a state, including information related to the state’s FFY 2013 SPP/APR, Indicator C3 Child Outcomes data (Outcomes data), and other data reported in each state’s FFY 2013 SPP/APR; information from monitoring and other publicly available information, such as Special Conditions on the state’s grant award under Part C; and other issues related to state compliance with IDEA. Below is a description of how the Department evaluated the states’ data using the RDA Matrix. The RDA Matrix was individualized for each state and included each state’s Compliance Score, Results Score; and RDA Percentage and Determination, each of which is described below.

199
Part C Compliance Matrix and Score
In making each state’s 2015 Part C determination, the Department used a Compliance Matrix that considered the following compliance data:
1. The state’s FFY 2013 data for Part C Compliance Indicators 1, 7, 8A, 8B, and 8C (including
whether the state reported valid and reliable data for each indicator), and, if the FFY 2013 data that the state reported under Indicators 1, 7, 8A, 8B, and 8C reflected compliance between 90 percent and 95 percent, whether the state demonstrated correction of all findings of noncompliance it had identified in FFY 2012 under such indicators;
2. The timeliness and accuracy of data reported by the state under sections 616, 618, and 642 of the IDEA;
3. The state’s FFY 2013 data, reported under section 618 of the IDEA, for the timeliness of state complaint and due process hearing decisions; and
4. Longstanding Noncompliance: The Department considered:
a. Whether the Department imposed Special Conditions on the state’s FFY 2014 IDEA Part C grant award and those Special Conditions were in effect at the time of the 2015 determination and the number of years for which the state’s Part C grant award had been subject to Special Conditions; and
b. Whether there were any findings of noncompliance identified in FFY 2011 or earlier by either the Department or the state that the state has not yet corrected.
Using the Compliance Matrix, a state was assigned a score of 0, 1, or 2 for each of the compliance indicators in item 1 above and for each of the additional factors listed in items 2 through 4 above. Using the cumulative possible number of points as the denominator, and using the actual points the state received in its scoring under these factors as the numerator, the Compliance Matrix reflected a Compliance Score.
Part C Results and Score
In making each state’s 2015 Part C determination, the Department used, for the first time, the FFY 2013 early childhood outcomes data that were reported under SPP/APR Indicator C3. States had been reporting these data for more than five years, and results elements related to data quality and child performance were considered in calculating the results scores in the manner described below.

200
Data quality was examined in terms of the completeness of the FFY 2013 Outcomes data and data anomalies identified within the state’s FFY 2013 Outcomes data compared to four years of historic data as follows:
(a) Data Completeness: The data completeness score was calculated using the total number of
Part C children who were included in the state’s FFY 2013 Outcomes data and the total number of children that the state reported exiting during FFY 2013 in its FFY 2013 IDEA section 618 Exiting data. Each state received a percentage that was computed by dividing the number of children reported in the state’s FFY 2013 Outcomes data by the number of children the state reported exited during FFY 2013 in the state’s FFY 2013 IDEA section 618 Exiting data. This percentage was used to score data completeness as follows: a state received a score of 2 if the percentage was at least 70 percent, a score of 1 if the percentage was between 34 percent and 69 percent, and a score of 0 if the percentage was less than 34 percent. The two states with approved sampling plans received a score of 2.
(b) Data Anomalies: The data anomalies score for each state represented a summary of the data anomalies in the state’s FFY 2013 Outcomes data. Previous publicly available data reported by and across all states for Indicator 3 (in the APRs for FFY 2009 through FFY 2012) were used to determine an expected range of responses for each progress category under the following three child outcome areas: Outcome A (positive social-emotional skills, including social relationships), Outcome B (acquisition and use of knowledge and skills, including early language/communication), and Outcome C (use of appropriate behaviors to meet their need). The following five progress categories were used under SPP/APR Indicator C3 for each of the three outcomes:
a. Percentage of infants and toddlers who did not improve functioning;
b. Percentage of infants and toddlers who improved functioning but not sufficient to move nearer to functioning comparable to same-aged peers;
c. Percentage of infants and toddlers who improved functioning to a level nearer to same-aged peers but did not reach it;
d. Percentage of infants and toddlers who improved functioning to reach a level comparable to same-aged peers; and
e. Percentage of infants and toddlers who maintained functioning at a level comparable to same-aged peers.
For each of the five progress categories for each of the three outcomes, a mean was calculated using publicly available data. A lower and upper scoring percentage was set at one standard deviation above and below the mean for the first progress category and two standard deviations above and below the mean for the other four progress categories. In cases where a state’s FFY 2013 score for a progress category was below the calculated "low percentage" or above the "high percentage" for that progress category for all states, the data in that particular category were considered an anomaly for that progress category. If a state’s score in a particular progress category was identified as an anomaly, the state

201
received a score of 0 for that category. A percentage that was equal to or between the low percentage and high percentage for each progress category received 1 point. Hence, a state could receive a total number of points between 0 and 15. Thus, a point total of 0 indicated that all 15 progress categories contained data anomalies, and a point total of 15 indicated that there were no data anomalies in all 15 progress categories. An overall data anomalies score of 0, 1, or 2 was based on the total points awarded. Each state received a data anomalies score of 2 if the total points received in all progress categories were 13 through 15, a data anomalies score of 1 for 10 through 12 points, and a data anomalies score of 0 for zero through nine points.
Child performance was measured by examining how each state’s FFY 2013 Outcomes data
compared with all other states’ FFY 2013 Outcomes data and examining the state’s performance change over time, which involved comparing each state’s FFY 2013 Outcomes data with its own FFY 2012 Outcomes data. The calculation of each of these results elements and scoring is further described below:
Data Comparison: The data comparison overall performance score represented how a state's FFY
2013 Outcomes data compared with other states' FFY 2013 Outcomes data. Each state received two scores for each of the three child outcome areas (A, B, and C). Specifically, states were scored for each outcome in terms of the following two summary statements: (1) Of those infants and toddlers who entered or exited early intervention below age expectations for the Outcome, the percentage who substantially increased their rate of growth by the time they turned 3 years of age or exited the program and (2) the percentage of infants and toddlers who were functioning within age expectations for the Outcome by the time they turned 3 years of age or exited the program. The state’s score on each of the resulting six summary statements was compared to the distribution of scores for the same summary statement for all states. The 10th and 90th percentile for each of the six summary statements was identified and used to assign points to performance outcome data for each summary statement. Each summary statement outcome was assigned 0, 1, or 2 points as follows. If a state’s summary statement value fell at or below the 10th percentile, that summary statement was assigned 0 or no points. If a state’s summary statement value fell between the 10th and 90th percentile, the summary statement was assigned 1 point. If a state’s summary statement value fell at or above the 90th percentile, the summary statement was assigned 2 points. The points were added across the six summary statements. A state could receive total points between 0 and 12, with the total points of 0 indicating all six summary statement values were below the 10th percentile, and a total points of 12 indicating all six summary statements were above the 90th percentile. An overall comparison summary statement score of 0, 1, or 2 was assigned based on the total points awarded as follows. States receiving a total of 9 through 12 points were assigned a score of 2; states receiving a total of 5 through 8 points were assigned a score of 1; states receiving a total of 4 points or less were assigned a score of 0.

202
Performance Change Over Time: The Overall Performance Change Score represented how each state’s FFY 2013 Outcomes data compared with its FFY 2012 Outcomes data and whether the state’s data demonstrated progress. The data in each Outcome Area were assigned a value of 0 if there was a statistically significant decrease from one year to the next, a value of 1 if there was no significant change, and a value of 2 if there was a statistically significant increase. The scores from all six Outcome Areas were totaled, resulting in a total number of points ranging from 0 to 12. The Overall Performance Change Score for this results element of 0, 1, or 2 for each state was based on the total points awarded. Each state received an Overall Performance Change Score of: 2 if the total points were 8 or above, a score of 1 for 4 through 7 points, and score of 0 for below 3 points.
Using the cumulative possible number of points as the denominator, and using as the numerator
the actual points the state received in its scoring under these factors, the Results Score was calculated.
Part C RDA Percentage and Determination
Each state’s RDA percentage was calculated by adding 50 percent of the state’s Results Score and 50 percent of the state’s Compliance Score. Based on the RDA Percentage, the state’s RDA Determination was defined as follows:
1. Meets Requirements: A state’s 2015 RDA Determination was Meets Requirements if the
RDA Percentage was at least 80 percent, unless the Department had imposed Special Conditions on the state’s last three IDEA Part C grant awards (i.e., for FFYs 2012, 2013, and 2014), and those Special Conditions were in effect at the time of the 2015 determination.
2. Needs Assistance: A state’s 2015 RDA Determination was Needs Assistance if the RDA Percentage was at least 60 percent but less than 80 percent. A state was also Needs Assistance if its RDA Percentage was 80 percent or above, but the Department had imposed Special Conditions on the state’s last three IDEA Part C grant awards (i.e., for FFYs 2012, 2013, and 2014), and those Special Conditions were in effect at the time of the 2015 determination.
3. Needs Intervention: A state’s 2015 RDA Determination was Needs Intervention if the RDA Percentage was less than 60 percent.
4. Needs Substantial Intervention: the Department did not make a determination of Needs Substantial Intervention for any state in 2015.
Enforcement
Sections 616(e) and 642 of IDEA require, under certain circumstances, that the secretary take an enforcement action(s) based on a state’s determination under section 616(d)(2)(A). Specifically, the secretary must take action when the Department has determined that a state: (1) needs assistance for two

203
or more consecutive years, (2) needs intervention for three or more consecutive years, or (3) at any time when the secretary determines that a state needs substantial intervention in implementing the requirements of IDEA or that there is a substantial failure to comply with any condition of a state’s eligibility under IDEA. The Department has taken enforcement actions based on the first two categories in the former sentence but, to date, no state has received a determination that it needs substantial intervention in implementing the requirements of IDEA.
Determination Status
In June 2015, the secretary issued determination letters on the implementation of IDEA to each SEA for Part B and to each state lead agency for Part C. Exhibit 80 shows the results of the FFY 2013 determinations by state for Part B; Exhibit 81 shows the results for Part C.

204
Exhibit 80. States determined to have met IDEA, Part B, requirements, by determination status: Federal fiscal year 2013
Determination status
Meets requirements Needs assistance
Needs assistance: two or more consecutive years
Needs intervention
Needs intervention: two consecutive years
Needs intervention: three or more consecutive years
Connecticut Delaware Alabama
Texas BIE
Indiana Federated States of Micronesia Alaska
District of Columbia
Iowa Florida American Samoa Kansas Georgia Arizona Kentucky Ohio Arkansas Maryland Virgin Islands California Massachusetts Colorado Minnesota Guam Missouri Hawaii Nebraska Idaho New Hampshire Illinois New Jersey Louisiana Oklahoma Maine Palau Michigan Pennsylvania Mississippi Republic of the Marshall Islands
Montana
Rhode Island Nevada Vermont New Mexico Virginia New York Wisconsin North Carolina Wyoming North Dakota Northern
Mariana Islands
Oregon Puerto Rico South Carolina South Dakota Tennessee Utah
Washington West Virginia NOTE: The FFY 2013 APR reporting period was from July 1, 2013, through June 30, 2014. Based on the states’ data submissions, the secretary of education made the determinations based on the totality of each state’s data, including its FFY 2013 APR data. These determinations were issued in June 2015. SOURCE: U.S. Department of Education, Office of Special Education Programs, “Part B State Performance Plan and Annual Performance Report State Determination Letters,” 2014 and 2015. Available at http://www2.ed.gov/fund/data/report/idea/partbspap/allyears.html (accessed Aug. 5, 2015).

205
Exhibit 81. States determined to have met IDEA, Part C, requirements, by determination status: Federal fiscal year 2013
Determination status
Meets requirements Needs assistance
Needs assistance: two or more consecutive years
Needs intervention
Needs intervention: two consecutive years
Needs intervention: three or more consecutive years
Alabama Alaska American Samoa
South Carolina
Colorado Arizona District of Columbia
Connecticut Arkansas Florida Delaware California Guam Georgia Louisiana Hawaii Idaho Michigan Illinois Indiana Mississippi Maine Iowa Missouri Massachusetts Kansas Nebraska Nevada Kentucky New Mexico New York Maryland Ohio North Dakota
Minnesota Oregon Northern Mariana Islands
Montana Pennsylvania Virgin Islands New Hampshire Puerto Rico New Jersey Rhode Island North Carolina South Dakota Oklahoma Tennessee Texas Vermont Utah Virginia Washington Wisconsin West Virginia Wyoming
NOTE: The FFY 2013 APR reporting period was from July 1, 2013, through June 30, 2014. Based on the states’ data submissions, the secretary of education made the FFY 2013 determinations, which were released in June 2015. SOURCE: U.S. Department of Education, Office of Special Education Programs, “Part C State Performance Plan and Annual Performance Report State Determination Letters,” 2014 and 2015. Available at http://www2.ed.gov/fund/data/report/idea/partcspap/allyears.html (accessed Aug. 5, 2015).
The results of an examination of the states’ Part B and Part C determinations for FFY 2012 and
FFY 2013 are presented in exhibits 82 and 83. A summation of the numbers presented in exhibit 82 shows that 21 states met the requirements for Part B in FFY 2013. In addition, this exhibit shows that between FFY 2012 and FFY 2013, seven states had a more positive determination or made progress; four states received a more negative determination or slipped; and 49 states received the same determination for both years. Five of the states that showed progress made sufficient progress to meet the requirements in FFY 2013. Of the 49 states that received the same determination status in both years, 16 met the requirements in both years; 30 were found to be in need of assistance for another year; and three were determined to be in need of intervention for another year.

206
Exhibit 82. Number of states determined to have met IDEA, Part B, requirements, by determination status and change in status: Federal fiscal years 2012 and 2013
Determination status FFY 2013 Change in determination status
since FFY 2012 Total Progress Slippage No change
Total 7 4 49 60 Meets requirements 5 0 16 21 Needs assistance 2 4 0 6 Needs assistance: two or more consecutive years 0 0 30 30 Needs intervention 0 0 0 0 Needs intervention: two consecutive years 0 0 1 1 Needs intervention: three or more consecutive years 0 0 2 2 NOTE: The FFY 2012 APR reporting period was from July 1, 2012, through June 30, 2013. Based on the states’ data submissions, the secretary of education made the FFY 2012 determinations, which were released in June 2014. The FFY 2013 APR reporting period was from July 1, 2013, through June 30, 2014. Based on the states’ data submissions, the secretary of education made the FFY 2013 determinations, which were released in June 2015. The 50 states, DC, PR, BIE, American Samoa, Guam, the Northern Mariana Islands, the Virgin Islands, the Federated States of Micronesia, the Republic of Palau, and the Republic of the Marshall Islands are included in this exhibit. SOURCE: U.S. Department of Education, Office of Special Education Programs, “Part B State Performance Plan and Annual Performance Report State Determination Letters,” 2014 and 2015. Available at http://www2.ed.gov/fund/data/report/idea/partbspap/allyears.html (accessed Aug. 5, 2015).
A summation of the numbers presented in exhibit 83 shows that 22 states met the requirements
for Part C in FFY 2013. In addition, this exhibit shows that between FFY 2012 and FFY 2013, six states had a more positive determination or made progress; 17 states received a more negative determination or slipped; and 33 states received the same determination for both years. Of the six states that showed progress, three made sufficient progress to meet the requirements in FFY 2013. Of the 33 states that received the same determination status in both years, 19 met the requirements in both years; 13 were found to be in need of assistance for another year; and one was found to be in need of intervention for another year.

207
Exhibit 83. Number of states determined to have met IDEA, Part C, requirements, by determination status and change in status: Federal fiscal years 2012 and 2013
Determination status FFY 2013 Change in determination status
since FFY 2012 Total Progress Slippage No change
Total 6 17 33 56 Meets requirements 3 0 19 22 Needs assistance 3 17 0 20 Needs assistance: two or more consecutive years 0 0 13 13 Needs intervention 0 0 0 0 Needs intervention: three or more consecutive years 0 0 1 1 NOTE: The FFY 2012 APR reporting period was from July 1, 2012, through June 30, 2013. Based on the states’ data submissions, the secretary of education made the FFY 2012 determinations, which were released in June 2014. The FFY 2013 APR reporting period was from July 1, 2013, through June 30, 2014. Based on the states’ data submissions, the secretary of education made the FFY 2013 determinations, which were released in June 2015. The 50 states, DC, PR, American Samoa, Guam, the Northern Mariana Islands, and the Virgin Islands are included in this exhibit. SOURCE: U.S. Department of Education, Office of Special Education Programs, “Part C State Performance Plan and Annual Performance Report State Determination Letters,” 2014 and 2015. Available at http://www2.ed.gov/fund/data/report/idea/partcspap/allyears.html (accessed Aug. 5, 2015).
As a result of the determinations for Part B and Part C issued to states for FFY 2012 and
FFY 2013, the secretary took enforcement actions against those states that were determined to need assistance for two or more consecutive years and the states determined to need intervention for three or more consecutive years. Subject to the provisions in section 616(e)(1)(A), the secretary advised each of the states that were determined to need assistance for two or more consecutive years of available sources of technical assistance (TA) that would help the state address the areas in which the state needed to improve. See https://osep.grads360.org/#program for additional information about the type of TA activities that are available and have been used in the past. Subject to the provisions in section 616(e)(2)(A) and (B), the secretary took enforcement actions for the states determined to need intervention for three or more consecutive years, as described in those states’ determination letters.
Status of Selected Indicators
This section summarizes the results of a 2015 analysis of two Part C indicators and two Part B indicators included in the states’ FFY 2013 APRs. In the APRs, states reported actual performance data from FFY 2013 on the indicators. The four indicators focus on early childhood transition and outcomes and include: Part C Indicator 8 (Early Childhood Transition), Part C Indicator 3 (Infant and Toddler outcomes), Part B Indicator 12 (Early Childhood Transition), and Part B Indicator 7 (Preschool Outcomes). The two early childhood transition indicators and the two outcome indicators were chosen for examination in this section because their data and the results of the 2015 analyses were sufficiently

208
complete to show how states performed on related Part C and B indicators, and they concern areas that are not addressed by data presented elsewhere in this report. This section summarizes states’ FFY 2013 actual performances on each indicator. Two documents, which are available online at https://osep.grads360.org/#program/spp-apr-resources, Part C State Performance Plan/Annual Performance Report 2015 Indicator Analyses and Part B State Performance Plan/Annual Performance Report 2015 Indicator Analyses, were used as the sources for the summaries of the results of the analysis of these indicators. Both sources were accessed on Oct. 9, 2015.
Early Childhood Transition: Part C Indicator 8
Part C Indicator 8, which is composed of three sub-indicators, measures the percentage of all children exiting Part C who received timely transition planning to support their transition from the IDEA, Part C early intervention program to preschool and other appropriate community services by their third birthday. Timely transition planning is measured by the following three sub-indicators: (a) individualized family service plans (IFSPs) with transition steps and services; (b) notification to the local education agency (LEA), if the child is potentially eligible for Part B; and (c) transition conference, if the child is eligible for Part B. Indicator 8 is a compliance indicator, and its three sub-indicators (8a, 8b, and 8c) have performance targets of 100 percent. These sub-indicators apply to the 50 states, the District of Columbia, Puerto Rico, American Samoa, Guam, the Northern Mariana Islands, and the Virgin Islands. Exhibit 84 displays the results of a 2015 analysis of FFY 2013 actual performance data on the three sub-indicators from the states for which Indicator 8 applies.

209
Exhibit 84. Number of states, by percentage of children exiting IDEA, Part C, who received timely transition planning by their third birthday, by sub-indicators of Part C Indicator 8: Federal fiscal year 2013
Percentage of childrena
Sub-indicator 8a: IFSPs with
transition steps and services
8b: Notification to LEA
8c: Transition conference
Number of states Number of states Number of states Total 56 56 56
90 to 100 48 44 45 80 to 89 4 8 8 70 to 79 3 0 3 60 to 69 0 2 0 50 to 59 1 0 0 Valid and reliable actual performance data not available 0 2 0 a“Percentage of children” measures a state’s performance on a sub-indicator of Part C Indicator 8, for which the target is 100 percent. NOTE: The FFY 2013 APR reporting period was from July 1, 2013, through June 30, 2014. The 50 states, DC, PR, American Samoa, Guam, the Northern Mariana Islands, and the Virgin Islands are included in this exhibit. SOURC209E: U.S. Department of Education, Office of Special Education Programs, “Part C State Performance Plan/Annual Performance Report 2015 Indicator Analyses,” 2015 (https://osep.grads360.org/#communities/pdc/documents/9033, accessed Oct. 9, 2015).
As shown in exhibit 84, 48 states reported that they had complied with the requirement of the
sub-indicator 8A concerning IFSPs with transition steps and services for 91 to 100 percent of the children. In contrast, 45 states reported meeting the requirement of sub-indicator 8C concerning a transition conference for 91 to 100 percent of the children, and 44 states reported that they had complied with the requirement of the sub-indicator 8b concerning notifications to the LEA for 91 to 100 percent of the children.
Early Childhood Transition: Part B Indicator 12
Part B Indicator 12 measures the percentage of children referred to Part B by Part C prior to age 3 who were found eligible for Part B and who had an individualized education program (IEP) developed and implemented by their third birthday. Indicator 12 is considered a compliance indicator with a target of 100 percent. This indicator applies to the 50 states, the District of Columbia, Puerto Rico, American Samoa, Guam, the Northern Mariana Islands, and the Virgin Islands. Exhibit 85 displays the results of a 2015 analysis of FFY 2013 actual performance data on Indicator 12 from the 56 states to which this indicator applies.

210
Exhibit 85. Number of states, by percentage of children referred to IDEA, Part B, by Part C prior to age 3 who were found eligible for Part B and who had individualized education programs (IEPs) developed and implemented by their third birthday: Federal fiscal year 2013
Percentage of childrena Number of states
Total 56 90 to 100 55 80 to 89 1 a“Percentage of children” measures a state’s performance on Part B Indicator 12, for which the target is 100 percent. NOTE: The FFY 2013 APR reporting period was from July 1, 2013, through June 30, 2014. The 50 states, DC, PR, American Samoa, Guam, the Northern Mariana Islands, and the Virgin Islands are included in this exhibit. SOURCE: U.S. Department of Education, Office of Special Education Programs, “Part B State Performance Plan/Annual Performance Report 2015 Indicator Analyses,” 2015 (https://osep.grads360.org/#communities/pdc/documents/9012, accessed Oct. 9, 2015).
For Indicator 12, 55 states reported percentages that were 90 to 100 percent of the target. Only one state reported a percentage less than 90 percent of the target, and its percentage was 82 percent.
Infant and Toddler Outcomes: Part C Indicator 3
Part C Indicator 3 measures the percentages of infants and toddlers with IFSPs who: (1) demonstrated improved outcomes during their time in Part C and (2) were functioning within age expectations regarding the outcomes by the time they turned 3 years of age or exited Part C. Each of the two measures took the following three outcomes into account: (a) positive social-emotional skills (including social relationships), (b) acquisition and use of knowledge and skills (including early language/communication and early literacy), and (c) use of appropriate behaviors to meet their needs. Indicator 3 is a results indicator and applies to the 50 states, the District of Columbia, Puerto Rico, American Samoa, Guam, the Northern Mariana Islands, and the Virgin Islands. Exhibits 86 and 87 display the results of a 2015 analysis of FFY 2013 actual performance data on Indicator 3 for the 56 states to which this indicator applied.

211
Exhibit 86. Number of states, by percentage of infants and toddlers with IFSPs who were below age expectation for the outcome when entering Part C who demonstrated improvement by age 3 or exit from Part C, by outcome type: Federal fiscal year 2013
Percentage of infants and toddlersa
Outcome Type
7a: Positive social-emotional skills
7b: Acquisition and use of knowledge and
skills 7c: Use of
appropriate behavior Number of states Number of states Number of states
Total 56 56 56 90 to 100 2 4 5 80 to 89 6 13 13 70 to 79 14 18 15 60 to 69 13 7 13 50 to 59 12 9 7 40 to 49 4 4 0 30 to 39 5 1 2 20 to 29 0 0 1 aPercentage of infants and toddlers identifies the percentage of infants and toddlers with IFSPs who were below age expectation for the outcome when entering Part C who demonstrated improvement regarding the outcome by age 3 or exit from Part C. NOTE: The FFY 2013 APR reporting period was from July 1, 2013, through June 30, 2014. The 50 states, DC, PR, American Samoa, Guam, the Northern Mariana Islands, the Virgin Islands, the Federated States of Micronesia, the Republic of Palau, and the Republic of the Marshall Islands are included in this exhibit. SOURCE: U.S. Department of Education, Office of Special Education Programs, “Part C State Performance Plan/Annual Performance Report 2015 Indicator Analyses,” 2015 (https://osep.grads360.org/#communities/pdc/documents/9033, accessed Oct. 9, 2015).
As shown in exhibit 86, the majority of infants and toddlers with IFSPs who were below age
expectation when entering Part C demonstrated by age 3 or exit from Part C improved social-emotional skills in 47 states, acquisition and use of knowledge and skills in 51 states, and use of appropriate behavior in 53 states.

212
Exhibit 87. Number of states, by percentage of infants and toddlers with IFSPs functioning at age expectation at age 3 or upon exiting Part C, by outcome type: Federal fiscal year 2013
Percentage of infants and toddlera
Outcome Type
3a: Positive social-emotional skills
3b: Acquisition and use of knowledge and
skills 3c: Use of
appropriate behavior Number of states Number of states Number of states
Total 56 56 56 90 to 100 0 0 0 80 to 89 2 1 3 70 to 79 7 2 7 60 to 69 17 7 18 50 to 59 19 21 17 40 to 49 8 15 6 30 to 39 3 9 3 20 to 29 0 0 1 10 to 19 0 0 1 0 to 9 0 1 0 aPercentage of infants and toddlers identifies the percentage of infants and toddlers with IFSPs who met the age expectation for the outcome at age 3 or upon exiting Part C. NOTE: The FFY 2013 APR reporting period was from July 1, 2013, through June 30, 2014. The 50 states, the District of Columbia, Puerto Rico, American Samoa, Guam, the Northern Mariana Islands, and the Virgin Islands are included in this exhibit. SOURCE: U.S. Department of Education, Office of Special Education Programs, “Part C State Performance Plan/Annual Performance Report 2015 Indicator Analyses,” 2015 (https://osep.grads360.org/#communities/pdc/documents/9033, accessed Oct. 9, 2015).
As shown in exhibit 87, the majority of infants and toddlers with IFSPs were at age 3 or upon
exiting Part C functioning at age expectation with regard to social-emotional skills in 45 states, acquisition and use of knowledge and skills in 31 states, and use of appropriate behavior in 45 states.
Preschool Outcomes: Part B Indicator 7
Part B Indicator 7 measures the percentages of preschool children with IEPs who: (1) demonstrated improved outcomes during their time in preschool, and (2) were functioning within age expectations regarding the outcomes by the time they turned 6 years of age or exited Part B. Each of the two measures took into account the following three outcomes: (a) positive social-emotional skills (including social relationships); (b) acquisition and use of knowledge and skills (including early language/communication and early literacy); and (c) use of appropriate behaviors to meet their needs. Indicator 7 is a results indicator and applies to the 50 states, the District of Columbia, Puerto Rico, the BIE, American Samoa, Guam, the Northern Mariana Islands, the Virgin Islands, the Federated States of Micronesia, the Republic of Palau, and the Republic of the Marshall Islands. Exhibits 88 and 89 display

213
the results of a 2015 analysis of FFY 2013 actual performance data on Indicator 7 for the 60 states for which this indicator applies.
Exhibit 88. Number of states, by percentage of children with IEPs who were below age expectation
for the outcome when entering Part B who demonstrated improvement by age 6 or exit from Part B, by outcome type: Federal fiscal year 2013
Percentage of childrena
Outcome Type
7a: Positive social-emotional skills
7b: Acquisition and use of knowledge and
skills 7c: Use of
appropriate behavior Number of states Number of states Number of states
Total 60 60 60 90 to 100 12 9 12 80 to 89 26 26 25 70 to 79 13 13 10 60 to 69 4 11 6 50 to 59 4 1 5 40 to 49 1 0 2 aPercentage of children identifies the percentage of children with IEPs who were below age expectation for the outcome when entering Part B who demonstrated improvement regarding the outcome by age 6 or exit from Part B. NOTE: The FFY 2013 APR reporting period was from July 1, 2013, through June 30, 2014. The 50 states, DC, PR, BIE, American Samoa, Guam, the Northern Mariana Islands, the Virgin Islands, the Federated States of Micronesia, the Republic of Palau, and the Republic of the Marshall Islands are included in this exhibit. SOURCE: U.S. Department of Education, Office of Special Education Programs, “Part B State Performance Plan/Annual Performance Report 2015 Indicator Analyses,” 2015 (https://osep.grads360.org/#communities/pdc/documents/9012, accessed Oct. 9, 2015).
As shown in exhibit 88, the majority of children with IEPs who were below age expectation when
entering Part B demonstrated by age 6 or exit from Part B improved social-emotional skills in 59 states, acquisition and use of knowledge and skills in 60 states, and use of appropriate behavior in 58 states.

214
Exhibit 89. Number of states, by percentage of children with IEPs functioning at age expectation at age 6 or upon exiting Part B, by outcome type: Federal fiscal year 2013
Percentage of childrena
Outcome Type
7a: Positive social-emotional skills
7b: Acquisition and use of knowledge and
skills 7c: Use of
appropriate behavior Number of states Number of states Number of states
Total 60 60 60 90 to 100 2 0 1 80 to 89 4 1 2 70 to 79 4 3 18 60 to 69 20 14 23 50 to 59 16 19 9 40 to 49 8 12 2 30 to 39 4 5 3 20 to29 1 5 1 10 to 19 1 1 1 aPercentage of children identifies the percentage of children with IEPs who were functioning at the age expectation for the outcome at age 6 or upon exiting Part B. NOTE: The FFY 2013 APR reporting period was from July 1, 2013, through June 30, 2014. The 50 states, DC, PR, BIE, American Samoa, Guam, the Northern Mariana Islands, the Virgin Islands, the Federated States of Micronesia, the Republic of Palau, and the Republic of the Marshall Islands are included in this exhibit. SOURCE: U.S. Department of Education, Office of Special Education Programs, “Part B State Performance Plan/Annual Performance Report 2015 Indicator Analyses,” 2015 (https://osep.grads360.org/#communities/pdc/documents/9012, accessed Oct. 9, 2015).
As shown in exhibit 89, the majority of children with IEPs at age 6 or upon exiting Part B were
functioning at the age expectation with regard to social-emotional skills in 46 states, acquisition and use of knowledge and skills in 37 states, and use of appropriate behavior in 53 states.

Section IV
Summary of Research Conducted Under Part E of the Education Sciences Reform Act of 2002


217
Summary of Research Conducted Under Part E of the Education Sciences Reform Act of 2002
In December 2004, Congress reauthorized the Individuals with Disabilities Education Act (IDEA) and, in doing so, amended the Education Sciences Reform Act of 2002, 20 U.S.C. 9501, et seq., by adding a new Part E. The new Part E established the National Center for Special Education Research (NCSER) as part of the Institute of Education Sciences (IES). Prior to the reauthorization of IDEA, the U.S. Department of Education’s Office of Special Education Programs (OSEP) was responsible for carrying out research related to special education. NCSER began operation on July 1, 2005. As specified in section 175(b) of the Education Sciences Reform Act of 2002, NCSER’s mission is to
• Sponsor research to expand knowledge and understanding of the needs of infants, toddlers,
and children with disabilities in order to improve the developmental, educational, and transitional results of such individuals;
• Sponsor research to improve services provided under, and support the implementation of, IDEA; and
• Evaluate the implementation and effectiveness of IDEA in coordination with the National Center for Education Evaluation and Regional Assistance.
In federal fiscal year (FFY) 2015 (i.e., Oct. 1, 2014, through Sept. 30, 2015), NCSER conducted two grant competitions: Special Education Research Competition and Special Education Research Training Competition. In FFY 2015, 264 applications were peer reviewed, and 32 new research and research training grants were awarded across the two grant programs.
Descriptions of projects funded by NCSER grants in FFY 2015 under Part E of the Education
Sciences Reform Act of 2002 follow. The descriptions summarize the proposed purposes of the projects
based on information taken from the research grants and contracts database on the IES website. NCSER
awarded 31 grants for its Special Education Research Competition program under the following eight
topics: Autism Spectrum Disorders; Cognition and Student Learning in Special Education; Early
Intervention and Early Learning in Special Education; Mathematics and Science Education; Professional
Development for Teachers and Related Services Providers; Reading, Writing, and Language
Development; Social and Behavioral Outcomes to Support Learning; and Transition Outcomes for
Secondary Students With Disabilities. NCSER made no awards for the Families of Children with
Disabilities; Special Education Policy, Finance, and Systems; and Technology for Special Education
topics in FFY 2015. NCSER awarded one grant for the FFY 2015 Special Education Research Training
Competition. The descriptions of the Special Education Research Program Grants are organized and

218
presented in terms of the eight topics. Following them is a description of the Special Education Research
Training Competition grant NCSER awarded under the Early Career Development and Mentoring in
Special Education topic. Additional information on the projects funded in FFY 2015 and continuing
projects can be found at http://ies.ed.gov/funding/grantsearch/ (accessed Aug. 14, 2015).
Autism Spectrum Disorders Award Number: R324A150032 Institution: University of Rochester Principal Investigator: Tristram Smith Description: Development and Pilot Testing of the Students with Autism Accessing General Education (SAAGE) Model. This project will develop a comprehensive intervention to increase the quality of educational services and access to inclusive settings for students with co-occurring autism spectrum disorder (ASD) and intellectual disability (ID) in elementary school. Existing support systems in many schools do not sufficiently meet the needs of these students, and there is a wide gap between what is known from research regarding best practices and current educational practices. This intervention will be designed to reduce that gap to improve social and academic outcomes for students with ASD and ID. In Year 1, researchers will conduct focus groups with stakeholders and obtain feedback from experts in the field to refine the initial modules and develop the complete and comprehensive SAAGE intervention and all required implementation materials. In Year 2, feasibility testing and the assessment of parent and teacher satisfaction with the intervention will make up the last stages of refining the model and finalizing implementation measures. In Year 3, researchers will conduct a pilot study to assess the promise of the intervention using a randomized controlled trial. The project is expected to produce a fully developed intervention, SAAGE, along with companion training materials, modules, and manuals that will improve educational services and access to inclusive settings for students with ASD and co-occurring ID. In addition, products will include peer-reviewed publications and presentations, including outreach to districts and schools. Amount: $1,500,000 Period of Performance: 7/1/2015–6/30/2018 Cognition and Student Learning in Special Education Award Number: R324A150171 Institution: University of Texas Health Science Center at Houston Principal Investigator: Carolyn Denton Description: Idea Detectives: Individualized Intervention in Reading Comprehension and Word Reading Based on Best Evidence from Cognitive Science. The aim of this project is to apply advances in cognitive science in text processing to further the development of an intensive and research-based reading intervention, Idea Detectives, for students in grades 2 and 3 who are at risk for or identified as having serious reading difficulties or disabilities (RD). In the absence of quality intervention, students with reading difficulties in the primary grades are likely to maintain these deficits throughout school. To address this need, many schools are implementing Response to Intervention (RtI) or Multi-tiered Systems of Support (MTSS) models that include a focus on reading outcomes. This project will develop a Tier 3 intervention intended to accelerate the reading progress of students who have demonstrated inadequate response to previously provided intervention. The research team will design Idea Detectives to integrate specific supports for children with impaired phonemic awareness, oral language development, working memory, attentional control, and self-regulation. It will enable targeted, systematic intervention in word reading, fluency, and comprehension. The research team will develop the intervention through an iterative process of development and examine its promise using a randomized controlled trial. The project is

219
expected to produce a fully developed intervention with evidence of feasibility and promise for accelerating the reading skills of students with RD within an RtI framework and result in peer-reviewed publications and presentations. Amount: $1,499,998 Period of Performance: 7/1/2015–6/30/2018 Award Number: R324A150023 Institution: Regents of the University of Michigan Principal Investigator: Priti Shah Description: Combined Cognitive and Motivational Interventions for ADHD. In this project, the research team will develop an enhanced working memory (WM) training intervention, including a motivational component. Also, the team will assess the intervention to identify malleable factors that could promote positive academic and behavioral outcomes, including those that were observed in the research team's prior NCSER-funded study. In Study 1, the team will develop the motivational component of the intervention targeting increased self-efficacy skills of students with attention deficit hyperactivity disorder (ADHD). The team will incorporate explicit training in motivation and in theories about the malleability of intelligence. In Study 2, the team will modify the WM intervention developed previously by altering the procedures by which student performance on the task is assessed. Finally, the team will combine the motivational component (developed in Study 1) and the revised WM intervention (modified in Study 2). In Study 3, the team will assess the enhanced WM training to determine whether the identified malleable factors are associated with positive academic and behavioral outcomes. In Study 4, the team will examine mediators such as motivation as well as the transfer of cognitive skills to promote positive outcomes. The project is expected to result in an understanding of the mechanisms by which WM improves on-task behaviors, attention, and academic outcomes for students with ADHD. In addition, the project is expected to provide preliminary evidence of any additional malleable factors (motivation in particular) for students receiving WM interventions. Results of the project will include peer-reviewed publications and presentations. Amount: $1,599,750 Period of Performance: 7/1/2015–6/30/2019 Award Number: R324A150035 Institution: University of Kentucky Research Foundation Principal Investigator: Brian Bottge Description: Developing Enhanced Assessment Tools for Capturing Students’ Procedural Skills and Conceptual Understanding in Math. The purpose of this measurement study is to develop, test, and refine a set of assessments for measuring the conceptual understanding and procedural math skills of middle school students with math difficulties (MD). Traditional measurement methods often do not effectively capture what students with MD know and are able to do in mathematics. Despite best efforts, many students with MD are still unsure of what test items are asking of them. In addition, current test formats do little to improve the field’s understanding of the kinds of errors that students are likely to make. This project will develop mathematics tests that are intended to help students with MD gain a deeper understanding of the problem contexts and the questions posed, thereby seeking to minimize variability in scores due to irrelevant constructs, such as problem decoding. During the first year, the research team will develop and refine a set of three new assessments: Interactive Computer-Based Test (ICBT), Formative Fractions Assessment (FFA), and Diagnostic Fractions Computation Test (DFCT). The team also will develop training materials for teachers and develop and revise scoring protocols. The second and third years will involve multiple studies to determine the extent to which the new measures can assess student understanding relative to paper-and-pencil versions of the measures that existed from prior research studies. Additional activities across the years include the refinement and extension of psychometric models to aid in the interpretation of test scores and student misconceptions of math concepts, including rational numbers. The project is expected to produce fully developed versions of the ICBT, FFA, and

220
DFCT as well as evidence of validity and reliability for the developed measures and result in publications and presentations. Amount: $1,599,999 Period of Performance: 7/1/2015–6/30/2019 Award Number: R324A150029 Institution: Vanderbilt University Principal Investigator: Fred Bess Description: Measurement of Listening Fatigue in School-Age Children with Disabilities. This project will result in a validated measure to assess listening fatigue for children in grades 1–12 with hearing loss and other communication-based disabilities. Previous studies, including those conducted as part of a prior NCSER-funded project, indicate that school-age children with hearing loss and specific language impairment are at increased risk for listening fatigue in their classes. Increased listening effort and the associated stress and fatigue can jeopardize the ability to learn, thus increasing the risk for problems in school. The development of a valid, sensitive measure of listening fatigue is critical to improving the understanding of fatigue in children with communication-based disabilities and is a prerequisite for development and assessment of effective intervention strategies for students with communication disorders. In Phase 1 of this project, researchers will gather qualitative data on fatigue outcomes through focus groups and cognitive interviews. Results will inform the development of the scale, and experts will review the content at the end of this phase. In Phase 2, researchers will conduct a preliminary test of the developed fatigue scale to run psychometric analyses that inform revisions. In Phase 3, researchers will field test the fatigue scale for further psychometric analyses to inform final revisions and complete the tool. The project is expected to produce a fully validated measure of listening fatigue and a companion user manual and result in peer-reviewed publications and presentations. Amount: $1,600,000 Period of Performance: 7/1/2015–6/30/2019 Early Intervention and Early Learning in Special Education Award Number: R324A150149 Institution: Oregon Social Learning Center Principal Investigator: Katherine Pears Description: Long-Term Effects of the Kids in Transition to School (KITS) Program for Children with Developmental Disabilities and Behavioral Problems. This study will examine the long-term effects of the KITS Program, an intervention aimed at enhancing the school readiness of young children with co-occurring developmental disabilities and behavioral problems, on children's functioning in elementary school. Children with these co-occurring problems are at particularly high risk for school readiness deficits, which may lead to further negative educational outcomes. In a previous IES-funded study, the principal investigator conducted a randomized controlled trial with preschool children with developmental disabilities and behavior problems and their families to examine the impact of KITS on school readiness through grade 1. The intervention demonstrated positive effects on early literacy, self-regulation, and parent involvement in school at the end of kindergarten. The current study will follow approximately 203 children and families who participated in the original efficacy trial to determine child outcomes through grade 5. Using a variety of data analysis techniques, the team will investigate the long-term impact of the intervention on academic competence, social-emotional functioning, and positive teacher-student relationships. The team also will examine mediators (school readiness and positive parenting) and moderators (child, family, school, and services characteristics) of the relationships between the intervention and late elementary school outcomes. In addition, the team will conduct a cost-effectiveness analysis of the KITS Program. The project is expected to produce evidence of the long-term effects of the KITS Program on children with co-occurring developmental disabilities and behavior

221
problems and cost effectiveness of the intervention and result in peer-reviewed publications and presentations. Amount: $1,299,872 Period of Performance: 7/1/2015–6/30/2018 Award Number: R324A150211 Institution: University of California, Davis Principal Investigator: Sally Rogers Description: Adapting an Evidence-Based Practice for Children At-Risk for Autism for Diverse Early Intervention Service Systems. The goal of this project is to improve developmental outcomes and school readiness of infants and toddlers at risk for autism spectrum disorders (ASD) and their families. The research team will adapt an existing empirically supported practice—the Early Start Denver Model (ESDM)—for use in the Program for Infants and Toddlers with Disabilities (Part C) of the Individuals with Disabilities Education Act (IDEA) intervention systems in low-income, ethnically diverse community settings. As rates of ASD continue to increase, more infants and toddlers with ASD are entering the Part C system. Improved access to effective care will reduce long-term costs and service intensity for these children at risk for ASD in later years and improve child outcomes over time. The research team will conduct project activities in four phases. In the exploration phase, the researchers will obtain a comprehensive understanding of community needs and barriers to serving children with ASD in early intervention. In the following phase, the team will work collaboratively with Part C administrators, providers, and families to adapt the ESDM for use in Part C services. Next, the team will implement the revised model, Community Adapted Early Start Denver Model (C-ESDM), in diverse Part C agencies using individualized implementation plans. Finally, the pilot study will examine the feasibility and fidelity of C-ESDM implementation and the promise for improving child and family outcomes. The project is expected to produce a manual that contains the modified and adapted assessment instrument and implementation procedures for the C-ESDM, a training package for Part C providers and families that will increase the effectiveness of intervention services for infants and toddlers at risk for ASD, and result in peer-reviewed publications and presentations. Amount: $1,498,581 Period of Performance: 7/1/2015–8/31/2018 Award Number: R324A150094 Institution: Vanderbilt University Principal Investigator: Ann Kaiser Description: An Efficacy Trial of J-EMT: Enhanced Milieu Teaching Language Intervention plus Joint Attention, Engagement and Regulation Intervention for Toddlers with Autism. This project will evaluate the efficacy of an early social communication and language intervention, the J-EMT, for improving outcomes of toddlers with autism spectrum disorders (ASD). Social communication skills are particularly important for this population, as a deficit in this area constitutes a core characteristic of ASD. The intervention is aimed at toddlers because the majority of children with ASD can be identified accurately by 24 months of age, and acquisition of communication skills by 36 months of age is a significant predictor of long-term language outcomes. The study team will use a randomized controlled trial to determine the impact of J-EMT on the social communication skills, receptive and expressive language, symbolic play, and symbol-infused joint engagement on toddlers with ASD and on parental use of language support strategies. The team will randomly assign approximately 120 children to the treatment or a business-as-usual control condition, and the children will participate in their services (intervention or typical community services) for six months. Primary data collection will occur before, immediately after, and six months after the intervention period. The study team will analyze data to examine the impact of J-EMT on measures of children's social communication, language, and related skills, as well as potential moderators of the impact. The project is expected to enhance the understanding of the efficacy of J-EMT

222
on the social communication outcomes for toddlers with ASD and their parents and result in peer-reviewed publications and presentations. Amount: $3,499,197 Period of Performance: 7/1/2015–6/30/2019 Award Number: R324A150074 Institution: University of Massachusetts, Boston Principal Investigator: Patricia Favazza Description: CHildren in Action: Motor Program for Preschoolers (CHAMPPS). The purpose of this project is to fully develop a classwide motor skills intervention, CHAMPPS, for preschool children with developmental disabilities. Many of these children have delays in motor development, yet they do not engage in structured motor play and physical activities to improve these skills. Enhancing motor development is an important goal itself, but fundamental motor skills are also linked to the development of cognitive processes and social skills. This study will focus on the development of an intervention that supports motor development in the context of motor play, including universal design for learning (UDL) lessons and physical activities, with the aim of improving children's motor, social, and cognitive development. The research team will refine and complete development of a motor skills intervention, CHAMPPS, aimed at improving outcomes for preschool children with developmental disabilities or delays while implemented classwide in inclusive settings. In the first two years, the team will develop the curriculum iteratively and field test it in eight classrooms per year. In the final year, the team will pilot test CHAMPPS by randomly assigning classrooms to the intervention or a business-as-usual control condition to evaluate the promise of the intervention for improving children's motor skills and cognitive and social development. The project is expected to produce a fully developed intervention that provides support in motor development for children with developmental disabilities or delays and result in peer-reviewed publications and conference presentations. Amount: $1,419,002 Period of Performance: 7/1/2015–6/30/2018 Award Number: R324A150103 Institution: Duquesne University Principal Investigator: Regina Harbourne Description: Efficacy of the START-Play Program for Infants with Neuromotor Disorders. The purpose of this project is to evaluate the efficacy of Sitting Together and Reaching to Play (START-Play), an intervention designed to target sitting, reaching, and motor-based problem solving to improve development and readiness to learn in infants with motor delays or dysfunction. There is limited research examining the efficacy of early physical intervention on infants with neuromotor dysfunction. In addition, most early motor interventions have not been linked directly to learning, despite the research demonstrating an association between motor activity and cognitive skills. START-Play specifically targets motor skills that lead to greater physical exploration, which has been associated with improved problem solving and global development. The research team will conduct a randomized controlled trial of START-Play across four states to investigate the impact of the intervention on changes over time in sitting and reaching, subsequent changes in global cognitive development, and the mediating influences of motor skill changes and problem solving. Approximately 140 infants will receive either the intervention or services as usual for three months, with follow-up assessments at three time points up until nine months post intervention. The team will examine group differences in outcomes, as well as potential moderators and mediators. This project is expected to produce evidence of the efficacy of START-Play on motor skill development and global cognitive development and result in peer-reviewed publications and presentations. Amount: $3,430,109 Period of Performance: 7/1/2015–6/30/2019

223
Award Number: R324A150132 Institution: University of South Florida Principal Investigator: Howard Goldstein Description: Explicit Vocabulary Instruction in Automated Listening Centers for Young Children with Language Delays. The purpose of this project is to complete the development of a technology-based curriculum program, Story Friends. The curriculum, which focuses on vocabulary, is designed to supplement a core reading program and be implemented with high levels of fidelity in a variety of preschool settings and instructional programs. Substantial differences in vocabulary skills can exist among children entering preschool. Preschoolers with limited oral language skills are at high risk for reading disabilities. However, many early childhood classrooms provide limited instruction in vocabulary, suggesting that preschoolers most at risk for reading disabilities are unlikely to receive the critical instruction on oral language that they need. Story Friends is intended to improve oral language skills of preschoolers most at risk for later reading disabilities and thereby reduce the incidence and severity of potential reading disabilities. A series of iterative activities will occur over a three-year period to develop the storybooks and accompanying lessons, teacher materials, and curriculum-based measures. The research team will conduct a pilot study to determine the feasibility and promise of the intervention for improving oral language, vocabulary, and comprehension skills. The research team will also investigate whether fidelity of treatment and use of teacher materials predict student outcomes. The project is expected to produce a fully developed intervention, Story Friends, and result in peer-reviewed publications and presentations. Amount: $1,499,971 Period of Performance: 7/1/2015–6/30/2018 Award Number: R324A150076 Institution: University of Florida Principal Investigator: Patricia Snyder Description: Impact of Professional Development on Preschool Teachers’ Use of Embedded-Instruction Practices: An Efficacy Trial of Tools for Teachers. The goal of this study is to examine the efficacy of Tools for Teachers (TfT), a professional development intervention that was developed and pilot tested through previous NCSER funding to improve teacher implementation of embedded instruction with preschool children with disabilities. Embedded instruction involves intentional teaching of individual child learning goals within the context of routine classroom activities. Prior research has found evidence that this approach can be effective with young children with varying disabilities, but it is not always implemented with fidelity. Therefore, the research team created this professional development program to support teachers in implementing the strategy with children. This study will use a randomized controlled trial to compare the efficacy of two versions of the TfT professional development program—using on-site coaching versus web-based self-coaching—to one another and to a control group to determine the effects on teacher practices and child outcomes. The research team will randomly assign 108 early childhood special education teachers to one of the two TfT conditions (on-site coaching or self-coaching) or to a business-as-usual control group. Each teacher will have three target children with a developmental delay or disability in his or her classroom. The research team will collect child, teacher, and classroom data in four waves throughout the implementation year. During the sustainability year, the team will collect teacher and classroom data. The team will analyze data to determine group differences in outcomes, with additional analyses used to examine mediation, moderation, and sustainability of instructional practices in the second year. The project is expected to produce evidence of the efficacy of the TfT professional development intervention, including the relative efficacy of the two versions, and result in peer-reviewed publications and presentations. Amount: $3,498,113 Period of Performance: 7/1/2015–6/30/2019

224
Award Number: R324A150221 Institution: Oregon Research Institute Principal Investigator: Edward Feil Description: Preschool First Step to Success: An Efficacy Replication Study. The purpose of this project is to replicate, via a randomized controlled trial, the efficacy of the preschool adaptation of the First Step to Success intervention for improving child behavior and social skills outcomes and the overall school readiness of preschool children who are at high risk for the development of oppositional and conduct disorders. There is a need to intervene early with young children who are exhibiting early signs of these disorders, before the severity and intensity of their problems increase. Results from a prior efficacy trial provided promising evidence that participating in Preschool First Step to Success (PFS) reduces children's problem behaviors and increases their social skills. This project aims to replicate those findings with a diverse population of students. This study will use a cluster randomized controlled trial design that nests teachers and classrooms within early childhood program centers. The research team will randomly assign 48 early childhood centers across two states to the PFS or control condition. A total of 244 teachers/classrooms (average of five classes per building) and 192 children and families from low-income households will participate. PFS will be implemented over a three-month period, with a booster session implemented one year later with the children, their parents, and their teachers. Data will be collected at baseline and approximately two months and one year after the intervention to determine the immediate and distal impacts of the intervention on child outcomes and examine potential moderating and mediating factors. The project is expected to produce evidence of the efficacy of PFS on student behavioral and school readiness outcomes for preschool children who are at high risk for the development of oppositional and conduct disorders and result in peer-reviewed publications and presentations. Amount: $3,499,924 Period of Performance: 7/1/2015–6/30/2019 Award Number: R324A150145 Institution: University of Oregon Principal Investigator: Jane Squires Description: Project SELECT: Social Emotional Learning in Early Childhood for Infants and Toddlers. The purpose of this project is to develop a social-emotional intervention, Social Emotional Learning in Early Childhood for Infants and Toddlers (SELECT) to increase the quality of key parent-child interaction skills, improve children's social-emotional skills, and ultimately improve school readiness for infants and toddlers with disabilities. Significant numbers of infants and toddlers—particularly those with developmental disabilities—have social-emotional problems that are neither recognized nor targeted for intervention. Although relationships between early social-emotional competence and later academic success have been documented, little attention has been given to the development of a curriculum-based approach aimed at evaluating important social-emotional constructs and tying the evaluation to simple, straightforward, routines-based early intervention in the home. The research team will use an iterative process to develop an intervention for infants and toddlers and their parents in home visiting programs. The team will use data from multiple sources, including interventionists and parents, in the development process to guide revisions. The research team will document the feasibility and promise of the intervention through two types of studies. The feasibility study will consist of preliminary tests of the intervention to examine acceptability and feasibility using child performance data and provider feedback to further guide, evaluate, and enhance the intervention. The pilot study will use a single-subject multiple baseline design to examine fidelity of implementation and the promise for enhancing parent-child interaction skills and improved child social-emotional competence. The project is expected to produce a fully developed intervention package aimed at improving young children's social-emotional skills and child-parent interactions; provide evidence of feasibility, fidelity, and promise; and result in peer-reviewed publications and presentations. Amount: $1,500,000 Period of Performance: 9/1/2015–8/31/2019

225
Award Number: R324A150063 Institution: Michigan State University Principal Investigator: Lori Skibbe Description: The Development and Validation of the Inventory of Phonological Awareness using Alternative Responses (IPAAR): An Assessment of Phonological Awareness Appropriate for Children with Speech Production Difficulties. The purpose of this study is to develop a computerized adaptive test of phonological awareness, called the Inventory of Phonological Awareness using Alternative Responses (IPAAR). Phonological awareness, the explicit awareness of and ability to manipulate the sound structure of language, is a key predictor of later literacy development. However, there are no standardized, validated tools of phonological awareness suited to meet the needs of children with limited speech production, despite the critical nature of this emergent literacy skill. This project will address this gap by developing the IPAAR to assess levels of phonological awareness for children with speech production difficulties as well as a wide range of children with and without disabilities. The development and evaluation of the IPAAR will occur in three phases. During the first phase, the research team will create and revise items, assessment instructions, and the user interface. The team will administer the item pool to approximately 1,000 children without disabilities during the second phase to calibrate and eliminate items, create a common scale of phonological awareness, and examine construct validity. During the third phase, the team will administer the final IPAAR to 300 children with speech production difficulties to assess item validity for this population. The research team will analyze data to determine the items to use and the instrument's validity. The project is expected to produce a new assessment called the IPAAR to assess levels of phonological awareness for children with speech production difficulties and a website to make the assessment widely available. Amount: $1,598,920 Period of Performance: 7/1/2015–6/30/2019 Award Number: R324A150166 Institution: University of Kansas Principal Investigator: Dale Walker Description: Validation of Cognitive Problem-Solving and Movement Infant Toddler IGDIs for Screening and General Outcome Progress Monitoring. This study will examine the reliability and validity of two Individual Growth and Development Indicators (IGDIs)—the Early Cognitive Problem Solving Indicator (EPSI) and the Early Movement Indicator (EMI)—designed for screening and progress monitoring in intervention decision making with infants and toddlers with and without disabilities. High-quality services for young children with or at risk for disabilities increasingly rely on the use of data for decision making. The IGDIs were designed to meet this need. They are fully developed brief assessments with evidence of feasibility for practitioners to administer. This project’s research team will conduct parallel studies to determine whether the EPSI and EMI are reliable and valid, are sensitive to growth over time, and have predictive utility for screening decisions. Using both extant and prospective data from similarly aged samples of children, the study team will investigate the psychometric properties of the EPSI and EMI. For each of the two measures, the team will assess children quarterly from ages 6 months to 36 months, with follow-up data collected at age 48 months. In addition to examining reliability and validity, the study team will analyze data to determine a variety of other characteristics of the assessments, including normative benchmarks for each age, sensitivity to growth and change over time, and the predictive value of the measures for use in screening decisions. The project is expected to produce information on the psychometric properties of the EPSI and EMI and the predictive utility of using data from these measures for intervention decision making for infants and toddlers with and without disabilities and result in peer-reviewed publications and presentations. Amount: $1,599,995 Period of Performance: 7/1/2015–6/30/2019

226
Mathematics and Science Education Award Number: R324A150078 Institution: University of Texas, Austin Principal Investigator: Sarah Powell Description: Developing Connections Between Word Problems and Mathematical Equations to Promote Word-Problem Performance Among Students with Mathematics Difficulty. The purpose of this efficacy study is to assess whether equation-solving instruction, conducted within the context of word-problem tutoring, leads to improved word-problem-solving outcomes. Word-problem proficiency is necessary to demonstrate successful mathematics performance. Many students, however, are inadequately prepared to solve word problems. This is especially true for students with or at risk for mathematics difficulty (MD). Students with or at risk for MD demonstrate significantly lower word-problem performance and make significantly more errors when solving word problems than peers without MD. Given the importance of word-problem competency and the need to enhance this skill in students with MD, there is a critical need to determine the efficacy of word-problem interventions for students with MD. During each of the first three years of the project, the researchers will recruit 150 students with MD and randomly assign them to one of three conditions—two competing word-problem tutoring programs (with and without equation-solving instruction) or a business-as-usual comparison. Tutoring will take place in each of the first three years along with fall and spring measurement and data collection. Maintenance testing will occur during the second year for Year 1 students and during the third year for Year 2 students. The final year of the project will involve maintenance testing on the Year 3 students and dissemination activities. The project is expected to produce evidence of the efficacy of an intervention for improving equation solving and word-problem performance for low-performing and at-risk learners and result in peer-reviewed publications and presentations. Amount: $3,013,726 Period of Performance: 7/1/2015–6/30/2019 Award Number: R324A150126 Institution: Pennsylvania State University Principal Investigator: Paul Morgan Description: Science Learning Difficulties: Patterns and Predictions in a Nationally Representative Cohort. The purpose of this project is to analyze nationally representative and longitudinal data to identify factors associated with or predictive of science learning difficulties in elementary and middle school. Some groups of elementary and middle school students are far more likely to experience low science achievement, although the factors leading to this greater risk are poorly understood. Students with disabilities, low-income students, and English language learners often display very low levels of science achievement. This research project will focus on two types of student profiles: (1) students with repeated science learning difficulties who persistently experience low science achievement and slow achievement growth over time and (2) students with resolved science learning difficulties who initially experience low science achievement but then demonstrate average achievement growth over time. Relevant predictors will include socio-demographic variables (e.g., family socioeconomic status); student characteristics (e.g., behavioral self-regulation, prior reading and mathematics achievement); instructional, teacher, and school characteristics (e.g., class time spent on science instruction, teacher's educational background); and interactions between these variables. Researchers will analyze the Early Childhood Longitudinal Study, Kindergarten Cohort (ECLS-K) dataset to identify factors associated with or predictive of science learning difficulties, examine inter-relations between these factors, and determine which factors may be most educationally relevant for addressing science learning difficulties in the United States. The project is expected to develop an understanding of the relative stability of science learning difficulties over the elementary and middle school years and potential factors that may help prevent or reduce science learning difficulties among at-risk students. The team will disseminate findings through published articles in peer-reviewed journals and presentations at national conferences.

227
Amount: $700,000 Period of Performance: 7/1/15–6/30/17 Professional Development for Teachers and Related Services Providers Award Number: R324A150152 Institution: Boise State University Principal Investigator: Evelyn Johnson Description: RESET: Recognizing Effective Special Education Teachers. The purpose of this project is to develop and validate a special education teacher observation measure, Recognizing Effective Special Education Teachers (RESET), designed to evaluate and improve instructional practice delivered to students with disabilities. The challenges of evaluating special education teachers are significant. Special educators work under a variety of conditions, serve a heterogeneous group of students with disabilities, enter the profession with varying skill levels, and may require additional instruction to meet the needs of struggling learners. These factors establish a need for an evaluation system that will help lead to high-quality, evidence-based instructional techniques focused on improving outcomes of students with disabilities in a variety of teaching contexts. This study aims to meet this need through RESET, an evaluation tool intended to gain a greater understanding of the characteristics, processes, and outcomes that are associated with high-quality instructional practices for students with disabilities. Using evaluation criteria the research team previously developed, the team will prepare the RESET observation tool and accompanying user manual for testing. The team will collect approximately 500 hours of video of teachers' instruction to use in determining the reliability and validity of RESET. The team will recruit and train 25 teachers not included in the videos and ask them to rate the video data according to RESET criteria. The research team will use data obtained from the teacher ratings of the video to finalize the RESET tool. The project is expected to produce evidence of validity and reliability for RESET use with special educators and result in peer-reviewed publications and presentations. Amount: $1,588,173 Period of Performance: 7/1/2015–6/30/2019 Award Number: R324A150047 Institution: University of North Carolina, Chapel Hill Principal Investigator: Samuel Odom Description: An Efficacy Study of the School-based National Professional Development Center on Autism Spectrum Disorders Model (NPDC). This project will assess the efficacy of a widely used professional development model that promotes program quality, teachers' use of evidence-based practices (EBPs), and positive outcomes for elementary school students with autism spectrum disorder (ASD). The study will respond to a national need to prepare teachers to implement effective, research-based educational programs for students with ASD to improve behavioral, social, and academic outcomes for these students. The researchers will conduct a randomized controlled trial of the effect of the NPDC model on elementary school, teacher, and student outcomes. Approximately 60 schools will be randomly assigned to the treatment or control condition. Researchers will train and support teachers and school-based teams at the study schools to provide appropriate and individualized interventions using EBPs to participating students. Data will be collected via school records, online assessment, and direct assessment in the beginning and end of the year-long implementation to determine whether the NPDC model leads to improved outcomes for students with ASD. The project is expected to produce evidence of the efficacy of the NPDC model for improving program quality and teachers’ use of EBPs for students with ASD and for promoting positive behavioral, social, and academic student outcomes. In addition, the project will result in peer-reviewed publications and presentations. Amount: $3,498,529 Period of Performance: 7/1/2015–6/30/2019

228
Award Number: R324A150181 Institution: University of Maryland, College Park Principal Investigator: Jade Wexler Description: Improving Content-Area Literacy Instruction in Middle Schools (Project CALI). The purpose of this project is to develop a middle school co-teaching program that improves collaboration between general (content-area) and special education teachers and, ultimately, reading skills and content-area knowledge of students with disabilities. The level of literacy necessary for postsecondary education and employment has increased dramatically over the last 20 years. However, many students with disabilities are not receiving sufficient literacy instruction in content-area classes to have any measurable impact on reading achievement. Co-teaching models hold great potential for promoting inclusion and building content-area knowledge and basic reading skills of students with disabilities. These models include both content-area teachers and special education teachers providing instruction to students with disabilities in the general classroom. Co-teaching models, however, can lead to confusion about roles and responsibilities, leading to minimal support for students with disabilities. This project will develop a systematic co-teaching model for middle school to address these concerns. The research team will use an iterative process to guide the creation of the professional development program and gather data to evaluate its usability, feasibility, and promise. In Years 1 and 2, the team will develop the program iteratively through a series of five cycles. In Year 3, the team will evaluate the promise of the program for improving teacher outcomes and student reading skills and content area knowledge. The project is expected to produce a fully developed professional development program focused on co-teaching and result in peer-reviewed publications and presentations. Amount: $1,500,000 Period of Performance: 7/1/2015–6/30/2018 Award Number: R324A150059 Institution: University of Washington Principal Investigator: Gregory Benner Description: Literacy Study Group for Teachers of Students with Emotional and Behavioral Disorders. The purpose of this project is to develop Literacy Study Group (LSG), a web-based professional development intervention designed to assist special education teachers in delivering high-quality reading instruction to elementary school students with emotional and behavioral disorders (EBD). Students with EBD are likely to experience significant reading difficulties, which are strongly correlated with low academic achievement, school dropout, conduct and social problems, and unemployment. Many of these children are also less likely to have access to reading instruction because of their placement in self-contained classrooms where they receive little or no reading instruction and because many teachers are unprepared to meet the instructional needs of this population. However, there is growing evidence that students with EBD are responsive to effective reading instruction when it is available. The project will use an iterative design approach to develop the LSG professional development intervention, which will focus on improving elementary special education teachers' abilities to deliver high-quality literacy instruction. In Years 1 and 2, the project will undergo three phases in which the research team will develop reading modules of the LSG prototype using teacher feedback and focus groups. In Year 3, the research team will assess the feasibility, efficiency, and usability of implementing LSG based on teacher feedback. The final year of the project will involve a randomized controlled trial to evaluate the promise of the fully developed LSG intervention. The project is expected to produce a fully developed LSG professional development program for elementary school teachers of students with EBD and result in peer-reviewed publications and presentations. Amount: $1,499,444 Period of Performance: 7/1/2015–6/30/2019

229
Award Number: R324A150231 Institution: Boston University Principal Investigator: Nathan Jones Description: Validating an Observation Protocol for the Evaluation of Special Educators. This project is designed to validate Charlotte Danielson's Framework for Teaching (FFT)—a widely used observation scheme—for use in the evaluation of special education teachers. Research suggests that teachers play an important role in improving student achievement; therefore, there has been recent attention to research on how to conduct teacher observations and measure instructional quality. Most of this research (including recent validity and reliability studies of the FFT) has been conducted with general education teachers, not special educators. Thus, there is a lack of high-quality, research-based tools to assess special educator teacher quality. This study will provide insights into the strengths and limitations of using the FFT with special educators and greater understanding of the characteristics, processes, and outcomes that are associated with high-quality special education classroom contexts. Researchers will investigate whether judgments of special educator teaching quality can be made on the basis of FFT scores. In Year 1, research efforts will focus primarily on data collection via 320 videotaped classroom observations of 80 teachers in grades 3-5. Year 2 will focus on training special education experts to score the classroom observations. Researchers will train raters on using FFT and the Reading Instruction in Special Education (RISE) instruments, and raters will begin scoring videotaped lessons. In Year 3, raters will score all 320 lessons using FFT and RISE. The end of Year 3 and Year 4 will focus on data analysis to determine the validity and reliability of the FFT instrument. The project is expected to produce evidence of validity and reliability for FFT use with special educators, annual written reports to the state and participating districts, a summative report to the participating state in the final year, and scoring support resources (e.g., a set of questions to encourage rater reflection, brief video clips of exemplary practice) that will lead to more accurate and valid scores in special education settings. Other products will include conference presentations, scholarly journal publications, and distribution of results through the Collaboration for Effective Educator Development, Accountability, and Reform (CEEDAR) Center. Amount: $1,600,000 Period of Performance: 7/1/2015–6/30/2019 Reading, Writing, and Language Development Award Number: R324A150021 Institution: San Francisco State University Principal Investigator: Pamela Hunt Description: Implementing an Emergent Literacy Program for Students with Intellectual Disabilities and Autism in General Education Classrooms. The purpose of this project is to evaluate the efficacy of the Early Literacy Skills Builder for increasing the literacy skills of students with severe intellectual disabilities or autism spectrum disorder (ASD) when it is implemented in small group contexts in general education classrooms. The Early Literacy Skills Builder curriculum is designed to meet the diverse instructional needs of young students who are verbal or nonverbal. Literacy outcomes for students with intellectual disabilities or ASD are typically poor. In addition, their instruction is often provided in settings outside of the general education classrooms and away from their peers without disabilities. The research team will evaluate whether an intervention that has been shown to be efficacious for improving early literacy outcomes in segregated settings can be efficacious when implemented in inclusive general education settings and whether it will result in changes in attitudes toward disability among peers without disabilities. The study team will use a randomized controlled trial to study the efficacy of the Early Literacy Skills Builder with pairs of students randomly assigned to the treatment group or business-as-usual control group. Approximately 80 students in kindergarten through fourth grade identified as having moderate to severe intellectual disabilities, multiple disabilities, or ASD will participate. This study will also include a rotating set of classmates to participate in the small group instruction so that the intervention can take place as part of an integrated small-group setting. Students will be assessed every

230
two months during the school year to determine whether students who receive Early Literacy Skills Builder have better reading outcomes than those in the control group. The project is expected to produce evidence of the efficacy of Early Literacy Skills Builder for improving reading outcomes of students with severe intellectual disabilities, peer-reviewed publications, and presentations. Amount: $2,750,825 Period of Performance: 9/1/2015–8/31/2018 Award Number: R324A150091 Institution: Regents of the University of California Principal Investigator: Emily Solari Description: Testing the Efficacy of Reading RULES: A Tier 1 and Tier 2 Intervention for First-Grade Children with Decoding and Comprehension Difficulties. The purpose of this project is to evaluate the efficacy of Reading RULES for first-grade students who are at risk for serious reading difficulties and disabilities in both word reading and comprehension. Students who do not learn to read adequately in the early grades typically have persistent reading difficulties. Potential persistent reading problems may be prevented or their severity reduced if they are addressed aggressively and early. Reading RULES combines whole-class and intensive small-group intervention designed to improve word reading, fluency, listening, and reading comprehension. Approximately 96 first-grade classrooms will participate in this research project. The study will focus on five first-grade students from each classroom who are at risk for reading difficulties in both word reading and comprehension. The research team will use a randomized controlled trial to study the efficacy of the intervention, with teachers randomly assigned to either the intervention or business-as-usual control group. The team will assess students before, during, and after intervention and when they are in second grade to determine whether students who receive Reading RULES have better reading outcomes than those in the control group. The project is expected to provide evidence of the efficacy of Reading RULES for improving reading outcomes and result in peer-reviewed publications and presentations. Amount: $3,499,893 Period of Performance: 7/1/2015–6/30/2019 Social and Behavioral Outcomes to Support Learning Award Number: R324A150071 Institution: Northeastern University Principal Investigator: Robert Volpe Description: Development and Validation of a Web-Based System for Monitoring Social Behavior. The purpose of this project is to develop tools for progress monitoring of social behavior, particularly for use in monitoring the impact of Tier 2 and 3 school-based interventions targeting academic enablers (study skills, interpersonal skills, motivation, and academic engagement) and externalizing behavior (disruptive and oppositional behavior) for students in kindergarten through third grade. Direct Behavior Rating (DBR) is one promising method for assessing social behavior. DBR has been described as a hybrid assessment tool, melding the characteristics of both behavior rating scales and systematic direct observation. Although the reliability and validity evidence for DBR has grown in recent years, research has focused almost exclusively on the evaluation of three single-item behavior scales (i.e., engagement, disruptive behavior, and noncompliance) completed using traditional paper measures. The research team will improve upon existing DBR research by moving beyond single-item DBR scales to developing multi-item scales and expanding the types of behaviors measured. In addition, the team will develop mobile-enabled, web-based tools for rating and summarizing student behavior using the newly developed DBR scales. In the assessment development phase, the research team will develop and refine the pool of DBR items for the multi-item scales. Next, in the assessment evaluation phase, the team will evaluate the reliability, validity, and treatment sensitivity of the DBR scales. In the technology development phase, the team will develop mobile-enabled, web-based tools for rating and summarizing student behaviors using

231
the newly developed DBR scales and refine the system based on user feedback to maximize feasibility, procedural integrity, and instrument utility. The project is expected to produce validated web-based DBR scales and tools for progress monitoring of social behavior for students in grades K–3 and result in peer-reviewed publications and presentations. Amount: $1,599,252 Period of Performance: 8/1/2015–7/31/2019 Award Number: R324A150179 Institution: University of Louisville Research Foundation, Inc. Principal Investigator: Andy Frey Description: Efficacy of Enhanced First Step to Success Intervention for Tertiary-Level Students with Disruptive Behavior. The purpose of this project is to examine the efficacy of the Tertiary First Step to Success (TFS) intervention for improving social, behavioral, and academic outcomes of students in kindergarten through grade 3 with or at risk for developing severe behavior disorders. TFS was developed through previous NCSER funding and includes classroom and home components implemented with the children, their parents, and their teachers. Research has shown that children's home experiences, particularly parenting practices at home that support children's adjustment to the social and educational demands of school, are linked to children’s mental health and educational success. TFS has demonstrated promise for improving behavior and education outcomes for students in this age range with severe problem behaviors, but the efficacy of the intervention has not yet been tested. In each year of the study, the research team will recruit 16 schools (64 total) to participate. Within each school, the study team will recruit six to seven teachers and randomly assign them to one of four conditions: (a) home-only component, (b) school-only component, (c) school-plus-home component, and (d) usual care. In the fall of each year, teachers in each participating classroom will identify students who exhibit serious externalizing behaviors. The research team will recruit the student identified with the most significant behavior problem to participate. The design will result in 100 teacher-student dyads in each condition. The research team will complete baseline data collection prior to randomization and will conduct outcome assessments immediately after completion of the intervention as well as six months post intervention. The project is expected to produce evidence of the efficacy of the TFS program for students with or at risk for developing severe behavior disorders in kindergarten through grade 3 and result in peer-reviewed publications and presentations. Amount: $3,497,001 Period of Performance: 7/1/2015–6/30/2019 Transition Outcomes for Secondary Students With Disabilities Award Number: R324A150046 Institution: University of Oregon Principal Investigator: Lauren Lindstrom Description: Paths 2 the Future: Testing the Efficacy of a Career Development Intervention for High School Girls with Disabilities. The purpose of this efficacy project is to determine whether the Paths 2 the Future (P2F) intervention produces a beneficial effect on education and career outcomes for high school girls with high-incidence disabilities. P2F is a fully developed, gender-specific career development intervention that was developed and pilot tested through previous NCSER funding. High school girls with disabilities face unique challenges in gaining employment, accessing postsecondary education, living independently, and fully participating in their communities. More research-based interventions are needed to address these barriers and improve post-school outcomes for this population. The research team will use a cluster randomized controlled trial to examine the efficacy of P2F. Approximately 24 schools and 480 high school girls with high-incidence disabilities will participate. The team will collect data at three time points (before, immediately after, and six months after the intervention). In their analyses, the team will examine the effects of the P2F intervention on the education and career outcomes of participating

232
high school girls with high-incidence disabilities, as well as potential mediating and moderating effects. The project is expected to produce evidence of the efficacy of the P2F curriculum in increasing career knowledge and skills (e.g., self-determination, disability knowledge, gender awareness, career and college readiness) and engagement in career-related activities (e.g., enrollment in career technical education, work experience, and paid employment) and result in peer-reviewed publications and presentations. Amount: $3,499,674 Period of Performance: 7/1/2015–6/30/2019 Award Number: R324A150137 Institution: American Institutes for Research (AIR) Principal Investigator: Dan Goldhaber Description: Predictors of Intermediate and Postsecondary Outcomes for Students with Disabilities. The purpose of this project is to identify malleable factors in public high schools that are predictive of the academic, behavioral, transition, and postsecondary success of students with disabilities. Information obtained from this study can inform future interventions to promote postsecondary success for these students. Little empirical attention has focused on the factors that influence outcomes for students with disabilities despite a large federal investment in special education services and the evidence that students with disabilities continue to lag behind their peers in terms of college access and employment success. The study team will analyze extant data from Washington State public schools and other sources of public data on youth after high school to examine three malleable factors for students receiving special education services: (1) enrollment in vocational education or workforce skills courses, (2) percent of the school day spent in general education classrooms, and (3) credentials and estimated performance of the students' high school teachers. The study team will examine these malleable factors as predictors of the academic, behavioral, transition, and postsecondary success of students with disabilities. The project is expected to produce preliminary evidence of malleable factors for students receiving special education services in public high schools that lead to positive student outcomes and result in peer-reviewed publications and reports, and presentations. Amount: $806,405 Period of Performance: 7/1/2015–6/30/2017 Award Number: R324A150138 Institution: University of Oregon Principal Investigator: Deanne Unruh Description: READY FOR WAGES: Research on Employment of Adjudicated Youth through Working at Gaining Employment Social Skills Curriculum. This project will assess the efficacy of READY for WAGES, a research-based social skills curriculum developed and pilot tested through previous NCSER funding, for promoting positive employment-related skills and outcomes for incarcerated juvenile offenders with disabilities in long-term facilities. Adolescents with disabilities are overrepresented in the juvenile justice system, and young offenders with disabilities are even more at risk for poor outcomes related to sustained employment than their peer offenders. In addition, juvenile offenders are costly to our society, in legal and incarceration costs as well as victims' person costs. Reducing recidivism rates can reduce these costs. Interventions are needed to target employment-related skills for young offenders, in particular those with disabilities, as they exit youth correctional facilities. The research team will conduct a cluster randomized controlled trial to assess the effect of the READY for WAGES curriculum on the outcomes of juvenile offenders with disabilities in youth correctional facilities. The READY for WAGES curriculum includes 14 lessons designed for implementation over a nine-week term in high school classes of approximately 50 minutes per day as offered in these facilities. The research team will compare students in the intervention classes to those in business-as-usual control classes on outcomes pre- and post intervention to determine the efficacy of the intervention. The project is expected to produce evidence of the efficacy of READY for WAGES in increasing employment-related skills and employment as well as

233
reducing recidivism rates for juvenile offenders with disabilities who have exited youth correctional facilities. Products of the project will include peer-reviewed publications and presentations. Amount: $3,500,000 Period of Performance: 9/1/2015–8/31/2019 Early Career Development and Mentoring in Special Education Award Number: R324B150004 Institution: Clemson University Principal Investigator: Robin Parks Ennis Description: Empowering Teachers with Low-Intensity Strategies to Support Instruction II. The principal investigator (PI) will conduct a program of research for improving outcomes for students with emotional disturbance (ED) while developing skills related to this research, including establishing partnerships with schools and districts, analyzing data using multi-level modeling and other advanced statistical techniques, and writing competitive grant proposals. The PI intends to develop a training model for teachers to implement a classroom-based, low-intensity strategy called Instructional Choice. Unlike other training models, the newly developed model will require little support from training providers. It is intended to improve academic and behavior outcomes for students with and at risk for ED. A three-phase process will guide the development of the professional development model for teachers. During the first phase, the PI will develop the training model and solicit feedback from a national panel of experts and practitioners. Usability studies of the intervention will take place during the second phase to examine potential effects on teacher implementation and student outcomes and to inform further development. A small randomized controlled trial will be implemented in the third phase to examine the promise of the developed model. Amount: $394,610 Period of Performance: 8/1/2015–7/31/2019


Section V
Summary of Studies and Evaluations Under Section 664 of IDEA


237
Summary of Studies and Evaluations Under Section 664 of IDEA
In the December 2004 reauthorization of the Individuals with Disabilities Education Act (IDEA), Congress required the secretary to delegate to the director of the Institute of Education Sciences (IES) responsibility to conduct studies and evaluations under sections 664(a), (b), and (c) of IDEA. This section of the annual report describes studies authorized by sections 664(a) and 664(c) of the law; the next section (Section VI) describes studies that contribute to the national assessment of IDEA required by section 664(b).
As specified in section 664(a), IES, either directly or through grants, contracts, or cooperative
agreements awarded to eligible entities on a competitive basis, assesses the progress in the implementation of IDEA. This includes the effectiveness of state and local efforts to provide (1) a free appropriate public education to children with disabilities and (2) early intervention services to infants and toddlers with disabilities and infants and toddlers who would be at risk of having substantial developmental delays if early intervention services were not provided to them. Under section 664(a), IES supports rigorous studies and evaluations that (1) analyze the impact of state and local efforts to improve educational and transitional services for children with disabilities; (2) analyze state and local needs for professional development, parent training, and other appropriate activities to reduce the need for disciplinary actions involving children with disabilities; (3) assess educational and transitional services and results for children with disabilities from minority backgrounds; (4) measure educational and transitional services and results for children with disabilities, including longitudinal studies; and (5) identify and report on the placement of children with disabilities by disability category.
As specified in section 664(c) of IDEA, IES is required to conduct a national study or studies
related to students with disabilities who take alternate assessments. In particular, IES is responsible for carrying out a national study or studies that examine (1) the criteria that states use to determine eligibility for alternate assessments and the number and type of children who take those assessments and are held accountable to alternate achievement standards; (2) the validity and reliability of alternate assessment instruments and procedures; (3) the alignment of alternate assessments and alternate achievement standards to state academic content standards in reading, mathematics, and science; and (4) the use and effectiveness of alternate assessments in appropriately measuring student progress and outcomes specific to individualized instructional need.
The National Center for Special Education Research (NCSER) and the National Center for
Education Evaluation and Regional Assistance (NCEE), which are part of IES, are responsible for and collaborate on studies and evaluations conducted under sections 664(a), (b), and (c) of IDEA. The

238
following studies, authorized by section 664(a) of IDEA and supported by IES, were ongoing during federal fiscal year 2015 (i.e., Oct. 1, 2014, through Sept. 30, 2015). Contract Number: ED-IES-10-C-0048 Contractor: Westat Project Director: Karen Tourangeau Description: Early Childhood Longitudinal Study, Kindergarten Class of 2010–11 (ECLS-K:2011), First- and Second-Grade Data Collections. The ECLS-K:2011 is the third in a series of longitudinal studies conducted by the National Center for Education Statistics to examine children’s early learning and development, transitions into kindergarten and beyond, and progress through school. It is following a cohort of children from their kindergarten year (the 2010–11 school year) through the 2015–16 school year, when most of the children are expected to be in fifth grade. Approximately 18,000 children participated in the first year of the study, which included data collections in fall 2010 and spring 2011. The study design also includes data collections in fall 2011 and spring 2012, when most of the children were in first grade; fall 2012 and spring 2013, when most of the children were in second grade; spring 2014, when most of the children were in third grade; spring 2015, when most of the children were in fourth grade; and spring 2016, when most of the children are expected to be in fifth grade. This particular contract covered national data collections in spring 2012, fall 2012, and spring 2013. These data collections included one-on-one direct child assessments (measuring knowledge and skills in reading, mathematics, and science, as well as executive function, height, and weight); computer-assisted parent interviews; and surveys for general classroom teachers, special education teachers of children receiving special education services, and school administrators. In addition, an evaluation of children’s hearing was conducted in the fall 2012 collection. Data collection from special education teachers on study children with an individualized education program and from classroom teachers and school administrators on Response to Intervention practices in study schools was supported with IDEA studies and evaluations funding ($859,454). A report on findings from the first-grade rounds of the study was released in November 2014 and is available at https://nces.ed.gov/pubsearch/pubsinfo.asp?pubid=2015109. A report on findings from the second-grade rounds of the study was released in May 2015 and is available at https://nces.ed.gov/pubsearch/pubsinfo.asp?pubid=2015077 (accessed Sept. 1, 2015). Amount: $31,347,491 Period of Performance: 8/20/2010–2/19/2015 Contract Number: ED-IES-12-C-0037 Contractor: Westat Project Director: Karen Tourangeau Description: Early Childhood Longitudinal Study, Kindergarten Class of 2010–11 (ECLS-K:2011), Third- and Fourth-Grade Data Collections. The ECLS-K:2011 is the third in a series of longitudinal studies conducted by the National Center for Education Statistics to examine children’s early learning and development, transitions into kindergarten and beyond, and progress through school. It is following a cohort of children from their kindergarten year (the 2010–11 school year) through the 2015–16 school year, when most of the children are expected to be in fifth grade. Approximately 18,000 children participated in the first year of the study, which included data collections in fall 2010 and spring 2011. The study design also includes data collections in fall 2011 and spring 2012, when most of the children were in first grade; fall 2012 and spring 2013, when most of the children were in second grade; spring 2014, when most of the children were in third grade; spring 2015, when most of the children were in fourth grade; and spring 2016, when most of the children are expected to be in fifth grade. This particular contract covers national data collections in spring 2014 and spring 2015. These data collections included one-on-one direct child assessments (measuring knowledge and skills in reading, mathematics, and science, as well as executive function, height, and weight); a child questionnaire; computer-assisted parent interviews; and surveys for general classroom teachers, special education teachers of children

239
receiving special education services, and school administrators. In addition, an evaluation of children’s hearing was conducted in the spring 2014 collection. Data collection from special education teachers on study children with an individualized education program and from classroom teachers and school administrators on Response to Intervention practices in study schools was supported with IDEA studies and evaluations funding ($350,926). A report on findings from the third-grade round of the study was released in May 2016 and is available at http://nces.ed.gov/pubs2016/2016094.pdf. A report on findings from the fourth-grade round of the study is expected to be available at http://nces.ed.gov/ecls (accessed Sept. 20, 2016). Amount: $28,346,941 Period of Performance: 6/29/2012–6/28/2017 Contract Number: ED-CFO-10A-0133/0002 Contractor: SRI International, Westat, RMCE, and Compass Evaluation and Research Project Director: Jose Blackorby Description: Study of Early Intervention and Special Education Services and Personnel. This study is supporting the analysis of extant data to examine early intervention and special education service delivery and the personnel providing services. The study is examining how early intervention service delivery varies across states; how special education and related services received by children and youths vary over time, across states, and by school characteristics; and how the distribution of personnel providing special education services varies over time, across states, and by school characteristics. Among the extant data sources the study team is using are cross-sectional data from the IDEA section 618 data states submit to the U.S. Department of Education and from the Schools and Staffing Survey. The report from this study will be available at http://ies.ed.gov/ncee (accessed Sept.1, 2015). Amount: $1,149,233 Period of Performance: 9/17/2010–9/16/2016 Contract Number: ED-IES-10-C-0073 Contractor: Mathematica Policy Research and University of Minnesota Institute on Community Integration (ICI) Project Director: Joshua Haimson Description: National Longitudinal Transition Study 2012 (NLTS 2012) (also referred to as Study of Transition Outcomes for Youth with Disabilities, Phase I). This study is the third in a series examining the characteristics and school experiences of a nationally representative sample of youths with disabilities. The study is addressing several questions. What are the personal, family, and school characteristics of youths with disabilities in public schools across the country? What regular education, special education, transition planning, and other relevant services and accommodations do youths with disabilities receive? How do the services and accommodations differ from those for youths not served under IDEA, including those identified for services under section 504 of the Rehabilitation Act of 1973? How do the services and accommodations for youths with disabilities vary with youth characteristics? How much have the services and accommodations of youths with disabilities changed over time? The NLTS 2012 focuses on a group of about 12,000 students ages 13 to 21 (in December 2011), of which 10,000 were students with individualized education programs across the federal disability categories. Data collection includes surveys of youths and their parents/ guardians. The study team gathered information in spring 2012 and summer 2013 to describe the transition experiences of youths and outcomes as they prepare to leave school. The study team also conducted a systematic review of the research literature on post-high-school transition programs for youths with disabilities. A report reviewing evidence on improving post-high-school outcomes for youths with disabilities was released in August 2013 and is available at http://ies.ed.gov/ncee/pubs/20134011/index.asp (accessed June 27, 2016). Reports describing the survey results will be announced on http://ies.ed.gov/ncee (accessed Sept. 1, 2015). Amount: $24,093,405 Period of Performance: 9/27/2010–2/26/2017


Section VI
Extent and Progress of the Assessment of National Activities


243
Extent and Progress of the Assessment of National Activities
As specified in section 664(b) of the Individuals with Disabilities Education Act (IDEA), as reauthorized in 2004, the secretary has the responsibility to conduct a “national assessment” of activities carried out with federal funds under IDEA. The secretary has delegated to the Institute of Education Sciences (IES), [in accordance with section 664(a) of IDEA] the responsibility for performing this national assessment [as required by section 664(b)] of the implementation and effectiveness of IDEA and of the federal, state, and local programs and services supported under the law. IES is carrying out this national assessment to determine the effectiveness of IDEA in achieving the law’s purpose and to collect information on how to implement IDEA more effectively. Information generated through this national assessment is intended to help federal policy makers and state and local administrators implement the law more effectively and help federal policy makers shape future legislation regarding infants, toddlers, preschoolers, children, and youths with disabilities. The National Center for Education Evaluation and Regional Assistance (NCEE), which is part of IES, is responsible for the national assessment of IDEA, in coordination with the National Center for Special Education Research (NCSER) at IES. NCEE supported the following studies and evaluations related to the national assessment during federal fiscal year (FFY) 2015 (i.e., Oct. 1, 2014, through Sept. 30, 2015).
Contract Number: ED-04-CO-0025/0013 Contractor: American Institutes for Research and NORC at the University of Chicago Project Director: Mengli Song Description: Study of School Accountability for Students with Disabilities. This study described the extent to which schools are accountable for the performance of the students with disabilities (SWD) subgroup under the Elementary and Secondary Education Act, how adequate yearly progress and school improvement status of schools vary with school accountability status, and how regular and special education practices for students with disabilities vary with school accountability for the SWD subgroup. Data sources for the evaluation included extant data from the U.S. Department of Education’s EDFacts database and 2011 surveys of principals and special education designees from elementary and middle schools in 12 states. The evaluation addressed three research questions: (1) To what extent are schools accountable for the performance of the SWD subgroup, and how does this accountability vary across schools and over time? (2) To what extent have schools accountable for the SWD subgroup been identified as needing improvement? (3) How does school accountability for the SWD subgroup relate to regular and special education practices for SWD? An interim report, relying on analysis of EDFacts data from 2005–06 to 2008–09 school years from up to 40 states, was released in May 2012 and is available at http://ies.ed.gov/ncee/pubs/20124056/ (accessed Sept. 1, 2015). An update on the interim report, using data through the 2009–10 school year from up to 44 states, was released in October 2013 and is available at http://ies.ed.gov/ncee/pubs/20134017/ (accessed Sept. 1, 2015). A third report, relying on analysis of data from EDFacts and 2011 surveys of school staff in 12 states, was released in February 2015 and is available at http://ies.ed.gov/ncee/pubs/20154006/ (accessed Sept. 1, 2015). Amount: $3,626,218 Period of Performance: 2/28/2008–2/27/2015

244
Contract Number: ED-04-CO-0111/0003 Contractor: MDRC, SRI International, Instructional Research Group, and Survey Research Management Project Director: Fred Doolittle Description: Evaluation of Response to Intervention Practices for Elementary School Reading. Response to Intervention (RtI) is a multi-step approach to providing early and more intensive intervention and monitoring within the general education setting. In principle, RtI begins with research-based instruction and behavioral support provided to students in the general education classroom, followed by screening of all students to identify those who may need systematic progress monitoring, intervention, or support. Students who are not responding to the general education curriculum and instruction are provided with increasingly intense interventions through a "tiered" system, and they are monitored frequently to assess their progress and inform the choice of future interventions, including, possibly, special education for students determined to have a disability. This evaluation investigated the effects on grades 1–3 reading achievement of providing intensive interventions to children who have been identified as at risk for reading difficulties. This study also investigated the range of RtI practices for early grade reading that a representative sample of schools in 13 states are using and how schools experienced with RtI vary the intensity of reading instruction to children based on student benchmark reading performance. The evaluation relied on a combination of regression discontinuity methods and descriptive comparisons. Site recruitment and data collection occurred in 2011 and 2012. The report from this study was released in November 2015 and is available at http://ies.ed.gov/ncee/pubs/20164000/ (accessed June 27, 2016). Amount: $14,204,339 Period of Performance: 3/25/2008–3/24/2016 Contract Number: ED-04-CO-0059/0032 Contractor: Westat and Empatha Project Director: Tamara Daley Description: National Evaluation of the IDEA Technical Assistance and Dissemination Program. As specified in IDEA Part D, the Technical Assistance and Dissemination (TA&D) Program is to provide technical assistance, support model demonstration projects, disseminate useful information, and implement activities that are supported by scientifically based research to meet the needs of children with disabilities. The national evaluation of the IDEA TA&D Program is designed to describe the products and services provided by the TA&D Program grantees, state and local needs for technical assistance, and the role that the TA&D Program plays in meeting those needs and supporting implementation of IDEA 2004. Research questions focus on three topic areas: (1) description of needs for and uses of TA&D services: What are the areas in which states and local providers report needing and/or receiving technical assistance to support IDEA implementation across all education levels? Which services are seen as most helpful in contributing to the improvement of key student outcomes, and what are the perceived barriers to local-level implementation? (2) description of TA&D grantee services: What are the TA&D Network objectives and provider areas of practice? How do TA&D grantees identify their clients, assess their needs, and develop and maintain their relationship with clients? (3) relationship between technical assistance and implementation of practices and policy: To what extent is assistance from TA&D grantees perceived as helpful in the implementation of special education policies and practices, and how satisfied are customers with the support they receive related to the implementation of IDEA? Data collection for the interim report occurred in 2011 and 2012 and included administering surveys to TA&D Program grantees, all state IDEA Part B and Part C administrators, and a sample of state-level special education program staff. An interim report based on these data was released in October 2013 and is available at http://ies.ed.gov/ncee/pubs/20144000/ (accessed Sept. 1, 2015). For the final report, the evaluation team is collecting additional data from each State Deaf-Blind Technical Assistance Project grantee and from those who provide services at the local level to children with deaf-blindness and their families. The team will analyze these data together with relevant extant data. The final report from the study will be announced at http://ies.ed.gov/ncee/ (accessed Sept. 1, 2015). Amount: $2,995,294 Period of Performance: 9/25/2009–8/31/2016

245
Contract Number: ED-IES-14-C-0001 Contractor: Mathematica Policy Research, Frank Porter Graham Child Development Institute at the University of North Carolina at Chapel Hill, University of Florida, Decision Information Resources, Social Policy Research Associates, Twin Peaks Partners, Oregon Research Institute, and University of Kentucky Project Director: Cheri Vogel Description: Evaluation of Preschool Special Education Practices, Phase I. There is limited information available on the special education services and supports that children ages 3 through 5 are receiving and the preschool practices and interventions being used in programs across states. A review of the evidence available on interventions targeting preschool-age children's language, literacy, and social-emotional skills found there to be limited and mixed evidence on the interventions reviewed addressing each of the above skill areas. The objectives of the first phase of the evaluation are threefold: (1) to assess the feasibility of conducting an impact study of curricula or interventions promoting the literacy, language, and/or social-emotional skills of preschool-age children with disabilities; (2) to identify feasible study design options for an impact study; and (3) to prepare for the conduct of the impact study, if it is deemed feasible to conduct the study. The Phase I study will collect information to address questions such as the following. Which curricula and interventions are used nationally for preschool children with disabilities to promote learning of language, literacy, and social emotional skills? What are the curricula and interventions that recent research demonstrates to have the most promise for improving the literacy, language, and social emotional skills of preschool children with disabilities? Through what agencies, in what settings, and using what program structures are these curricula and interventions being used with preschool children with disabilities? The Phase I study team will collect new data from state and district grantees of IDEA funds to obtain nationally representative information on the programs, services, curricula, and interventions available to children ages 3 through 5 identified for special education services. New data collection will inform assessment of the feasibility of conducting an impact study and study design options for an impact study. Additionally, the study team will conduct an evidence review focusing on preschool interventions targeting the improvement of literacy, language, and social emotional skills for preschool-aged children with disabilities in order to identify curricula or interventions for the design of impact study options. If it is feasible to conduct an impact study, preparations for the impact study will occur under Phase I. A descriptive report based on the survey and extant data will be prepared and announced on http://ies.ed.gov/ncee/ (accessed June 27, 2016). Amount: $6,669,202 Period of Performance: 11/22/2013–10/31/2018 Contract Number: ED-IES-14-C-0003 Contractor: MDRC and American Institutes for Research Project Director: Fred Doolittle Description: Impact Evaluation of Training in Multi-Tiered Systems of Support for Behavior (MTSS-B). Training school staff in supporting student behavior is becoming increasingly attractive to districts and schools as a vehicle for school improvement. Implementation of multi-tiered systems of support for behavior (MTSS-B) is an approach to improving school and classroom climate as well as student outcomes. MTSS-B is a multi-tiered, systematic framework for teaching and reinforcing behavior for all students as well as for providing additional support to those who need it. Over a third of U.S. school districts report implementing MTSS-B at the elementary school level. Recent studies have shown the promise of MTSS-B, and a large-scale study of the effectiveness of MTSS-B is needed. This study will address several questions: What is the impact on school staff practices, school climate, and student outcomes of providing training in the MTSS-B framework plus universal positive behavior supports (Tier I) and a targeted (Tier II) intervention? What are the impacts for relevant subgroups (e.g., at-risk students)? Which strategies are correlated with improvement in student outcomes? The contractor, with assistance and input from the U.S. Department of Education and in consultation with a panel of experts, selected an MTSS-B training provider. The study team randomly assigned approximately 90 elementary

246
schools to either (1) training in MTSS-B that includes universal supports (Tier I) plus a targeted (Tier II) intervention or (2) a business-as-usual control group. The provider will provide training in MTSS-B at treatment schools prior to and across two school years, 2015–16 and 2016–17, and the schools receiving the training will implement MTSS-B across the two years. Data collection will include staff and student surveys, student testing, teacher ratings of student behavior, classroom observations, and review of student records data. The impact report will be announced on http://ies.ed.gov/ncee/ (accessed Sept. 1, 2015). Amount: $21,999,650 Period of Performance: 11/26/2013–11/25/2018

Appendix A
Infants, Toddlers, Children, and Students Served Under IDEA, by Age Group and State


249
Exhibit A-1. Number and percentage of the population of infants and toddlers birth through age 2 served under IDEA, Part C, and children and students ages 3 through 21 served under IDEA, Part B, by age group and state: Fall 2014
State
Birth through age 2 3 through 5 6 through 21
Number served
Percentage of the
population serveda
Number served
Percentage of the
population servedb
Number served
Percentage of the
population servedc
Alabama 3,077 1.8 7,150 4.0 75,204 7.4 Alaska 737 2.2 2,034 6.3 15,989 9.8 Arizona 5,363 2.1 15,113 5.7 116,428 7.9 Arkansas 1,144 1.0 12,881 11.2 53,740 8.5 California 36,895 2.5 76,641 5.1 634,564 7.6 Colorado 6,775 3.4 12,553 6.1 80,229 7.1 Connecticut 4,675 4.2 8,431 7.2 64,862 8.5 Delaware 975 2.9 2,050 6.1 17,839 9.5 District of Columbia (DC) 635 2.4 1,429 6.2 10,743 9.8 Florida 13,615 2.1 38,158 5.8 324,767 8.8 Georgia 8,322 2.1 17,725 4.4 178,323 7.9 Hawaii 1,520 2.7 2,364 4.4 16,717 6.2 Idaho 1,802 2.7 3,267 4.7 25,210 6.6 Illinois 20,926 4.4 37,599 7.8 257,317 9.4 Indiana 9,495 3.8 17,931 7.0 152,534 10.5 Iowa 3,439 2.9 6,322 5.3 57,544 8.5 Kansas 4,673 3.9 11,570 9.6 58,275 8.9 Kentucky 4,423 2.7 16,994 10.3 80,826 8.8 Louisiana 4,278 2.3 9,709 5.2 69,536 7.0 Maine 889 2.3 3,445 8.7 28,475 11.5 Maryland 7,729 3.5 13,105 5.9 91,031 7.4 Massachusetts 19,509 8.9 16,716 7.6 151,083 11.1 Michigan 8,898 2.6 20,456 5.9 177,715 8.5 Minnesota 5,449 2.6 15,296 7.3 110,141 9.6 Mississippi 1,948 1.7 9,299 7.8 57,149 8.5 Missouri 5,388 2.4 16,598 7.3 108,054 8.5 Montana 676 1.8 1,620 4.4 15,412 7.5 Nebraska 1,492 1.9 5,465 6.9 41,876 9.9 Nevada 2,889 2.8 8,537 7.8 45,218 7.8 New Hampshire 1,958 5.1 3,332 8.3 25,646 9.6 New Jersey 11,413 3.6 18,222 5.6 214,304 11.7 New Mexico 5,203 6.4 4,285 5.1 43,420 9.6 New York 28,852 4.0 68,528 9.9 420,549 10.8 North Carolina 10,010 2.8 18,887 5.1 177,158 8.4 North Dakota 1,150 3.7 1,801 6.1 11,835 7.5 Ohio 10,157 2.5 22,411 5.3 231,776 9.6 Oklahoma 2,558 1.6 8,919 5.6 96,752 11.4 Oregon 3,532 2.6 9,987 7.1 73,220 9.4 Pennsylvania 18,574 4.3 32,726 7.6 265,548 10.4 Rhode Island 2,095 6.4 2,942 8.9 20,418 9.3 South Carolina 3,655 2.1 8,971 5.0 90,129 9.0 South Dakota 1,255 3.4 2,568 7.2 16,407 8.8 Tennessee 4,390 1.8 12,527 5.2 118,202 8.7 See notes at end of exhibit.

250
Exhibit A-1. Number and percentage of the population of infants and toddlers birth through age 2 served under IDEA, Part C, and children and students ages 3 through 21 served under IDEA, Part B, by age group and state: Fall 2014—Continued
State
Birth through age 2 3 through 5 6 through 21
Number served
Percentage of the
population serveda
Number served
Percentage of the
population servedb
Number served
Percentage of the
population servedc
Texas 23,855 2.0 42,654 3.6 408,969 6.5 Utah 3,841 2.5 9,686 6.3 67,839 8.8 Vermont 800 4.4 1,819 9.9 12,189 9.5 Virginia 8,874 2.9 16,394 5.4 145,771 8.5 Washington 6,529 2.4 14,912 5.5 118,547 8.3 West Virginia 3,109 5.0 4,804 7.9 39,463 11.2 Wisconsin 5,739 2.8 15,846 7.6 104,588 8.6 Wyoming 1,209 5.3 3,081 13.2 — — 50 states and DC 346,394 2.9 735,760 6.1 5,819,531 8.7d BIE schoolse † † 410 † 5,974 † American Samoa 32 — 112f — — — Guam 161 — 171f — 1,855 — Northern Mariana Islands 80 — 84f — 808 — Puerto Rico (PR) 3,772 3.4 16,868 14.3 112,218 14.9 Virgin Islands 142 — 123f — 1,124 — 50 states, DC, BIE schools, PR,
and outlying areasg 350,581 — 753,528 — 5,941,510 — Federated States of Micronesia † — 133h — 1,928 — Republic of Palau † — 6h — 100 — Republic of the Marshall Islands † — 30h — 703 — 50 states, DC, BIE schools, PR,
outlying areas, and freely associated statesi — — 753,697 — 5,944,241 —
— Not available. † Not applicable. aPercentage was calculated by dividing the number of infants and toddlers birth through age 2 served under IDEA, Part C, by the estimated resident population birth through age 2, then multiplying the result by 100. bPercentage was calculated by dividing the number of children ages 3 through 5 served under IDEA, Part B, by the estimated resident population ages 3 through 5, then multiplying the result by 100. cPercentage was calculated by dividing the number of students ages 6 through 21 served under IDEA, Part B, by the estimated resident population ages 6 through 21, then multiplying the result by 100. dExcludes data for the estimated resident population ages 6 through 21 for Wyoming. eThe Bureau of Indian Education (BIE) receives IDEA, Part C, funds under IDEA section 643(b) and reports separately every two years under IDEA section 643(b)(5) to the U.S. Department of Education on the number of children contacted and served by tribal entities that receive Part C funds. The BIE receives IDEA, Part B, funds under IDEA section 611(h)(1)(A) to serve children ages 5 through 21 enrolled in elementary and secondary schools for American Indian children operated or funded by the BIE. Children and students served through BIE schools are included in the population estimates of the individual states in which they reside. fThe four outlying areas do not receive funds under IDEA, Part B, section 619. However, they may report children ages 3 through 5 who receive services funded under IDEA, Part B, section 611(b)(1)(A). gThe four outlying areas are American Samoa, Guam, the Northern Mariana Islands, and the Virgin Islands. hThe three freely associated states do not receive funds under IDEA, Part B, section 619. However, they may report children ages 3 through 5 who receive services funded under IDEA, Part B, section 611(b)(1)(A). iThe three freely associated states are the Federated States of Micronesia, the Republic of Palau, and the Republic of the Marshall Islands.

251
SOURCE: U.S. Department of Education, EDFacts Metadata and Process System (EMAPS), OMB #1820-0557: “IDEA Part C Child Count and Settings Collection,” 2014. U.S. Department of Education, EDFacts Data Warehouse (EDW), OMB #1875-0240: “IDEA Part B Child Count and Educational Environments Collection,” 2014. U.S. Department of Commerce, U.S. Census Bureau. “Intercensal Estimates of the Resident Population by Single Year of Age and Sex for States and the United States: April 1, 2000 to July 1, 2014,” 2014. Data were accessed fall 2015. For actual data used, go to http://www2.ed.gov/about/reports/annual/osep/index.html.

252
Exhibit A-2. Number of infants and toddlers birth through age 2 served under IDEA, Part C, by race/ethnicity and state: Fall 2014
State American Indian or
Alaska Native Asian
Black or African
American Hispanic/
Latino
Native Hawaiian or Other
Pacific Islander White
Two or more races
Alabama 11 45 909 206 0 1,786 120 Alaska 237 17 16 54 6 318 89 Arizona 310 88 247 2,033 18 2,545 122 Arkansas 5 14 268 84 3 737 33 California 105 3,429 2,338 x x x x Colorado 14 148 274 2,034 7 4,081 217 Connecticut 12 151 499 1,419 21 2,477 96 Delaware x x 254 157 0 480 45 District of Columbia x x 309 135 x 152 28 Florida 42 248 3,105 4,679 14 5,059 468 Georgia 13 228 3,450 510 12 4,019 90 Hawaii x 439 x 150 149 542 214 Idaho 24 20 16 274 7 1,366 95 Illinois 15 630 2,875 5,912 7 10,972 515 Indiana 6 129 974 1,050 5 7,005 326 Iowa 18 73 185 411 9 2,561 182 Kansas 22 95 285 826 13 3,204 228 Kentucky 8 64 331 262 6 3,530 222 Louisiana 4 39 1,837 205 0 2,050 143 Maine 9 4 17 x x 831 17 Maryland 12 421 2,247 1,165 12 3,570 302 Massachusetts 33 1,009 1,798 4,519 12 11,426 712 Michigan 72 141 1,563 599 8 6,290 225 Minnesota 156 236 443 527 4 3,846 237 Mississippi x 23 893 54 x 935 35 Missouri 8 83 845 321 13 3,919 199 Montana 92 x x 12 0 519 46 Nebraska 22 x 65 212 x 1,130 42 Nevada 18 121 280 1,091 18 1,181 180 New Hampshire x 52 32 66 x 1,710 94 New Jersey 9 777 1,211 3,643 30 5,297 446 New Mexico 412 30 99 3,467 4 1,115 76 New York 51 1,698 3,424 6,656 67 16,643 313 North Carolina 118 189 2,677 1,544 8 5,262 212 North Dakota 119 14 30 22 4 930 31 Ohio 37 185 1,530 374 25 7,522 484 Oklahoma 144 52 171 428 14 1,513 236 Oregon 27 107 59 796 7 2,420 116 Pennsylvania 25 500 2,578 2,307 9 12,090 1,065 Rhode Island x 38 133 601 x 1,229 82 South Carolina x 44 1,277 340 x 1,847 131 South Dakota 202 14 17 53 3 909 57 Tennessee 7 77 824 329 14 2,977 162 See notes at end of exhibit.

253
Exhibit A-2. Number of infants and toddlers birth through age 2 served under IDEA, Part C, by race/ethnicity and state: Fall 2014—Continued
State American Indian or
Alaska Native Asian
Black or African
American Hispanic/
Latino
Native Hawaiian or Other
Pacific Islander White
Two or more races
Texas 23 538 2,046 12,746 37 8,270 195 Utah 44 60 35 728 38 2,837 99 Vermont 0 15 14 6 0 717 48 Virginia 9 398 1,665 978 8 5,129 687 Washington 137 402 301 1,432 67 3,721 469 West Virginia 3 14 86 56 3 2,849 98 Wisconsin x 111 627 826 x 3,919 202 Wyoming 42 x 12 152 x 953 41 American Samoa 0 x 0 0 25 0 x Guam 0 26 0 0 113 0 22 Northern Mariana Islands 0 19 0 0 46 x x Puerto Rico 0 x 0 x 0 0 0 Virgin Islands 0 0 114 21 0 x x x Data suppressed to limit disclosure. SOURCE: U.S. Department of Education, EDFacts Metadata and Process System (EMAPS), OMB #1820-0557: “IDEA Part C Child Count and Settings Collection,” 2014. Data were accessed fall 2015. For actual data used, go to http://www2.ed.gov/about/reports/annual/osep/index.html.

254
Exhibit A-3. Number of children ages 3 through 5 served under IDEA, Part B, by race/ethnicity and state: Fall 2014
State American Indian or
Alaska Native Asian
Black or African
American Hispanic/
Latino
Native Hawaiian or Other
Pacific Islander White
Two or more races
Alabama 16 90 2,055 372 6 4,426 185 Alaska 528 59 61 155 45 935 251 Arizona 816 301 567 6,705 35 6,198 491 Arkansas 53 83 3,576 1,238 31 7,717 183 California 309 6,699 4,362 41,533 231 19,506 4,001 Colorado 95 286 505 4,444 22 6,713 488 Connecticut 18 328 1,004 2,422 9 4,371 279 Delaware 6 61 544 354 2 1,021 62 District of Columbia 0 20 986 290 1 109 23 Florida 74 668 9,196 11,786 51 15,068 1,315 Georgia 34 486 6,291 2,360 20 7,890 644 Hawaii 4 511 51 450 540 404 404 Idaho 59 28 17 191 3 2,536 433 Illinois 251 1,310 4,742 8,159 78 21,688 1,371 Indiana 23 243 1,587 1,939 9 13,215 915 Iowa 25 108 379 601 14 4,937 258 Kansas 104 196 685 1,892 19 8,157 517 Kentucky 19 155 1,422 853 11 13,907 627 Louisiana 59 102 4,085 398 11 4,819 235 Maine 35 22 80 58 0 3,160 90 Maryland 47 660 4,315 2,057 20 5,458 548 Massachusetts 38 880 1,543 3,453 10 10,149 643 Michigan 167 455 3,198 1,534 19 14,363 720 Minnesota 372 671 1,382 1,662 14 10,380 815 Mississippi 14 67 4,069 201 7 4,783 158 Missouri 55 236 2,244 865 23 12,594 581 Montana 233 9 8 64 0 1,254 52 Nebraska 115 90 298 816 10 3,930 206 Nevada 80 231 1,044 3,357 78 3,180 567 New Hampshire 5 79 76 185 9 2,948 30 New Jersey 38 1,487 2,272 5,532 47 8,427 419 New Mexico 440 31 90 2,480 5 1,184 55 New York 341 3,365 9,861 18,520 78 34,901 1,462 North Carolina 470 401 5,037 2,895 28 9,505 551 North Dakota 179 16 67 84 8 1,392 55 Ohio 17 378 2,624 1,093 19 17,243 1,037 Oklahoma 1,496 104 560 1,013 34 5,193 519 Oregon 122 257 271 2,480 45 6,407 405 Pennsylvania 45 801 4,856 3,864 13 21,658 1,489 Rhode Island 43 71 216 644 4 1,862 102 South Carolina 29 81 3,172 739 5 4,562 383 South Dakota 455 20 39 124 4 1,833 93 Tennessee 30 220 2,332 888 9 8,776 272 See notes at end of exhibit.

255
Exhibit A-3. Number of children ages 3 through 5 served under IDEA, Part B, by race/ethnicity and state: Fall 2014—Continued
State American Indian or
Alaska Native Asian
Black or African
American Hispanic/
Latino
Native Hawaiian or Other
Pacific Islander White
Two or more races
Texas 255 1,457 4,532 21,640 43 13,723 1,004 Utah 162 110 101 1,511 102 7,550 150 Vermont 4 18 45 30 1 1,708 13 Virginia 50 826 3,564 2,245 366 8,506 837 Washington 229 742 620 3,764 86 8,240 1,231 West Virginia 3 20 152 95 1 4,410 123 Wisconsin 252 350 1,659 2,334 23 10,731 497 Wyoming 107 19 29 414 2 2,425 85 BIE schoolsa 410 0 0 0 0 0 0 American Samoa 0 0 0 0 112 0 0 Guam 0 43 0 0 115 3 10 Northern Mariana Islands 0 33 0 0 34 0 17 Puerto Rico 4 4 3 16,801 5 51 0 Virgin Islands 1 0 98 19 0 3 2 Federated States of Micronesia 0 0 0 0 133 0 0 Republic of Palau 0 0 0 0 6 0 0 Republic of the Marshall Islands 0 0 0 0 30 0 0 aAlthough Bureau of Indian Education (BIE) schools do not receive funds under IDEA, Part B, section 619, BIE schools may report 5-year-old children who are enrolled in elementary schools for American Indian children operated or funded by the BIE and served with IDEA, Part B, section 611(h)(1)(A) funds. SOURCE: U.S. Department of Education, EDFacts Data Warehouse (EDW), OMB #1875-0240: “IDEA Part B Child Count and Educational Environments Collection,” 2014. Data were accessed fall 2015. For actual data used, go to http://www2.ed.gov/about/reports/annual/osep/index.html.

256
Exhibit A-4. Number of students ages 6 through 21 served under IDEA, Part B, by race/ethnicity and state: Fall 2014
State American Indian or
Alaska Native Asian
Black or African
American Hispanic/
Latino
Native Hawaiian or Other
Pacific Islander White
Two or more races
Alabama 538 411 28,815 3,244 47 40,939 1,210 Alaska 4,698 567 653 1,137 365 6,912 1,657 Arizona 7,458 1,549 7,730 51,108 245 45,733 2,605 Arkansas 417 421 12,835 5,224 214 33,579 1,050 California 4,854 37,180 59,467 349,351 2,681 163,292 17,739 Colorado 963 1,300 5,079 29,237 139 40,705 2,806 Connecticut 225 1,339 10,686 16,739 41 34,324 1,508 Delaware 83 251 6,821 2,556 7 7,664 457 District of Columbia 13 68 8,821 1,254 16 497 74 Florida 1,141 4,078 84,192 93,231 314 131,914 9,897 Georgia 355 2,800 71,129 21,966 142 76,315 5,616 Hawaii 90 3,452 406 1,791 7,311 2,263 1,404 Idaho 561 205 379 1,843 63 18,751 3,408 Illinois 1,415 5,309 56,553 55,923 348 129,456 8,313 Indiana 450 1,197 20,911 13,070 61 109,349 7,496 Iowa 347 639 5,229 6,258 97 42,710 2,264 Kansas 758 802 5,525 9,723 66 38,351 3,050 Kentucky 111 539 9,704 3,497 44 64,541 2,390 Louisiana 506 426 34,915 2,262 33 30,404 990 Maine 348 258 860 631 22 25,789 567 Maryland 313 2,448 38,982 11,553 84 34,627 3,024 Massachusetts 468 4,258 15,603 31,629 140 94,404 4,581 Michigan 1,681 2,267 37,251 12,273 136 118,517 5,590 Minnesota 3,175 4,496 13,771 10,639 67 73,131 4,862 Mississippi 139 259 27,904 1,154 14 27,146 533 Missouri 566 1,094 20,473 4,945 130 77,978 2,868 Montana 2,244 79 206 780 39 11,606 458 Nebraska 898 549 3,684 7,389 39 27,685 1,632 Nevada 788 1,077 6,257 17,423 429 16,783 2,461 New Hampshire 85 284 725 1,160 27 23,229 136 New Jersey 271 8,409 39,251 50,603 267 113,111 2,392 New Mexico 4,793 233 981 26,958 37 9,773 645 New York 2,851 15,561 93,357 124,063 686 178,463 5,568 North Carolina 2,939 1,981 57,042 23,445 153 85,123 6,475 North Dakota 1,319 70 463 604 24 9,129 226 Ohio 348 1,726 45,266 10,673 107 163,192 10,464 Oklahoma 15,682 774 11,194 11,747 176 52,804 4,375 Oregon 1,569 1,498 2,432 17,338 380 46,119 3,884 Pennsylvania 494 3,774 45,439 28,326 128 178,192 9,195 Rhode Island 238 312 1,861 5,225 30 12,004 748 South Carolina 301 560 37,771 5,717 53 42,644 3,083 South Dakota 2,786 153 516 827 11 11,599 515 Tennessee 288 1,006 29,948 7,531 69 77,623 1,737 See notes at end of exhibit.

257
Exhibit A-4. Number of students ages 6 through 21 served under IDEA, Part B, by race/ethnicity and state: Fall 2014—Continued
State American Indian or
Alaska Native Asian
Black or African
American Hispanic/
Latino
Native Hawaiian or Other
Pacific Islander White
Two or more races
Texas 1,808 7,194 67,698 203,413 448 120,574 7,834 Utah 1,213 600 1,317 13,216 767 49,298 1,428 Vermont 84 101 346 145 8 11,388 117 Virginia 451 4,744 41,632 20,092 166 72,058 6,628 Washington 2,655 4,481 7,293 27,877 923 66,919 8,399 West Virginia 42 107 1,896 495 12 36,125 786 Wisconsin 1,978 2,446 15,983 11,855 67 69,300 2,959 Wyoming — — — — — — — BIE schoolsa 5,974 — — — — — — American Samoa — — — — — — — Guam 4 277 2 7 1,529 14 22 Northern Mariana
Islands 0 191 0 0 480 3 134 Puerto Rico 76 8 18 111,992 4 120 0 Virgin Islands 2 1 845 228 0 32 16 Federated States of
Micronesia 0 0 0 0 1,928 0 0 Republic of Palau 0 1 0 0 99 0 0 Republic of the
Marshall Islands 0 0 0 0 703 0 0 — Not available. aBureau of Indian Education schools. SOURCE: U.S. Department of Education, EDFacts Data Warehouse (EDW), OMB #1875-0240: “IDEA Part B Child Count and Educational Environments Collection,” 2014. Data were accessed fall 2015. For actual data used, go to http://www2.ed.gov/about/reports/annual/osep/index.html.


Appendix B
Developmental Delay Data for Children Ages 3 Through 5 and Students Ages 6 Through 9 Served Under IDEA, Part B


261
Developmental Delay Data for Children Ages 3 Through 5 and Students Ages 6 Through 9 Served Under IDEA, Part B
IDEA allows states flexibility in the use of the developmental delay category. Per statute, use of the category is optional. Only children ages 3 through 9 may be reported in the developmental delay disability category and then only in states with the diagnostic instruments and procedures to measure delays in physical, cognitive, communication, social or emotional, or adaptive development. States must have defined and established eligibility criteria for developmental delay in order to report children in this category. Although IDEA does not require that states and local education agencies categorize children according to developmental delay, if this category is required by state law, states are expected to report these children in the developmental delay category.
Appendix B presents information about the children ages 3 through 5 and students ages 6 through
9 reported in the developmental delay category. In particular, exhibits B-1 and B-2 provide data on the percentages of resident populations in the 50 states, the District of Columbia (DC), and Puerto Rico (PR) represented by the children ages 3 through 5 and students ages 6 through 9 served under IDEA, Part B, who were reported under the category of developmental delay, respectively, in each year, 2005 through 2014. Exhibit B-3 identifies whether each state, the District of Columbia, Bureau of Indian Education (BIE) schools, Puerto Rico, the four outlying areas (American Samoa, Guam, the Northern Mariana Islands, and the Virgin Islands), and the three freely associated states (the Federated States of Micronesia, the Republic of Palau, and the Republic of the Marshall Islands) reported any children ages 3 through 5 and any students ages 6 through 9 under the developmental delay category in 2014.

262
Exhibit B-1. Number of states reporting children ages 3 through 5 served under IDEA, Part B, under the category of developmental delay and percentage of the population ages 3 through 5 served under IDEA, Part B, reported under the category of developmental delay, by year: Fall 2005 through fall 2014
Year Number of statesa Percentage of resident
population servedb 2005 49 2.92 2006 49 2.78 2007 49 2.86 2008 49 2.73 2009 50 2.78 2010 49 2.84 2011 49 2.89 2012 48 2.98 2013 48 2.94 2014 50 2.99 aThese are states that reported a non-zero count for children ages 3 through 5 under the category of developmental delay and had estimated resident population data available. For the purpose of this exhibit, number of states may include any of the 50 states, DC, BIE schools, and PR. Population data are not available for the outlying areas or the freely associated states. bPercentage was calculated by dividing the number of children ages 3 through 5 served under IDEA, Part B, reported under the category of developmental delay by the estimated resident population ages 3 through 5 in the states that reported children under the category of developmental delay for that year, then multiplying the result by 100. NOTE: States’ use of the developmental delay category is optional for children ages 3 through 9 and is not applicable to children older than 9 years of age. For information on states with differences in developmental delay reporting practices, see exhibit B-3. Although BIE schools do not receive funds under IDEA, Part B, section 619, BIE schools may report 5-year-old children who are enrolled in elementary schools for American Indian children operated or funded by BIE and who receive services funded under IDEA, Part B, section 611(h)(1)(A). SOURCE: U.S. Department of Education, EDFacts Data Warehouse (EDW), OMB #1875-0240: “IDEA Part B Child Count and Educational Environments Collection,” 2005–2014. These data are for the states, DC, BIE schools, and PR that reported children under the category of developmental delay. For 2007 and 2008, data for Vermont were not available. For 2010, 2012, and 2013, data for Wyoming were not available. For 2011 and 2013, data for BIE schools were not available. U.S. Department of Commerce, U.S. Census Bureau. “Intercensal Estimates of the Resident Population by Single Year of Age and Sex for States and the United States: April 1, 2000 to July 1, 2014,” 2005–14. These data are for the states, DC, and PR that reported children under the category of developmental delay. For 2007 and 2008, data for Vermont were excluded. For 2010, 2012, and 2013, data for Wyoming were excluded. Children served through BIE schools are included in the population estimates of the individual states in which they reside. Data for 2005–11 were accessed fall 2012. Data for 2012 were accessed fall 2013. Data for 2013 were accessed fall 2014. Data for 2014 were accessed fall 2015. For actual data used, go to http://www2.ed.gov/about/reports/annual/osep/index.html.

263
Exhibit B-2. Number of states reporting students ages 6 through 9 served under IDEA, Part B, under the category of developmental delay and percentage of the population ages 6 through 9 served under IDEA, Part B, reported under the category of developmental delay, by year: Fall 2005 through fall 2014
Year Number of statesa Percentage of resident
population servedb 2005 31 1.17 2006 33 1.17 2007 35 1.11 2008 34 1.26 2009 37 1.25 2010 35 1.33 2011 35 1.41 2012 36 1.49 2013 36 1.56 2014 36 1.65 aThese are states that reported a non-zero count for students ages 6 through 9 under the category of developmental delay and had estimated resident population data available. For the purpose of this exhibit, number of states may include any of the 50 states, DC, BIE schools, and PR. Population data are not available for the outlying areas or the freely associated states. bPercentage was calculated by dividing the number of students ages 6 through 9 served under IDEA, Part B, reported under the category of developmental delay by the estimated resident population ages 6 through 9 in the states that reported students under the category of developmental delay for that year, then multiplying the result by 100. NOTE: States’ use of the developmental delay category is optional for children ages 3 through 9 and is not applicable to children older than 9 years of age. For information on states with differences in developmental delay reporting practices, see exhibit B-3. SOURCE: U.S. Department of Education, EDFacts Data Warehouse (EDW), OMB #1875-0240: “IDEA Part B Child Count and Educational Environments Collection,” 2005–14. These data are for the states, DC, BIE schools, and PR that reported children under the category of developmental delay. For 2007 and 2008, data for Vermont were not available. For 2010 and 2011, data for Puerto Rico were not available. For 2010 and 2014, data for Wyoming were not available. For 2011 and 2013, data for BIE schools were not available. U.S. Department of Commerce, U.S. Census Bureau. “Intercensal Estimates of the Resident Population by Single Year of Age and Sex for States and the United States: April 1, 2000 to July 1, 2014,” 2005–14. These data are for the states, DC, and PR that reported children under the category of developmental delay. For 2007 and 2008, data for Vermont were excluded. For 2010 and 2011, data for Puerto Rico were excluded. For 2010 and 2014, data for Wyoming were excluded. Students served through BIE schools are included in the population estimates of the individual states in which they reside. Data for 2005–11 were accessed fall 2012. Data for 2012 were accessed fall 2013. Data for 2013 were accessed fall 2014. Data for 2014 were accessed fall 2015. For actual data used, go to http://www2.ed.gov/about/reports/annual/osep/index.html.

264
Exhibit B-3. States reporting children ages 3 through 5 and students ages 6 through 9 served under IDEA, Part B, under the category of developmental delay, by state: Fall 2014
State
Reported some children ages 3 through 5 under
developmental delay category
Reported some students ages 6 through 9 under
developmental delay category
Alabama Yes Yes Alaska Yes Yes American Samoa No — Arizona Yes Yes Arkansas Yes No BIE schoolsa Yes Yes California No No Colorado Yes Yes Connecticut Yes No Delaware Yes Yes District of Columbia Yes Yes Federated States of Micronesia Yes Yes Florida Yes No Georgia Yes Yes Guam Yes No Hawaii Yes Yes Idaho Yes Yes Illinois Yes Yes Indiana Yes No Iowa No No Kansas Yes Yes Kentucky Yes Yes Louisiana Yes Yes Maine Yes Yes Maryland Yes Yes Massachusetts Yes Yes Michigan Yes Yes Minnesota Yes Yes Mississippi Yes Yes Missouri Yes Yes Montana Yes No Nebraska Yes Yes Nevada Yes No New Hampshire Yes Yes New Jersey Yes No New Mexico Yes Yes New York Yes No North Carolina Yes Yes North Dakota Yes Yes Northern Mariana Islands Yes Yes Ohio Yes No Oklahoma Yes Yes See notes at end of exhibit.

265
Exhibit B-3. States reporting children ages 3 through 5 and students ages 6 through 9 served under IDEA, Part B, under the category of developmental delay, by state: Fall 2014—Continued
State
Reported some children ages 3 through 5 under
developmental delay category
Reported some students ages 6 through 9 under
developmental delay category
Oregon Yes No Pennsylvania Yes Yes Puerto Rico Yes No Republic of Palau Yes No Republic of the Marshall Islands Yes Yes Rhode Island Yes Yes South Carolina Yes Yes South Dakota Yes No Tennessee Yes Yes Texas No No Utah Yes Yes Vermont Yes Yes Virgin Islands Yes Yes Virginia Yes Yes Washington Yes Yes West Virginia Yes No Wisconsin Yes Yes Wyoming Yes — — Not available. aBureau of Indian Education schools. SOURCE: U.S. Department of Education, EDFacts Data Warehouse (EDW), OMB #1875-0240: “IDEA Part B Child Count and Educational Environments Collection,” 2014. Data were accessed fall 2015. For actual data used, go to http://www2.ed.gov/about/reports/annual/osep/index.html.


Appendix C
IDEA Part B Maintenance of Effort Reduction and Coordinated Early Intervening Services


269
IDEA Part B Maintenance of Effort Reduction and Coordinated Early Intervening Services
Appendix C presents state-level information on maintenance of effort (MOE) reduction and coordinated early intervening services (CEIS). In particular, Exhibit C-1 presents the number of students who received CEIS and number and percentage of local education agencies (LEAs) and educational service agencies (ESAs) in the 50 states, the District of Columbia (DC), Bureau of Indian Education (BIE) schools, Puerto Rico (PR), the four outlying areas (American Samoa, Guam, the Northern Mariana Islands, and the Virgin Islands), and the three freely associated states (the Federated States of Micronesia, the Republic of Palau, and the Republic of the Marshall Islands), that were required to use 15 percent of IDEA sections 611 and 619 funds for CEIS due to significant disproportionality or that voluntarily used up to 15 percent of funds reserved for CEIS. Exhibit C-2 presents state-level data on the number and percentage of LEAs and ESAs that met the IDEA, Part B, requirements under 34 C.F.R. section 300.600(a)(2), had an increase in section 611 allocations, and took the MOE reduction pursuant to IDEA section 613(a)(2)(C) in school year 2013–14.

270
Exhibit C-1. Number of students who received coordinated early intervening services (CEIS) and number and percentage of local education agencies (LEAs) or educational service agencies (ESAs) that were required to use 15 percent of IDEA sections 611 and 619 funds for CEIS due to significant disproportionality or that voluntarily used up to 15 percent of IDEA sections 611 and 619 funds reserved for CEIS, by state: School year 2013–14
State Number of students who received CEIS
LEAs/ESAs required to use or voluntarily used IDEA sections 611
and 619 funds for CEIS Number Percentagea
Alabama 5,129 4 3.0 Alaska 614 1 1.9 American Samoa 0 0 0.0 Arizona 9,926 19 3.2 Arkansas 2,418 30 11.6 BIE schoolsb — — — California 82,997 32 3.0 Colorado 0 0 0.0 Connecticut 3,865 13 7.7 Delaware 7,344 4 11.1 District of Columbia (DC) 3,113 1 2.5 Federated States of Micronesia 0 0 0.0 Florida 79,749 26 34.7 Georgia 3,369 22 11.1 Guam 0 0 0.0 Hawaii 0 0 0.0 Idaho 229 3 2.3 Illinois 70,217 117 13.5 Indiana 23,666 71 19.5 Iowa 5,104 19 5.2 Kansas 53 1 1.3 Kentucky 6,035 9 5.1 Louisiana 58,128 95 64.2 Maine 0 0 0.0 Maryland 2,898 3 12.0 Massachusetts 33,197 6 1.5 Michigan 5,881 37 6.7 Minnesota 3,335 81 30.1 Mississippi 12,943 48 32.0 Missouri 333 6 1.1 Montana 0 0 0.0 Nebraska 4,913 39 15.6 Nevada 48,743 1 5.9 New Hampshire 468 10 5.8 New Jersey 8,014 21 3.1 New Mexico 16,594 14 9.6 New York 87,590 78 11.2 See notes at end of exhibit.

271
Exhibit C-1. Number of students who received coordinated early intervening services (CEIS) and number and percentage of local education agencies (LEAs) or educational service agencies (ESAs) that were required to use 15 percent of IDEA sections 611 and 619 funds for CEIS due to significant disproportionality or that voluntarily used up to 15 percent of IDEA sections 611 and 619 funds reserved for CEIS, by state: School year 2013–14—Continued
State Number of students who received CEIS
LEAs/ESAs required to use or voluntarily used IDEA sections 611
and 619 funds for CEIS Number Percentagea
North Carolina 23,451 22 9.7 North Dakota 2,210 8 25.0 Northern Mariana Islands 0 0 0.0 Ohio 45,475 167 17.2 Oklahoma 2,734 13 2.4 Oregon 14,251 18 9.0 Pennsylvania 36,922 5 0.8 Puerto Rico (PR) 0 0 0.0 Republic of Palau 0 0 0.0 Republic of the Marshall Islands 0 0 0.0 Rhode Island 8,230 33 61.1 South Carolina 13,778 25 27.8 South Dakota 1,427 12 7.9 Tennessee 3,296 5 3.6 Texas 126,239 122 9.9 Utah 6,660 18 14.3 Vermont 1,700 7 11.7 Virgin Islands 1,086 2 100.0 Virginia 23,067 15 11.4 Washington 321 4 1.5 West Virginia 0 0 0.0 Wisconsin 25,085 101 22.5 Wyoming 5,478 23 46.9 50 states, DC, BIE schools, PR, outlying
areas, and freely associated states 928,275 1,411 9.5 — Not available. aPercentage was calculated by dividing the number of LEAs and ESAs that were required to use 15 percent of IDEA sections 611 and 619 funds for CEIS due to significant disproportionality in school year 2013–14 and the number of LEAs and ESAs that voluntarily used up to 15 percent of IDEA sections 611 and 619 funds for CEIS, by the total number of LEAs and ESAs in school year 2013–14, then multiplying the result by 100. bBureau of Indian Education schools. SOURCE: U.S. Department of Education, EDFacts Metadata and Process System (EMAPS), OMB #1820-0689: “IDEA Part B Maintenance of Effort (MOE) Reduction and Coordinated Early Intervening Services (CEIS),” 2014. U.S. Department of Education, EDFacts Data Warehouse (EDW), OMB #1875-0240: “IDEA Part B Child Count and Educational Environments Collection,” 2014. Data were accessed fall 2015. For actual data used, go to http://www2.ed.gov/about/reports/annual/osep/index.html.

272
Exhibit C-2. Number and percentage of local education agencies (LEAs) or educational service agencies (ESAs) that met the IDEA, Part B, requirements under 34 C.F.R. section 300.600(a)(2), had an increase in IDEA section 611 allocations, and took the maintenance of effort (MOE) reduction pursuant to IDEA section 613(a)(2)(C) in school year 2013–14 by state
State
LEAs/ESAs had an increase in IDEA section 611 allocations, met
requirements, and took the MOE reduction
Number Percentagea Alabama 7 5.2 Alaska 0 0.0 American Samoa 0 0.0 Arizona 0 0.0 Arkansas 0 0.0 BIE schoolsb — — California 0 0.0 Colorado 1 1.7 Connecticut 0 0.0 Delaware 0 0.0 District of Columbia (DC) 0 0.0 Federated States of Micronesia 0 0.0 Florida 0 0.0 Georgia 0 0.0 Guam 0 0.0 Hawaii 0 0.0 Idaho 0 0.0 Illinois — — Indiana 9 2.5 Iowa 0 0.0 Kansas 0 0.0 Kentucky 33 18.8 Louisiana 1 0.7 Maine 0 0.0 Maryland 0 0.0 Massachusetts 1 0.3 Michigan 0 0.0 Minnesota 0 0.0 Mississippi 0 0.0 Missouri 9 1.7 Montana 0 0.0 Nebraska 8 3.2 Nevada 0 0.0 New Hampshire 0 0.0 New Jersey 0 0.0 New Mexico 63 43.2 New York 0 0.0 North Carolina 0 0.0 See notes at end of exhibit.

273
Exhibit C-2. Number and percentage of local education agencies (LEAs) or educational service agencies (ESAs) that met the IDEA, Part B, requirements under 34 C.F.R. section 300.600(a)(2), had an increase in IDEA section 611 allocations, and took the maintenance of effort (MOE) reduction pursuant to IDEA section 613(a)(2)(C) in school year 2013–14 by state—Continued
State
LEAs/ESAs had an increase in IDEA section 611 allocations, met
requirements, and took the MOE reduction
Number Percentagea North Dakota 0 0.0 Northern Mariana Islands 0 0.0 Ohio 4 0.4 Oklahoma 86 15.7 Oregon 0 0.0 Pennsylvania 31 4.7 Puerto Rico (PR) 0 0.0 Republic of Palau 0 0.0 Republic of the Marshall Islands 0 0.0 Rhode Island 0 0.0 South Carolina 0 0.0 South Dakota 0 0.0 Tennessee 0 0.0 Texas 11 0.9 Utah 0 0.0 Vermont 0 0.0 Virgin Islands 0 0.0 Virginia 0 0.0 Washington 0 0.0 West Virginia 0 0.0 Wisconsin 0 0.0 Wyoming 0 0.0 50 states, DC, BIE schools, PR, outlying areas,
and freely associated states 264 1.8 — Not available. aPercentage was calculated by dividing the number of LEAs and ESAs that met the IDEA, Part B, requirements and had an increase in IDEA section 611 allocations and took the MOE reduction in school year 2013–14, by the total number of LEAs and ESAs, then multiplying the result by 100. bBureau of Indian Education schools. SOURCE: U.S. Department of Education, EDFacts Metadata and Process System (EMAPS), OMB #1820-0689: “IDEA Part B Maintenance of Effort (MOE) Reduction and Coordinated Early Intervening Services (CEIS),” 2014. Data were accessed fall 2015. For actual data used, go to http://www2.ed.gov/about/reports/annual/osep/index.html.


The Department of Education’s mission is to promote student achievement and preparation for global competitiveness by fostering educational excellence and ensuring equal access.
www.ed.gov