indira management review (imr) -...
TRANSCRIPT

Indira Management Review (IMR) (Bi-annual International Research and Academic Journal)
ISSN: 0974–3928 Volume: X Issue: 2 December 2016
Editor-in-Chief Dr. Renu Bhargava
Executive Editor Dr. Suvarna Deshpande
Co-ordinating Editor Prof. Tanay Kurode
Indira School of Business Studies
Abhinavan, 89/2 A, New Pune–Mumbai Highway Tathawade, Pune–411033, India
E-mail: [email protected] Cell: 020-66759428

First Impression: December 2016
© Indira School of Business Studies, Pune
Indira Management Review (IMR)
Vol. X • Issue: 2 • December 2016
ISSN: 0974–3928
No part of this publication may be reproduced or transmitted in any form by any means, electronic or mechanical, including photocopy, recording, or any information storage and retrieval system, without permission in writing from the copyright owners.
DISCLAIMER
The authors are solely responsible for the contents of the papers compiled in this volume. The publishers or editors do not take any responsibility for the same in any manner. Errors, if any, are purely unintentional and readers are requested to communicate such errors to the editors or publishers to avoid discrepancies in future.
Publishing Consultancy
EXCEL INDIA PUBLISHERS 91 A, Ground Floor Pratik Market, Munirka, New Delhi-110067 Tel: +91-11-2671 1755/ 2755/ 3755/ 5755 Fax: +91-11-2671 6755 E-mail: [email protected] Web: www.groupexcelindia.com
Typeset by Excel Publishing Services, New Delhi–110067 E-mail: [email protected]
Printed by Excel Printing Universe, New Delhi–110067 E-mail: [email protected]

Indira Management Review (IMR) (Bi-annual International Research and Academic Journal)
Advisory Board Dr. Tarita Shankar
Chairperson, Indira Group of Institutes, Pune
Prof. Chetan Wakalkar Group Director, Indira Group of Institutes, Pune
Dr. Ashok Joshi Director General
Indian Institute of Cost and Management Studies & Research (IndSearch), Pune Founder Dean–Faculty of Management, Pune
Former President, Association of Indian Management Schools President, Association of Management Development Institutions in South Asia
Dr. E.B. Khedkar Former Dean, Faculty of Management,
Savitribai Phule Pune University Vice Chancellor, Ajeenkya D.Y. Patil University, Pune
Director, Dr. D.Y. Patil School of Management, Lohegaon, Pune
Dr. G.K. Shirude Director
S.P. Mandali’s Naralkar Institute of Career Development and Research Pune
Dr. Vikas Inamdar Director, MES’s Institute of Management & Career Courses, Pune
Dr. N.M. Vechalekar Dean, Post Graduate Programme
Indian Institute of Cost and Management Studies & Research (IndSearch), Pune
Dr. P.K. Sinha Professor, Former Director in Charge,
Dr. D.Y. Patil Institute of Management & Research Pimpri, Pune
Mr. Roger La Salle Director, LaSalle Matrix Thinking, Melbourne, Australia

Editorial Board Dr. Manivasagam
Chief Technical Officer–CTO, Onward Technologies Troy, Greater Detroit Area, USA
Mr. Himanshu Shah Vice President, Information Technology, Symantec, Pune
Dr. Ravindra Utgikar Vice President, PRAJ Industries Ltd. Pune
Mr. Anupam Parnaik Chartered Accountant
Principal (Investment Team), Hayfin Capital Management LLP, London, UK
Dr. Jayant Panse Director, Maharashtra Institute of Management,
Kalamb–Walchandnagar, Pune
Dr. Charushila Birajdar Principal
RSSP's Maharashtra College of Science and Commerce, Pune
Dr. Saroj Hiremath HOD (Marketing), Sir Parshurambhau College, Pune
Dr. Subhash Bhave Professor
Indian Institute of Cost and Management Studies & Research (IndSearch), Pune
Dr. Manoj Gadre Associate Professor,
SB Patil Institute of Management, Akurdi, Pune
Dr. Amod Sane Director, Green Pharmacy, Pune
Mr. Sanjay Ahire Owner Finite 4 LLC (USA) & Trileehiretech LLP (India)
Sr. Process Engineer, Ford Motor Company, Westland, Michigan, USA
Mr. Bhushan Khodpe Sr. Manager Business Development,
Geometric Europe GMBH Filial Sweden
Chief Editor’s Desk
Indira Management Review (IMR) is an international biannual peer reviewed journal published by Indira school of Business studies (ISBS). Responsible management education forms the hallmark of the business school and research is one of the pillars centering around the context which evolves management thinking on newer developments in India and the Globe.
IMR encourages new ideas and perspectives on existing research. Manuscripts that are suitable for publication in IMR cover domains such as business strategy and policy, IT sourcing, entrepreneurship, human resource management, financial management, organizational behavior, organizational theory, marketing and research. Some excerpts from the current publications are presented to you:
Reviews from the top international policy makers in the recent past have stated that the economic reforms unleashed by India would not only boost its growth but also accelerate its Global Economic Alliances. One of the constituents in this growth story would be to enhance the primary factors of production. According to Global Entrepreneurship Monitor, Indian economy is factor driven economy. Reforms put in place in this direction would yield impressive growth for our nation.
The need is also felt for adopting unique approaches for enterprise level value stream mapping in organizations to understand need of customer and map the business processes accordingly to satisfy the stakeholders. The need to improve is almost universally recognized, but knowing areas of focus is critical in this approach. The key to reaching and sustaining world leading competitiveness is not a series of randomly selected events, it is a vision of the future state of a process and a strategic plan for making that vision a reality.
The pace, at which digital innovations have expanded, has put established organizations at jeopardy. In the automobile industry, digitalization brings new players, shifting the technological spotlight from traditional to IT, enabling consumers to educate themselves in connectivity mobility, and converting them to ever more valuable source of information. A topic well researched by the author in digital disruptions in automobile world. Connected to the study is the follow up on social networking sites seen as ‘global consumer phenomenon’ with an exponential rise in usage.
In the context of sustainability a strong case is built in the Reverse Logistics for economic, customer and environmental reasons. Multiple reasons and outcomes of the reverse flow of goods have been presented by the author.
Considering employee quotient in efficiency of an organization, it is wise to consider the linkwithwork life balance. Organizations have realized the growing importance of using Information Technology (IT) in leveraging their Human Resource (HR) functions.
Productivity in Industry finds its base in the education community and lately the role of educating women to enhance economic growth is well founded. The commitment of “Education for All” is needed to ameliorate the education system. Thus emerges the analysis in the paper signifying the consequence of human resource management practices on Indian Education Institutions. A well-educated population, adequately equipped with knowledge and skills, is a precondition of sustained economic growth!
Dr. R. Bhargava (Director–Indira School of Business Studies, Pune)
From the Desk of Editor
Dear Readers,
The qualitative and timely publication of Vol. X/ Issue-II (Dec-2016) of Indira Management Review (ISSN: 0974-3928) has brought great joy and happiness to the editorial team of the journal and honorable members of the Editorial and Advisory Board. The board member’s rich experience and varied expertise in providing immense insight has resulted in a very high quality and informative journal. An enormous amount of work has gone into the development & transformation of Indira Management Review and it has been an interesting journey.
Editorial board members carefully reviewed the papers and carried out justified evaluation. Based on their evaluation, we could accept 10 research papers for this issue across the disciplines. We are certain that these papers will provide qualitative information and thoughtful ideas to our accomplished readers. The contributions have come in not only from industry and academics from India but also from very renowned global industry groups as well.
The aim of journal is to percolate knowledge in various research fields and elevate high end research. Education without research and development becomes meaningless to the community. We feel highly motivated by the positive response from contributors and likeminded educational fraternity showing their deep interest in bringing this second issue of our bi-annual, international research journal. The objective is being pursued vigorously by providing blind reviews and plagiarism check.
Indira management Review is published by IGI’s Indira School of Business Studies and it is a quality research journal. The journal endeavors to provide forums for academicians and industry participants who are interested in the discussion of current and future issues and challenges impacting the globe as well as promoting and disseminating relevant, high quality research in the field of management.
Large number of research papers were received for publication and we thank each one of the authors personally for soliciting the journal. We thank IGI Management who conveyed their appreciation on the quality and content of the journal and expressed their best wishes for future issues. We convey our deep gratitude to the Editorial Board and Advisory Board members.
We invite all the authors and their professional colleagues to submit their research papers, articles & book reviews for publication in our forthcoming issue i.e. Vol. XI | Issue I | July 2017 as per the “Scope and Guidelines to Authors” given at the end of this issue. Any comments and observations for the improvement of the journal are most welcome.
We wish all readers meaningful and quality time while going through the journal.
Dr. Suvarna Deshpande Executive Editor
Indira Management Review
Contents
Research Papers
1. Enterprise Value Stream Mapping: Satisfying Stakeholders Mr. Madhav V. Shingre 9
2. Digital Disruptions in Automobile World Mr. Sanjay Ahire 21
3. A Study of Recycling in the Recovery Hierarchy of Reverse Logistics Prof. Mangesh P. Dande 31
4. A Study on Work–Life Balance of Employees at Federal Bank Ltd., Kothrud Pune Dr. A.N. Barbole and Prof. Sheetal Gaur 45
5. A Study of Initiatives by Entrepreneurship Development Cell in Indian Institutes of Technology (IITs) Prof. Madhura Wagh 55
6. Study of Use of e-HRM in Performance Appraisal Process in IT Organizations Dr. Manasi Sameer Bhate 62
7. Comparative Study of Women Development in the Field of Education in Maharashtra and Madhya Pradesh from 2001 to 2011 Ms. T.P.V. Ratnasri and Prof. Mrunal Risbud 73
8. A Study on the Impact of Human Resource Management on the Performance at an Educational Institution: A Study amongst the Workforce Prof. Sumati Sidharth, Lt Cdr. Ruby Matthew and Mr. Ekanto Ghosh 83
9. An Examination of Influence of Higher Education Service Quality on Students’ Satisfaction: An Indian Perspective Dr. V. Krishnamoorthy, Ms. A.S. Aishwaryadevi and Ms. B. Bharathi 95
10. Implications of Social Media Amongst College Students Ms. Pooja Vasudev Joshi and Dr. Vinita Nawalakha 103

8 Contents
IMR (Indira Management Review) Volume X, Issue 2, December, 2016
Articles
11. When India will get its Educational Freedom? Dr. V.H. Inamdar 108
12. Role of Service Sector in Indian Economy Dr. Parmeshwar Yadav 110
13. Human Happiness Index Prof. Amruta Deshpande 112
Book Review
14. Things a Little Bird Told Me: Confessions of the Creative Mind Dr. Ravindra Utgikar 115
AUTHOR INDEX 117

IMR (Indira Management Review)
Volume X, Issue 2, December, 2016
Enterprise Value Stream Mapping: Satisfying Stakeholders
Madhav V. Shingre* Vice President, 1
KETRON IT and Engineering Solutions (P) Ltd., Pune
Abstract: The research focuses on sustainability of organization which is very much important due to fluctuations in global economy, currency rates, demand and supply, stringent regulatory and legal norms, customers demanding needs and competition in market. There is a need for enterprise level value stream mapping approach in organization to understand the need of customer (every stakeholder) and map the business processes accordingly to satisfy the stakeholders.
Keywords: Value Stream Mapping, Malcolm Baldridge Awards, Lean Organization, Lean Six Sigma, Stakeholders, Lean Manufacturing, Six Sigma, Tata Business Excellence model
Introduction The need to improve is almost universally recognized, but you need to know where your improvement effort should be focussed to achieve the best results. The key to reaching and sustaining world leading competitiveness is not a series of randomly selected events, it is to have a vision of the future state of a process and a strategic plan for making that vision a reality.
In most organizations, people tend to work relating only to the people immediately around them in the process and not understanding their impact on the overall delivery of the product or service.
Many organizations pursuing “lean” conversions have realized that improvement events alone are not enough. Improvement events create localized improvements, value stream mapping and analysis strengthens the gains by providing vision and plans that connect all improvement activities.
Value stream mapping and analysis is a tool that allows you to see waste, and plans to eliminate it. Most of the organizations never realize the importance of lean when they are on growth path.
Management adopts lean concepts whenever there is no growth or major issues with profits, capital investments. In fact, value stream mapping needs to be implemented while having growth so that lean culture gets integrated within the organization.
Value Stream Mapping is commonly used in lean environments to identify opportunities for improvement in lead time.
*Corresponding Author E-mail: [email protected]

10 Shingre
IMR (Indira Management Review) Volume X, Issue 2, December, 2016
Although Value Stream Mapping is often associated with manufacturing, it is also used in logistics, supply chain, service related industries, healthcare, software development, and product development.
In a build to the standard form Shigeo Shingo suggests that the value adding steps be drawn across the centre of the map and the non-value adding steps be represented in vertical lines at right angles to the value stream. Thus, the activities become easily separated into the value stream which is the focus of one type of attention and the 'waste' steps another type. He calls the value stream the process and the non-value streams the operations. The thinking here is that the non-value adding steps are often preparatory or tidying up to the value-adding step and are closely associated with the person or machine/ workstation that executes that value adding step. Therefore, each vertical line is the 'story' of a person or workstation whilst the horizontal line represents the 'story' of the product being created.
Value stream maps are usually drawn by hand in pencil to keep the mapping process simple and allow for simple correction. The idea is that a map can be drawn without delay while observing the target process in situation.
However, software tools are emerging as an alternative. A variety is available either as stand-alone products or stencils/ add-ons to products such as Microsoft Visio and iGrafxFlowCharter.
Advantages of Value Stream Mapping Following are the some of the advantages of value stream mapping:
1. Being able to react to the customers demand 'pull'
2. Eliminating waste to increase the proportion of time that is 'value-added'
3. Knowing the true product or service cost
4. Understanding the relationship between functions and their knock on impacts
5. Reducing inventory and holding it in the right place
6. Reducing process lead time
7. Increasing manpower and equipment flexibility
8. Building robust, standardized processes
It also results in repeat business due to more customer focus and more value to the customer. VSM helps the organization to maintain the harmony between departments by clear role and responsibility, proper escalation of issues and by proper direction from the owner. It also improves the communication and coordination within the organization.

Enterprise Value Stream Mapping: Satisfying Stakeholders 11
IMR (Indira Management Review) Volume X, Issue 2, December, 2016
Disadvantages of Value Stream Mapping Actually, there is as such no disadvantage of value stream mapping but VSM only focuses on customer’s perception of value. We can mention that following are weaknesses of the VSM:
1. It is not possible to meet and/ or exceed the customers expectations always
2. Organizational objective of making profit may be conflicting if customers value expectation is only cost
3. It is very complex to change Value Stream mapping with the change in customer, product and/ or market
4. Value Stream Mapping’s objective of minimizing non-value added activities may result in comfort of employees and may put pressure on employees
5. Value Stream Mapping is a tool which states that all processes need to be customer aligned and result in customer value. That shows VSM is considering a major stakeholder as CUSTOMER only.
Evolvement of Enterprise Value Stream Mapping Referring to the weakness of Value Stream Mapping there was an evolvement of concept of ‘VALUE OF THE ENTERPRISE’
What is the Value of the Organization? Value of the organization can’t be judged only by customer but also by other major stakeholders like shareholders/ investors, senior management, employees, suppliers.
There is need to be optimum balance of value from the perception of the all stakeholders.
Definition of Enterprise Value Stream Mapping Enterprise Value Stream Mapping can be defined as the maximization of value for all defined stakeholders. Following are the examples of some of the stakeholders:
1. Shareholders
2. Customers
3. Employees
4. Enterprise leadership
5. Suppliers
EVSM focuses on value creation, in addition to waste elimination.
Note: Some of the other stakeholders could be:
12 Shingre
IMR (Indira Management Review) Volume X, Issue 2, December, 2016
Government
Society
Environment
Purpose of Enterprise Value Stream Mapping It provides basis for defining multiple stakeholder value streams and associated flows
Better Understand Enterprise Architecture and Interdependencies among Enterprise Processes
Define and Identify Sources of Waste at Enterprise Level
Maximization of Value Creation for All Stakeholders
Provide a Coherent Framework for Detailed Mapping within Various Enterprise Processes
Provide Methodology for Prioritizing, Sequencing and Coordinating Improvement Actions at Enterprise Level
Enterprise Flow Considerations Following are the flow considerations need to be considered for EVSM:
Materials flow
Information flows
Capital flows (Cash & Funds Flow)
Human Resources does not flow; they are utilized
Facilities do not flow; they are utilized
Energy/ Motivation flow
Knowledge “flows” between individuals/functions/suppliers--it is acquired, applied and enhanced
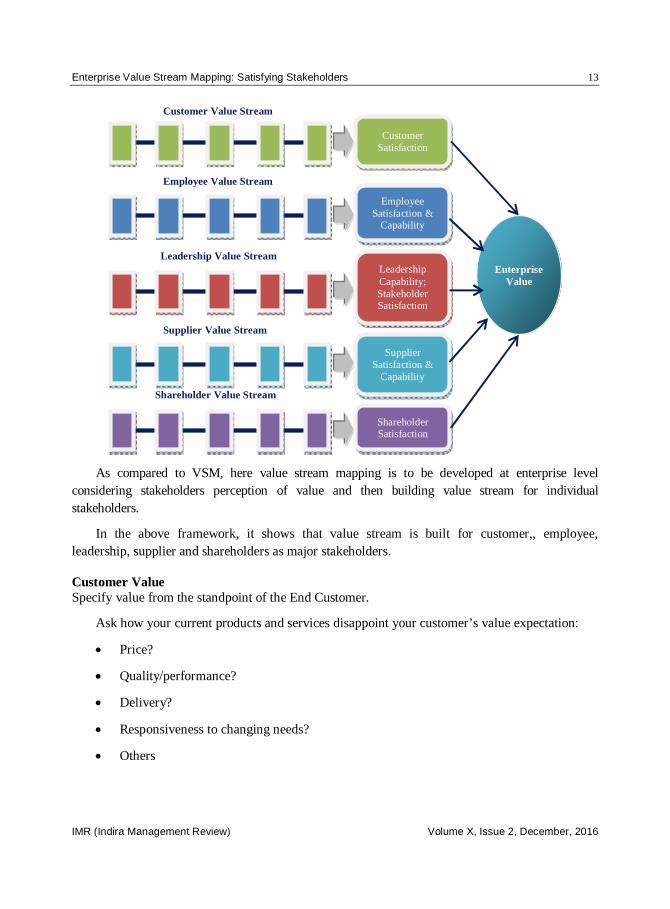
EVSM–Stakeholders Perspective Following value stream map gives the representation of the enterprise value stream mapping.
It is very important to build the organizational value for all the stakeholders to use their synergies and make the sustainable organization. EVSM is very good concept to give value to the stakeholders in the most possible way.
Enterprise Value Stream Mapping: Satisfying Stakeholders 13
IMR (Indira Management Review) Volume X, Issue 2, December, 2016
As compared to VSM, here value stream mapping is to be developed at enterprise level considering stakeholders perception of value and then building value stream for individual stakeholders.
In the above framework, it shows that value stream is built for customer,, employee, leadership, supplier and shareholders as major stakeholders.
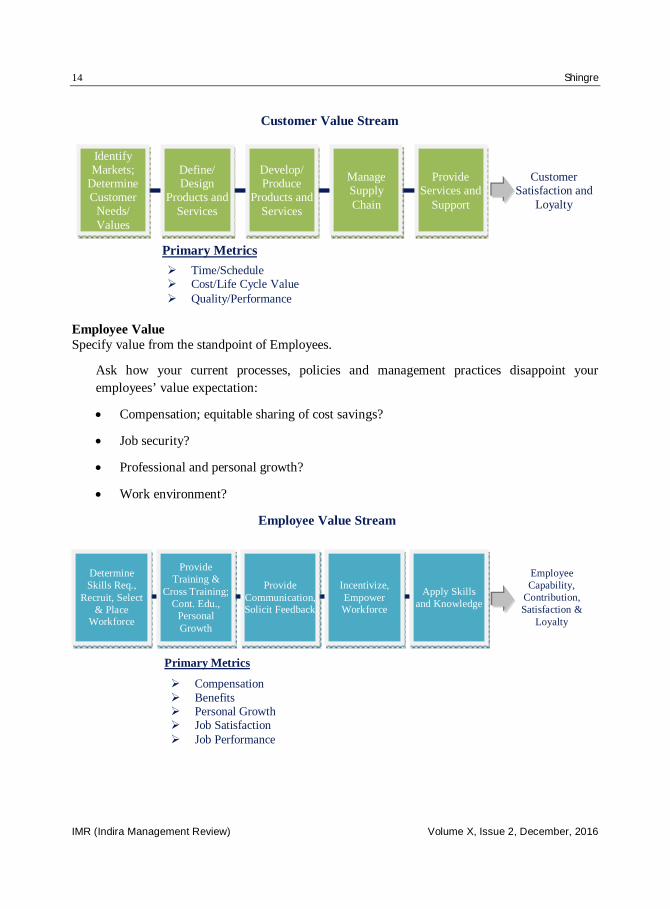
Customer Value Specify value from the standpoint of the End Customer.
Ask how your current products and services disappoint your customer’s value expectation:
Price?
Quality/performance?
Delivery?
Responsiveness to changing needs?
Others
Enterprise Value
Customer Value Stream
Employee Value Stream
Leadership Value Stream
Supplier Value Stream
Shareholder Value Stream
Customer Satisfaction
Employee Satisfaction &
Capability
Leadership Capability; Stakeholder Satisfaction
Supplier Satisfaction &
Capability
Shareholder Satisfaction
14 Shingre
IMR (Indira Management Review) Volume X, Issue 2, December, 2016
Employee Value Specify value from the standpoint of Employees.
Ask how your current processes, policies and management practices disappoint your employees’ value expectation:
Compensation; equitable sharing of cost savings?
Job security?
Professional and personal growth?
Work environment?
Compensation Benefits Personal Growth Job Satisfaction Job Performance
Employee Value Stream
Primary Metrics
Determine Skills Req.,
Recruit, Select & Place
Workforce
Provide Training &
Cross Training; Cont. Edu.,
Personal Growth
Provide Communication, Solicit Feedback
Incentivize, Empower Workforce
Apply Skills and Knowledge
Employee Capability,
Contribution, Satisfaction &
Loyalty
Time/Schedule Cost/Life Cycle Value Quality/Performance
Customer Value Stream
Primary Metrics
Identify Markets;
Determine Customer
Needs/ Values
Define/ Design
Products and Services
Develop/ Produce
Products and Services
Manage Supply Chain
Provide Services and
Support
Customer Satisfaction and
Loyalty
Enterprise Value Stream Mapping: Satisfying Stakeholders 15
IMR (Indira Management Review) Volume X, Issue 2, December, 2016
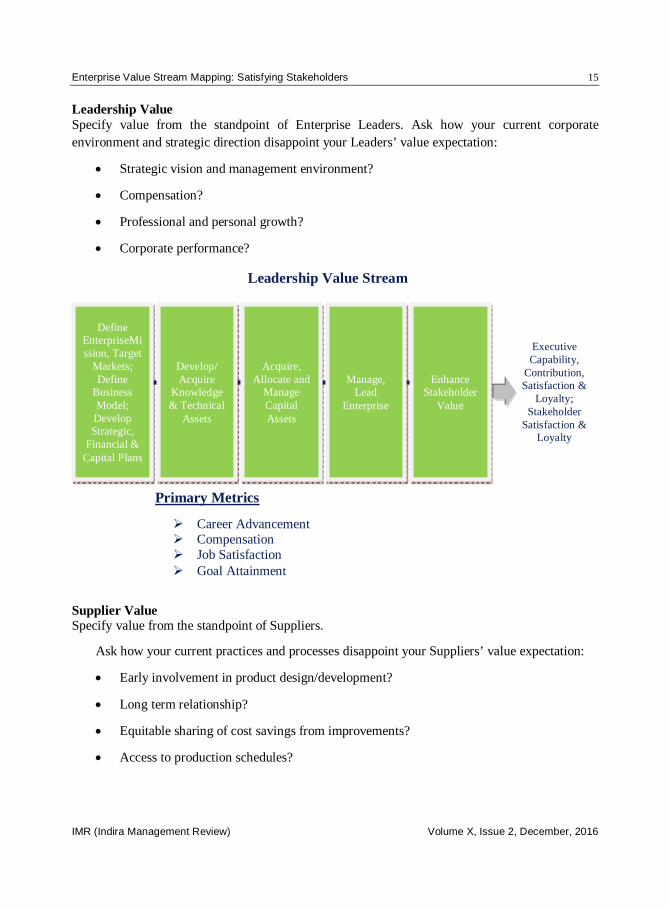
Leadership Value Specify value from the standpoint of Enterprise Leaders. Ask how your current corporate environment and strategic direction disappoint your Leaders’ value expectation:
Strategic vision and management environment?
Compensation?
Professional and personal growth?
Corporate performance?
Supplier Value Specify value from the standpoint of Suppliers.
Ask how your current practices and processes disappoint your Suppliers’ value expectation:
Early involvement in product design/development?
Long term relationship?
Equitable sharing of cost savings from improvements?
Access to production schedules?
Career Advancement Compensation Job Satisfaction Goal Attainment
Leadership Value Stream
Primary Metrics
Define EnterpriseMission, Target
Markets; Define
Business Model;
Develop Strategic,
Financial & Capital Plans
Develop/ Acquire
Knowledge & Technical
Assets
Acquire, Allocate and
Manage Capital Assets
Manage, Lead
Enterprise
Enhance Stakeholder
Value
Executive Capability,
Contribution, Satisfaction &
Loyalty; Stakeholder
Satisfaction & Loyalty

16 Shingre
IMR (Indira Management Review) Volume X, Issue 2, December, 2016
Shareholder/ Investor Value Specify value from the standpoint of Shareholders.
Ask how your current strategic direction and performance disappoint your Shareholders’ value expectation:
1. Share price, market share?
2. PAT?
3. Ability to generate cash flows?
4. Sustainability, Agile etc.
Define Enterprise
Scope; Review/
Approve Long Range
Business Plans
Share Price Market Penetration, Growth, Expansion Ability to Generate Cash Flow ROI Risk Mitigation
Shareholder (Investor) Value Stream
Primary Metrics
Raise Capital;
Issue Stocks & Bonds; Declare
Dividends
Set Executive Performance
Goals, Incentives & Compensation
Conduct Executive
Performance Reviews
Enhance Shareholder
Value
Shareholder Satisfaction &
Loyalty
Initiate Review & Approve Mergers,
Acquisitions, Partnerships
Adequate Margin Equitable Sharing of Cost Reductions Long Term Relationships
Supplier Value Stream
Primary Metrics
Strategic Selection of
Supplier Base; On-
going Assessment
Involve Suppliers in Pursuit of Business
Opportunities
Involve Suppliers Early in
Design & Development
Provide Access to
Production Schedules;
Require Delivery of Defect-free Products to Point of Use As Needed
Involve Suppliers in On-Going Product &
Process Improvement
Initiatives; Share
Benefits Equitably
Supplier Satisfaction, Capability &
Loyalty; Long Term
Relationship & Stability

Enterprise Value Stream Mapping: Satisfying Stakeholders 17
IMR (Indira Management Review) Volume X, Issue 2, December, 2016
Optimum Balance of Stakeholders Value Major technique used in industry is to find out the stakeholder’s satisfaction interdependencies by following matrix which will give basis for balancing the value of stakeholders.
Tata Business Excellence Model Tata Group is using Tata Business Excellence Model (TBEM) which is based on Malcolm Baldrige Award which was given by the Department of Commerce in the USA to the best valued and sustainable organization.
The framework of TBEM is as above and objective is to satisfy following stakeholders:
1. Customers
2. Investors
3. Employees
4. Suppliers
5. Government
6. Society
+ ++ + Shareholder Satisfaction
+ + + Supplier Satisfaction
++ + ++ ++ Leadership Satisfaction
++ + Employee Satisfaction
+++ ++ +++ Customer Satisfaction
Shareholder Satisfaction
Supplier Satisfaction
Leadership Satisfaction
Employee Satisfaction
Customer Satisfaction
Legend: +++ Extremely strong positive correlation -Negative correlation ++ Strong positive correlation --Strong negative correlation + Positive correlation ---Extremely strong negative correlation 0 Negligible or zero correlation
Stakeholder Satisfaction Interdependencies

18 Shingre
IMR (Indira Management Review) Volume X, Issue 2, December, 2016
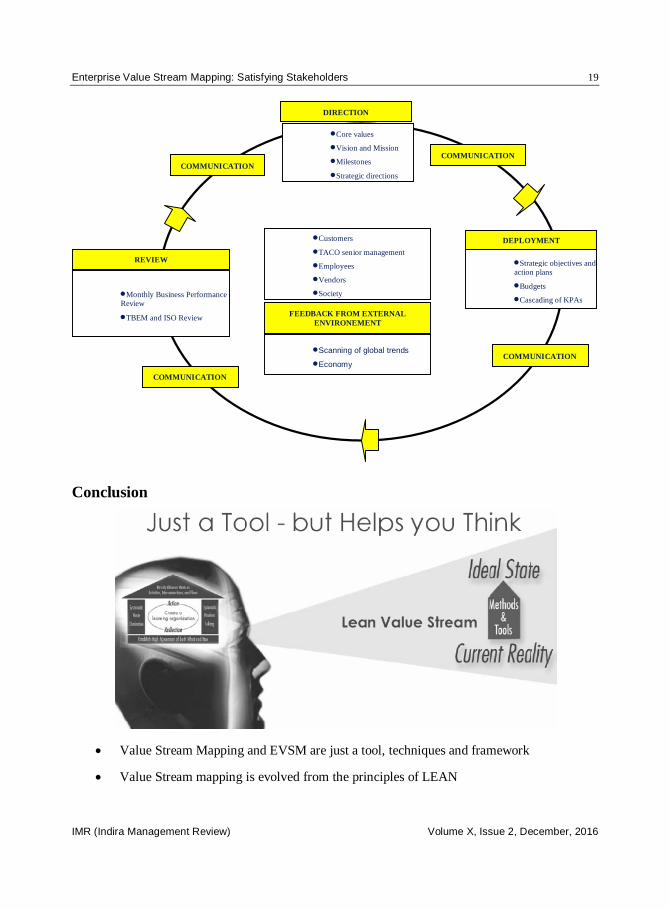
Tata Business Excellence Model Framework Following is the customized framework which is prepared by Tata Auto Comp Systems Ltd. (TACO) which is auto components manufacturing company.
TACO uses MOAC (Mother of All Charts) technique for EVSM.
The direction to the organization will be given by the senior management of TACO by defining core values, vision & mission and milestones for the organization.
It will be communicated and deployed by defining strategic objectives and action plans, budgets.
It is getting reviewed on monthly basis and after analysis it will be revised if required.
For making the system more oriented to stakeholders there will be interface of all stakeholders like customers, employees, vendors, senior management of TATA Group.
Enterprise Value Stream Mapping: Satisfying Stakeholders 19
IMR (Indira Management Review) Volume X, Issue 2, December, 2016
Conclusion
Value Stream Mapping and EVSM are just a tool, techniques and framework
Value Stream mapping is evolved from the principles of LEAN
STAKEHOLDERS FEEDBACK DEPLOYMENT Strategic objectives and action plans
Budgets
Cascading of KPAs
REVIEW
Monthly Business Performance Review
TBEM and ISO Review
DIRECTION Core values
Vision and Mission
Milestones
Strategic directions
Customers
TACO senior management
Employees
Vendors
Society
FEEDBACK FROM EXTERNAL ENVIRONEMENT Scanning of global trends
Economy COMMUNICATION COMMUNICATION
COMMUNICATION COMMUNICATION
20 Shingre
IMR (Indira Management Review) Volume X, Issue 2, December, 2016
In Value Stream Mapping, the processes should result in more value from the perception of the customer.
Enterprise Value Stream Mapping/ Management is technique which is evolved at enterprise level to find out the ‘VALUE of the ENTERPRISE’
In EVSM the approach is to create/ maximize the value of the organization for the stakeholders.
EVSM considers all stakeholders like Customer, Shareholders, Employee, Partners/ Suppliers, Society, Government etc.
Successful EVSM approach will ensure sustainable organization for particular period may be for decades
References [1] Rother, Mike and Shook, John, Learning to See: Value-stream Mapping to Create Value and Eliminate Muda,
ISBN: 0966784308. [2] Rich, Nick, Esain, Ann and Bateman, Nicola, Lean Evolution: Lessons from the Workplace. [3] Deming, W.E. (1982), Out of the Crisis, Cambridge University Press, Cambridge. [4] Juran, J.M. (1988), Juran on Planning for Quality, Free Press, New York, NY. [5] Taylor, F.W. (1911), The Principles of Scientific Management, Harper and Bros., New York, NY. [6] Gilbreth, Frank and Lillian (1924), The Quest of the One Best Way, Purdue University Frank and Lillian Gilbreth
Papers, 1924. [7] Website: http://en.wikipedia.org/wiki/Value_Stream_Mapping [8] Peter Hines Presentation of Cardiff University. [9] Motorola Case Study from www.motorola.com [10] Value Stream Mapping from IOWA University. [11] Workshop on Enterprise Value Stream Mapping by Lean Aerospace Initiative. [12] Malcolm Baldrige Award. [13] Tata Business Excellence Model.
IMR (Indira Management Review)
Volume X, Issue 2, December, 2016
Digital Disruptions in Automobile World
Sanjay Ahire* Sr. Process Engineer, Ford Motor Company, Westland, Michigan 1
Owner Finite 4 LLC (USA) & Trileehiretech LLP, India
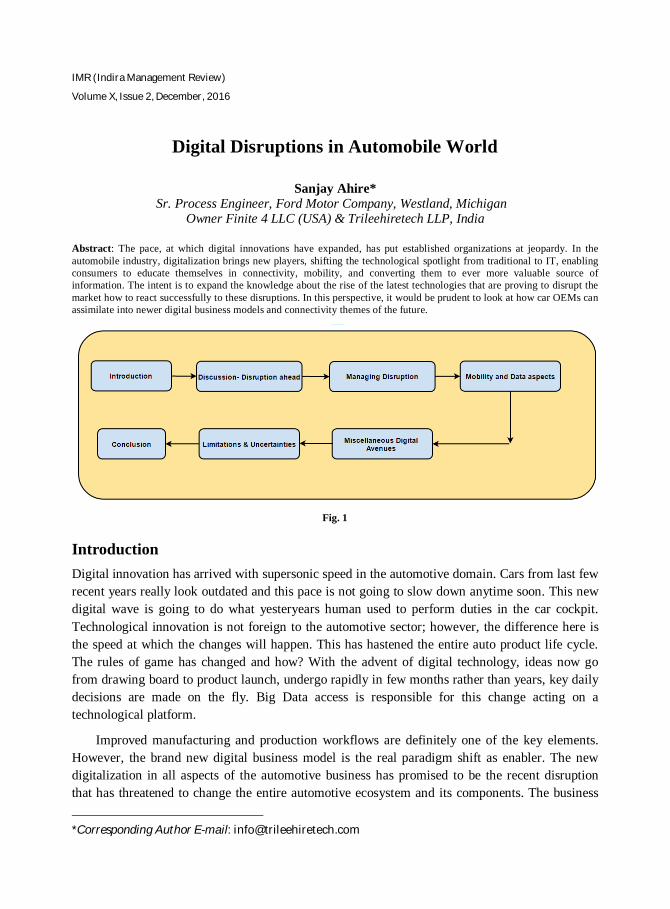
Abstract: The pace, at which digital innovations have expanded, has put established organizations at jeopardy. In the automobile industry, digitalization brings new players, shifting the technological spotlight from traditional to IT, enabling consumers to educate themselves in connectivity, mobility, and converting them to ever more valuable source of information. The intent is to expand the knowledge about the rise of the latest technologies that are proving to disrupt the market how to react successfully to these disruptions. In this perspective, it would be prudent to look at how car OEMs can assimilate into newer digital business models and connectivity themes of the future.
Fig. 1
Introduction Digital innovation has arrived with supersonic speed in the automotive domain. Cars from last few recent years really look outdated and this pace is not going to slow down anytime soon. This new digital wave is going to do what yesteryears human used to perform duties in the car cockpit. Technological innovation is not foreign to the automotive sector; however, the difference here is the speed at which the changes will happen. This has hastened the entire auto product life cycle. The rules of game has changed and how? With the advent of digital technology, ideas now go from drawing board to product launch, undergo rapidly in few months rather than years, key daily decisions are made on the fly. Big Data access is responsible for this change acting on a technological platform.
Improved manufacturing and production workflows are definitely one of the key elements. However, the brand new digital business model is the real paradigm shift as enabler. The new digitalization in all aspects of the automotive business has promised to be the recent disruption that has threatened to change the entire automotive ecosystem and its components. The business
*Corresponding Author E-mail: [email protected]

22 Ahire
IMR (Indira Management Review) Volume X, Issue 2, December, 2016
tool that it provides as cutting edge is rapidly replacing the yesteryears linear business models in many walks of automotive domain.
One of the most exciting advances in automotive evolution has been connectivity; thanks to technology like GM’s in-car concierge and safety system OnStar system which was introduced in the year 1996. This technology has been used by more than 1 billion customer requests. This technology has helped in automatic accident response and vehicle theft recovery, via satellite door unlocks, to vehicle repair diagnostics. It is a lightning fast data gathering machine that GM can use along with Mobileye to create precision maps to be used by autonomous vehicles. The company is also using OnStar's network in its new car-sharing service, Maven.
The focus seems to shift towards tech giants from Silicon Valley, Tel Aviv or Bangalore. As customers wants to be connected, relationships are shifting to a much more service oriented and data driven model. As the traditional automotive industry is not yet prepared to step up to this disruptive model, compared to the information and communication technology (ICT), acquisitions and collaborations are call of the hour.
Discussion: Disruption Ahead Though connectivity is not new to automotive sector, business opportunities in this technology are rapidly growing. As the automotive ecosystem is opening to powerful non-traditional players, digital connectivity is becoming a disruptive trend. Automakers need to determine their focus and identify where they can generate value from this technology; and accelerate the future when it comes to deploying new operating models and capabilities.
Mechanical engineering is soul to the automobile, traditionally. They will need to compete in digital and connected world which are not their forte. Value chains are shifting and the demand for the big data eclipses horsepower, the very business model is changing rapidly. The idea of cars as data generating autonomous machines may shift considerably in the near future. As mobility technologies evolve and vehicles gear and programme themselves to drive autonomously, the key question is, can the soul of car endure the test of time? This is the question that has kept many automobile pundits busy recently.
Autonomous driving is modifying the thinking about the car design and engineering. These futuristic cars look very different than what they seem today. More and more it has started looking like lightweight connected mobile living rooms that are made out of composite materials that are strong and light weight. If mobility becomes a common service, it may ring in end to the car ownership. Some of the prophecies are to fulfill the requirements of how a car can work in future service, namely, “mobility as a service” powered by a mobility provider. This mobility provider requires a connection over the cloud where the passengers provide their requirements for being transported, and the mobility provider will coordinate this. It does not stop here; it’s for transporting commodities as well. In the look ahead, it won’t matter whether we transport people by planes, trains or automobiles, we can combine all of this and call this “combo-traffic”.

Digital Disruptions in Automobile World 23
IMR (Indira Management Review) Volume X, Issue 2, December, 2016
Fig. 2
There are three things taking place in parallel:
The first is power train of the car. It will change from traditional combustion engine-driven systems to mechatronic systems.
Next, we will go from human operated cars to the functionality of autonomous behaving cars.
Other changes we see coming is behavioural shift in thinking. Society will not like to pay 100 per cent for a car when they use the car only say 20 per cent over their lifetime. They run the car 20 per cent, and the car stands still over its lifetime 80 per cent. Idea is to not possess or own but receive it as service. Customers would want to be transported by a good transport system. Fun by driving will be passé’. They would want to have fun by being transported. This is a completely different thinking.
Autonomous driving will come into picture as it is the next generation path all over the world, we are driving toward.
Question remains then–what is the role of mobility? Autonomous cars will be used by the mobility providers as on demand service eliminating the need to own the cars by the end customers. The mobility providers will look at the big data and with the help of data analytics will be able to predict the travel needs and pattern and accordingly offer the transportation service at a very economical fee. And, based on this business, now the pathbreaking evolution will start. This has an impact on the car manufacturers, because this mobility provider is now the contact to the end-customer. The customer is “service buyer” and not car buyer anymore. The below picture depicts the futuristic overall data generation and flow picture.

24 Ahire
IMR (Indira Management Review) Volume X, Issue 2, December, 2016
Fig. 3
Managing Disruption With the omnipresent digitalization, customers will be asking for more and more slick technologies in the car cockpit and surrounding vehicle. In order to cater to these changing demands, the traditional car manufacturers have to be alert enough to be service-oriented, meeting the demands as well as making earnings through the services provided. The mindset will be changing for the OEMs from the product feature based focus to the consumer oriented service providers. There is this mix of OEMs who would like to be in the comfort zone of manufacture feature-based cars and sale it to the traditional customers with the age old proven work techniques.

Digital Disruptions in Automobile World 25
IMR (Indira Management Review) Volume X, Issue 2, December, 2016
However, this space will eventually evaporate and the new business model of adapting the direct customer relationship with high level of service with the power of the ICT like technologies, sell the entire connectivity package as service to the end customer. There are various other scenarios possible in the new order. One of them is the traditional OEMs will be contractors to the ICTs like Google and Apple of the day. Other option is for OEMs to completely revamp and reinvent just like Ford is trying to do having started Ford Mobility Centre in Silicon Valley.
Mobility and Data Aspects Prime input to the mobility is the consumer data. The entire concept of mobility hinges on the data patterns and its utility by harvesting. Currently, this is just a data and has no intelligence to it proving to be useless. However, this will change soon with many avenues to predict the behavioural patterns converted to the requirements and eventually leading to the economical solutions. That is where the race begins to grab that all important fuel that runs the mobility engine. There are many considerations here.
Data Ownership: Customers think the data should be owned by them as they are the authors originating the data. However, since the cars are the place where the data is generated, it becomes all that easy for the car producers to claim the ownership. They may as well offer lucrative deals to get their hands on the data with the carrot of providing convenient service at a very affordable price.
Data Security: The all important data floating around cannot be open to all. There needs to be secured channels that transmit it to the proper databases avoiding hacking. The nervousness of the end customer can be well understood and cannot be undervalued. Becoming customers trusted data hub should be the first and foremost priority of the OEMs.
Reward Programs: More and more customers would like to sell the data at a premium. Moot question would be who to trust more. Traditionally, ICTs are the most trusted partners whom the customers trust the most rather than any other third party. The reasons are plenty. The rewards and the points system rewarding the data usage are the best with the ICTs. The long term recurring business also provides them with elite memberships and some cool gains. It is eventually the forces in the ICT which are predicted to compete for that share.
Demographics: Studies and experiences in the industry so far point out that the emerging economies such as China, India and Thailand has customers who are more progressive about allowing access to this data versus the western users. The consumers in the growing economies could lead the way to the more bold reward programmes paving way for the path-breakers.
26 Ahire
IMR (Indira Management Review) Volume X, Issue 2, December, 2016
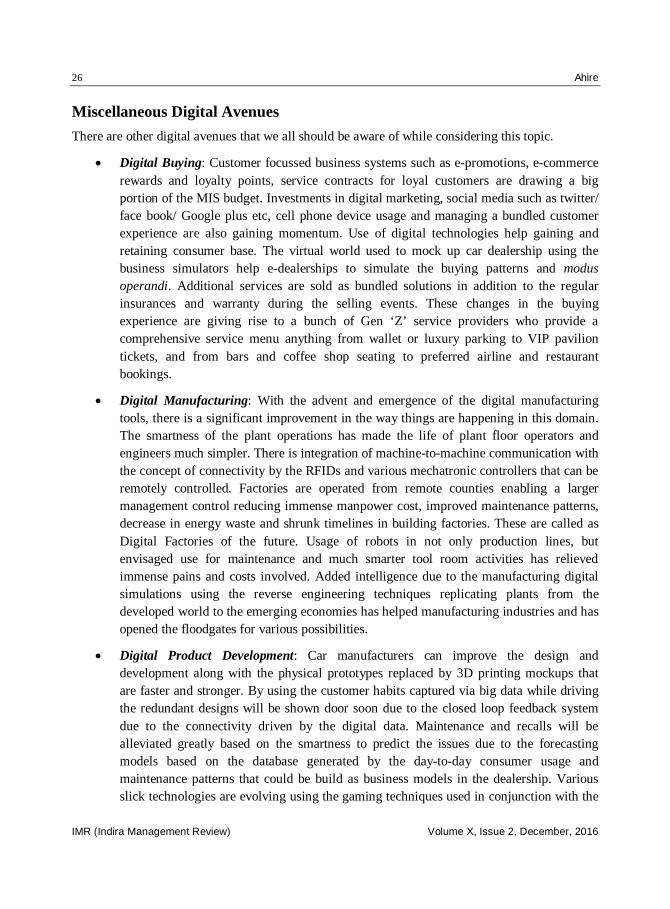
Miscellaneous Digital Avenues There are other digital avenues that we all should be aware of while considering this topic.
Digital Buying: Customer focussed business systems such as e-promotions, e-commerce rewards and loyalty points, service contracts for loyal customers are drawing a big portion of the MIS budget. Investments in digital marketing, social media such as twitter/ face book/ Google plus etc, cell phone device usage and managing a bundled customer experience are also gaining momentum. Use of digital technologies help gaining and retaining consumer base. The virtual world used to mock up car dealership using the business simulators help e-dealerships to simulate the buying patterns and modus operandi. Additional services are sold as bundled solutions in addition to the regular insurances and warranty during the selling events. These changes in the buying experience are giving rise to a bunch of Gen ‘Z’ service providers who provide a comprehensive service menu anything from wallet or luxury parking to VIP pavilion tickets, and from bars and coffee shop seating to preferred airline and restaurant bookings.
Digital Manufacturing: With the advent and emergence of the digital manufacturing tools, there is a significant improvement in the way things are happening in this domain. The smartness of the plant operations has made the life of plant floor operators and engineers much simpler. There is integration of machine-to-machine communication with the concept of connectivity by the RFIDs and various mechatronic controllers that can be remotely controlled. Factories are operated from remote counties enabling a larger management control reducing immense manpower cost, improved maintenance patterns, decrease in energy waste and shrunk timelines in building factories. These are called as Digital Factories of the future. Usage of robots in not only production lines, but envisaged use for maintenance and much smarter tool room activities has relieved immense pains and costs involved. Added intelligence due to the manufacturing digital simulations using the reverse engineering techniques replicating plants from the developed world to the emerging economies has helped manufacturing industries and has opened the floodgates for various possibilities.
Digital Product Development: Car manufacturers can improve the design and development along with the physical prototypes replaced by 3D printing mockups that are faster and stronger. By using the customer habits captured via big data while driving the redundant designs will be shown door soon due to the closed loop feedback system due to the connectivity driven by the digital data. Maintenance and recalls will be alleviated greatly based on the smartness to predict the issues due to the forecasting models based on the database generated by the day-to-day consumer usage and maintenance patterns that could be build as business models in the dealership. Various slick technologies are evolving using the gaming techniques used in conjunction with the

Digital Disruptions in Automobile World 27
IMR (Indira Management Review) Volume X, Issue 2, December, 2016
mechanical softwares that enables foolproof designs. This approach of design for consumers stepping up from design for manufacturing will help industry resolve many pain points for a better customer experience.
Digital Supply Chain: The main benefit from interconnecting the supply chain is reduction in cost via a better managed SCM process. In the past, the supply chain has been depicted as long lead times in a complicated workflow. Digitalization will reduce dollar cost and speed supply chain transparency through continued allied system integration, data collection and big data analytics. It has promised to shrink the number of deficiencies and accelerate the entire process of part design, production and delivery. Mostly the integration will be achieved through the cloud, where everyone in the chain will be accessing the very same data, resulting in flexibility and stability in the system.
Social media monitoring across the supply chain can more quickly identify component quality breakdowns where a supplier rather than the vehicle manufacturer would have to redesign, rebuild and resupply a part. The exploding growth of data from the connected Internet of Things throughout the supply chain will demand new skills for workers and managers.
Health and Wellness: The evolution of new business models arising from industry convergence will look more feasible than a standalone approach. For example, the convergence of healthcare players and car manufacturers is expected to expand, with health, wellness and wellbeing becoming a brand separator beyond connected and self-driven cars.
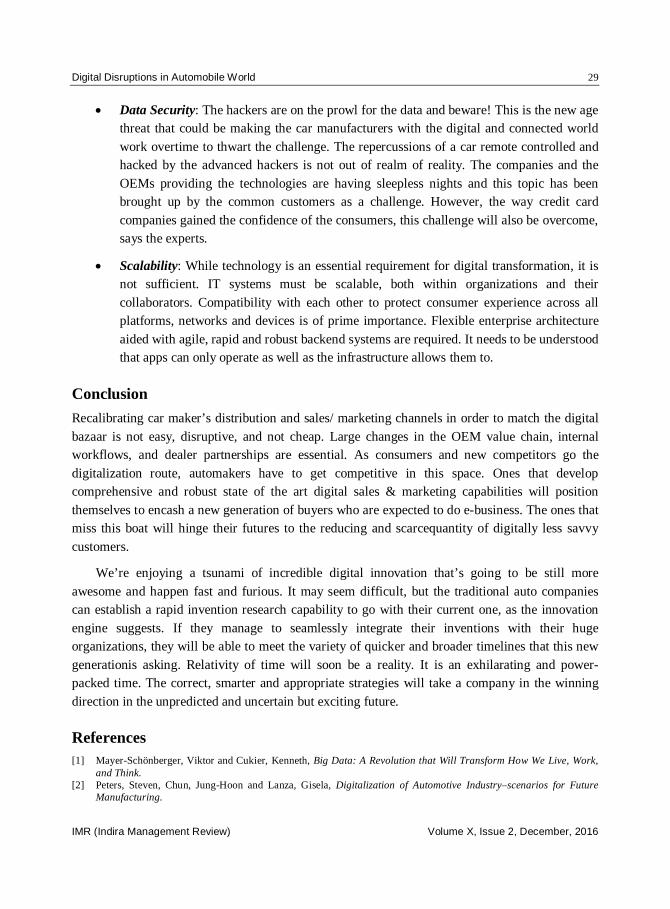
Limitations and Uncertainties The speed at which the evolution is happening has made the pundits sit upright and take notice of the possible winners; who will be the major players in the connectivity and who will have more influence to disrupt the market. The safe prediction was that the technological powerhouse will come and dominate this space. However, the subtle knowledge of cognitive number crunching and analysis to the facial recognition technologies would proceed further. To translate these gaps into dollar value, engineers need to realize that smart car solutions transcend way beyond a simple vehicle option. Rising in the connected car domain needs a totally innovative business mind, which concludes immense changes in strategy, thinking, culture, and execution across the entire company.
Key Players Success/ Failures: Dominant players such as Apple and the Google are expected to cause the stir. They would likely come up with state-of-the-art applications that will compete in the messaging, music, voice commands and data gathering software tracking the customer behaviour and solution to cater to these needs. Carplay, Siri, iTunes, Android Auto etc. are examples.

28 Ahire
IMR (Indira Management Review) Volume X, Issue 2, December, 2016
Rise of Specialization: Exponential expansion in the digital information in the customer facial expressions tracking devices, remote control of cars using telematics and sophisticated mechatronics giving rise to the specific companies catering to these special needs. This infers that the traditional IT players may not be the ones who will dominate the space but it could be someone else who could rise above others.
Fig. 4
Culture Shock: This is the most talked about thing in the HR world. It will be difficult to absorb this change easily. The traditional methods will fall apart and a new generation will rule the key positions in the organization leading to the conflicts. Younger players could rule the roost leading to the unrest; that is very common in the IT world but uncommon in the mechanical world of automotive. There would be immense need of counselling and couching the hard-to-change minds, howsoever valuable resources they may be. The meltdown in the year 2008-09 had seen the exodus of the talent which was hard to replace in the coming years after the automobile recession. It will be prudent to learn from the history and gear up for the future shocks. Organizational changes, large shakeups may be needed to make the conventional organizational structures nimble for the faster launches with higher pace.
Talent Acquisition: The same old talent may not be able to sustain the pace of newer inventions that are needed to fulfill the digital wave. Various hirings and trainings will be the call of the day to meet the challenges posed.
Digital Disruptions in Automobile World 29
IMR (Indira Management Review) Volume X, Issue 2, December, 2016
Data Security: The hackers are on the prowl for the data and beware! This is the new age threat that could be making the car manufacturers with the digital and connected world
work overtime to thwart the challenge. The repercussions of a car remote controlled and hacked by the advanced hackers is not out of realm of reality. The companies and the
OEMs providing the technologies are having sleepless nights and this topic has been brought up by the common customers as a challenge. However, the way credit card
companies gained the confidence of the consumers, this challenge will also be overcome, says the experts.
Scalability: While technology is an essential requirement for digital transformation, it is not sufficient. IT systems must be scalable, both within organizations and their
collaborators. Compatibility with each other to protect consumer experience across all platforms, networks and devices is of prime importance. Flexible enterprise architecture
aided with agile, rapid and robust backend systems are required. It needs to be understood that apps can only operate as well as the infrastructure allows them to.
Conclusion Recalibrating car maker’s distribution and sales/ marketing channels in order to match the digital
bazaar is not easy, disruptive, and not cheap. Large changes in the OEM value chain, internal workflows, and dealer partnerships are essential. As consumers and new competitors go the
digitalization route, automakers have to get competitive in this space. Ones that develop comprehensive and robust state of the art digital sales & marketing capabilities will position
themselves to encash a new generation of buyers who are expected to do e-business. The ones that miss this boat will hinge their futures to the reducing and scarcequantity of digitally less savvy
customers.
We’re enjoying a tsunami of incredible digital innovation that’s going to be still more
awesome and happen fast and furious. It may seem difficult, but the traditional auto companies can establish a rapid invention research capability to go with their current one, as the innovation
engine suggests. If they manage to seamlessly integrate their inventions with their huge organizations, they will be able to meet the variety of quicker and broader timelines that this new
generationis asking. Relativity of time will soon be a reality. It is an exhilarating and power-packed time. The correct, smarter and appropriate strategies will take a company in the winning
direction in the unpredicted and uncertain but exciting future.
References [1] Mayer-Schönberger, Viktor and Cukier, Kenneth, Big Data: A Revolution that Will Transform How We Live, Work,
and Think. [2] Peters, Steven, Chun, Jung-Hoon and Lanza, Gisela, Digitalization of Automotive Industry–scenarios for Future
Manufacturing.

30 Ahire
IMR (Indira Management Review) Volume X, Issue 2, December, 2016
[3] Kessler, Tim and Buck, Chris, How Digitization Affects Mobility and the Business Models of Automotive OEMs. [4] Pasch, Brian, Pasch, Glenn, McGurren, Marc and Shaffer, Edward, Selling Cars in the Digital Age. [5] Schmidt, Eric and Cohen, Jared, The New Digital Age: Reshaping the Future of People, Nations and Business. [6] Koushik, Srini and Dr. Mehl, Rainer, The Automotive Industry as a Digital Business. [7] http://www.mckinsey.com/industries/automotive-and-assembly/our-insights/a-road-map-to-the-future-for-the-auto-
industry [8] https://www.atkearney.com/automotive/ideas-insights/featured-article/-
/asset_publisher/4rTTGHNzeaaK/content/how-automakers-can-survive-the-self-driving-era/10192 [9] http://www.tcs.com/resources/white_papers/Pages/Digitization-Auto-Companies.aspx

IMR (Indira Management Review)
Volume X, Issue 2, December, 2016
A Study of Recycling in the Recovery Hierarchy of Reverse Logistics
Mangesh P. Dande* Assistant Professor, Indira School of Business Studies, Pune1
Abstract: All businesses have forward as well as reverse flows of goods. The forward flow moves from the supply of raw material to the end user. The reverse flow moves counter to this forward flow. There are multiple reasons and outcomes of the reverse flow of goods. One such outcome is recovery of material or energy. There are several recovery options in the recovery hierarchy which need sound evaluation. Organizations have started focussing on various recovery options in reverse logistics for economic, customer and environmental reasons. One such strategic option is recycling which is the recovery of materials from rejected/ used/ end of life/ obsolete products or waste. The paper presents the recycling process and its place in the Recovery Hierarchy. It covers the definition, reasons, advantages and concerns about recycling. It gives an insight into the importance of recycling in the area of material recovery management in reverse logistics.
Keywords: Reverse Logistics (RL), Recovery Hierarchy, Recovery Options, Recycling
Introduction Rogers D.S. (1998)1 has explained reverse logistics (RL) in their unique book Going Backwards: Reverse Logistics Trends & Practices. RL is the process of planning, implementation, and controlling the efficient and cost-effective flow of various materials such as raw materials, in-process inventory, finished goods and associated information from the point of end-user to the point of origin. The end purpose is to recapture value or correct disposal. More specifically, RL is the reverse flow of goods from their last destinations for re capturing value or correct disposal. The definition may also include remanufacturing and refurbishing activities. Growing concern for green supply chains makes it more relevant to focus on reverse logistics.
The returns can be broadly classified into three types:
1. Manufacturing Returns: raw materials, excess materials, rejections, leftovers, byproducts.
2. Distribution Returns: product recalls, stock returns, and commercial returns.
3. Customer Returns: Guarantee/ warranty returns, service returns, end of use/ end of life returns.
The RL process moves from product collection to inspection, separation, sorting till final disposition. The various options in RL could be return to seller, reuse, resell, redistribute, salvage, repair, recondition, refurbish, remanufacture, ‘recycle’, donate, disposal through incineration or to landfill.
*Corresponding Author E-mail: [email protected]

32 Dande
IMR (Indira Management Review) Volume X, Issue 2, December, 2016
There are a number of disposition options available in RL to fulfill the economical, legislative and social obligations. The process of ‘Recycling’ is one of them. ‘Recycling’ is the recovery of parent materials from rejected/ used /end of life/ obsolete or waste materials. ‘Recycling’ involves collection, sorting, processing of the materials to its original form so that it can be reused as inputs for manufacturing products of similar or other designs. One prime reason is saving of scare materials which we extract from mother earth. The result is cost effectiveness and reduced environmental damage. In this research paper the study of ‘Recycling’ as a material recovery option in the recovery hierarchy is presented.
Objectives The paper intends to fulfill the following objectives:
To understand the meaning of reverse logistics and its drivers.
To study recycling as a material recovery option.
To understand the reasons, advantages and concerns about recycling.
Research Methodology The findings presented in this paper are the outcome of the survey of literature conducted by the researcher. A review of the secondary data in the area of materials recovery management under reverse logistics was done. A number of articles and research papers on reverse logistics and materials recovery options were referred. Websites of various organizations were studied for getting information about the drivers of reverse logistics. The reasons for recycling were explored from different sources. The outcome of the review of the recycling practices and their pros and cons are given in the conclusion section of this paper.
Reverse Logistics Definitions The definitions and meaning of reverse logistics by some of the authors/ organizations are given in this section.
Business dictionary2 gives the definition of Reverse Logistics as the movement of the unwanted or excess materials, in process products or finished equipment back to the manufacturing firm. The reasons for this reverse movement through their logistics chain could be for ‘Recycling’, reuse or final disposition.
James R. Stock (1998)3 has given his definition at the Council of Logistics Management in 1998. He says that the term ‘Reverse Logistics’ is in reference to the logistics role in returns of goods, reduction of sources, substitution of materials, ‘product recycling’ and disposal of waste. It also covers repairs, refurbishing and remanufacturing.

A Study of Recycling in the Recovery Hierarchy of Reverse Logistics 33
IMR (Indira Management Review) Volume X, Issue 2, December, 2016
According to Bearing Point (2008)4, RL denotes a set of planning, implementation and control measures of the flow of raw materials and final products so as to recover and ‘recycle’ those materials or products. It involves a wide range of actions, including collection, sorting for further processing and reconditioning.
According to Guide, et al. (2000)5, RL is the task of recovering the discarded products; including shipping and packaging materials and backhauling them to a central collection area for either remanufacturing or ‘recycling process’.
Karen Hawks (2006)6 includes a wide range of actions. It covers the returns goods processing resulting from goods damage, seasonal inventory, salvaging operations, recalled inventory, end of use returns, end of life returns. Its scope also includes various ‘recycling programmes’, hazardous materials processes, obsolete components and equipment disposition and different asset recovery options.
According to Vogt et al. (2002)7, RL is the management of all activities involved in flow of goods, demand information and money in the direction opposite of the primary forward logistics flow. It involves reduction in the waste generated, as well as the management of collection, transportation, disposition and ‘Recycling’ of both types of hazardous and non-hazardous waste in a way that increases the long-term profitability of the organization.
Carter and Ellram (1998)8 explain Reverse Logistics as a process whereby organizations can be more environmentally efficient by ‘Recycling’, Reusing and Reducing the amount of materials used. It is the reverse distribution of materials amongst channel members. It facilitates the ‘Recycling’ and reuse of material thereby reducing the total material inputs.
A review of above definitions points out that these authors have included ‘Recycling’ under the scope of Reverse Logistics. The collection, sorting and processing of returned products to extract materials suitable for reuse is known as ‘Recycling’. It is an important part of the RL cycle. Some products which cannot be reused for technical, obsolescence or cost reasons can be recycled to recover the parent material. Organizations are adopting the recycling process for economic, legislative, environmental and social responsibility reasons. Under this, the returned products are processed by using appropriate technologies. These result in new materials which are available for use in same or different supply chains.
Reverse Logistics Drivers There are several reasons for Reverse Logistics. Products are retuned as they are not functioning properly or stopped to perform. They could move in reverse direction from any of their channel positions in supply chain.
Carter and Ellram (1998)8 put forth a model of forces which stimulate and restrain RL. They have identified four environmental forces:
1. Government (in terms of regulations).
2. Suppliers.
34 Dande
IMR (Indira Management Review) Volume X, Issue 2, December, 2016
3. Buyers.
4. Competitors.
The RL activities are either forced or done proactively for economic reasons. Generally organizations get involved in RL because they can profit from it or/ and they have to do it or/ and they feel socially motivated to do it.
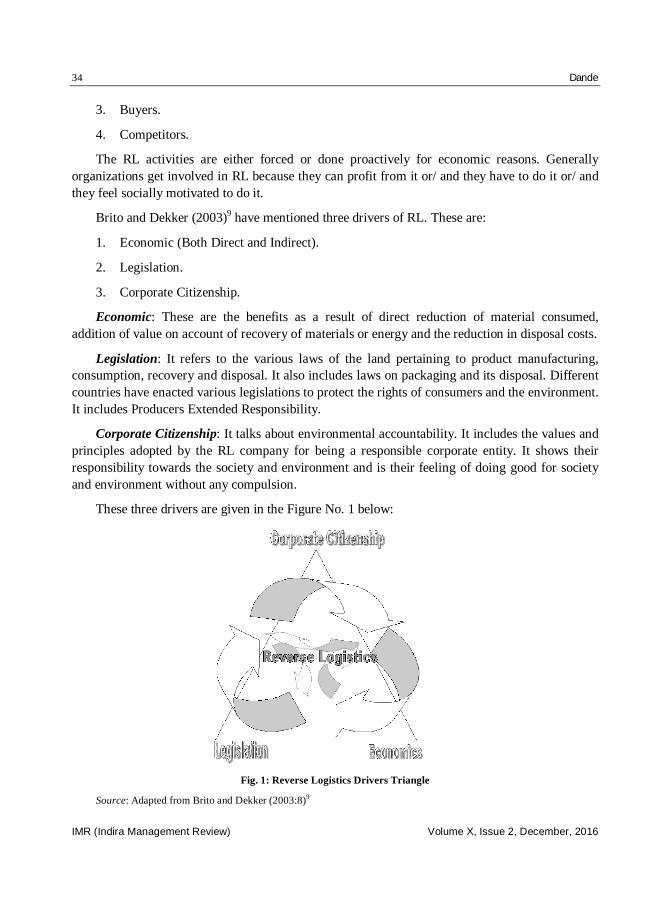
Brito and Dekker (2003)9 have mentioned three drivers of RL. These are:
1. Economic (Both Direct and Indirect).
2. Legislation.
3. Corporate Citizenship.
Economic: These are the benefits as a result of direct reduction of material consumed, addition of value on account of recovery of materials or energy and the reduction in disposal costs.
Legislation: It refers to the various laws of the land pertaining to product manufacturing, consumption, recovery and disposal. It also includes laws on packaging and its disposal. Different countries have enacted various legislations to protect the rights of consumers and the environment. It includes Producers Extended Responsibility.
Corporate Citizenship: It talks about environmental accountability. It includes the values and principles adopted by the RL company for being a responsible corporate entity. It shows their responsibility towards the society and environment and is their feeling of doing good for society and environment without any compulsion.
These three drivers are given in the Figure No. 1 below:
Fig. 1: Reverse Logistics Drivers Triangle
Source: Adapted from Brito and Dekker (2003:8)9

A Study of Recycling in the Recovery Hierarchy of Reverse Logistics 35
IMR (Indira Management Review) Volume X, Issue 2, December, 2016
The arrows in the figure depict that the three drivers are not mutually exclusive. All are overlapping and are playing their roles of RL drivers. Different situations and products would have varying pulls from these drivers. Also these are country dependent as different countries are having their own set of customer and environmental legislations.
Reverse Logistics Recovery Options According to Brito and Dekker (2003)9 the recovery options are the various methods of recovery and recapturing of value in the RL process. Actually, the process of recovery is an intermediate phase of the total RL chain. The four phases are explained below:
1. Collection: The first phase is of collection which involves bringing the material from the customer.
2. Inspection, Selection and Sorting: Assessing the quality and deciding to send it through appropriate channels depending on the inspection results. If quality is appropriate, it can be reused, resold or redistributed. Otherwise, the suitable recovery option is adopted.
3. Recovery Process: Involving some minor or major work as required for capturing the maximum value, or adopting any of the recovery alternatives as per the different levels as given in the Figure No. 2. It can be Repaired (Product level), Refurbished (Module level), Remanufactured (Component level), Retrieval (Selective part level), ‘Recycling (Material level)’and Incineration (Energy level).
4. Redistribution: The final phase is of redistribution to the channel partners as per requirements. If none of the recovery options are possible for technical or economic reasons, then the material is sent to landfill.
Fig. 2: Inverted Pyramid of Recovery Options
Source: Adapted from Brito and Dekker (2003)9
Direct recovery
Re-sale/Re-use/ Re-distribution
Process recovery
Repair
Refurbishing
Remanufacturing
Retrieval
Recycling
Incineration
(Landfill)

36 Dande
IMR (Indira Management Review) Volume X, Issue 2, December, 2016
The recovery options at different levels as explained above are shown in Fig. 2: Inverted Pyramid of Recovery Options. It is also called as the Hierarchy of Recovery.
It is not necessary that the recovery options at the top of the pyramid are of high value, or are more environmental friendly as compared to the lower end options. It depends on the economic value of the selected recovery option which varies from product-to-product. The existence for corresponding market also decides the value in RL chain.
Recycling According to Brito and Dekker (2003)9, there is a dilemma for what to do with returns. As discussed in previous section the Recovery Process can involve some minor or major work as required to capture maximum value. Organization can adopt any of the recovery alternatives as per different levels.
Product level
Module level
Component level
Selective part level
Material level
Energy level
Refer to the Inverted Pyramid of Recovery given in Fig. 2. In some situations the materials can go through the phase of Recycling (Material level) rather than moving to Incineration (Energy level) or going to the landfill. The reasons for choosing this recycling could be economic, legislative or social.
Above levels are known as ‘Recovery Hierarchy’. Recovery at the Recycling level is generating new materials by using the material which could not be recovered in the upper phases of this hierarchy from Product level to Selective part level. Here the form of the product changes. This recovery process is called as Recycling in which the returned material is processed using suitable technologies and converted to new usable material. This reuse could be in the same supply chain, manufacturing similar products or other supply chains producing other products.
It is just unsustainable in the short and long run to send the returns for Incineration i.e. burning or to landfills for final disposition. Both, incineration and landfill options lead to pollution of land, water and air. Hence, the best option in the recovery hierarchy before Incineration and landfill is recycling.
Conserve Energy Future10 gives the 3 Rs for a sustainable future. The ‘Reduce, Reuse, Recycle’ Waste Hierarchy is the order of priority of the actions to be taken to reduce the quantity of waste generated and to develop overall waste management processes and programmes. The waste hierarchy consists of 3 Rs as follows: Reduce, Reuse and Recycle. Called the “three Rs” of waste management, this waste hierarchy is the guidance suggested for creating a sustainable life.

A Study of Recycling in the Recovery Hierarchy of Reverse Logistics 37
IMR (Indira Management Review) Volume X, Issue 2, December, 2016
The First ‘R’–Reduce It is the concept of reducing what is produced and what is consumed and the first R in the waste hierarchy. The logic is simple to understand. If there is less waste, then there is less to recycle or reuse. The process of first R reducing begins with a scrutiny of what you are using, and what it is used for.
The Second ‘R’–Reuse Learning to reuse items, or re-purpose them for a different use then what they were intended for is the second essential in waste hierarchy.
The Third ‘R’–Recycling The final stage of this waste hierarchy is to recycle. To recycle a product means that it will be converted again into a raw material that can be formed into a different item. There are very few materials on the earth which cannot be recycled. Much development is being made towards integrating recycling plants with industries that can process the waste material. One needs to recognize as to which products can be recycled and which cannot. Carefully choosing the products that can be recycled will be the first step towards effective recycling.
Recycling Revolution11 gives an easy-to-use list of the materials which can be recycled. Aluminum cans, steel cans, copper, other metals, newspaper, magazines, paper packaging, plastics. The list of industrial components which can be recycled can include automobile parts, tyres, batteries, consumer durables, electronics equipment, construction waste, medical waste etc.
Company List–Recycling Companies in India12
There are over hundred companies in India doing recycling of agricultural produce, automobiles, chemicals, construction materials, electrical equipment, industrial equipment, medical waste, metals, paper, plastics, rubber and textiles. These are mostly concentrated in the industrial belts. They cost effectively cater to the material requirements of the industry and reduce the adverse impact on environment.
Stakeholders13 in recycling business, include investors, owners, government agencies, environmental groups, customers, citizens, employees and suppliers. All play a role in the recycling business which is an important component of the reverse logistics.
Environmental Laws of India14
Central Government of India has notified rules under Environment (Protection) Act, 1986 for dealing with non-biodegradable solid waste materials causing environmental hazards when released into land, water and atmosphere. The dangers are so vast that India alone generates about 800 to 3,200 tons of plastic waste per day. These rules pertain to the manufacture, use, collection, segregation, transportation and disposal of recycled plastics carry bags and containers. These rules are enforced by the State Pollution Control Boards. These are applicable to vendors selling
38 Dande
IMR (Indira Management Review) Volume X, Issue 2, December, 2016
foodstuffs. They cover prohibition of usage of carry bags or containers made of recycled plastics for storing, carrying, dispensing, or packaging of foodstuffs. Manufacturers of recycled plastic carry bags shall code/ mark carry bags and containers. Manufacturers shall print on each packet of carry bags as to whether these are made of ‘recycled material’ or of ‘virgin plastic’. The minimum thickness of the carry bags produced from virgin plastics/ recycled plastics shall not be lesser than 20 microns.
Definition of Recycling Dictionary15 meaning of Recycling is to treat or process used or waste materials so as to make suitable for reuse. It means, to make something new from what has been used before, to process in order to regain the material for use.
As per Calrecycle16, recycling is using waste as material to manufacture a new product. Recycling involves altering the physical form of an object or material and making a new object from the altered material. Recycling is not total waste prevention because only waste generated can be recycled. One must generate waste in order to recycle the waste. Therefore, if you are recycling, you have already created waste. Although recycling is a desired thing, ideally it would be better to not generate any waste. Of course, recycling consumes less energy and resources than making new replacement items with virgin material. With recycling, you normally need to collect a material, transport it, clean and sort it, transform it, market that transformed material, make the converted material into a new product, package and market the product. Manufacturing a product out of recycled materials is environmentally better than using virgin materials.
Reasons for Recycling Soccra17 gives 10 Reasons to Recycle:
1. Good for the Economy: Businesses get the required raw materials to produce new products.
2. Creates Jobs: Millions of workers are employed for recycling operations which are mostly labour intensive.
3. Reduces Waste: Effective recycling reduces overall wastage and flows towards landfill are reduced.
4. Good for the Environment: Recycling consumes far less energy, uses lesser natural resources, and reduces waste from heaping up in landfills.
5. Saves Energy: Recycling offers noteworthy energy savings over production with virgin materials. (Manufacturing with recycled aluminum cans uses 95% less energy).
6. Preserves Landfill Space: No one wants to reside near a landfill. Recycling preserves existing landfill space. Land is very costly and the saved land could be used for more developmental projects.

A Study of Recycling in the Recovery Hierarchy of Reverse Logistics 39
IMR (Indira Management Review) Volume X, Issue 2, December, 2016
7. Prevents Global Warming: Recycling of solid waste checks the discharge of tons of greenhouse gases into the atmosphere.
8. Reduces Water Pollution: Producing goods from recycled materials creates far less water pollution than from virgin materials.
9. Protects Wildlife: Using recycled materials lessens the damage to forests, rivers, wetlands, and other habitat essential to wildlife.
10. Creates New Demand: Recycling and purchasing recycled goods generates additional demand for recycled products, thereby reducing waste and aiding our economy.
Advantages of Recycling Conserve Energy Future18 mentions some Advantages of Recycling:
1. Protects Environment: The notable benefit of recycling is that it supports in protecting the environment in the most stable manner. While countless trees are chopped down continually, recycled paper produced from certain trees is reused repeatedly to curtail deforestation. With recycled paper as an exceptional example, many other natural resources can be recycled and used this way.
2. Reduces Energy Consumption: A huge amount of energy is consumed during processing raw materials. Recycling helps to reduce energy consumption, which is critical for massive production such as refining or mining. This makes the manufacturing process very beneficial and cost-effective for the manufacturers.
3. Reduces Pollution: Today, Industrial waste is the highest source of all types of pollution. Recycling of industrial products such as chemical, plastics, and cans assists to reduce pollution levels significantly, as these materials are reused rather than throwing them away irresponsibly.
4. Reduces Global Warming: Recycling aids in reducing global warming and its adverse effects. Huge amount of waste is burned in piles which emits large amount of greenhouse gases such as CO2 and CFCs. Recycling ensures that this burning process is decreased and any waste is regenerated as a valuable product with no or minimal detrimental impact on the environment. Recycling produces fewer greenhouse gases as industries burn lesser fossil fuels for producing eco-friendly products.
5. Judicious and Sustainable Use of Resources: Recycling encourages sustainable and judicious use of resources. It ensures that there is much lesser discriminate use of material when presently available in plenty. Recycling is encouraged at all levels from school to corporate offices at international levels. The result is preservation of all precious resources for the future generations, without any compromise for the present.

40 Dande
IMR (Indira Management Review) Volume X, Issue 2, December, 2016
6. Conserves Natural Resources: If used and old materials are not recycled, then the new products are manufactured from extracting fresh raw materials from under the earth through extraction and mining. Recycling helps in saving important raw materials and safeguards natural surroundings for the future. Conserving the natural resources such as minerals, wood and water ensures its optimal use.
7. Reduces Volume of Waste to Landfills: Recycling of old and waste products into new products decreases the amount of waste going to landfills. This benefits in reducing pollution of land and water as landfills are the main sources in contributing to the damage of natural environment. Recycling programmes prevent tons of waste from being dumped into landfills every year.
8. Create Green Jobs: Recycling is helpful for the environment and also generates green jobs. Recycling requires a lot of labour for the various activities of collection, sorting and processing.
Concerns of Recycling Andrew Handley (2013)19 has cautioned about the adverse impacts of recycling, on the environment:
1. Recycling Gives False Promises: It’s the mindset it gives to the people. The idea is that by putting materials in the recycle bin, by buying products made from recycled material, we’re saving the environment but it is not really contributing to reduce and reuse.
2. All-In-One Recycling is Inefficient: There’s the problem of quantity versus quality. All-in-one recycling centres emphasis on speed which introduces extra contamination issues.
3. Some Products are Better Left Unrecycled: Products like glass which requires sand, the most abundant resource on the planet. Recycling of glass is more detrimental than the processing of virgin glass.
4. Recycling Barely Dents Demand: The demand for many recyclable products is growing too fast to keep up with anything that recycling can provide.
5. Oil Refining Creates Toxic Chemicals: Some recycling processes having oil emit toxic gases during reprocessing.
6. Current Methods Aren’t Effective: The present available technology is not that effective to control the adverse effects of recycling on environment.
7. Most Plastics Can’t be Recycled: Not all plastics can be recycled and if done leads to contamination problems and is harmful to health.
8. Paper Sludge is Just Disgusting: Some byproducts of recycling are too harmful to environment.
A Study of Recycling in the Recovery Hierarchy of Reverse Logistics 41
IMR (Indira Management Review) Volume X, Issue 2, December, 2016
9. Air Pollution is Still a Problem: Recycling has its own set of air pollution issues.
10. Contamination Gets Around: The issue of contamination of packaging materials for food products due to recycling is a great risk to human health and environment.
Conserve Energy Future18 Point Out Certain Disadvantages of Recycling
1. Not Always Cost Effective: Recycling is not always cost-effective. Sometimes, there may be a need to establish dedicated factories to process reusable products. This may generate more pollution as they would undergo the process of storage, cleaning and transportation.
2. Recycled Products May not Last for Long: Products from recycled materials are not always durable. Such items are generally made of trashed waste, handpicked from heaps and other waste products which are of fragile or used overly. For this reason, recycled products are cheaper and generally last for a shorter period.
3. Unsafe and Unhygienic Recycling Sites: Recycling sites are generally not safe and also unhygienic. Places where all types of waste are dumped are favourable for debris formation and spread of disease and related dangers caused by harmful waste and chemicals. This causes widespread pollution and is harmful for people who recycle such products. Such waste mixed with water leads to leachate formation and contamination of water bodies including drinking water.
4. Not Widespread on Large Scale: Although recycling is an important step to curtail pollution, unfortunately this process is just a minor part of long-term success. Recycling regularly occurs on a smaller scale at homes, societies or schools and has failed to be useful at a larger level such as at industries or at a global level. Saving paper at schools level cannot be compared to the large oil spills or massive tree felling at industrial level.
5. High Initial Cost: Setting up a new recycling unit involves very high cost. This huge cost can come up as a part of acquiring different facilities, upgrading the processing units, educating residents through seminars and other programmes, disposing of existing chemicals and waste etc.
According to Mary Bauer (2015)20, “The Negative Effects of Recycling Paper” gives some adverse effects about recycling of paper:
Energy consumption is not effective in many situations and leading to higher energy costs in recycling of paper.
Harmful chemicals are produced as byproducts of recycling requiring further treatments to safeguard the environment.
Water pollution is the result of many recycling programs due to the removal of inks and other toxic materials.

42 Dande
IMR (Indira Management Review) Volume X, Issue 2, December, 2016
Solid waste generated during recycling is also having chemicals which are harmful to human beings and environment.
Encouraging Consumption: Recycling programs advertise about their care about planet and society encouraging people to purchase and consume more recycled products.
Conclusion Reverse logistics covers many activities including recycling. The drivers of reverse logistics are economic, environmental and legislative. Recycling is an important step of the Recovery
Hierarchy and a crucial recovery option. It is an inseparable part of the 3R philosophy. Whether it’s profitable or not, recycling must go on because of the imbalance between limited natural
resources and human material demand. It comes into picture after the previous options of Reduce/ Reuse/ Repairs/ Refurbish/ Remanufacture/ Retrieval are not possible for economical,
obsolescence, environmental or legislative reasons. Many sectors have scope of recycling of a number of materials.
The recycling is having advantages as reduced waste generation, lesser dependence on virgin materials leading to lesser mining activities and its related problems, reduced energy consumption,
lesser land/ water/ air pollution, reduced adverse environmental impacts, more employment generation, reduced landfills, reduced global warming, and protection of wildlife. Overall it is
good for sustainable economy and environment.
Not all is positive about recycling. The initial costs of recycling plants are high. Recycling
generates air/ water/ land pollution, some of the residual waste and byproducts are harmful. There are issues of safety and contamination of a few recycled products. Recycling is not sufficient to
meet demand of materials. Also, all materials are not recyclable and some are not cost effective.
According to Eco Cycle21, “Recycling isn’t the only answer. Recycling alone will not stop
resource destruction but it’s a significant step along the way to a world of Zero Emissions and Zero Waste. Zero Emissions refers to reducing emissions from transportation, energy and
production by choosing alternate means of travel, substitute fuels, preservation, efficiencies, and renewable rich and non-polluting sources of energy like wind and solar. Zero waste refers to
redesigning our manufacturing and consumption systems to utilize resources more efficiently, to avoid waste before it happens and to integrate all leftover materials back into the manufacturing
cycle rather than dumping them as waste. If we combine Zero Emissions and Zero Waste together, we would get our solution.
Government should encourage recycling over other disposition options of incineration and landfill by giving incentives so as to protect the resulting environmental damage, businesses to
design products in which the recovery can happen at the product/ module/ component/ part level. Also, they should target using some portion of recycled materials; purchasers to buy only those

A Study of Recycling in the Recovery Hierarchy of Reverse Logistics 43
IMR (Indira Management Review) Volume X, Issue 2, December, 2016
products which are made from recycled materials. They should adopt the philosophy of Reduce, Reuse and Recycle. Consumers to stop wasting and avoiding excessive consumerism and support
Industries using recycled materials. All stakeholders should understand the recovery hierarchy and support the 3R philosophy.
After weighing, the pros and cons of recycling, one can wisely take the right decisions related to this process. Understanding the impact of recycling is needed on a large-scale which if
effectively done can bring in substantial positive results, beneficial to survival of human beings and environment.
A famous proverb says that, “we do not inherit the earth from our ancestors, we borrow it from our children”. This holds true for all the resources we get from mother earth. The scarcity of
these resources needs to be understood and steps taken to use the reducing resources conservatively. Recycling aims at reduction and savings of the scare materials and thereby having
a positive impact on the environment.
References [1] Rogers, D.S. and Tibben-Lembke, R.S. (1998), “Going Backwards: Reverse Logistics Trends & Practices, Reverse
Logistics Executive Council”, Pittsburgh, P.A. [2] Business Dictionary, “Reverse Logistics” Retrieved from http://www.businessdictionary.com/definition/reverse-
logistics.html [3] Stock, James R. (1998), “Development and Implementation of Reverse Logistics Programs”, Oak Brook, Illinois,
Council of Logistics Management. [4] Bearing Point (2008), “How Mature is the Green Supply Chain?”, Supply Chain Monitor, Insight–Survey Report.
Retrieved from: http://supplychainstandardadmin.madgex.com/assets/getAsset.aspx?liAssetID=530 [5] Guide, D., Jayaraman, V., Srivastava, R. and Benton, W. (2000), “Supply Chain Management for Recoverable
Manufacturing Systems”, Interface, Vol. 30(3), pp. 125–142. [6] Hawks, Karen (2006), “What is Reverse Logistics?”, Reverse Logistics Magazine, Winter/Spring 2006 Retrieved
from: http://www.rlmagazine.com/edition01p12.php [7] Vogt, J.J., Pienaar, W.J. and De Wit, P.W.C. (2002), Business Logistics Management: Theory and Practices, Cape
Town: Oxford University Press. [8] Carter, C.R. and Ellram, L.M. (1998), “Reverse Logistics: A Review of Literature and Framework for Future
Investigation”, Journal of Business Logistics, Vol. 19, No. 1. [9] Marisa, Brito P. and Dekker, Rommert (2003), “A Framework for Reverse Logistics”, ERIM Report Series Research
in Management, ERS-2003-045-LIS.April 2003. [10] Conserve Energy Future “Reduce, Reuse, Recycle”, Retrieved from http://www.conserve-energy-future.com/reduce-
reuse-recycle.php [11] Recycling Revolution “What to Recycle”, Retrieved from http://www.recycling-revolution.com/recycling-basics.html [12] Company List–Recycling Companies in India, Retrieved from:
https://companylist.org/India/Environment/Recycling/3.html [13] Stakeholders Retrieved from: http://yourbusiness.azcentral.com/list-stakeholders-waste-business-25001.html [14] Environmental Laws of India, Retrieved from http://www.environmentallawsofindia.com/recycled-plastics-
manufacture-and-usage-rules,-1999.html [15] Dictionary.Com, “Recycle”. http://www.dictionary.com/browse/recycle [16] Calrecycle, “Recycling”, Retrieved from http://www.calrecycle.ca.gov/reducewaste/define.htm#Recycling [17] Soccra “10 Reasons to Recycle”, Retrieved from http://www.socrra.org/recycling_top10.shtml

44 Dande
IMR (Indira Management Review) Volume X, Issue 2, December, 2016
[18] Conserve Energy Future “Advantages and Disadvantages of Recycling”, Retrieved from http://www.conserve-energy-future.com/advantages-and-disadvantages-of-recycling.php
[19] Handley, Andrew (2013), “10 Ways Recycling Hurts the Environment”, Listverse, January 27, 2013 Retrieved from http://listverse.com/2013/01/27/10-ways-recycling-hurts-the-environment/
[20] Bauer, Mary (2015), “The Negative Effects of Recycling Paper”, Live Strong.com.Last Updated: Jun 22, 2015 Retrieved from http://www.livestrong.com/article/159591-the-negative-effects-of-recycling-paper/
[21] Eco Cycle “Recycling isn’t the only Answer”, Retrieved from: https://ecocycle.org/files/pdfs/EcoCycleTenReasons.pdf
IMR (Indira Management Review)
Volume X, Issue 2, December, 2016
A Study on Work–Life Balance of Employees at Federal Bank Ltd., Kothrud Pune
Dr. A.N. Barbole1 and Sheetal Gaur2 1Professor & Head, Department of Commerce and Management,
Chhatrapati Shivaji Night College of Arts and Commerce, Solapur 2Asst. Professor, Sinhgad College of Science, Pune
Abstract: In order to sustain in the competitive world, people are trying their level best to excel at their work place. But at the same time, they are expected to take care of their family and dependents. Employees keep on juggling their professional and personal life. They try hard to maintain a balance between their professional and personal life but fail to do so as expectations from both workplace and family are never-ending which ultimately lead to Work-Life imbalance. The concept of Work-Life balance is nothing but the separation that an employee does between his work-life and personal life. Earlier this, problem was faced by the people belonging to medical and police services but now-a-days, this problem has become a common phenomenon.
The efficiency of any organization depends upon the productivity of its employees. The productivity of an employee is directly linked with his Work-Life Balance. Hence, now-a-days most of the organizations are taking efforts to enable their employees to have a proper Work-Life Balance.
This paper is based on the study of Work-Life Balance of the employees in banking industry. The data for the research is collected from the employees of Federal Bank Ltd. Kothrud Branch Pune. The sample size for the study is 21 employees. After the research, it has been found that employees in the banks have problems of Work-Life Balance and organizations need to take this issue seriously and come up with some Work-Life Balance strategies so as to help their employees to maintain a Balanced Work-Life Balance.
Keywords: Work-Life Balance, Work-Life Imbalance, Productivity, Relationships
Introduction to the Study The work foundation1 has defined work-life balance as “Work-life balance is about people having a measure of control over when, where and how they work. It is achieved when an individual’s right to a fulfilled life inside and outside paid work is accepted and respected as the norm, to the mutual benefit of the individual, business and society.”
Jeffrey H. Greenhaus, Karen M. Collins and Jason D. Shaw2 have proposed three components of Work-Family Balance which are as follows:
Time balance: An equal amount of time devoted to work and family roles.
Involvement balance: An equal level of psychological involvement in work and family roles.
Satisfaction balance: An equal level of satisfaction with work and family roles.
Corresponding Author E-mail: [email protected], [email protected]

46 Barbole and Gaur
IMR (Indira Management Review) Volume X, Issue 2, December, 2016
Each component of work–family balance can represent positive balance or negative balance depending on whether the levels of time, involvement, or satisfaction are equally high or equally low.
Role ambiguity creates huge amount of frustration among the employees and that directly affects their work productivity. Hence, if some efforts are taken by both the employer as well as the individuals some solution can be found out to solve the problem of Work-Life balance.
Introduction to the Banking Industry Banking industry is one of the most prominent industries. Work-Life Balance in banking industry has always been a matter of concern as the work of bank includes huge amount of risk, employee transfer policy, increasing need of customers, heavy competition, technology upgradation, staff shortage, current retirement phase, work deadlines, etc. It is extremely difficult for the bankers to manage the increasing pressure which they get from their higher authorities. On the other hand, bankers are mostly being transferred every three years. Change in location is again a problem. Either they take their family with them or they move alone. Being away from their family creates stress among the employees. Expectations of the organization as well as expectations of family is creating huge amount of pressure on the employees.
This paper has tried to find out the factors affecting the work-life balance and the efforts taken by the organization and individuals to solve this problem in Federal Bank Ltd.
Objectives of the Study 1. To study the causes of Work-Life Imbalance of employees of Federal Bank Ltd., Kothrud
Branch Pune.
2. To study the challenges faced by the employees of Federal Bank Ltd. in maintaining the Work-Life Balance.
3. To evaluate whether family expectations/ dependency have an impact on the effectiveness of the performance of the employees of Federal Bank Ltd.
Research Methodology3 In order to carry out the research, following method is adopted:
Sources of Data Both, primary and secondary data has been used so as to carry out the research.
Primary Data In order to carry out the research, a questionnaire was prepared which consisted of 21 close ended and 1 open ended questions. The questionnaire was distributed to the employees of Federal Bank Ltd. Interview Method was also used so as to get general information.

A Study on Work–Life Balance of Employees at Federal Bank Ltd., Kothrud Pune 47
IMR (Indira Management Review) Volume X, Issue 2, December, 2016
Secondary Data Various reference books were used to collect information on research methodology. Internet was used to collect information on work-life balance. Various papers on work-life balance were referred.
Sampling Unit The employees of Federal Bank Ltd. Kothrud, Pune are the sampling unit for the study purpose.
Sample Size The sample size for the study is of 21 employees of Federal Bank Ltd. Kothrud, Pune.
Sampling Design Probability sampling design has been used so that every member of the population has got an equal chance to be included in the research. Census method has been adopted to collect the data as the number of employees in the bank was less and it was practically possible for the researcher to collect data from each and every employee in the bank.
Data Analysis and Interpretation
Chart No. 1: Representing the Age of the Employees at Federal Bank Ltd.
The above chart represents the age of the employees working in the bank. As in recent years many senior employees have been retired and new recruitments have taken place. 86% of employees fall under the age group of 25–30. The branch manager is a senior person and falls under the age group of 51–60.
Chart No. 2: Representing the Gender of the Employees of Federal Bank Ltd.
86%
0%9%
5%
25-30
31-40
41-50
51-60
43%
57%
Gender
Male
Female

48 Barbole and Gaur
IMR (Indira Management Review) Volume X, Issue 2, December, 2016
The above chart represents the gender of the employees. The number of female working in this bank is more than that of male.
Chart No. 3: Representing the Marital Status of the Employees, Whether They have Children and Dependents at Home
A total of 57% of the respondents are married. A total of 86% of the respondents’ fall in the age group of 25–30 and as of now, they do not have any other dependents on them at their place.
Chart No. 4: Representing the Satisfaction Level of Respondents towards the Working Hours of the Bank
The above chart represents the satisfaction level of respondents towards the working hours of the bank; it states that 86% respondents are satisfied with the working hours of the bank.
12
43
9
4
18
0
2
4
6
8
10
12
14
16
18
20
MARRIED CHLIDREN DEPENDENTS
YES
NO
86%
14%
SATISFIED
NOT SATISFIED

A Study on Work–Life Balance of Employees at Federal Bank Ltd., Kothrud Pune 49
IMR (Indira Management Review) Volume X, Issue 2, December, 2016
Chart No. 5: Representing Whether Employees have to Work Extra Hours in the Bank
The above chart states whether employees have to work extra hours in the bank. As per the research, respondents have to wait extra in the bank only when they have some emergencies in the bank. Otherwise, they often leave for home on time.
Chart No. 6: Representing a Combination of Two Questions: Managing Work-Life Balance and Sharing Time with Family
The above chart states that 86% respondents are able to manage their Work-Life and family life in an appropriate manner which is a positive sign for the bank; 57% respondents think that they get sufficient time for their family whereas 47% respondents think that they do not get sufficient time for their family because of work.
3
15
03
0
2
4
6
8
10
12
14
16
ALWAYS SOMETIMES OFTEN NEVER
18
12
3
9
0
2
4
6
8
10
12
14
16
18
20
ABLE TO BALANCE TIME FOR FAMILY
YES
NO

50 Barbole and Gaur
IMR (Indira Management Review) Volume X, Issue 2, December, 2016
Chart No. 7: Representing a Combination of Two Questions: Employees Worry about Work when they are with their Family and they Miss Out Quality Time Because of Work
As per the research, 71% respondents sometimes worry about their work when they are with their family; 47% respondents always miss out quality time with their family because of work.
Chart No. 8: Representing Whether Stress is Created Among Respondents Due to Work, Whether their Colleagues are Supportive and Whether Organization Provides Sufficient Resources
The above chart is a combination of three questions asked to the respondents. As per the research, 100% respondents have said that their colleagues are supportive; 86% respondents have said that they get sufficient resources from their organization to perform the work. When the respondents were asked about the stress created out of work, 57% respondents said that work creates stress to them whereas 43% respondents said that work does not create stress to them.
0
15
6
9 9
3
0
2
4
6
8
10
12
14
16
ALWAYS SOMETIMES NEVER
WORRY ABOUT WORK WHNE WITH FAMILY
MISS QUALITY TIME BECAUSE OF WORK
18
21
9
3
0
12
0 5 10 15 20 25
RESOURCES PROVIDED BY ORG
SUPPPORTIVE COLLEGUES
STRESS DUE TO WORK
NO
YES

A Study on Work–Life Balance of Employees at Federal Bank Ltd., Kothrud Pune 51
IMR (Indira Management Review) Volume X, Issue 2, December, 2016
Chart No. 9: Representing the Various Strategies Adopted by the Respondents to Manage Stress
The above chart represents the various strategies adopted by the respondents to manage their stress arising out of work. Yoga, meditation, entertainment, dance, music are the various methods used by the respondents to manage stress.
Chart No. 10: Representing Whether the Organization takes any Initiative to Reduce the Stress of the Respondents
As per the research, 100% respondents have said that organization does not take any initiative to reduce the stress level of the employees.
Chart No. 11: Representing Whether the Organization takes any Initiative to Manage the Work-Life Balance of the Respondents
8%
9%
26%
23%
34%YOGA
MEDITATION
ENTERTAINMENT
DANCE
MUSIC
0%
100%
YES
NO
71%
29%
YES
NO

52 Barbole and Gaur
IMR (Indira Management Review) Volume X, Issue 2, December, 2016
As per the responses given by the respondents, 71% of the respondents stated that their organization takes up a few initiatives to manage their Work-Life Balance whereas 29% respondents said that the organization does not take any steps.
Chart No. 12: Representing the Methods Adopted by the Organization to Manage Work-Life Balance
As 71% respondents have said that their organization takes up a few initiatives to manage WLB, sanctioning leaves whenever required turns out to be one of the strategies adopted by Federal Bank Ltd. No other method is adopted by the organisation.
Chart No. 13: Representing the Opinion of the Respondents towards Customization of Work-Life Balance Policies as per Individual Needs
0 0
15
00
2
4
6
8
10
12
14
16
FLEXIBLE STARTING
TIME
FLEXIBLE ENDING
TIME
LEAVE SANCTIONS
BRINGING CHILDREN TO WORK
ON OCCASIONS
WLB INITIATIVES BY ORGANISATION
21
0
YES
NO

A Study on Work–Life Balance of Employees at Federal Bank Ltd., Kothrud Pune 53
IMR (Indira Management Review) Volume X, Issue 2, December, 2016
As per the research, 100% respondents said that Work-Life Balance policies should be customized to individual needs so that employees will be able to manage their Wok-Life Balance in an appropriate manner.
Findings and Suggestions 1. Work-Life Imbalance is basically caused due to longer working hours, increased
responsibilities at home, having children, increased responsibilities at work, excessive multitasking, speed of work, less salaries etc. A total of 86% employees at Federal Bank Ltd. are in the age group of 26–30. Hence, as of now they are not facing any issues regarding Work - Life Imbalance. Remaining employees do have some issues regarding taking care of children, dependents at home. As they are being transferred every three years, their families have not shifted from their hometown.
2. Various challenges such as unrealistic demands, lack of support from colleagues, lack of resources from the organization, high stress level are being faced by the employees in maintaining the Work- Life Balance. The employees of Federal Bank Ltd. are happy and satisfied with the resources provided by the bank; 100% of the employees have said that they have supportive colleagues. Hence, the challenge faced by the employees is related to the stress of work since bank jobs are mostly stressful. However, 42% of the employees get stressed due to work. As per the research, the organization does not take any efforts to reduce the stress of their employees. Hence, a few steps such as arranging yoga sessions, stress management seminars, trips, movies, management games etc. can be taken by the organization that helps the employees to get refreshed and feel stress-free.
3. The biggest challenge faced by the employees of Federal Bank Ltd. now is the demonetization of currency which is declared by the Prime Minister of India. Bank is providing all possible facilities to motivate their employees to work efficiently and employees have positively accepted this challenge. Rs. 3250/- compensation per day has been given to the employees for working on Saturday and Sunday. Apart from this, lunch and dinner is provided by the bank to their employees. In this way, the biggest challenge is being handled in a very efficient manner by the bank as well as by the employees.
4. Performance of employees in banks is assessed on the basis of Business Target Achievements, Business Development, Compliance of Banking rules and regulations, customer handling and service efficiency, able to face stiff competition in banking domain, career development, etc.
Employees will be able to achieve all the above mentioned tasks in an appropriate manner only if bank is in a position to have adequate manpower, provide adequate training to the employees in their work profile that will help to improve their efficiency, well defined work-life balance policies.

54 Barbole and Gaur
IMR (Indira Management Review) Volume X, Issue 2, December, 2016
As per the research, Federal Bank Kothrud, Pune provides training to their employees on regular basis. Apart from this, special training sessions are arranged for the employees whenever new software is introduced or existing one is updated. In this way, the employees of this bank are well trained in their profile and are able to perform their task properly.
It is also found that employees are able to focus on their career enhancement apart from their regular duties and responsibilities as employees in this bank are continuously updating themselves by giving various examinations conducted by the Indian Institute of Banking and Finance (IIBF); 76% of the employees have cleared JAIIB and CAIIB examination and bank has given them increments in their salary for the same which shows that bank is taking efforts to enhance the career of employees and motivate them by giving increments.
5. The bank does not take any initiatives to help the employees in managing their Work-Life Balance except for sanctioning the leaves. Hence, various other strategies such as flexible working hours, allowing work from home, focussing on outcomes, not hours worked, promoting breaks in the work day, giving employees information about work-life balance, providing childcare benefits, offering maternity/ paternity leave to new parents, getting input from employees: ask them what other benefits may be useful. Such strategies can be useful for the bank to maintain Work-Life Balance among the employees.
Conclusion Work-Life Balance is possible only if efforts are taken by both, the employees as well as the organization. Employees need to set priorities and act accordingly. Too much of importance to the work-life will definitely affect their personal life and vice versa. Employees should give time to maintain their hobbies, family trips, time for their children, family get-together etc along with the time devoted to their work. Hence, all such efforts will definitely enable the employee to have a balanced Work-Life Balance.
References [1] Work Foundation, www.theworkfoundation.com [2] Greenhaus, J.H. et al. (2003), Journal of Vocational Behavior, Vol. 63, pp. 510–531. [3] Dr. Goyal, K.A. and Agrawal, Arpita (2015), Babel Pacific Business Review International, Vol. 8, Issue 5, November
2015. [4] Beri, G.C., McGraw Hill Education, 5th Edition. [5] Miller, Bridget, http://hrdailyadvisor.blr.com/ Wednesday, February 10th, 2016.
IMR (Indira Management Review)
Volume X, Issue 2, December, 2016
A Study of Initiatives by Entrepreneurship Development Cell in Indian Institutes of Technology (IITs)
Madhura Wagh*1 Lecturer, RSSP's Maharashtra College of Science and Commerce, Kothrud, Pune
Abstract: Entrepreneurship in India is divided in two ways: ‘opportunity entrepreneurship’ and ‘necessity entrepreneurship’. For the growth of opportunity entrepreneurship, development of entrepreneurial ecosystem is necessary. Global Entrepreneurship Monitor 2013-India report suggests introduction of entrepreneurship education at undergraduate university level as well as at engineering and technical institutions to promote commercialization of R&D and technology-based enterprises should be made mandatory in all states. IITs are able to develop such ecosystem through their ED Cells. Hence, study of initiatives by ED Cells in IITs was important.
Current Indian Economy According to Global Entrepreneurship Monitor Indian economy is factor-driven economy. In factor-driven economies, economic growth of the country is determined by primary factors of production i.e. land and labour (mostly unskilled). Economic activity in these economies is primarily based on the extraction of natural resources; the focus is on building a subsistence and basic level of foundation.
This report divides entrepreneurship in India in two ways:
Opportunity entrepreneurship, and
Necessity entrepreneurship
‘Necessity entrepreneurship’ involves people who start a business because other employment options are either absent or unsatisfactory. One has to become entrepreneur because there is no better option of work. In contrast, ‘opportunity entrepreneurship’ involves those who choose to start their own business by taking advantage of a perceived entrepreneurial opportunity.
Almost 58% of early-stage entrepreneurs were motivated to start a venture by some business opportunity, i.e. roughly 6% of the total adult population was opportunity-driven entrepreneurs. Correspondingly, about 40% of early-stage entrepreneurs were forced into entrepreneurship due to lack of other alternatives, and 4% of the total adult population were necessity-driven entrepreneurs.
Entrepreneurship and Education Global Entrepreneurship Monitor 2013 India report suggests introduction of entrepreneurship education at undergraduate university level as well as at engineering and technical institutions to promote commercialization of R & D and
*Corresponding Author E-mail: [email protected]

56 Wagh
IMR (Indira Management Review) Volume X, Issue 2, December, 2016
technology-based enterprises should be made mandatory in all states. Entrepreneurship education needs to be accompanied with dynamic lectures delivered by expert faculty in entrepreneurship. Experienced entrepreneurs with proven track records in business should be recruited for mentorship programmes. There should be interactive sessions between mentors and students. This would help to mitigate fear of failure and set role models for potential entrepreneurs.
Education and training need to be imparted to fill in gaps at grassroots levels. Quality of education differs from area-to-area. Quality education at all levels, will increase employment opportunities for the individual, and also reduce necessity entrepreneurship. It will pave way to increase the individual’s alertness to identify and exploit business prospects and thus increase opportunity entrepreneurship.
Entrepreneurship Development Cell (ED Cell) In India, it is believed, tremendous hidden entrepreneurial talent exists which if properly harnessed, could be helpful in solving many of the serious problems faced by the country. Harnessing this hidden entrepreneurial talent through entrepreneurship training to target groups of population is now considered to be viable alternative to many of the problems facing the country.
Youth, in general, in the country, lack information about the entrepreneurial opportunities, schemes, incentives etc. which was found acting as one of the deterring factors for choosing the industrial entrepreneurship.
The Entrepreneurship Development Cell is being promoted in educational institutions to develop institutional mechanism to create entrepreneurial culture in Science & Technology academic institutions and to foster techno-entrepreneurship for generation of wealth and employment by Science & Technology persons. The ED Cells are established in academic institutions (science colleges, engineering colleges, universities, management institutes) having requisite expertise and infrastructure. The mission of the ED Cell is to "develop institutional mechanism to create entrepreneurial culture in academic institutions to foster growth of innovation and entrepreneurship amongst the faculty and students.”
Government has a separate mechanism for entrepreneurship development. Now, a new ministry has also been started as Entrepreneurship and Skill Development Ministry. Various institutions are working all over India for nurturing entrepreneurship skills in young generation. Entrepreneurship Development Cell is one of the ways to develop entrepreneurship in students. National Science and Technology Entrepreneurship Development Board (NSTEDB) have specified functions of ED cell.
Objectives of Study 1. To analyze initiatives organized by ED cell
2. To examine arrangements for mentorship
3. To find out ideal ecosystem for ED cell
4. To give suggestions for improvement of ED Cell

A Study of Initiatives by Entrepreneurship Development Cell in Indian Institutes of Technology (IITs) 57
IMR (Indira Management Review) Volume X, Issue 2, December, 2016
Hypothesis H1: ED Cells of IITs arrange innovative activities for awareness and development of
entrepreneurship.
Research Gap After literature review, it was revealed that working of ED Cell is not yet studied by any researcher. ED Cells are important milestones for development of entrepreneurship in students.
Research Methodology In this research, researcher wants to find out initiatives by Entrepreneurship Development Cells in IITs. Now, for the growth of Indian economy, it is necessary to shift the concentration from consumer goods to capital goods. Production for capital goods can be increased by engineer entrepreneurs. IITs are supposed to produce best engineers in the country and hence entrepreneurship of IITans is very important.
There are 23 IITs as on date, out of which, 6 are established in 2015–16. Hence, for the research purpose, 17 IITs, which were established before 2016 are taken into account.
All IITs have separate websites for their ED Cell. The research is based on information as updated on websites of ED cells of IITs. The paper is based on secondary data.
Literature Review Neeta Baporikar describes three phases of entrepreneurship development in her book Entrepreneurship Development and Project Management:
1. Initial Phase: Creation of awareness about the entrepreneurial opportunities based on service and research
2. Development Phase: Implementation of training programmes to develop motivation and management skills.
3. Support Phase: Infrastructural support of counseling, assisting to establish new enterprise and to develop existing unit.
She analyzed barriers to entrepreneurship in 3 categories: Entry barriers, Survival barriers and Exit barriers.
Sandeep Vij and Pooja Sharma examine entrepreneurial drive of business students in ‘Does Entrepreneurial Education Enhance the Entrepreneurial Drive of Business Students?’. The study explores the effects of demographics on the entrepreneurial drive of students and compares the level of entrepreneurial drive among groups of students who have or who have not undergone some training on entrepreneurship. The results of the study show that type of family and genders
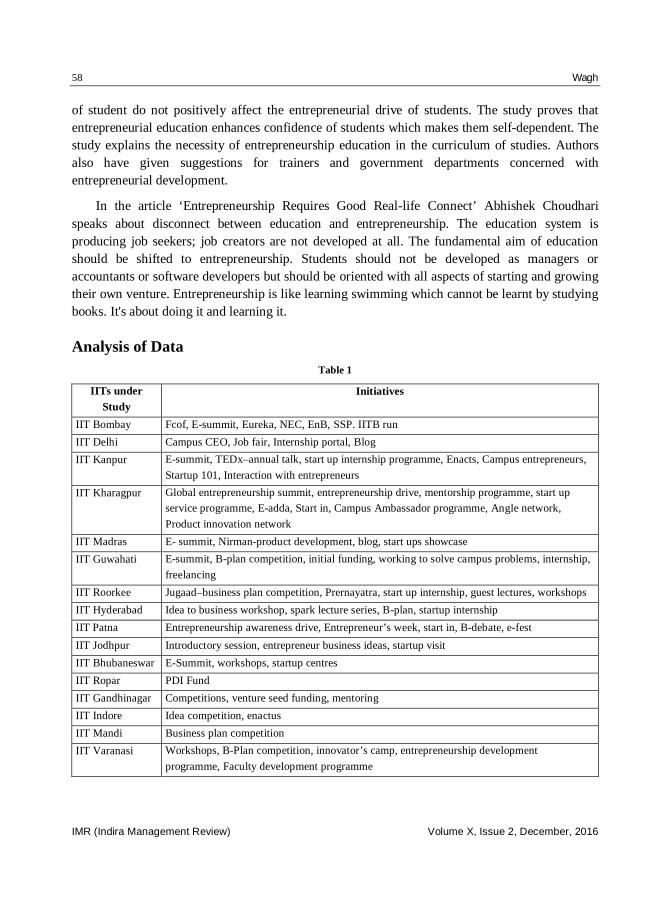
58 Wagh
IMR (Indira Management Review) Volume X, Issue 2, December, 2016
of student do not positively affect the entrepreneurial drive of students. The study proves that entrepreneurial education enhances confidence of students which makes them self-dependent. The study explains the necessity of entrepreneurship education in the curriculum of studies. Authors also have given suggestions for trainers and government departments concerned with entrepreneurial development.
In the article ‘Entrepreneurship Requires Good Real-life Connect’ Abhishek Choudhari speaks about disconnect between education and entrepreneurship. The education system is producing job seekers; job creators are not developed at all. The fundamental aim of education should be shifted to entrepreneurship. Students should not be developed as managers or accountants or software developers but should be oriented with all aspects of starting and growing their own venture. Entrepreneurship is like learning swimming which cannot be learnt by studying books. It's about doing it and learning it.
Analysis of Data Table 1
IITs under Study
Initiatives
IIT Bombay Fcof, E-summit, Eureka, NEC, EnB, SSP. IITB run
IIT Delhi Campus CEO, Job fair, Internship portal, Blog
IIT Kanpur E-summit, TEDx–annual talk, start up internship programme, Enacts, Campus entrepreneurs,
Startup 101, Interaction with entrepreneurs
IIT Kharagpur Global entrepreneurship summit, entrepreneurship drive, mentorship programme, start up
service programme, E-adda, Start in, Campus Ambassador programme, Angle network,
Product innovation network
IIT Madras E- summit, Nirman-product development, blog, start ups showcase
IIT Guwahati E-summit, B-plan competition, initial funding, working to solve campus problems, internship,
freelancing
IIT Roorkee Jugaad–business plan competition, Prernayatra, start up internship, guest lectures, workshops
IIT Hyderabad Idea to business workshop, spark lecture series, B-plan, startup internship
IIT Patna Entrepreneurship awareness drive, Entrepreneur’s week, start in, B-debate, e-fest
IIT Jodhpur Introductory session, entrepreneur business ideas, startup visit
IIT Bhubaneswar E-Summit, workshops, startup centres
IIT Ropar PDI Fund
IIT Gandhinagar Competitions, venture seed funding, mentoring
IIT Indore Idea competition, enactus
IIT Mandi Business plan competition
IIT Varanasi Workshops, B-Plan competition, innovator’s camp, entrepreneurship development
programme, Faculty development programme

A Study of Initiatives by Entrepreneurship Development Cell in Indian Institutes of Technology (IITs) 59
IMR (Indira Management Review) Volume X, Issue 2, December, 2016
Table 2
Initiatives IITs Following Funding support 16
Business plan competition 12
E-summit 9
Start up internship 8
Workshops 8
Blog 6
Entrepreneurship drive/ run 2
Enacts projects 2
National entrepreneurship challenge 1
Startup visit 1
Working to solve campus problems 1
66
Fig. 1
After analyzing the data, it is revealed that 80% of initiatives are common across all IITs. Distinct initiative which should be followed by all IITs is National Entrepreneurship Challenge.
Observations and Findings IITs were established in India in 3 phases. First five IITs were established during 1950–60. In 1994 IIT Bhubaneswar was established. Then, after a long period, in 2008–09 another 8 IITs were established. In 2012, IIT Varanasi was recognized. Again, in 2015–16, 7 new IITs were established:
0
2
4
6
8
10
12
14
16
18

60 Wagh
IMR (Indira Management Review) Volume X, Issue 2, December, 2016
ED cells in IITs which were established in second phase i.e. 2008–09 are at infant stage and ED cells in IITs established in first phase are matured.
ED cells in IITs is students run activity. Faculties work as mentors for them.
Activities of ED cell are organized only for members of ED cell.
Because of high status of IITs, ED cells are supported by business tycoons.
ED cells have strong connection between them and startups.
Activity E-summit is organized by all IIT ED cells. E-summit consists of startup workshop, internship and job fair, startup Expo, innovation and business conclave. E-summit brings together venture capitalist, angel investors and aspirant entrepreneurs.
B-Plan competition is also arranged by all ED cells. In the Business Plan Competition students have to present comprehensive Business Plan for their own idea of business.
ED cells give importance to innovative businesses. Students are able to develop new technologies and products with their regular studies.
Most of the startups are in the category of service sector and consumer goods. Development for production of capital goods is overlooked.
All IITs have their own incubation centres for business. ED cells are connected with incubation centre. Incubation centre provides basic facilities required for startup and also provides consultation facility for aspects related to business. E.g. legal aspects, marketing.
ED cells are not connected to each other or to any entrepreneurship development institutions.
ED cell of IIT Bombay have a distinctive initiative ‘National Entrepreneurship for All.
Hypothesis Testing Hypothesis is Accepted: Entrepreneurship development institutions give more importance to entrepreneurship development trainings, workshops and guest lectures. In addition to these activities, ED Cells in IITs take initiatives in actual conversion of idea to business.
Suggestions ED cells are supposed to build entrepreneurial talent in students. If students are made aware about entrepreneurship at very early stage, they can afford risk of business. They will get a chance to experiment their ideas and to test feasibility of business:

A Study of Initiatives by Entrepreneurship Development Cell in Indian Institutes of Technology (IITs) 61
IMR (Indira Management Review) Volume X, Issue 2, December, 2016
For fostering entrepreneurship in students, entrepreneurship awareness activities should be compulsory for all students. Students who are not aware about entrepreneurship will not become member of ED Cell and in turn will lose the opportunity to develop them as entrepreneurs.
Indian economy needs imitating entrepreneurs also. There is no need to give stress on innovations. ED Cells and incubation centres should support imitating entrepreneurs also.
ED Cell should build ecosystem for production of capital goods. Import substitution is also important activity for growing entrepreneurship.
ED cells and incubation centres of IITs should be connected to all science and technology institutes in that region. They have to support and guide ED cells in science and technology institutes. The network of all ED cells and incubation centres will be able to improve entrepreneurship in whole region and in turn in whole country.
There should be a network of entrepreneurship development institutes and ED cells in institutes. Entrepreneurship development institutes initiate research on entrepreneurship which will become helpful for ED cells. It will build the gap in theory and practice.
Further Scope of Study The study should be undertaken for assessing the success of ED cells. It is not clear what should be the parameters to measure the success of ED cells. The parameters could be any one or more of the following:
Number of initiatives by ED cell
Number of students attended the initiative
Number of students became entrepreneurs
References [1] www.iptu.co, “The India Report”, Astaire Research. [2] Websites of ED Cells of IITs. [3] Desai, Vasant, Dynamics of Entrepreneurial Development and Management, Himalaya Publishing House, [4] www.gemconsortium.org GEM 2013–India Report. [5] Saini, Jasmer Singh (1996), Entrepreneurship Development Programmes and Practices, Deep & Deep, New Delhi,
p. 17. [6] Journal of Small Business Management, (Jan. 1989) p. 67. [7] Journal of Business Venturing, 2007.
IMR (Indira Management Review)
Volume X, Issue 2, December, 2016
Study of Use of e-HRM in Performance Appraisal Process in IT Organizations
Dr. Manasi Sameer Bhate*1 Associate Professor,
MES’s Institute of Management and Career Courses, Pune
Abstract: Today's working climate demands a great deal of commitment and efforts from employees, who in turn naturally expect a great deal from their employers. Today, Human Resource (HR) is not treated as a single function. It's a collection of highly specialized capabilities-each with distinct objectives, tasks and needs. Organizations have realized the growing importance of using Information Technology (IT) in leveraging their Human Resource (HR) functions. This takes the form of e-HRM (Electronic Human Resource Management). The e-HRM revolution relies on cutting edge information technology, ranging from internet-enabled Human Resources Information Systems (HRIS) to corporate intranets and portals. This paper investigates the use of e-HRM in performance appraisal as one of the Human Resource Function in IT organizations. Human Resource Development (HRD) is the framework for helping employees to develop their personal and organizational skills, knowledge and abilities. Performance appraisal is about improving performance and ultimate effectiveness. Employees are encouraged to look ahead to improve effectiveness, utilize strengths, minimize weaknesses and examine how potentials and aspirations should match up. The study provides insights into implementation of e-HRM with reference to performance appraisal. It discusses the impact of e-HRM on appraisal process. It attempts to identify implications for future research in this field.
Keywords: Human Resource (HR), Information Technology (IT), Electronic Human Resource Management (e-HRM), Internet-enabled Human Resources Information Systems (HRIS), Performance Appraisal, Human Recourse Department (HRD)
Introduction Behind every successful organization are its resources. One of the main important resources of the organization is ‘HUMAN’. An organization’s success hinges both on 'high touch' and on ‘high tech’. Organizations who have been striving for business excellence have realized that the core of any business excellence programme has always been ‘people’.
Successful growing organizations have placed the combined development of information technology and human resources as their top priority.
The performance appraisal is the process of assessing employee performance by way of comparing present performance with already established standards which have already been communicated to the employees, subsequently providing feedback to employees about their performance level for the purpose of improving their performance as needed by the organization. The very purpose of performance upgrade is to know performance of employee, subsequently to decide whether training is needed to particular employee or to give promotion with additional pay
*Corresponding Author E-mail: [email protected]
Study of Use of e-HRM in Performance Appraisal Process in IT Organizations 63
IMR (Indira Management Review) Volume X, Issue 2, December, 2016
hike. Every corporate sector uses performance appraisal as a tool for knowing about the employee and take decisions about particular employee.
IT companies have started using information technology in their Human Resource Management functions to optimize their management and improve their efficiency. This paper explores the role of Information Technology (IT) in HRM precisely in the performance appraisal function of IT organizations.
Theoretical Framework Before an objective performance appraisal system can be developed, one must first perform a job analysis[6] to determine what tasks are actually performed on the job, the standards to which these tasks need to be performed, and the knowledge, skills, abilities, and other characteristics necessary, in order to adequately perform these tasks. Job analysis is the systematic, empirical process of determining the exact nature of a job, including:
The tasks and duties to be done;
The knowledge, skills and abilities necessary to adequately perform these; and
The criteria that distinguish between acceptable and unacceptable performance.
Job Analysis According to DeCenzo & Robbins (2006)[1], “Job analysis is a systematic exploration of the activities within a job. It defines and documents the duties, responsibilities and accountabilities of a job and the conditions under which a job is performed. Job analysis is the process of studying and collecting information relating to the operations and responsibilities of a specific job. The immediate products of this analysis are job descriptions and job specifications. Hence, job analysis can be described as a process of collecting information about a job. The results of a job analysis are typically used in writing job descriptions and setting standards for use in performance appraisals.
Performance appraisals[6] need to be based on the tasks that are actually required to be performed on the job rather than on some general impression of the performance of the employee.
Dr. U.S.S. Shrivastav and Nimisha Sapra[2] in IJRIM, Volume 2, Issue 4 have focussed on performance appraisal. They quote that performance appraisal is a widely recognized process. Yet, efforts to study and examine its effect on attitudinal outcomes are scarce. The present study has addressed this research gap. The study has contributed to the body of knowledge on automation of performance appraisal process and thus is benefiting the HRM practitioners and HRM scholars.
Armstrong and Baron (2005)[3] recommend following points:
Training should be provided to both the evaluators and the employees.

64 Bhate
IMR (Indira Management Review) Volume X, Issue 2, December, 2016
Transparency in the implementation of the system.
Provision of continuous feedback to employees on their performance.
Disciplinary measures should be taken on supervisors who do not provide continuous feedback to employees.
e-HRM[4] activities are:
Fig. 1: e-HRM activities
Many companies make use of web-based technology to evaluate the performance of an individual. This can be done either using the computer monitoring tool, wherein the complete working of an individual can be recorded, or through writing the reviews and generating the feedback on the employee’s performance using the web portal.[5]
Research Design Objectives
To take the review of performance appraisal process implementation in e-HRM software.
To study the automated processes used to streamline performance reviews and appraisal processes.
Scope of Study This work is confined to study the appraisal process present in the organizations. It also
visualizes real time scenarios in industry. It explores some of the merits and demerits in existing system.

Study of Use of e-HRM in Performance Appraisal Process in IT Organizations 65
IMR (Indira Management Review) Volume X, Issue 2, December, 2016
Research Methodology Method Used A sample of 50 companies was selected for conducting the survey.
Sources of Data Sample method is useful for data collection. The types of data collected were:
1. Primary data
2. Secondary data
Primary Data Respondents for the survey were selected HR department employees including HR Executives, Sr. HR Executives, HR Managers and other HR team members. After receiving the questionnaire, fully filled and valid questionnaires were selected for further research.
Questionnaires 130 questionnaires were distributed to HR Executives, Sr. HR Executives, HR Managers and other HR team members.
Secondary Data Secondary data was collected from past records and manual of the company, books, internet etc. It is the data already collected, which is made available for reference purposes. In my research, the secondary sources used are: various files and records maintained by organization, HR manual.
Sample Size 121 questionnaires were considered out of 130 and Random Sampling Method is used for research work.
Hypothesis Performance Appraisal function is benefitted by the use of e-HRM in HR department.
Data Analysis Use of e-HRM Software for Performance Appraisal
Table 1: Use of e-HRM Software for Performance Appraisal
Sr. No. Choice Count Percentage 1 Yes 91 75.21% 2 No 30 24.79%
Total 121 100.00%
Based on the above table, data following graph is depicted:

66 Bhate
IMR (Indira Management Review) Volume X, Issue 2, December, 2016
Fig. 2: Use of e-HRM Software for Performance Appraisal
Observations
From the above statistics, it shows that due to extensive use of information technology, appraisal process becomes easier to execute. In order to reduce the work pressure as well as for perfection in the appraisal process, use of software is appreciated.
More than 75% responses have been received regarding the use of technology in appraisal process of an employee.
24% responses opine that technology is not used for employee’s performance appraisal process.
Providing Report on Ongoing Feedback
Fig. 3: Providing Report on Ongoing Feedback
34.62
3.08
18.46
37.69
6.15
0.00
10.00
20.00
30.00
40.00
1 2 3 4 5
Report on on-going feedback
Providing report on on-going feedback
24.79%^
75.21%^

Study of Use of e-HRM in Performance Appraisal Process in IT Organizations 67
IMR (Indira Management Review) Volume X, Issue 2, December, 2016
Observations
The goal of ongoing feedback is to identify where performance is effective and where performance needs improvement. Giving and receiving feedback is a two-way street; both the manager and the employee should be proactive by frequently seeking out and providing feedback.
e-HRM software can generate the reports on ongoing feedback of the participants.
The above graph indicates various responses received from e-HRM software on ongoing feedback of the participants.
From the graph, it is clearly seen that more than 37% respondents say that they ‘strongly agree’ on responses received from e-HRM software on ongoing feedback of the participants.
More than 3% respondents say that they ‘disagree’ on responses received from e-HRM software on ongoing feedback of participants.
18% respondents have given neutral opinion.
More than 6% respondents say that they ‘strongly agree’ and more than 7% respondents disagree on ongoing feedback of the participants.
Here the graph indicates that in total, more than 34% respondents entered ‘strongly disagree’ option for on ongoing feedback of the participants.
e-HRM Software Generates Report on whether the Employee Fits within the Organization
Fig. 4: e-HRM Software Generates Report on Whether Employee Fits within the Organization
29.23
13.85
19.23
30.77
6.92
0.00
5.00
10.00
15.00
20.00
25.00
30.00
35.00
1 2 3 4 5
Report on Employee's Fitment with the Organization
Report on employee's fitment with the organization

68 Bhate
IMR (Indira Management Review) Volume X, Issue 2, December, 2016
Observations
e-HRM software can generate the report on fitment of the employee in the organization.
The above graph indicates various responses received from e-HRM software on fitment of the employee in the organization.
From the graph it is clearly seen that more than 29% respondents say that they ‘strongly disagree’ on fitment of the employee in the organization.
More than 30% respondents say that they ‘agree’ on fitment of the employee in the organization.
19% respondents have given neutral opinion.
More than 6% respondents say that they ‘strongly agree’ and more than 13% respondents ‘disagree’ on fitment of the employee in the organization.
Analysis of Various Statements Related to e-HRM Software Here, many questions were raised regarding various functions of e-HRM software which uses technology in appraisal process. These functionalities are discussed as under:
e-HRM Software Enables us to Complete Appraisal on Time
Fig. 5: e-HRM Software Enables us to Complete Appraisal on Time
16.92
0.77
12.31
40.00
30.00
0.00
5.00
10.00
15.00
20.00
25.00
30.00
35.00
40.00
45.00
1 2 3 4 5
Report on Completion of Appraisal on Time
Report on completion of appraisal on time

Study of Use of e-HRM in Performance Appraisal Process in IT Organizations 69
IMR (Indira Management Review) Volume X, Issue 2, December, 2016
Observations
The above graph indicates responses received regarding opinions about e-HRM software helping in completion of appraisal process on time.
From the graph, it is clearly seen that more than 30% respondents say that they ‘strongly agree’ on the e-HRM software helping in completion of appraisal process on time.
More than 40% respondents agree on the e-HRM software helping in completion of appraisal process on time.
More than 12% respondents have given neutral opinion.
More than 16% respondents say that they ‘strongly disagree’ on the e-HRM software helping in completion of appraisal process on time.
About 17% of the respondents say that they ‘disagree’ on the e-HRM software reporting on superior-subordinate relationship.
About 0.7% of the respondents say that they ‘disagree’ on the e-HRM software helping in completion of appraisal process on time.
From this analysis, it is clearly observed that 70% of the respondents agree on the opinion that e-HRM software is helping in completion of appraisal process on time.
e-HRM Software Guarantees Accuracy in Appraisal Process
Graph 6: e-HRM Software Guarantee Accuracy in Appraisal Process
20.77
1.54
12.31
46.92
18.46
0.00
5.00
10.00
15.00
20.00
25.00
30.00
35.00
40.00
45.00
50.00
1 2 3 4 5
Accuracy in Appraisal Process
Accuracy in appraisal process
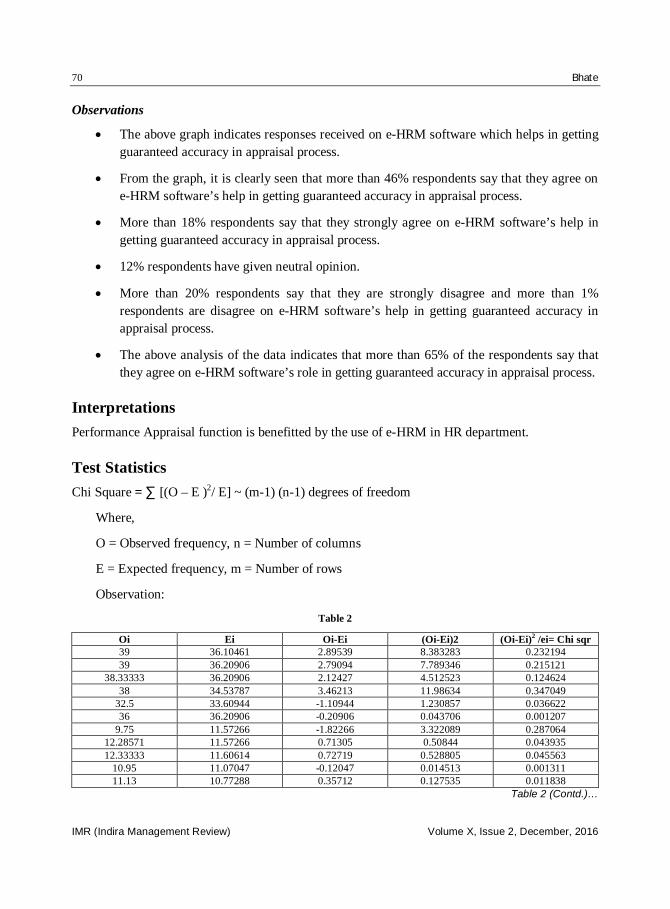
70 Bhate
IMR (Indira Management Review) Volume X, Issue 2, December, 2016
Observations
The above graph indicates responses received on e-HRM software which helps in getting guaranteed accuracy in appraisal process.
From the graph, it is clearly seen that more than 46% respondents say that they agree on e-HRM software’s help in getting guaranteed accuracy in appraisal process.
More than 18% respondents say that they strongly agree on e-HRM software’s help in getting guaranteed accuracy in appraisal process.
12% respondents have given neutral opinion.
More than 20% respondents say that they are strongly disagree and more than 1% respondents are disagree on e-HRM software’s help in getting guaranteed accuracy in appraisal process.
The above analysis of the data indicates that more than 65% of the respondents say that they agree on e-HRM software’s role in getting guaranteed accuracy in appraisal process.
Interpretations Performance Appraisal function is benefitted by the use of e-HRM in HR department.
Test Statistics Chi Square = ∑ [(O – E )2/ E] ~ (m-1) (n-1) degrees of freedom
Where,
O = Observed frequency, n = Number of columns
E = Expected frequency, m = Number of rows
Observation:
Table 2
Oi Ei Oi-Ei (Oi-Ei)2 (Oi-Ei)2 /ei= Chi sqr 39 36.10461 2.89539 8.383283 0.232194 39 36.20906 2.79094 7.789346 0.215121
38.33333 36.20906 2.12427 4.512523 0.124624 38 34.53787 3.46213 11.98634 0.347049
32.5 33.60944 -1.10944 1.230857 0.036622 36 36.20906 -0.20906 0.043706 0.001207
9.75 11.57266 -1.82266 3.322089 0.287064 12.28571 11.57266 0.71305 0.50844 0.043935 12.33333 11.60614 0.72719 0.528805 0.045563
10.95 11.07047 -0.12047 0.014513 0.001311 11.13 10.77288 0.35712 0.127535 0.011838
Table 2 (Contd.)…

Study of Use of e-HRM in Performance Appraisal Process in IT Organizations 71
IMR (Indira Management Review) Volume X, Issue 2, December, 2016
…Table 2 (Contd.) 10 11.60614 -1.60614 2.579686 0.222269
19.55 18.87818 0.67182 0.451342 0.023908 18.85714 18.9328 -0.07566 0.005724 0.000302 21.16667 18.9328 2.23387 4.990175 0.263573 10.07692 18.05897 -7.98205 63.71312 3.52806 23.33333 17.57352 5.75981 33.17541 1.887807
18.25 18.9328 -0.6828 0.466216 0.024625 34.25 39.1626 -4.9126 24.13364 0.616242
36.14286 39.27589 -3.13303 9.815877 0.249921 38.52 39.2759 -0.7559 0.571385 0.014548 49.6 37.46316 12.13684 147.3029 3.93194
21.66667 36.45609 -14.7894 218.7269 5.999737 50.65 39.27589 11.37411 129.3704 3.293888 17.5 23.90695 -6.40695 41.04901 1.717032
14.14286 23.97611 -9.83325 96.69281 4.032881 19.66667 23.97611 -4.30944 18.57127 0.774574
22.93 22.86952 0.06048 0.003658 0.00016 22.5 22.25475 0.24525 0.060148 0.002703
38.25 23.97611 14.27389 203.7439 8.497789 36.42849
Number of rows = 6
Number of columns = 5
(m-1) * (n-1) = 5 * 4 = 20
Level of Significance Chi-Square tabulated at 1% level of significance = 37.566
Inference Chi-Square calculated = 36.42849
Chi-Square tabulated is greater than Chi-Square calculated for 1% level of significance. Hence the hypothesis is tested and accepted.
Conclusion 1. Unique feature observed in the e-HRM software that it helps in reducing the work
pressure as well as provides perfection in the appraisal process. There is provision of submitting the appeal after appraisal process through software.
2. e-HRM software reduces paperwork and easily monitors and executes performance appraisal process.
3. Appraisal process becomes easier to execute.
4. Use of software is appreciated in appraisal process. HR department employees thus can focus on core HR functionalities more effectively.
72 Bhate
IMR (Indira Management Review) Volume X, Issue 2, December, 2016
References [1] DeCenzo, David A. and Stephen, Robbins P. (2006), Fundamentals of Human Resource Management, Wiley
Paperback. [2] Armstrong and Baron (2012), Impact of Performance Appraisal on Employees Attitude by Managing Performance:
Performance Management in Action, Second Edition. IJRIM Vol. 2, Issue 4 (ISSN: 2231-4334). [3] Strohmeier, Stefan (2007), Research in e-HRM: Review and Implications by Human Resource Management Review,
pp. 19–37. [4] (2016, November21) Retrieved from http://businessjargons.com/e-hrm.html#ixzz4Qr5FJIsK [5] Rao, P Subba, Personnel & Human Resource Management, Chapter: Performance Appraisal pp. 133–151, Himalaya
Publishing House. [6] (2016, November 14). Retrieved from http://www.ehow.com [7] (2016, November 22) Retrieved from http://en.wikipedia.org

IMR (Indira Management Review)
Volume X, Issue 2, December, 2016
Comparative Study of Women Development in the Field of Education in Maharashtra and Madhya Pradesh
from 2001 to 2011
T.P.V. Ratnasri* and Mrunal Risbud Sir Parshurambhau College, Pune1
Abstract: The education community has lately realized the importance of education of women. The commitment of “Education for All” is needed to ameliorate the education status of women. This research paper mainly focuses on the Development of Women in the field of education in Maharashtra as compared to Madhya Pradesh. The female literacy in Maharashtra increased in 2011. The district of Mumbai (suburban) has the highest literacy rate as compared to the other districts in Maharashtra. Pune has shown a drastic improvement in female literacy in the last decade. Even in case of Madhya Pradesh, the literacy rate increased from 2011, whereas the female literacy rate increased from 2011. This shows that even though there is improvement in women education in Madhya Pradesh but comparatively it is lower than that of Maharashtra.
Keywords: Women Development, Literacy, Education, Comparison
Objective The main objective of this research paper is:
1. To study the development of women in the field of education.
2. Comparison of female literacy in between two states i.e. Maharashtra and Madhya Pradesh.
Hypothesis Women development in the field of education is more in Maharashtra as compared to Madhya Pradesh.
Introduction In today’s scenario, education has become a basic necessity of life apart from roti, kapada and makaan. Education is one of those factors which is provided equally to all irrespective of religion, caste, creed, sex, area, etc. But in this male dominant society, women are not given much opportunity for self-development and growth. As said by Mahatma Gandhi, "Educate one man, you educate one person but educate one woman and you educate a whole civilization." Women education is equally important for the development of the social, economic and political aspects of our country which means the overall development of our nation. This research paper mainly
*Corresponding Author E-mail: [email protected]

74 Ratnasri and Risbud
IMR (Indira Management Review) Volume X, Issue 2, December, 2016
focuses on women development in the field of education in Maharashtra as well as Madhya Pradesh. Female education inched its way through under stewardship of individual pioneers and the missionaries. It was for the first time in 1813 that the East India Company accepted responsibility for education of people. But it restricted to educational activities to men and refused to take any direct action for the education of girls and women. The strong prejudice against their education was so deeply rooted in social and religious life of the people that any attempt to educate them was sure to create a very great commotion. The company, therefore, refused to grant any financial assistance for the establishment of girls’ school.
A good deal of work had to be done to change this attitude towards the education of women. The earliest modern schools for girls started under the auspices of missions for the interests of children of Christian converts only. Encouraged by the success of their attempts, the missionaries set up institutions for education of non-Christian girls and women as well. These institutions were set up in Bengal, Bombay and Madras as well. The Baptist Mission started its first school in 1819.
Research Methodology The study is based on secondary data.
The information collected in the research report is from secondary source.
Sources of Data Collection: Books, websites, journals.
Study Region The state of Maharashtra is located in the Deccan Plateau towards the west near the Sahyadri Ranges and is considered to be the second most densely populated state after Uttar Pradesh. It is located near the Arabian Sea near the west coast.
The state of Madhya Pradesh is also termed as the Heart of India due to its geographical location. The name itself indicates that it is the Central province of India and has Bhopal as its capital. Madhya Pradesh is the sixth largest state in India in terms of population. The Narmada river in Madhya Pradesh flows between the Vindhya and the Satpura ranges and acts as a boundary between which divides the nation into North and South India.
Data Analysis Maharashtra is considered to be the financial capital of India. Due to this, there are many trade transactions which take place in Maharashtra, especially in Mumbai. The existing ports in Mumbai have paved a way for wider international trade transactions. Due to this, the need for education was felt and therefore the rate of education in Maharashtra has improved in the past decade and is also more as compared to Madhya Pradesh.

Comparative Study of Women Development in the Field of Education in Maharashtra and Madhya Pradesh 75
IMR (Indira Management Review) Volume X, Issue 2, December, 2016
The data provided below is primarily based on secondary data. It studies the comparison of women development in education in Maharashtra and Madhya Pradesh. As per the official standards set up by the government, a person is said to be literate if he/ she can read, write and understand any language. The number of educated women in Maharashtra was 26.8 million in 2001 and 36.3 million in 2011.
Table 1: Increase in the Number of Women Literacy in Maharashtra from 2001 to 2011
Year Women Literacy Rate 2001 67%
2011 75.90%
Source: Secondary Data (www.undp.org/content/dam/...development/MHDR%20English-2012.pd)
Fig. 1: Woman Literacy Rate
In case of Madhya Pradesh, Indore has the highest literacy rate as compared to rest of the districts in Madhya Pradesh out of which 10,33,371 are females. Bhopal district which is the capital city of Madhya Pradesh has the highest female literacy rate of 76.6%. The female literacy rate in Madhya Pradesh is less than that of Maharashtra which proves that Madhya Pradesh is comparatively less developed in terms of education as compared to Maharashtra.
Table 2: Increase in the Number of Women Literacy in Madhya Pradesh from 2001 to 2011
Year Women Literacy Rate 2001 50.30%
2011 60%
Source: Secondary Data (censusindia.gov.in/2011-prov-results/data_files/mp/07Literacy.pdf)
62%
64%
66%
68%
70%
72%
74%
76%
1 2
woman literacy rate

76 Ratnasri and Risbud
IMR (Indira Management Review) Volume X, Issue 2, December, 2016
Fig. 2: Woman Literacy Rate in M.P.
Justification of Objective Increase in growth rate of women development in education in Madhya Pradesh is more than that of Maharashtra from 2001 to 2011.
It has been observed that the increase in percentage of development of women education in Madhya Pradesh is more than that of Maharashtra. The percentage increase of women education is calculated as follows:
Percentage increase in women education =
Women literacy rate in 2011–women literacy rate in 2001 x 100.
Women literacy rate in 2011
Percentage increase in women education in MAHARASHTRA =
3,62,96,706–2,67,80,980 × 100
3,62,96,706
= 26.21 %
Percentage increase in women education in MADHYA PRADESH=
1,76,76,841–1,19,20,289 × 100
1,76,76,841
= 32.56%
44.00%
46.00%
48.00%
50.00%
52.00%
54.00%
56.00%
58.00%
60.00%
62.00%
1 2
Woman literacy rate in M.P

Comparative Study of Women Development in the Field of Education in Maharashtra and Madhya Pradesh 77
IMR (Indira Management Review) Volume X, Issue 2, December, 2016
Fig. 3: Pie Diagram Showing Comparative Percentage Increase in Women Education from 2001 to 2011 in Madhya Pradesh and Maharashtra
The percentage increase in women education in Madhya Pradesh is 32.56% and that of Maharashtra is 26.21%. This clearly indicates that the state of Madhya Pradesh has witnessed an increase in its women literacy rate as compared to that of Maharashtra during the last decade. This high amount of percentage increase is expected in underdeveloped areas because of the existence of high level of women illiteracy.
Findings The percentage increase in women education from 2001 to 2011 is more in Madhya Pradesh than that of Maharashtra. But the number of women literates is more in Maharashtra as compared to that of Madhya Pradesh, hence women development in the field of education is more in Maharashtra as compared to Madhya Pradesh.
Government Schemes There are various schemes introduced by the government for the development of women in the field of education.
The Government of Maharashtra has introduced various schemes in the state to improve the socio-economic situation in the country. The government has given prima facie importance for women education in the state. Reducing the gap in gender education is the main objective of Sarva Shiksa Abhiyan (SSA). One of the most essential schemes initiated by the Indian government is the Beti Bachao, Beti Padao scheme in 2014. The main objective of this scheme is to prevent gender-based sex-selective elimination, ensure survival and protection of the girl child, ensure education of the girl child. Some of the other schemes related to the education of women are given below:
1
2
Madhya Pradesh Maharashtra

78 Ratnasri and Risbud
IMR (Indira Management Review) Volume X, Issue 2, December, 2016
1. Attendance Allowance Scheme: This scheme was introduced by the Government of Maharashtra to reduce the dropout rate of girls in primary schools. Under this scheme, Rs.1 per day and maximum Rs. 220 in the academic year is paid to the parents of the girls studying from classes 1 to 4 who have attendance of more than 75% of working days. It includes all girls from TSP areas and those belonging to Scheduled Caste (SC), Scheduled Tribe (ST), Below Poverty Level (BPL) families in other areas. During 2013–14 about 4.91 lakh girls were benefited and an expenditure of 10.81 crore was incurred.
2. Ahilyabai Holkar Scheme: Under this scheme, girls from rural areas studying in classes 5–10 are provided free travel in buses run by Maharashtra State Road Transport Corporation to attend school, if school facility is not available in the village. During 2013–14, about 19.50 lakh girls availed this facility and expenditure of Rs. 57.85 Crore was borne by the state government.
3. Kasturba Gandhi Balika Vidyalaya (KGBV): This scheme was launched for setting up residential schools at upper primary level with an objective to ensure access and quality education for out of school girls belonging to SC, ST, OBC and minority families from Educationally Backward Blocks (EBBs). In 10 districts of the state, 43 KGBVs are sanctioned with capacity of 100 girls each. During 2013–14 an expenditure of Rs. 8.33 Crore was incurred and 4,202 girls were benefitted.
The Government of Madhya Pradesh has also introduced schemes related to the education of women. The following are the schemes:
Ladli Laxmi Yojna: This scheme was started in 2006 with an objective to lay strong foundation for girls’ future through improvement in their educational and economic status and to bring about a positive change in social mindset toward the birth of a girl. Under this scheme, National Saving Certificates worth Rs. 6000 are purchased by the state government in the name of a girl every year after she is born till the amount reaches 30,000. The girl covered under the scheme is given Rs. 2,000 on getting admission in class 4, Rs. 4,000 on getting admission in class 9 and Rs. 7,500 on getting admission in class 11. She is given Rs. 200 per month during her studies in class 11 and 12.
Though the government has taken the initiative to increase women education in Maharashtra and Madhya Pradesh, the number of women literates is low as compared to male literates.
The following table shows the literacy rate of Males and Females in the year 2001.
Table 3
Particulars Maharashtra Madhya Pradesh Male Literates 3,71,84,963 1,96,72,274 Female Literates 2,67,80,980 1,19,20,289
Secondary Data: 1) www.census2011.co.in › States 2) censusmp.nic.in/censusmp/All-PDF/6Literacy21.12.pdf

Comparative Study of Women Development in the Field of Education in Maharashtra and Madhya Pradesh 79
IMR (Indira Management Review) Volume X, Issue 2, December, 2016
Diagram Showing Male and Female Literacy Rate in Maharashtra in 2001
Fig. 4
Diagram Showing Male and Female Literacy Rate in Madhya Pradesh in 2001
Fig. 5
The following table shows the literacy rate of Males and Females in the year 2011.
Table 4
Particulars Maharashtra Madhya Pradesh Male Literates 4,52,57,584 2,51,74,328 Female Literates 3,62,96,706 1,76,76,841
Secondary Data: www.census2011.co.in › States
0 10000000 20000000 30000000 40000000
1
2
Series1
Female Literates
Male Literates
0 5000000 10000000 15000000 20000000
1
2
Series1
Female Literacy
Male Literacy

80 Ratnasri and Risbud
IMR (Indira Management Review) Volume X, Issue 2, December, 2016
Diagram Showing Male and Female Literacy in Maharashtra in 2011
Fig. 6
Diagram Showing Male and Female Literacy in Madhya Pradesh in 2011
Fig. 7
It has been observed that the literacy rate has increased from 2001 to 2011. At the same time, the female literacy rate has also increased in 2011 as compared to 2001. The gap between male and female education has reduced from 2001 to 2011 but the fact is that female literacy is less than that of male literacy.
0 10000000 20000000 30000000 40000000 50000000
1
2
Series1
Female Literacy.
Male Literacy
0 5000000 10000000 15000000 20000000 25000000 30000000
1
2
Series1
Female Literacy
Male Literacy
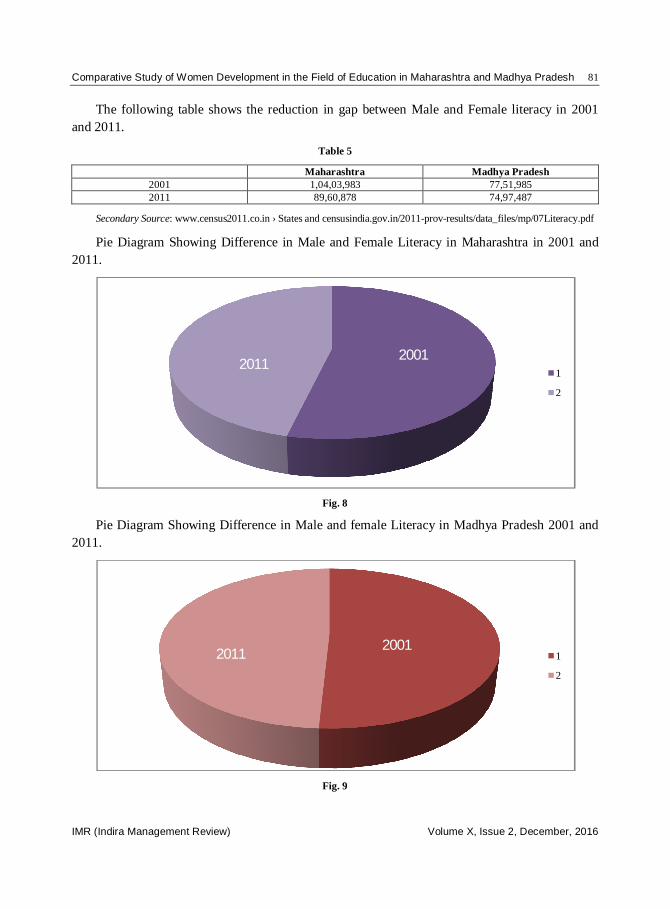
Comparative Study of Women Development in the Field of Education in Maharashtra and Madhya Pradesh 81
IMR (Indira Management Review) Volume X, Issue 2, December, 2016
The following table shows the reduction in gap between Male and Female literacy in 2001 and 2011.
Table 5
Maharashtra Madhya Pradesh 2001 1,04,03,983 77,51,985 2011 89,60,878 74,97,487
Secondary Source: www.census2011.co.in › States and censusindia.gov.in/2011-prov-results/data_files/mp/07Literacy.pdf
Pie Diagram Showing Difference in Male and Female Literacy in Maharashtra in 2001 and 2011.
Fig. 8
Pie Diagram Showing Difference in Male and female Literacy in Madhya Pradesh 2001 and 2011.
Fig. 9
1
2
20012011
1
2
20012011

82 Ratnasri and Risbud
IMR (Indira Management Review) Volume X, Issue 2, December, 2016
Causes of Low Women Development in the Field of Education The negative attitude of parents towards a girl child and their education is one of the major causes of low women development in India. In many Indian families, son is given more importance than a daughter. They do not consider it necessary to educate a girl child, since a girl child has to leave her parents’ house and go and stay with her in-laws. They consider it as waste of money to educate a girl child.
Poverty is another cause of low rate of women education. Many families cannot afford to educate a girl child due to many economic and financial drawbacks. Though the government has introduced various schemes they are reluctant to send their daughters to school.
India being a gender segregated society, it is essential to have a female teacher especially in areas of low female literacy.
Conclusion It has been observed that the development of women in the field of education has increased during the last decade. People are becoming aware about the importance of education, especially, women education. But, still, as compared to Maharashtra, women literacy is low in Madhya Pradesh. Hence, the hypothesis is accepted. During the last decade, the increase in literacy rate of women in Madhya Pradesh is more than that of Maharashtra.
Scope for Further Study Due to time constraints, it was not possible to focus on the development of women in all the states of India. This research paper focuses only on the comparison of female literacy in two states. But the female literacy in all the states in India will be studied in future.
References [1] Mathur, Y.B., Women Education in India, Asia Publication House. [2] Sharma, Usha and Sharma, B.M., Founders of Women Education. [3] Kulshreshtha Indira ‘Noopur, Education of Women from Socially Backward Communities, Vikas Publication House.

IMR (Indira Management Review)
Volume X, Issue 2, December, 2016
A Study on the Impact of Human Resource Management on the Performance at an Educational Institution:
A Study amongst the Workforce
Sumati Sidharth1, Ruby Matthew2 and Ekanto Ghosh3 1Assistant Professor, Department of Technology Management,
Defence Institute of Advanced Technology, Pune, India 2Lieutenant Commander, Indian Navy, M.Tech (Technology Management),
Defence Institute of Advanced Technology, Pune, India 3Second Year Student, M.Tech (Technology Management), Department of Technology
Management, Defence Institute of Advanced Technology, Pune, India
Abstract: Today, Human Resource Management (HRM) practices are considered a crucial and considerable contributory factor in the performance of all organizations. This research study analyses the significance and consequence of human resource management (HRM) practices on the organizational performance of an Indian educational institution. The major aim of the study is to investigate whether there exists a relationship between 'HRM Practices' and the 'Performance of the Educational Institution'. The research studies the impact of the following HRM practices: training, performance appraisal, career planning, employee participation, job definition, compensation and selection on the performance of an educational institution.
Keyword: HRM, Educational Institution, Organizational Performance, Training, Performance Appraisal, Career Planning, Employee Participation, Job Description, Compensation, Selection
Introduction Employees are one of the most important assets of an organization as they contribute to its growth and success (Danish and Usman, 2010). Malik et al. (2010) concluded that in the era characterized by rapid and continuous change, knowledge capital must be retained in order for the organizations to be productive and responsive to the needs of their stakeholders. Similarly, organizations like an educational institution which is both a research and training institute need to interest, maintain and help in overall growth of the employees. Universities need employees who are well trained and motivated so that they are committed to their work of conducting research and training for the development of the nations (Lew, 2009). Research literature has shown that effective application of some human resources management (HRM) practices enables university employees to be committed to their work for good performance of the universities (Chen et al., 2009; Shahzad et al., 2008).
Previous Research In the last two decades, study on human resource management practices as a determinant of organizational performance has gained momentum, especially, in the industry and corporate
Corresponding Author E-mail: [email protected], [email protected], [email protected]

84 Sidharth, Matthew and Ghosh
IMR (Indira Management Review) Volume X, Issue 2, December, 2016
sectors. However, the results from the researchers are either inconclusive or controversial (Qureshi et al., 2007). Literature review indicates that earlier studies have also focused on the impact of HRM practices on university performance with only academicians as the centre of focus (Chen et al., 2009; Malik et al., 2010; Lew, 2009; Rowley, 1996). Very little observational or factual research has been conducted to study the effects of HRM practices on an educational institution’s performance in India. Therefore, this study is to examine the impact of HRM practices on organizational performance of an educational institute in India.
Objective The objective of the study is to identify major factors which impact the organizational performance at an educational institution. Also, the study aims to find the relation between each of the factors and the organizational performance of the educational institution.
Educational Institute under Study Due to time constraint, the scope of the research was limited and only one educational institution has been studied. This Institution has been referred henceforth in the paper as the ‘educational institution under study’. The features of the educational institution under study are mentioned below.
It is an autonomous educational and research institution, fully funded by a governmental organization under an important Ministry of the Government of India through Grants-in-Aid. It enjoys the status of a ‘Deemed to be University’, enabling it to leverage its wealth of both—academic acumen, and administrative and financial freedom. The Ministry of Human Resources Development (MHRD), Government of India has classified the educational institution as a category ‘A’ deemed university. It is also ‘NAAC’ and NBA accredited. It is ranked between 30 and 40 in the National Institutional Ranking for Universities by MHRD in 2016.
Literature Review A number of theories have claimed that human resources of a firm are potentially a powerful source of sustainable competitive advantage for organizations. They have tried to demonstrate that a positive relationship exists between HRM and the firm’s performance. HRM practices are creating positive results on organizational performance. Results calculated through regression suggested that effective implementation of key HRM practices increases organizational performance. On the other hand, companies interested in enhancing HR performance may emphasize the need for empowerment and training. A few studies, however, did not find clear effects of HRM practices on productivity (Delaney et. al., 1989). Kelley (1996) found that HRM practices do not affect performance of organizations; Batt (2002) found that HRM practices do not compensate well in small organizations that operate in local markets. Various HRM models considered are:
A Study on the Impact of Human Resource Management on the Performance at an Educational Institution 85
IMR (Indira Management Review) Volume X, Issue 2, December, 2016
The Harvard Model (Beer et al. 1984) Beer et al. devised the famous Harvard Map (sometimes referred to as the Harvard Model) of HRM. The Harvard Model is based on an analytical research and provides a broad causal
representation of the 'determinants and consequences of HRM policies’. It shows human resource policies are often influenced by two significant factors:
Situational factors in the outside business environment or within the firm such as laws and societal values, unions, labour market conditions, management philosophy, work-
force characteristics, business strategies, and task technology. According to Beer et al., these factors may tend to constrain the formation of HRM policies but they may also tend
to be influenced by human resource policies.
Stakeholder interests, including those of shareholders, management employees, unions,
community, and government. Beer et al. argue that human resource policies should be influenced by all stakeholders. If not, 'the enterprise will fail to meet the needs of these
stakeholders in the long run and it will fail as an institution.'
The model states that human resource policies have both immediate outcomes and long-term
consequences in any organization.
The Michigan Model (Devanna et al., 1984) The Michigan Model (Fombrun, Tichy and Devanna, 1984) focuses on hard HRM. It states that
like any other resources, people should be managed and obtained cheaply, used sparingly, developed and exploited fully. It also stresses on the correlation amongst HRM activities.
According to this model, selection, development, appraisal and rewards were geared towards organizational performance.
Delaney and Huselid (1996) Huselid established that the employees’ effectiveness largely depended on the impact the HRM practices had on employees’ behaviour. Huselid (1995) evaluated that HRM practices are
statistically significant and have a positive effect on corporate financial performance of the organization. Huselid (1995) stressed that by adopting best practices in selection, inflow of best
quality of skill set will be inducted adding value to skills inventory of the organization. He also stressed on the importance which training has as a complement of selection practices by which the
organizational culture and employee behaviour can be aligned to produce positive results.
Guest Comparative Model (1997) The Guest Model was propounded by David Guest in 1987. This model is a combination of
aspects that resemble both, a hard and soft, approach of HRM.

86 Sidharth, Matthew and Ghosh
IMR (Indira Management Review) Volume X, Issue 2, December, 2016
Guest proposes four crucial components that underpin organizational effectiveness. These four crucial components are:
Strategic Integration
This is the organization’s capability to maintain the right balance between the HRM strategy and the business strategy. In other words, there must be congruence between business strategy and the HR strategy in order to enable the organization to achieve its goals. Strategic integration shows the harder side of the Guest Model.
Flexibility
Flexibility is basically the capability of the organization and its people to adapt to the ever-changing business and work environment, and to the capacity to manage innovation. Flexibility carries connotations of both hard and soft HRM. Flexibility, in this case, is about being concerned with the need to achieve business objectives; at the same time, meeting the need to treat the employees as fairly as possible.
High Commitment
This is concerned with the need to have both behavioural and attitudinal commitment. Behavioural commitment in terms of going an extra mile when needed and attitudinal commitment is reflected through a strong identification with the organization.
Quality
Quality is based on the assumption that provision of high quality goods and services results from a quality way of managing people.
Lee and Lee (2007) More recent empirical study on HRM practices (Lee & Lee, 2007) uncovered six underlying HRM practices on business performance, namely teamwork, training and development, HR planning, compensation/ incentives, performance appraisal, and employee security help improve firms’ business performance in terms of product quality, employees’ productivity and firms’ flexibility. The study revealed that three items of HRM practices which influence business performance are: training and development, HR planning and compensation/ incentives. Their research evidence shows that effective HRM practices can have positive impact on business performance.
Tanveer, et al. (2011) Tanveer, et al. conducted a study to examine the impact of Human Resource Management practices on the employee performance/ organizational performance in the textile industry. To find out the performance determinants, research model of HRM practices was used. There are many HR practices like performance appraisal, recruitment and selection, career path, compensation, job definition and training. Only three practices (recruitment and selection, training, performance appraisal) were taken to understand the impact on the performance of the employees. These

A Study on the Impact of Human Resource Management on the Performance at an Educational Institution 87
IMR (Indira Management Review) Volume X, Issue 2, December, 2016
factors were taken because of their utmost requirement at any textile mill. This is an interesting study proving the importance of those practices which highly affects the performance of the employees. This study provided an insight into the factors that make an employee perform better. All selected variables (recruitment and selection, performance appraisal, training) were found to be significantly related with performance of employees.
Qureshi et al. (2010) Qureshi et al., pointed out that the study of HRM (Human Resource Management) practices has been a critical and significant area in management and organizational performance from last several years. Qureshi et al., identified how the practices of HRM (employee participation, training, career planning system, job description, compensation system, selection system, and performance appraisal system) impact the financial performance of organizations. Qureshi et al. (2010) demonstrated that for being successful in today's competitive market one needs speed and adaptability, patents and access to capital and innovation, technology, and economies of scale. Organizational performance and competitive advantages are largely derived from the human resources within an organization and high contribution of human resource management practices.
Theoretical Framework As the optimum factors of the study were defined, the theoretical framework was made to consider and analyze further and formulate the hypothesis.
Fig. 1: HRM Factors Impacting Organizational Performance

88 Sidharth, Matthew and Ghosh
IMR (Indira Management Review) Volume X, Issue 2, December, 2016
Hypothesis Human Resource Management Practices are positively correlated to Organizational Performance.
H1: Organizational performance is immensely related to Training.
H2: Organizational performance is immensely related to Performance Appraisal.
H3: Organizational performance is immensely related to Career Planning.
H4: Organizational performance is immensely related to Employee Participation.
H5: Organizational performance is immensely related to Job Description.
H6: Organizational performance is immensely related to Compensation.
H7: Organizational performance is immensely related with Selection.
Methodology Formulation of Research Survey Questionnaire The research methodology involved data collection from the administrative and support staff being considered for the survey. For this survey, a questionnaire was made and finalized. It was mainly established on the proven scale of Qureshi and Ramay (2006).
Identification of the Sample As the previous studies and researchers had concentrated mainly on the academia, it was decided to focus on the workforce for the study. It comprised of administrative and support staff. The total workforce strength of the educational institute under study was 112 which is comparatively lesser than other educational institutes and hence, the sample size was planned to be kept to 100% of the population.
Physical Survey Due to practical difficulties at the organization, the survey was undertaken on an individual basis with all confidentiality being maintained to a get an actual realistic feedback.
Research Design Population is defined as the entire workforce (administrative and support staff) of the educational institute under study. "Convenience sampling" technique, a form of non-probability sampling, was used for data selection. This technique is accustomed to make research process faster by obtaining abundant completed questionnaires quickly from personnel who were available and freely ready to take part without any pressure.
Sample Size and Type The sample size of the research was proposed to be 100% of the population. The population of the educational institute under study was determined to be 112 (112 administrative and support staff members). However, due to practical difficulties only 90 members (80%) of the workforce participated as sample by convenience sampling method.

A Study on the Impact of Human Resource Management on the Performance at an Educational Institution 89
IMR (Indira Management Review) Volume X, Issue 2, December, 2016
Data Collection Both primary and secondary data were used for the study.
Primary Data The primary data was intended to be collected at a group level to ensure total confidentiality. Initially, a collective session of the entire workforce was called for undertaking the questionnaire. Two attempts were made with the assistance of the admin-in-charge but they went futile as a very few personnel (in single digits) turned up. Later, it was collected through a direct approach with the employees with assistance of questionnaire schedule. The primary data collection also included holding discussions and observation.
Total of 95 questionnaire were distributed 90 were returned, with a response rate of (80%) per cent; 10 questionnaires which were returned were omitted due to incomplete information. As a result, a total of 80 questionnaires were determined as usable and recorded into statistical analysis.
It is important to mention that the questionnaire had to be explained in Hindi to those respondents who were not conversant with English while approaching them to take part in the survey.
Secondary Data Secondary data includes detailed literature review collected from books, journals, periodicals, articles, working papers, reports and websites.
Scaling Technique Adopted for the Study “Regarding scaling of items, it is vital that the scale used must generate sufficient variance among respondents for subsequent statistical analyses” as stated by Stone, 1978. Although there are a number of different scaling techniques available such as Guttman and Thurstone, but Likert-type scales are the most frequently used in survey questionnaire research (Cook et al., 1981) and are the most useful in behavioural research (Kerlinger, 1986). Scale used for analysis: Likert Scale
Table 1: Likert Scale
Strongly Disagree Disagree Indifferent Agree Strongly Agree 1 2 3 4 5
Test of Reliability Before applying statistical tools, testing of reliability is important. Therefore, in this study, Cronbach Alpha reliability test is conducted for all measures. It is commonly used as a tool of internal constancy or reliability of psychometric test score for a sample of examinees. Reliabilities are checked and they all fall between 0.76 and 0.86, which is satisfactory value because the satisfactory value is required to be more than 0.6 for the scale to be reliable (Malhotra, 2002). The overall Cronbach Alpha of the all scales used in this study is 0.81. This indicates the reliability of scales is reasonably high.

90 Sidharth, Matthew and Ghosh
IMR (Indira Management Review) Volume X, Issue 2, December, 2016
Statistical Analysis Both Microsoft Excel and Minitab are used in the research to obtain results to the objectives. Following tools are used in the analysis:
Percentage Analysis
Basic Statistics
Graphs and Charts
Pie Charts and Histogram
Graphical Summary
Scatter Plots and Box plots
Spearman’s Correlation
Demographic Characteristics of the Respondents The population of the non-teaching staff at the educational institute under study is 112.
Fig. 2: Demographic Characteristics of the Respondents
AGE GENDER EDUCATION
TOTAL YRS OF EXPERIENCE EXPERIENCE AT DIAT
MASTERSMATRICULTIONOTHER1-310-1213-1516-1920+4-67-9
20-25
Other
26-3031-3536-4051-55FEMALEMALEDIPLOMAGRADUATION
CategoryOther5.0%
51-553.8%36-40
11.3%
31-3540.0%
26-3031.3%
20-258.8%
MALE85.0%
FEMALE15.0%
Other2.5%
OTHER8.8%MATRICULTION
3.8%
MASTERS41.3%
GRADUATION35.0%
DIPLOMA8.8%
7-912.5%
4-638.8%
20+10.0%
16-196.3%
13-153.8%
10-1213.8%
1-315.0%
Other2.5%
7-923.8%
4-640.0%
1-333.8%
Chart of AGE, GENDER, EDUCATION, TOTAL YRS OF, EXPERIENCE Chart of AGE, GENDER, EDUCATION, TOTAL YRS OF, EXPERIENCE
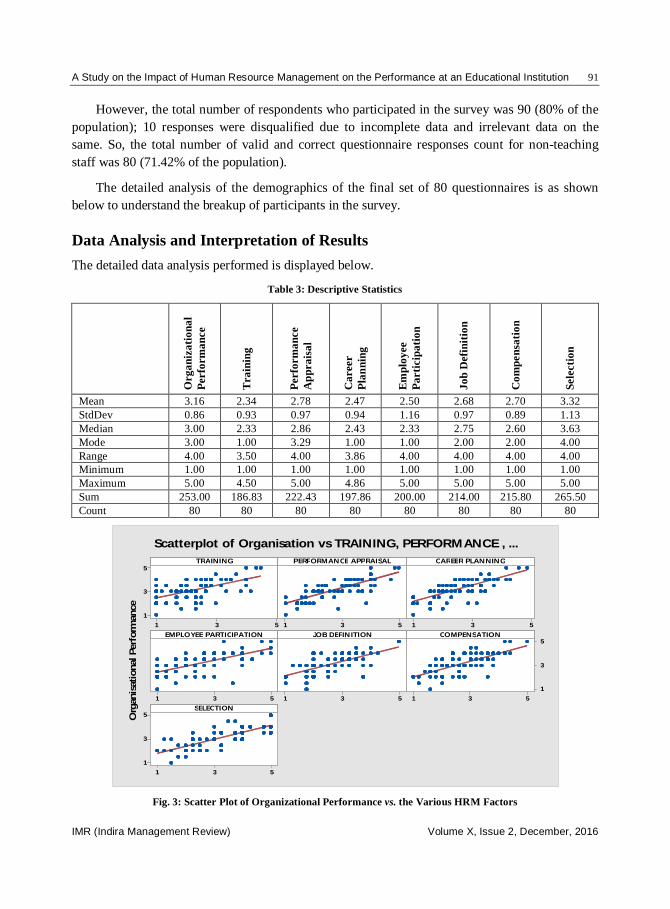
A Study on the Impact of Human Resource Management on the Performance at an Educational Institution 91
IMR (Indira Management Review) Volume X, Issue 2, December, 2016
However, the total number of respondents who participated in the survey was 90 (80% of the population); 10 responses were disqualified due to incomplete data and irrelevant data on the same. So, the total number of valid and correct questionnaire responses count for non-teaching staff was 80 (71.42% of the population).
The detailed analysis of the demographics of the final set of 80 questionnaires is as shown below to understand the breakup of participants in the survey.
Data Analysis and Interpretation of Results The detailed data analysis performed is displayed below.
Table 3: Descriptive Statistics
Org
aniz
atio
nal
Perf
orm
ance
Trai
ning
Perf
orm
ance
A
ppra
isal
Car
eer
Pl
anni
ng
Empl
oyee
Pa
rtic
ipat
ion
Job
Def
initi
on
Com
pens
atio
n
Sele
ctio
n
Mean 3.16 2.34 2.78 2.47 2.50 2.68 2.70 3.32 StdDev 0.86 0.93 0.97 0.94 1.16 0.97 0.89 1.13 Median 3.00 2.33 2.86 2.43 2.33 2.75 2.60 3.63 Mode 3.00 1.00 3.29 1.00 1.00 2.00 2.00 4.00 Range 4.00 3.50 4.00 3.86 4.00 4.00 4.00 4.00 Minimum 1.00 1.00 1.00 1.00 1.00 1.00 1.00 1.00 Maximum 5.00 4.50 5.00 4.86 5.00 5.00 5.00 5.00 Sum 253.00 186.83 222.43 197.86 200.00 214.00 215.80 265.50 Count 80 80 80 80 80 80 80 80
Fig. 3: Scatter Plot of Organizational Performance vs. the Various HRM Factors
531
5
3
1531 531
531 531 531
5
3
1
531
5
3
1
TRAINING
Org
anis
atio
nal P
erfo
rman
ce
PERFORMANCE APPRAISAL CAREER PLANNING
EMPLOYEE PARTICIPATION JOB DEFINITION COMPENSATION
SELECTION
Scatterplot of Organisation vs TRAINING, PERFORMANCE , ...
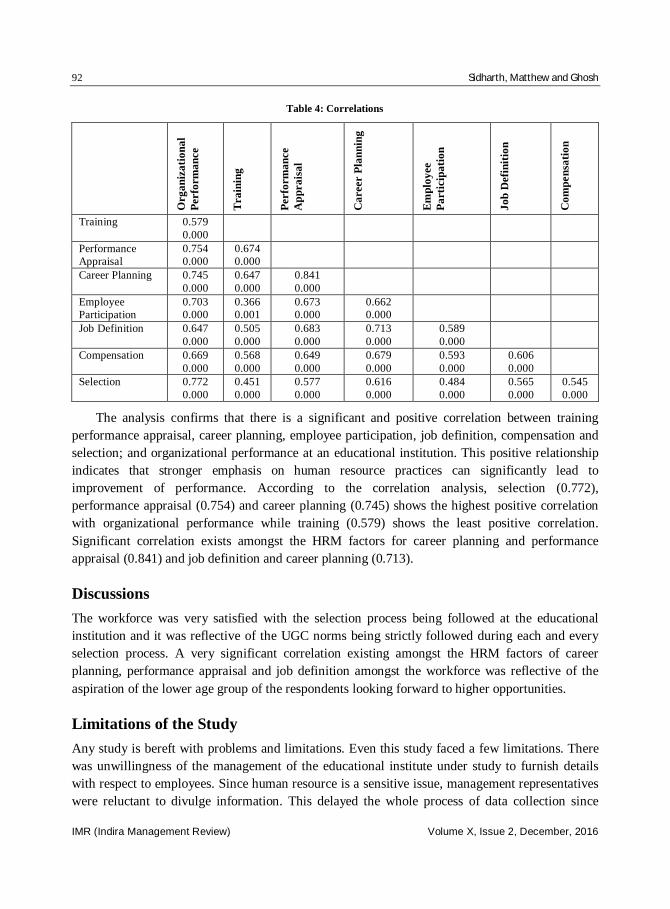
92 Sidharth, Matthew and Ghosh
IMR (Indira Management Review) Volume X, Issue 2, December, 2016
Table 4: Correlations
Org
aniz
atio
nal
Perf
orm
ance
Trai
ning
Perf
orm
ance
A
ppra
isal
Car
eer
Plan
ning
Empl
oyee
Pa
rtic
ipat
ion
Job
Def
initi
on
Com
pens
atio
n
Training 0.579 0.000
Performance Appraisal
0.754 0.000
0.674 0.000
Career Planning 0.745 0.000
0.647 0.000
0.841 0.000
Employee Participation
0.703 0.000
0.366 0.001
0.673 0.000
0.662 0.000
Job Definition 0.647 0.000
0.505 0.000
0.683 0.000
0.713 0.000
0.589 0.000
Compensation 0.669 0.000
0.568 0.000
0.649 0.000
0.679 0.000
0.593 0.000
0.606 0.000
Selection 0.772 0.000
0.451 0.000
0.577 0.000
0.616 0.000
0.484 0.000
0.565 0.000
0.545 0.000
The analysis confirms that there is a significant and positive correlation between training performance appraisal, career planning, employee participation, job definition, compensation and selection; and organizational performance at an educational institution. This positive relationship indicates that stronger emphasis on human resource practices can significantly lead to improvement of performance. According to the correlation analysis, selection (0.772), performance appraisal (0.754) and career planning (0.745) shows the highest positive correlation with organizational performance while training (0.579) shows the least positive correlation. Significant correlation exists amongst the HRM factors for career planning and performance appraisal (0.841) and job definition and career planning (0.713).
Discussions The workforce was very satisfied with the selection process being followed at the educational institution and it was reflective of the UGC norms being strictly followed during each and every selection process. A very significant correlation existing amongst the HRM factors of career planning, performance appraisal and job definition amongst the workforce was reflective of the aspiration of the lower age group of the respondents looking forward to higher opportunities.
Limitations of the Study Any study is bereft with problems and limitations. Even this study faced a few limitations. There was unwillingness of the management of the educational institute under study to furnish details with respect to employees. Since human resource is a sensitive issue, management representatives were reluctant to divulge information. This delayed the whole process of data collection since

A Study on the Impact of Human Resource Management on the Performance at an Educational Institution 93
IMR (Indira Management Review) Volume X, Issue 2, December, 2016
repeated visits had to be made. Another shortcoming of this study is the possible bias of the respondents because of their hectic schedules. Fear amongst the respondents to participate in a survey questionnaire was also noticed anticipating vindictive action. Lack of faith in the system amongst employees made a feeling of this study being inconsequential. Failure to muster enough number of participants in the group survey led to the need for individual survey. Non-interest of personnel to participate or cooperate in the survey as they felt it was not relevant to them. Thus many questionnaires were not filled up even after repetitive reminders. Since there was a time limit for the study, conducting an elaborate study to cover a wider scope was not possible and to include more number of educational institutions was practically impossible.
Future Scope This study did not consider the academia or students even though they too are a part of the organization. A new study can be incorporated amongst the academia and students of the University. Further, this research was limited to one educational institution and did not consider other educational institutes. A similar research can be undertaken at other Institutes to undertake a comparative research and to get a complete generalized result.
Suggestions In order to manage the activities in the universities and enhance performance, higher education institutions need effective HRM. Research, new ideas and innovation can assist in promoting higher education in the development of human resources. Every organization has a set of values and culture. Once hired, through systematic training and socialization, individuals need to be incorporated into the organization’s framework. Continuous appraisement of the employees’ progress is needed to be followed at the educational institution under study. The workforce needs to be appraised about their career progression aspects and an atmosphere of trust needs to be developed. Several previous studies have also shown that the effectiveness of any HRM practice is dependent on the successful implementation of these practices. The fear amongst employees about suggestion and dissent needs to taken away and positive criticism with effective solutions need to be encouraged to solve problems. Stronger and effective performance appraisal systems would definitely improve employees’ commitment and productivity and thus, the performance at the educational institution.
Conclusion The primary objective of this research was to examine the impact of human resource practices on organizational performance at an Educational Institution. The results of the study show that all the selected optimum human resource practices have a significant impact on performance.
94 Sidharth, Matthew and Ghosh
IMR (Indira Management Review) Volume X, Issue 2, December, 2016
References [1] Beer, M., Spector, B., Lawrence, P.R., Mills, D.Q. and Walton, R.E. (1984), “A Conceptual View of HRM”,
Managing Human Assets, Free Press, New York Chap. 2.
[2] Buchanan, D. and Huczynski, A. (2004), Organizational Behaviour: An Introductory Text, 5th ed. Harlow: Prentice
Hall.
[3] Balochi, Q.B., Ali, N., Kiani, T.S., Ahsan, A. and Mufty, A. (2010), “Relationships between Human Resources
Practices and Perceived Employees’ Performance of Bankers in NWFP, Pakistan (an Empirical Evidence)”,
European Journal of Social Science, Vol. 18 No. 2, pp. 210–214.
[4] Chen, S.H., Wang, H.H. and Yang, K.J. (2009), “Establishment and Application of Performance Measure Indicators
for Universities”, The TQM Journal, Vol. 21, No. 3, pp. 220–235.
[5] Danish, R.Q. and Usman, A. (2010), “Impact of Reward and Recognition on Job Satisfaction and Motivation: An
Empirical Study from Pakistan”, International Journal of Business and Management, Vol. 5, No. 2, pp. 159–167.
[6] Delaney, J.T. and Huselid, M.A. (1996), “The Impact of Human Resource Management Practices on Perceptions of
Organizational Performance”, Academy of Management Journal, Vol. 39, pp. 949–969.
[7] Devanna, M.A., Fombrun, C.J. and Tichy, N.M. (1984), “A Framework for Strategic Human Resource
Management”, in Fombrun, C.J., Tichy, M.M. and Devanna, M.A. (eds) Strategic Human Resource Management, New York: John Wiley.
[8] Parameswaran, E.G. (2003), “Perspectives on HRD”, Neelkamal Publications Pvt. Limited.
[9] Guest, D. (1997), “Human Resource Management and Performance: A Review and Research Agenda”, International Journal of Human Resource Management, Vol. 8, No. 3, pp. 263–276.
[10] Guest, D. (2002), “Human Resource Management, Corporate Performance and Employee Well Being: Building The
Worker into HRM”, The Journal of Industrial Relations, Vol. 44, No. 3, pp. 335–358.
[11] Haslinda (2009), The Journal of International Social Research, Vol. 2/ 9 Fall 2009, p. 180.
[12] Khan, M.A. (2010), “Effects of Human Resource Management Practices on Organizational Performance–An
Empirical Study of Oil and Gas Industry in Pakistan”, European Journal of Economics, Finance and Administrative Sciences, Vol. 24, pp. 157–175.
[13] Qureshi, M. Tahir and Mohammad, Ramay I. (2006), “Impact of Human Resource Management Practices on
Organizational Performance in Pakistan”, Muhammad Ali Jinnah University, Islamabad.
[14] Qureshi, M.T., Ayisha, A., Mohammad, A.K., Rauf, A.S. and Syed, T.H. (2010), “Do Human Resource Management
Practices have an Impact on Financial Performance of Banks?”, African Journal of Business Management, Vol. 4(7),
pp. 1281–1288.
[15] Shahzad, K., Bashir, S. and Ramay, M.I. (2008), “Impact of Human Resource Practices on Perceived Performance of
University Teachers in Pakistan”, International Review of Business Research Papers, Vol. 4(2), pp. 302–315.
[16] Storey, J. (1995), Human Resource Management: A Critical Text, London, Routledge.
[17] Tanveer, Y., Shaukat, M.Z., Alvi, S.A. and Munir, A. (2011), “The Way Human Resource Management (HRM) Practices Effect Employees Performance: A Case of Textile Sector”, Vol. 1(4), pp. 112–117.
[18] Wright, P.M., Gardner, T.M. and Moynihan, L.M. (2003), “The Impact of Human Resources Practices on the
Performance of Business Unit”, Human Resources Management Journal, Vol. 13(3), pp. 21–36.

IMR (Indira Management Review)
Volume X, Issue 2, December, 2016
An Examination of Influence of Higher Education Service Quality on Students’ Satisfaction: An Indian Perspective
Dr. V. Krishnamoorthy1, A.S. Aishwaryadevi2 and B. Bharathi3 1Assistant Professor, Department of Management Studies Kongu Engineering College, Perundurai, Erode–638052
2,3MBA–II Year, Kongu Engineering College, Perundurai, Erode–638052
Abstract: The objective of the research is to understand the dimensions of higher education service quality. The scope of this study is confined only to the Tamil Nadu students’ perception on higher education service quality. The researchers used questionnaire method for collecting data from the students and snowball sampling method has been administered. This study identified five important dimensions of higher education service quality. These are: curriculum aspects, infrastructure aspects, competency of faculty, academic activities and teaching methods. Furthermore, this study proved that student satisfaction is impacted by teaching methods, curriculum and competency of staff. The findings of the study would enable the policy makers to benchmark their services with other universities.
Keywords: Curriculum, Infrastructure, Competency, Academic Activities, Teaching Methods
Introduction Sustaining and enhancing service quality is now an essential requirement for higher educational institutions. The prevailing higher education is a dynamic and increasingly competitive one (Cheung et al., 2011; Dehghan et al., 2014), where universities need to maximize their efforts so as to improve their services (Clemes et al., 2013), numerous factors forcing the higher education institution to adopt quality education. These are: internationalization of higher education (Harrey and Williams, 2010; Sultan and Wong, 2010), the decrease in state finding for public universities (Quinn et al., 2009), and the increase in the number of private universities, (Halai, 2013). Although generic instruments exist for assessing service quality, such as the SERVQUAL instrument (Parasuraman et al., 1988, 1994), relatively few studies have attempted to measure service quality in the specific context of higher education, (Cuthbert, 1996; Soutar and Mcneil, 1996; Pariseau and Mc Daniel,1997; Arambewela and Hall, 2006; Wong et al., 2012). Around the world, higher educational institutions are facing declining enrollment and increasing retention problems (Rowley, 2003). Furthermore, many education institutions have adopted aggressive marketing activities and movement towards market orientation by focusing on student needs (Ivy, 2001). Service quality is defined as fitness for use and those service features which meet customer needs and thereby provide customer satisfaction (Parasuraman et al., 1988). SERQUAL model developed by Parasuraman et al., (1988) is the most widely known scale of service quality. The higher education industry relies essentially on quality management to stay competitive (Yeo,
Corresponding Author E-mail: [email protected], [email protected]

96 Krishnamoorthy and Aishwaryadevi
IMR (Indira Management Review) Volume X, Issue 2, December, 2016
2009). O’Niel and Palmer (2004) define service quality in higher education as the discrepancy between students expectation versus perception of delivery.
Review of Literature Trivellas and Dargenidou (2009) investigated the influence of leadership roles on the quantity of services provided in higher education. Quality in higher education is a relative concept, given the number of various stakeholders involved (Tam, 2001) which ranges from the single student as the primary customer (Hill, 1995) to the whole of society (Rowley, 1997). Since higher education meets all the classical features of the service (Cherubini, 1996; Pellicelli, 1997); the concept of service quality and customer satisfaction are directly applicable, moving the universities closer to their market needs. A number of studies have been conducted to measure service quality in the context of higher education (Cuthbert, 1996; Soutar and McNeil, 1996; Pariseau and Mc Daniel, 1997; Wong et al.., 2012), elected to adapt the dimensions of the SERVQUAL model, which proposes five dimensions as originally proposed by Parasuraman et al., (1988). Leblanc and Nguyen (1977) identified seven service quality dimensions. These are: contact personnel, reputation, physical evidence, administration, curriculum, responsiveness and access to facilities. Harvey and Green (1993) contended that education is not presenting a service to a customer, but rather a continuous process of transformation of the student. This view has been strongly supported by Lomas (2007), Watty (2005) and Zachariah (2007).
Proposed Research Model This study is approached with the following model.
Fig. 1
Curriculum Aspect
Infrastructure
Competency of Faculty
Non-academic Activities
Teaching Methods
Student's Satisfaction

An Examination of Influence of Higher Education Service Quality on Students’ Satisfaction 97
IMR (Indira Management Review) Volume X, Issue 2, December, 2016
Objectives of the Study 1. To examine the various antecedents of higher education service quality among the
students.
2. To analyze the influence of higher education service quality dimensions on students’ satisfaction.
3. To measure the level of higher education service quality among the students.
Research Methodology The scope of the study is confined only to the students’ perception on higher education service quality. The researchers employed snow ball sampling method to select the students for this research. The sampling units consist of students with different demographic profiles aged 23 and above, residing in the Tamil Nadu state. The researchers administrated questionnaire method for collecting data from the students. The questionnaire consists of three parts. Part I consists of the demographic profile of the study, the second part of the questionnaire consists of variables relating to higher education service quality and third part of the questionnaire, content of variables relating to student satisfaction. The completed questionnaire was pre-tested by 20 students chosen from universities situated in Tamil Nadu. Before administering the questionnaire, content validity of the questionnaire was verified by constituting a panel. Even though the researchers administered 450 questionnaires to the different university students, the researcher could obtain only 243 filled questionnaires. Therefore, the response rate of the study is 54 per cent.
Demographic Profile of the Respondents The student profile is made up of 54.89 per cent male students and 45.11 per cent female students. Over 53 per cent of the respondents were aged between 23–25 and 26 per cent of the respondents were aged between 21–23 and 21 per cent of the respondents were above 25 years. Out of the selected respondents, 43 per cent of the students belong to aided institutions, and 22 per cent of the students belong to state universities and 45 per cent of the students belong to self-financing colleges. Regarding educational qualifications, 43 per cent of the students had engineering as their qualifications; 32 per cent of the students had Arts related qualification as their qualification, and the remaining 25 per cent of the students had other qualifications.
Proposed Hypothesis This study is approached with the following hypothesis:
H01: The curriculum will have no significant impact on students’ satisfaction.
H02: The infrastructure will have no significant impact on students’ satisfaction.
H03: Competency of staff will have no significant impact on students’ satisfaction.

98 Krishnamoorthy and Aishwaryadevi
IMR (Indira Management Review) Volume X, Issue 2, December, 2016
H04: Non-academic activities will have no significant impact on students’ satisfaction.
H05: Teaching methods will have no significant impact on students’ satisfaction.
Table 1: Reliability of the Instruments
Sr. No. Factors No. of Original Variables No. of Variables Retained
Cronbach Alpha
1 Curriculum Aspects 4 4 0.784 2 Infrastructure Aspects 5 5 0.716 3 Competency of faculty 5 5 0.792 4 Non-academic activities 5 4 0.810 5 Teaching methods 4 4 0.821
The higher education service quality dimensions.
Internal consistency was examined by evaluating the Cronbach’s alpha (1951).The Cronbach value in Table 1 reveals the survey instrument is reliable as all Cronbach’s alpha are much higher than 0.70 (Nunnally,1978).
Antecedents of Higher Education Service Quality Initially, the higher education service quality variables were factor analyzed to identify the various dimensions of higher education service quality. Exploratory factoring was based on principal components analysis with varimax rotation of 23 variables. Before conducting the exploratory factor analysis, a test was conducted to establish whether variables correlated to each other with the objective of finding out whether it was possible to carry out a factor analysis. According to Barlett’s test of sphericity (sig=0.000, higher education service quality variables correlated with each other respectively. Furthermore, the Kaiser-Meyer-Olkin (KMO) measures of sampling adequacy (0.733) revealed a practical level of common variance and therefore factoring was suitable. The higher education service quality factor whose Eigen values were greater than 1 was selected according to the criteria developed by Kaiser (1958).
Furthermore, only factor loading greater than 0.5 were included in the further analysis (Hair et al., 1999). The higher education service quality principal component factor analysis revealed five important dimensions. The first underlying dimension of the factor is 'curriculum'. Four variables loaded on the “curriculum” dimensions with a variance of 31.874 per cent. The second dimension is made up of variables that relate to “Infrastructure facilities” which consists of five variables. The third dimension included items relating to the “competence of faculty” which consists of five variables with an eigen value of 1.312. The second dimension with five items contributed a variance of 6.908 percent and the third one to five items contributed 6.770 per cent. The fourth dimension consists of items that relate to non-academic activities. The final and fifth dimension consists of variables related to “Teaching Methods”.

An Examination of Influence of Higher Education Service Quality on Students’ Satisfaction 99
IMR (Indira Management Review) Volume X, Issue 2, December, 2016
Table 2: Antecedents of Higher Education Service Quality Dimension (HESQD)
Sr. No. Hesqd No. of Variables Included
Eigen Value
Percentage of Variance Explained
Cummulative Percentage of Variance Explained
1 Curriculum 4 4.607 31.874 31.874
2 Infrastructure facilities 5 1.449 6.908 38.781
3 Competence of faculty 5 1.312 6.770 45.551
4 Non-academic Activities 4 1.286 6.096 51.646
5 Teaching Methods 4 1.602 5.592 57.238
KMO measures sampling adequacy = 0.733 Bartlett’s test of sphericity = 431.229
Regression analysis among higher education service quality dimensions.
Multiple regression analysis was administered to explore the linkage between student-perceived higher education service quality and student satisfaction.
Table 3: Influence of their Education Service Quality on Student Satisfaction
Sr. No. HESQ Standarized Coefficient
t Sig Collinearity Statistic Tolerance VIF
1 Constant -- 3.329 0.001 - - 2 Curriculum 0.231 2.791 0.006 0.662 1.511 3 Infrastructure facility 0.069 0.829 0.409 0.655 1.527 4 Competency of faculty 0.201 2.512 0.014 0.704 1.421 5 Non-academic activities 0.117 1.491 0.139 0.731 1.368 6 Teaching Methods 0.447 6.926 0.000 0.954 1.049
F Statistics 23.445 푅 0.530 Adjusted 푅 0.507 Significance 0.000
The factor scores of the service quality factors obtained in factor analysis represented the dependent variable. The results revealed that there is a significant influence on teaching methods (β=0.447, t=6.926, ρ=0.000), curriculum (β=0.231, t=2.76,ρ≤0.005), competency of faculty (β=0.201, t=2.791, ρ<0.005). The study also proved that there is no significant influence on non-academic activities and infrastructure on student satisfaction. It is thus evident from the adjusted 푅 , that model explains 50.7 per cent of the variance in students’ satisfaction.
Table 4: Students' Perception of Higher Education Service Quality Dimension
Sr. No. Higher Education Service Quality Dimensions Mean Score Among ‘t’ statistics Male Student, Female Student
1 Curriculum Aspects 2.6143 3.0141 -1.3142 2 Infrastructure Aspects 2.6847 3.6143 -3.6273 3 Competency of Faculty 2.6411 3.5316 -2.1776 4 Non-academic Activities 2.1141 3.0012 -0.6161 5 Teaching Methods 2.1471 3.7143 -2.6143

100 Krishnamoorthy and Aishwaryadevi
IMR (Indira Management Review) Volume X, Issue 2, December, 2016
Significant at Five Percent Level The highly perceived higher education service quality variables among the male students are “Infrastructure facility” and “competency of faculty” since their respective mean scores is 2.6847 and 2.6411. Among the female students, these two are higher education service quality variables are “Teaching methods” and “infrastructure aspects”. Regarding the students’ perception of higher education service quality dimensions, the significant difference between two groups of students have been identified in case of infrastructure, competency of faculty and teaching methods, since their respective ‘t’ statistics are significant at the 5 per cent level.
Table 5: Testing of Hypothesis
Sr. No. Hypothesis Beta Results
1 H01: The curriculum will have no significant impact on students’
satisfaction Rejected
2 H02: The infrastructure will have no significant impact on student’s
satisfaction 0.069 Accepted
3 H03: Competency of staff will have no significant impact on student’s
satisfaction 0.201 Rejected
4 H04: Non-academic activities significant impact on student’s satisfaction 0.117 Accepted 5 H05: Teaching methods significant impact on student’s satisfaction 0.441 Rejected
In case of higher education service quality among the students, the regression co-efficient indicated in Table 5 provide strong supports for the fact that the independent variables, teaching methods is the most important factor for influencing student’s satisfaction followed by curriculum aspects, competency of faculty. Furthermore, the two independent variables like infrastructure, non-academic activities are non-significant in influencing students’ satisfaction.
Conclusion The present study has identified five dimensions of higher education service quality. These are: curriculum aspects, Infrastructure activities, Competency of staff, non-academic activities and teaching methods. It has also analyzed the influence of higher education service quality on the students’ satisfaction from students’ perspectives. A multiple regression has been administered to find the impact of higher education service quality on the students’ satisfaction.
The study found that among other higher education service quality student satisfaction is impacted by teaching methods, curriculum aspects and competency of staff. Furthermore, regarding the students’ perception on higher education service quality dimensions, the significant difference has been identified among the male and female students in case of Infrastructure aspects, competency of staff and teaching methods.
Limitations and Scope for Further Study This study did not consider the influence of the students’ intention to restudy the course in the universities. This study considers snow ball sampling for selecting respondents. In future, a

An Examination of Influence of Higher Education Service Quality on Students’ Satisfaction 101
IMR (Indira Management Review) Volume X, Issue 2, December, 2016
random sampling method can be employed for collecting data from the respondents. The findings of this study would enable the policy makers to benchmark their services with other universities. Future research could also attempt to investigate the influence of a particular course on students’ satisfaction.
The present study has considered only the students’ perception on higher education service quality. Further studies could gather data on teaching staff perception on higher education service quality.
References [1] Arambewela, R. and Hall, J. (2006), “A Comparative Analysis of International Education Satisfaction using
SERVQUAL”, Journal of Services Research, Vol. 6, pp. 141–163.
[2] Cheng, M. (2011), “Transforming the Learner Versus Passing the Exam: Understanding the Gap Between Academic and
Student Definitions of Quality”, Quality in Higher Education, Vol. 17, No. 1, pp. 3–17.
[3] Cherubini, S. (1996), Marketing Dei Servizi, Franco Angeli, Milano.
[4] Clemes, M.D., Cohen, D.A. and Wang, Y. (2013), “Understanding Chinese University Students Experiences: An
Empirical Analysis”, Asia Pacific Journal of Marketing and Logistics, Vol. 25, No. 3, pp. 391–427.
[5] Cronback, L.J. (1951), “Coefficient Alpha and the Internal Structure of Tests”, Psychometrika, Vol. 16, pp. 297–334.
[6] Cuthbert, P.F. (1996), “Managing Service Quality in HE: is SERVQUAL the Answer? Part 2”, Managing Service Quality, Vol. 6, No. 3, pp. 31–35.
[7] Dehghan, A., Dugger, J., Dobrzykowski, D. and Balazs, A. (2014), “The Antecedents of Student Loyalty in Online
Programs”, International Journal of Educational Management, Vol. 28, No. 1, pp. 55–35.
[8] Halai, N. (2013), “Quality for Private Universities in Pakistan: An Analysis of Higher Education Commission Rankings
2012”, International Journal of Educational Management, Vol. 27, No. 7, pp. 775–786.
[9] Harvey, L. and Green, D. (1993), “Defining Quality”, Assessment and Education in Higher Education, Vol. 18,
No. 1, pp. 9–34.
[10] Harvey, L. and Williams, J. (2010), “Fifteen Years of Quality in Higher Education (Part two)”, Quality in Higher Education, Vol. 16, No. 2, pp. 37–41.
[11] Hill, F.M. (1995), “Managing Service Quality in Higher Education: The Role of the Student as Primary Consumer”,
Quality Assurance in Education, Vol. 3, No. 3, pp. 10–21.
[12] IVY, J. (2001), “Higher Education Institution Image: A Correspondence Analysis Approach”, International Journal of Educational Management, Vol. 15(6), pp. 276–282.
[13] Leblance and Nguyen, N. (1997), “Searching for Excellence in Business Education: An Exploratory Study of Customer
Impressions of Service Quality”, International Journal of Educational Management, Vol. 11, No. 2, pp.72–79.
[14] Lomas, L. (2007), “Zen, Motorcycle Maintenance and Quality in Higher Education”, Quality Assurance in Education,
Vol. 15, No. 4, pp. 402–412.
[15] O’Neill, M.A. and Palmer, A. (2004), “Importance Performance Analysis: a Useful Tool for Directing Continuous
Improvement in Higher Education”, Quality Assurance in Education, Vol. 12(1), pp. 39–52.
[16] Parasuraman, A., Zeithaml, V.A. and Berry, L.L. (1988), “SERVQUAL: A Multiple Item Scale for Measuring Consumer
Perceptions of Service Quality”, Journal of Retailing, Vol. 64, No. 1, pp. 12–40.
[17] Parasuraman, A., Zeithaml, V.A. and Berry, L.L. (1988), “SERVQUAL: A Multiple Item Scale for Measuring Consumer
Perceptions of Service Quality”, Journal of Retailing, Vol. 64, No. 1, pp. 12–40.
[18] Parasuraman, A., Zeithaml, V.A. and Berry, L.L. (1994), “Alternative Scales for Measuring Service Quality:
Comparative Assessment based on Psychometric and Diagnostic Criteria”, Journal of Retailing, Vol. 70, No. 3,
pp. 193–194.

102 Krishnamoorthy and Aishwaryadevi
IMR (Indira Management Review) Volume X, Issue 2, December, 2016
[19] Parasuraman, A., Zeithaml, V. and Berry, L. (1988), “SERVQUAL: A Multiple Item Scale for Measuring Consumer
Perceptions of Service Quality”, Journal of Retailing, Vol. 64, No. 1, pp. 12–40.
[20] Pariseau, S.E. and Mcdaniel, J.R. (1997), “Assessing Service Quality in Schools of Business”, International Journal of Quality & Reliability Management, Vol. 14, No. 3, pp. 204–218.
[21] Pariseau, S.E. and Mcdanie, J.R. (1997), “Assessing Service Quality in Schools of Business”, International Journal of Quality & Reliability Management, Vol. 14, No. 3, pp. 204–218.
[22] Pellicelli, G. (1997), Marketing Deiservizi, Utet, Torino.
[23] Quinn, A., Lemay, G., Larsen, P. and Johnson, D.M. (2009), “Service Quality in Higher Education” Total Quality Management, Vol. 20, No. 2, pp. 139–152.
[24] Rowley, J. (1997), “Beyond Service Quality Dimensions in Higher Education and Towards a Service Contract”, Quality Assurance in Education, Vol. 5, No. 1, pp. 7–14.
[25] Rowley, J. (2003), “Retention: Rhetoric of Realistic Agendas for the Future of Higher Education”, International Journal of Educational Management, Vol. 17(6), pp. 248–253.
[26] Soutar, G. and MCNeil, M. (1996), “Measuring Service Quality in a Tertiary Institiution”, Journal of Educational Administration, Vol. 34, No. 1, pp. 72–82.
[27] Soutar, G. and McNeil, M. (1996), “Measuring Service Quality in a Tertiary Institution”, Journal of Educational Administration, Vol. 34, No. 1, pp. 72–82.
[28] Sultan, P. and Wong, H. (2010), “Performance based Service Quality Model: An Empirical Study on Japanese
Universities?”, Quality Assurance in Education, Vol. 18, No. 2, pp. 126–143
[29] Tam, M. (2001), “Measuring Quality and Performance in Higher Education”, Quality in Higher Education, Vol. 7, No. 1,
pp. 47–54.
[30] Trivellas, P. and Dargenidou, D. (2009), “Leadership and Service Quality in Higher Education: The Case of the
Technological Educational Institude of Larissa”, International Journal of Quality and Service Sciences, Vol. 1, No. 3,
pp. 294–310.
[31] Watty, K. (2005), “Quality in Accounting Education: What Say the Academics?”, Quality Assurance in Education,
Vol. 13, No. 2, pp. 120–131.
[32] Wong, K. Tunku, U. and Rahman, A. (2012), “Constructing a Survey Questionnaire to Collect Data on Service Quality
of Business Academics”, European Journal of Social Sciences, Vol. 29, No. 2, pp. 209–221.
[33] Wong, K. Tunku, U. and Rahman, A. (2012), “Constructing a Survey Questionnaire to Collect Data on Service Quality
of Business Academics”, European Journal of Social Sciences, Vol. 29, pp. 209–221.
[34] Yeo, R.K. (2009), “Service Quality Ideals in a Competitive Tertiary Environment”, International Journal of Educational Research, Vol. 48, pp. 62–76.
[35] Zachariah, S. (2007), “Managing Quality in Higher Education: A Stakeholder Perspective”, Ph.D. thesis, University of
Leicester.

IMR (Indira Management Review)
Volume X, Issue 2, December, 2016
Implications of Social Media Amongst College Students
Pooja Vasudev Joshi and Dr. Vinita Nawalakha Sir Parshurambhau College, Pune1
Abstract: There is no doubt that social media has gained wider acceptability and usability. It is also becoming the most important communication tool among students, especially, at the higher level of educational pursuit. Social media is viewed as having bridged the gap in communication. Among the social media, Facebook, Twitter, WhatsApp and others are gaining popularity. Herein, with this paper, the researcher is focusing on the impact of WhatsApp on the college students. WhatsApp and other social networking sites are seen as ‘Global Consumer Phenomenon’ with an exponential rise in usage, within the last few years. Therefore, this study is intended to provide insight into emerging phenomenon of addiction to WhatsApp. The findings indicate that extroverts appear to use WhatsApp for social enhancement, whereas introverts use it for social compensation. Negative correlates of WhatsApp usage include decrease in real life social community participation and academic achievements as well as relationship problems, each of which may be indicative of potential addiction.
Introduction Social Networking Site (SNS) is a web-based service that allows the user to construct a public profile, which facilitates to connect with other people. New developments in technological world had paved way for individuals and families to communicate through social media. Various social media like Facebook, Twitter, WhatsApp etc, are used to create and sustain relationships. Also, users can upload their photos, post what they are doing, at any given time and send personal or public messages to whomever they choose.
In this information age, social media sites seem to be growing in popularity rapidly, especially, amongst youth. In particular, college students form a large proportion of users on social media networks.
Social media networks offer a straight forward way to converse with peers and get a feedback which may influence young adults’ self esteem. For example, WhatsApp is used by students primarily to maintain relationships with individuals they are acquainted with who live, near and far. This field of study is important because socializing is the underlying theme in using forms of social media, since this social media phenomenon is continuing to grow at a fast pace. Smartphones have become super-colossal and crowd-pleasing because many free applications such as WhatsApp have been launched which entirely makes it more popular. The idea is that this application is plainly a messaging application with no advertisements, games, reminders, gimmicks and extra banners. This is the major reason that users get addicted to it. But every beautiful thing has a dark side, in the same way WhatsApp has its own disadvantages i.e. it keeps you busy, it creates social detachment, becomes watchdog, etc.
Corresponding Author E-mail: [email protected]

104 Nawalakha
IMR (Indira Management Review) Volume X, Issue 2, December, 2016
Students were asked whether spending time on WhatsApp affects their time management and schedule, whether they lose their productivity at work or study, whether it affects the use of proper language. Also, the researcher investigated whether WhatsApp helps in instant communication; or, whether it reduces the cost of communication. The questionnaire includes whether WhatsApp reduces the real life interactions; also, whether it satisfies their emotional needs, etc.
Research Methodology Objectives
To study the implications of social media networking amongst college students.
To understand the effects of social media on personal communication as it is growing at a fast pace.
Hypothesis: Students are Addicted to WhatsApp Sample Size A sample size of 60 students was taken.
Respondents Selected Students: Second Year B.Com.
Students from Second Year/ Third Year BBA.
Students from First Year/ Second Year/ Third Year BA.
Sources of Data Collection Primary Data: Collected through survey (questionnaire)
Secondary Data: Internet, Wikipedia, Google
Books: Reference from Second Year B.Com. communication book
Limitation The study was conducted at SP COLLEGE only.
Findings 1. The findings indicated that 40% students are addicted to WhatsApp. According to one of
the previous survey, only 25% students were addicted to WhatsApp (sample size 60 students). There is a 15% rise as compared to previous survey. A total of 27% students say: no, they are not addicted and 33% students say sometimes they are addicted to WhatsApp.

Implications of Social Media Amongst College Students 105
IMR (Indira Management Review) Volume X, Issue 2, December, 2016
2. A total of 57% students say that they use WhatsApp as a cost reducing tool and 60% students say that they use WhatsApp for instant communication; 27% students say they don’t use WhatsApp as a source of instant communication and 13% students say that they sometimes use WhatsApp as an instant communication tool; 28% students say they don’t use WhatsApp as a cost reducing tool and 15% students say sometimes they use WhatsApp as a cost reducing tool.
Table 1: Source: Primary Data
Sr. No. Questions Yes ( % )
No ( % )
Sometimes ( % )
1 Do you think you are addicted to WhatsApp? 40 27 33 2 Whether it affects your time management and schedule? 25 55 20 3 Whether you lose your productivity at work or study? 40 40 20 4 Does it help you in instant communication? 60 27 13 5 Do you use this tool in reducing the cost of communication? 57 28 15 6 Do you rely on the information you receive on WhatsApp? 35 23 42 7 Do you think WhatsApp is knowledge sharing tool? 48 12 40 8 Does it affect the proper use of language? 52 32 16 9 Does it satisfy your emotional needs? 30 37 33 10 Do you think it has reduced your real life interaction? 57 15 28
3. Mostly short forms of language are used while communicating on WhatsApp to reduce the time and to type fast. Due to this, in examinations same form of language is used. When students were asked about this, 52% students said yes WhatsApp has affected the proper use of language; 32% said no and 16% students said sometimes it affects the use of proper language.
4. Not only WhatsApp but several other social media have reduced the real life interaction. Hardly do people meet and have a conversation. A total of 57% students say yes WhatsApp has reduced their real life interaction with friends and even families. 28% students say sometimes use of WhatsApp reduces the real life interaction, but only 15% say no WhatsApp has not affected the real life interaction. When asked about the satisfaction of emotional needs, 30% said yes it satisfies their emotional needs, 37% said no, it does not satisfy their emotional needs and 33% said sometimes it satisfies their emotional needs. The response was mixed and so no definite inference can be drawn. Surprisingly 55% students said that WhatsApp didn’t affect their time management and schedule. Only 25% students said yes and 20% said sometimes it affects their time management.
5. 40% students said yes and 40% said no, 20% said sometimes, when asked whether WhatsApp reduces their productivity at work or study. Only 35% students rely on the information received on WhatsApp; 23% students said no and 42% students said sometimes they rely on the information received on WhatsApp. A total of 48% of the students think that WhatsApp is really a knowledge sharing tool; 12% students said no and 40% students said sometimes they think WhatsApp is a knowledge sharing tool.

106 Nawalakha
IMR (Indira Management Review) Volume X, Issue 2, December, 2016
Graph 1: Showing Findings (in %)
Recommendations Following can be ways to reduce the WhatsApp addiction:
Finding a better addiction
e.g.: reading books, playing musical instruments, etc
To un-install the application
One can simply decide a time when to check it
Avoiding sending jokes, irrelevant messages etc. Once in a while is all right, but making it a daily practice is not good.
WhatsApp should be used as a communication tool only, addiction should be avoided.
Justification of Hypothesis QUE: Do you think you are addicted to WhatsApp?
ANS: Yes - 40%
Sometimes - 33%
No. - 27%
So 73% respondents says that they are using WhatsApp in which 40% are addicted to WhatsApp and 33% are sometimes addicted to it.
Hence, hypothesis is accepted.
0
10
20
30
40
50
60
70
1 2 3 4 5 6 7 8 9 10
YES ( % )
NO ( % )
SOMETIMES ( % )

Implications of Social Media Amongst College Students 107
IMR (Indira Management Review) Volume X, Issue 2, December, 2016
Graph 2: Diagram Showing Percentage of Students Addicted to WhatsApp
Conclusion From the survey, it could be said that the percentage of WhatsApp addiction among students is rising. There could potentially be a cause for concern particularly, when there is a rise in amount of time that the students spend online. The stated recommendations can be taken into consideration to reduce the WhatsApp addiction. Students should not forget the main aim behind WhatsApp and other social medias that, it is just a medium to connect to people and share information.
References [1] Blackwood, C., Flowers, S.S., Rogers, J.S. and Staik, I.M. (1991, November), Pleasure Reading by College Students;
Fact or Fiction? Paper Presented at the Annual Meeting of the Mid-South Education Research Association
Conference, Lexington, KY.
[2] Arnett, J.J. (2000), Emerging Adulthood: A Theory of Development from the Late Teens through the Twenties.
[3] Cassey, G. and Evans, T. (2011), “Designing for Learning: Online Social Networks as a Classroom Environment”,
The International Review of Research in Open and Distance Learning, Vol. 12(7), pp. 1–26.
[4] Chen, S.Y. (2007), “Extracurricular Reading Habits of College Students in Taiwan: Findings from Two National
Surveys”, Journal of Adolescent & Adult Literacy, Vol. 50, pp. 642–650.
[5] Book-SY BCOM “Business Communication” by Dr. Saroj Hiremath.
YES ( % )
NO ( % )
SOMETIMES ( % )

IMR (Indira Management Review)
Volume X, Issue 2, December, 2016
When India will get its Educational Freedom?
Dr. V.H. Inamdar Director, MES-IMCC
Liberalization, Privatization & Globalization (LPG) process got a kick-start in India in the year
1991. We are witnessing favourable outcome of this process in every sector of the economy; except in education sector! Education sector is completely locked in License and Permit Raj. This
sector has become rigid and static. It should become autonomous, dynamic and competitive. Academic Ranking of the World Universities (ARWU) by Shanghai Jiao Tong University (SJTU)
in China underlines the fact that in the Top 500 universities globally, there are 151 American, 45 Chinese and only 01 Indian university. What does this indicate? Indian universities need to
have complete financial, administrative and academic autonomy in order to improve their standards.
Today, apart from UGC, 16 apex councils are governing the higher and technical education sector. They should be merged together to create National Council for Higher Education &
Research (NCHER) for single-window clearance. Education is a concurrent subject in the perview and jurisdiction of the Centre and the State. In the State also, educational institutions have to cross
the obstacles race created by Mantralaya, DTE, SSS, PNS, Social Welfare Department etc., in effect, university autonomy is at stake. State universities in Pune, Mumbai, Nagpur are bogged
down under pressure of affiliated institutions. Savitribai Phule Pune University (SPPU), for example, has nearly 1000 affiliated colleges and recognized institutions, 10 lakh students in 3
districts of Western Maharashtra. As per NKC-New Delhi Norms, ideally there should be 1 university in each district & 100 affiliated colleges per university. Today’s universities are
overloaded due to examination work. In effect, teaching and research gets hampered. In order to sort out this problem, a separate examination board could be created on the lines of SSC Board &
HSC Board. Today, we are having 800 universities in the country. We need at least 1500 universities in order to raise G.E.R. from 18% to 30%. Education sector needs to be re-structured
based on ‘Expansion, Equity and Excellence’. E.B.C. Scholarship appears to be the ideal way for giving financial relief to the needy but deserving students. We need corporate universities and
foreign universities. Today, 6.5 lakhs bright students are going abroad for higher education by spending U.S. $ 4 billion (Rs. 26800 Crores) annually. Moreover, it creates a brain drain. If we
enrich and empower our own universities, it will surely create a reverse flow.
Indian universities should create I.P.R. Chairs & Patent Offices on campus so as to convert
ideas into real start-ups for wealth creation and job creation. Teachers should do research and researchers should teach.

When India will get its Educational Freedom? 109
IMR (Indira Management Review) Volume X, Issue 2, December, 2016
In order to make it happen, NDA Government should take a bold political initiative to conduct a joint session of Loksabha & Rajyasabha for clearing pending educational reform bills
that have been recommended by NKC-New Delhi and Dr. Yashpal Committee. At the state level, new Maharashtra Universities Act needs to be passed.
Let us liberate ‘Saraswati’ on the lines of ‘Laxmi’; as the superhighway to superpower status runs through the knowledge corridor. India got its political freedom in 1947, economic freedom in
1991. When will India get its educational freedom?
Dr. Vikas Inamdar [email protected]

IMR (Indira Management Review)
Volume X, Issue 2, December, 2016
Role of Service Sector in Indian Economy
Dr. Parmeshwar Yadav Associate Professor,
Indira School of Business Studies, Pune
Introduction Adam Smith, the father of Modern Economics has stated ‘services are unproductive’. But time has changed and now services are playing major role in the economy. Services sector has emerged as the fastest growing sector of the economy. Services sector is called the tertiary sector. It has become wider. Services sector includes: trade, hotels, restaurants, transport, storage, communication, finance, insurance, real estate and business services. Service sector has made structural changes in the economy. The new economic policy of 1991 was the turning point of the Indian economy. A lot of changes in the economy have been occurring due to the adoption of ‘The New Economic Policy’ especially, in the services sector. The current situation in India is that the growth rate of services has overtaken both agriculture and industry, and is now more than 45 per cent of the GDP.
The services sector has the highest growth rate and is the least volatile sector. Growth is particularly marked in public services, IT and financial services. In some areas, the growth rate of the services sector is 40%–50% due to increased use of mobile technologies.
India, therefore, has a services-oriented economy. It hasn’t followed traditional growth models (as in China) in that it has skipped the manufacturing stage and has jumped straight from the agricultural stage to services. Growth in the services sector will support growth in the agricultural and industrial sectors, although growth in manufacturing, which causes pollution, is not so desirable in terms of job creation and increased prosperity.
The service sector of India has also witnessed a remarkable rise in the global market apart from the Indian market. The broad-based services in the trade sector, has undergone a large-scale rise. A statistics concerning the growth of India’s service sectors are listed below:
The software services in Indian economy along with the export of products is growing at a massive pace and thereby witnessed an alarming rise of 35.5 per cent and reached a lumpsum amount of USD 18 billion. The ITeS and BPO sectors grew by 33.5 per cent and earned a revenue of USD 8.4 billion. The service sector of Indian economy has been the most high-powered sector in India’s economy. It has also been focussing in various investments, of late. As Indian economy is looking forward for more liberalization, sectors like banking are on its way to loom large and occupy a more significant position in India's economy.

Role of Service Sector in Indian Economy 111
IMR (Indira Management Review) Volume X, Issue 2, December, 2016
The services sector is not only the dominant sector in India’s Gross Domestic Product (GDP) but has also attracted significant foreign investment flows, contributed significantly to exports as well as provided large-scale employment.
Indian service sector grew at approximately 8 per cent per annum and contributed to about 64 per cent of India’s GDP in 2015–16.
The services sector is the key driver of India’s economic growth. The sector contributed around 66.1 per cent of its Gross Value Added growth in 2015–16, thereby becoming an important net foreign exchange earner and the most attractive sector for FDI (Foreign Direct Investment) inflows.
India is the eighth largest services exporter in the world.
The services exports have in 2014 stood at US$ 155.6 billion, which constitutes 7.5 per cent of the GDP. The services imports increased at a rate of 3.3 per cent to US$ 81.1 billion in 2014–15.
Out of overall services sector, the sub-sector comprising financial services, real estate and professional services contributed 21.6 per cent to the GDP, and grew the fastest among all sub-segments at 10.3 per cent year-on-year basis in 2015–16.
The sub-sector of trade, hotels, transport, communication and services related to broadcasting contributed 12.6 per cent the GDP. The third-largest sub-segment comprising public administration, defence and other services contributed nearly 12.6% to the GDP.
The importance of the service sector, we can discuss, as below. Over the past 30 years, production has increased in all the three sectors. It has increased the most in the service sector.
Service sector has contributed 64% in the GDP which is highest, as compared to agriculture and industry sector. Service sector is also playing a vital role in employment generation; 31% employment is generated by service sector which is significant as compared to agriculture (49%) and industry sector (20%).
In the future also service sector will be domination sector in the economy.

IMR (Indira Management Review)
Volume X, Issue 2, December, 2016
Human Happiness Index
Amruta Deshpande* Assistant Professor,
Indira School of Business Studies, Pune
Happiness is a mental or emotional state of well-being defined by positive or pleasant emotions ranging from contentment to intense joy. Happy mental states may also reflect judgements by a person about their overall wellbeing.
The World Happiness Report is a measure of happiness published by the United Nations Sustainable Development Solutions Network. In July 2011, the UN General Assembly passed a resolution inviting member countries to measure the happiness of their people and to use this to help guide their public policies. The United Nations declared 20th March as the International Day of Happiness to recognize the relevance of happiness and well-being as universal goals.
‘Happiness’ has been making headlines over the past few months, though India didn’t have much to cheer about, as it figured among 10 countries that saw the largest declines in happiness levels between 2005–07 and 2013–15. According to the World Happiness Report which ranked 156 countries, India was at the 118th spot-one below last year’s ranking. But this must have hurt the powers that even Saudi Arabia, Somalia and Pakistan were rated happiest than India Every year, the World Happiness Index surveys numerous people from various countries around the world in search of, as the name implies, which country has the happiest population. This year’s winner is Denmark, followed closely by Switzerland, Iceland, and Norway. The US ranked 13th.
What is the ‘Gross National Happiness–GNH?’ The Gross National Happiness (GNH) is an aggregate measure of a country’s national production, in the vein of the gross national product or gross domestic product. Gross National Happiness (GNH) attempts to measure the sum total not only of economic output, but also of net environmental impacts, the spiritual and cultural growth of citizens, mental and physical health and the strength of the corporate and political systems.
In July 2011, the UN General Assembly passed a resolution inviting its member countries to measure the happiness of their people and to use this to help guide their public policies. On April 2, 2012, this was followed by the first UN High Level Meeting on ‘Happiness and Well-Being: Defining a New Economic Paradigm’ which was chaired by Prime Minister Jigme Thinley of Bhutan, the first and so far only country to have officially adopted GNH (Gross National Happiness) instead of GDP (Gross Domestic Product) as their main development indicator. The first World Happiness Report was released on April 1, 2012.

Human Happiness Index 113
IMR (Indira Management Review) Volume X, Issue 2, December, 2016
An index to measure happiness at your workplace may seem like too corny an idea, but the experience of some of the world’s most attractive employers shows that companies can no longer ignore the happiness quotient in their organizations.
Employee Happiness Most of the organizations have realized the importance of employees’ happiness. Most speakers in seminars explain that happiness could make you healthier, kinder, more productive, and even more likely to get promoted. Organizations spend money on happiness coaches, team-building exercises, game-plays, consultants, and Chief Happiness Officers.
When you look closely at the research, there is evidence to suggest that happy employees are less likely to leave, more likely to satisfy customers, are safer, and more likely to engage in citizenship behaviour. However, we also discovered alternate findings, which indicate that some of the taken-for-granted wisdoms about what happiness can achieve in the workplace are mere myths.
Real Statements on Happiness (Review of Literature) It won’t necessarily get you through the work day.
Happiness could damage your relationship with your boss, family, friends
Happiness could make you selfish.
So why, contrary to all of this evidence, do we continue to hold on to the belief that happiness can improve a workplace?
When we assume that happy workers are better workers, we can sweep more uncomfortable questions under the carpet, especially since happiness is often seen as a choice. It becomes a convenient way of dealing with negative attitudes, party poopers, and other unwanted characters in corporate life. Let’s state some inexpensive ways to keep employees happy.
Inexpensive ways to keep Employees happy Trust people–give them freedom within guidelines
Help people see why what they do matters
Give regular encouragement, praise, perks and thanks
Help people find and play to their strengths
Encourage a healthy balance between work and life
Treat your employees with respect: Give respect and take respect, treat them well.

114 Deshpande
IMR (Indira Management Review) Volume X, Issue 2, December, 2016
Money Matters: Provide adequate vitamin M to all employees as per their performance.
Build ownership among your employees: Let employees feel that they own the place, not just work there.
Positive work environment has long-lasting effects on employee engagement, overall productivity and profit and ultimately happiness.
In reality, work—like all other aspects of life—is likely to make us feel a wide range of emotions. If your job feels depressing and meaningless, it might be because it is depressing and meaningless. Pretending otherwise can just make it worse. Happiness, of course, is a great thing to experience, but nothing that can be willed into existence. And maybe the less we seek to actively pursue happiness through our jobs: the more likely we will be to actually experience a sense of joy in them a joy which is spontaneous and pleasurable, and not constructed and oppressive. But most importantly, we will be better equipped to cope with work in a sober manner. To see it for what it is. And not as we—whether executives, employees, or dancing motivational seminar leaders—pretend that it is.
So stay happy stay healthy…

IMR (Indira Management Review)
Volume X, Issue 2, December, 2016
Things a Little Bird Told Me: Confessions of the Creative Mind
Author: Biz Stone
Reviewer: Dr. Ravindra Utgikar Vice President, PRAJ Industries Ltd. Pune
Twitter brand needs no introduction and a book written by one of the co-founders, Biz Stone,
created a lot of excitement. In this book, the author discusses birth and journey of Twitter.
Additionally, he unveils his success mantra and the learning he gained throughout his life. These
are very contemporary and can be harnessed in any business setting. Book paints Biz Stone as a
calm guy focused on realizing his vision; not at all perturbed about the fact that he was broke until
35 years of his age. A true—although a rags-to-riches— story of a person who was bombarded by
a huge amount of debt and today has a net worth in excess of $200 million.
Biz Stone’s story of coming up with the idea of Twitter is about understanding what exactly
people care the most and not as much about not a Eureka moment. Emotional investment,
according to author is single biggest investment one can make in his work. He says, Success
isn’t guaranteed, but failure is certain if you aren’t truly emotionally invested in your work.”
One should visualize in the mind how working on a particular project would be before taking it
on. This facilitates decision whether you should take it up or not.
He was brought up poor; however, he learned early in his life that one shouldn’t wait for
opportunities but create the set of circumstances that make up that opportunity. His story tells us
that until you have achieved your ultimate goals, you should never feel accomplished. He had
employment opportunity at Google despite not having a degree. It was surefire way to stable debt
free life but he gave it up to answer his heart’s calling.
Notwithstanding huge initial criticism from friends and colleagues, he continued to work upon
idea with the help of Jack Dorsey, the techie, and Evan Williams. This was the genesis of Twitter.
Users wholeheartedly embraced Twitter within no time and it became a huge success. Power of
Twitter was well very well received by not just Twitter employees and users in north America but
all over the world. The book describes how Twitter gave a lifeline and voice to many who wanted
to express views, give updates about the events and let the world know about factual on-ground

116 Stone and Utgikar
IMR (Indira Management Review) Volume X, Issue 2, December, 2016
situation during the watershed events such as Arab spring, Mumbai blasts etc. Twitter was a new
way of broadcasting information/ news to the world and created a strong alternative to news
broadcasting bodies that are often manipulated. He reassures readers that everyone can be creative
and that creativity is a renewable source. He says, “You might not be a great artist but you sure
have a creative streak and are capable of creative thoughts.”
According to the author, being compassionate with the people around you is very important.
He explains that altruism is not a one way street. When we help others, we are not just giving
something away. By helping others, in an interdependent world, we also help ourselves directly or
indirectly, he says.
Things a Little Bird Told Me: Confessions of a Creative Mind is an inspirational book that
forces people to look at the brighter side of life every single time. It definitely talks about the life
of Twitter and its behind-the-scenes stories but without failing to churn out the slightest of
learning that one could take away from them.

Author Index
Ahire, Sanjay, 21 Aishwaryadevi, A.S., 95
Barbole, A.N., 45 Bharathi, B., 95 Bhate, Manasi Sameer, 62
Dande, Mangesh P., 31 Deshpande, Amruta, 112
Gaur, Sheetal, 45 Ghosh, Ekanto, 83
Inamdar, V.H., 108
Joshi, Pooja Vasudev, 103
Krishnamoorthy, V., 95
Matthew, Ruby, 83
Nawalakha, Vinita, 103
Ratnasri, T.P.V., 73 Risbud, Mrunal, 73
Shingre, Madhav V., 9 Sidharth, Sumati, 83
Utgikar, Ravindra, 115
Wagh, Madhura, 55
Yadav, Parmeshwar, 110

Guidelines for Authors
Research Papers
Indira Management Review (IMR), is a blind fold peer-reviewed research journal published bi-annually. IMR is committed to publishing scholarly empirical and theoretical research papers that have a high impact on the management field as a whole. IMR encourages new ideas & new perspectives on existing research. Manuscripts that are suitable for publication in IMR cover domains such as business strategy and policy, IT sourcing, entrepreneurship, human resource management, financial management, organizational behavior, organizational theory, marketing and research. IMR encourages papers with Indian context, more so if they examine issues with reference to India’s place in the bigger international picture. Research Papers are put through the blind/peer review process and plagiarism check before being accepted.
Authors are requested to note the following while forwarding written material for publication:
1. The research paper should be sufficiently brief in length (approx. 5000 words or 10–12 pages) without sacrificing content, in MS word format in Aerial font size 12, typed in 1.5 line spacing. Graphs & tables should be in the body of the text & not separate.
2. The research paper should carry a brief abstract not exceeding 100 words profiling the nature of work to follow.
3. Bibliography needs to be structured in the APA format.
4. A duly filled, signed & scanned copy of declaration form should accompany the research paper, signed by the author/s (Refer below Annexure I)
5. Plagiarism by authors submitting research papers/ articles/book review to IMR for publication is viewed seriously. Whenever use of material from other sources without appropriate acknowledgement/permission is noticed, the author/s of such contribution/s will be liable to be black listed at IMR, apart from other actions that may be initiated by concerned authorities. It is therefore, earnestly requested that such practices be scrupulously avoided.
6. The Soft copy of the research paper/article/book review along with the scanned copy of declaration form should be e-mailed to [email protected]
7. Research paper/article/book review approved by the review panel will be taken up for publication, & the date of publication will depend upon the editorial constraint of time & space. The journal will not enter into correspondence with authors regarding date of publication. Authors are requested not to remind us regarding the same. We shall convey to the author the fate of their article when the review process is completed & the decision reviewed from the reviewer–be it acceptance, rejection or a recommendation for effecting modifications/ additions, deletions from the text, for compliance by the author.
8. It is understood that a research paper submitted to IMR for publication & pending consideration will only be withdrawn in writing if it is proposed to be published elsewhere.
9. The mailing of research papers for publication to IMR signifies acceptance of the editors decision regarding acceptance or otherwise of a contribution to be final & binding.

Guidelines for Authors
Book Review
We invite academicians and authors from industry to write reviews of books on business management allied subjects.
The book-reviewers are requested to follow the guidelines given below:
1. The reviewer should begin with a listing of the bibliographical details of the book comprising the name (s) of the author (s), full title and sub-title of the book (as they appear on the cover), details of the place and name of the publisher, year of publication, number of pages in the book, whether hardbound or paperback, and the price, if mentioned.
2. The review can range from 1000 to 3000 words, depending on the topic and the importance of the book.
3. The review should engage with the theme of the book and the issues and problems raised, and should make a rigorous attempt to identify and assess the main arguments put forth by the author.
4. The review should be written in a manner and style that would qualify it as a short article in its own right.
5. The reviewer should provide a confirmation that this review has not been sent for publication elsewhere and that the author will cede the copyright, if it is accepted for publication in Indira Management Review (IMR)
6. The book under review should have been published recently, preferably in the current or the previous year, and be preferably the new release.
7. The reviewer should also comment on the stylistic aspect and literary presentation of the book.
8. Bibliographical references should be avoided. If the references are considered essential, then citation style adopted by Indira Management Review (IMR) should be followed.
Thus, the review should be an objective assessment of the book, indicating its specific strengths and weaknesses, and an overall assessment by the reviewer.
Annexure I
Copyright Warranty & Authorization Form
Title of the Paper/ Book Review/ Article:
------------------------------------------------------------------------------------------------------------
------------------------------------------------------------------------------------------------------------
Declaration:
I/We……………………………………………………………………………………………...
………………………………..the author/s of the research paper/ book review/ article entitled
………………………………………………………………………………………………………..
………………………………………………………………………………………authorize you to
publish the above mentioned research paper/ book review/ article in your international research
journal-Indira Management Review.
It is herein agreed that:
1. I/We will not publish above said contribution anywhere else without the prior written permission of the publisher unless it has been changed substantially.
2. I/We declare and warrant that his/her/their contribution is original, excerpts for such excerpts from copyrighted works as may be included with the permission of the copyright holder and author thereof, that it contains no libelous statements, and does not infringe on any copyright, trademark, patent, statutory right, proprietary right of others. The author signs for and accepts responsibility for releasing this material on behalf of any and all co-authors.
3. The author also warrants that he/ she has the right to enter into this agreement, the research paper/ book review/ article contains no libelous or unlawful statements, contains no instructions that may cause harm or injury and does not violate the copyright or trademark, or infringes on the right or the privacy or others; and that all statements in the article asserted as facts are either true or are based upon reasonable research.
4. I/We agree to indemnify the Editors of IMR against all claims and expenses arising from any breach of warranty from me/ us in this agreement.
Author I Author II
Name: ___________________ Name: ___________________
Sign: ___________________ Sign: ___________________

Personal Details of the Author/s
Author I
Name:
_________________________________
Designation:
_________________________________
Place of Work:
_________________________________
Address:
_________________________________
E-mail id:
_________________________________
Mobile:
_________________________________
Date:
_________________________________
Location:
_________________________________

Publication Ethics and Malpractice Statement
Our Journal is dedicated to following best practices on ethical matters, errors and retractions. The prevention of publication malpractice is one of the important responsibilities of the editorial board. Any kind of unethical behavior is not acceptable, and ISBS and IMR do not tolerate plagiarism in any form. Authors submitting articles to IMR affirm that manuscript contents are original. The following duties outlined for editors, authors, and reviewers. Editors, authors, and reviewers will also adhere to the IMR submission guideline policies.
Duties of Editor Publication Decisions: Based on the review report of the editorial review board, the editor can accept, reject, or request modifications to the manuscript.
Review of Manuscripts: Each editor must ensure that each manuscript is initially evaluated by the editor for originality, making use of appropriate software to do so. Following desk review, the manuscript is forwarded for blind peer review to the editorial review board that will make a recommendation to accept, reject, or modify the manuscript.
Fair Review: The editor must ensure that each manuscript received is reviewed for its intellectual content without regard to sex, gender, race, religion, citizenship, etc. of the authors.
Confidentiality: The editor must ensure that information regarding manuscripts submitted by the authors is kept confidential.
Disclosure and Conflicts of Interest: The editor of IMR Journal will not use unpublished materials disclosed in a submitted manuscript for his/her own research without written consent of the author.
Duties of Authors Reporting Standards: Authors should present an accurate account of their original research as well as an objective discussion of its significance. Manuscripts will follow the submission guidelines of the journal.
Originality: Authors must ensure that they have written entirely original work.
Multiple, Redundant, or Concurrent Publications: Authors should not submit the same manuscript to more than one journal concurrently. It is also expected that the author will not publish redundant manuscripts or manuscripts describing the same research in more than one journal.
Acknowledgement of Sources: Authors should acknowledge all sources of data used in the research and cite publications that have been influential in the research work.
Authorship of the Paper: Authorship should be limited to those who have made a significant contribution to conception, design, execution or interpretation of the reported study. Others who have made significant contribution must be listed as co-authors. Authors also ensure that all the

Publication Ethics and Malpractice Statement 123
IMR (Indira Management Review) Volume X, Issue 2, December, 2016
authors have seen and agreed to the submitted version of the manuscript and their inclusion of names as co-authors.
Data Access and Retention: Authors should provide raw data related to their manuscript for editorial review and must retain such data.
Fundamental Errors in Published Works: If at any point of time, the author (s) discovers a significant error or inaccuracy in submitted manuscript, then the error or inaccuracy must be reported to the editor.
Duties of Reviewers Confidentiality: Information regarding manuscripts submitted by authors should be kept confidential and be treated as privileged information.
Acknowledgement of Sources: Manuscript reviewers must ensure that authors have acknowledged all sources of data used in the research. Any kind of similarity or overlap between the manuscripts under consideration or with any other published paper of which reviewer has personal knowledge must be immediately brought to the editor's notice.
Standards of Objectivity: Review of submitted manuscripts must be done objectively and the reviewers should express their views clearly with supporting arguments.
Promptness: In the event that a reviewer feels it is not possible for him/her to complete review of manuscript within stipulated time then this information must be communicated to the editor, so that the manuscript could be sent to another reviewer.

Indira Management Review
Subscription Order Form
Name of the Subscriber:
Dr./ Prof./ Mr./ Ms.: …………………………………………………..............................................................................
(Institution: If subscribing in the name of the organization)
………………………………………………………………………………………..........………
………………………………………………………………………………………..........………
(Mention Specific department if necessary) …………………………………………..…………..
Mailing Address:
Name Designation/Department :
Address :
Phone :
E-mail ID :
Period of Subscription : 1 Yr/ 2 Yrs/ 3Yrs Subscription : 1 year INR 400
(Tick Appropriately) : 2 year INR 700
: 3 year INR 1000
Enclosed is Demand Draft Number: ………………………………… dated ……………………
Favouring Shree Chanakya Education Society, For INR 400/ 700/ 1000 drawn on (name of
Bank)………………………………. Payable at Pune towards the subscription for 1Yr/ 2 Yrs/ 3Yrs. (No cheques/ postal order/ money orders please)
Date: _________________ Authorized Signature: _________________
Please mail the above form together with the Demand Draft for the appropriate amount
To: The Editor, Indira Management Review
Indira School of Business Studies
Abhinavan, 89/2 A, New Pune–Mumbai Highway Tathawade, Pune–411033, India


Indira Management Review
Feedback Form
Please take few minutes to complete the form and mail it to The Editor, Indira Management Review, Indira School of Business Studies, Abhinavan, 89/2 A, New Pune–Mumbai Highway, Tathawade, Pune, India–411033 (INDIA). You can also e-mail it to [email protected] This will help in keeping us clued to needs of industry and academia.
Please tick the appropriate choice. If your choice is (iii) please mention details
Layout:
i. Good ii. Satisfactory iii. Can be improved
(iii) ------------------------------------------------------------------------------------------------------
------------------------------------------------------------------------------------------------------------
Content:
i. Good ii. Satisfactory iii. Can be improved
(iii) ------------------------------------------------------------------------------------------------------
------------------------------------------------------------------------------------------------------------
Quality of Articles:
i. Good ii. Satisfactory iii. Can be improved
(iii) ------------------------------------------------------------------------------------------------------
------------------------------------------------------------------------------------------------------------
What are the subjects on which you would like IMR to feature articles? Please specify.
------------------------------------------------------------------------------------------------------------
------------------------------------------------------------------------------------------------------------
We would welcome quality articles of value to industry and academia such as research or academic papers/ case studies/articles/ book reviews etc. for IMR. For Details see our guidelines to the authors.
Would you like to write for IMR? Yes If so, your choice of subject: ………………….
Also mention name/s of journals in which you have published your work:
Your Name: Institute:
Address: Email Id:
Designation: Date:
Signature:
