indigenous health – australia, canada, aotearoa new zealand and
TRANSCRIPT
The path to universal coverageHEALTH SYSTEMS FINANCING
Lisa Jackson Pulver, Melissa R. Haswell, Ian Ring,John Waldon, Wayne Clark, Valorie Whetung, Dianne Kinnon, Catherine Graham, Michelle Chino, Jonathon LaValley, Christina Compher and Ritu Sadana
World Health Report (2010)Background Paper, 33
Indigenous Health – Australia, Canada, Aotearoa New Zealand and the United States - Laying claim to a future that embraces health for us all

ADVANCED PRELIMINARY WEB VERSION 22 November 2010
© World Health Organization, 2010 All rights reserved. The designations employed and the presentation of the material in this publication do not imply the expression of any opinion whatsoever on the part of the World Health Organization concerning the legal status of any country, territory, city or area or of its authorities, or concerning the delimitation of its frontiers or boundaries. Dotted lines on maps represent approximate border lines for which there may not yet be full agreement. The mention of specific companies or of certain manufacturers' products does not imply that they are endorsed or recommended by the World Health Organization in preference to others of a similar nature that are not mentioned. Errors and omissions excepted, the names of proprietary products are distinguished by initial capital letters. All reasonable precautions have been taken by the World Health Organization to verify the information contained in this publication. However, the published material is being distributed without warranty of any kind, either expressed or implied. The responsibility for the interpretation and use of the material lies with the reader. In no event shall the World Health Organization be liable for damages arising from its use. The findings, interpretations and conclusions expressed in this paper are entirely those of the author and should not be attributed in any manner whatsoever to the World Health Organization.
Advanced Preliminary Web Version 22 November 2010 1

Indigenous Health – Australia, Canada, Aotearoa New Zealand and the United States - Laying claim to a future
that embraces health for us all
World Health Report (2010) Background Paper, No 33 Lisa Jackson Pulver1, Melissa R. Haswell1, Ian Ring1,2, John Waldon1,3, Wayne
Clark4, Valorie Whetung4, Dianne Kinnon4, Catherine Graham4, Michelle Chino5, Jonathon LaValley5, Christina Compher5 and Ritu Sadana6.
1 Muru Marri Indigenous Health Unit, School of Public Health and Community Medicine, Faculty of Medicine, university of New South Wales, Australia 2 Centre for Health Service Development University of Wollongong, Australia 3 Centre for Maori Health Research and Development, Massey University, New Zealand 4 National Aboriginal Health Organization, Canada 5 School of Community Health Sciences, University of Nevada Las Vegas, USA 6 Department of Health Systems Financing Health Systems and Services Cluster, World Health Organization, Geneva
Advanced Preliminary Web Version 22 November 2010 2
We pay our respects to the Indigenous Peoples of our countries, and to our Elders, past, present and future, and hope we have honoured their wishes in how this report has been compiled.
As proposed by the International Group on Indigenous Health Measurement, Lisa Jackson Pulver was commissioned by the World Health Organization to coordinate the preparation of this background paper. We acknowledge each country's Ministry of Health and or national statistical agencies who shared available data in this area. The paper benefited from discussions and suggestions received during the UN Inter-Agency Support Group on Indigenous Peoples' Issues, hosted by the World Health Organization, Geneva, on 16 September 2010, as well as from peer reviewers.
Advanced Preliminary Web Version 22 November 2010 3

Indigenous Health – Australia, Canada, Aotearoa New Zealand and the United States - Laying claim to a future that embraces health for us all.
I. Introduction
1.1 Health for all - within and across countries.
Improving the health of all peoples has been a call across the globe for many decades and unfortunately remains relevant today, particularly given the large disparities in health status of peoples found around the world. Rather than differences in health, or health inequalities, we use a different term, health inequities. This is so as mere differences in health (or "inequalities") can be common in societies and do not necessarily reflect unfair social policies or practices. For example, natural ageing implies older people are more prone to illness. Yet, when differences are systematic, socially produced and unfair, these are considered health inequities. Certainly making judgments on what is systematic, socially produced and unfair, reflects value judgements and merit open debate. We are making explicit in this paper what our judgments are, and the basis for these judgments.
The World Health Assembly in 2009 (WHO 2009) passed a resolution with each of its 193 Member States endorsing, that reducing health inequities within and across countries, should be a priority for all countries and development partners, and that the task requires multiple sectors to work together, given that evidence from around the world documents that the distribution of health within and across countries reflect a broad range of social determinants, including the interaction of social determinants with biological determinants. The WHO's global health agenda clearly identifies four gaps that must be addressed. The first one is to increase social justice, followed by increasing responsibility, implementation and knowledge. Moreover, the WHO recognizes that to overcome these gaps, strong political will, integrated policies and broad participation are required.
Health equity implies that everyone could attain their full health potential regardless of social position or other social circumstances. Health inequities are systematic as they are not distributed randomly. Instead they show a consistent pattern across different population groups. Many of these differences are not only due to physical health factors, but also increasingly due to social factors. In fact, the underlying causes are complex, often reflecting systematic social, political, historical, economic and environmental factors, accumulated during a lifetime and transferred across multiple generations. "Social" determinants is therefore used as shorthand for all of these factors.
1.2 Embracing Indigenous peoples.
Despite a number of global achievements that have improved population health, one key marker of the impact of inequities in health status globally, is the constancy of conspicuously poor health status of Indigenous populations of their Lands and in their countries, whether we look across the globe as a whole or within the wealthiest of nations.
Advanced Preliminary Web Version 22 November 2010 4
The phenomenal gains and advantage that development has thus far provided to the United States, Canada, Australia and Aotearoa New Zealand have not achieved a present that embraces equity in Indigenous health determinants, access or outcomes within their own boarders.
The United Nations has estimated that there are about 370 million Indigenous people in the world today living in at least 70 countries (Canberra Report). An estimated 7 million of these people live within the high income countries of the United States, Canada, New Zealand and Australia. Each of these nations share a colonial history associated primarily with the British empire that commenced between 400 and 500 years ago in the Northern hemisphere (US, Canada) and just over 220 years ago in the Southern Hemisphere (New Zealand, Australia). Despite the vast difference in time and place, familiar stories of the colonisation experience and its lasting impact on the health status and challenges faced today in striving for recovery emerge as a shared agenda of unfinished business. Profound health and social inequities persist between Indigenous and non-Indigenous populations of all four nations, as this paper and extensive evidence documents.
1.3 Pathways to improving health.
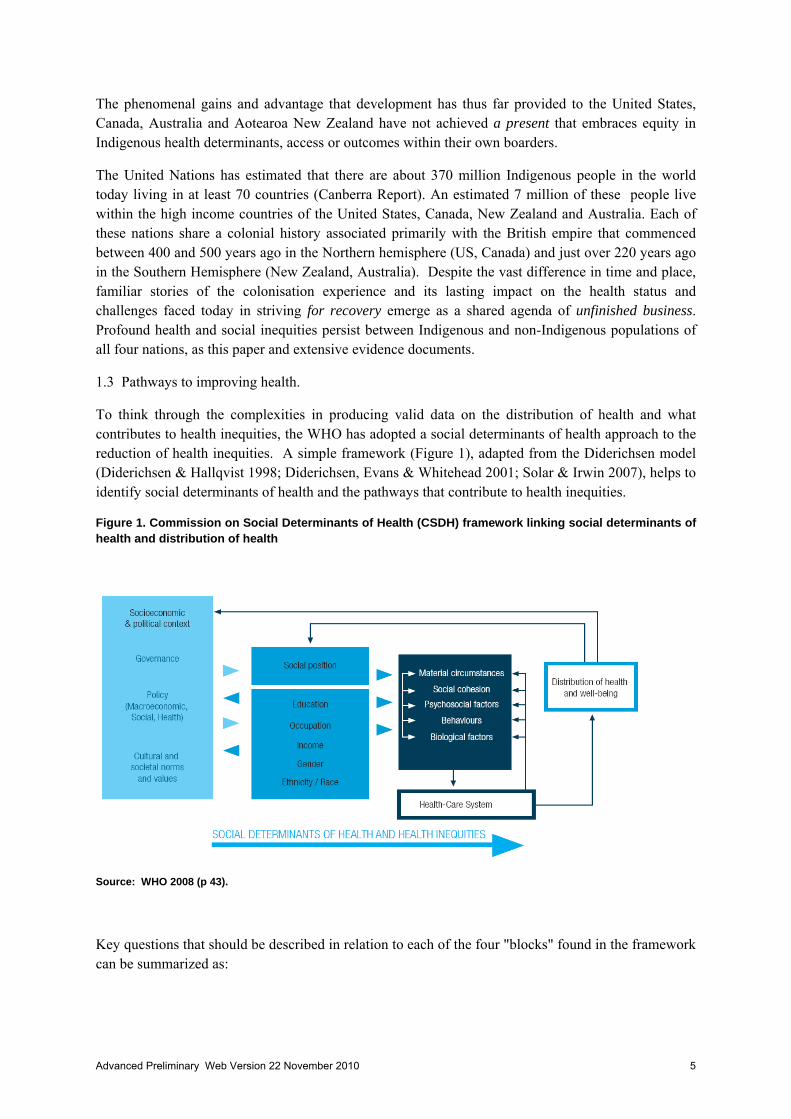
To think through the complexities in producing valid data on the distribution of health and what contributes to health inequities, the WHO has adopted a social determinants of health approach to the reduction of health inequities. A simple framework (Figure 1), adapted from the Diderichsen model (Diderichsen & Hallqvist 1998; Diderichsen, Evans & Whitehead 2001; Solar & Irwin 2007), helps to identify social determinants of health and the pathways that contribute to health inequities.
Figure 1. Commission on Social Determinants of Health (CSDH) framework linking social determinants of health and distribution of health
Source: WHO 2008 (p 43).
Key questions that should be described in relation to each of the four "blocks" found in the framework can be summarized as:
Advanced Preliminary Web Version 22 November 2010 5

1) Socioeconomic Political Context: What are the main characteristics of a country that influence the form and magnitude of social stratification as well as the implications of stratification for the circumstances in which people live and work?
2) Social Stratification: What are the key dimensions of social stratification? How extensive is the social stratification?
3) Differential exposures, vulnerabilities, and consequences: What is the extent of (a) differential vulnerabilities, (b) differential exposures, and (c) differential consequences? The differential exposures (e.g. ineffective services) and consequences (e.g. financial burden), in the way individuals interact with social systems, such as health care or education, is part of this block.
4) Differential outcomes in health: What are the main resulting health inequities that emerge in a given society and what is the extent of these health inequities?
This conceptual framework served as the departure point on how to "operationalize" or make concrete monitoring and assessment, with the initial purpose of describing levels and potential linkages across components within national settings or for population sub-groups. This framework can therefore be used to identify indicators for monitoring and evaluation, to enable both qualitative and quantitative assessment of the state of social determinants of health and linkages to health inequities.
1.4 Understanding and documenting social determinants of Indigenous peoples' health.
To truly understand the challenge of recovery, complete and accurate data on Indigenous people are needed within these domains for several reasons. These include to monitor progress towards the goal of health equity, to serve as inputs to policy discussions and decisions with a wide range of stakeholders, and to keep governments and organisations accountable for forward movement, including progress on policy targets and related objectives and goals.
That being noted, achieving and demonstrating accuracy in identification and measurement of Indigenous health status across these key domains is an enormous task, with challenges and opportunities varying within and across countries.
Australia, New Zealand, the United States and Canada share a common language, have well established statistical systems to be able to explore and report on what is happening on the ground and enjoy a long history of collaboration with each other. Despite this, there are clear indications that each country experiences significant problems in the collection of accurate data on Indigenous peoples as a whole, and on health in particular. There is clearly the need to improve communication between statistical and health data collectors and agencies and Indigenous representative groups and advisors.
1.5 Collaboration as one important way forward
The International Group of Indigenous Health Measurement (IGIHM), comprising individuals and groups from Australia, Canada, New Zealand and the US was established in an effort to improve definitions, upgrade the quality of collection and uses of health data and information with colleagues in the other countries who experience the same issues. It is agreed that high-quality data are fundamental to understanding the causal mechanisms which underlie health disparities in our peoples.
Advanced Preliminary Web Version 22 November 2010 6

Since 2004, there have been multiple meetings, each dedicating itself to the many issues in advancing health data. The IGIHM invited the WHO’s contribution to its third meeting in Kona, Hawaii in 2008. Since then, the WHO has participated in our meetings as an active participant. Technical discussions between the IGIHM and WHO concluded that data on health systems and indigenous peoples -- including health systems financing and indigenous peoples, pertinent to this paper -- is incomplete even in these high four income countries. One aim of the World Health Report of 2010, is to provide examples and discussions options on how low, middle and high income countries can finance health systems so that they can move more quickly towards the goal of universal coverage. It was clear that the experiences fostered by IGIHM to improve methods, sharing of data, and moving forward collaboratively across the four countries, could contribute to the aims of the World Health Report, and at the same time benefit Indigenous peoples in other countries. Following our initial meetings is was then agreed that the IGIHM support the historic inclusion of – for the first time in history – an examination of Indigenous health within these four countries as a background paper to the WHO's annual World Health Report.
1.6 Universal coverage of all Indigenous peoples -- without financial hardship
While all blocks in Figure 1 are critically important, the intended focus of the four country specific papers is on the health system (within block 3 in Figure 1) and in particular, the approach to financing services (spanning from preventive to palliative care, at the population, community, household or individual level) and the pooling of financial risk, so that financial barriers to gain access to effective services, potentially faced by Indigenous people, are minimized or eliminated. Access to effective services, is what WHO has named as coverage, and universal coverage means that all people can access health services that they need, and that these services are effective. Moving towards the goal of universal coverage also means in practice reducing health inequities particularly within countries.
The added dimension is that all people should benefit from universal coverage while being protected against financial hardship associated with paying for this care, either through out of pocket payments, insurance premiums, or other ways that governments raise revenues to pay for health services or health services providers collect fees. This does not imply that care is free, but does mean that governments should steward an approach to finance health systems that is progressive, inclusive and effective. Taking on a social determinants approach also means not limiting an analysis to proximate risk factors, such as behaviours and lifestyles, which is the current paradigm that is expressed by the "individual risk factor" approach to improve health. Instead, a broader perspective on what are the "causes of the causes" is needed to address the underlying social (and economic, etc.) determinants.
Therefore, documenting current approaches to finance health services for indigenous populations and eventually developing options to extend coverage to indigenous populations and/or reduce financial barriers, addresses institutional or systems issues that could lead to reducing health inequities. For Indigenous peoples, this broader approach must complement the existing emphasis on "risk factors, lifestyle or behaviours". Monitoring the implementation of expanded coverage and reduction in financial barriers, and the resulting distribution of health across population sub-groups, will add to the evidence base on ways to improve health equity.
Advanced Preliminary Web Version 22 November 2010 7

II. Summary
2.2 Overview
Prepared during 2010, this document includes four country-specific sections investigating Indigenous health, with an attempt to document available data on coverage and health financing, with each of these four sections led by Indigenous members of the IGIHM. A brief overview is provided, prior to the country specific sections.
The following set of papers highlight key strengths, issues and challenges surrounding data issues and sources, inequities in health status and health service access, current funding approaches to Indigenous health programs and services, policy which sets out future aims and explores how the outcomes of these should be monitored and evaluated. That being noted, the degree to which each paper discusses each of these focusing on Indigenous health, varies based on the available and valid data and evidence within Australia, New Zealand, the United States and Canada.
It is clear from the following papers, that despite their overwhelming growth in national wealth, each country struggles with the achievement of health equity within their borders. These wealthy countries enjoy many advantages in their capacity to address inequities, in health and other areas, and have the potential to ensure that each and every citizen enjoys the right to good health and that health inequities are systematically reduced.
The papers reveal that the drive to finance universal coverage among Indigenous peoples in each country poses major challenges to health systems that are not necessarily tailored to Indigenous people, who often have distinctly different needs from those of the non-indigenous or mainstream populations.
2.3 Shared contexts across the four countries
Some of the strengths and challenges given the overall context, are shared across countries; others are unique to a particular setting. Among those shared include:
• The diversity of language, culture and practise across Indigenous peoples within the countries. While this is a major source of strength and pride, it poses administratively the challenge that "one size doesn’t fit all" – what works for one Indigenous group, may not work for another.
• The small proportion of the total population of these countries that are correctly identifed as
Indigenous, differs, ranging from 1.6% in the United States to 14% in New Zealand. There are also differences and distinctions in definitions of who is Indigenous and who is not, who are counted and who are not. There is also a large degree of geographic dispersion of Indigenous peoples, through growing urbanisation through to those geographically isolated into profoundly remote and isolated areas where services struggle to provide even the most basic of service, retain staff locally and ensure a consistent, appropriate level of care commiserate with need. Each of these differences is associated with different data collection and analysis approaches.
Advanced Preliminary Web Version 22 November 2010 8

• It hard to claim national voice based on numerical representation alone; however, voice is magnified through outstanding leadership in some areas, yet there is – and will probably be – never one voice that could possibly represent the needs of all Indigenous peoples in a given nation. It must be noted, that the voices of non-Indigenous peoples are represented through a process known as Parliament or Congress. The expectation of the mainstream that there be one voice only is not something that the mainstream itself holds to. The extent to which Indigenous peoples are represented in mainstream processes, is not the focus of this paper, yet it is an important consideration in the development of health policies, including health financing policies, that are not limited to leadership only within the health sector.
• Indigenous populations in all the countries are growing rapidly, including lower median ages,
higher death rates at younger ages and a higher child to adult dependency ratio, in comparison to non-indigenous populations. While bringing enormous energy and creativity to these populations, growing numbers of young people are in direct contrast to the aging, non-Indigenous populations. In other words, our populations are ‘youthing’ whilst the mainstream populations are ‘ageing’.
• Gaps between Indigenous and non-Indigenous citizens are not only clear in health status, but
also in socio-economic status, education, employment, environmental and social health and most other social determinants of health. This level of material disadvantage comes on top of persisting intergenerational grief and loss, some from the mainstream denial of the impacts of colonisation and others from harmful, dominating government policy. This means that the burden of disease, and requirement for appropriate health services commiserate with need, is likely to remain while these collective inequalities exist.
2.4 In practice, country specific
The ways of dealing with these differences between Indigenous and non-indigenous populations, is also reflected in different approaches to finance services for Indigenous and mainstream populations in each country. For example:
In the US where different funding streams for Indigenous Peoples Health exist through the Indian Health Service, it is not indexed to inflation, population growth, or salary increases (in contrast to other financing steams that are) which presents a situation of declining services in the face of growing need.
In New Zealand, public funding of health services exists only for child and adolescent oral health and for primary health care. Indigenous Peoples are less likely to use services when out of pocket payments exist due to socio-economic disadvantage.
In Australia, there are large differences in private health insurance coverage (15% of Indigenous peoples compared to 51% of non-indigenous peoples). Although per-capita Indigenous health expenditures are equal to or even greater than the national average, this is a relatively recent phenomena and does not adequately reflect the higher burden of illness for Indigenous people, and has only just begun to acknowledge or address the serious health disparities.
Advanced Preliminary Web Version 22 November 2010 9

As each of these countries is committed to achieving health for all citizens, these higher per capita Indigenous health expenditures will be needed for some time to correct for the unacceptably high burden of disease and mortality currently being experienced by Indigenous peoples.
Each country also uses different mechanisms to monitor the current situation. There is variation in how Indigenous peoples are identified, classified and enumerated in data sources and in the census. Not all countries consistently collect information on all of its Indigenous peoples, and while there are significant efforts being made to correct this, our present information is often incomplete and of poor quality, thus rendering some of it unusable or incomparable with future assessments. Moreover, the country specific reports show that data on health systems financing and indigenous peoples, is incomplete even in these high income countries. This lack of reliable data prevents clear recognition of where we are now, how policy and practice changes are affecting access to health care and resulting health outcomes, how the social determinants of health are changing and impacting and how quickly goals are being achieved.
2.5 Ways Forward to increase collaboration towards health equity
In each of the four countries, all Indigenous peoples have engaged with Governments over time. We (as in Indigenous peoples) know the issues and are aware of and are capable, if not leading, the solutions. All groups highlight the key mechanism for implementing solutions is through partnerships, collaboration, respect and relationships that are based on trust and multiple dimensions, one of which includes reciprocity. These are many ways relationships, and they take time, trust, love and respect to make happen and to sustain.
Improvement in data quality is mandated by this report, and includes identification of Indigenous people in birth and death records and hospital and health service information systems and all other associated data bases to better understand the health inequality solutions that exist and to justify and guide increased expenditures for our Indigenous peoples that are required to reduce them.
From our perspective, international recognition of what we are doing and of what we are asking for requires collaboration and support from the WHO and other important international groups and agencies.
Proposals for designation as a WHO Collaborating Centre in Indigenous health measurement are currently being developed and will join the other 900 such groups world wide. Of those 900 that currently exist, less than five have explicitly noted Indigenous Peoples or specific ethnic groups as part of their terms of reference. Furthermore the focus of these 900 Centers is on specific conditions, risk factors or diseases, rather than on more holistic issues or health and data measurement or metric.
A thriving and productive WHO Collaborating Center on International Indigenous Health would be beneficial, not only for Indigenous peoples of these four nations, but those living in all 70 countries globally.
Advanced Preliminary Web Version 22 November 2010 10
Introduction: References
Diderichsen & Hallqvist 1998
Diderichsen, Evans & Whitehead 2001
Solar & Irwin 2007.
WHO 2008. Commission on Social Determinants of Health Final Report. Geneva, Switzerland.
WHO 2009. World Health Assembly Resolution 63.14 "Reducing health inequities through action on the social determinants of health."
Advanced Preliminary Web Version 22 November 2010 11
III. Australia.
Authors: Lisa Jackson Pulver, Melissa R. Haswell and Ian Ring.
3.1 Introduction to Aboriginal and Torres Strait Islander Australia Aboriginal and Torres Strait Islander people are the First Peoples of Australia. Aboriginal people have been present on this continent for at least 50,000 to 70,000 years (Hudjashov et al., 2007). The colonisation and post-colonisation experience over the past 222 years devastated, but did not destroy, Aboriginal and Torres Strait Islander peoples and their cultures. The National Apology to the Stolen Generations in 2008 (Rudd 2008) gave many people hope that Australia has entered an era of change, recovery, and a re-discovery of its ancient heritage. If successful, the nation will re-emerge from a tragic past with an enhanced base of knowledge for decision making and action to face her many seen and unseen future challenges. Australia’s diverse peoples will - at last - have the opportunity to move forward with a collective yet respectful sense of belonging.
To achieve this, improvements in the health and wellbeing of Australia’s First Peoples must remain a national priority. However, achieving positive change, recovery of health and social equality requires clear application of Indigenous health principles and practices guiding the best of contemporary public health and primary, secondary and tertiary health care. This short chapter provides a snapshot of Aboriginal and Torres Strait Islander health status and service usage patterns and describes our current policy thrust towards better outcomes.
3.2 Basic demographics Australia has two major Indigenous groups, namely Aboriginal and Torres Strait Islander peoples, within and between which there is much diversity in origin, culture and world views, and different experiences of colonisation. Whilst comprised of 500 to 600 distinct groups, Australia’s First Peoples possess several unifying links. Among these are strong spiritual beliefs that tie people to the Land and Sea; a culture of storytelling and art; collectivist identity and, like other First Nations populations, a persisting legacy of inequality stemming from a devastating colonial history.
The words of Nyungar activist and writer, Mudrooroo, summarise clearly a part of the world view that characterises Australia’s First Nations peoples’ view:
Traditionally Aboriginal society is based on three major principles. The first of these is a powerful all encompassing religion. They believe that Aboriginal children are born of women but conceived of a spiritual source whose fonte is the land. And to them the land has two kinds of landscapes – one is physical, which all human beings can view. The other is spiritual, which only they can see. For Aboriginal people there is only one way to own land and that is to be conceived of it. Land is a parent. This very important principle prevents any kind of land aggrandisement, which has been the scourge of the rest of the world (Reynolds, 1989, pp. 88-92).
Further, Australia listened to and has since adopted a definition of Aboriginality based on individual and collective identity. Thus a working definition that is legally and widely accepted is:
An Aboriginal person is often defined legally as a person who is a descendant of an Indigenous inhabitant of Australia, sees himself or herself as an Aboriginal person and is recognised as Aboriginal by members of the community in which he or she live (Australian Institute of Aboriginal and Torres Strait Islander Studies, 2008).
Torres Strait Islanders are people who belong to the area today known as the Torres Strait Islands. These Islands are located in the waters that separate Queensland’s Cape York Peninsula and Papua New Guinea. Today, there are 18 island and two mainland communities with local governance structures and primary health care centres. A substantial number of Torres Strait Islanders live on mainland Australia outside of the Torres Strait region, with most residing in Queensland.
Advanced Preliminary Web Version 22 November 2010 12
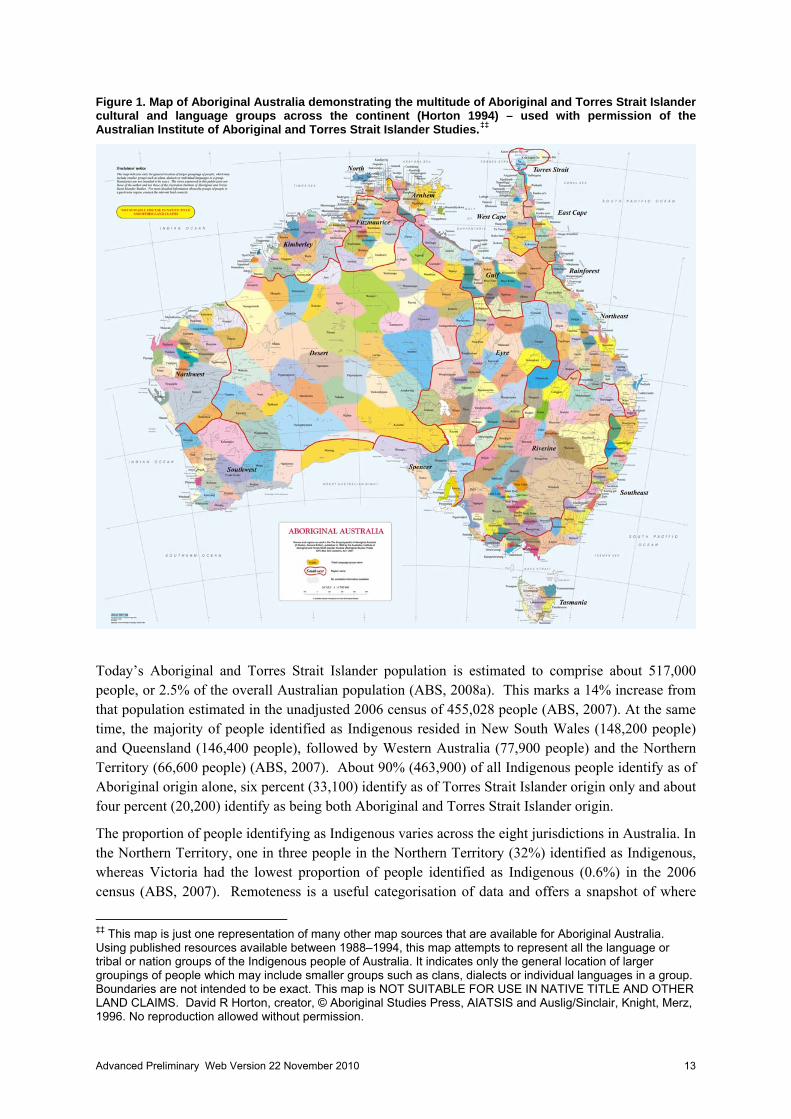
Figure 1. Map of Aboriginal Australia demonstrating the multitude of Aboriginal and Torres Strait Islander cultural and language groups across the continent (Horton 1994) – used with permission of the Australian Institute of Aboriginal and Torres Strait Islander Studies.‡‡
Today’s Aboriginal and Torres Strait Islander population is estimated to comprise about 517,000 people, or 2.5% of the overall Australian population (ABS, 2008a). This marks a 14% increase from that population estimated in the unadjusted 2006 census of 455,028 people (ABS, 2007). At the same time, the majority of people identified as Indigenous resided in New South Wales (148,200 people) and Queensland (146,400 people), followed by Western Australia (77,900 people) and the Northern Territory (66,600 people) (ABS, 2007). About 90% (463,900) of all Indigenous people identify as of Aboriginal origin alone, six percent (33,100) identify as of Torres Strait Islander origin only and about four percent (20,200) identify as being both Aboriginal and Torres Strait Islander origin.
The proportion of people identifying as Indigenous varies across the eight jurisdictions in Australia. In the Northern Territory, one in three people in the Northern Territory (32%) identified as Indigenous, whereas Victoria had the lowest proportion of people identified as Indigenous (0.6%) in the 2006 census (ABS, 2007). Remoteness is a useful categorisation of data and offers a snapshot of where
‡‡ This map is just one representation of many other map sources that are available for Aboriginal Australia. Using published resources available between 1988–1994, this map attempts to represent all the language or tribal or nation groups of the Indigenous people of Australia. It indicates only the general location of larger groupings of people which may include smaller groups such as clans, dialects or individual languages in a group. Boundaries are not intended to be exact. This map is NOT SUITABLE FOR USE IN NATIVE TITLE AND OTHER LAND CLAIMS. David R Horton, creator, © Aboriginal Studies Press, AIATSIS and Auslig/Sinclair, Knight, Merz, 1996. No reproduction allowed without permission.
Advanced Preliminary Web Version 22 November 2010 13

Aboriginal and Torres Strait Islander peoples in Australia reside. There are five specific categories of remoteness: major cities, inner regional, outer regional, remote and very remote.
The majority of Aboriginal peoples are residing in the major cities (31%), followed by outer regional, inner regional, very remote and remote (23%, 22%, 16% and 8% respectively). The majority of Aboriginal people in the Northern Territory are very remote dwellers, while in Victoria and South Australia, the majority reside in major cities. This marked variation in remoteness distribution across states and territories is illustrated in Table 1 (ABS, 2007).
Table 1. Proportional distribution of the Aboriginal and Torres Strait Islander population according to remoteness in each state and territory in 2006 (from ABS 2007).
Major Cities of
Australia Inner Regional
Australia Outer Regional
Australia Remote
Australia Very Remote
Australia
State/Territory % % % % %
New South Wales 42 33 19 4 1
Victoria 48 36 16 - -
Queensland 26 20 32 8 14
South Australia 48 10 23 5 14
Western Australia 34 9 15 15 26
Tasmania(c) - 52 44 2 1
Northern Territory(d) - - 19 18 63
Australian Capital Territory 100 - - - -
Australia (e) 31 22 23 8 16
- nil or rounded to zero (including null cells)
(a) Usual Residence.
(b) Remoteness calculated using best fit of 2006 Collection Districts with 2001 Remoteness Areas. Data may change with release of 2006 Remoteness Areas.
(c) Hobart is classified as Inner Regional Australia.
(d) Darwin is classified as Outer Regional Australia.
(e) Excludes Other Territories. See Glossary.
Advanced Preliminary Web Version 22 November 2010 14

3.3 Short history on the collection of data and Indigenous identification
Most of the epidemiological understanding of the health status of Aboriginal and Torres Strait Islander peoples relies on routine health data collections held at each jurisdiction and nationally. It was not until 1973 that health ministers endorsed a policy of collecting national Indigenous health statistics. A report commissioned by the Commonwealth Department of Health titled, Aboriginal Health statistics in Australia: a survey and a plan provided a blueprint to systematically collect Indigenous health statistics (Smith, 1978). Broad consensus was reached in the mid-1980’s on the importance of collecting Indigenous statistics in key collections, including those that recorded and registered births and deaths, maternal and perinatal separations and hospital record databases (Thomson, 2003).
Even today, Indigenous health statistics are often not available or are of too poor a quality to be used with confidence (Couzos & Murray, 2003; Supramaniam et al., 2006), although the situation is improving. Western Australia, South Australia and Northern Territory have better recording of Indigenous status than other jurisdictions, while Tasmania, Victoria and the Australian Capital Territory generally have the worst. As a result, the reporting of national Indigenous mortality statistics are largely based on data collected from Western Australia, Northern Territory and South Australia for long term trends, but include data from New South Wales and Queensland for the current period. For hospital data the statistics are based on Queensland, Western Australia, South Australia and the Northern Territory for long term trends, but include New South Wales and Victoria for the current period. ).
The primary reason for unreliable Indigenous health data is the incomplete identification of Aboriginal and Torres Strait Islander peoples in national and jurisdiction data collections. It is clear from the working definition of just who is an Aboriginal and Torres Strait Islander person, that identification by front line health and admissions staff cannot be assumed as correct as many of these people make a judgement from the appearance of the person before them alone.
A better method requires staff to ask the question, “Are you an Aboriginal or Torres Strait Islander person?” In many cases this basic question is either not asked, or staff simply refuse to ask (ABS, 2002; Jackson Pulver et al., 2003). This is why, as simple as it sounds, we can’t get accurate measures of magnitude of illness within the population, and it is difficult to determine if mortality and morbidity rates are improving or worsening, or to what extend Aboriginal and Torres Strait Islander peoples are accessing mainstream health services, primary health care and other general practice services.
Data quality and utility of collected information are also affected by small sample sizes and incident case numbers, unreasonably wide confidence intervals, reliance upon demographic and statistical data of limited accuracy and use of ‘best estimates’ where data are lacking.
Finally, only recently has attention been focused on the assessment and creation of metrics to measure factors such as social and emotional wellbeing, identity, empowerment and sense of belonging, cultural strength and recovery from and healing of intergenerational trauma – all factors which underlie many of the behavioural risks associated with mortality, morbidity and other health measures (AIHW 2009a; Haswell et al., 2010). Without validated measures, it is not possible to include these in the administrative picture of Aboriginal and Torres Strait Islander health. These are important measures – which will over time – add to our ability to better analyse and interpret Aboriginal and Torres Strait Islander health information and data.
3.4 Population in recovery An estimated seven hundred and fifty thousand to one million Aboriginal people lived on the Australian continent in 1788 (Franklin & White, 1991; Madden & Jackson Pulver, 2009). There is
Advanced Preliminary Web Version 22 November 2010 15

little evidence of widespread illness or disease in the Aboriginal and Torres Strait Islander population pre-colonisation (Kunitz, 1990 & Kunitz, 1994), and it is unlikely that Aboriginal and Torres Strait Islander people suffered from the lifestyle diseases that are endemic today (AIHW & ABS, 2005).
European settlement led to an enormous and rapid loss of life. Population fell to around 120,000 (plausible estimate) in the 1920s and 1930s (Madden and Jackson Pulver, 2009). Today’s Aboriginal and Torres Strait Islander population of over half a million people remains well below pre-settlement levels. The high rates of disease and fatalities in communities facilitated the fragmentation of every aspect of Aboriginal society (Saggers & Gray, 1991; Reynolds, 1989).
The depth of grief and loss that was experienced by Aboriginal people in those early days remains a persistent shadow in today’s world - where factors that influence Aboriginal health relate directly to the history of colonisation and have been reinforced by subsequent government policies. These policies included the confinement of Aboriginal people on mission settlements; dispossession from ancestral land (otherwise known as ‘country’); banishment from country as punishment for misdemeanours and perceived wrongs and widespread policy of forcible removal of Aboriginal and Torres Strait Islander children (often referred to as the Stolen Generations) (Human Rights and Equal Opportunity Commission 1997). Many other activities designed to facilitate assimilation of Aboriginal and Torres Strait Islander peoples into the colonised Australian world caused further disempowerment and disadvantage that continues to impact negatively on Australian society today. Figure 2. Population pyramid comparing age distributions of Indigenous and non-Indigenous Australians by gender (ABS 2006).
Today the population pyramid of Aboriginal and Torres Strait Islander Australians (Figure 2) provides evidence of a population in recovery. Striking differences are seen. Compared to the ageing non-Indigenous Australian population, young Aboriginal and Torres Strait Islander people represent a much larger proportion of the population. Median age is markedly low; fertility rates are higher and dependency ratios are higher among Indigenous Australians.
A significant move towards reconciliation and recovery for Australia was taken in February 2008 with the National Apology to Australia’s Stolen Generations and their families and communities delivered by then Prime Minister Mr Kevin Rudd. This apology is widely viewed as an essential step towards healing, not only of members of the Stolen Generations and their families, but to the broader Australian nation as a whole. It must be remembered however, the apology was only one of 52 recommendations in the seminal Bringing Them Home report (Human Rights and Equal Opportunity Commission 1997) needed to achieve just reparation for the human rights abuses endured by the
Advanced Preliminary Web Version 22 November 2010 16

individuals, families and communities affected by these policies that resulted in the Stolen Generations. We await movement on the substantial components of the remaining recommendations.
Since the 1970’s, some of the strongest advocates for health equality for Aboriginal and Torres Strait Islander peoples have come from within the medical profession. For example, the Royal Australasian College of Physicians (1997) and the Australian Medical Association (2005) apologised for the medical profession’s support and contribution to the policies of forced removal of Aboriginal and Torres Strait Islander children from their families. Both organisations have adopted many pro-active and specifically targeted policies in Indigenous health. Both organisations are also active members of the Close the Gap coalition (see below).
3.5 Health Inequalities There has recently been a high level of political and media attention, in Australia and overseas, to the large gap in life expectancy between Aboriginal and Torres Strait Islander peoples and non-Indigenous Australians. Up until recently, estimates showed that , on average, Aboriginal and Torres Strait Islander people born would have expected to live lives 17 years less than their non-Indigenous counterparts (AIHW & ABS 2008). In 2009, ABS changed its methodology and reported that in 2005-2007 Aboriginal and Torres Strait Islander life expectancy was estimated to be 11.5 years lower for Indigenous males and 9.7 years lower for Indigenous females (ABS 2009). It must be noted that these changes in life expectancy reflect only a change in methodology in the derivation of these estimates. While debate continues on the extent of the life expectancy gap (Madden et al, 2010), it is generally accepted that gaps between Indigenous and non-Indigenous peoples in life expectancy (Ring & Brown, 2002; Bramley et al., 2004) and the United Nations Human Development Index (Cooke et al., 2007) are unacceptably large in New Zealand, Canada and the United States, and particularly so in Australia (Figure 3). Figure 3. Population pyramid comparing the proportional distribution of deaths stratified by age and gender among Aboriginal and Torres Strait Islander Australians versus non-Indigenous Australians (ABS 2006).
Aboriginal and Torres Strait Islander men and women experience death rates at least two and often many more times higher than those of the general population (AIHW & ABS, 2003, 2005 & 2008). The disparities within age groups are even more alarming, with age-specific death rates of middle-
Advanced Preliminary Web Version 22 November 2010 17

aged Aboriginal and Torres Strait Islander people (35-44 and 45-54) being five to six times higher than those of non-Indigenous counterparts (AIHW & ABS, 2008).
Cardiovascular disease was the leading single cause of premature death overall accounting for one quarter of the total 12,573 years of life lost (YLL) due to disease and injury in 2008. Cancer caused 14 percent of YLL, followed by unintentional injuries (11%), intentional injuries (9%) and diabetes (7%) (AIHW & ABS, 2008).
Aboriginal and Torres Strait Islander people are experiencing problems at higher incidence rates and at younger ages than the general population. Many continue to experience multiple risk factors for both physical and mental illness, poor access to health services and environmental conditions that promote, rather than prevent, the spread of infectious disease especially among children. Not surprisingly, the rise of chronic diseases and suicide deaths amongst Aboriginal and Torres Strait Islander Australians has been remarkably rapid. From being practically absent two to three generations ago, the majority of excess deaths are now due to chronic diseases, notably respiratory and circulatory diseases, endocrine, metabolic and nutritional diseases and cancer (AIHW & ABS, 2008).
Health services have focused on transitioning their approach and pathways of care to emphasise long term management of chronic physical diseases for over a decade. This, combined with improved medications and drug therapy, has helped identify problems earlier and reduce complications and hospitalization rates in some groups. Less effort has addressed the rapidly rising disability associated with mental disorders and alcohol and drug use (which are also chronic, recurring and debilitating) that is evident in the World Health Organisation’s Burden of Disease studies (WHO, 2009).
Aboriginal and Torres Strait Islander infant mortality and early childhood health has improved since the 1960s, but there is still a significant relative disadvantage for Aboriginal and Torres Strait Islander infants and children (Thomson & Ali, 2003). For WA, SA and the NT, longer-term trends suggest that the mortality rate for Aboriginal and Torres Strait Islander infants decreased by 47% between 1991 and 2006 compared to a reduction of 34% for non-Indigenous infants, and there was a significant closing of the gap. For the period 2002-2006 Indigenous infant mortality rates were 3 times the rate for non-Indigenous infants (AHMAC 2008, p64).
While in recent years chronic diseases have arisen to become the main focus of health promotion activities, prevention and early intervention efforts, the burden of chronic infectious diseases, while not often a cause of mortality, remains highly significant (Couzos & Murray 1999; ABS & AIHW 2003; 2008). The high prevalence of bacterial and viral infections of the ear, respiratory and gastrointestinal tract, skin and mouth, combined with poor nutritional status, place an enormous burden on child growth, development, enjoyment and participation in recreational activities and learning opportunities (ABS & AIHW 2003; 2008).
Infections are acquired early and experienced repeatedly in childhood because of the poor social and environmental conditions that persist in many contemporary Aboriginal and Torres Strait Islander settings (Pholeros et al., 1993; Couzos & Murray 1999; Bailie et al., 2010). These conditions include overcrowded housing, poor ventilation, inadequate clean water and appropriate sanitation, non-functioning health hardware including cooking and food storage facilities and typically substandard (high energy, low nutrient) and expensive food supply, household wet areas (showers, kitchen sinks and laundry facilities). Put simply – the treatment of infections without interrupting transmission sources leads to reinfection.
It is also acknowledged that unhealed loss and trauma linked to poor social and environmental health conditions underlie most of the above-described inequalities in health and illness (King, Smith & Gracey, 2009). Chronic, insufficiently addressed problems persist in environmental health and household infrastructure, drug and alcohol abuse, access to recreational facilities, effectiveness of services, and health education efforts that stymie prevention. These illnesses are recognised globally as markers of poverty and poor access to services (WHO, 2002).
Advanced Preliminary Web Version 22 November 2010 18

3.6 Self-determination & Aboriginal Community Controlled Health Organisations (ACCHOs) The need for a different health service delivery model that could better address the needs of Aboriginal and Torres Strait Islander Australians has been long and widely recognised and major progress has been achieved in making this a reality. From their beginnings in 1971, Aboriginal Community Controlled Health Services (ACCHO’s) have been initiated, planned and managed by local Aboriginal and Torres Strait Islander communities, aiming to deliver high quality holistic and culturally appropriate health care. They are also known as Aboriginal Medical Services or AMSs. Today, a national network of over 140 Aboriginal Community Controlled Health Organisations is operating across Australia in all states and territories, which provided in 2003/2004, about 1.6 million episodes of comprehensive primary health care. ACCHO’s are designed to create positive, culturally secure environments where Aboriginal people can receive comprehensive care.
Aboriginal people, sick and tired of the failure of the Australian health care system to provide services that were appropriate, acceptable, affordable, accessible and participatory, founded the first AMS in Redfern in 1971. The AMS in Redfern provided Aboriginal people with a community owned and culturally secure health care service that addressed their health needs within a holistic framework (Foley, 1975). A watershed in Aboriginal and Torres Strait Islander health and politics, its philosophy of community control and participation in the delivery of primary health care paved the way to alternative approaches to address health care issues (Bell et al., 2000).
Primary Health Care and Aboriginal Community Controlled Health Organisations (ACCHO’s) are pivotal to improvements in Aboriginal and Torres Strait Islander health. It is important to note that they did not spring up in isolation but arose out of the political struggle for Aboriginal and Torres Strait Islander self-determination. ACCHO’s have developed state, national and, in some cases regional representative and resource bodies to improve policy formulation and resource allocation for their communities. The National Aboriginal Community Controlled Health Organisation (NACCHO) is the peak body of community controlled health organisations (Bell et al., 2000).
There is no such entity as a generic Aboriginal Medical Service. ACCHOs are distinct, independent local health services owned and run by local Aboriginal and Torres Strait Islander communities according to their needs and priorities. ACCHSs are planned and managed by a health committee elected from their local Aboriginal and Torres Strait Islander community. Board members are also elected to be members of State/Territory based ACCHO’s. These organisations are independent of, but affiliates of, the national peak body representing Aboriginal Community Controlled Health Services, NACCHO.
Adopting a horizontal management structure, ACCHO’s are controlled by their local Aboriginal and Torres Strait Islander community through their elected Board of Directors, with advice provided by salaried doctors and other health professionals in their employ. This contrasts with hospitals and community health services that are part of a state-wide service structure with management hierarchies (Bell et al., 2000).
Since their establishment, ACCHO’s have demonstrated their ability to provide effective, appropriate, acceptable, affordable and accessible health services to Aboriginal and Torres Strait Islander people (NAHSWP, 1989; Bell et al., 2000). Copeman (1980) showed a rapid reduction in paediatric hospitalisations after the establishment of an ACCHS. Despite the expansion of ACCHO’s, however, they are far from sufficient in size and resources to meet the enormous demand. It thus remains imperative that there be a capacity building plan for ACCHO's and also that Aboriginal and Torres Strait Islander people have equity of access to appropriate mainstream health care services and programs.
Advanced Preliminary Web Version 22 November 2010 19

Aboriginal community-controlled and mainstream primary health care centres are at the forefront of Aboriginal and Torres Strait Islander health care in Australia and clearly have the potential to play a pivotal role in correcting health inequalities. Primary health care services deliver on care across the spectrum, from health promotion, prevention, early detection and intervention and quality treatment and rehabilitation support.
3.7 Access to health services Despite the crucial advances in health services, recognised inequalities persist across every measurable domain, including health and wellbeing, education and social with these impacting on how Aboriginal and Torres Strait Island people access quality health care and on how health care is ultimately financed. Barriers to access of appropriate health care and the nationally subscribed initiatives Medicare and the Pharmaceutical Benefits Scheme (PBS) schemes are recognised as having a profound effect on Aboriginal and Torres Strait Islander health and well being (NAHSWP, 1989; RCIADIC, 1991). In 2002, Medicare established a system where people are able to voluntarily identify themselves as an Aboriginal and/or Torres Strait Islander person in the Medicare database. At 1 November 2010, 51.4% of the estimated Aboriginal and Torres Strait Islander population in Australia had identified themselves. There is considerable age-related variation in identification, with a large number occurring at birth or early childhood, leading to an estimated 92.4% of children aged 0-4 being identified as compared to 41.8% of those aged 55 and over. (AIHW 2010).
John Deeble (2009), one of the architects of Medicare, recently observed that in comparison with service access of other Australians, Aboriginal and Torres Strait Islander people are:
• High users of public in-patient and out-patient hospital services, transport and public health;
• Low users of medical, pharmaceutical and dental services; and
• Very high users of community health services.
One way of conceptualising these differences is to recognise the obvious in the departure from the non-Indigenous health service pyramid:
Advanced Preliminary Web Version 22 November 2010 20
Information on use of primary health services by Aboriginal and Torres Strait Islander people comes from health surveys – such as the National Aboriginal and Torres Strait Islander Health Survey (NATSIHS) (ABS 2006) – and from data collected through the use of Medicare - yet these show different patterns of use.
The NATSIHS (ABS 2006) shows 10% higher self-reported visits to general practitioners or specialists by Aboriginal and Torres Strait Islander people compared to self-reported visits by non-Indigenous people. Self-reported rates for visits to casualty and hospital outpatients units were two and a half times as high for Aboriginal and Torres Strait Islander people. Self-reported visits for dental consultations were about 40% lower for Aboriginal and Torres Strait Islander people when compared against visits by non-Indigenous peoples. In 2004-05, 15% of Aboriginal and Torres Strait Islander people reported that at some time in the last 12 months they did not go to a doctor when needed, 7% did not go to a hospital when needed, and 21% did not go to a dentist when needed. A higher percentage of Aboriginal and Torres Strait Islander people in non-remote areas reported not accessing care when needed than in remote areas. Reasons for not accessing care vary by remoteness with cost being an important factor in non-remote areas and transport/distance and availability of services being factors in remote areas (AHMAC 2008).*
Self-reported data however may be influenced by incomplete or inaccurate recall, telescoping and other issues and data from the Medicare system may therefore give a more accurate picture, although it too has its limitations. Deeble (2009) recently compared data of people who identified as Aboriginal and Torres Strait Islander people and use private GP services under the Medicare system with those who use services provided through an Aboriginal Community Controlled Health Organisation (ACCHO). Deeble (2009) estimates that over 60% of the estimated Aboriginal and Torres Strait Islander population can be identified through these services.
He found that -
On average, Indigenous people do not use primary care services as much as the non-Indigenous population;
In the VII (GP services) sample, for which we have full information, the proportion who ever see a doctor was lower and the frequency with which they visit doctors was less;
The pattern is not uniform. The largest difference is in the care of children under five years of age and, to a lesser extent, in the five to 14 age group;
For almost all other Indigenous people, age-specific usage rates are higher than for other Australians and the differences reflect the pattern of illness which leads to Aboriginal people dying at younger ages than non-Indigenous people;
For people aged 65 years and over, non-Indigenous use is higher but very few Aboriginal people live that long;
Indigenous use of specialist services through Medicare is very much lower than for non-Indigenous people.
The overall impact of these differences is difficult to judge because of their heavy reliance on hospital-based specialist treatment outside the Medicare benefits system but it must have some influence on out-of-hospital care. Additionally, the 2006-07 health expenditure data referred to on Table 4 shows that while per capita expenditure on GP-type services is lower for Indigenous Australians, per capita expenditure on all primary care services is 29% higher for Indigenous Australians. Furthermore this is believed to be a rapidly changing situation and it is expected that further published documents will emerge over time.
Advanced Preliminary Web Version 22 November 2010 21

Deeble (2009) concludes that, for data limited to the doctor services for which Medicare pays benefits and does not include the primary care within hospital emergency services -
on the criterion of equity of access, the present levels of primary care use by adults would not appear to be grossly unfair or inadequate;
From 15 years of age, Indigenous use per person was between four per cent and 28 per cent higher than for other Australians;
Amongst people who had voluntarily identified, the proportion who saw a doctor at all was lower, though not dramatically so, but those who did attend did so more frequently than the average;
However, Indigenous usage never reached the level of non-Indigenous people in the age groups when the non-Aboriginal death rate was highest (75 years and more);
In both respects, the position was quite different for children with use significantly lower for all up to age 14, particularly those aged under five.
Data for the Aboriginal Community Controlled Health sector suggested an almost identical result, although in both the ACCHOs and the State-provided services, nurse care was a viable alternative. Despite this, the data clearly understates the overall volume of primary care delivered through the Aboriginal Community Controlled Health sector.
Deeble's main conclusion was that:
On access grounds alone, raising both the coverage of children and their service use would thus appear to be the first priority and, because of its preventive content, that should contribute to more equal outcomes as well.
Deeble (2009) also highlighted the much lower use of specialist services by Aboriginal and Torres Strait Islander people particularly given the high levels of complex chronic conditions.
Another way of considering inequalities in access is through examination of expenditure data. The most recent Expenditure Report by the Australian Institute of Health and Welfare 2009 (AIHW 2009b) showed that overall expenditure on Aboriginal and Torres Strait Islander people for health and high care residential aged care services was 1.2 times that of the population as a whole, but that level of expenditure was clearly inadequate given the much higher (two to three times higher) levels of illness in the Aboriginal and Torres Strait Islander population. In critical areas, medical services and medications, expenditure was substantially lower for Aboriginal and Torres Strait Islander people than for the population as a whole (0.52 and 0.4 respectively).
Table 4 (reproduced from Table 5.2 in AIHW 2009b), shows lower expenditure for both primary and secondary/ tertiary services for medical, dental, and other professional services including medications. Levels of expenditure on hospitals were higher but probably lower than required for level of need.
Advanced Preliminary Web Version 22 November 2010 22

Table 4 Expenditure per person on primary and secondary/tertiary health and high care residential aged care services for Aboriginal and Torres Strait Islander and non-Indigenous people, 2006–07 (Table 5.2 from AIHW 2009b).
Primary expenditure ($ per person)
Secondary/tertiary expenditure ($ per
person)
Area of expenditure Indigenou
s
Non-Indigeno
us Rati
o Indigenous
Non-
Indigenous Ratio
Total hospital services 325.6 211.1 1.54 2,512.7 1,443.5 1.74
Admitted patient services . . . . . . 2,199.4 1,302.3 1.69
Non-admitted patient services 325.6 211.1 1.54 313.3 141.2 2.22
Patient transport 110.9 16.4 6.75 110.9 65.7 1.69
Medical services 341.5 524.7 0.65 81.1 287.9 0.28
Dental services 139.5 278.8 0.50 . . . . . .
Other professional services 21.4 79.8 0.27 21.4 79.8 0.27
Community health services 1,186.7 182.0 6.52 . . . . . .
Public health 212.2 83.5 2.54 . . . . . .
Medications 224.4 508.5 0.44 23.1 104.5 0.22
Aids and appliances 36.5 122.4 0.30 3.8 25.2 0.15
Total health (a) 2,598.7 2,007.3 1.29 2,753.0 2,006.5 1.37
High care residential aged care . . . . . . 81.8 373.6 0.22
Total health and high care residential aged care (a) 2,598.7 2,007.3 1.29 2,834.8 2,380.2 1.19
(a) Excludes expenditure on research, health administration and other health services. Source: AIHW health expenditure database.
The effect of these shortfalls in access to services is particularly evident for the major cause of death and the major contributor to the life expectancy gap – coronary heart disease (CHD), where despite higher illness levels there are lower rates of therapeutic interventions.
Key findings of a report on the health status and treatment of Aboriginal and Torres Strait Islander people with coronary heart disease showed that Aboriginal and Torres Strait Islander Australians had three times the rate of major coronary events such as heart attack and 1.4 times the out-of-hospital death rate from CHD, and when in hospital more than twice the in-hospital CHD death rate but had a 40% lower rate of being investigated by angiography, a 40% lower rate of coronary angioplasty or stent procedures and a 20% lower rate of coronary bypass surgery (AIHW 2006).
Advanced Preliminary Web Version 22 November 2010 23
After experiencing a major coronary event, Aboriginal and Torres Strait Islander Australians were more likely to die without being admitted to hospital (rate ratio of 1.4) for treatment. If admitted to hospital for CHD, Aboriginal and Torres Strait Islander Australians were over twice as likely to die (rate ratio of 2.3) than other Australians but were 40% less likely to receive percutaneous coronary interventions (PCI) and 20% less likely to receive coronary artery bypass graft surgery (CABG) (age-adjusted rate ratio of 0.6 and 0.8 respectively) as other Australians.
In 2002–2003 Aboriginal and Torres Strait Islander people with CHD were less likely to undergo a coronary procedure across all levels of complexity. The largest difference in procedure rates between Aboriginal and Torres Strait Islander Australians and other Australians occurred in the least complex groups (no or 1–2 comorbidities present). In these groups, Aboriginal and Torres Strait Islander Australians were (rate ratio 0.6) just over half as likely to have a coronary procedure.
As indicated below, in response to these continuing inequalities in outcomes and access to health services, the Australian government and its state and territory counterparts have recently instituted a series of policy reforms and much higher levels of expenditure for Aboriginal and Torres Strait Islander people for health and other services
3.8 What do these service access patterns mean? At first glance, the large quantity of community health service use by Aboriginal and Torres Strait Islander Australians, combined with a lower use of medical and pharmaceutical care (mid-level) care could seem to be a positive finding. The high use of Aboriginal Community Controlled and government community health services no doubt reflects the presence of these services, particularly in remote areas and the cultural accessibility of ACCHO’s in particularly in urban areas. However it also probably reflects very high repeated use brought about by two main reasons. One is the fact that health care has limited sustainable impact in the face of poor environmental and social health conditions in which many Aboriginal and Torres Strait Islander Australians live.
Statistics demonstrate that the low level of medical/dental/ pharmaceutical care is anything but an indication of a low level of need at secondary care. In fact, the high hospitalisation and mortality rates confirm an extremely high level of unmet need.
In a submission to the House of Representatives Standing Committee on Family and Community Affairs (2008), the National Aboriginal Community-Controlled Health Organisations identified the barriers impeding Aboriginal and Torres Strait Islander people’s access to health services. These can be summarised as:
• economic barriers – many Aboriginal people, who experience life-long economic disadvantage, cannot afford doctor and PBS co-payments and such invisible costs such as having a home phone to make appointments or enquiries or travel costs.
• physical or geographical barriers – many communities in rural and remote areas simply do not have local access to GPs, specialists, pharmacies and hospitals. Even for communities on the fringe of major urban concentrations, ready access to practices that bulk-bill, and a range of specialist and allied health services, may be severely limited. Remote area primary health centres, which provide services to over one quarter of Aboriginal and Torres Strait Islander population (compared to just 2.3% of non-Indigenous Australians) face severe distance challenges in the provision of high quality care, especially given the complex presentations they are faced with as a result of poor living conditions.
• administrative barriers – when people are struggling economically, or when their lives are in chaos connected to illness, unemployment, lack of education, incarceration of a family member, or other disadvantage, they may neither procure, nor carry current Medicare and health care cards.
Advanced Preliminary Web Version 22 November 2010 24
• cultural barriers – a simple, but widespread, example would be the reluctance of many to enter an unfamiliar (and possibly unwelcoming) non-Aboriginal service.
Other key reasons for poor utilisation of mainstream health services by Aboriginal people include a lack of General Practitioner (GP) outreach clinics; GP’s poor understanding of Aboriginal culture; an insufficient number of GPs bulk-billing; and the feeling of being unwelcome in General Practices (Andrews et al., 2002). It is important to stress, however, that there are also many positive encounters between non-Indigenous health professionals and Aboriginal people. The nature of clinical encounters is highly complex and success depends on a range of critical communication and personal factors.
A serious problem facing Aboriginal-focused primary health care services is workforce recruitment and retention. This can lead to services resorting to a constant stream of agency staff that is not committed to developing long term relationships with clients or service improvement. Poor communication and internet access, substandard environmental health infrastructure, severe housing shortages and maintenance problems, extreme weather conditions in some settings that regularly prevent inward and outward movement, minimal economic opportunity, public transport and food and goods supply, continue to plague these services (Arkles et al., 2006). Access to General Practitioners, specialist doctors, dental services and nurses and sophisticated equipment and treatments is especially limited, particularly for those without private transport. Airplane-based medical and evacuation organisations help to fill the gap in emergency and some core health services in very remote areas.
Some community health services have made significant advances in enhancing cultural safety, with strong community engagement and consultation processes, an inviting environment, welcoming families, displaying of Aboriginal art and culture and recruiting Aboriginal staff (Eckermann et al., 2010; Hayman 2010). Remote communities associated with the Utopia region where communities and health services are decentralised, significantly lower rates of chronic disease and mortality have been observed (Rowley et al., 2008). Similar positive links between health and remoteness are also seen in the Torres Strait Islands, outstation settings and in some remote Western Australia and Northern Territory settings where ways of life have been less disrupted and cultural activities like bushtucker and caring for country practices remain strong in everyday life. This demonstrates that appropriately designed services can overcome remoteness issues and become part of the positive benefit of living away from urban centres. One essential ingredient in this success appears to be strong, respectful relationships within and between communities and their services.
Numerous reports now acknowledge the importance of providing health services for Aboriginal and Torres Strait Islander people that are culturally secure and free from all forms of discrimination. Failure to do this is in violation of basic human rights and a risk factor for poor health and wellbeing (RCIADIC, 1991; NAHSWP, 1989; HREOC, 1997; Jackson Pulver & Fitzpatrick, 2004; Aboriginal and Torres Strait Islander Social Justice Commissioner, 2005).
3.9 Major policy actions and solutions In 2005, the Social Justice Commissioner, Mr Tom Calma, asked for a commitment from all Australian Governments to commit reducing the inequality and achieve equality in health and life expectancy within a generation. Mr Calma and his Social Justice Report started the movement that is today seen as the “Close The Gap campaign”.
Over 40 Indigenous and non-Indigenous organisations and 130,000 plus Australian people have signed on and agreed to participate in the campaign.
In addition to two National Aboriginal and Torres Strait Island health summits, key outputs from the Close the Gap Coalition include a comprehensive set of targets to inform a national plan of action (Human Rights and Equal Opportunity Commission, 2008), a Shadow progress report (Close the Gap
Advanced Preliminary Web Version 22 November 2010 25

Steering Committee 2010a) and a policy paper on Partnership (Close the Gap Steering Committee 2010b).
According to the Close the Gap Coalition, two significant planks of the campaign are yet to be achieved:
• a new partnership between Indigenous Australians and their representatives and Australian governments to underpin the national effort to achieve Indigenous health equality;
• the development of an appropriately funded, long-term comprehensive national plan of action to achieve Indigenous health equality.
The Close the Gap campaign maintains its precedence of being a campaign about human rights. Internationally, the Close the gap campaign has contributed to many reports, including the World Health Organisation’s Commission on the Social Determinants of Health’s final report, Closing the gap in a generation: Health equity through action on the social determinants of health (2008).
The last few years have seen a fundamental shift in government policy towards Aboriginal and Torres Strait islander people, influenced at least partially by the Close the Gap campaign. At the 20 December 2007 COAG meeting, all Australian governments agreed to ‘a partnership between all levels of government to work with Indigenous communities to achieve the target of closing the gap on Indigenous disadvantage’.
The specific targets are:
• Close the gap in life expectancy between Indigenous and non- Indigenous Australians within a generation
• Halve the gap in mortality rates for Indigenous children under five by 2018 • Ensure access to early childhood education for all Indigenous four year olds in remote
communities by 2013 • Halve the gap in reading, writing and numeracy achievement for Indigenous children by
2018 • Halve the gap for Indigenous students in Year 12 or equivalent attainment rates by 2020 • Halve the gap in employment outcomes between Indigenous and non-Indigenous Australians
by 2018
On February 13, 2008, the Prime Minister offered in Parliament an Apology to Australia's Indigenous peoples. This was followed by a National Indigenous Health Equality Summit held in Canberra from 18 – 20 March 2008 which culminated in the signing of the Statement of Intent to Close the Gap by the Prime Minister, Leader of the Opposition, Government Ministers, heads of Aboriginal and mainstream health organisations and other key stakeholders, as well numerous states and territories. The Statement of Intent committed the signatories:
• To developing a comprehensive, long-term plan of action, that is targeted to need, evidence-based and capable of addressing the existing inequities in health services, in order to achieve equality of health status and life expectancy between Aboriginal and Torres Strait Islander peoples and non- Indigenous Australians by 2030.
• To ensuring primary health care services and health infrastructure for Aboriginal and Torres Strait Islander peoples which are capable of bridging the gap in health standards by 2018.
• To ensuring the full participation of Aboriginal and Torres Strait Islander peoples and their representative bodies in all aspects of addressing their health needs.
• To working collectively to systematically address the social determinants that impact on achieving health equality for Aboriginal and Torres Strait Islander peoples.
Advanced Preliminary Web Version 22 November 2010 26

• To building on the evidence base and supporting what works in Aboriginal and Torres Strait Islander health, and relevant international experience.
• To supporting and developing Aboriginal and Torres Strait Islander community-controlled health services in urban, rural and remote areas in order to achieve lasting improvements in Aboriginal and Torres Strait Islander health and wellbeing.
• To achieving improved access to, and outcomes from, mainstream services for Aboriginal and Torres Strait Islander peoples.
• To respect and promote the rights of Aboriginal and Torres Strait Islander peoples, including by ensuring that health services are available, appropriate, accessible, affordable, and of good quality.
• To measure, monitor, and report on our joint efforts, in accordance with benchmarks and targets, to ensure that we are progressively realising our shared ambitions.
2008 also saw a significant injection of funding into the effort, with $1.6 billion committed over four years. Tom Calma stated that –
this is a watershed moment in our efforts to close the life expectancy gap. Never have we seen such concentrated and determined effort from all governments working together. We applaud the emphasis from COAG on preventative health and access to primary care.
The Australian Government, in collaboration with state and territory governments, aims to improve access for Aboriginal and Torres Strait Islander peoples to effective health care services essential to improving health and life expectancy, and reducing child mortality (Council of Australian Governments 2007). This supports the Government’s broader commitments to close the gap between Aboriginal and Torres Strait Islander peoples and non-Indigenous Australians in health, education and employment. Two of these targets relate directly to the Health and Ageing Portfolio: to close the gap in life expectancy within a generation; and to halve the gap in mortality rates for Indigenous children under five years of age within a decade.
New funded programs aim to contribute to closing the gap in life expectancy and halving the gap in mortality rates for Indigenous children under five years of age within a decade through:
• preventing and managing chronic disease;
• improving access to maternal and child health services;
• improving access to effective primary health care and substance use services;
• improving social and emotional wellbeing services; and
• improving workforce capacity.
3.10 Council of Australian Governments (COAG) action. COAG is the forum where all Australian governments, national, state and territory, come together and formulate policy and action. Core to the Government’s commitment to closing the gap is the $4.6 billion COAG funding around national partnerships – and comprises:
• An additional $1.94 billion for remote Indigenous housing, taking total investment to $5.5 billion over 10 years
• $1.57 billion for Indigenous health over four years • $564.4 million for early childhood development over six years • $228.9 million for Indigenous economic development over five years • $291.2 million to improve remote service delivery over six years
Advanced Preliminary Web Version 22 November 2010 27

The Australian Government’s annual expenditure has increased to almost $1 billion, by 57 per cent, on Indigenous specific health programs since 2007–08 (Australian Government 2008). The Prime Minister also committed to providing annual progress reports at the opening of Parliament each year. The 2010 Report (Australian Government & Rudd, 2010) highlighted the fact that the National Apology to the Stolen Generations provided an opportunity for a shared future and a fresh beginning for all Australians, and cited three principles -
• A clear acknowledgement and recognition of previous wrongdoing and failed policies; • A practical commitment to closing the gap between Indigenous and non-Indigenous
Australians, setting specific targets and working in partnerships based on mutual responsibility and respect; and
• A commitment to transparency and accountability in measuring progress over time.
Acknowledgement of the policy shift is also indicated in that report where it is recognised, reported verbatim below,
“For decades, successive Commonwealth, state and territory governments have not faced up to taking responsibility for inadequate housing and services in remote communities. They have also provided inadequate health, education and community services to many Indigenous people in regional and urban areas".
The Government’s commitment to closing the gap is driven by three policy imperatives:
• Address decades of under-investment in services, infrastructure and governance; • Re-build the positive social norms that underpin daily routines like going to school and work,
and which foster community-led solutions; and, • Re-set the relationship between Indigenous and non-Indigenous Australians.
The Australian Government also committed $46.4 million (over four years) to improve the collection and reporting of Aboriginal and Torres Strait Islander people's health and other data by national agencies. Part of this money was allocated to the creation of a Closing the Gap Clearing House which will provide a information that has been evaluated on what has worked in the context of closing the gap.
3.11 Australia’s Conclusions Evaluation of health policy is complex – as there are many intervening variables between the writing and adoption of a policy, its implementation and the way that it plays out as an enhancement of people’s lives and health.
We require adequate data measuring the intervening steps between where we are now and where we want to be to ensure that we stay on track towards the well-defined goals.
Ultimately, policies will be judged by their impact and their ability to achieve and demonstrate outcomes. Aboriginal and Torres Strait Islander people have been subject to many Australian national and state government policies over the last two centuries; most or all have probably reflected “good intentions” of the times. However, many have caused harm while a few have achieved positive, measurable gain. Since the National Apology, the finely detailed Close the Gap initiative and the substantial funding attached, there has been renewed optimism in Australia that things are going to change for the better.
As we proceed, there must be a committed drive towards data collection that yields better quality and more reliable data. The official statistical agencies need to continue their efforts to improve data and to reconcile any differences that arise, so that policy development can be based on consistent, best practice estimates. This should include the measurement of aspects of health that Aboriginal and
Advanced Preliminary Web Version 22 November 2010 28

Torres Strait Islander people deeply value, such as healing, social and emotional wellbeing and empowerment. Consistent improvement in these currently poorly measured areas will be crucial for the sustainability of health advancement. We also need to be mindful of the discouraging artefacts of data improvement, i.e. correcting current underestimations may temporarily suggest that things are getting worse rather than better. This, however, is an acceptable price for getting an accurate picture that we can truly rely on to monitor progress and guide direction and decision making – knowing what works and what doesn’t in promoting change.
There is no substitute for excellent policy, grounded in true engagement and voice of stakeholders and communities, strengthened by solid understanding of practicalities and needs on the ground, supported with adequate resources, and implemented within solid partnerships with commitment to inter-sectoral collaboration frameworks. Effective use of money and the outcomes that are achieved will depend on the extent to which Australia is able to overcome these major challenges in policy and practice.
At this point in time, there is a sense that, after a long period of inadequate response to continuing disadvantage, the new policies are widely welcomed. There remains controversy about the method of implementation and the absence of a comprehensive long-term action plan to which the signatories committed in the Statement of Intent. Nonetheless, the Council of Australian Governments’ National Integrated Strategy for Closing the Gap in Indigenous Disadvantage and the National Indigenous Reform Agreement do represent a comprehensive national plan for closing the gap in Indigenous disadvantage.There remains the need for a new partnership between Indigenous Australians and their representatives and Australian governments to underpin the national effort to achieve Indigenous health equality.
These controversies and questions must be addressed as they are warning bells to ensure that we keep on track and don’t fall into the same traps as previous unsuccessful policies and programs. The difference between success and failure is likely to be captured by the extent to which the current activity is achieving empowerment of Aboriginal and Torres Strait Islander people to gain control over their everyday lives, health and situations. Only through community empowerment and real partnership with government can we ensure the ongoing building of capacity within Aboriginal Community-controlled health services and of mainstream health services to meet the needs of Indigenous Australians. These core issues must be considered essential for the sustainability of health gains to be achieved and maintained into the future.
Acknowledgements
Ms Sybille McKeown National Centre for Aboriginal and Torres Strait Islander Statistics Australian Bureau of Statistics
Ms Debra Reid Office for Aboriginal & Torres Strait Islander Health Department of Health and Ageing Department of Health and Ageing
Prof Richard Madden National Centre for Classification in Health University of Sydney
Prof Ted Wilkes National Drug Research Institute Curtin University
Advanced Preliminary Web Version 22 November 2010 29
Ms Sally Fitzpatrick Muru Marri Indigenous Health Unit University of New South Wales
Advanced Preliminary Web Version 22 November 2010 30

3.12 Australia: References Aboriginal and Torres Strait Islander Social Justice Commissioner. 2005. Social Justice Report 2005. Sydney: Human Rights and Equal Opportunity Commissioner. http://www.hreoc.gov.au/social_justice/sj_report/sjreport05/index.html
Andrews, B., Simmons, P., Long, I., and Wilson, R. 2002. Identifying and overcoming the barriers to Aboriginal access to general practitioner services in rural New South Wales. Aust J Rural Health 10: 196-201.
Arkles R. 2006. Overseas Trained Doctors in Aboriginal and Torres Strait Islander Health Services: A Literature Review. Sydney: Muru Marri Indigenous Health Unit Monograph Series, MMIHU and the Cooperative Research Centre for Aboriginal Health.
Australian Bureau of Statistics (ABS). 2002. Occasional Paper: Hospital Statistics, Aboriginal and Torres Strait Islander Australians. Cat. no. 4711.0. Canberra: Commonwealth of Australia.
Australian Bureau of Statistics (ABS). 2006. National Aboriginal and Torres Strait Islander Health Survey 2004–05. Cat. no. 4715.0. Canberra: Commonwealth of Australia.
Australian Bureau of Statistics (ABS). 2007. Population Distribution, Aboriginal and Torres Strait Islander Australians, 2006. Cat. no. 4705.0. Canberra: Commonwealth of Australia.
Australian Bureau of Statistics (ABS). 2008a. Experimental Estimates of Aboriginal and Torres Strait Islander Australians, June 2006. Pub. 3238.0.55.001. Canberra: Commonwealth of Australia.
Australian Bureau of Statistics (ABS). 2009, ‘Experimental Life Tables for Aboriginal and Torres Strait Islander Australians’, cat. no.3302.0.55.003
Australian Government. (2008). Australian Government budget papers 2008-9, Section 2, Departmental Outcomes- 8 Indigenous Health. http://www.aph.gov.au/budget/2008-09/content/bp2/html/index.htm.
Australian Government & Rudd, K. Prime Minister’s Report 2010 Closing the Gap. Canberra: Commonwealth of Australia. http://www.fahcsia.gov.au/sa/indigenous/pubs/general/Pages/closing_the_gap_2010.aspx
Australian Health Ministers’ Advisory Council (AHMAC). 2008, ‘Aboriginal and Torres Strait Islander Health Performance Framework Report 2008’, Canberra: AHMAC.
Advanced Preliminary Web Version 22 November 2010 31

Australian Institute of Aboriginal and Torres Strait Islander Studies (AIATSIS). 2008. Little Red Yellow Black Site. Retrieved 15 December 2009 from http://lryb.aiatsis.gov.au/who/called.html.
Australian Institute of Health and Welfare (AIHW). 2006. Aboriginal and Torres Strait Islander People with Coronary Heart Disease: Further Perspectives on Health Status and Treatment. Cardiovascular Diseases Series no. 25. Cat. no. CVD 33. Canberra: AIHW.
Australian Institute of Health and Welfare (AIHW). 2009a. Measuring the Social and Emotional Wellbeing of Aboriginal and Torres Strait Islander Peoples. IHW 24. Canberra: Commonwealth of Australia.
Australian Institute of Health and Welfare (AIHW). 2009b. Expenditure on Health for Aboriginal and Torres Strait Islander People 2006–07. Health and Welfare Expenditure Series no. 39. Cat. no. HWE 48. Canberra: AIHW.
Australian Institute of Health and Welfare (AIHW). 2010. National Best Practice Guidelines for Collecting Indigenous Status in Health Data Sets. Cat. no. IHW 29. Canberra: AIHW. Australian Institute of Health and Welfare (AIHW) and Australian Bureau of Statistics (ABS). 2003. The Health and Welfare of Australia’s Aboriginal and Torres Strait Islander Peoples 2003. ABS cat. no. 4704.0, AIHW cat. no. IHW11. Canberra: AIHW and ABS.
Australian Institute of Health and Welfare (AIHW) and Australian Bureau of Statistics (ABS). 2005. The Health and Welfare of Australia’s Aboriginal and Torres Strait Islander Peoples 2005. ABS cat. no. 4704.0, AIHW cat. no. IHW14. Canberra: AIHW and ABS.
Australian Institute of Health and Welfare (AIHW) and Australian Bureau of Statistics (ABS) 2008. The Health and Welfare of Australia’s Aboriginal and Torres Strait Islander Peoples 2008. ABS cat. no. 4704.0, AIHW cat. no. IHW 21. http://www.aihw.gov.au/publications/index.cfm/title/10583 Australian Medical Association. 2005. Position Statement of Aboriginal and Torres Strait Islander Health. Barton, ACT: AMA Ltd.
Bailie, R., Stevens, M., McDonald, E., Brewster, D., and Gutheridge, S. 2010. Exploring cross-sectional associations between common childhood illness, housing and social conditions in remote Australian Aboriginal communities. BMC Public Health 10: 247.
Bell, K., Couzos, S., Daniels, J., Hunter, P., Mayers, N., and Murray, R. 2000. Aboriginal community controlled health services. Pages 75–102 in: General Practice in Australia. Canberra: Commonwealth Department of Health and Aged Care.
Bramley, D., Hebert, P., Jackson, R., and Chassin, M. 2004. Indigenous disparities in disease-specific mortality, a cross-country comparison: New Zealand, Australia,
Advanced Preliminary Web Version 22 November 2010 32
Canada, and the United States. N Z Med J 117(1207), http://www.nzma.org.nz/journal/117-1207/1215.
Close the Gap Steering Committee for Indigenous Health Equality. 2010a. Shadow Report on the Australian Government’s Progress towards Closing the Gap in Life Expectancy between Indigenous and non-Indigenous Australians. http://www.oxfam.org.au/resources/filestore/originals/OAus-CloseTheGapShadowReport-0210.pdf
Close the Gap Steering Committee for Indigenous Health Equality. 2010b. Partnership Position Paper. http://www.oxfam.org.au/resources/filestore/originals/OAus-CloseTheGapShadowReport-0210.pdf
Commission on the Social Determinants of Health. 2008. Closing the Gap in a Generation: Health Equity through Action on the Social Determinants of Health. http://whqlibdoc.who.int/publications/2008/9789241563703_eng.pdf.
Cooke, M., Mitrou, F., Lawrence, D., Guimond, E., and Beavon, D. 2007. Indigenous well-being in four countries: An application of the UNDP’s Human Development Index to Indigenous peoples in Australia, Canada, New Zealand and the United States. BMC Intl Health Human Rights 7: 9.
Copeman, R. 1980. The effect of an Aboriginal Medical Service on admissions of children to hospital in a NSW country town. Med J Aust 1 (1 Suppl.): 5-6 (9 Feb.).
Council of Australian Governments. 2007. Communique – 20 December 2007. http://www.coag.gov.au/coag_meeting_outcomes/2007-12-20/index.cfm.
Couzos, S., and Murray, R. 2003. Aboriginal Primary Health Care: An Evidence Based Approach, 2nd ed. Melbourne: Oxford University Press.
Deeble, J. 2009. Assessing the Health Service Use of Aboriginal and Torres Strait Islander Peoples. http://www.health.gov.au/internet/nhhrc/publishing.nsf/Content/16F7A93D8F578DB4CA2574D7001830E9/$File/John%20Deeble%20Indigenous%20paper%20June%202009.pdf
Eckermann, A.K. (1992). Binan Goonj: Bridging Cultures in Aboriginal Health. Armidale, NSW: Dept of Aboriginal and Multicultural Studues, University of New England.
Foley, G. 1975. The history of the Aboriginal Medical Service—A study in bureaucratic obstruction. Identity 2(5): 38-40.
Franklin, M.A., White, I. 1991. The history and politics of Aboriginal health. In: The Health of Aboriginal Australia, ed. J. Reid and P. Trompf. Sydney: Harcourt Brace.
Advanced Preliminary Web Version 22 November 2010 33

Haswell, M.R., Kavanagh, D., Tsey, K., Reilly, L., Cadet-James, Y., Laliberte, A., Wilson, A., and Doran, C. 2010. Psychometric validation of the Growth and Empowerment Measure (GEM) applied with Indigenous Australians. Aust N Z J Psychiatry 44: 791-799.
Horton, D., gen. ed. 1994. The Encyclopaedia of Aboriginal Australia [CD-ROM]. Canberra: Aboriginal Studies Press, Australian Institute of Aboriginal and Torres Strait Islander Studies.
House of Representatives Standing Committee on Family and Community Affairs (2000). Health is life: report on the inquiry into Indigenous health. Canberra: The Parliament of the Commonwealth of Australia.
Hudjashov, G., Kivisild, T., Underhill, P.A., Endicott, P., Sanchez, J.J., Lin, A.A., Shen, P., Oefner, P., Renfrew, C., Villems, R., and Forster, P. 2007. Revealing the prehistoric settlement of Australia by Y chromosome and mtDNA analysis. Proc Nat Acad Sci USA 104(21): 8726-8730.
Human Rights and Equal Opportunity Commission (HREOC). 1997. Bringing Them Home: Report of the National Inquiry into the Separation of Aboriginal and Torres Strait Islander Children from Their Families. Sydney: Sterling Press.
Human Rights and Equal Opportunity Commission (HREOC). 2008. Close the Gap, National Indigenous Health Equality Targets. Outcomes from the National Indigenous Health Equality Summit Canberra, March 18-20, 2008. http://www.hreoc.gov.au/social_justice/health/targets/health_targets.pdf Jackson Pulver, L.R., Bush, A., and Ward, J.E. 2003. An analysis to determine the number of Aboriginal and Torres Strait Islander women using an urban obstetric hospital. Aust Health Rev 26(2): 19-25.
Jackson Pulver, L.R., and Fitzpatrick, S. 2004. A brief summary of recent reports concerning rights-based reconciliation viewed in relation to Aboriginal and Torres Strait Islander health. Health Prom J Aust 15(3): 193-199.
King, M., Smith, A., and Gracey, M. 2009. Indigenous health, part 2: The underlying causes of the health gap. The Lancet 374(9683): 76-85.
Kunitz, S. 1990. Disease and the Destruction of Indigenous Populations. Canberra: National Centre for Epidemiology and Population Health, Australian National University.
Kunitz, S. 1994. Disease and Social Diversity: The European Impact on the Health of Non-Europeans. New York: Oxford University Press.
Madden, R.C., and Jackson Pulver, L.R. 2009. Aboriginal and Torres Strait Islander population: More than reported. Aust Actuarial J 15(2): 181-208.
Advanced Preliminary Web Version 22 November 2010 34
Madden, R.C., Jackson Pulver, L.R., Ring, I., Taylor, L., Tickle, L., Indigenous Life Expectancy using multiple Australian data sources, Statistics Canada Methodology Symposium, 2010
National Aboriginal Health Strategy Working Party (NAHSWP). 1989. National Aboriginal Health Strategy. Canberra: National Aboriginal Health Strategy Working Party.
National Aboriginal and Torres Strait Islander Health Council (NATSIHC). 2004. National Strategic Framework for Aboriginal and Torres Strait Islander Health 2003-2013. Canberra: NATSIHC.
Pholeros, P., Rainow, S., and Torzillo, P. 1993. Housing for Health: Towards a Healthy Living Environment for Aboriginal Australia. Newport Beach: Healthabitat.
Potts, H. 2008. Accountability and the Right to the Highest Attainable Standard of Health. http://www.comminit.com/en/node/288460/348.
Reynolds, H. 1989. Dispossession: Black Australians and White Invaders. Sydney: Allen & Unwin.
Ring, I., and Brown, N. 2002. Indigenous Health: Chronically inadequate responses to damning statistics. Med J Aust 177(11): 629-631.
Rowley, K.G., O’Dea, K., Anderson, I., McDermott, R., Saraswati, K., Tilmouth, R., Roberts, I., Fitz, J., Wang, Z., Jenkins, A., Best, J.D., Wang, Z., and Brown, A. 2008. Lower than expected morbidity and mortality for an Australian Aboriginal population: 10-year follow-up in a decentralised community. Med J Aust 288(5): 283-287.
Royal Australasian College of Physicians. 1997. Communique of the 1997 Cottrell Conference hosted by the Royal Australasian College of Physicians: Statement on the Delivery of Specialist Services to Remote and Rural Aboriginal and Torres Strait Islander Communities.
Royal Commission into Aboriginal Deaths in Custody. 1991. National Report Vol. 1:24-28. Canberra: Australian Government Printing Service. www.austlii.edu.au/au/other/IndigLRes/rciadic/national/vol1.
Rudd, K. 2008. National Apology to the Stolen Generations. Canberra: Commonwealth of Australia. http://australia.gov.au/about-australia/our-country/our-people/ national-apology-to-the-stolen-generation-video.
Saggers, S., and Gray, D. 1991. Policy and practice in Aboriginal health. Pages 381-420 in: The Health of Aboriginal Australia, ed. J. Reid and P. Trompf. Sydney: Harcourt Brace.
Advanced Preliminary Web Version 22 November 2010 35
Smith, L. 1978. Aboriginal health statistics in Australia—A survey and a plan. Third Revision. Canberra: Health Research Group, Australian National University.
Supramaniam, R., Grindley, H., and Jackson Pulver, L. 2006. Cancer mortality in Aboriginal people in New South Wales, Australia, 1994–2002. Aust N Z J Public Health 30(5): 453-456.
Thomson, N. 2003. The need for Indigenous health information. Pages 1–24 in: The Health of Indigenous Australians, ed. N. Thomson. South Melbourne: Oxford University Press.
Thomson, N., and Ali, M. 2003. Births, deaths and hospitalisation. Pages 44–74 in: The Health of Indigenous Australians, ed. N. Thomson. South Melbourne: Oxford University Press.
World Health Organisation (WHO). 2002. International Trachoma Initiative. Geneva: WHO.
World Health Organisation (WHO). 2009. Global Health Risks: Mortality and Burden of Disease Attributable to Selected Major Risks. Geneva: WHO. http://whqlibdoc.who.int/publications/2009/ 9789241563871_eng.pdf.
Advanced Preliminary Web Version 22 November 2010 36

IV. Canada
4.1 Introduction
Aboriginal peoples in Canada are comprised of three politically and culturally distinct groups – Indians (First Nations), Inuit and Métis – as recognized by the Constitution Act of 1982. According to the 2006 Census (Statistics Canada, January 2008), there are currently 1,172,785 Aboriginal peoples in Canada that represents four per cent of the Canadian population. Of the total Aboriginal population, 698, 025 are First Nations, 389,780 are Métis, and 50,480 are Inuit (Statistics Canada, 2008). Aboriginal peoples are the fastest growing and youngest populations in Canada with a 45 per cent increase in Aboriginal population growth from 1996 to 2006 compared to 8 per cent increase for the non-Aboriginal population (Statistics Canada, 2006 Census, January 2008). Furthermore, in 2006, the median age of the total Aboriginal population was 27 years compared to 40 years for the non-Aboriginal population (Statistics Canada, 2008).
It is important to note that according to the British North America Act of 1867 (now the Constitution Act 1982), the federal government was given responsibility for “Indians and lands reserved for Indians” (Section 91 [24]), while provincial/territorial governments were given the responsibility for both health and education off-reserve. This division of jurisdictions has created gaps in accessing health services and inequities across systems.
In Canada, Aboriginal peoples disproportionately experience disparities related to the social determinants of health. Aboriginal people were almost 4 times more likely to live in crowded homes compared to the non-Aboriginal population and they were 3 times more likely to live in a home in need of major repairs. In 2006, of the Aboriginal population aged 25 to 64, 34 per cent had not completed high school compared to 15 per cent of the non-Aboriginal population. Furthermore, 8 per cent of the Aboriginal population had a university degree compared to 23 per cent of the non-Aboriginal population. Unemployment rates for the Aboriginal population aged 15 and older were 5 times higher than the non-Aboriginal population. (Statistics Canada, 2008). “At the root of these disparities are historic and ongoing impacts of European colonization, which directly and indirectly impact health. Approximately one-third of Aboriginal children live in low-income families and food-security is a serious concern”. (Janet Smylie & Paul Adomako, 2009, Indigenous Children’s Health Report: Health assessment in action, Keenan Research Centre, p.4).
A key to addressing disparities such as these is to ensure universal coverage of adequate health services. Routine monitoring and evaluation of health systems and gaps are necessary to ensure that this coverage is achieved. As First Nations, Inuit, and Métis are distinct populations who face unique and diverse barriers within the health system, this paper utilizes a population specific approach to explore and make key recommendations on the complex issues related to data, inequities, policies, and monitoring and evaluation. However, given its limited scope this paper simply highlights some issues that are of great concern to each population.
Advanced Preliminary Web Version 22 November 2010 37

4.2 FIRST NATIONS
First Nations are tribally and linguistically diverse peoples who live throughout all geographic regions of Canada. The term "First Nations people" includes Status and Non-Status “Indians”: a “Status” or “Registered Indian” refers to one who is accorded certain rights under the federal Indian Act (Indian and Northern Affairs Canada, 2010b). “Non-Status Indians” identify as First Nations but are not officially recognized under the Indian Act (Indian and Northern Affairs Canada, 2002, p. 11). While the term Indian is used in this Act, the term First Nations is commonly used by the people. In 2006, 60% of the Aboriginal population in Canada identified as First Nations, and of these 81% were “Registered Indians” (Statistics Canada, 2009, p. 1). The First Nations population grew by 29% between 1996 and 2006 (Statistics Canada, 2006 Census, January 2008). Post-contact, First Nations were relegated to a tract of land, called a “reserve”. In 2006, 615 First Nations on-reserve communities were recognized by Indian and Northern Affairs Canada. Currently, 40% of First Nations people live on-reserve, while the remainder live off-reserve in urban or rural settings (Statistics Canada, 2008 p. 41).
First Nations Data Sources
First Nations data sources include the following:
• The Indian Register: official record of Registered Indians (Indian and Northern Affairs Canada, 2010a).
• The Census: amongst the general population of Canada, only 1 in 5 households receive the long-form version which permits them to indicate Aboriginal identity; however, all who dwell on-reserve receive it (indeed, this is the only means through which the Census can inquire about individuals’ Aboriginal identity and status). All other households in Canada (4 out of 5) receive the short-form which affords no opportunity to indicate Aboriginal identity (Statistics Canada, 2007, p. 5). It should also be noted that in 2006, 22 reserves did not participate in the Census (Statistics Canada, 2007, p. 5).
• Other surveys: the Aboriginal Peoples Survey and Aboriginal Children’s Survey and the Canadian Community Health Survey (which collect off-reserve data), and the First Nations Regional Longitudinal Health Survey (usually referred to simply as the RHS, which collects on-reserve data). The RHS is a national survey under First Nations control (First Nations Centre, 2007, p. 2).
• Vital statistics are collected by the provinces/territories and may not include an Aboriginal identifier.
The First Nation population counts from the Indian register may not be consistent with Census or Band membership data. The key issues for First Nations are incomplete and fragmented data which prohibits monitoring health for all First Nations. Surveys include different groups of First Nations based on Status or geography (for example, on-reserve or off-reserve) that cannot necessarily be combined and data is collected and maintained by separate and mutually exclusive systems.
Advanced Preliminary Web Version 22 November 2010 38

Inequalities
Health Canada funds the delivery of primary health care services on-reserve, Non-Insured Health Benefits for status First Nations and some special programs for all First Nations. The level of primary care on reserves is less than that provided to Canadians through the provincial/territorial health care systems (Lavoie, 2004). The Non-Insured Health Benefits Program provides coverage for some drugs, medical transportation, dental, medical supplies and equipment, vision and crisis counseling services to status Indians (First Nations), but the level and type of coverage varies according to the discretion of the regional Health Canada offices (Assembly of First Nations, 2005). Due to inequalities in the Indian Act (Parliament of Canada, 2010), some First Nations women do not have the same status rights as men and therefore are not eligible for the same federally funded services.
First Nations living in the territories have less access to enhanced program funding from Health Canada compared to the provinces due to the interpretation of transfer and self-government agreements (Lemchuk-Favel, 2007). All First Nations are eligible for provincial health care services delivered off reserve, but health service may be denied or delayed due to jurisdictional disputes regarding which level of government should pay for certain services for Status Indians (UNICEF Canada, 2010).
First Nations experience disproportionately high rates of tuberculosis, diabetes, injuries, suicide and cardio-vascular disease, although this is not necessarily the case in all communities. There is a high level of diversity among different nations and communities. (Reading, 2009; Assembly of First Nations/FNIGC, 2007; Health Canada, 2005a, 2009). In addition to health outcomes, First Nations also experience disparities in the heath determinants. Based on the Community Well-being Index, a composite measure that includes education, income, labour force participation/employment and housing indicators, First Nations communities lag far behind compared to the general Canadian population on all indicators, and have experienced a decline in housing conditions from 2001 to 2006 (INAC, April 2010). Nearly one-third of First Nations communities consider their water unsafe to drink and from 40% to 49% of homes have mould or mildew (First Nations Centre, 2005).
Policy
In the past, Health Canada set policies in a top-on-down fashion, but has since conceded that “no two [Indian] bands are exactly alike, what is good for one band is not necessarily…good for another,” and therefore seeks “to achieve an increasing level of health in Indian communities, generated and maintained by the Indian communities themselves” (Health Canada, 2005b). Accordingly, it now encourages individual First Nations to negotiate direct control over their own health care with the ultimate aim of devolving all existing health resources to First Nation control (Health Canada, 2005b). The Federal Government has also struck tripartite agreements with First Nations and the governments of British Columbia, Saskatchewan and Manitoba.
Health Canada provides the Aboriginal Health Transition Fund (AHTF) to: adapt and integrate health services between federal and provincial/territorial health systems to better meet First Nations needs; and increase First Nations participation in the design, delivery, and evaluation of health programs and services (Aboriginal Canada Portal, 2010). Funding for the AHTF will cease by March 2011. British Columbia, Saskatchewan, Manitoba, and Ontario work in collaboration with their provincial
Advanced Preliminary Web Version 22 November 2010 39
government to bring about positive change in First Nations health. This work ranges from serving in an advisory capacity to acting as full partners in the creation and implementation of effective community health strategies.
Monitoring and Evaluation
First Nations communities face a 3% funding cap on such critical services as nursing, medications, and medical transportation (Assembly of First Nations, 2007). Based on trends and disparities in health outcomes, risk factors, social determinants, health services and funding levels for First Nations, Canada is losing ground in addressing health and wellness needs. Growth in funding to the provinces/territories surpasses the funding caps that are placed on primary health services on-reserve. The First Nations Action Plan for Non-Insured Health Benefits (Assembly of First Nations, 2005) provides recommendations for targets on levels of spending.
The Assembly of First Nations report Development of a First Nations Health Reporting Framework (2006) outlines principles, indicators and outstanding issues in the creation of a First Nations information system which is part of the broader First Nations Framework in the 2005 Blueprint on Aboriginal Health (Kelowna Agreement) and builds on the Aboriginal Health Reporting Framework identified in the 2003 Accord on Health Care Renewal. The Blueprint sets the goal of measurable improvements in health outcomes by 2015 with the establishment of a First Nations Health Reporting Framework (FNHRF) (set to begin reporting in 2010-2011) to monitor progress. Funding support and community level capacity building are required to realize this plan.
Information on Government spending, health and social outcomes, infrastructure and health transfer are publicly available, but not easily collated due to multiple sites of collection and lack of coordinated reporting. Government indicators are macro-level and do not include relevant community level indicators for First Nations.
4.3 INUIT
The Inuit Nunangat, or homeland, stretches from the western Northwest Territories (Inuvialuit region), through Nunavut, northern Quebec (Nunavik) and Labrador (Nunatsiavut), and covers approximately 40% of Canada’s land mass (Inuit Tapiriit Kanatami and Inuit Circumpolar Council Canada, 2007). Of the total population of 50,480, 78% of Inuit live in the Nunangat, and the other 22% live primarily in five southern urban areas and two northern hub communities (Inuit Tapiriit Kanatami, 2008a). Land claims have been settled in all four regions, and the three land claim organizations and one Inuit regional government are active in the areas of health and social development. Inuit have the youngest population of the three Aboriginal groups, with a median age of 22 years. The Inuit population grew by 26% between 1996 and 2006 (Statistics Canada, 2006 Census, January 2008).
Inuit Data Sources
The first comprehensive survey of Inuit health was conducted in the Inuvialuit Region, Nunavut, and Nunatsiavut communities in 2007-08, similar to research in Nunavik in 2004. The Inuit Health Survey included household surveys, as well as clinical tests with adults and children; results are currently
Advanced Preliminary Web Version 22 November 2010 40
being released. Funding for the survey was one-time only. As well, the Canadian Census, the Aboriginal Peoples Survey and the Aboriginal Children’s Survey, (both post-census surveys with good coverage of Inuit, at least in Northern areas) provide basic information on health and social conditions, health determinants, etc. Three 5 year cycles of the surveys have been completed, but ongoing funding is not guaranteed. Key data issues for Inuit are: the lack of funding and infrastructure to conduct their own population-level survey research; confidentiality and validity in small sample sizes; lack of an Inuit identifier in most provincial and territorial administrative data; lack of Inuit-specific rather than geographically-based socio-economic data and information on health determinants; difficulties accessing university-based research funding and finding support for community-driven applied research; and lack of data on urban Inuit (National Aboriginal Health Organization and Canadian Institute for Health Information, 2009; Cameron, 2007).
Inequalities
Inuit fair poorly on virtually every health measure in comparison to other Canadians, and in many cases, other Aboriginal Peoples as well. The gap in life expectancy between residents of Inuit communities and Canadians in general is about 13 years, and the gap is growing (Inuit life expectancy likely is declining rather than increasing). The Inuit suicide rate is more than 11 times higher than the overall Canadian rate (Inuit Tapiriit Kanatami, 2008a).
Inuit face high rates of tuberculosis, many cancers, respiratory diseases, accidental injuries and sexually transmitted infections (Cameron, 2007). Inequities in factors that contribute to good health abound, for example, 38% of Inuit in the Inuit Nunangat live in crowded housing (compared to 5% of non-Aboriginal Canadians). The male Inuit unemployment rate across Canada is 23%, and median annual income for Inuit adults of $13,699 compared to $22,120 for all Canadians (Inuit Tapiriit Kanatami, 2008a). Nearly 70% of Inuit preschoolers in Nunavut live in households that are food insecure (they did not have enough food and had to skip meals or eat only small meals and poor quality food some of the time) (Egeland et. al, 2010).
Inuit culture and lifestyles also have many strengths that can be built upon, for example, Inuktitut language use remains high in some areas, family and community ties are strong, most children are involved in cultural and outdoor activities, and traditional food continues as a regular part of the diet (Statistics Canada, 2008).
Inuit Nunangat spans two provinces and two territories and as a result, health care delivery systems vary greatly. Primary, acute and specialist care is delivered by regional or territorial governments, while public health, mental health, and community health programs may be delivered by governments or by Inuit health authorities. Most communities are served by small health clinics staffed with nurses and community health workers, with periodic fly-in care by physicians and mental health specialists. Chronic staff shortages, high turnover and reliance on non-resident health care providers affects quality of care and health outcomes (Lemchuk-Favel, 2007; Nunavut Tunngavik Incorporated, 2008).
Most Northerners have to fly out of their communities for diagnostic, acute care and treatment, which can result in delays in diagnosis and treatment. Transportation costs consume a large proportion of the health care budget. Problems identified with Non-Insured Health Benefits (NIHB – the national Inuit and First Nations insurance program) are: a narrow scope of insured services; crisis versus preventive
Advanced Preliminary Web Version 22 November 2010 41

counselling and dental services, and having to pay up front for services (particularly pharmaceuticals) not registered for direct billing to NIHB.
Health needs and concerns of Inuit living in urban areas are understudied, but it is known that they rarely receive Inuit-specific services, face language and cultural barriers in mainstream services, and face inequities in benefits as beneficiaries living outside of their land claims.
Policy
While Inuit have their own traditional healing practices and knowledge developed over centuries, westernized health care was introduced over the last three hundred years by whalers, missionaries and trading companies. The Government of Canada never took legislated responsibility for health care delivery to Inuit, yet it did deliver health care services from Ottawa to the northern territories from 1954-82, when responsibility was transferred to the territorial government. Presently, almost all funding for territorial health care comes from the federal government through block transfers, which makes it difficult to determine how the money is being spent and whether Inuit are benefiting fully from federal programs (Lemchuk-Favel, 2007).
A comprehensive Inuit health policy approach, in spite of repeated calls for this by Inuit organizations, and an Inuit/provincial/territorial/federal Inuit Health Summit held in January 2008, is lacking. Too often, Inuit needs and realities are subsumed within the much larger First Nations population.
Monitoring and Evaluation
Inuit-specific data, and systematic research on Inuit health status, funding mechanisms, and systems integration is lacking in Canada. Because only one Inuit region has access to Inuit-specific administrative data, there is very little information available to monitor and reform the Inuit health care system. Inuit organizations have been working with the federal, territorial and provincial governments, and guiding documents such as the Inuit Action Plan, a joint Health Canada-Inuit Tapiriit Kanatami work plan and a Circumpolar Inuit Health Action Plan (forthcoming) have been created. What is needed is a comprehensive tri-lateral, long-term planning approach, built on a robust monitoring and evaluation system (Inuit Tapiriit Kanatami and Inuit Circumpolar Council Canada, 2007; Inuit Tapiriit Kanatami, 2008b; Inuit Circumpolar Council Canada, 2009).
4.4 MÉtis
Métis are individuals of mixed First Nations and European (usually Scottish or French) heritage. While Métis are a distinct people, there is also a great deal of diversity among this population with regards to culture, language, values and beliefs, varying between communities and geographic regions. In the 2006 Census, Métis represented 33% of the total Aboriginal population in Canada (Statistics Canada, 2008). The Métis population grew by 91% between 1996 and 2006 and half of the total Métis population is 30 years of age and younger (Statistics Canada, 2006 Census, 2008).
Advanced Preliminary Web Version 22 November 2010 42

Métis Data Sources
Among the several potential sources of health and well-being data, which include provincial administrative data, vital registration, health surveillance systems, census, health surveys, and academic/community-based research projects, currently very few allow easy identification and extraction of Métis-specific data (Anderson et al., 2006; Smylie & Anderson, 2006). Historically, the Aboriginal Peoples Survey, academic research projects and data linkages have been the only avenues for the collection of Métis specific health data (Anderson et al., 2006; National Aboriginal Health Organization, 2009; Smylie & Anderson, 2006).
Health surveys are a cost-effective, less time consuming and informative source of data. To date the Aboriginal Peoples Survey is the only national data source that captures disaggregated data on the health and wellbeing of Métis in Canada. The Aboriginal Peoples Survey and Aboriginal Children’s Survey have collected self-reported health and well-being information (Statistics Canada, 2008). Three Aboriginal Peoples Surveys (1991, 2001 and 2006) have been completed to date. In 2001 and 2006, a Métis supplement questionnaire was also administered to Métis respondents, which included other questions on health and well-being. The first Aboriginal Children’s Survey was conducted in 2006 (Statistics Canada, 2008); however, the 1991 and 2001 Aboriginal Peoples Survey included a children’s component. The Aboriginal Peoples Survey has attempted to survey off-reserve First Nations, Inuit and Métis on access and use of, and satisfaction with health care services, and reasons for not receiving health care (Statistics Canada, 2008).
Provincial administrative databases contain rich, detailed data on usage of health services, hospitalizations, physician visits, mortality, vital statistics, among others. However, most provincial health information databases and health surveillance systems do not have ethnic identifiers (Anderson et al., 2006; Smylie & Anderson, 2006), with the exception of the health care system in the Northwest Territories (Minore, Katt, & Hill, 2009). This precludes easy extraction of Métis-specific data. Provincial Métis registries have been linked to the provincial administrative databases (Anderson et al., 2006) to overcome this limitation. Two organizations, the Manitoba Metis Federation (Anderson et al., 2006) and the Métis Nation of Ontario (Law & Smylie, 2008; National Aboriginal Diabetes Association, 2009) have successfully completed data linkages. In 2002, the Manitoba Metis Federation linked a sample of their membership list to health databases in Manitoba Health (the provincial ministry of health) (Kliewer, Mayer, & Wajda, 2002). This yielded estimations of the extent of health care utilization (physician utilization and hospitalizations), and diabetes and cancer prevalence rates among Métis in Manitoba (Kliewer et al., 2002). Recently, the Métis Nation of Ontario partnered with the Institute of Clinical Evaluative Sciences (ICES) to determine the prevalence rates of some diseases among Métis in Ontario (Law & Smylie, 2008; National Aboriginal Diabetes Association, 2009). A report is expected in 2010.
Well designed and well informed academic/community-based research studies can be an important source of health information. While academic research can be a vehicle for data collection on health and services coverage, Métis have been severely under-represented in academic research projects (Young, 2003; Young & Katzmarzyk, 2007). In a literature review prepared by the Métis Centre of the National Aboriginal Health Organization (2009), it was found that the extent of health coverage among Métis was not addressed in any of the existing research.
Advanced Preliminary Web Version 22 November 2010 43
Inequalities
Métis experience several inequalities in health care access and quality of care. For example, according to the 2006 Aboriginal Peoples Survey, Métis adults are less likely to report they have a family doctor and that they are very satisfied with the way care was provided the last time they saw a health professional compared to the total Canadian population (Janz, Seto, & Turner, 2009). With regard to access to traditional medicines, healing or wellness practices, only one in three (32%) indicated these were available in their city, town or community (Janz, 2009 #293). While, age-standardized number of physician visits were comparable between Métis and the total Manitoba population, hospitalizations were higher for Métis (Kliewer et al., 2002).
In terms of health outcomes, Métis face several inequalities. For instance, Métis adults were more likely to report being diagnosed with arthritis and/or rheumatism, high blood pressure, asthma, and diabetes compared to the total Canadian population (Janz et al., 2009). Perhaps as a consequence, Métis adults have a lower life expectancy compared to non-Aboriginal adults (Tjepkema et al., 2009). Also, age-standardized mortality rates for Métis were significantly higher compared to non-Aboriginal individuals (Tjepkema et al., 2009).
Policy
Unlike status First Nations and Inuit, all health services for Métis are covered under provincial health insurance plans, similar to that for the non-Aboriginal population (Anderson, Smylie, Anderson, Sinclair, & Crengle, 2006). The exception are Métis in the Northwest Territories; the Northwest Territories is the only jurisdiction in Canada which has a Métis Health Benefits Program similar to the federal Non-Insured Health Benefits (Department of Health and Social Services Northwest Territories). Jurisdictional issues such as these not only affect health coverage and outcomes for Métis, they also severely limit opportunities for data collection.
Monitoring and Evaluation
As a result of aforementioned gaps, Métis-specific data, and systematic research on Métis health status, funding mechanisms and systems integration is lacking in Canada.
The challenge to determining health coverage and health status of Métis is the inability to accurately determine the exact Métis population figures (Anderson et al., 2006; Minore et al., 2009; Smylie & Anderson, 2006), and to identify Métis in provincial databases (Anderson et al., 2006; Minore et al., 2009; Smylie & Anderson, 2006). Partial Métis population counts and coverage can be determined using provincial Métis registries. However, Métis registries have previously been subjected to limitations including voluntary registration, exclusions, gaps, inconsistencies or errors (Anderson et al., 2006; Minore et al., 2009; Smylie & Anderson, 2006). These have resulted in the lack of representativeness of the samples and the inability to generalize findings. These factors collectively result in a systematic undercounting of Métis in population counts; disease, birth and death registries and administrative databases (Anderson et al., 2006; Minore et al., 2009; Smylie & Anderson, 2006).
Inconsistencies in how Métis are identified in national surveys pose another challenge. Métis have been identified in the census and national surveys by either using the ancestry question or the identity
Advanced Preliminary Web Version 22 November 2010 44

question (Saku, 1999). The 1991 census lacked the identity question, however the subsequent censuses, and as a result the Aboriginal Peoples Survey, have incorporated the identity question (Tjepkema, Wilkins, Senécal, Guimond, & Penney, 2009). The inconsistencies limit time series analysis of reported health outcomes and service coverage.
4.5 CONCLUSION
Key recommendations for primary health care reform for First Nations, Inuit and Métis populations are listed below by population.
FIRST NATIONS
1. Ensure equity for First Nations regardless of gender, status and place of residency. 2. Increase compatibility of different data sources for comparable data. 3. Maintain focus on social determinants of health as well as health outcomes and health
systems. 4. Establish clear guidelines, measurement, monitoring and accountability for addressing health
disparities supported by sufficient funding. 5. Resolve existing jurisdictional inconsistencies and disputes across levels of government. 6. Ensure the provision of equitable primary care services on reserve to those provided off
reserve.
INUIT
1. A closer examination of federal health spending equity between Inuit and First Nations. 2. Greater transparency in health spending by the territorial and provincial governments. 3. Health spending commensurate with the health inequities experienced by Inuit. 4. Inuit designed and delivered community health programs. 5. Long-range health planning.
The goal is to move toward providing primary care services closer to home, staffed by Inuit; with enhanced cultural competence in care; and better integration between all service providers.
MÉTIS
1. The addition of Metis identifiers in provincial databases and vital registries or at least the complete or near complete enumeration of all eligible Métis in each province. To do this issues related to ethics must first be identified and addressed.
2. Increased funding for Métis-specific academic research. 3. Improved sampling methods and increased sampling sizes. 4. Increased access to existing databases. 5. Improve existing national and regional surveys. 6. Increased capacity of Metis to understand, interpret, collect and analyse data and statistical
information.
Advanced Preliminary Web Version 22 November 2010 45
4.6 Canada: References
The British North America Act. (1867). Retrieved from: http://www.solon.org/Constitutions/Canada/English/ca_1867.html Garner, R., Carrière, G., C., S., & The Longitudinal Health and Administrative Data Research Team. (2010). The Health of Inuit, Métis and First Nations Adults Living Off-Reserve in Canada: The Impact of Socio-economic Status on Inequalities in Health. Ottawa: Statistics Canada. Indian and Northern Affairs Canada. (2009). Fact Sheet - Urban Aboriginal population in Canada. Ottawa: Indian and Northern Affairs Canada. Statistics Canada. (2008). Aboriginal Peoples in Canada in 2006: Inuit, Métis and First Nations, 2006 Census. Ottawa: Statistics Canada. First Nations Aboriginal Canada Portal (March 17, 2010). Aboriginal Health Transition Fund - First Nations, Inuit and Aboriginal Health webpage. Retrieved on-line on June 15 from: http://www.aboriginalcanada.gc.ca/acp/apps/fundingtool.nsf/eng/fd20075.html. Assembly of First Nations. (April 25, 2005). First Nations action plan for non-insured health benefits. Retrieved from: http://afn.ca/cmslib/general/NIHB%20Action%20Plan_Fe.pdf. Assembly of First Nations. (May 2006). The development of a First Nations Health Reporting Framework. Retrieved from: http://64.26.129.156/cmslib/general/FNHRF.pdf. Assembly of First Nations (February 2, 2007). National Chief Welcomes Renewed Support of the First Ministers Meeting and Conservative Platform Targets by the Health Council of Canada. Retrieved on-line on June 14, 2010 from http://afn.ca/article.asp?id=3295. Assembly of First Nations/First Nations Information Governance Committee. (2007). The First Nations Regional Longitudinal Health Survey (RHS), 2002/03, 2nd Ed. www.rhs-ers.ca Blueprint on Aboriginal Health: A 10-Year Transformative Plan. Prepared for the meeting of First Ministers and leader of national Aboriginal organizations, November 24-25, 2005. Retrieved from: http://www.hc-sc.gc.ca/hcs-sss/pubs/system-regime/2005-blueprint-plan-abor-auto/index-eng.php. First Ministers and National Aboriginal Leaders, Strengthening Relationships and Closing the Gap. Kelowna, British Columbia, November 24-25, 2005. http://www.health.gov.sk.ca/aboriginal-first-ministers-meeting. First Nations Implementation Plan section also posted at: http://www.afn.ca/cmslib/general/FirstNationsPlan.pdf. First Nations Centre. (2005). First Nations Regional Longitudinal Health Survey (RHS) 2002/03: The Peoples’ Report. Ottawa: National Aboriginal Health Organization. First Nations Centre (2007). OCAP: Ownership, Control, Access and Possession. Sanctioned by the First Nations Information Governance Committee, Assembly of First Nations. Ottawa: National Aboriginal Health Organization. Health Canada. (2003). Non-Insured Health Benefits program: Information booklet. Retrieved from: http://www.hc-sc.gc.ca/fniah-spnia/pubs/nihb-ssna/2003_booklet_livret_info/index-eng.php. Health Canada. (2005a). A statistical profile on the health of First Nations in Canada: For the year 2000. Ottawa: Health Canada.
Advanced Preliminary Web Version 22 November 2010 46

Health Canada (2005b). Ten Years of Health Transfer, First Nations and Inuit Control web page. Retrieved on-line on June 1, 2010 from: http://www.hc-sc.gc.ca/fniah-spnia/pubs/finance/_agree-accord/10_years_ans_trans/2_intro-eng.php#introduction. Health Canada. (2009). A statistical profile on the health of First Nations in Canada: Self-rated health and selected conditions, 2002-2005. Ottawa: Health Canada. Health Council of Canada. (February, 2006). Health Care Renewal in Canada: Clearing the road to quality. Annual Report to Canadians 2005. Retrieved from: http://www.healthcouncilcanada.ca/en/index.php?option=com_content&task=view&id=91&Itemid=93. Indian and Northern Affairs Canada (2002). Words First: An Evolving Terminology Related to Aboriginal Peoples in Canada. Indian and Northern Affairs Canada. (April 2010). Measuring Well-Being: The Community Well-Being (CWB) Index. Retrieved from: http://www.ainc-inac.gc.ca/ai/rs/pubs/cwb/index-eng.asp. Indian and Northern Affairs Canada (2010a). The Indian Register. Retrieved from: http://www.ainc-http://www.ainc-inac.gc.ca/br/is/index-eng.asp. Indian and Northern Affairs Canada (2010b). Indian Status. Retrieved from: http://www.ainc-inac.gc.ca/br/is/index-eng.asp . Lavoie, J. G. (2005). Governed by contracts: The development of indigenous primary health services in Canada, Australia and New Zealand. Journal of Aboriginal Health, 1, pp. 6-24. Lemchuk-Favel, L. (January 10, 2007). Federal health funding to First Nations in the Territories: A discussion document. Draft. Retrieved from: http://www.afn.ca/cmslib/general/Terr-FN-Health-Funding200751105424.pdf. Parliament of Canada, House Publications (2010). http://www2.parl.gc.ca/HousePublications/Publication.aspx?DocId=4470443&Language=E&Mode=1&Parl=40&Ses=3. Reading, J. (2009). The crisis of chronic disease among Aboriginal peoples: A challenge for public health, population health and social policy. Victoria, B.C.: Centre for Aboriginal Health Research, University of Victoria. Retrieved from: http://www.cahr.uvic.ca/docs/ChronicDisease%20Final.pdf. Statistics Canada (2007). How Statistics Canada Identifies Aboriginal Peoples. Ottawa: ON. Statistics Canada (2009). Canada Year Book 2009: Aboriginal Peoples. Ottawa: ON. UNICEF Canada (2010). Leave No Child Behind webpage. Retrieved on-line on June 16, 2010 from: http://www.unicef.ca/portal/SmartDefault.aspx?at=2063.
Inuit Cameron, E. (2007). State of the knowledge: Inuit public health. Prince George: National Collaborating Centre for Aboriginal Health.
Advanced Preliminary Web Version 22 November 2010 47

Egeland, G.M., Pacey, A., Cao, Z., & Sobol, I. (2010). Food insecurity among Inuit preschoolers: Nunavut Inuit Child Health Survey 2007-2008. Canadian Medical Association Journal, 182(3), 243-248.
Inuit Circumpolar Council Canada. (2009). 2009 Circumpolar Health Summit. Ottawa.
Inuit Tapiriit Kanatami. (2008a). Inuit statistical profile. Ottawa. Retrieved from www.itk.ca/publications/inuit-statistical-profile
Inuit Tapiriit Kanatami. (2008b). Leaders gather to address Inuit health priorities (media release). Ottawa. Retrieved from www.itk.ca/media-centre/media-releases/leaders-gather-address-inuit-health-priorities
Inuit Tapiriit Kanatami and Inuit Circumpolar Council Canada. (2007). Building the Inuit Nunaat: The Inuit action plan. Ottawa.
Lemchuk-Favel, L. (2007). Federal health funding to First Nations in the Territories: A discussion document (January 10, 2007 draft). Ottawa: FAV COM.
National Aboriginal Health Organization and Canadian Institute for Health Information. (2009). Harnessing the power of health information to improve the health of First Nations, Inuit and Métis populations. Presentation to the National Aboriginal Health Organization National Conference. Retrieved from www.naho.ca/conference/presentations/B5-HR2-W-Vanloffeld2.pdf
Nunavut Tunngavik Incorporated. (2008). Nunavut’s health system: A report delivered as part of Inuit obligations under article 32 of the Nunavut Land Claims Agreement, 1993. Iqaluit.
Statistics Canada. (2008). Aboriginal Children’s Survey, 2006: Family, community and child care. Ottawa.
Métis Statistics Canada. (2006). Census tables: Aboriginal Identity (8), Age Groups (8), Area of Residence (6), Sex (3) and Selected Demographic, Cultural, Labour Force, Educational and Income Characteristics (233), for the Total Population of Canada, Provinces and Territories, 2006 Census - 20% Sample Data Retrieved May 22, 2010, from http://www12.statcan.gc.ca/census-recensement/2006/dp-pd/tbt/Rp-eng.cfm?LANG=E&APATH=3&DETAIL=0&DIM=0&FL=A&FREE=0&GC=0&GID=0&GK=0&GRP=1&PID=97446&PRID=0&PTYPE=88971,97154&S=0&SHOWALL=0&SUB=0&Temporal=2006&THEME=73&VID=0&VNAMEE=&VNAMEF= Anderson, M., Smylie, J., Anderson, I., Sinclair, R., & Crengle, S. (2006). First Nations, Métis, and Inuit Health Indicators in Canada. A background paper for the project Action Oriented Indicators of Health and Health Systems Development for Indigenous People in Australia, Canada and New Zealand. Regina, SK: Indigenous Peoples' Health Research Centre. Department of Health and Social Services Northwest Territories. Metis Health Benefits. Retrieved June 15, 2010, from http://www.hlthss.gov.nt.ca/english/services/health_care_plan/metis_benefits/default.htm Greenwood, M. (2006). Landscapes of Indigenous health: An environmental scan by the National Collaborating Centre for Aboriginal Health. Prince George: University of Northern British Columbia.
Advanced Preliminary Web Version 22 November 2010 48
Janz, T., Seto, J., & Turner, A. (2009). Aboriginal Peoples Survey, 2006. An Overview of the Health of the Métis Population. Ottawa: Statistics Canada. Kliewer, E., Mayer, T., & Wajda, A. (2002). The Health of Manitoba’s Métis Population and their Utilization of Medical Services: A Pilot Study. Winnipeg, MB: CancerCare Manitoba and Manitoba Health. Law, D. G., & Smylie, J. (2008). Our Health Counts: Development and Application of a Baseline Population Health Database for Urban Aboriginal People in Ontario. Paper presented at the Proceedings of the North East LHIN Aboriginal Health Summit - The New Health Environment, North Bay. Minore, B., Katt, M., & Hill, M. E. (2009). Planning without facts: Ontario's Aboriginal health information challenge. J Agromedicine, 14(2), 90-96. National Aboriginal Diabetes Association. (2009). Report on Diabetes Surveillance in Aboriginal Communities. Winnipeg: National Aboriginal Diabetes Association. National Aboriginal Health Organization. (2009). Data collection options for Métis health and well-being Information: a report on the data collection options and feasibility project. (Report in preparation at time of publication). National Aboriginal Health Organization. (2010). Report on feedback from Métis stakeholders on Statistics Canada's two post-censual surveys: APS and ACS. (Report in preparation at time of publication). Saku, J. C. (1999). Aboriginal Census data in Canada: a research note. The Canadian journal of native studies, 19(2), 365-379. Smylie, J., & Anderson, M. (2006). Understanding the health of Indigenous peoples in Canada: key methodological and conceptual challenges. CMAJ, 175(6), 602. Statistics Canada. (2008). Aboriginal Peoples Survey (APS). Retrieved December 17, 2008, from http://www.statcan.gc.ca/cgi-bin/imdb/p2SV.pl?Function=getSurvey&SDDS=3250&lang=en&db=imdb&adm=8&dis=2 Tjepkema, M., Wilkins, R., Senécal, S., Guimond, E., & Penney, C. (2009). Mortality of Métis and Registered Indian adults in Canada: An 11-year follow-up study. Ottawa: Statistics Canada. Young, T. K. (2003). Review of research on aboriginal populations in Canada: relevance to their health needs. BMJ (Clinical research ed.), 327(7412), 419-422. Young, T. K., & Katzmarzyk, P. T. (2007). Physical activity of Aboriginal people in Canada. Canadian journal of public health.Revue canadienne de sante publique, 98 Suppl 2, S148-160.
Advanced Preliminary Web Version 22 November 2010 49

V. Aotearoa New Zealand
5.1 Colonisation and Demographic Change
Prior to the colonisation of New Zealand by European people that began in the late 18th century, the population of New Zealand was an amalgam of the newly arrived settlers from then Pacific and their descendents (King, 1999; Walker, 1992). As early as a few decades after the first European settlers established new lives in New Zealand, the features of New Zealanders changed when recorded census taking was begun by these new visitors. As a minority a census of European settlers was much easier to manage settlement by settlement but the remoteness of settlements meant an under count was expected for both the new settlers from Europe and the New Zealanders established in great numbers. The change in how the estimates of population were made was informed by degrees of intermarriage, race and later ethnicity. These changes in definition tell us much of the relationship between the people indigenous to New Zealand (in the 19th century, the ancestors of those who are) now known as Maori and those whose ancestry is associated with the 19th century and more recent migrations to New Zealand, non-Maori.
The relationship between Maori and the rest of New Zealand remains dynamic and reflects changing definitions and the manner in which statistics are compiled. The health characteristics of the indigenous population, Maori by descent, in New Zealand are portrayed by the rich sources of information, the census and health-related data. These data when combined form an amalgam, a composite of a variety of assumptions about the people who participated. This amalgam presents both a contemporary view of how Maori were viewed by those collecting and analysing the statistics and what health-related data was deemed to best reflect that status of Maori. In the past and with few exceptions Maori were rarely consulted about how they were described in the official statistics and therefore little knowledge remains in the official statistics of Maori populations as determined by Maori nor is there much about Maori concerns about their health and well being.
To project an accurate impression or estimate of Maori populations it is essential that a robust understanding of who are Maori is decided before describing the impact of morbidity and mortality relative to the rest of the population of New Zealand. A comparison of the epidemiology of a disease between Maori and non-Maori may inform the mechanism for the determinants of poor health and give rise to the development of preventative, treatment and palliative strategies but it also provides the basis for an equity debate regarding the fair and equitable distribution of society’s resources. The efficacy of these strategies relative to Maori can also be determined from inequalities in outcome as measured by mortality or morbidity however these measures do not capture the features of what well being and indeed health may mean to many Maori. Where this is the case, the utility of a simple epidemiologically-based disease state analysis may understate Maori priorities for health. Before exploring the differing perspectives Maori and non-Maori hold regarding health and well being, it is useful to consider how the census of New Zealanders became complicated once Governor Hobson stated ‘we are one country’ at the signing of the Treaty of Waitangi, 1840 (Orange, 1987).
5.2 Census There are estimates of the population of New Zealand prior to European settlement. Dieffenbach who visited parts of New Zealand between 1839 and 1841 concluded that in parts the natives were
Advanced Preliminary Web Version 22 November 2010 50

numerous estimating the population of settlements (predominantly Maori) living on both sides of Cook Strait was 6490 in 1840 (Dieffenbach, 1843).
Reliable estimates of the population of New Zealand after the arrival of European settlers in the early 19th century were published in the records of the Appendices to the Journals of the House of Representatives from census. Brabant, a district magistrate, reported in the records of The Parliament a decreasing census of Maori in the Bay of Plenty. He reported the population had declined from 4200 in 1878 to 2246 in 1881 (Brabant RM, 1878, 1881). These estimates were regional estimates based on those Maori living in the areas near the sea or other areas where access to relatively easy. Later census data recorded patterns of European settlement and rarely mentioned Maori.
Pool estimated the national population of Maori fell from perhaps more than 100,000 prior to 1840 to less than 40,000 by the beginning of the 20th century (Pool, 1991). Since the beginning of the 20th century the population of Maori in New Zealand has increased although the definitions of the Maori population have been inconsistent with those used in the census. Statistics New Zealand estimates of the Maori population for the years 1991–2000 had been derived from the results of the 2001 Census and independently of results from the 1991 and 1996 Censuses because of changes to the question on ethnicity. The census ethnicity question for the 1996 Census had a different format from that used in 1991 and 2001. The first order of ethnicity for the two answer boxes had 'NZ Maori' listed first and 'NZ European or Pakeha' was listed second in 1996. The 1991 and 2001 questions also used the words 'New Zealand European' rather than 'NZ European or Pakeha'. The 2001 question used the word 'Maori' rather than 'NZ Maori'. The same census form also included an answer box for 'Other European' with additional drop down answer boxes for 'English', 'Dutch', 'Australian', 'Scottish', 'Irish', 'o ther ' . These were not used in 1991 and 2001 (Stat is t ics New Zealand, 2010a) .
5.3 To Be or Not to Be Maori
Now based on the concept of cultural affiliation the “New Zealand Maori Ethnic Group” is the standard definition of the Maori population now used by Statistics New Zealand. This definition includes all those who identify themselves as belonging to the New Zealand Maori ethnic group, either alone or in combination with any other ethnic groups (Statistics New Zealand, 1998). For some time a single definition that captured all who ever identified as Maori as a health numerator was used to complement the Statistics NZ census denominator to account for the historical undercount for Maori as described in latest edition of Hauora:
This method counts as Māori anyone ever recorded as Māori in any cancer registration, hospital admission or death registration, or on the National Health Index (usually over a specified period). In analyses of earlier periods (1996–2001), the ‘ever Māori’ method appeared to produce reasonable estimates of deaths and cancers (Robson & Harris, 2007).
Current Maori population estimates for the years 2001–06 have been revised using results from the 2001 and 2006 Censuses and will be updated next year from the results of the 2011 census. Furthermore, in August 2010 Statistics New Zealand estimated the population of New Zealand at 4,374,774 from a census night population of 4,116,900 on March 7, 2006. The result has been an over count of Maori when using the ‘ever Maori’ classification of ethnicity most probably due to
Advanced Preliminary Web Version 22 November 2010 51

more years of data being available for data linkage and improving classification of ethnicity (Robson & Harris, 2007).
At the end of June 2010 there were there were 64,120 live births, there were 28,840 deaths registered, therefore births exceeded deaths by 35,280 for the preceding calendar year. The birth rate was 2.2 births per women, about half of the peak of 4.3 births per woman in 1961 (Statistics New Zealand, 2010b).
The Māori population has a younger age structure, with a relatively large proportion in the main reproductive ages (15–44 years). With a median age for Māori of 22 years, most do not have access to their language. Combined with a relatively high population growth rate (average annual increase of 1.4 percent) relative to non-Māori (average annual increase of 0.7 percent) driven by a higher fertility rate for Māori females (compared with non-Māori females) in 2008, the Māori total fertility rate was 2.95, compared with 2.01 for non-Māori8. Māori are predicted to remain a significant proportion of the population under 15 years by Statistics New Zealand for some time.9
The 565,329 people who identified with the Māori ethnic group in the 2006 Census, represented one in seven people enumerated four years ago. 1 in 4 (130,482) people of Māori ethnicity speak the Māori language. While the capacity of speak their own language is available to relatively few Maori, there are Government funded initiatives to promote it. In spite of this support the proportion of people able to converse in the Maori language is falling and the language is now seen at greater risk than was understood in the 1970s for Richard Benton.
Figure 1: The Use of Maori Language by Maori People
Source: (Statistics New Zealand, 2002)
8 The total fertility rate is the average number of live births that a woman would have during her life if she experienced the age-specific fertility rates of a given period (usually a year). It excludes the effect of mortality. (Source: http://www.stats.govt.nz/browse_for_stats/population/births/BirthsAndDeaths_HOTPMar10qtr/Technical%20Notes.aspx). 9 http://www.stats.govt.nz/browse_for_stats/population/estimates_and_projections/ethnic-pop-projections-issues-and-trends.aspx
Advanced Preliminary Web Version 22 November 2010 52

5.4 Inequalities in Access, Health Risks and Outcomes, and Out-of-pocket Expenditures
Out of pocket health expenditure from private house-holds has increased slightly over the ten year period this has been monitored in the series based on the System of Health Accounts (SHA). These were promulgated by the Organisation for Economic Co-operation and Development (OECD) and were adopted by New Zealand in 2003 (Ministry of Health, 2010a).
Funding of health care in New Zealand (see Fig 2 below) show little change in out of pocket expenses in the past decade, however there has been an almost a doubling of the contribution made by the Accident Compensation Corporation in the publicly funded sector and a tripling of the contribution of Not-for-Profit organisation in the privately funded sector. While there is a significant private contribution to health care, more than 78% of the funding for health care comes from local and national Government as either direct funding or social security.
Figure 2: Funding Health Care in New Zealand
1996/97 2006/07
Publicly funded Privately funded
78.5% 79.2% 21.5% 20.8%
Other government
Local authorities
Ministry of Health
70.8% 67.6% 2.5% 1.9% 0.6% 0.7%
Healthinsurance
Not-for-profit organisations
Privatehousehold
14.8% 14.9% 6.4% 4.9% 0.3% 1.0%
Social securityACC
4.6% 9.0%
Source: (Ministry of Health, 2010b)
The Government of New Zealand’s report on health expenditure was published in 2010 to cover the fiscal year 2006-07 (Ministry of Health, 2010a). This report is the latest in a series of reports to present an estimate of health expenditure with no comment on health service effectiveness, efficiency or quality. Out of pocket expenses by household are considered a private contribution to the cost of healthcare and are included with private insurance and non-governmental funding of not-for-profit organisations.
The information in this report provides a basis for identifying and measuring trends and changes in the patterns of health and disability expenditure in New Zealand. This data is also useful in evaluating policies related to health and disability expenditure levels and patterns, plus it provides a basis for comparing New Zealand’s expenditure with other nations. (Ministry of Health, 2010a) . Intended as a resource for interested individuals and organisations to foster informed debate, the report offers insights into the manner in which health care is funded in New Zealand, where public and private funding account for the provision of health care.
Advanced Preliminary Web Version 22 November 2010 53

5.5 Inequalities exist between Māori and non-Māori.
Inequalities are exhibited for high-level indicators such as life expectancy and infant mortality and across a range of health conditions, Māori having higher rates of chronic disease, including cancer, diabetes, cardiovascular disease and asthma and have done so for some time.10 A challenge for primary health provision is to improve its performance so that it can deliver on some of its fundamental principles of fairness and equity and ensure New Zealanders live long, healthy and independent lives with equitable access to these services.
Government funding is provided only for child and adolescent oral health and for primary health care. Māori adults were equally as likely as non-Māori adults to have seen a GP in the last 12 months however, they were more likely not to attend when a part payment is levied.11 While the cost to the patient of primary health care may be a factor in gain access, the ability to pay displays inequalities that further burden Māori. Māori live in areas with the most deprived NZDep2006 scores12. In 2006, 24 percent of Māori lived in decile 10 areas (compared to with 7 percent of non-Māori), while only 3 percent of Māori live in decile 1 areas (compared with 12 percent of non-Māori).13 Jensen and Smith (2006) found that “Maori continue to have the greatest levels of health inequality in New Zealand, with measures of mortality and morbidity showing significant gaps compared to non-Maori even after controlling for deprivation. These ethnic differences in health status relate in part to a higher prevalence of smoking and other risk factors, in part to in-come inequalities, but also in part to barriers to access and treatment and to provider bias”.14
The report for New Zealand prepared by the Ministry of Health provides clear and well supported examples of risk activities that are known to adversely affect health.
5.6 Government Strategies
In the New Zealand report the strategies of Government are outlined and articulate the expectation that Māori have equitable access to clinically effective and culturally appropriate health and disability services. While Māori are acknowledged as having a special relationship with Government under the Treaty of Waitangi, life expectancy has increased but there has been less improvement made with other the health targets set by Government over the past twenty years. An explicit Māori Health Strategy was outlined first in 2002 (He Korowai Oranga) 15 as a discussion document and this policy is updated regularly by a action plan, He Whakataataka16 that aims to reduce inequalities, maintain 10 Pomare, E. W., & de Boer, G. M. (1988). Hauora: Maori Standards Health; a study of the years 1970‐1984. Wellington: Department of Health and Medical Research Council, Robson, B., & Harris, R. (Eds.). (2007). Hauora: Maori Standards of Health IV, a study of the years 2000 ‐ 2005. Wellington: Te Ropu Rangahau Hauora a Eru Pomare.
11 Source: http://www.mauriora.co.nz/file/Jansen_Oct_06.pdf 12 NZDep2006 is a small‐area‐based relative deprivation index based on nine socioeconomic variables from the 2006 Census. NZDep2006 scores are usually categorised into tenths (deciles), numbered from 1 (least deprived) to 10 (most deprived). NZDep2006 describes the deprivation experienced by groups of people in small areas and describes the general socio‐economic deprivation of an area. It does not describe the deprivation of an individual. 13 Source: Salmond C, Crampton P, Atkinson J. 2007. NZDep2006 Index of Deprivation. Wellington: Department of Public Health, University of Otago. 14 Source: http://www.mauriora.co.nz/file/Jansen_Oct_06.pdf 15 Minister of Health. (2001). He korowai oranga Maori health strategy discussion document. Wellington: Office of The Minister of Health, Hon Annette King, Office of the Associate Minister of Health, Hon Tariana Turia.
16 Ministry of Health. (2002). Whakatataka: Maori Health Action Plan 2002–2005. Wellington: Ministry of Health.
Advanced Preliminary Web Version 22 November 2010 54

health gains and acknowledge Māori aspirations for control over their own lives. The delivery of this health strategy is undertaken while acknowledging the development of whanau, hapu, Iwi and Maori communities, Māori participation throughout the health and disability support sector, effective health and disability support services, and working across sectors. This is underpinned by an emphasis on the importance of good quality data, monitoring and evaluation.
Figure 3: The Structure of the New Zealand Health Sector Source: (Ministry of Health, 2010a)
Minister of Health
ACC levies and premiums Tax payments
Ministerial Advisory
Committee
Formal accountabilityFunding
Central Government
Annual Purchase Agreement Reporting
Ministry of Health• Advise on policy• Provide health information and process payments• Facilitate collaboration and co-ordination
Acting on behalf of the Minister to:• implement, administer and enforce legislation and
regulations• plan and fund some services• plan and maintain nationwide service frameworks• monitor
Contracts
Accident Compensation
Corporation (ACC)
Reporting for monitoring
Service agreements for some services
Reporting for monitoring
Negotiation of accountability
21 District Health Boards
Service agreements
Reporting for monitoring
Private and NGO providers
• Pharmacists, laboratories, radiology clinics
• PHOs, GPs, midwives, independent nursing practices
• Voluntary providers• Community trusts• Private hospitals• Māori and Pacific providers• Disability support services
Reporting for monitoring
Service agreements
District Health Board provider arms
Predominantly hospital services, and some community services,
public health services, and assessment, treatment and
rehabilitation services
Some fees/ co-payments
Services
Private health
insurance Services
New Zealand population and business enterprises
New Zealand health and disability support services
The vast majority of the Ministry expenditure relates to bulk funds devolved to DHBs for purchasing at a local level. Funded by DHBs Primary health organisations (PHO) who deliver primary health care are expected to take a population health approach. PHO are now charged directing health and
Advanced Preliminary Web Version 22 November 2010 55

disability services to areas of greatest need, with the aim of keeping people healthier for longer, and promoting well-being. Their aim is to have as many people as possible participating in preventative measures alongside treating disease, disorders or disabilities at an individual level. PHOs have had successes. With improved health information there is now evidence of stabilisation or improvement in health inequalities in New Zealand over the past decade, including in relation to infant morality and life expectancy, improvement in rates of immunisation (an indicator that was a key concern prior to the Primary Health Care Strategy), along with a reduction in inequalities associated with ethnicity.
Personal health expenditure is public funding for personal health services is for the purpose of improving or protecting their health. A total of $9,999.1 million or 78.0% of total personal health expenditure was committed in 2006/07 by the Ministry for personal health expenditure showing an increase on average by 8.8% per year and personal health care (the largest component) has grown by 8.9%.
Public expenditure classified as Maori Health has been maintained in the range of 3.9 to 4.4% of head office expenditure for the Ministry of Health (see Table 1) and the Ministry of Maori Development through their brief to address health inequalities in the delivery of health and disability services (Ministry of Health, 2010a: pp 34-35 ). Other areas receiving public fund for health are education and research.
Public funding for current health-related activities by the Ministry of Education supports tertiary training and education of many classes of health professionals. In 2003/04, there was a significant change in the level of the education expenditure. The total estimates for 2006/07 are $484.8 million to support the education of health professionals and $118.5 million for the overhead proportion of clinical research undertaken by tertiary institutions. This was an increase of $34.5 million and $11.2 million from the previous year as a result of moving to a fully costed funding model and the contribution that trainees make to their own training..
A substantial proportion the public investment in health research was transferred from the Ministry of Health to the Ministry of Research, Science and Technology (MoRST) in 1997. This included the Health Research Council which was established by its own legislation as the in 1990. Health research is now included in the priority setting and management process applied to other public-good science and technology investments. In 2006/07, expenditure on health research was $74.5 million, compared with $67.5 million in 2005/06.
5.7 Conclusion
The challenges for New Zealand now that there is a mechanism for reporting on health expenditure is to provide an analysis of public spending for Maori health outside the functions of the Ministry of Health’s head office activities. The evidence of the influence of out-of pocket expenses on the health and well being of Maori will remain unclear while the private provision of health is not coded for ethnicity.
Advanced Preliminary Web Version 22 November 2010 56

Table 1: Ministry of Health Head Office expenditure, by output class, 2004/05, 2005/06 and 2006/07
2004/05 2005/06 2006/07 Output class
$ million % of total $ million % of total $ million % of total
Health and disability policy advice
12.4 7.19% 13.2 6.95% 14.2 6.88%
Performance management 16.9 9.80% 18.8 9.92% 18.3 8.90% Ministerial support services 2.7 1.57% 3.2 1.66% 3.4 1.64% Māori health 4.2 2.44% 3.9 2.08% 4.4 2.13% Public health 40.2 23.32% 47.8 25.24% 48.2 23.38% Disability issues 8.8 5.10% 10.7 5.64% 11.4 5.52% Health sector development 1.0 0.58% 0.0 0.00% 0.0 0.00% Mental health 7.4 4.29% 7.3 3.86% 8.9 4.31% Clinical services 16.8 9.74% 14.4 7.60% 15.1 7.32% Screening programmes 10.2 5.92% 10.2 5.40% 10.6 5.13% Information services 51.8 30.05% 60.0 31.65% 71.7 34.79%
Total 172.4 100.00% 189.5 100.00% 206.0 100.00%
Biosecurity – policy advice 1.5 19.23% 1.9 19.32% 1.8 100.00% Biosecurity – specific pest and disease response
6.3 80.77% 8.0 80.68% 0.0 0.00%
Total 7.8 100.00% 9.9 100.00% 1.8 100.00%
Source: Ministry of Health ((Ministry of Health, 2010a) Note: Totals may be affected by rounding.
While Maori health indicators are improving, the progress made in relation to non-Maori is slow and the inequalities remain. The progress likely for improving the health and well being of Maori will require long term commitment to health targets and strategies evaluated to ensure strategies remain effective and outcome focussed.
We can expect Maori health to improve but whether the rate of improvement allows the inequalities to be addressed remains an issue of resourcing, accurate data classification, improved efficacy of health service delivery and improved generation of new knowledge to inform health service delivery and policy formulation. The contribution that out of pocket expenses make to Maori health are multi factorial and cross access to health services (primary health care all the way to the delivery of primary health care and the personal contribution the health workforce makes to their own education and training through academic tuition fees and time off work to undertake training.
Advanced Preliminary Web Version 22 November 2010 57

Aotearoa New Zealand: Reference
Brabant RM, H. (1878). Census of the Maori Population, 1878. Appendices to the Journals of the House of Representatives, II(Session 1, G2).
Brabant RM, H. (1881). New Zealand Census, 3rd April 1881, Maori Results For Bay of Plenty. Appendices to the Journals of the House of Representatives II(Part 2 G3).
Dieffenbach, E. (1843). Travels in New Zealand (Vol. 1). London: John Murray, Albemarle Street.
King, M. (1999). The Penguin History of New Zealand. Wellington: Penguin.
Ministry of Health. (2010a). Health Expenditure Trends in New Zealand 1997-2007. Wellington: Ministry of Health,.
Ministry of Health. (2010b). Health Expenditure Trends in New Zealand 1997–2007 (on-line ed.). Wellington: Ministry of Health,.
Orange, C. (1987). The Treaty of Waitangi. Wellington: Allen & Unwin New Zealand Limited.
Pool, I. (1991). Te iwi Maori: a New Zealand population, past present and projected. Auckland: Auckland University Press.
Robson, B., & Harris, R. (Eds.). (2007). Hauora: Maori Standards of Health IV, a study of the years 2000 - 2005. Wellington: Te Ropu Rangahau Hauora a Eru Pomare.
Statistics New Zealand. (1998). New Zealand now - Maori. Wellington, New Zealand: Statistics New Zealand.
Statistics New Zealand. (2002). Final Report on the Survey on the Health of the Maori Language. Retrieved December 10, 2006, from http://www.tetaurawhiri.govt.nz/english/downloads/statsfinalreport/Tables%2001-8b.pdf
Statistics New Zealand. (2010a). 2001 Census Population Structure and Internal Migration. Retrieved from http://stats.co.nz/Census/2001-census-data/2001-census-population-structure-and-internal-migration/explanatory-notes.aspx
Statistics New Zealand. (2010b). Births on the rise again. Retrieved August 18, 2010, from http://www.stats.govt.nz/browse_for_stats/population/births/BirthsAndDeaths_MRJun10qtr.aspx
Walker, R. (1992). The Relevance of Maori Myth and Tradition. In M. King (Ed.), Te Ao Hurihuri - Aspects of Maoritanga (pp. 170-182). Auckland: Reid Publishing.
Advanced Preliminary Web Version 22 November 2010 58
VI. United States of America
Michelle Chino, Ph.D.
Jonathon LaValley, MPH
University of Nevada Las Vegas
School of Community Health Sciences
6.1 Introduction
As of 2008, an estimated 4.9 million people – belonging to 562 federally recognized tribes and more than 100 state recognized tribes, as well as tribes that are not state or federally recognized – were classified as American Indian and Alaska Native either alone or in combination with one or more other races, making up 1.6% of the U.S. population (Office of Minority Health 2009). The federal government’s relationship with Native Americans is commonly referred to as a “trust” relationship, characterized by the courts as analogous to a ward-guardian relationship, in which health care is provided without reference to treaty rights with few exceptions (Berry 2004). The age structure of the American Indian and Alaska Native population is younger than the general population, with much larger age cohorts under age 25 and half as many adults age 65 and older (Meyer 2000).
Despite the federal trust relationship and the establishment of the Indian Health Service in 1955, American Indians and Alaska Natives continue to have a lower life expectancy than any other racial/ethnic group in the U.S., and higher rates of injury and many diseases. Further, per capita health spending is less than any other federally funded group. As a result, many services, particularly preventive and specialty services are unavailable (US Commission on Civil Rights 2003). Health care service disparities are further compounded by socio-political and cultural issues that limit the ability to advance data collection, ensure appropriate translation of data to practice, and strengthen the data infrastructure.
6.2 Barriers and enablers to the collection of data
There are characteristics intrinsic to American Indian and Alaskan Native communities which impact the availability and collection of data necessary for analysis of disparities in health and well-being among these population groups. These intrinsic characteristics include small population size, geographic dispersion of this small population both among urban areas, and concentration within rural often remote areas. In particular, rural concentration increases barriers to inclusion in national representative survey samples while geographic dispersion makes it difficult to develop sampling strategies which would increase American Indian and Alaskan Native representation (DHHS, 2007). Compounding these challenges to health data collection is the misclassification or inconsistent collection of racial identifiers in most federal health data and survey methods which do not fit the circumstances of the target population (Buchwald et al, 2006). These culturally inadequate survey methods frequently rely on the accuracy and availability of address listings; respondent telephone access; and ignore household mobility, language and cultural barriers (Lavelle et al., 2009).
Advanced Preliminary Web Version 22 November 2010 59

Barriers to successfully collecting health data on American Indian and Alaskan Natives have also been associated with investigator biases; investigators’ failure to gain trust and establish credibility in the community in which the data is collected; community perceptions of the institutions collecting the data; and the community perceived ultimate application or use of the data (Norton and Manson, 1996). Studies have reported a particular mistrust among urban dwelling American Indians and Alaskan Natives who report that such institutions are elitist and not committed to the welfare of minority communities (Buchwald et al., 2006). Finally, investigator assumptions may overlook cultural and language differences which result in interpretation and responses to survey questions that differ from that of the general population.
Despite myriad barriers to research from within and without American Indian and Alaskan Native communities, research has identified factors which appear to improve health data acquisition within this group. American Indians and Alaskan Natives report they are willing to participate in health related studies especially if they are conducted by trusted entities with whom they have consistent interaction, meaningfully involve the community in appropriate ways, maintain confidentiality, compensate participants, and address health concerns identified as important to the community being studied (Buchwald et al., 2006). The growing popularity of Community Based participatory Research and an increased amount of tribal epidemiology programs which identify and collect community relevant health data are also facilitating the collection of data which can be used to assess the health and well being of American Indians and Alaskan Natives (Lavelle et al., 2009).
6.3 Data
Overview of key data sources There is very limited data on behavioral risk factors associated with morbidity and mortality in Native Americans, although the Indian Health Service (IHS) estimates that lifestyle and behavioral issues contribute to almost 70% of the disease that occur at a higher rate in Indian country (Berry 2004). The Behavioral Risk Factor Surveillance System review of self-reported health status and risk factors over 1997-2000 fills this gap, but no statistical testing was performed for comparisons in this report to measure the significance of health disparities (Denny 2003).
The only recent comprehensive review of the health status of urban American Indians and Alaska Natives looked only at Natives living in counties with the urban IHS services (34% of the urban Native population); relying on census data and vital statistics data over 1990-2000, this study may have substantially undercounted this population and did not report age-adjusted statistics (Castor 2006). A national linked birth-death database looking at a narrower range of health outcomes reported conflicting results (Baldwin 2002).
Healthy People 2010: Objectives for the Nation is a national agenda for public health research in the United States utilized at the federal level to set priorities for the collection of health related data and the implementation of health programs. Of the 128 objectives that are population specific to American Indians and Alaskan Natives, more than half have no baseline data. (Burhansstipanov and Satter, 2000). While the United States Department of Health and Human Services has prioritized collection and improved identification of AIAN in federal health data including: the National Health Interview Survey, National Health and Nutrition Examination Survey I and II, Behavioral Risk Factor Surveillance System, National Medical Expenditures Survey, and the National Survey of Family Growth, a United States Department of Health and Human Services study found the majority of data did not have large enough samples for even simple distributions to be produced (DHHS, 2000). More recent research reviewed the availability of American Indian and Alaskan Native data for the
Advanced Preliminary Web Version 22 November 2010 60

assessment of health disparities utilized by the National Health Disparities Report, an annual congressional assessment of health care quality and assess. This research has revealed that of over 200 indicators of quality of access and care, data on American Indians and Alaskan natives was available for only 42% of these measures (Moy et al., 2006). Concurrent studies suggest that this may even underestimate the data problem (Rhoades, 2006). Data on American Indian and Alaskan Natives with regards to federal child care, transportation, and Workforce Investment Act subsidies and services are currently unavailable (US GAO, 2005).
6.4 Measurement methodology problems (about us but not with us/ changes over time) Research into the health of American Indian and Alaska Native populations is mostly descriptive, but has been more extensively reviewed than research into other indigenous populations in Australia, New Zealand and Canada (Sanson-Fisher 2006). The availability and validity of health data is further complicated by perpetually small sample sizes that limit more complex analyses and hinder generalizability. While American Indian and Alaska Native health data are often collected through federally funded studies, these data are too often collapsed into an “other” category or omitted from report documents that note “insufficient data”. “Other” data is of no use for monitoring or developing health services or programs (Burhansstipanov & Satter 2000).
Data ownership is a growing focus of debate and negotiation between data collectors and data users, particularly as the balance of power has shifted giving tribes increasing control over their data (Lomawaima, 2000). While this change is essential to tribal self-determination, there are implications for the availability and comparability of increasingly disparate data elements and collection methodologies. The contribution of contextual variables is acknowledged as important to data interpretation but often overlooked (Jones 2001).
6.5 Identification issues in these sources (across urban/remote, over time, across age and sex) The misidentification of American Indians and Alaska Natives in administration datasets has been reported for many years. An assessment of the accuracy of race reporting on death certificates for the years 1979-85 found that American Indians and Alaska Natives had the greatest amount of race misreporting on death certificates (26.7%) as compared to 17.6% for Asian/Pacific Islanders, while misclassification was very small for Whites (0.8%) and African-Americans (1.8%) (Sorlie 1992). A review of misclassification rates for American Indian and Alaska Native ethnicity in cancer registries in urban populations relying on contract health services found misclassification rates ranging from 3% in Alaska to 44% in the Southern Plains (Espey 2008).
6.6 Systematic undercounting of births/deaths Misclassification of American Indians and Alaska Natives in vital statistics records results in consistent underestimation of rates of infant mortality, injuries, cancer, and overall mortality; some rates are as much as 47% higher after correction for miscoding (Castor 2006). A study which matched records of the National Death Index, a census of state death certificates, to IHS patient records found significant variation among states in the miscoding of American Indian and Alaskan Native race, ranging from 28 percent to two percent miscoded (IHS, 1996). American Indians and Alaska Natives are more likely to be miscoded if they die in urban settings (Castor 2006). The most recent study linking data from the Current Population Survey to the National Death Index found the highest level of race or ethnicity misreporting for American Indians and Alaska Natives. The study matched 1990-98 survey records to death certificates and found that 45% of decedents self-reported as American Indian or Alaska Native on the survey were not reported as such on their death certificate, as compared to a misclassification rate of 10.3% for Asian and Pacific Islanders, and 11.9% for Hispanics (Arias 2008).
Advanced Preliminary Web Version 22 November 2010 61
6.7 Programmes to improve enumeration The limitations and inaccuracies of health and well being data collected on American Indians and Alaskan Natives have been extensively studied (Lavelle et al., 2009; DHHS, 2007). While many recommendations for the improvement of the identification and inclusion of American Indians and Alaskan Natives in federally collected population, health, and well-being data have been made, few have resulted in programs or policies which improve enumeration (IOM, 2003).
Specific federal programs to improve the enumeration of American Indians and Alaskan Natives in the United States include the United States Office of Management and Budget Directive 15 (OMB 15) and the United States Census Bureau Tribal Government Liaison Program (DHHS, 2007). Under OMB 15, The United States Census and other federally funded population and health related studies were required to revise racial and ethnic survey data collection procedures with the goal of improving enumeration of American Indians and Alaskan Natives. The OMB 15 Directive permits respondents to self-identify more than one race, and allows American Indian and Alaskan Native respondents to self identify as a singular group (OMB, 1997). The Tribal Government Liaison Program was piloted during the 2000 Census. During this census, the support of tribal governments was obtained to enhance the collection of accurate population data. Tribal liaisons were selected who served to bridge cultural and language gaps to accurate enumeration identified in the previous census. In some circumstances, successful partnerships between American Indian and Alaskan Native governments and the US Census Bureau were developed and led to improved enumeration by increasing the inclusion of this population and improving survey methods to make them more culturally relevant (DHHS, 2005).
Tribal governments among the American Indian and Alaskan Native population have initiated their own programs to collect health and well being data through tribal epidemiological consortiums. Tribal epidemiological programs generally have broad community support in assessing community identified health issues. When added to national data, these programs have potential to vastly improve the enumeration and documentation of American Indians and Alaskan Natives and their health status and needs (Northwest Tribal Epidemiology Center, 1999).
In a 2003 report on improving racial and ethnic disparities in healthcare, the Institute of Medicine (IOM) recommends the collection and reporting of data on healthcare access and utilization by OMB defined patient race and the requirement of measures of racial and ethnic disparities in performance evaluations performed by major medical service provider accreditation agencies such as Joint Commission on Accreditation of Healthcare Organizations (JCAHO) and the National Committee for Quality Assurance (NCQA) (IOM, 2003).
6.8 Inequalities
Access (effective coverage of PHC and specialized care, unequal quality of care) Only 1.9 million American Indian and Alaska Native people belong to federally recognized tribes and live on reservations or other trust lands where the Indian Health Services (IHS) operates a comprehensive health service delivery system, and only 600,000 can access IHS funded services in urban clinics run by Indian health organizations (Figure 1) (Office of Minority Health 2009). Even on reservations, IHS services tend to be underfunded and under-staffed and offer a narrower range of services than Medicaid or private insurance plans, and available services are rationed (Brown 2000, Berry 2004). American Indians and Alaska Natives relying on the IHS rather than medical insurance are less likely to have obtained the minimum number of doctor visits for their age group and health status (Brown 2000). Native Americans are more likely than other ethnic groups to consider a clinic
Advanced Preliminary Web Version 22 November 2010 62
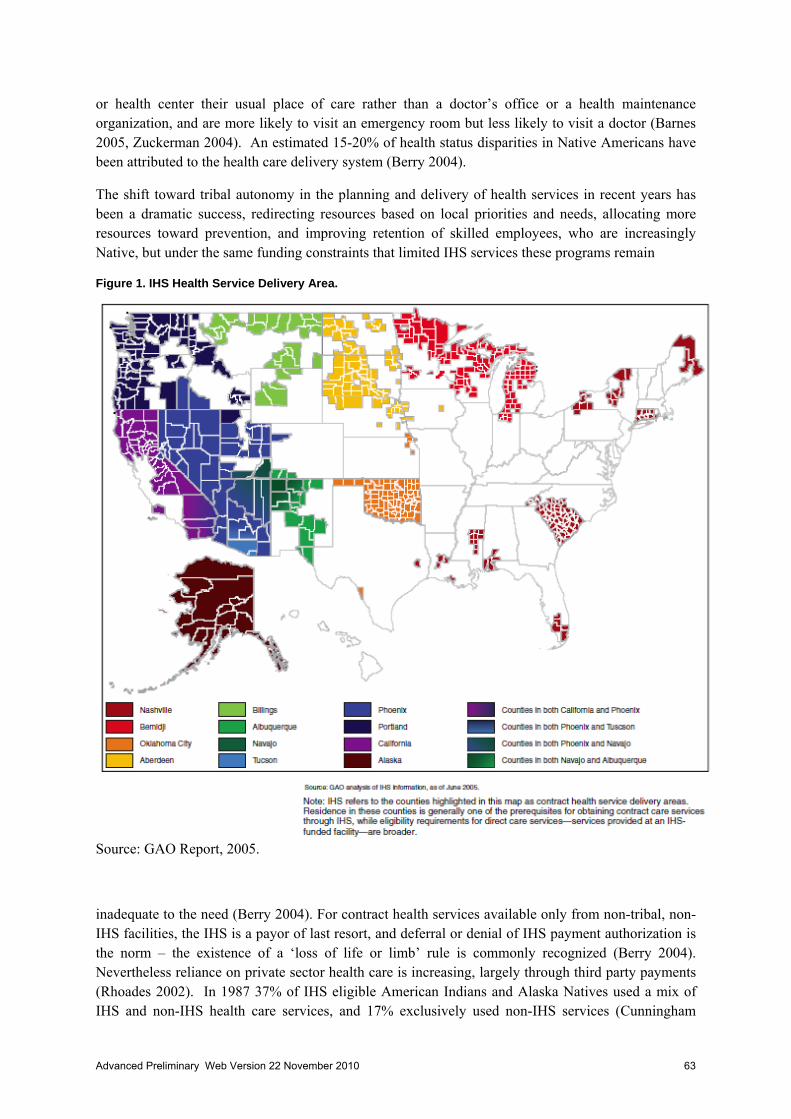
or health center their usual place of care rather than a doctor’s office or a health maintenance organization, and are more likely to visit an emergency room but less likely to visit a doctor (Barnes 2005, Zuckerman 2004). An estimated 15-20% of health status disparities in Native Americans have been attributed to the health care delivery system (Berry 2004).
The shift toward tribal autonomy in the planning and delivery of health services in recent years has been a dramatic success, redirecting resources based on local priorities and needs, allocating more resources toward prevention, and improving retention of skilled employees, who are increasingly Native, but under the same funding constraints that limited IHS services these programs remain
Figure 1. IHS Health Service Delivery Area.
Source: GAO Report, 2005.
inadequate to the need (Berry 2004). For contract health services available only from non-tribal, non-IHS facilities, the IHS is a payor of last resort, and deferral or denial of IHS payment authorization is the norm – the existence of a ‘loss of life or limb’ rule is commonly recognized (Berry 2004). Nevertheless reliance on private sector health care is increasing, largely through third party payments (Rhoades 2002). In 1987 37% of IHS eligible American Indians and Alaska Natives used a mix of IHS and non-IHS health care services, and 17% exclusively used non-IHS services (Cunningham
Advanced Preliminary Web Version 22 November 2010 63

1993). Among American Indian and Alaska Native users of Medicaid compared with Whites using Medicaid, patients report greater difficulty getting needed care, difficulty getting timely care, difficulty with provider communication; poorer plan service and that staff are less helpful (Weech-Maldonado 2003).
The degree of understaffing in some IHS services is extreme – there is only 1 dentist for every 2,800 individuals in the IHS compared to 1 dentist for every 1,500 individuals in the general population (Nash 2005). In dental health care the basic premise upon which care is rationed is changing from basic care for all who have access, to more complex care for fewer individuals, and unmet dental needs make up a large proportion of self-reported unmet health needs among Native Americans (Broderick 2000, Zuckerman 2004). Similarly in the area of child and adolescent mental health services, the IHS estimated in 1990 that at least 200 child specialists were needed, but only 17 trained clinicians were then employed by the IHS (Novis 2000).
Health promotion initiatives are underutilized in Indian health care strategies and underfunded federally; there are currently only about 1,400 Community Health Representatives working in health promotion in over 400 rural communities across over 250 tribes (Satterfield 2002). Serving long hours and often on a 24-hour basis, Community Health Representatives provide early intervention, case findings and improved access to the health care system, and support health care delivery and continuity of care (Satterfield 2002). They also provide culturally relevant education and social support (Satterfield 2002). Urban Native elders’ use of preventive services is suboptimal for many measures, including mammograms, fecal occult blood testing, audiometry, visual acuity testing, smoking cessation counseling, and vaccination (Buchwald 2001). Their access to ambulatory and preventive care is dramatically poorer than that of Whites, even among Medicare enrollees (Virnig 2002).
Nearly one third of American Indians and Alaska Natives are uninsured, and 35% of those not covered by IHS services or an insurance policy have no usual source of health care (Brown 2000). Poverty is a significant barrier to health care – Native women living in rural areas make on average only $15,000 a year, and urban Native women make only $18,800 (The Status of Women in the States 2004). Overcrowding in Native American homes is three times the national average (Berry 2004). Unemployment is twice the national average both on- and off-reservation, and a larger proportion of families with children are single-parent households (Castor 2006). On reservations infrastructure is largely lacking, impassable roads are a barrier to accessing IHS services, and housing is substandard; for example, among the Navajo more than 50% of homes rely on wood burning for heating, 32% lack adequate plumbing, and 60% lack telephone services (Berry 2004).
Language is a barrier to communication with health care providers for 371,000 American Indians and Alaska Natives, and IHS does not provide formal language assistance to its patients, relying on staff and employees who speak the same language as the patient to translate informally or relying on patients to bring their own translators (Berry 2004). Contract health services off reservations have no means of accommodating patients with language services (Berry 2004).
It has been suggested that the longer hospital stays of American Indian and Alaska Native patients are related in part to delayed discharges resulting from discriminatory practices by providers of post-hospital care and extended care facilities, driving up the cost burden on patients and increasing their risk of nosocomial infections, negligent acts or medical errors (Khaliq 2003). The IHS does not directly fund long-term care for Native elders, who rely on the Medicaid program for these services and must leave their communities to receive them (Lewis 2003). Discrimination and cultural
Advanced Preliminary Web Version 22 November 2010 64

insensitivity are primarily an issue with contract health service providers outside the IHS (Berry 2004).
Barriers to a healthy lifestyle and in particular to the prevention of obesity include lack of access to healthy foods, an absence of fitness centers or safe places for physical activities in rural areas, and domestic problems and deep-rooted intergenerational trauma affecting Native Americans’ freedom to make healthy eating and exercising a priority in their lives (Berry 2004). However, the IHS established a National Diabetes Program in 1979 that now serves as a model program for monitoring quality of care in health services, and quality of care has improved markedly through targeted interventions with some results better than certain non-Indian health diabetes programs (Roubideaux 2004).
The 1978 Indian Religious Freedoms Act was a key step toward U.S. government recognition of the use of traditional medicines and religious ceremonies in health care among American Indians and Alaska Natives (Buchwald 2000). In 2002, the Association of American Indian Physicians approved a resolution acknowledging and supporting Native American traditional healing and medicines as part of the spectrum of health care appropriate for Native Americans (Berry 2004). Some third party provider contracts are fashioned to include traditional healers in the IHS services system, but many argue that this level of integration between biomedical and traditional healing services is not enough (Kuschell-Haworth 1999). A survey of a convenience sample of clinic patients using traditional health care found that they generally indicate that it helps some or quite a lot, and that if traditional health services were more available they would consume more (Buchwald 2000). A study of Vietnam veterans’ use of biomedical and traditional health services for mental illness noted regional differences in the prevalence of use of a traditional healer related to the availability of services, with traditional healers’ services making up for a shortfall in biomedical mental health services in the southwest but traditional healers less available and less utilized in the Northern Plains (Gurley 2001).
6.9 Outcomes (disability, morbidities, mortality)
American Indians and Alaska Natives have had generally poorer health status than average in the United States, including disadvantages in death rates, morbidity, disability, and risk factors (Figure 2). The life expectancy of American Indians and Alaska Natives is almost six years less than the general population in the U.S. (Noreuil 2010). American Indian and Alaska Native adults are more likely than other groups to report fair or poor health, and report higher rates of the behavioral risk factors cigarette smoking, inactivity, binge drinking, and obesity, and are less likely to be screened for cervical cancer (Denny 2003). Infant mortality rates are higher than among non-Hispanic whites, as are rates of cardiovascular disease and stroke, homicide and suicide, HIV infection, and type 2 diabetes (Noreuil 2010). Disparities in infant mortality are due mainly to preventable infectious
Advanced Preliminary Web Version 22 November 2010 65

Figure 2. Key Differences in Health Status Indicators for American Indians and Alaskan Natives in IHS Areas and the United States General Population.
Source: GAO Report, 2005
diseases and Sudden Infant Death Syndrome (WWAMI Rural Health Research Center 2008). Diabetes disproportionately affects Native women whereas suicide and injuries disproportionately affect Native men (Rhoades 2003). The age-adjusted death rate for tuberculosis is 500% higher than the U.S. general population, and the age-adjusted death rate from alcoholism is 740% higher (Noreuil 2010). In Oklahoma American Indian and Alaska Native patients experienced longer hospital stays than their white counterparts, controlling for the influence of financial incentives and surrogates for medical need, likely due in part to unmeasured medical need (Khaliq 2003).
American Indian and Alaska Native adults are far more likely than other ethnic groups to have experienced serious psychological distress within the past 30 days or to have felt hopeless or worthless most or all of the time within the past 30 days (Barnes 2005). More prevalent mental illnesses in two well-characterized Native American populations compared with the general population in the U.S. include panic disorder, post-traumatic stress disorder, anxiety disorders, alcohol dependence, and any substance use disorder, yet lifetime help-seeking for patients meeting the criteria for a diagnosis was low (Beals 2005). Among Native American youth living on reservations, inhalants, alcohol, marijuana and tobacco use are more prevalent than in White youth (Hawkins 2004). One study found a prevalence of alcohol abuse of 11% among Native adolescents, a 9%
Advanced Preliminary Web Version 22 November 2010 66

prevalence of marijuana abuse and dependence, and a 4% prevalence of other substance abuse dependence (Novins 2000). Disparities between Native American youth and the general population in other psychiatric disorders are inconsistent across studies, but the prevalence of disruptive behavior disorders may be higher among Native American youth (Novins 2000). These patterns vary across tribes, however (Novins 2000).
Several local studies of urban health disparities between American Indians and Alaska Natives and Whites show higher rates of low birth weight, risk factors for poor birth outcomes, communicable diseases, mortality among nonelderly individuals, injuries, and alcohol related deaths among urban Natives (Castor 2006). Birth rates among teenage urban American Indian and Alaska Native mothers are 80% than in all other groups, and with the exception of mother’s smoking status all risk factors for poor birth outcomes and infant deaths are more prevalent among urban Natives using IHS services than among Natives living on reservations, with the largest urban/reservation difference in the rates of alcohol consumption during pregnancy (Castor 2006). However, a more inclusive study comparing urban and rural American Indian and Alaska Native birth outcomes and risk factors for poor birth outcomes reported minimal differences between the two groups, with poorer health status in rural areas (Baldwin 2002). Sudden Infant Death Syndrome is the leading cause of infant mortality in urban Natives and over time rates in all groups except urban Natives have decreased (Castor 2006). Mortality rates for the leading causes of death are lower in urban Natives than in the overall American Indian and Alaska Native population, with the exception of alcohol and drug related deaths, but rates of diabetes, chronic liver disease, cirrhosis, unintentional injuries, and infant mortality are still higher than in the general population (Castor 2006).
Over 1972-1996 significant improvements in the health status of American Indians and Alaska Natives have been measured in the areas of infectious diseases and injury, alcoholism, chronic liver disease, and overall mortality and life expectancy (Berry 2004). Much of the reduction in mortality in American Indians and Alaska Natives has been the result of fewer deaths from injury (Ring 2003). A comparison of infectious disease hospitalizations in 1980 and 1994 revealed that the improvements seen in most age groups were not apparent in Elders, however (Holman 2001). In 1994 major health disparities remained in rates of tuberculosis, cellulitis, oral infections, osteomyelitis, liver disease, infections during pregnancy, and neonatal infection rates (Holman 2001, Holman 2010). In recent years with the shift in the disease burden toward chronic diseases, Native health status has hardly continued to improve and overall gains in health are eroding due to poor access to primary health care (Berry 2004).
6.10 Level of out-of-pocket expenditures or cost-sharing
Estimated annual out-of-pocket expenditures on health by Indians reached $600 per capita per year in 1996 (Kunitz 1996). Whereas IHS and tribal clinics provide services free to eligible clients, medical and dental services at urban Indian programs are provided on a sliding fee basis for primary care, and referrals for inpatient hospital care, specialty services, diagnostics, etc. are at the client’s expense (Forquera 2001). Many Native Americans utilizing IHS services also have public or private health insurance to make up for gaps in health services available on the reservation (DeNavas-Walt 2006). Transportation costs for rural natives are often not covered by health insurance (Upper Midwest Rural Health Research Center 2007).
Only 36% of American Indians and Alaska Natives had private health insurance coverage in 2006, and 24% rely on Medicaid coverage (Office of Minority Health 2009). Barriers to Medicaid
Advanced Preliminary Web Version 22 November 2010 67

enrollment are cultural, administrative, and discriminatory (Forquera 2001). Over 2003-2005, 30% of American Indians and Alaska Natives were uninsured (DeNavas-Walt 2006). IHS services only partly make up for this lack of insurance coverage (Zuckerman 2004). Among American Indians and Alaska Natives not covered by IHS services, the uninsured rate is 23% (Brown 2000). Only 15% of parents of low-income uninsured American Indian and Alaska Native children reported “not needing insurance” as their reason for not purchasing insurance or enrolling in an insurance benefit (Blumberg 2005). There is a 20-fold difference in the uninsured rate between American Indian and Alaska Native elders over age 65 years and the U.S. general population of the same age, with insurance coverage lowest for elders living on reservation or trust land (Upper Midwest Rural Health Research Center 2007).
6.11 Effects of data limitations on measurement of inequalities
The assessment of health disparity involves estimating the burden of disease within a community, measuring the community’s access to care, and comparing the outcomes of this care among population groups. This assessment should inform public policy and the allocation of resources to improve any observed inequality. The validity and accuracy of health disparity data are reduced when health and demographic data are neither reported accurately nor completely (Stehr-Green et al., 2002). Ultimately, improved understanding of American Indian and Alaskan Native health related inequalities can provide the foundation for programmatic activities to remove health disparity (Table 1).
Inadequate data on the health and well being of American Indians and Alaskan natives poses potential problems for the accurate measurement of health inequalities as well the accurate application of programs and funds towards disparity in health status and care. Lack of data can cause errors of omission when they are interpreted to mean that no health inequality or problem exists (Stehr-Green et al., 2002). Unique patterns of disease or behavioral characteristics correlated with disease may not be identified or addressed. Insufficient and inaccurate data prohibit comparisons among tribes, underserved populations, and impair the ability to determine whether a health problem is emerging or simply previously undocumented. In terms of funding, agencies may not support selected programs because health conditions are unrecognized within collected data. Limited data from some American Indian and Alaskan Native populations may be generalized to other or even all American Indian and Alaskan Native communities. This results in the application of programs, resources, and funding to problems which may or may not exist in all communities. Important health care delivery infrastructure such as staff, facilities, and resources both on and off the reservation may not be committed to support emerging health needs when their allocation is based upon insufficient data (Burhansstipanov and Satter, 2000). Further, data which validates disparities in healthcare utilization and treatment outcomes may be absent.
Advanced Preliminary Web Version 22 November 2010 68

TABLE 1 – Implications of “Accurate” and “Inaccurate” American Indian and Alaska Native Health Data
Potential Beneficial Uses of Accurate
Data
Potential Hazards of Inaccurate Data
1. Help tribal nations, health boards and urban Indian clinics identify health priorities.
1A. Limited tribal fiscal resources are allocated for problems that may be of less concern to the local community.
1B. Insufficient data are interpreted as there not being a problem rather than as a data error or lack of inclusion in data collection (e.g., low participation in Behavioral Risk Factor Surveillance System caused by lack of telephones).
2. Help funding agencies recognize unmet needs within selected communities.
2. Funding agencies do not support selected programs because the health condition is “unrecognized” as a problem by the data.
3. Justify the need for unique programs within tribes, counties, states, regions, and territories (data from 1 region of the country cannot be generalized to another region or tribe, so use of data from a southwestern region misrepresents the seriousness of selected problems among Northern Plains tribes).
3. Funding agencies erroneously assume that data from 1 part of the country are generalizable to another tribal community. Thus, if smoking is not a problem in the Southwest, the agency may believe it is not a problem among Northern Plains tribes.
4. Document behavioral practices that are related to health and disease.
4. Lack of data is interpreted to mean that there is no problem behavior (e.g., habitual tobacco use).
5. Clarify the disparity and variation in disease rates among population groups.
5. Unique patterns of disease for a specific tribal community are not identified as problems or addressed.
5. Clarify the effect selected behaviors have on disease or health in selected populations or regions of the country.
6. Lack of local behavioral data frequently results in inaccurate conclusions (e.g., elevated suicide rate among northwestern tribes was not associated with the events, such as caring for a dying family member and insufficient grief support).
6. Document unique disease patterns among small communities (who remain underserved communities).
7. Unusual patterns continue to go unnoticed by local tribal programs, and subsequently more community members can be affected (e.g., HIV and sexual activity with multiple partners).
8. Obtain sufficient resources to address selected health problems.
8. Infrastructures (including staff, facilities, resources on and off the tribal community reservation) are not available to support the growing health problem.
9. Set research priorities at federal (e.g., Department of Health and Human Services, National Institutes of Health, Centers for Disease Control and Prevention, Indian Health Service) and state agencies to serve the needs of American Indian and Alaska Native communities.
9. Federal documents tend to use New Mexico or Arizona data when setting research priorities. Thus, elevated problems for other tribal communities are not acknowledged in federal priorities (e.g., Native American breast cancer).
10. Allow tribal health data to be compared with data for other medically unserved or underserved populations and nations.
10. Insufficient and inaccurate health data prohibit comparisons among (1) tribes, (2) underserved populations (e.g., Native Hawaiians and American Indians), and (3) racial/ethnic grouips (e.g., Native Americans and Whites).
11. Document health trends over time. 12. Inability to determine if a health problem is “new” or simply previously undocumented.
Source: Burhansstipanov and Satter, 2000.
Advanced Preliminary Web Version 22 November 2010 69

6.12 Policies
History of funding policy U.S. federal funding for Native American health care services was first streamlined in response to a tuberculosis epidemic in Indian boarding schools in 1911, and not until 1930 did the Bureau of Indian Affairs stipulate that all Indians belonging to a recognized tribe were entitled to health care services administered by the federal government (Graleski 2005). The Indian Health Services (IHS) was created in 1954, and was authorized to grant funds for the construction of community hospitals in 1953, but at this time there was still no statutory device that guaranteed funding for Indian health resources (Forquera 2001, Graleski 2005). Only in 1976 did the Indian Health Care Improvement Act acknowledge the federal government’s obligation to provide health care for Native Americans (Graleski 2005). The present distribution of IHS facilities, personnel and services has evolved primarily in response to Congressional appropriations, directives, and administrative and legal decisions that override deliberate health systems planning, resulting in an uneven distribution of services despite the federal aim of equitably distributed resource allocation, and over recent years funding for resource allocation planning has fallen through and targets have not been updated (Pfefferbaum 1997). As of 2006 there is a $429 million backlog for essential maintenance, alteration, and repair of Indian health facilities (Smith 2006).
The Indian Self-Determination and Education Assistance Act of 1975 authorized the Secretaries of Interior and Health and Human Services to contract with, and make grants to, Indian tribes and other Indian organizations for the planning, administration and delivery of federal services, and with amendments to this act in 1988 the tribes are free to take IHS programs and allocate and structure them as they deem necessary (Graleski 2005). Funding allocations for federal programs have failed to respond to inflation and population growth, leading to major shortfalls (Graleski 2005). As of 2001, 53% of the IHS budget for medical care was managed by tribes, with most of the remainder still running IHS operated hospitals, outpatient health centers, and smaller health stations; 17% of the IHS budget purchases non-tribal private sector health services not available at IHS facilities (Forquera 2001). Pressure to contract with the federal government to provide services arises from competition for IHS funding, and increasingly tribes face a choice between competing for resources themselves or seeing resources allocated away to other tribes that do have contracts to provide services themselves (Kunitz 1996).
The trend toward tribal self-determination threatens the already weak Urban Indian Health Program within the IHS (Trombino 2005). The Indian Health Care Improvement Act of 1976 requires the U.S. Department of Health and Human Services to contract with urban Indian organizations to provide health programs for urban American Indians and Alaska Natives, but these programs have been disproportionately underfunded (Brown 2000). In 1992, Congress amended the Act to require a policy that assures the highest possible health status for Indians and urban Indians and to provide all resources necessary to effect that policy (Graleski 2005). But by 1997, only 1.4% of the IHS health services budget was appropriated for urban Indian health services, although 60% of American Indians and Alaska Natives now live in urban areas off-reservation (Brown 2000). Several cities independently developed health services for urban Natives (Forquera 2001).
The U.S. government initiated mental health programs for Native Americans in 1965, but funding for these services has always been low compared to the relative need (LaFromboise 1988). A survey of patient caseloads in urban health clinics in 1978 indicated that 30% of presenting complaints were
Advanced Preliminary Web Version 22 November 2010 70

attributable to mental health programs, yet in 1985 funding for mental health services and alcoholism services amounted to only 7.3% of the total IHS budget (LaFromboise 1988). In 1997, the total IHS budget for mental health amounted to $23 per person (Novins 2000). Although mainstream mental health services are technically available to many Native Americans as well, these services are far less likely to be culturally sensitive (Gone 2003). In 1985, the IHS convened a series of working groups to develop a plan for combating alcohol abuse, and the Indian Alcoholism Initiative of the Secretary of Health and Human Services charged an interagency task force with providing permanent programs combating alcoholism in 1986, with activities initially focusing on prevention (Rhoades 1988). Not until 2000 did the IHS begin to merge mental health and substance abuse programs into a single “Behavioral Health” program branch to remove barriers to treatment of Native Americans with comorbid substance abuse and other psychiatric disorders (Novis 2000).
Overall funding increases are grossly inadequate to cover the costs of inflation, population growth, and salary increases – the Health and Human Services budget justification for FY 2005 indicated that across dental health services, mental health services, alcohol and substance abuse treatment programs, contract health services, and public health nursing programs, all levels of budget increases would fall so far inadequate of need that fewer services would be provided than in the preceding fiscal year (Figure 3) (Berry 2004). These trends are related to external pressures to reduce the overall cost of health care in the United States while the costs of medical services increase faster than national incomes (Holkup 2002).
Figure 3. Comparison Between IHS Appropriations Per Capita and Other Federal Health Expenditures, 2003.
Advanced Preliminary Web Version 22 November 2010 71

Source: U.S. Department of Health and Human Services, Indian Health Service, Office of Management Support, Division of Financial Management, “IHS Appropriations Per Capita Compared to Other Federal Health Expenditure Benchmarks,” March 2003, submitted by fax Mar. 27, 2003.
6.13 How to raise more money, or enough Over the decades, the existing health care system whether managed by IHS, tribes, or urban programs, has had to broaden its base of financial support in order to respond to the needs of the growing population of American Indians and Alaskan Natives. In 2000, Congress enacted a bill allowing all three types of medical care providers for American Indians and Alaskan Natives (IHS, tribal, and urban) to bill directly for services provided to Medicaid and Medicare beneficiaries (IOM, 2003). Even though there is now a process for American Indians and Alaskan Natives to access Medicare and Medicaid for the provision of healthcare, these services are still underutilized (Joe, 2003). American Indians and Alaskan Natives are still the least likely of all racial groups to access Medicaid and even less likely to access to access Medicare (71% of eligible American Indians compared with 96% of Whites) (Joe, 2003).
In order to enhance existing funding for the health care of American Indians and Alaskan Natives, which may be inadequate through the delivery of services through IHS, the Indian Health Care Improvement Act Amendments establish Contract Health Services (CHS) funds. These funds allow for IHS to act as a ‘payor of last resort’ for individuals who are already utilizing alternate resources for health care including Medicare, Medicaid, private insurance, and IHS facilities (GAO, 2005). However, the inadequate funding of CHS continues to directly impact patient care, even delaying treatment and diagnosis and drives patients to accept cheaper medical intervention or to go without health care altogether (Joe, 2003). Tribes are also engaged in procuring funding to supplement the shortfalls in the IHS budget. For example, the Healthy Alaska Natives Foundation holds annual community fundraisers to promote the group's work and to raise money to offset a shortfall in IHS funding (Ben-Yosef, 2009).
Tribally managed health care initiatives that have been able to tap into other financial resources have initiated prevention based programs such as wellness campaigns, adolescent treatment programs, substance abuse treatments, integration of traditional tribal healing practices, and disease prevention programs (Joe, 2003). The scope of these activities is limited by the private (meaning tribal) and public funds available to tribal governments. Studies suggest that American Indian and Alaskan Native governments are at an increased disadvantage to procuring federal grants for managed healthcare initiatives due to limited resources which reduce the potential to identify grant opportunities, apply for grants with matching funding requirements, prepare successful grant applications, and develop the infrastructure needed to meet all grant management requirements (DHHS, 2006).
Options for strengthening the American Indian and Alaskan Native health care system have been proposed both internally by the United States federal government as well as national programs for health care research. Suggested options available to the federal government include recommendations for the full funding of the IHS mandate by increased appropriations to account for population growth and increases in national health expenditures, expansion of the enrollment of American Indians and Alaskan natives into other federal health programs through benefits assistance and counseling for improved enrollment and retention into these programs (HCFO, 2009). State options which have been proposed include collaboration between state Medicaid and Children Health Insurance programs, tribes, and IHS to increase enrollment in these programs (GAO, 2005). IHS specific options to leverage more funds for the care of American Indians and Alaskan Natives include the development
Advanced Preliminary Web Version 22 November 2010 72

and implementation of a business model for IHS and the expansion of the CHS program which would allow for improved partnerships with local health care systems (HCFO, 2009).
6.14 Current or planned policies In 2009, the Indian Health Care Improvement Act was enacted to reauthorize the original Indian Health Care Improvement Act which funds IHS. The original Indian Health Care Improvement Act was amended to revise requirements for health care programs and services for American Indian and Alaskan Natives in order to address demonstrated disparities in programs, funding, and outcomes (HCFO, 2009). The Amendment replaced the Urban Health Programs Branch with a Division of Urban Indian Health in order to underscore the objective of providing direct health care for urban dwelling American Indians and Alaskan Natives. The Amendment authorizes grants for health information technology, telemedicine services development, and related infrastructure improvements for tribal community health programs. It specifically directs the IHS to provide programs of comprehensive behavioral health, prevention, and treatment (Heisler and Walke, 2010).
The amendment of the Indian Health Care Improvement Act expands American Indian and Alaskan Native access to IHS funds by excluding from calculations of gross income any services or benefits provided or purchased by IHS and any services or benefits provided by a tribe or tribal organization, directly or through insurance. The amendments expand coverage for qualified American Indians and Alaskan Natives in State Children’s Health Insurance Program, authorizing payments from these and all other federal aid programs (e. g. Medicare and Medicaid) to Indian Health Programs operating within a state (Heisler and Walke, 2010).
6.15 Monitoring and Evaluation
Recommendations for targets In 2004, the U.S. Civil Rights Commission made numerous recommendations to the U.S. Congress concerning Indian health, based on a Congressional briefing, interviews, research and a review of the relevant literature (Berry 2004). The Commission recommended educating and training health care providers on cultural safety, recruiting more health care providers, increasing retention rates for IHS health care providers, improving program monitoring and evaluation, modernizing data collection, increasing appropriated funding levels, increasing enrollment in public insurance programs, and increasing collections from third party insurers (Berry 2004). The Commission also noted that the IHS has, in many cases, identified solutions to health problems pervasive in Indian Country, yet Congress has failed to provide the resources necessary to implement those solutions, and that the rapid implementation of these remedial measures is necessary (Berry 2004).
6.16 Structured framework for action? Despite the recognized need for accurate health data, agreement on appropriate health indicators, and collaborative efforts for data collection, dissemination and utilization, there are few if any formalized or structured efforts for improving American Indian and Alaska Native health data. The challenges of collecting accurate health data for the US Indigenous population – a small percentage of the total US population, geographic dispersion of the Indigenous population, difficulties in contacting Indigenous households, and misclassification of Indigenous status for births, deaths and other administrative data – call for more research on ways to obtain accurate health data for the entire Indigenous population of the United States. Past experience with flawed health policy that was based on inaccurate data or on information limited to a specific tribe or other subgroup shows the pitfalls of relying on poor-quality information. Improving the quality of health data for the US Indigenous will require a national commitment to address the challenges described in this report.
Advanced Preliminary Web Version 22 November 2010 73
A national program to improve Indigenous health data should include the training of tribal members on health data collection and analysis. Developing this expertise within the Indigenous population will enable the tribes to participate in monitoring the health status of their members. It will also ensure that tribal members will have the skills to participate in the debate over new approaches to measuring Indigenous health status and in the development of appropriate health policy.
Advanced Preliminary Web Version 22 November 2010 74

6.17 USA: References Arias E, Schauman WS, Eschback K, Sorlie PD, Backlund E. The validity of race and Hispanic origin reporting on death certificates in the United States. National Center for Health Statistics. Vital Health Stat 2(148). 2008.
Baldwin L, Grossman D, Casey S, Hollow W, Sugarman J, Freeman W, Hart L. Perinatal and infant health among rural and urban American Indians/Alaska Natives. Am J Public Health 2002; 92(9): 1491-1497.
Barnes P, Adams P, Powell-Griner E. Health characteristics of the American Indian and Alaska Native adult population: United States, 1999-2003. Advance Data from Vital and Health Statistics 2005; 356: 1-24.
Beals J, Novins D, Whitesell N, Spicer P, Mitchell C, Manson S. Prevalence of mental disorders and utilization of mental health services in two American Indian reservation populations: mental health disparities in a national context. Am J Psychiatry 2005; 162: 1723-1732.
Berry M, Reynoso C, Braceras J, Edley C, Kirsanow P, Meeks E, Redenbaugh R, Thernstrom A. Broken Promises: Evaluating the Native American health care system. U.S. Commission on Civil Rights, 2004.
Bettles J, Robertson D, and Romero, FC. (1999). Northwest Tribal Registry – Seattle: Indian Health Board record Linkage Project. The Northwest Tribal Epideiology Center. Northwest Area Indian Health Board. November 15, 1999.
Blakely T, Ajwani S, Robson B, Tobias M, Bonne M. Decades of disparity: widening ethnic mortality gaps from 1980 to 1999. New Zealand Med J 2004; 117(1199): 1-21.
Blumberg S, O’Connor K, Kenney G. Unworried parents of well children: a look at uninsured children who reportedly do not need health insurance. Pediatrics 2005; 116: 345-351.
Broderick E, Niendorff W. Estimating dental treatment needs among American Indians and Alaska Natives. J Public Health Dentistry 2000; 60(4): 250-255.
Brown E, Ojeda V, Wyn R, Levan R. Racial and ethnic disparities in access to health insurance and health care. UCLA Center for Health Policy Research, 2000.
Buchwald D, Beals J, Manson S. Use of traditional health practices among Native Americans in a primary care setting. Medical Care 2000; 38(12): 1191-1199.
Buchwald D, Furman R, Ashton S, Manson S. Preventive care of older urban American Indians and Alaska Natives in primary care. J Gen Intern Med 2001; 16: 257-261.
Buchwald D, Mendoza-Jenkins V, Croy C, McGough H, Bezdek M, Spircer P. (2006). Attitudes of Urban American Indians and Alaskan Natives Regarding Participation in Research. Journal of General Internal Medicine. Vol 21, pp 648 – 651.
Burhansstipanov L, Satter DE. (2000). Office of Management and Budget Racial Categories and Implications for American Indians and Alaskan Natives. American Journal of Public Health. Vol. 90 (11), 1720 – 1725.
Advanced Preliminary Web Version 22 November 2010 75

Castor M, Smyser M, Taualii M, Park A, Lawson S, Forquera R. A nationwide population-based study identifying health disparities between American Indians/Alaska Natives and the general populations living in select urban counties. Am J Public Health 2006; 96(8): 1478-1484.
Cunningham P. Access to care in the Indian Health Service. Health Affairs 1993; Fall: 224-233.
DeNavas-Walt C, Proctor B, Lee C. Income, poverty, and health insurance coverage in the United States: 2005. U.S. Census Bureau, Current Population Reports, 2006.
Denny C, Holtzman D, Cobb N. Surveillance for health behaviors of American Indians and Alaska Natives: findings from the behavioral risk factor surveillance system, 1997-2000. MMWR 2003; 52(SS-7): 1-14.
Espey D, Wiggins C, Jim M, Miller B, Johnson C, Becker T. Methods for improving cancer surveillance data in American Indian and Alaska Native populations. Cancer 2008; 113(S5): 1120-1130.
Forquera R. Urban Indian health. Henry J. Kaiser Family Foundation, 2001.
Gone J. Mental health services for Native Americans in the 21st century United States. Prof Psychol Res Practice 2004; 35(1): 10-18.
Graleski B. The federal government’s failure to provide health care to urban Native Americans in violation of the Indian Health Care Improvement Act. Univ Detroit Mercy Law Rev 2005; 82: 461-475.
Gurley D, Novins D, Jones M, Beals J, Shore J, Manson S. Comparative use of biomedical services and traditional healing options by American Indian Veterans. Psychiatric Services 2001; 52(1): 68-74.
Hawkins E, Marlatt G, Cummins L. Preventing substance abuse in American Indian and Alaska Native youth: promising strategies for healthier communities. Psychological Bull 2004; 130(2): 304-323.
Heisler EJ, Walke R. (2010). Indian Health Care Improvement act Provisions in the Patient Protection and Affordable Care Act (P.L. 111-148). Congressional Research Services. CRS Report for Congress 7-5700, R41152.
Holkup P. Big changes in the Indian Health Service: are nurses aware? J Transcult Nurs 2002; 13: 47-53.
Holman R, Curns A, Cheek J, Singleton R, Anderson L, Pinner R. Infectious disease hospitalizations among American Indian and Alaska Native infants. Pediatrics 2003; 111: e176-e182.
Holman R, Curns A, Kaugman S, Cheek J, Pinner R, Schonberger L. Trends in infectious disease hospitalizations among American Indians and Alaska Natives. Am J Public Health 2001; 91(3): 425-431.
Indian Health Service. United States Department of Health and Human Services. Adjusting for Miscoding of Indian Race on State Death Certificates. Rockville, MD: 1996.
Advanced Preliminary Web Version 22 November 2010 76

Joe, Jennie R. (2003). The Rationing of Healthcare and Health Disparaity for the American Indians / Alaskan Natives. Native American Research and Training Center, University of Arizona. Institute of Medicine of the National Academies, National Academic Press, Washington, DC: pp 529 – 537.
Jones, Camara P. “Race,” racism, and the practice of epidemiology. Am J Epidemiol 2001; 154(4): 299-304.
Khaliq A, Broyles R, Roberton M. The use of hospital care: do insurance status, prospective payment, and the unit payments make a difference? J Health Human Services Admin 2003; 25: 471-496.
Kunitz S. The history and politics of U.S. health care policy for American Indians and Alaska Natives. Am J Public Health 1996; 86(10): 1464-1473.
Kuschell-Haworth H. Jumping through hoops: traditional healers and the Indian Health Care Improvement Act. DePaul J Health Care Law 1999; 2: 843-860.
LaFromboise T. American Indian mental health policy. Am Psychologist 1988; 43(5): 388-397.
Lavelle B, Larsen MD, Gundersen C. (2009). Research Synthesis: Strategies for the Surveys of American Indians. Public Opinion Quarterly. 2009, pp 1 – 19.
Lewis J. Lack of long-term care services in Indian Country: an analysis of extending Medicaid long term care funding to non-638 tribal programs. Doctoral paper, Saint Louis University, 2003.
Lomawaima, K. Tsianina. Tribal sovereigns: reframing research in American Indian Education. Harvard Educational Review 2000; 70(1): 1-21.
Meyer J. Age: 2000. U.S. Census Bureau, Census 2000 Brief Series. Available at: http://www.nationalatlas.gov/articles/people/a_age2000.html
Moy E, Smith CR, Johansson P, and Andrews R. (2006). Gaps in Data for American Indians and Alaska Natives in the National Healthcare Disparities Report. American Indian and Alaska Native Mental Health Research: The Journal of the National Center. American Indian and Alaska Native Programs, University of Colorado at Denver and Health Sciences Center: 13 (1), pp 52-69.
Nash D, Nagel R. Confronting oral health disparities among American Indian/Alaska Native children: the pediatric oral health therapist. Am J Public Health 2005; 95(8): 1325-1329.
Noreuil M. Coming full circle: understanding American Indian health disparities. Nursing Education and Technology, 2010.
Novins D, Fleming C, Beals J, Manson S. Quality of alcohol, drug, and mental health services for American Indian children and adolescents. Am J Medical Quality 2000; 15: 148-156.
Pfefferbaum R, Pfefferbaum B, Rhoades E, Strickland R. Providing for the health care needs of Native Americans: policy, programs, procedures, and practices. Am Indian Law Rev 1997; 21: 211-258.
Rhoades D. (2006). Commentary - Disparities in Data for American Indians and Alaskan Natives. American Indian and Alaska Native Mental Health Research: The Journal of the National Center. American Indian and Alaska native Programs, University of Colorado at Denver Health Sciences Center, Vol. 13 (1), pp 70 – 74.
Advanced Preliminary Web Version 22 November 2010 77
Rhoades E, Mason R, Eddy P, Smith E, Burns T. The Indian Health Service approach to alcoholism among American Indians and Alaska Natives. Public Health Reports 1988; 103(6): 621-627.
Rhoades E. American Indians and the private health care sector. West J Med 2002; 176: 7-9.
Rhoades E. The health status of American Indian and Alaska Native males. Am J Public Health 2003; 93(5): 774-778.
Ring I, Brown N. The health status of indigenous peoples and others: the gap is narrowing in the United States, Canada, and New Zealand, but a lot more is needed. BMJ 2003; 327(7412): 404-405.
Robert Wood Johnson Foundation, Changes in Health Care Financing and Organization Program. (2009). Financing American Indian Health Care: Impact and Options for Improving Access and Quality. October 2009, Volume 12 (7), pp 1 – 6.
Roubideaux Y. A review of the quality of health care for American Indians and Alaska Natives. Mel and Enid Zuckerman Arizona College of Public Health and University of Arizona College of Medicine, 2004.
Sanson-Fisher R, Campbell E, Perkins J, Blunden S, Davis B. Indigenous health research: a critical review of outputs over time. MJA 2006; 184(10): 502-505.
Satterfield D, Burd C, Valdez L, Hosey G, Shield J. The “In-Between People”: participation of community health representatives in diabetes prevention and care in American Indian and Alaska Native communities. Health Promot Pract 2002; 3: 166-175.
Smedley BD, Stith A and Alan R. Nelson. (2003). Unequal Treatment: Confronting Racial and Ethnic Disparities in Health Care. Institute of Medicine of the National Academies, The National Academies Press: Washington, DC.
Smith S. The highest possible health status for Indians. Human Rights 2006; 33: 22-23.
Sorlie PD, Rogot E, Johnson NJ. Validity of demographic characteristics on the death certificate. Epidemiology 1992; 3(2):181-84.
Stehr-Green P, Bettles J, Robertson LD. (2002). Effect of Racial/Ethnic Missclassification of American Indians and Alaskan Native on Washington State Death Certificates, 1989 – 1997. American Journal of Public Health. March 2002, Vol. 92 (3), pp 443 – 444.
Trombino C. Changing the borders of the federal trust obligation: the urban Indian health care crisis. NYU J Legislation Public Policy 2005; 8: 129-162.
Upper Midwest Rural Health Research Center. Health insurance coverage and access to health care for American Indian and Alaska Native elders. Rural Health Research and Policy Centers Policy Brief, 2007.
U.S. Commission on Civil Rights. (2003). A Quiet Crisis: Federal Funding and Unmet Needs in Indian Country. Washington, DC.
United States Department of Health and Human Services. (2007). Gaps and Strategies for Improving AI/AN/NA Data: Final Report. Contract No. 233-02-0087. US DHHS, Office of Human Services Policy, Washington, DC.
Advanced Preliminary Web Version 22 November 2010 78
United States Department of Health and Human Services. (2006). Barrier to American Indian, Alaskan Native, Native American Access to HHS Programs. Final Report. US DHHS, Office of Human Services Policy, Washington, DC.
United States Government Accountability Office. Report on Implementation of the Indian Child Welfare Act. Washington, DC: April 8, 2005.
United States Government Accountability Office. Indian Health Service: Health Care Services Are Not Always Available to Native Americans. Report to the Committee on Indian Affairs, United States Senate. Report No. GAO-05-789. Washington, DC: August, 2005.
United States Office of Management and Budget, Revisions to the Standards for Classification of Federal Data on Race and Ethnicity. Federal Register Notice. October 30, 1997, http://www.whitehouse.gov/omb/fedreg/ombdir15.html.
Virnig B, Lurie N, Huang Z, Musgrave D, McBean A, Dowd B. Racial variation in quality of care among Medicare+ Choice enrollees. Health Affairs 2002; 21(6): 224-230.
Waksberg J, Levine D, and Marker D. Assessment of Major Federal Data Sets for Analyses of Hispanic and Asian or Pacific Islander Subgroups and Native Americans: Task 3 Report: Extending the Utility of Federal Databases. Prepared for DHHS/ASPE: Westat, Rockville, MD, May 2000.
Weech-Maldonado R, Morales L, Elliot M, Spritzer K, Marshall G, Hays R. Race/ethnicity, language, and patients’ assessments of care in Medicaid managed care. Health Services Res 2003; 38(3): 789-808.
WWAMI Rural Health Research Center. National trends in Perinatal and infant health of rural American Indians (AIs) and Alaska Natives (ANs): have the disparities between AI/ANs and whites narrowed? Department of Family Medicine, University of Washington, 2008.
Zuckerman S, Haley J, Roubideaux Y, Lillie-Blanton M. Health service access, use, and insurance coverage among American Indians/Alaska Natives and Whites: what role does the Indian Health Service Play? Am J Public Health 2004; 94: 53-59.
Advanced Preliminary Web Version 22 November 2010 79