indices of qualitative variation - ornl
TRANSCRIPT

LEGAL NOTICE ---- i
Thls report was prepared os on account of Government sponsored work.
nor the Commission, no? m y person acting on bahblf of the Commirsion:
A. Maker a n y warronty or representation, expressed or Implied, wi th respect to the occuracy, compteteness, ac usefulness of the Informotion contained ~n this report, or that the use of
any information, apparatus, method, or process dinclosed in t h i s repori m a y not infringe
privntely owned rights; or
any l inbi l t t ies w i t h respect t o the use of, or for damages resul t ing !?om the use of
any Information, uppoiatus, method, or pracess d i sc losed rn thts raport.
As used in the above, “persm actgng on behalf of the C o m m i s s i o n ” includes any employee or
contractor of the Commission, or employee of such contrnctor, to fhe eztent t ho t sitch employee
or contractor of the Commirs ,on, or smpleyae of suph contractor prepores, disseminotss, or
pravtdaa *cce$r to, any loformotion pursuant to h i s employment or contract w i t h the Commission,
or his employment w i t h such centroctor.
Neither the United States,
8. Assumes
!--.- __ I

n
ORNL-TM- 1919
C o n t r a c t No. FJ-7h-05-eng-26
Director's Division CIVIL DEFENSE RESEARCH PROJECT*
INDICES OF QUALITATIVE VARIATION
Allen R. Wi lcox
OCTOBER 1967
OAK RIDGE NATIOlTAL LABORATORY Oak Ridge, Tennessee
operated by IJNION CARBIDE CORPORATION
f o r the lis S e ATOMIC ENERGY COk@E3SIOM
* This research was supported i n part 'by the Advanced Research Projects Agency, Office of the Secretary of Defense. The views expressed in this artic1.e are the author's own and do not necessarily reflect those of OKNL or the USAEC.


3
CONTENTS
Lnt roduct ion . . . . . . . . . . . . . . . . . . . . . . . . . . . . . . . . . . . . . . . . . . . . . . . . . . . . . . 5
Formal Froperties of the Indices. . . . . . . . . . . . . . . . . . . . . . . . . . . . . . . . . e 5 Description o€ the Indices......... ................................ 7
~ D ~ . . D . I . . . . . . 0 . . 0 . . . . . . . . . . . . . . . . . . . . . . . . . . . . . . . . . . . . . . . . . . . . 7
RA~~R......................................................~~... 8
AVljE~'.........................~. ................................ 8
M T S D I E ' . . . . . . . . . . . . . . . . . , . . . . . . . . . . ' . " . . . . . . . . . . . . . . . . . . . . . . . * . . . . 9
Summary and Conclusion ................................. =.....*....16
Appendix A: Input Preparation, Sample Problem, and Output for the DOMSTAT CDmputer Program .... .... e ............... a ............ 17
Appendix B: Fortran List of the NOMSTAT Computer Program ......... 23
4
Prefa tory - Note
The s t a t i s t i c a l explora t ion repor ted i n t h i s memorandum was under-
taken t o help us t o b e t t e r implement our r e s p o n s i b i l i t i e s f o r t h e ana lys i s
of American publ ic opinion on defense po l i cy i n general , and con t inen ta l
defense i n p a r t i c u l a r . A s familiari ty with surveys w i l l c e r t i f y , many
of t he most i n t e r e s t i n g quest ions and se-ts of responses only meet nominal
c r i t e r i a , i.e., cannot be placed i n r e l a t i v e pos i t i ons on a sca l e . Accord-
ingly, t h e analyst who wishes t o t r e a t t hese quest ions wi th a d e s i r a b l e de-
gree of r i g o r and s o p h i s t i c a t i o a needs measures appropr ia te t o them, i n
the author ' s phrase, measures of a -ua l i t a t ive va r i a t ion . This memorandum
i s a modest e f f o r t t o assist t h e ana lys t who d e s i r e s t o improve h i s a b i l i t y
t o explore e s s e n t i a l l y q u a l i t a t i v e da ta . A s such, we hope it w i l l be help-
f u l t o a Trariety of s o c i a l s c i e n t i s t s who confront such da ta i n t h e course
o f empir ical research.
Davis B. Bobrow
5
I* IlSlTROUUCTION
c
In textbook t rea tments o f measures of va r i a t ion , s t a t i s t i c s a r e
always mentioned. w%ich measure t h e v a r i a t i o n of a. u i v a r i a t e d i s t r i b u -
t i o n when the v a r i a b l e under cons idera t ion s a t i s f i e s t h e requirements
of an o r d i n d , In t e rva l , o r r a t l o s c a l e . Most commonly, t h e range,
t h e semi - in t e rqua r t i l e range, t he average devia t ion , the standard de-
v i a t ion , and t h e variance are presented and discussed , However, .the
p re sen ta t ion and d i scuss ion of measures of' variatisr: s u i t a b l e f o r use
wi th . v a r i a b l e s t h a t s a t i s f y oa1.y t h e requirements of a nominal s c a l e
i s of'ben completely absent . I n addi t ion , t h e r e appears t o be no uni-
f i e d ciiscussion o f those few appropr ia te measwes s c a t t e r e d through
the H t e r a t u r e . Based on t h e assumptior! t h a t such measures may have
considerable u t i l i t y f o r t h e s t a t i s t i c a l handl ing of q u a l i t a t i v e data ,
t h i s paper r ep resen t s a f i rs t attempt t o gather. together and t o gener-
a t e a . l t e rna t ive ind ices of gual.i.tative v a r i a t i o n . The t rea tment i s in t roduc to ry throughout. A more in t ens ive mathematical. and empir ica l
treatment o f t hese measures w i l l hopeful ly be provided by o the r s who
wish t o probe more deepl-y i n t o t h e c h a r a c t e r i s t t c s and, ut:Il.ity of t h e
s t a t i s t i c s .
11. FGRMAL PROPERTIES OF %'%Z INDICES
The d i scuss ion i s l imi t ed t o Lmeasuies that satisfy c e r t a i n foxmal.
condi t ions . The f i r s t t h rep of t h e s e condi t ions represent what a r e
?unsi&erp? %o be d e s i r a b l e formas p r o p e r t i e s of such indices. First ar?d second, the maximum and/or minimum values t k i a t such an index may ob ta in should not, depend on t h e magnitude of e i t h e r of tbe two b a s i c
p z r m e t e r s of a q u a l i t a t i v e d i s t r i b u t i o n - - t h e number of cases and the
number of categories. These condi t ions f a c i l i t a t e comparison o f t h e
values of a p a r t i c u l a r Index, even when they 2.~2 derived i'rom radical ly
d.lffecent d i s t r i b u t i o n s . Third, t hey must a11 have a. s tandard range of
val-des: i n t l i 2 (':&se, from 0 t o 1- This condit;on i ' a c i l i t a t e s com-
p'vison amo~g in&ices f o r the samc d i s t r i b u t i o n . -

6
The f i n a l condi t ion s p e c i f i e s t h e forms t h a t a d i s t r i b u t i o n must
have when an index based on i t obta ins t h e maximum and minimum values .
With the number of cases placed a t 100 and the number of ca tegor ies a t
4, Fig . 1 i l l u s t r a t e s with histograms t h e minirnum-related and maximum-
r e l a t e d forms, respec t ive ly . Thus, t h e minimum value of 0 occurs i f ,
and only if, a l l cases f a l l within - one category. Conversely, t h e max-
i m u m value of 1 occurs i f , and only if, an i d e n t i c a l number of cases
f a l l wi th in -- each category.
of measure t o which t h i s paper i s being addressed. It i s assumed t h a t
an index t h a t does not s a t i s f y t h i s condi t ion can be more u s e f u l l y re-
l a t e d t o some o ther concept or idea. Measures t h a t s a t i s f y t h i s condi-
t i o n can be thought of a s ind ices of "generalized q u a l i t a t i v e v a r i a t i o n .
This condi t ion de l inea te s the genera l "type"
112
F 1.00 r e q
e U
n C
Y O I_
A
F 100 r e 9
e U
11 25 C
I I I Y O B I C ' D ' A B C D
Category Category
Fig. 1
1
.'-As a consequence of t h i s condition, t he ind ices discussed here in reach 1 only when the number of ca tegor ies d iv ides evenly i n t o the number OP cases . This circumstance impares the comparabi l i ty oi" t h e ind ices i n c e r t a i n cases b u t does not diminish t h e i r genera l usefulness .
2For a desc r ip t ion of a measure of q u a l i t a t i v e v a r i a t i o n t h a t does not s a t i s f y t h i s condition, see George J. McCall and J. L . Simmons, "A New Measure of A t t i t u d i n a l Opposition, '' Public Opinion Quarterly, 30 :2 (Summer 1966) 271-278. A c r i t i q u e of t h i s measure can be found i n David Gold, "Cri tLcal Note on a New Measure of A t t i t u d i n a l Opposition, Publ ic Opinion Quarter ly , 31: 1 (Spring 1967) 76-79.
n
7 n
1x1. DRSCRIPTIGN OF THE INDIC'ES
The f i r s t index t h a t we have developed, MODVH, i s an index of' devia- I I _ C P
t i o n froin t h e mode - - - - J
dev ia t ion From t h e mean.
i'erences between t h e non-modal frequencies and the modal. frequency, i.e.,
analogous t o t h e standard dev ia t ion as a measure of The II core of this index i.s t h e sum of t h e d i f -
K 2 (fm-fi) i=l
where f = t h e frequency of t h e - i t h category, and i
m K K
f = t h e frequency of t h e modal category.
Since Zf. - H and Zf = Kf,, t he formula can be s impl i f i ed t o KI;, - N.
Dividing t h i s e,vpression by N(K-I.) s tandard izes t h e range of t h e index
( K L- t h e number of ca t egor i e s and N = t h e r?umber of c a s e s ) .
1 m i= 1 i=l
This expression i s d i rec t l -y r e l a t e d t o Linton Freeman's v a r i a t i o n 7 n
1 r a t i o , v.3 The formula f o r - v i s 3- - I m According t o Freeman, t h e N
v a r i a t i o n r a t i o i s t o be used as an a i d i n judging the adequacy of t h e
mode a s a summarizer of t h e d i s t r i b u t i o n . It i s simply t h e propor t ion
of nominodal cases .
'IS a summariztx.
achieve a m i n i m u m of 0, bu t i t can never achieve a maximum of l. because
t h e modal frequency can never be O+ However, by d iv id ing and sub t r ac t -
can be standardized t o ing by appropr ia te c o r r e c t i o n f a c t o r s ,
The higher i t s value, t h e less adequat,e t h e mode i s As inspec t ion of i t s forrcuia will confirm, - v can
fm - B
€rn - 1 IC_
N IC which r d u c e s t o - K f m - N , t h e core of MCDVP,. MODVR,
J!i( K - 1 ) ( K - 1 )
8
i n o ther words, i s e s s e n t i a l l y a standardized v a r i a t i o n r a t i o .
c
'Linton C Freemen, Elementary Applied S t a t i s t i c s , N\~t?w York: John Viley and Sons, 1-96?, pp. 40-43.
8
Fina l ly , t h e core of t h i s index (and of most of t h e o the r s which
follow) i s subt rac ted from 1 so t h a t low values w i l l s tand f o r l o w
v a r i a t i o n and high val.ues f o r high ins tead of v ice versa . Thus, P4OI)VB 4
equals Kfm - N
l -
The next f i v e ind ices a r e a l l va r i a t ions on a theme, f o r they a r e
all b a s i c a l l y analogs of measures t h a t are used on o rd ina l or i n t e r v a l
da ta . This i s done by t r e a t i n g the frequencies of t h e K ca.tegories as
values of a q u a n t i t a t i v e va r i ab le , c a l c u l a t i n g t h e p a r t i c u l a r s t a t i s t i c ,
and f i n a l l y s tandard iz ing t h e resu l t t o conform t o t h e c r i t e r i a l i s t e d
above. I n t h i s way i cd ices a r e constructed t h a t are analogous t o t h e
range, average deviat ion, mean di f ference, variance, and s tandard devia-
t ion.
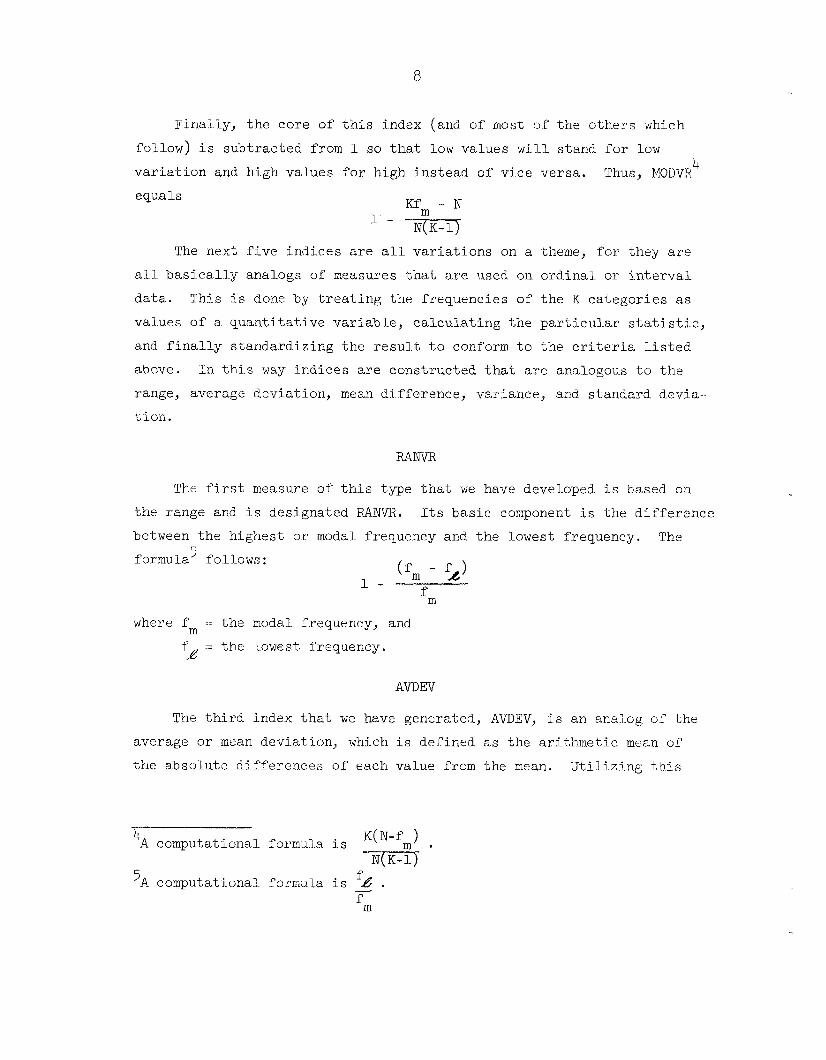
The f i r s t measure of t h i s type t h a t we have developed i s based on
the range and i s designated RANVR. I ts basic: coniponent i s Lhe d i f f e rence
between t h e highest or modal frequency and t h e lowest frequency. The r;
formula' fol-lows : Cf, - 5) 1 - n
.L m
where f := the modal frequency, and m f = t he lowest frequency. /e
AVDEV
The t h i r d index t h a t we have generated, AWEV, i s an anaiog of t he
average or mean deviat ion, which i s def ined as the a r i t hme t i c mean of
t h e absolute d i f fe rences of each value from the mean. U t i l i z i ng t h i s
4 K ( N - f )
'A comput,ational formula i s fa .
A computa,tional forrnu1.a i s *' I
9
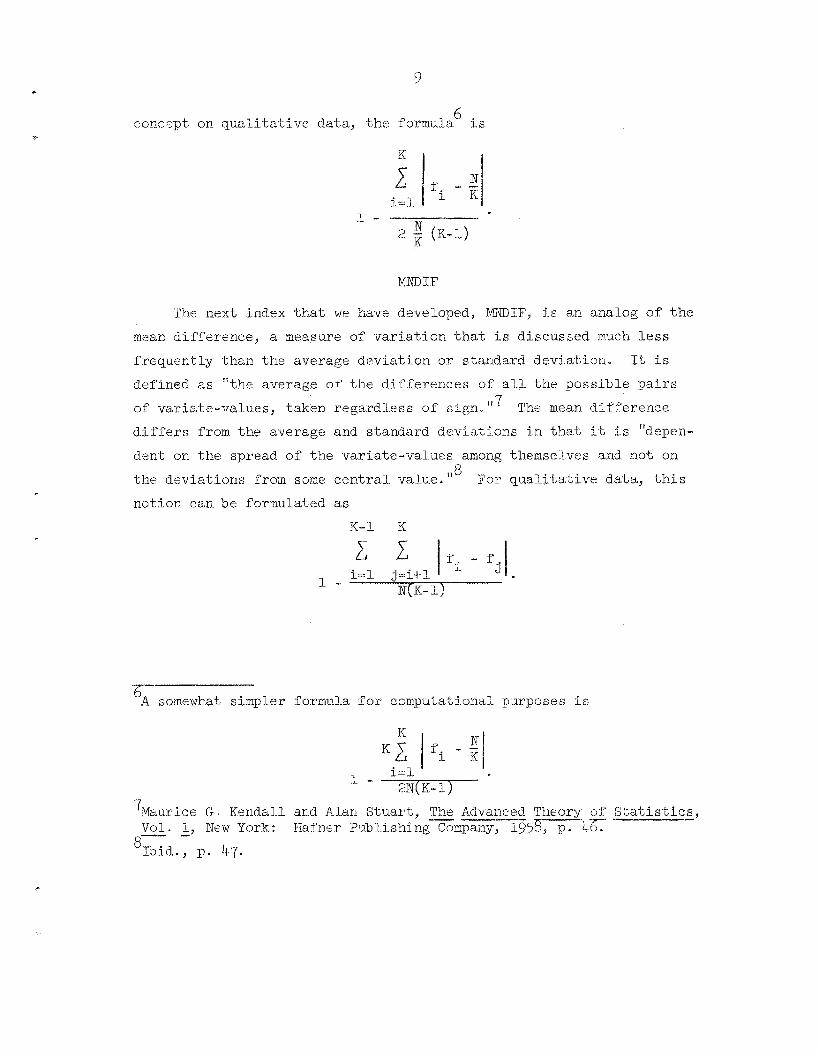
6 concept on qua l i ta l ive data, the formula is
N .L - 2 ( K - 1 )
MiiIF
The next index t h a t we have dpveloped, MNDIF, i s an analog of t h e
mean d i f fe rence , a measure of var ia t ion. t ,ha t i s discussed much Less
f requent ly than the average devia t ion o r standard devi..a"ciri. It i s def ined a,s "the average of t he d i f f e rences of a l l t he poss ib l e p a i r s of var ia te- ,values , taken regsrdl.ess o f s ign . 117
d i f f e r s from the average and s tandard dxviati.ons i n t h a t it i s "depcn-
dent on the spread of t h e var ia te -va lues among themselves ani? not on
t h e devia t ions from some c e n t r a l value. For q u a l i t a t i v e data, t h i s
not ion can be formulated as
he mean d i f f e rence
718
K - 1 K
l -
A somewhat simpler formula Tor coniputational. purposes i s 6
1 - 1 i=l
2lV( K- l ) 'Maurice C;
_- Vel. - 1, New York: Kendal-1 and Alan Stuar t , - The Advanced Theory of S t a t i s t i c s ,
Hafn.:r Publ ishing Company, lg5-4&;- %bid . , p. 47.
10
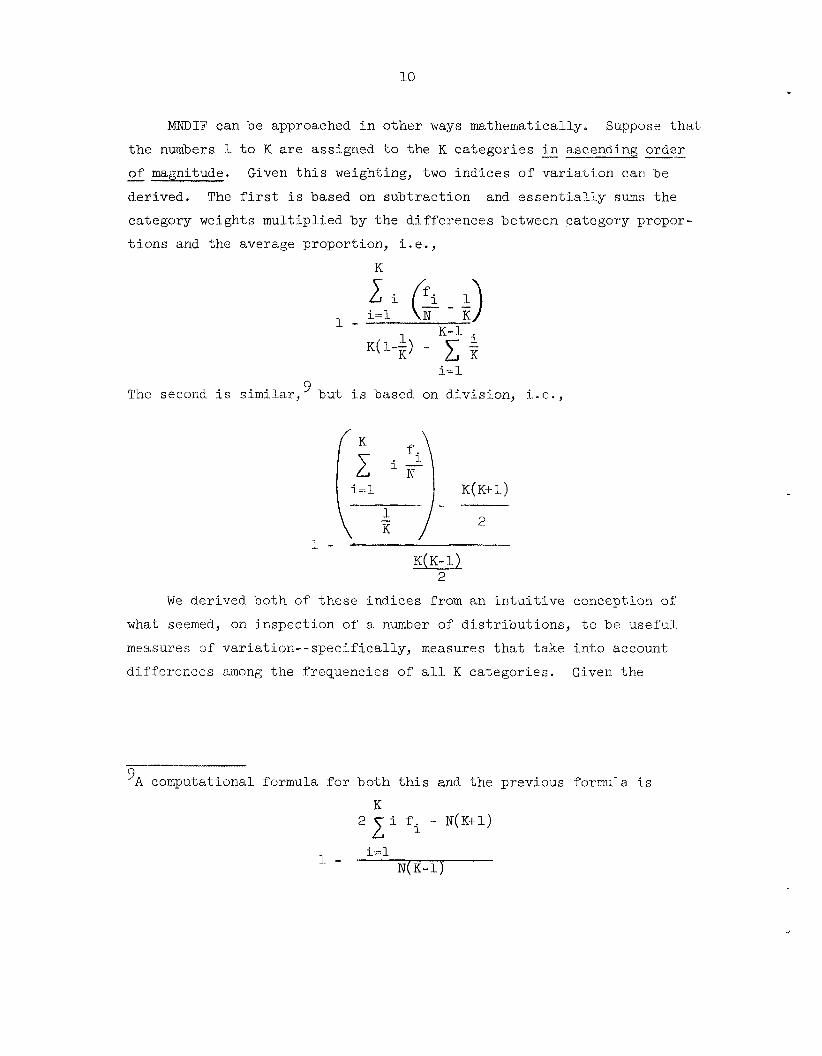
MNDIF can be approached i n o ther ways mathematically. Suppose t h a t
t h e numbers 1 t o K are assigned t o the K ca tegor i e s _I i n ascending order
- of magnitude. Given t h i s weighting, two ind ices o f v a r i a t i o n can be
der ived. The f i r s t is based on sub t r ac t ion and e s s e n t i a l l y sums t h e
category weights mul t ip l ied by t h e dLfferences between cakegory propor-
t i o n s and the average proportion, i . e . ,
K
i=l 1 - K - l . K ( 1 - l ) K - K
i=l
The second i s similar,9 bu t i s based on d iv is ion , i.e.,
K ( K - ~ ) 2
We derived both of t hese ind ices from an i n t u i t i v e conception o f
what seemed, on inspec t ion of 3 number of d i s t r i b u t i o n s , t o be u s e f u l
measures of va r i a t ion - - spec i f i ca l ly , measures t h a t t ake in-to account
d i f f e rences among t h e frequencies of a l l R ca tegor ies . Giver? t h e
‘A computational formula for both t h i s and t h e previous formula. i s
K
i=l 1 - N ( K - ~ )

91
Y-rnNC
The fif-t;h index, VARNC, i s ag. analog of: t h e variunce, which i s de-
f ined 8 s the a r i thme t i c mean of' t h e squared d i f f e rences of each value
from tke mean. For use with q u a l i t a t i v e da'ca, i t s formula i s 11.
K
1 - I!f (I(-1)
K
This formula i s q u i t e similar t o AVDEV, t he b a s i c d i f f e rence being t h a t
the d i f f e rences a r e squared. i n s t ead of having t i ieir absolute values
taken.
"It might be noted t h a t another me&.sure, Gini ' s index of euncentrat ion, is also eq!ii.valent to MIDIF when. it i s modified for. a_:.iaiitati.ve d.at7a. For a discussion of G i n i ' s index, see Hayward R . AI-ker and Bruce M. Russet t , "On Measuring Inequal i ty , i' -- Behavioral Science, 9:.1 ( .Tu. ly 1964) 207-218 e
'l~ computations1 formula i s
N"(K-I)
d( R- 1)

12
If MNBIF i s approached i n I.ike manner and a squared vers ion derived, t he
r e s u l t i n g formula i s
K - 1 K
-x Gi - f j ) Y i = 3. J-=i+ 1
1 - - N'(K-1)
1% and i s equal t o VARNC.
Mueller and Schusslei- ' s Index oi' Qual i t a t ive Var ia t ion (IQV). '' base t h i s index on the idea t h a t t h e t o t a l number of d i f f e rences among
t h e ca tegor ies ( o r i n t h e i r terminology, Ttems) of a given va r i ab le
p o v i d e s a means of measuring q u a l i t a t i v e v a r i a t i o n . This to ta l - i s
obtained by counting the d i f f e rences between each category and every
o ther category and summing these d i f f e rences . Thus, using sex as an
example of q u a l i t a t i v e var iab le , " i f t h e r e were nine boys and t h r e e
girls, each of t he nine boys would d i f f e r from each of -the t'nree g i r l s ,
producing 27 d i f f e rences . I"-'
t h e fol lowing ru l e : mul.tiply every category frequency by every other
category frequency and sum these products. Although the authors do not
VARNC can be approached. i n another way through a d iscuss ion of
They
They reduce t h i s counting procedurci: t o
l2This is similar to t he case for q u a n t i t a t i v e da t a . A s Kendall and S t u a r t note, a squared mean d i f fe rence i n t h e q u a n t i t a t i v e case i s equal t o twice t h e var iance. Op c i t . , p. '17.
l3S0hn E . Mueller and Karl P. Schuessler, S t a t i s t i c a l Reasoninp; i n Sociology, Boston: Houghton Mi f f l i n Company, 1961,- pp. 177-17q
l4=., p. 1-77.

present a genera l formula,15 one can be constructed as follows:
This formula i s a l s o a l g e b r a i c a l l y equivalent t o VARNC.
F ina l ly , VARNC can a l s o be der ived by s tandard iz ing A 2 t y p i c a l formula for X. i s
2 K 2 (Oi - Ei)
i=l *i
where 0 =. the observed frequency f o r the Lth category, and i E. = the expected frequency for t he I i t h category. 1
Subs t i t u t ing t h e nota t ion used i n t h i s paper, t he formula i s
K
c i=l K
1. A computational formula:
K - 1 K

14
and, when standardized, it becomes
1 -
K z (fi - :)2 i=l
N N( K- 1) K
which reduces t o VARNC.
STDEV
STDEV, t he f i n a l analog index t h a t we have developed, i s based on the standard deviat ion, which i s def ined as the square roo t of the v a r i -
ance.
AVDEV o r with MNDIF. From AWEV, the formula i s
A s with VARNC, a formula can be der ived by s t a r t i n g e i t h e r with 16
N 2 K 2 ( f i - E) i=l
( N - ! ) 2 + (K-1)(i)2 1 -
From MNDIF, t he formula i s
computational formula:
1.5
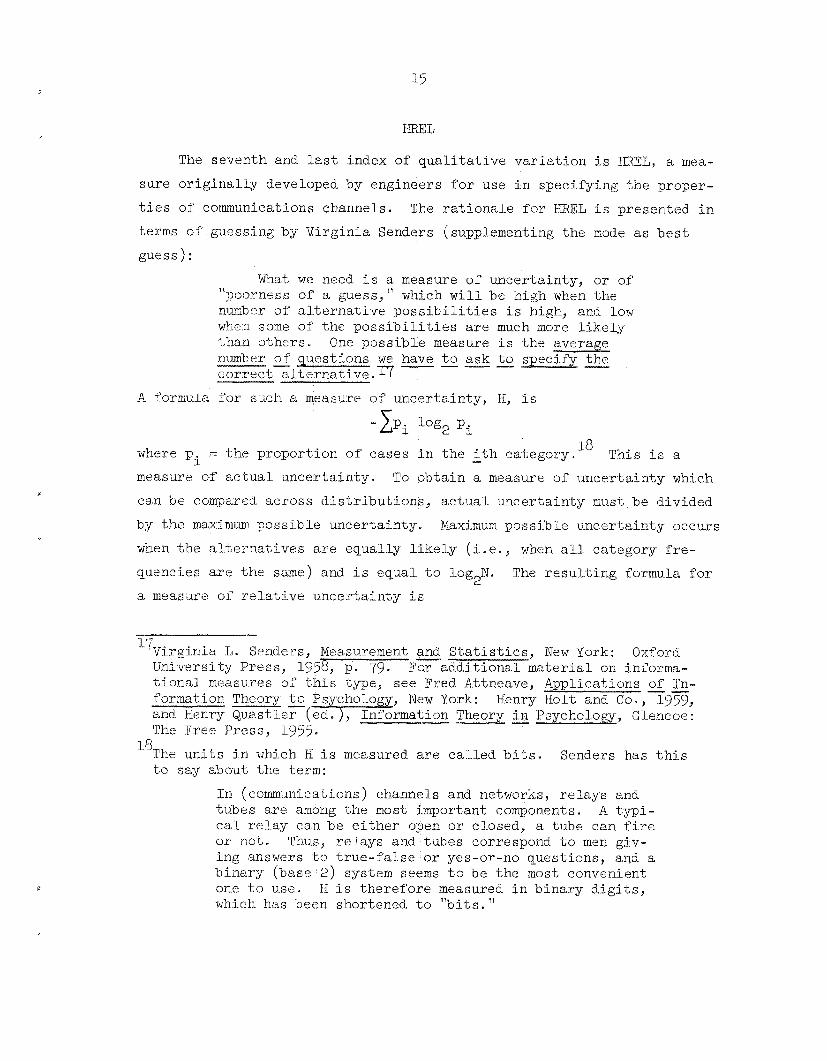
The seventh and las t index of q u a l i t a t i v e va r i a t ion i s mEL, a mea-
sure o r i g i n a l l y developed by engineers for use i n spec i fy ing the proper-
t i e s of coinmunications channels. The r a t i o n a l e f o r HXEL i s presented i n terms of guessing by Virg in ia Senders (supplementing t h e mode as b e s t
guess):
What we need i s a measure of uncertainty, o r of‘ “poorness of a guess,” which w i l l be high when the n1mbP.r of a l t e r n a t i v e p o s s i b i l i t i e s i s high, and low when some of the p o s s i b i l i t i e s a r e much more l i k e l y than o thers . Qne poss ib l e measure i s t he average nmber of gues t ions we have t o ask t o spec i fy the iorreet a l t e r n a t i v e .r7
-_I__I
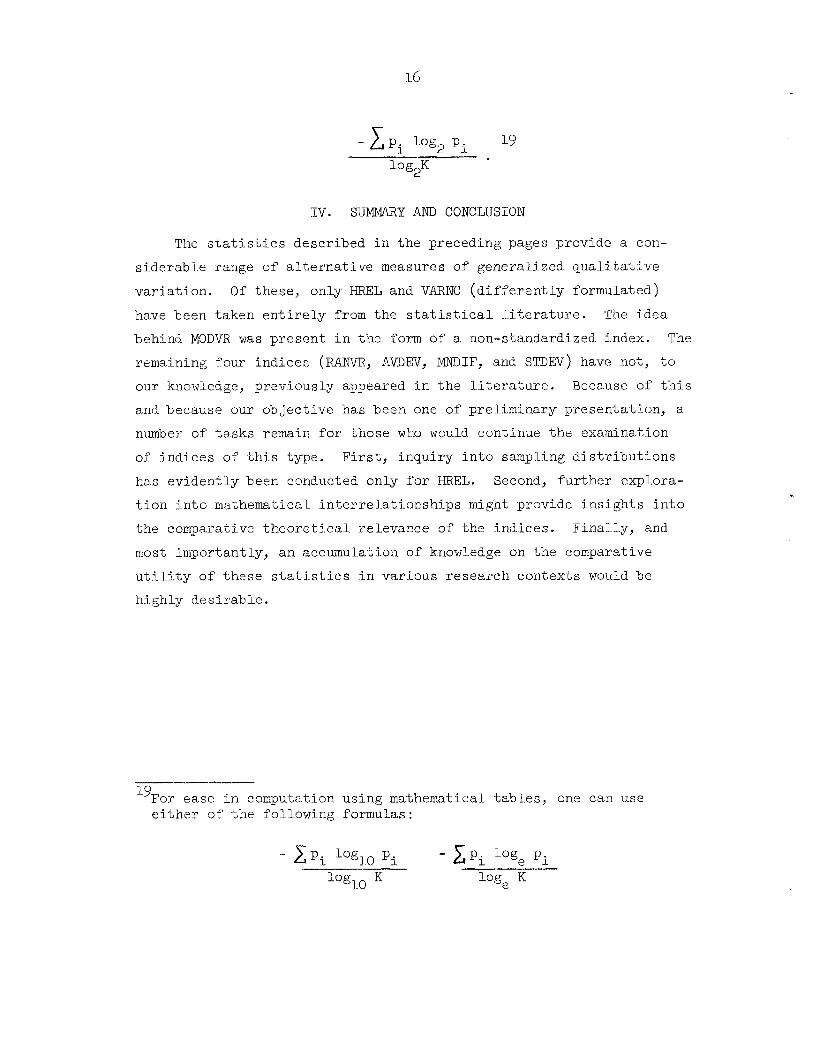
A formula Cor such a measure of uncertainty, H, i s
- z P i log2 Pi
This i s a 18 where p = t he proport ion of cases i n the i t h category.
measure of a c t u a l uncer ta in ty . To ob ta in a measure of uncer ta in ty which
can be compared across d i s t r i b u t i o n s , a c t u a l uncer ta in ty must be divided
by the maximum poss ib le uncer ta in ty .
when t h e a l t e r n a t i v e s a r e equal ly l i k e l y (i” e . , when all. catcgory f r e -
quencies a r e the same) and i s equal t o log N. The resuLting formula for
a measur? of r e l a t i v e uncer ta in ty i s
- i
Maximum poss ib l e uncer ta in ty m c u r s
2
1‘7Virginia TJ. Senders, Measurement - and S t a t i s t i c s , New York: Oxford Uni-irersity Press, 1958, p. 79. For a d d i t i o n a l ma te r i a l on informa- t i o n a l mcasures of t h i s type, see Fred Attneave, Applications of In- formation Theory t o Psychology, New York: Henry H o l t and Co., 1959, and Henry Qua .s t le r ( ed. ), Information Theory i n Psycholopy, Glencoe: The Free Press, 1‘355.
to say about the term:
-- -
“The u n i t s i n which H i s measured are ca l l ed b i t s . Senders has t h i s
In (communications) channels and networks, r e l ays and tubes are among t h e most important components. A ty-pi- ea1 r e l a y can be e i t h e r open o r closed, a tube can f i r e OY not . Thus, r e l ays and tubes correspond t o men giv- ing answers t o t rue - fa l se o r yes-or-no quest ions, and a b ina ry (base 2) system seems t o be the most convenient one t o use. H i s t he re fo re measured i n b ina ry d i g i t s , which has been shortened t o “b i t s . ”
IV. SUMMARY AND CONCLUSION
The s t a t i s t i c s descr ibed i n the preceding pages provide a con-
s ide rab le range of a l t e r n a t i v e measures of general ized q u a l i t a t i v e
v a r i a t i o n . O f these, only HREL and VAKNC ( d i f f e r e n t l y formulated)
have been taken e n t i r e l y from t h e s t a t i s t i c a l l i t e r a t u r e . 'The idea
behind MODVR was present i n t he form of a non-standardized index. The
remaining four ind ices (RfYNVR, AVDEV, MNDIF, and STDEV) have not, t o
our knowledge, previously appeared i n t h e l i t e r a t u r e . Because of t h i s
and because our objec t ive has been one of prel iminary presenta t ion , a number of tasks remain for those who would continue t h e examination
of ind ices of t h i s type. F i r s t , inqui ry i n t o sampling d i s t r i b u t i o n s
has ev ident ly been conducted only f o r HREL. Second, fu r the r explora-
t i o n i n t o mathematical i n t e r r e l a t i o n s h i p s migh-t provide i n s i g h t s i n t o
the comparative t h e o r e t i c a l relevance of t he ind ices . F ina l ly , and
most importantly, an accumulation of knowledge on t h e comparative
u t i l i t y of t hese s t a t i s t i c s i n var ious research contex ts would be
h ighly des i r ab le .
"For ease i n computation us ing mathematical t a b l e s , one can use e i t h e r of t h e following formulas :
APPENDIX A
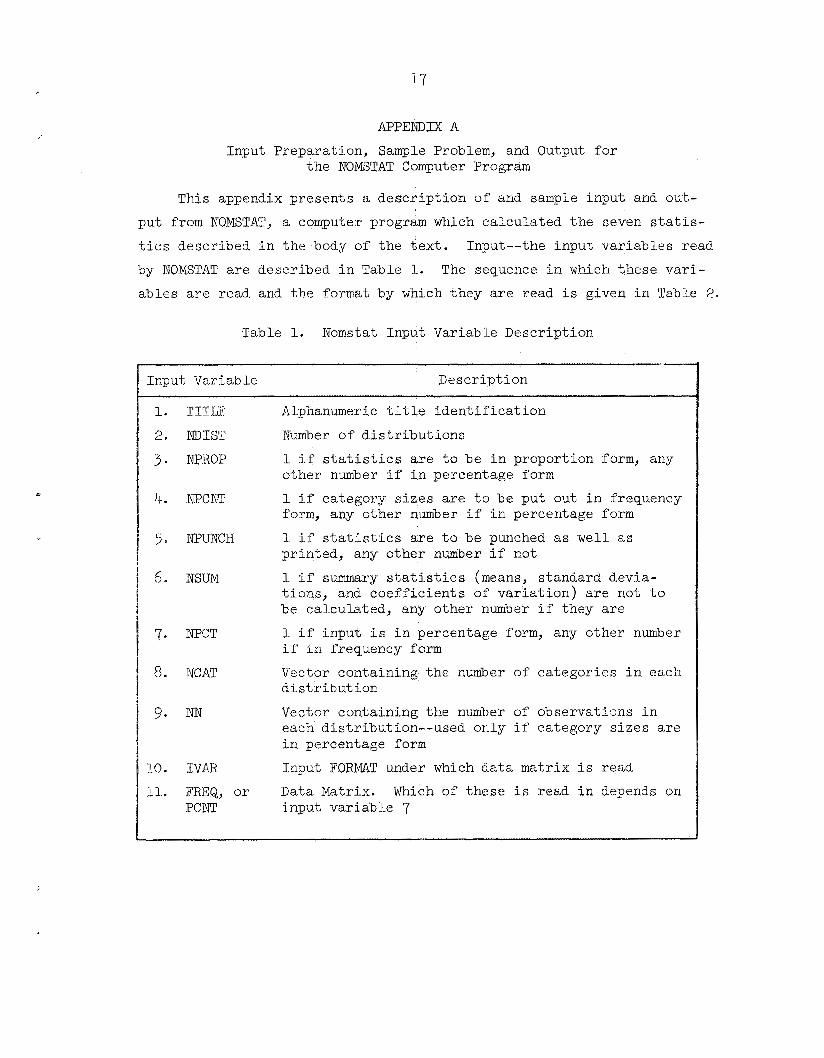
Input Preparat ion, Sample Problem, and Output f o r t he NOMSTAT Computer Program
This appendix presents a desc r ip t ion of and sample input and out-
pu t from NOMSTAT, a computer program which ca lcu la ted the seven s ta t i s - t i c s descr ibed i n the body of t he t e x t .
by NOMSTAT a r e descr ibed i n Table 1.
ab le s a r e read and the format by which they a r e read i s given i n Table 2.
Input--the input va r i ab le s read
The sequence i n which these v a r i -
Table 1. Nomstat Input Variable Descr ipt ion
1 Input Variable Descr ipt ion
I 1.
' 2.
3 -
4.
5.
6.
7-
8.
9.
10
11.
TITLE
NDIST
NPROP
mcm
NPURCH
NSUM
NPCT
NCAT
-m
IVAR
FREQ, or PCN!r
Alphanumeric t i t l e i d e n t i f i c a t i o n
Number of d i s t r i b u t i o n s
1 i f s t a t i s t i c s are t o be i n proport ion form, any o ther number i f i n percentage form
1 i f category s i z e s a r e t o be put out i n frequency form, any o ther number if i n percentage form
I i f s t a t i s t i c s a r e t o be punched as we l l a s pr in ted , any o ther number i f not
1 i f summary s t a t i s t i c s (means, standard devia- t i ons , and c o e f f i c i e n t s of v a r i a t i o n ) a r e not t o be ca lcu la ted , any other number i f they a r e
1 if input i s i n percentage form, any other number i f i n frequency form
Vector containing the number of ca tegor ies i n each d i st r ibu t i on
Vector containing the number of observati-ons i n each d is t r ibu t ion- -used only i f category s i z e s a r e i n percentage form
Input FORMAT under which da ta matr ix i s read
Data Matrix. input va r i ab le 7
Which of these i s read i n depends on
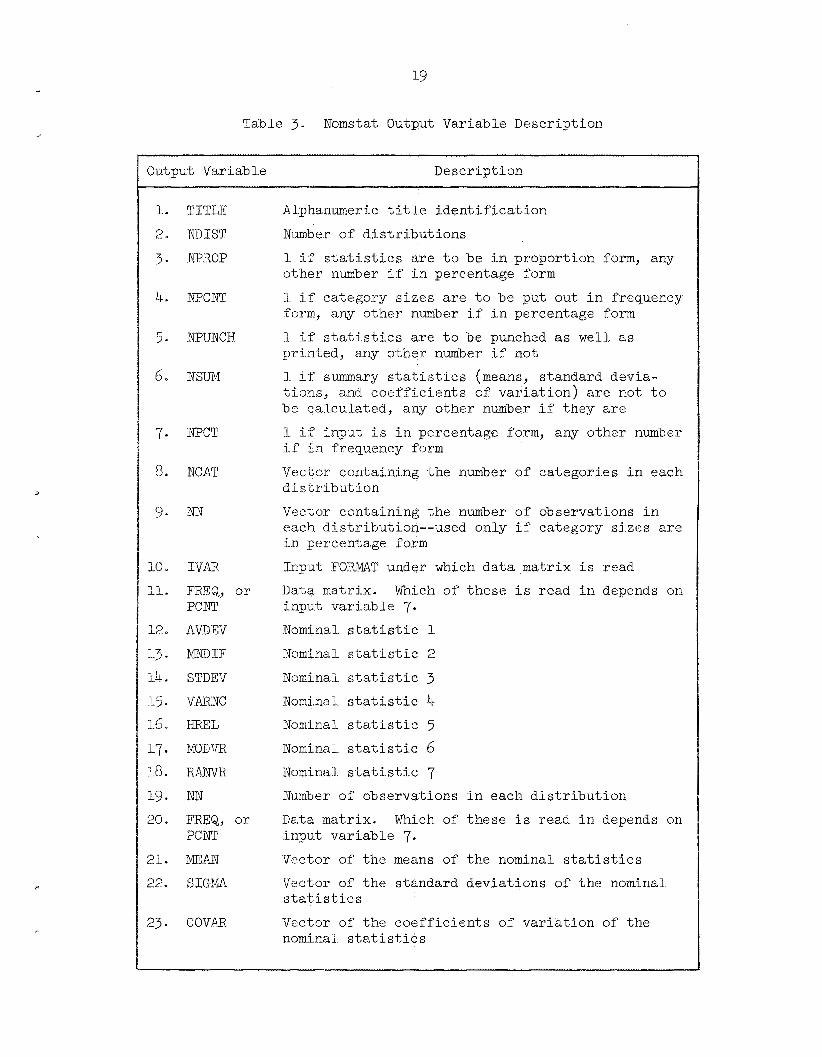
Table 3. Nomstat Output Variable Descr ipt ion
Output Variab l e Descr ipt ion
1. TITLE
2. mIsT 3. NF’ROP
5. WUNCH
6. NnrsOM
7. XPCT
8. NCAT
9. NN
10. IVAI
11. FREQ, o r
12. AVDE’iT
pcrrt-
13. MCTDIF
14. STDEV
l.5. VAiRNC 16. r n L
17. MODVR 18. RANVR
19. NN
20- FREQ, or PCMI
21. MEAN
22. SIGMA
23. COVAR
Alphanumeric t i t l e i d e n t i f i c a t i o n
Number of d i s t r i b u t i o n s
1- i f s t a t i s t i c s a r e t o be i n propor t ion form, any o ther number i f i n percentage form
1 i f category s i z e s a r e t o be put out i n frequency form, any o ther number if i n percentage form
l i f s t a t i s t i c s a r e t o be punched as wel l as p r in t ed , any o ther number i f not 1 i f summary s t a t i s t i c s (means, s tandard devia- t i ons , and c o e f f i c i e n t s of v a r i a t i o n ) a r e not t o be ca lcu la ted , any o ther number i f they a r e
1 i f input i s i n percentage form, any o ther number i f i n frequency form
Vector containing t h e number of ca tegor ies i n each d i s t r i b u t i o n
Vector containing the number of observations i n each d is t r ibu t ion- -used only i f category s i z e s a r e i n percentage form
Input FORMAT under which data matr ix i s read
Data matrix. Which of t hese i s read i n depends on input va r i ab le 7. Nominal s t a t i s t i c 1
Nominal s t a t i s t i c 2
Nominal s t a t i s t i c 3
Nominal s t a t i s t i c 4 Nominal s t a t i s t i c 5 Nominal s t a t i s t i c 6 Nominal s t a t i s t i c 7 Number of observations i n each d i s t r i b u t i o n
Data matr ix . Which of these i s read i n depends on input va r i ab le 7. Vector of t h e means of t he nominal s t a t i s t i c s
Vector of the standard devia t ions of t he nominal s t a t i s t i c s
Vector of t h e c o e f f i c i e n t s of v a r i a t i o n of t h e nominal s t a t i s t i c s

20
Table 4. Nomstat Output Variab1.e Sequence arid Sense Switch Control
S e que nc e
1.
2.
3- 4. 5. 6.
‘7
8.
9.
10.
Output Variable
TITLE
NDIST, NPROP, NpC1. i , WUNCH, NSUM, NPCT
NCA’T
NN
I V A R
FREQ, o r PCNT
AWEV, PINDIF, STDEV, VRRJ!K, I-ITIEL, MODVR, RANVR
NN
FREQ, o r PCl!
MEAN, SIGMA, COVAR
- -
Sense Swftch Control
FREQ (If NPCNT=1) , otherwise PCNT
If NSITM # 1
21
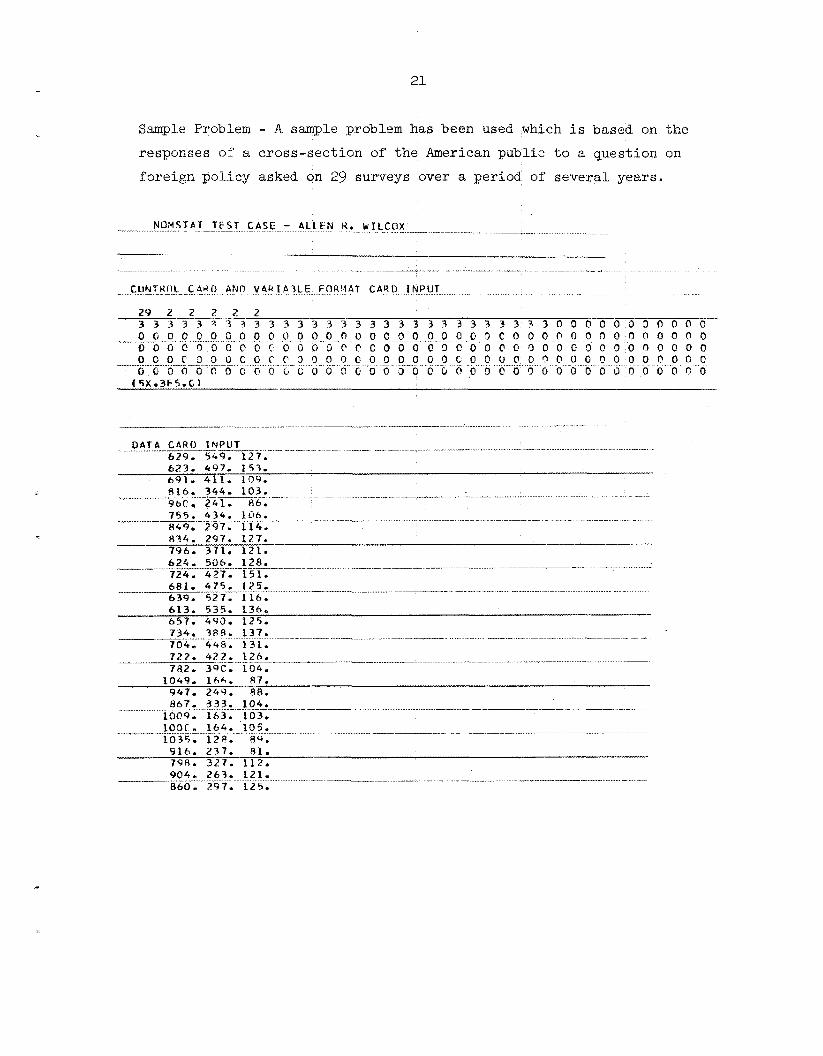
Sample Problem - A sample problem has been used which i s based on
responses of a c ross -sec t ion of t h e American publ ic t o a quest ion
fore ign po l i cy asked on 29 surveys over a per iod of several years
t he
on
22
-- . - - - - - __- - __ - - _ -
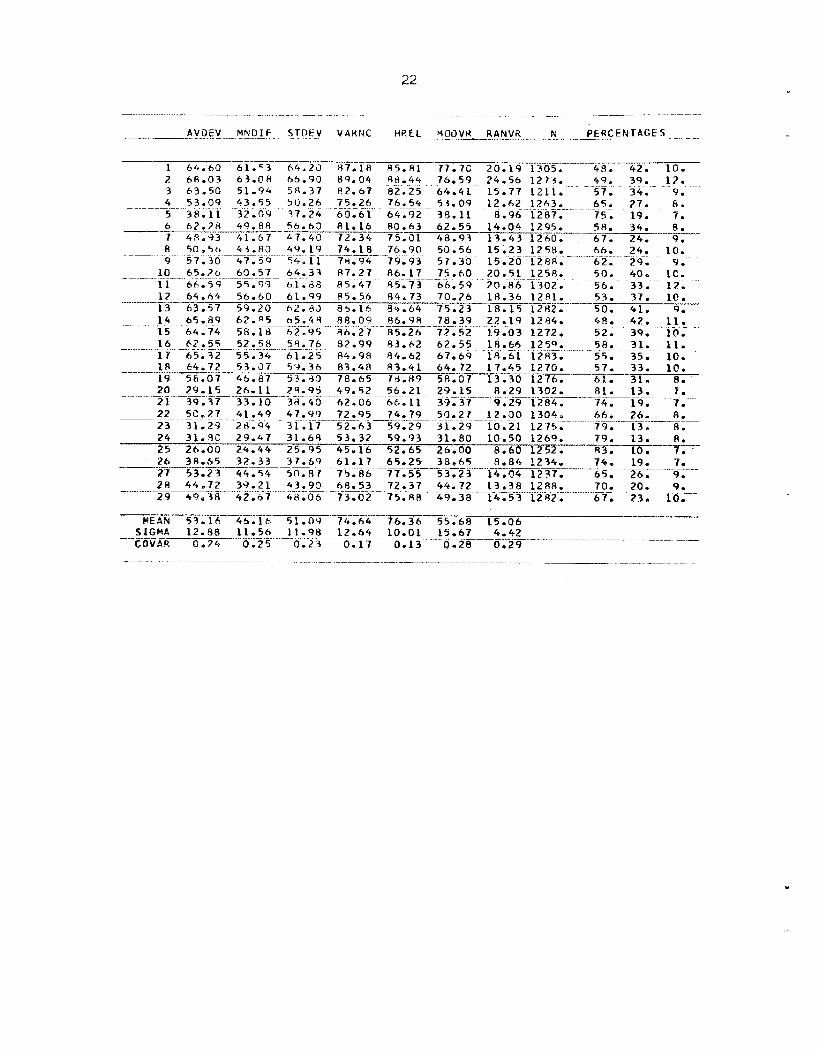
AVDEV MNDJF 5 T D k V V A K N C HREL ’4t$lVJL_-RANVR N _PF_RCENTAGES
II- - I_ __ - - - _. --_____ 1 64.60 61.53 6 4 - 2 3 HTXR 45.81 77.7C 20.19 1305 . 4 8 . 42 . l a . 3 63.50 51.94 5 8 - 3 7 P2.67 6 2 - 2 5 64 .41 15.77 1211 . 57 . 34. 9.
5 3 8 . 1 1 3 2 - 0 9 3 7 - 3 4 60.61 64.92 38 .11 8.96 1287 . 75. 19. 7 .
__- . ? 6 8 - 0 3 - _ 6 3 . @ R - b6 .90 89.04 8 8 - 4 4 76.59- 2 6 - 5 6 1 2 7 3 . 4 9 . 39.- 1 2 .
____ 4 - 53.09 _ _ 43.55 50.26 75.26 76.54- 53.09-12-.h2- 1263,__ 6 5 . 27. 8,
6 6 2 - 2 8 49.88 56.63 81.16 80.63 62.55 14.04 1295% 58 . 34. ----8A- 7 4 ~ . 9 3 41.67 47.40 72.34 75.01 48.93 1 3 . 4 3 1260. 6 7 . 24. 9.
. _ _ 8 _ ~ O e S t ~ _ ) 3 . 8 3 -49.19 - - - 74 .18 - -76.90 50.56--15.23 1258 . 56 . 24 . 10. 9 57.30 4 7 1 5 9 54.11 7 # . 9 4 79.93 57.33 15.20 128R.- 6 2 . 29 . -9.
- _ - 10 65-?6 - 6 9 - S L - 622-33 A7.27 8 6 - 1 7 - 7 5 . 6 0 20 .51 -125R. - - 5 0 . 40. 1 C . 11 66.5’4 55.0’3 6l.d8 H5.47 45.73 66 .59 20.86 1307. 5 6 . 3 3 . l? .
5 0 . 41. 9. -. 17 64.64 5 6 s 61.99 P5.54 84.73 ,70.?6 1R.36 12P1. - 53 . 7 7 . lo.*-
- _ _ __ 1 6 _ _ 67,5_5-52.58 58.76 82.99-_83.62 67.55 1-8.56 1259 . 5e. 3 1 . - 11.
19 58.07 4 6 - 8 7 53.40 78.65 r8.89 5R.07-13.30 1276 . -TI, 3 1 . a.
21 39.17 33 .10 3d.43 62.06 6 4 - 1 1 39.37 9.29-1284. 74. 19; 7.
1 3 63.57 59.20 62-83 8 5 - 1 6 84.64 75 .23 18 .15 1282. ___- 1 4 - 6 5 - 8 9 h2.Q5 h 5 . 4 4 - 88.00 96.9R 7c .39 22.19 ! 2 @ 4 . _ _ - 4 A e - 41.- 11.
1 5 6 4 - 7 4 5 8 - 1 6 62 .95 8 6 - 2 7 35-26 72.52 19.03 1272 . 52. 39, 10.
17 65.32 55.34 61.25 R4.98 84.62 67.69 lR.61 1283- 55 . 3 5 . 10. 18 64.72 53.57 59 .36 83.4R 83 .41 64.72 17.45 1 2 7 0 . 5 7 . 3 3 . 10.
20 81. 13. 7. 2 9 - 1 5 2 6 - 1 1 2 S - 9 5 - 4 9 . 5 2 56.21 29.&5- -_ 8.29 1392. __ __ 22 5C.27--41-4? _ 4 7 - 9 9 72295-74.79 50.27 - 12.00 1304.- h e . 2 6 . A . _
23 31.29 26 .94 31.17 -52.h3 5 9 2 9 - 31.29 10.21 1275 . 7 9 . 13. 8 . 2 4 3 1 . 9 C 2 9 - 4 7 3 1 - 6 8 53.32 59.93 3 1 - 8 0 10.50 1269 . 7 9 . 13. A. 2 5 26.00 2 4 - 4 4 25.95 45.16 52.65 26.00 8 . 6 0 1 2 5 2 . A3. 18. T:7
27 53.23 44.54 50.87 7 5 ; f i a 7 7 : r 5 - 3 T z 3 14.Q4 1237. 6 5 , 26 . 9. 20. 9.
29 49.38 42.07 48.06 73.02 751.88- 49.38 14 .53 1 2 8 2 . 6 7 . 2 3 . 10.
2-6 34.55 32.33 3 7 . 6 9 61.17 65.24 38.65 8.84 1234 . 96. 19. 7. ___ __ - __ ________
9 o i _______ 28 44.72 39.2’1 4 2 ~ 9 0 6 8 - 5 3 72.37 3 3 - 7 2 13.38 128R. __ _I -- -- __ --___- ---I-
WEAN 5 3 - 1 6 46 .16 51.09 74.64 76.36 5 5 - 4 6 15.06
-- - - SIGMA 1 2 - 6 8 11.56 1 1 - 9 6 1 2 - 6 4 10.01 15.67 4 . 4 2 - - _ _ __-___ C O V A R 0.74 0.75 -0.2-3---0;17 -- 0.13 0.2e--0.29
23
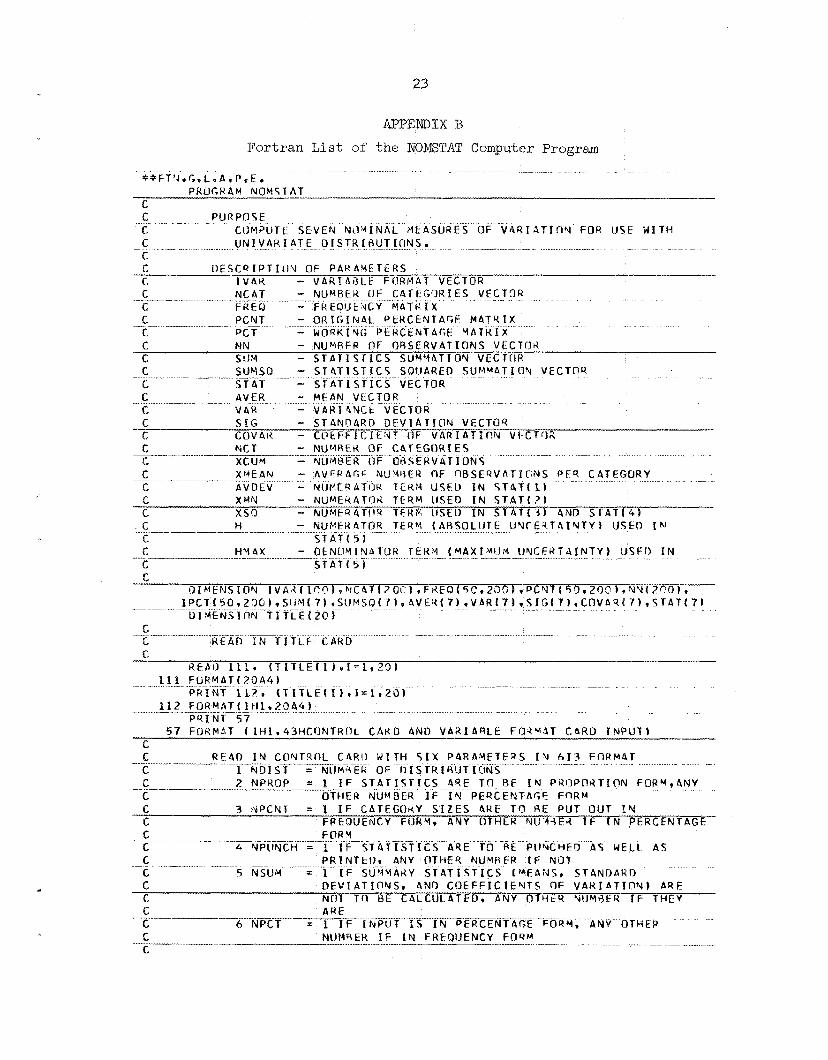
APPENDIX 13
For t ran L i s t of' the bOMSTAT Computer - -- - - __
**FT'J.G,L,A,P.E.
Program -. _ _ . .
PROGRAM NOM1';TAT C C - PUR PO F E_ C CIIb11PUTE S E V E N N c l G I N 4 L M t A S U R E S OF ' V A R T A T I I Y F O R U S E W I T H
C -_I_ _ _ - _ _ - - - c _ _ U N I V A R I A T E O I S T R I R U T I O N S m
C I ) i % C Q 1 P T I L ) V OF PAR A Y E T E R S c. I V A R - V 4 R I 4 3 L E F ( J K M A T V F C T O R r. N C A T - N H Y B F K OF C A T E G ' 3 R I E S V E C T O R c.-- - - -_ - - I
!-REO - FKEQlJh \1CY W4TR 1 X PCNT - O K I G I N 4 L P k K C E N T A G F M A T R I X -c - I_______
C P C T - N f l Q K I Y G P t H C E N T 4 G E Y A T K I X C N N - N U M A F R OF O R S E R V A T I O N F V E C T f l d C SlJM - S T A T I S T I C S SUMM4T l l7FJ V E C T O R e - __ - - ~ S U N S D _ - - - S T 4 T I S T I C 5 SRI IARED S U M ~ A T I O Y V E C T O R _ _ C FT 4 1 1 STATIS~ICS V E C T O R
H Y A X .... -
24
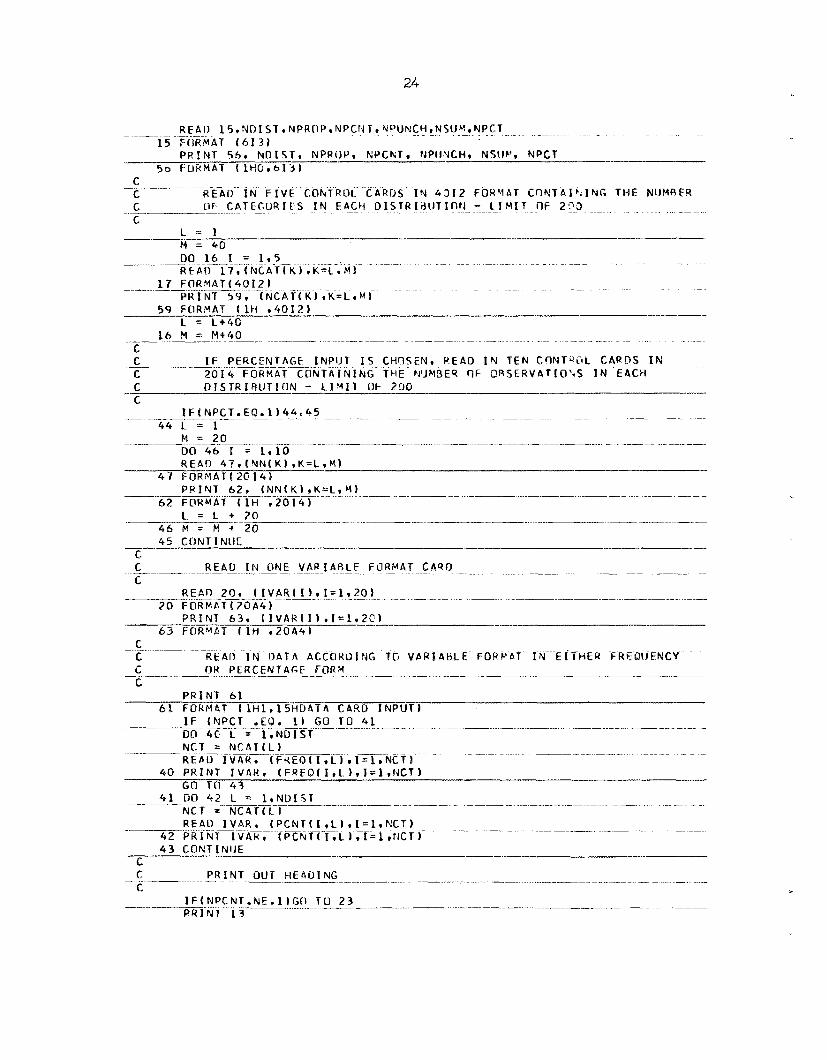
25
C C I N I T I A L I Z E TO 0 TWO V E C T O R S - SUM ( S U M M 4 T I O N - ~ b F - ~ T H E ~ ~ N ~ Y I N A L ~ - ~ - ~ -
C S Q U A R E D 1 C
- ...... - ................... .-_.I__._l.. .......
__ I: S T A T I S T I C S ) P M O SUNSO ( S U M M A T I O N OF T H E N O Y I Y A L STATlSTICS
_̂....l_ii._..._.._..-...-.-.....-............--..-............._.....l.I i ..... .. 24 00 19 I = 1.7 19 S U M ( ! ) = SUMSO(11 = 0
_.-__I_ __._I.-.---_I____I__.___.-. __-_I ... ....... .......... C c R E C I Q M A J O R DO L O O P - C A L C U L A T f O N OF S T A T I S T I C S C
C -___ DO 50 K = _-L?ND_I_s_T_ i ~~~~~-
C C c
______
N C T = N C A T 1 Y ) I F f P C T . E Q - 1 ) G O T O 49 . _liI
XCIJM = 0
... ..- __ - .- ~- _____._---- C StJY N U M E R A T O R T E R M S FOii S T A T l S T I C S 1-5 C
X M E A N 2 X C l I W / N C T A U D E V = XMV = XSQ = H = C 00 6 H = l r N C T
.... ........ ......... ___.l_ll_._ll______I._II__--
65 H = H + ( - 1 + P C N f f M ~ K ~ / l O ~ ~ a I L O G F ( P C N T I M ~ ~ ~ / l ~ ~ ~ ~ L ~ ~ F ~ ~ ~ ~ ~ 8 AVDEV = P V O t V + A H S F ( P C N T ( b'* K ) * X C U h ~ / l O O - X I " I E A h l )
M P = H + 1 ................ ___ ........ ...............................
DO 6 MPP = Y P v N C T 6 X Y N = XM'J+A6S F ( PC N T ( Y .K *X CU Y / 1OO-PC N T I MPP 9 K * X C I I Y / 100 1 --__ ........... &__ .................... ...... ........................ c
C C A L C U L A T k S T A T I S T I C S 1 -5 f
N C T l N C T - 1
S T A T ( 4 ) = 1 0 0 - l Q O * N C T ~ X S W / l X C U ~ ~ ~ ~ ~ h l C ~ l ) X C T = N C T
__________- - ................ - .................. c c FIMO L A R G E S T A N D S Y A L L E S T C A T E G O R Y P E R C E N T 4 G E 5 FOR U S E I N

26
c c C A L C U L A T k P R n P O K T I O N 5 I F R E Q U E S T E D
...... ~ ....... ....... ......... c IFINPROPTNE.~)GO T O HZ Dl3 R O 1 = l r 7
~ -.-________ ........ ~_ ....... ................ ......... R Q STATlIl = STAT(I)/100
C C SUM ?^GE-'?S?-ATISTICS AND THE S T A T I S T I C S SQtJ4RED
----..-I-
...... ....... - . __._ . 82 DO 2 1 I 1 9 7
SUM( I I = SlJM6 1 ) + S T A T I I ) .. - --- ..... 21 S U M S Q ~ I ) = S U Y S Q ~ II+STPT( I )s*2
.- C c P R I N T M 4 1 N n U T P U T IN E I T H E R FREQTCNCY OR P E R C S N T A G E FORM c .- . . . . ~ - ~ . ~~ ........... .................
I F ( N P C N T . N E . 1 ) G O T U 7 1
r

27
ACKNOWLEDGEMEET'S
The author gratefully acknowledges the careful perusal of and
helpful commentary on this paper by M. A. Kastenbaum and W. E. Lever
of the Statistics Section and by Pamela Wilcox of the C i v i l Defense
Research Project.


29 c
ORNL-TM-1919
INTERNAS; DISTRIBUTION
1. T. H. Atkinson 2. D. B. Bobrow 3 . S. B. Bobrow 4. M. C. B e l l 5 . W. J. Boegly, sir. 6. J. C. Bresee 7. F. R . Bruce 8. C. 17. Chester 9. G. A. C r i s t y
LO. N. E. Cut ler 11. L. Dresner 12. R. C . Durfee 13. M. Feliciario 14* D. A. Gardiner 15. C. M. Haaland 16* A. S. Householder 17. M. A. Kastenbaum 18. C. H . Kearny 19. W. E. Lever 20. J. S. Zevey 21e J. 2. Liverman 22. B. G. MacPherson
135 e
1.36.
137.
138 - 147
148 e
149.
1.50.
151-160,
161.
162.
23 * 24 - 25. 26. 27- 28. 29 * 30 31. 32.
33-57. 58.
59-60. 61.
70-84
85-134.
W. M. McMullen C. Nader D. L. Narver, Jr. D . B. nelson A. E’. Shinn J. W. Strohecker R. A. Uher V. R . Uppuluri A. M. Weinberg E. P. Wigner A. R. Wilcox P. B. Wilcox Cent ra l Research Library ORJ!JL-Y-12 Technical Library, Document Reference Section Laboratory Records Department Laboratory Records, ORNL RC ORNL Patent Off ice Lnboratory and UniverrLty Division, OR0 Divis ion of Technical In fo r - mation Extension C i v i l Defense P ro jec t Library
EXTERNAL DISTRIBUTION
Chadwick F. Alger, Department of P o l i t i c a l Science, North- western University, Evanston, I l l i n o i s Lee F. Anderson, Department of P o l i t i c a l Science, Northwestern University, Evans ton, I I l i n o i s Douglas Bwy, Department of P o l i t i c a l Science, Western Reserve TjRiver s i t y , Cleveland, Ohio L. J. Deal, C i v i l E f fec t s Branch, Divis ion of Biology and Medi- c ine, 3 . S . Atomic Energy Commission, Washington, D . C . Harold Guetzkow, Department of P o l i t i c a l Science, Northwestern University, Evans t on, I l l i n o i s Kenneth Janda, Department of P o l i t i c a l Science, Northwestern University, Evans t on, Illinois David W. Minar, Department of P o l i t i c a l Science, Northwestern University, Evanston, I l l i n o i s Col. Ralph Pennington, Advanced Research Pro j e e t s Agency, Department of Defense, Washington, D.C. Rudolph J. Rummel, Department of P o l i t i c a l Science, Univers i ty of H a w a i i , Honolulu, H a w a i i W i l l i a m Scot t , Department of Psychology, Univers i ty of Colorado, Boulder, Colorado

30
l63-l.7z0 W. E . Strope, Off ice of C i v i l Defense, Department of t he Army,
1-73-17'7. Raymond Tanter, Advanced Research P ro jec t s Agency, The Pentagon, Washington, D . C.
Washington, D.C.