indices of deprivation 2015 - gov.uk · pdf fileimd decile. the english indices of deprivation...
TRANSCRIPT

Introduction 2
Findings 3
Accompanying tables
and reports
24
Definitions
25
Technical notes 29
Enquiries
37
Responsible Statistician:
Baljit Gill
Statistical enquiries:
office hours 0303 444 0033
indices.deprivation@communiti
es.gsi.gov.uk
Media Enquiries:
0303 444 1201
ov.uk
The English Indices of Deprivation
2015
About this release
This release updates the English Indices of Deprivation 2010
The English Indices of Deprivation measure relative levels of deprivation in 32,844 small areas or neighbourhoods, called Lower-layer Super Output Areas, in England
Most of the indicators used for these statistics are from 2012/13
Key Results
The majority (83 per cent) of neighbourhoods that are the
most deprived according to the 2015 Index of Multiple
Deprivation were also the most deprived according to the
2010 Index
61 per cent of local authority districts contain at least one
of the most deprived neighbourhoods in England
Middlesbrough, Knowsley, Kingston upon Hull, Liverpool
and Manchester are the local authorities with the highest
proportions of neighbourhoods among the most deprived
in England
The 20 most deprived local authorities are largely the
same as found for the 2010 Index, but the London
Boroughs of Hackney, Tower Hamlets, Newham and
Haringey have become relatively less deprived and no
longer feature in this list
Seven of the 10 local authority districts with the highest
levels of income deprivation among older people are in
London. Tower Hamlets is the most deprived district with
regard to income deprivation among both children and
older people.
Statistical Release 30 September 2015
u
s
i
n
g
R
e
s
e
a
r
c
h
S
u
m
m

2 The English Indices of Deprivation 2015 Statistical Release
Introduction
Since the 1970s the Department for Communities and Local Government and its
predecessors have calculated local measures of deprivation in England. This
Statistical Release contains the latest version of these statistics, the English Indices
of Deprivation 2015 which update the 2010 Indices. It is important to note that these
statistics are a measure of relative deprivation, not affluence, and to recognise that
not every person in a highly deprived area will themselves be deprived. Likewise,
there will be some deprived people living in the least deprived areas.
This statistical release provides an overview of the findings of the English Indices of
Deprivation 2015 focussing on the national and sub-national patterns of multiple
deprivation, with some analysis of patterns in income and employment deprivation. A
full Research Report, Technical Report and guidance documents accompany the
release of these statistics along with a series of supporting data tables. The
Research Report contains more detailed analysis of the individual domains that
contribute to multiple deprivation.
The English Indices of Deprivation 2015 are based on 37 separate indicators,
organised across seven distinct domains1 of deprivation which are combined, using
appropriate weights, to calculate the Index of Multiple Deprivation 2015 (IMD 2015).
This is an overall measure of multiple deprivation experienced by people living in an
area and is calculated for every Lower layer Super Output Area (LSOA), or
neighbourhood, in England. Every such neighbourhood in England is ranked
according to its level of deprivation relative to that of other areas.
The analysis presented in this Statistical Release focuses mainly on the 10 per cent
of neighbourhoods that are most deprived nationally according to the Index of
Multiple Deprivation. For ease, these neighbourhoods are referred to
interchangeably in the following commentary as the ‘most deprived’ or as being
‘highly deprived’. But there is no definitive threshold above which an area is
described as ‘deprived’ or ‘highly deprived’; the Indices of Deprivation are a
continuous scale of deprivation. Users often take the most deprived 10 per cent or
20 per cent of neighbourhoods (or local authority districts) as the group of highly
deprived areas, but other thresholds can be used. Wider analysis, using different cut-
off points or summary measures for describing deprivation, is presented in the
accompanying Research Report.
1 These are Income Deprivation; Employment Deprivation; Health Deprivation and Disability; Education, Skills
and Training Deprivation; Crime; Barriers to Housing and Services; and Living Environment Deprivation. Details
of these domains and the indicators used to calculate them can be found in the Definitions section of this release.

The English Indices of Deprivation 2015 Statistical Release 3
Findings
National Distribution of Deprivation
The patterns of deprivation across England are complex. The most and least
deprived neighbourhoods are spread throughout England. Map 1 illustrates the
geographical spread of deprivation across England, showing local authority district
boundaries for context. The 32,844 neighbourhoods have been divided according to
their deprivation rank into 10 equal groups (deciles). Areas shaded dark blue are the
most deprived 10 per cent (or decile) of neighbourhoods in England while areas
shaded bright yellow are the least deprived 10 per cent.
As was the case in previous versions of the Indices, there are concentrations of
deprivation in large urban conurbations, areas that have historically had large heavy
industry, manufacturing and/or mining sectors, coastal towns, and large parts of east
London. There are also pockets of deprivation surrounded by less deprived places in
every region of England.
The most deprived neighbourhood in England is to the east of the Jaywick area of
Clacton on Sea (Tendring 018a), and this was also the most deprived
neighbourhood according to the Index of Multiple Deprivation 2010. But the Index of
Multiple Deprivation is not intended for the purpose of identifying the single most
deprived area in England. The Index ranks all 32,844 neighbourhoods and allows
users to identify the set of neighbourhoods that are most deprived, and differences
between areas in their actual levels of deprivation may be very small.

4 The English Indices of Deprivation 2015 Statistical Release
Map 1: Distribution of the Index of Multiple Deprivation 2015
Contains OS data © Crown copyright (2015)

The English Indices of Deprivation 2015 Statistical Release 5
According to the overall Index of Multiple Deprivation many of the most deprived
neighbourhoods in England face multiple issues. Almost all of them (99 per cent) are
highly deprived (i.e. in the most deprived decile) on at least two of the seven
domains of deprivation. Nearly two-thirds (64 per cent) of them are highly deprived
on four or more domains, and over a quarter (27 per cent) are highly deprived on five
or more of the seven domains.
Table 1: The most deprived 10 per cent of neighbourhoods nationally based on the Index of Multiple Deprivation, by the number of domains on which they are also in the most deprived decile
Number of domains
Number of Lower-layer
Super Output Areas
Percentage of Lower-
layer Super Output Areas
Cumulative percentage of Lower-
layer Super Output Areas
7 3 0.1 0.1
6 159 4.8 4.9
5 714 21.7 26.7
4 1,210 36.8 63.5
3 894 27.2 90.7
2 271 8.3 99.0
1 33 1.0 100.0
Total 3,284 100
Of the 3,284 most deprived neighbourhoods in England, 162 rank as highly deprived
on six or all seven domains. These neighbourhoods are not evenly distributed across
England: 114, or 70 per cent of them, are located within just 12 local authority
districts. Birmingham contains 26 such neighbourhoods; Blackpool, 15; Leeds, 14;
Bradford, 13; and Liverpool, 11. Blackpool, Barrow in Furness, and Burnley have
proportionately more neighbourhoods ranked as highly deprived on six or all seven
domains: 16 per cent of all 94 neighbourhoods in Blackpool met this criterion, as did
10 per cent of neighbourhoods in Barrow in Furness and 8 per cent in Burnley.
Change since the Indices of Deprivation 2010
The English Indices of Deprivation 2015 are based on broadly the same
methodology as the 2010 Indices. Although it is not possible to use the Indices to
measure changes in the level of deprivation in places over time, it is possible to
explore changes in relative deprivation, or changes in the pattern of deprivation,
between this and previous updates of the Indices2.
6 The English Indices of Deprivation 2015 Statistical Release
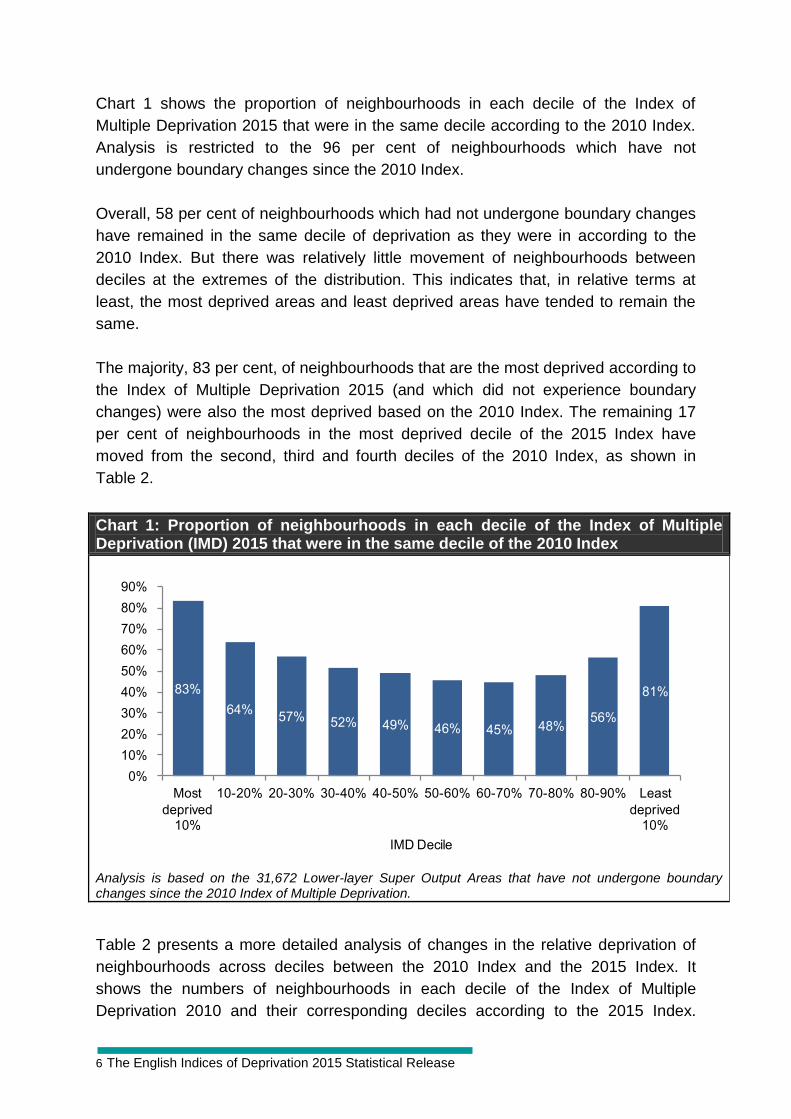
Chart 1 shows the proportion of neighbourhoods in each decile of the Index of
Multiple Deprivation 2015 that were in the same decile according to the 2010 Index.
Analysis is restricted to the 96 per cent of neighbourhoods which have not
undergone boundary changes since the 2010 Index.
Overall, 58 per cent of neighbourhoods which had not undergone boundary changes
have remained in the same decile of deprivation as they were in according to the
2010 Index. But there was relatively little movement of neighbourhoods between
deciles at the extremes of the distribution. This indicates that, in relative terms at
least, the most deprived areas and least deprived areas have tended to remain the
same.
The majority, 83 per cent, of neighbourhoods that are the most deprived according to
the Index of Multiple Deprivation 2015 (and which did not experience boundary
changes) were also the most deprived based on the 2010 Index. The remaining 17
per cent of neighbourhoods in the most deprived decile of the 2015 Index have
moved from the second, third and fourth deciles of the 2010 Index, as shown in
Table 2.
Chart 1: Proportion of neighbourhoods in each decile of the Index of Multiple Deprivation (IMD) 2015 that were in the same decile of the 2010 Index
Analysis is based on the 31,672 Lower-layer Super Output Areas that have not undergone boundary changes since the 2010 Index of Multiple Deprivation.
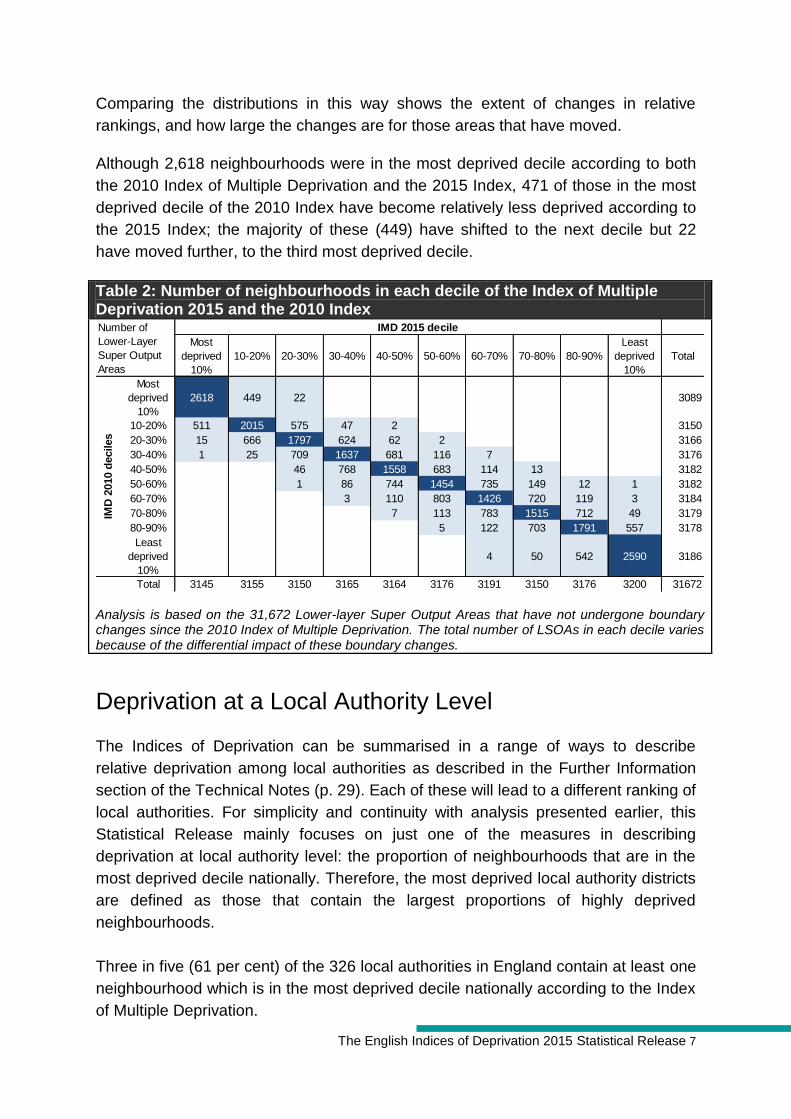
Table 2 presents a more detailed analysis of changes in the relative deprivation of
neighbourhoods across deciles between the 2010 Index and the 2015 Index. It
shows the numbers of neighbourhoods in each decile of the Index of Multiple
Deprivation 2010 and their corresponding deciles according to the 2015 Index.
83%
64%57% 52% 49% 46% 45% 48%
56%
81%
0%
10%
20%
30%
40%
50%
60%
70%
80%
90%
Most
deprived 10%
10-20% 20-30% 30-40% 40-50% 50-60% 60-70% 70-80% 80-90% Least
deprived 10%
IMD Decile
The English Indices of Deprivation 2015 Statistical Release 7
Comparing the distributions in this way shows the extent of changes in relative
rankings, and how large the changes are for those areas that have moved.
Although 2,618 neighbourhoods were in the most deprived decile according to both
the 2010 Index of Multiple Deprivation and the 2015 Index, 471 of those in the most
deprived decile of the 2010 Index have become relatively less deprived according to
the 2015 Index; the majority of these (449) have shifted to the next decile but 22
have moved further, to the third most deprived decile.
Table 2: Number of neighbourhoods in each decile of the Index of Multiple Deprivation 2015 and the 2010 Index
Analysis is based on the 31,672 Lower-layer Super Output Areas that have not undergone boundary changes since the 2010 Index of Multiple Deprivation. The total number of LSOAs in each decile varies because of the differential impact of these boundary changes.
Deprivation at a Local Authority Level
The Indices of Deprivation can be summarised in a range of ways to describe
relative deprivation among local authorities as described in the Further Information
section of the Technical Notes (p. 29). Each of these will lead to a different ranking of
local authorities. For simplicity and continuity with analysis presented earlier, this
Statistical Release mainly focuses on just one of the measures in describing
deprivation at local authority level: the proportion of neighbourhoods that are in the
most deprived decile nationally. Therefore, the most deprived local authority districts
are defined as those that contain the largest proportions of highly deprived
neighbourhoods.
Three in five (61 per cent) of the 326 local authorities in England contain at least one
neighbourhood which is in the most deprived decile nationally according to the Index
of Multiple Deprivation.
Most
deprived
10%
10-20% 20-30% 30-40% 40-50% 50-60% 60-70% 70-80% 80-90%
Least
deprived
10%
Total
Most
deprived
10%
2618 449 22 3089
10-20% 511 2015 575 47 2 3150
20-30% 15 666 1797 624 62 2 3166
30-40% 1 25 709 1637 681 116 7 3176
40-50% 46 768 1558 683 114 13 3182
50-60% 1 86 744 1454 735 149 12 1 3182
60-70% 3 110 803 1426 720 119 3 3184
70-80% 7 113 783 1515 712 49 3179
80-90% 5 122 703 1791 557 3178
Least
deprived
10%
4 50 542 2590 3186
Total 3145 3155 3150 3165 3164 3176 3191 3150 3176 3200 31672
Number of
Lower-Layer
Super Output
Areas
IMD 2015 decile
IMD
2010 d
eciles

8 The English Indices of Deprivation 2015 Statistical Release
More extreme neighbourhood deprivation is concentrated among fewer local
authorities: about one in five local authorities (22 per cent) contain at least one
neighbourhood which is in the one per cent most deprived nationally.
Deprived neighbourhoods have become more dispersed since 2004: the proportion
of local authorities containing at least one neighbourhood in the most deprived decile
has increased with successive updates of the Indices of Deprivation (see Chart 5).
Just under half (49 per cent) of local authorities, based on current boundaries3,
contained at least one highly deprived neighbourhood according to the Index of
Multiple Deprivation 2004, compared to 61 per cent on the 2015 Index.
Chart 5: Proportion of local authorities with at least one neighbourhood in the most deprived decile nationally
This analysis uses current local authority district boundaries
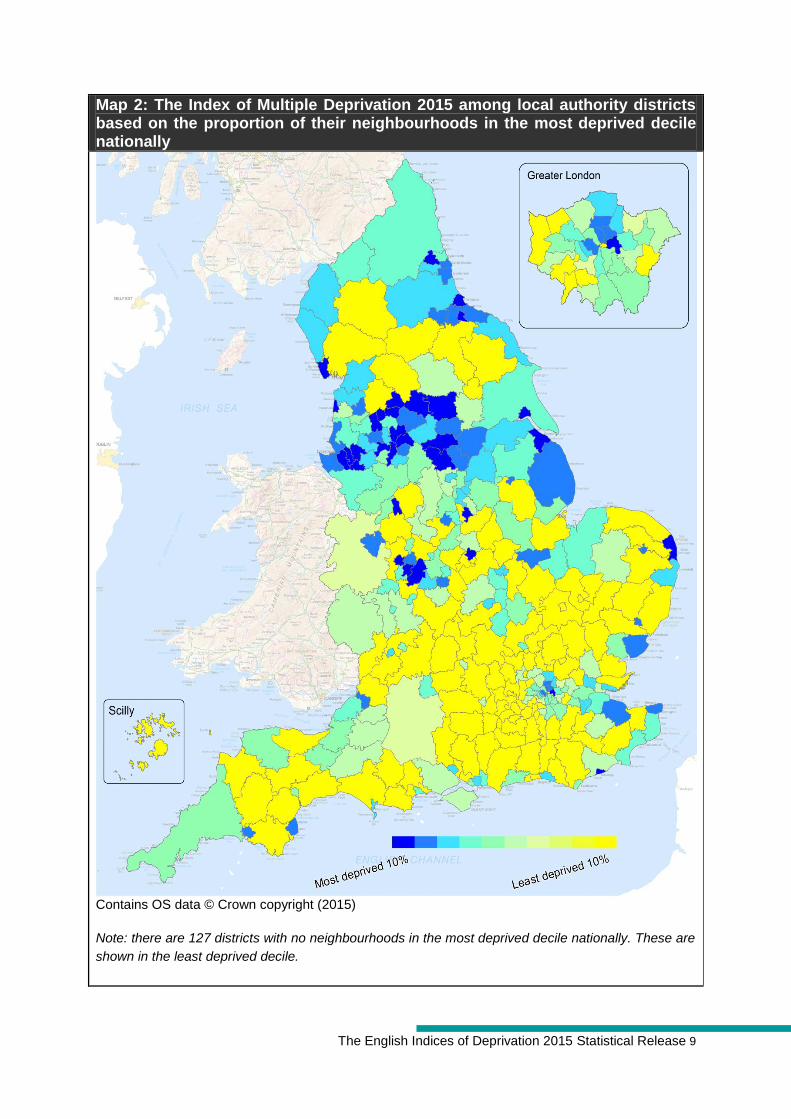
Map 2 illustrates the geographical spread of deprivation for local authority districts
across England. This higher level geography masks some pockets of deprivation that
are visible in Map 1. Areas shaded dark blue are the 10 per cent of districts in
England that contain the largest proportion of highly deprived neighbourhoods. Areas
shaded bright green contain proportionately few highly deprived neighbourhoods,
and are relatively less deprived. But 127 of the 326 districts (39 per cent) do not
contain any highly deprived neighbourhoods and are therefore equally ranked on this
measure. These 127 districts are banded together and shown in bright yellow,
corresponding to the least deprived decile.
3 The number and structure of local authorities changed following reorganisation on 1 April 2009.
The English Indices of Deprivation 2015 Statistical Release 9
Map 2: The Index of Multiple Deprivation 2015 among local authority districts based on the proportion of their neighbourhoods in the most deprived decile nationally
Contains OS data © Crown copyright (2015) Note: there are 127 districts with no neighbourhoods in the most deprived decile nationally. These are
shown in the least deprived decile.

10 The English Indices of Deprivation 2015 Statistical Release
It should be noted that geographically large districts shown on the map may have
relatively small populations, and geographically small districts may contain larger
populations.
Middlesbrough, Knowsley, Kingston upon Hull, Liverpool and Manchester are the
five local authority districts with the largest proportions of highly deprived
neighbourhoods in England, ranging from 49 per cent in Middlesbrough to 41 per
cent in Manchester (see Table 3.) By definition, each district would contain just 10
per cent of such highly deprived neighbourhoods if deprivation was evenly
distributed across local authorities.
Table 3: The 20 local authority districts with the highest proportion of their neighbourhoods in the most deprived 10 per cent of neighbourhoods nationally on the Index of Multiple Deprivation 2015, and change since the 2010 Index
Note: Based on all neighbourhoods i.e. Lower-layer Super Output Areas (LSOAs). Due to boundary changes, the numbers of LSOAs should not be directly compared across the Indices of Deprivation 2015 and 2010; changes are measured as percentage point changes. Hastings and Stoke-on-Trent are equally ranked as 13
th most deprived on this measure
according to the 2015 Index.
N % N %
Middlesbrough 42 48.8 41 46.6 2.2
Knowsley 45 45.9 45 45.5 0.5
Kingston upon Hull 75 45.2 70 42.9 2.2
Liverpool 134 45.0 148 50.9 -5.9
Manchester 115 40.8 118 45.6 -4.8
Birmingham 253 39.6 251 39.2 0.4
Blackpool 36 38.3 35 37.2 1.1
Nottingham 61 33.5 45 25.6 7.9
Burnley 20 33.3 20 33.3 0
Hartlepool 19 32.8 21 36.2 -3.4
Bradford 101 32.6 94 30.6 2.0
Blackburn with Darwen 28 30.8 31 34.1 -3.3
Hastings 16 30.2 15 28.3 1.9
Stoke-on-Trent 48 30.2 50 31.3 -1.1
North East Lincolnshire 31 29.2 27 25.2 4.0
Salford 43 28.7 47 32.6 -4.0
Rochdale 38 28.4 35 25.9 2.4
Pendle 16 28.1 17 29.8 -1.8
Halton 21 26.6 21 26.6 0.0
Great Yarmouth 16 26.2 13 21.3 4.9
IMD 2015 IMD 2010Percentage
point
change
from 2010

The English Indices of Deprivation 2015 Statistical Release 11
Turning for a moment to the very most deprived neighbourhoods in England,
Liverpool is the local authority with the largest number of neighbourhoods in the most
deprived one per cent of all neighbourhoods nationally (26 out of its 298
neighbourhoods, or 9 per cent are in this group). But Blackpool has the highest
proportion of its neighbourhoods in the most deprived one per cent nationally (19 out
of 94, or 20 per cent). (See Table 4.4 of the Research Report.)
Change in relative deprivation since the Indices of Deprivation 2010
This section focuses on changes in relative deprivation since the previous version of
the Index of Multiple Deprivation. As explained in the ‘Further information’ section
(p.33), care should be taken in interpreting change between updates of the Indices.
The changes being described are relative, in terms of changes in the degree to
which the neighbourhoods in a local authority district are among the most deprived
nationally, as determined by each version of the Indices. If an area experienced
some absolute decrease (i.e. improvement) in deprivation levels but less so than
other areas, the Index would still show an increase in relative deprivation.
The same five local authority districts have the greatest proportions of highly
deprived neighbourhoods according to both the 2015 and 2010 Index (Table 3).
Liverpool was ranked most deprived according to the 2010 Index with just over half
(51 per cent) of all neighbourhoods in Liverpool in the most deprived decile
nationally. This has fallen by 6 percentage points according to the 2015 Index. But
there were larger changes between the 2015 Index and its predecessor in other
areas. Chart 6 shows the ten local authority districts that experienced the largest
decreases on this summary measure and the ten which experienced the largest
increases.
There have been large decreases in a number of London Boroughs in the
proportions of their neighbourhoods that are highly deprived. In Hackney and
Newham in particular, there were reductions of 24 percentage points: from 42 per
cent of neighbourhoods in Hackney being highly deprived on the Index of Multiple
Deprivation 2010 to 17 per cent following this update, and from 31 per cent of
neighbourhoods being highly deprived in Newham on the 2010 Index to 8 per cent
following this update.4
4 While the proportions for Hackney and Newham are described in whole numbers, the percentage
point change is calculated from unrounded data.

12 The English Indices of Deprivation 2015 Statistical Release
Chart 6: Change in the proportion of neighbourhoods in the most deprived decile according to the Index of Multiple Deprivation 2015 and the 2010 Index by local authority district: the ten authorities with the largest percentage point decreases and increases respectively
It is notable that there were four London Boroughs (Hackney, Tower Hamlets,
Newham and Haringey) among the 20 most deprived local authorities based on this
summary measure of the Index of Multiple Deprivation 20105. But these are no
longer among the 20 most deprived districts according to this summary measure of
the 2015 Index, indicating that they have become relatively less deprived.
Apart from Nottingham, the ten local authority districts with the largest percentage
point increases on this summary measure were not among the most deprived
districts nationally. This is borne out in Chart 7 which depicts the 33, or 10 per cent
of local authority districts which are most deprived according to the Index of Multiple
Deprivation 2015 and how they have fared relative to other areas since the 2010
Index6.
5 See Table 4 of the Statistical Release for the 2010 Index
www.gov.uk/government/uploads/system/uploads/attachment_data/file/6871/1871208.pdf 6 Corresponding charts in Chapter 5, Section 5.3, of the Research Report illustrate changes in rank
among the most deprived districts according to the Index of Multiple Deprivation 2015 over a longer
timescale, since the 2010, 2007 and 2004 Indexes.
The English Indices of Deprivation 2015 Statistical Release 13
In Chart 7, districts are ranked according to the proportion of their neighbourhoods
that were in the most deprived decile of the Index at the time. The slope of the lines
indicates change in rank position, that is whether the local authority district has
become relatively more or less deprived, and not absolute change. In other words, it
is possible that a district may have become less deprived in real terms since the
previous Index but more deprived relative to all other districts (or vice versa). But it
should be noted that a change in rank – even of several places – may not represent
a large increase or decrease in absolute levels of deprivation.
The absence of any notable changes in rank among the most deprived local
authority districts is of interest as this indicates areas that have been persistently
most deprived. As well as being the five most deprived local authorities according to
the 2015 and 2010 Indexes, Middlesbrough, Knowsley, Kingston upon Hull,
Liverpool and Manchester were also among the ten most deprived local authorities
according to the 2007 and 2004 updates (see Chart 5.4 of the Research Report).
The earlier observation that the London Boroughs of Hackney, Tower Hamlets,
Newham, and Haringey have become relatively less deprived is borne out in this
chart. Tower Hamlets is ranked 24th on this measure according to the 2015 Index,
but was ranked 7th most deprived based on the 2010 Index (and 3rd most deprived
based on both the 2004 Index and 2007 Index).
As stated earlier, there are a range of measures that summarise deprivation in local
authorities and each leads to a different ranking of these areas. While the measure
based on the proportion of neighbourhoods among the most deprived 10 per cent
nationally is easy to interpret, a neighbourhood that may be only a few ranks outside
the most deprived 10 per cent is not counted as being most deprived. A
complementary summary measure of deprivation is the extent measure. This
focuses on the neighbourhoods in the larger geographic area that are among the
most deprived three deciles of deprivation, but it gives higher weight to the most
deprived decile and gradually less weight to each individual percentile thereafter. By
avoiding a sharp cut-off, while still focusing on the most deprived neighbourhoods, it
can give a more balanced indication of change in relative deprivation over time.
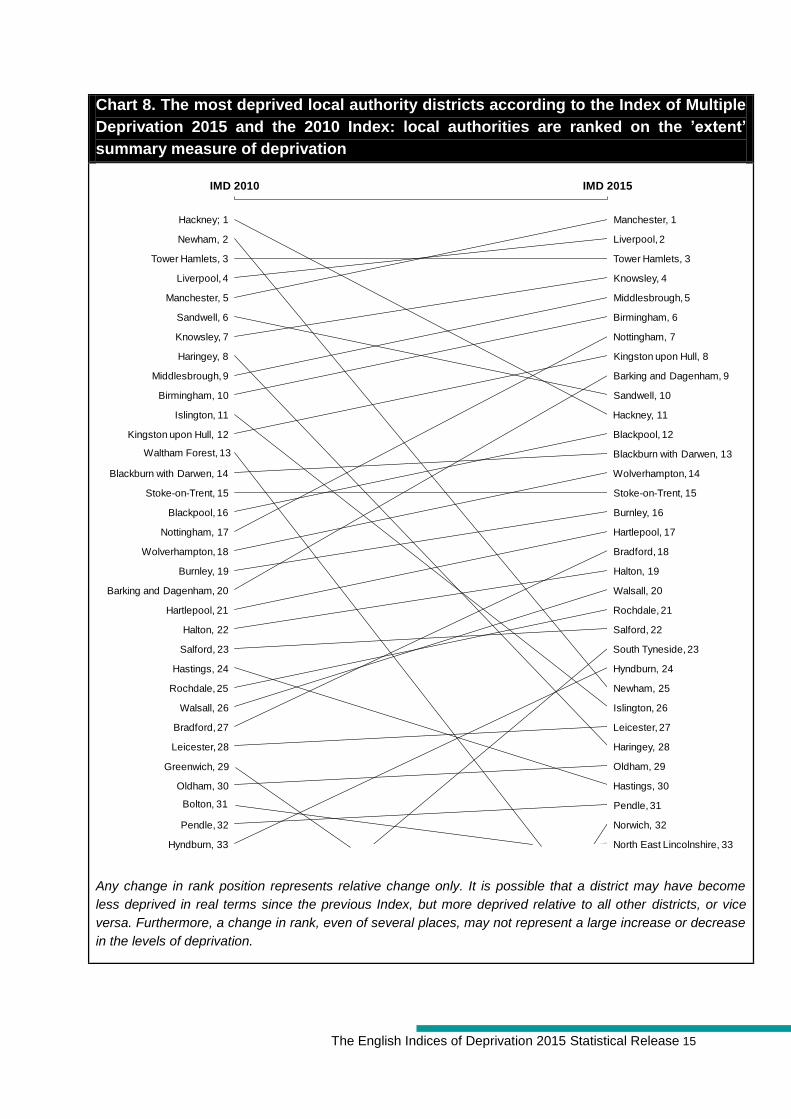
Chart 8 presents how the most deprived local authorities have changed rank on the
Index of Multiple Deprivation since the previous update based on the extent
measure. This chart tells a somewhat different story. On this measure, six London
boroughs rank among the most deprived 10 per cent of local authorities according to
the Index of Multiple Deprivation 2015. Notably, Tower Hamlets remains among the
three most deprived local authorities on this measure, and the outer east London
borough of Barking and Dagenham has become relatively more deprived, moving
from 20th to 9th most deprived since the 2010 Index.

14 The English Indices of Deprivation 2015 Statistical Release
Chart 7. The most deprived local authority districts according to the Index of
Multiple Deprivation 2015 and the 2010 Index: local authorities are ranked on the
proportion of neighbourhoods in the most deprived 10 per cent nationally
Note: Hastings and Stoke-on-Trent are equally ranked as 13th most deprived on this measure. Any change in rank position represents relative change only. It is possible that a district may have become less deprived in real terms since the previous Index, but more deprived relative to all other districts, or vice versa. Furthermore, a change in rank, even of several places, may not represent a large increase or decrease in the levels of deprivation.
Middlesbrough, 1
Middlesbrough, 2 Knowsley, 2
Knowsley, 4
Kingston upon Hull, 3
Kingston upon Hull, 5
Liverpool, 4
Liverpool, 1
Manchester, 5
Manchester, 3
Birmingham, 6
Birmingham, 8
Blackpool, 7
Blackpool, 9
Nottingham, 8
Nottingham, 25
Burnley, 9
Burnley, 12
Hartlepool, 10Hartlepool, 10
Bradford, 11
Bradford; 16
Blackburn with Darwen, 12
Blackburn with Darwen, 11
Stoke-on-Trent, 13
Stoke-on-Trent, 15
Hastings, 13
Hastings, 20
North East Lincolnshire, 15
North East Lincolnshire, 26
Salford, 16
Salford, 13
Rochdale, 17
Rochdale, 24
Pendle, 18Pendle, 18
Halton, 19
Halton, 21
Great Yarmouth, 20
Wolverhampton, 21
Wolverhampton, 21Hyndburn, 22
Leicester, 23
Leicester, 27
Tower Hamlets, 24
Tower Hamlets, 7
St. Helens, 25
Sheffield, 26
Sheffield, 31
Oldham, 27
Oldham, 33
Sandwell, 28
Sandwell, 17
Barrow-in-Furness, 29
Barrow-in-Furness, 23
Newcastle upon Tyne, 30
Newcastle upon Tyne, 28
Leeds, 31
Barnsley, 32
Redcar and Cleveland, 33
IMD 2015IMD 2010
Hackney, 6
Newham, 14
Haringey, 19
Walsall, 29
Bolton, 32
Wirral, 30
The English Indices of Deprivation 2015 Statistical Release 15
Chart 8. The most deprived local authority districts according to the Index of Multiple
Deprivation 2015 and the 2010 Index: local authorities are ranked on the ’extent’
summary measure of deprivation
Any change in rank position represents relative change only. It is possible that a district may have become
less deprived in real terms since the previous Index, but more deprived relative to all other districts, or vice
versa. Furthermore, a change in rank, even of several places, may not represent a large increase or decrease
in the levels of deprivation.
Manchester, 1
Manchester, 5
Liverpool, 2
Liverpool, 4
Tower Hamlets, 3Tower Hamlets, 3
Knowsley, 4
Knowsley, 7
Middlesbrough, 5
Middlesbrough, 9
Birmingham, 6
Birmingham, 10
Nottingham, 7
Nottingham, 17
Kingston upon Hull, 8
Kingston upon Hull, 12
Barking and Dagenham, 9
Barking and Dagenham, 20
Sandwell, 10
Sandwell, 6
Hackney, 11
Hackney; 1
Blackpool, 12
Blackpool, 16
Blackburn with Darwen, 13
Blackburn with Darwen, 14 Wolverhampton, 14
Wolverhampton, 18
Stoke-on-Trent, 15Stoke-on-Trent, 15
Burnley, 16
Burnley, 19
Hartlepool, 17
Hartlepool, 21
Bradford, 18
Bradford, 27
Halton, 19
Halton, 22
Walsall, 20
Walsall, 26
Rochdale, 21
Rochdale, 25
Salford, 22
Salford, 23 South Tyneside, 23
Hyndburn, 24
Hyndburn, 33
Newham, 25
Newham, 2
Islington, 26
Islington, 11
Leicester, 27
Leicester, 28 Haringey, 28
Haringey, 8
Oldham, 29
Oldham, 30 Hastings, 30
Hastings, 24
Pendle, 31
Pendle, 32 Norwich, 32
North East Lincolnshire, 33
IMD 2015IMD 2010
Waltham Forest, 13
Greenwich, 29
Bolton, 31

16 The English Indices of Deprivation 2015 Statistical Release
The distribution of deprivation in Local Enterprise
Partnerships
The Indices of Deprivation are being published for Local Enterprise Partnerships for
the first time. The purpose is to enable partnerships to understand the extent to
which neighbourhoods in their areas are deprived and the types of deprivation
experienced within them. The partnership areas vary in size, but all cover large
geographical areas and diverse populations.
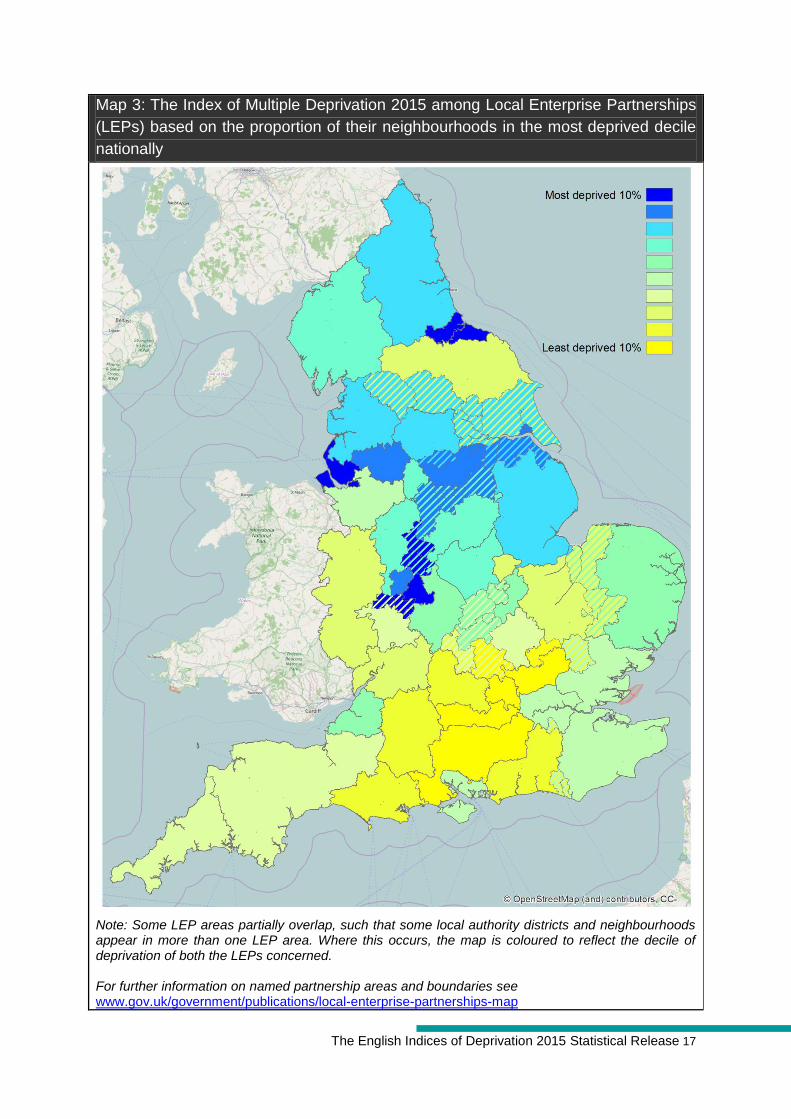
Map 3 and Table 4 rank all 39 Local Enterprise Partnerships in England based on
the proportion of neighbourhoods in each that are in the most deprived decile of the
Index of Multiple Deprivation 2015 nationally. Because these partnership areas may
experience deprivation in some domains but not others, Table 4 also shows the
proportion of neighbourhoods which are among the most deprived decile of the
constituent deprivation domain indices.
The five Local Enterprise Partnerships that are most highly deprived according to
this summary measure of the Index of Multiple Deprivation are Liverpool City Region,
Tees Valley, Greater Birmingham and Solihull, Humber, and Greater Manchester. In
these areas, between 21 per cent and 31 per cent of neighbourhoods are among the
most deprived decile nationally of this Index.
But in the majority of partnerships (27 of the 39), the proportion of neighbourhoods in
the most deprived decile of the Index of Multiple Deprivation nationally is less than
10 per cent. There are five partnerships where less than one per cent of
neighbourhoods are in the most deprived decile of this Index nationally. These
include Enterprise M3 and Buckinghamshire Thames Valley, where none of the
neighbourhoods meet this criterion. This is not to say that there are no deprived
people in the partnership areas ranked as least deprived; rather where deprivation
exists, it may not be concentrated within particular neighbourhoods.
The English Indices of Deprivation 2015 Statistical Release 17
Map 3: The Index of Multiple Deprivation 2015 among Local Enterprise Partnerships
(LEPs) based on the proportion of their neighbourhoods in the most deprived decile
nationally
Note: Some LEP areas partially overlap, such that some local authority districts and neighbourhoods appear in more than one LEP area. Where this occurs, the map is coloured to reflect the decile of deprivation of both the LEPs concerned. For further information on named partnership areas and boundaries see www.gov.uk/government/publications/local-enterprise-partnerships-map
18 The English Indices of Deprivation 2015 Statistical Release
The most deprived partnership areas according to the Index of Multiple Deprivation
are also among the most deprived in terms of both income deprivation and
employment deprivation. This is not unexpected since these two domains carry the
greatest weight in contributing to the overall Index.
Income deprivation is a measure of families being on very low incomes whether in or
out of work, whereas employment deprivation is based on involuntary exclusion of
people of working age from work. In most partnership areas, income deprivation and
employment deprivation are closely matched. This is partly expected given the
definitions of the domains: families experiencing employment deprivation are very
likely to also experience income deprivation. But in some areas, most notably
London, a greater proportion of neighbourhoods are among the most highly income
deprived nationally than are among the most highly employment deprived nationally.
The opposite is found, for example, for the North Eastern, Liverpool City Region,
Sheffield and Cumbria partnerships.
Partnership areas that are relatively less deprived according to the Index of Multiple
Deprivation may be more highly deprived in particular dimensions. The most notable
examples of this are found in the Barriers to Housing and Services domain. Apart
from the Greater Birmingham and Solihull partnership, none of the ten most deprived
partnership areas according to the Index of Multiple Deprivation are highly deprived
on this domain. Yet a number of less deprived partnership areas according to the
overall Index contain high proportions of neighbourhoods that are highly deprived on
this domain. Cornwall and the Isles of Scilly, the Marches, and London – although
relatively less deprived on the overall Index – contain particularly high proportions of
such neighbourhoods. Deprivation on this domain can reflect a mixture of local
challenges: low incomes in relation to local housing costs, household overcrowding
and homelessness; and distance from services (GPs, food shops, schools and post
offices) which tends to affect more sparsely populated areas.

The English Indices of Deprivation 2015 Statistical Release 19
Table 4: The proportion of neighbourhoods in each Local Enterprise Partnership that are in the most deprived 10 per cent of areas nationally according to the Index of Multiple Deprivation, and the underlying domain indices
Note: some local authority districts and neighbourhoods are in more than one partnership area. Where this occurs, the summary statistic for each of the partnership areas concerned is based on all the neighbourhoods within it, even if some neighbourhoods also fall under another partnership area.
Rank
Local Enterprise
Partnership
Index of
Multiple
Deprivation Income Employment
Education,
Skills and
Training
Health
Deprivation
and
Disability Crime
Barriers to
Housing
and
Services
Living
Environment
% % % % % % % %
1 Liverpool City Region 31.3 30.1 35.2 18.0 45.8 12.5 0.5 14.9
2 Tees Valley 26.9 29.0 31.7 23.0 32.9 13.9 1.2 0.7
3 Greater Birmingham and
Solihull 23.9 22.2 20.9 16.7 9.6 9.1 25.2 18.3
4 Humber 22.0 20.1 21.4 22.1 11.3 20.4 6.9 11.8
5 Greater Manchester 20.8 20.0 21.2 13.7 31.3 14.2 1.4 7.2
6 Black Country 18.7 25.1 20.9 21.2 8.1 5.8 0.7 3.9
7 Sheffield City Region 17.5 15.6 20.3 23.6 19.4 10.8 4.2 3.7
8 Lancashire 17.2 13.8 16.2 12.3 27.2 15.5 1.7 19.4
9 Leeds City Region 16.9 13.4 15.9 19.6 15.7 12.9 2.4 15.5
10 North Eastern 13.8 16.8 24.1 11.6 29.0 3.3 3.7 1.8
11 Greater Lincolnshire 11.0 9.4 11.5 13.2 9.4 10.7 10.0 9.1
12 Derby, Derbyshire,
Nottingham and 10.0 9.3 11.0 15.4 10.8 7.6 3.7 7.4
13 Cumbria 9.0 5.6 10.3 12.8 17.1 6.2 12.5 23.7
14 Leicester and
Leicestershire 8.5 8.7 6.8 11.7 5.6 10.4 3.4 7.5
15 Stoke-on-Trent and
Staffordshire 8.4 7.4 10.2 14.7 10.9 6.7 4.2 6.6
16 Coventry and Warwickshire 8.2 7.7 6.0 8.2 7.5 6.4 8.4 8.8
17 West of England 7.7 6.9 8.1 10.2 6.5 7.8 2.8 8.6
18 Northamptonshire 6.9 4.7 5.7 12.8 5.9 11.8 9.0 3.3
19 New Anglia 6.3 5.1 5.9 13.7 4.7 3.4 15.2 8.7
20 Solent 6.1 5.2 4.0 12.8 5.3 9.2 2.8 14.4
21 London 5.7 9.1 2.9 0.3 1.3 21.1 24.2 15.7
22 Cheshire and Warrington 5.6 5.1 6.5 8.2 8.9 5.9 3.8 6.3
23 South East 5.3 5.1 5.3 8.5 2.4 9.4 7.6 4.3
24 Heart of the South West 5.2 4.2 5.5 4.8 5.8 7.0 11.1 18.8
25 Cornwall and Isles of Scilly 5.2 3.7 5.5 3.1 4.0 3.1 23.5 48.0
26 South East Midlands 4.5 4.5 3.4 7.7 3.5 9.7 12.3 2.0
27 Worcestershire 4.4 4.4 5.2 8.8 3.0 3.3 17.9 7.7
28 The Marches 4.1 5.0 5.5 8.4 3.4 2.9 25.7 20.6
29 Greater Cambridge and
Greater Peterborough 3.5 2.8 2.9 8.8 2.3 2.1 14.9 2.3
30 Gloucestershire 3.5 2.9 2.4 6.2 1.9 3.2 8.8 4.6
31 York, North Yorkshire and
East Riding 3.4 2.8 3.7 5.4 2.3 2.1 14.4 9.8
32 Dorset 2.4 2.0 2.2 4.9 2.7 4.0 10.0 7.1
33 Coast to Capital 2.3 2.5 1.6 4.3 2.6 6.5 11.6 7.0
34 Swindon and Wiltshire 2.2 2.2 2.2 8.6 0.5 4.3 13.4 1.2
35 Oxfordshire 0.5 0.7 0.0 6.1 0.5 1.7 9.6 1.7
36 Thames Valley Berkshire 0.4 0.9 0.4 1.9 0.0 5.2 5.6 4.3
37 Hertfordshire 0.3 0.1 0.6 1.0 0.1 0.4 4.8 0.6
38 Buckinghamshire Thames
Valley 0.0 0.0 0.0 2.2 0.0 1.3 8.2 0.0
39 Enterprise M3 0.0 0.1 0.0 2.6 0.2 0.8 6.0 0.9

20 The English Indices of Deprivation 2015 Statistical Release
Income deprivation and employment deprivation
The analysis so far has mainly focused on the Index of Multiple Deprivation. This
section focuses on the two domains of deprivation which contribute the most weight
to the overall Index: the Income Deprivation Domain and Employment Deprivation
Domain. In addition, the section explores the supplementary indices of income
deprivation among children and older people. These indices describe deprivation in
terms of proportions of deprived people, so allowing direct comparison of deprivation
levels between areas.
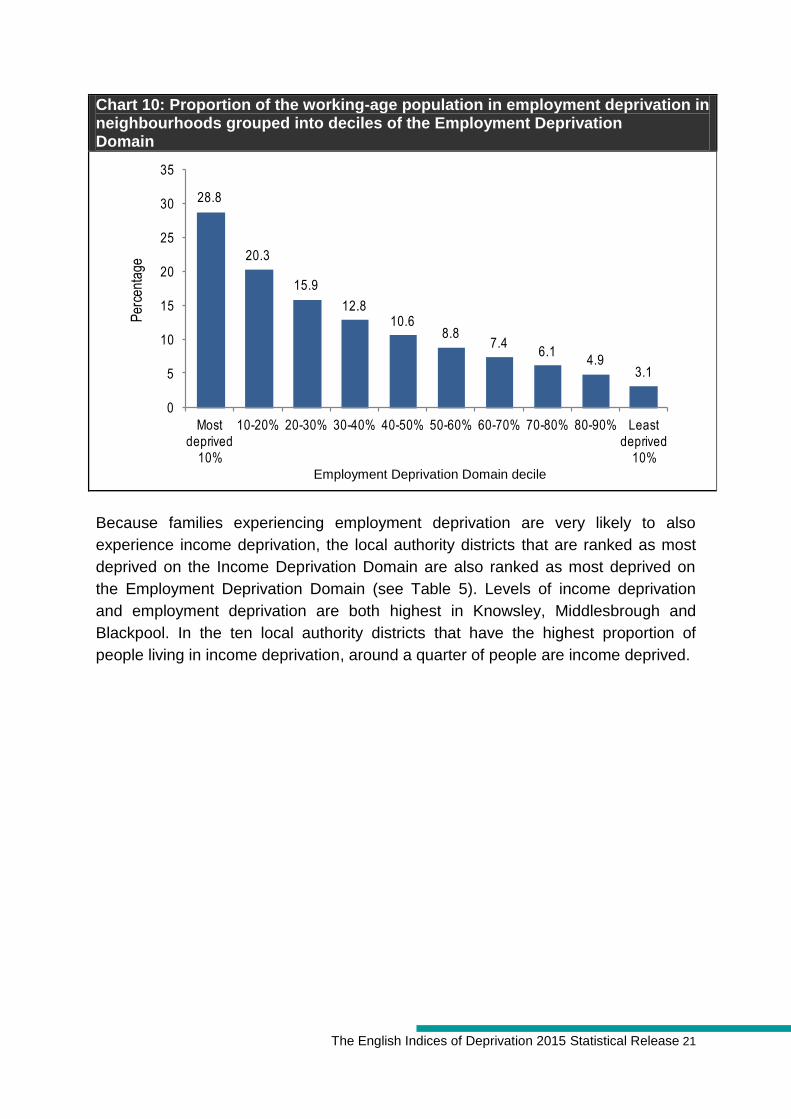
Levels of income deprivation and employment deprivation vary widely between
neighbourhoods. In the most deprived decile of neighbourhoods on the Income
Deprivation Domain, on average, 37 per cent of the population are income deprived.
But in the least deprived decile of this deprivation domain, only 3 per cent of people
are income deprived (Chart 9). A similar pattern is observed for employment
deprivation among the working-age population. In the most deprived decile of
neighbourhoods on the Employment Deprivation Domain, on average, 29 per cent of
the working-age adults are employment deprived, compared with 3 per cent of those
in the least deprived decile of this domain (Chart 10).
Chart 9: Proportion of the population living in income deprived households in neighbourhoods grouped into deciles of the Income Deprivation Domain
Chart 4.1: Proportion of the population living in income deprivation in England by decile
36.9
26.3
20.3
16.0
12.810.1
8.16.4
4.92.9
0
5
10
15
20
25
30
35
40
Most deprived
10%
10-20% 20-30% 30-40% 40-50% 50-60% 60-70% 70-80% 80-90% Least deprived
10%
Per
cent
age
Income domain decileIncome Deprivation Domain decile
The English Indices of Deprivation 2015 Statistical Release 21
Chart 10: Proportion of the working-age population in employment deprivation in neighbourhoods grouped into deciles of the Employment Deprivation Domain
28.8
20.3
15.9
12.810.6
8.87.4
6.14.9
3.1
0
5
10
15
20
25
30
35
Most deprived
10%
10-20% 20-30% 30-40% 40-50% 50-60% 60-70% 70-80% 80-90% Least deprived
10%
Per
cent
age
Employment domain decile
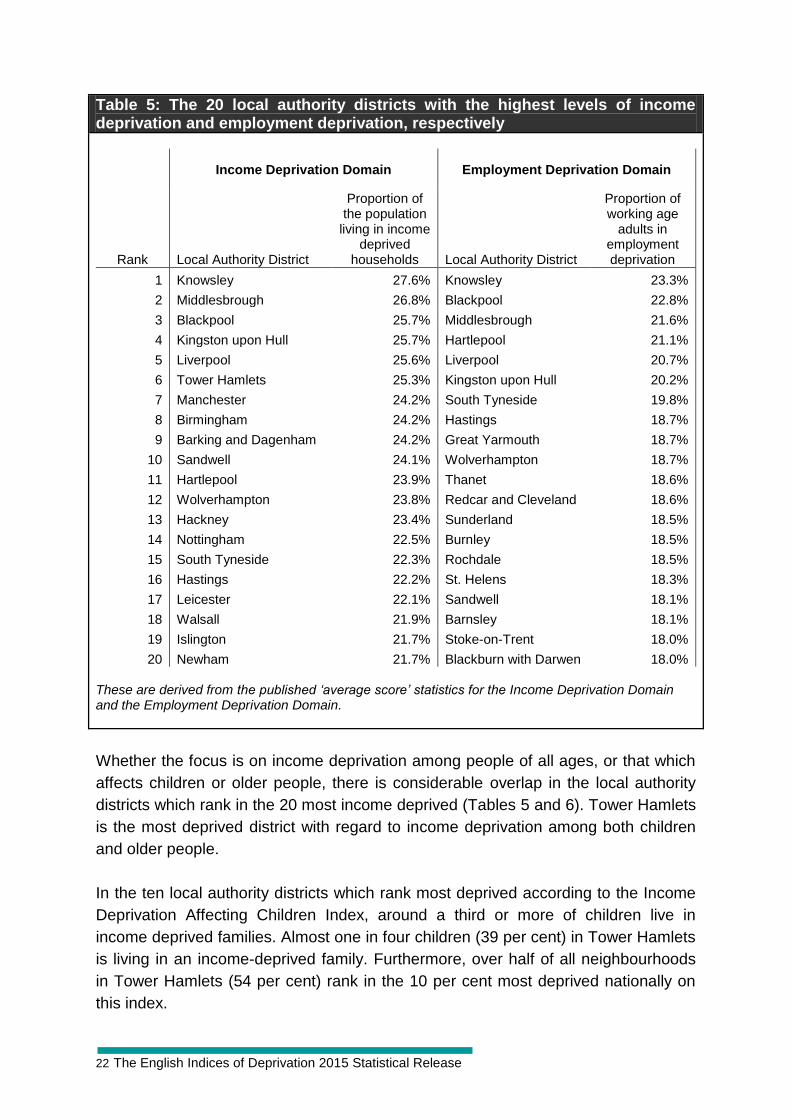
Because families experiencing employment deprivation are very likely to also
experience income deprivation, the local authority districts that are ranked as most
deprived on the Income Deprivation Domain are also ranked as most deprived on
the Employment Deprivation Domain (see Table 5). Levels of income deprivation
and employment deprivation are both highest in Knowsley, Middlesbrough and
Blackpool. In the ten local authority districts that have the highest proportion of
people living in income deprivation, around a quarter of people are income deprived.
Employment Deprivation Domain decile
22 The English Indices of Deprivation 2015 Statistical Release
Table 5: The 20 local authority districts with the highest levels of income deprivation and employment deprivation, respectively
Income Deprivation Domain Employment Deprivation Domain
Rank Local Authority District
Proportion of the population
living in income deprived
households Local Authority District
Proportion of working age
adults in employment deprivation
1 Knowsley 27.6% Knowsley 23.3%
2 Middlesbrough 26.8% Blackpool 22.8%
3 Blackpool 25.7% Middlesbrough 21.6%
4 Kingston upon Hull 25.7% Hartlepool 21.1%
5 Liverpool 25.6% Liverpool 20.7%
6 Tower Hamlets 25.3% Kingston upon Hull 20.2%
7 Manchester 24.2% South Tyneside 19.8%
8 Birmingham 24.2% Hastings 18.7%
9 Barking and Dagenham 24.2% Great Yarmouth 18.7%
10 Sandwell 24.1% Wolverhampton 18.7%
11 Hartlepool 23.9% Thanet 18.6%
12 Wolverhampton 23.8% Redcar and Cleveland 18.6%
13 Hackney 23.4% Sunderland 18.5%
14 Nottingham 22.5% Burnley 18.5%
15 South Tyneside 22.3% Rochdale 18.5%
16 Hastings 22.2% St. Helens 18.3%
17 Leicester 22.1% Sandwell 18.1%
18 Walsall 21.9% Barnsley 18.1%
19 Islington 21.7% Stoke-on-Trent 18.0%
20 Newham 21.7% Blackburn with Darwen 18.0% These are derived from the published ‘average score’ statistics for the Income Deprivation Domain and the Employment Deprivation Domain.
Whether the focus is on income deprivation among people of all ages, or that which
affects children or older people, there is considerable overlap in the local authority
districts which rank in the 20 most income deprived (Tables 5 and 6). Tower Hamlets
is the most deprived district with regard to income deprivation among both children
and older people.
In the ten local authority districts which rank most deprived according to the Income
Deprivation Affecting Children Index, around a third or more of children live in
income deprived families. Almost one in four children (39 per cent) in Tower Hamlets
is living in an income-deprived family. Furthermore, over half of all neighbourhoods
in Tower Hamlets (54 per cent) rank in the 10 per cent most deprived nationally on
this index.

The English Indices of Deprivation 2015 Statistical Release 23
In the ten local authority districts which rank most deprived according to the Income
Deprivation Affecting Older People Index, around a third or more of older people are
income deprived, rising to half of all older people in Tower Hamlets. Seven of these
ten districts are London boroughs. Furthermore, more than three-quarters of
neighbourhoods in both Tower Hamlets and Hackney (76 per cent and 78 per cent
respectively) rank in the 10 per cent most deprived nationally on this index.
Further findings on these and other domains of deprivation are presented in
Appendix E of the Research Report.
Table 6: The 20 local authority districts with the highest proportions of children and older people in income deprivation, respectively
Income Deprivation Affecting Children Index (IDACI)
Income Deprivation Affecting Older People Index (IDAOPI)
Rank Local Authority District
Proportion of children living in income deprived
households Local Authority District
Proportion of older people
living in income
deprived households
1 Tower Hamlets 39.3% Tower Hamlets 49.7%
2 Middlesbrough 35.7% Hackney 43.1%
3 Islington 35.3% Newham 41.0%
4 Nottingham 34.5% Manchester 36.3%
5 Manchester 34.3% Islington 36.1%
6 Kingston upon Hull 34.0% Southwark 34.3%
7 Knowsley 33.7% Lambeth 33.2%
8 Liverpool 33.4% Liverpool 32.7%
9 Blackpool 32.9% Knowsley 32.6%
10 Hackney 32.2% Haringey 31.8%
11 Barking & Dagenham 31.9% Leicester 31.5%
12 Wolverhampton 31.3% Sandwell 29.2%
13 Enfield 30.7% Kingston upon Hull 28.4%
14 Hartlepool 30.7% Birmingham 28.2%
15 Birmingham 30.5% Brent 28.0%
16 Lambeth 30.4% Barking & Dagenham 27.9%
17 Southwark 30.3% Hammersmith & Fulham 27.5%
18 Sandwell 29.9% Nottingham 25.9%
19 Lewisham 29.6% Lewisham 25.7%
20 Norwich 29.0% Camden 25.4% These are derived from the published ‘average score’ statistics for the supplementary indices of the Income Deprivation Domain, IDACI and IDAOPI.

24 The English Indices of Deprivation 2015 Statistical Release
Accompanying tables and reports The following tables are available to download alongside this release.
Neighbourhood (Lower-layer Super Output Area) level data
There are a number of files at neighbourhood level. The first of these contains the
Index of Multiple Deprivation ranks and deciles, and is sufficient for the purposes of
most users. Other files are available for users with more specific requirements.
File 1 Index of Multiple Deprivation
File 2 Domains of deprivation
File 3 Supplementary Indices - Income Deprivation Affecting Children Index
and Income Deprivation Affecting Older People Index
File 4 Sub-domains of deprivation
File 5 Scores for the Indices of Deprivation
File 6 Population denominators
File 7 All ranks, deciles and scores for the Indices of Deprivation, and
population denominators (CSV file)
File 8 Underlying indicators
File 9 Transformed domain scores
Summary data for higher-level geographies
File 10 Local Authority District Summaries
File 11 Upper-tier Local Authority Summaries
File 12 Local Enterprise Partnership Summaries
File 13 Clinical Commissioning Group Summaries
Appendix F of the Research Report and Appendix O of the Technical Report ‘What
data has been published’ describe these data files in more detail.
The following additional supporting documents have been published:
A Guidance note which focuses on the Index of Multiple Deprivation, to aid
interpretation of this Index, with some caveats on its use.
An infographic which illustrates how the Index of Multiple Deprivation is
comprised and some do’s and don’ts concerning its use.
Frequently asked questions

The English Indices of Deprivation 2015 Statistical Release 25
A Research Report provides guidance on how to use and interpret the
datasets and presents further results from the Indices of Deprivation 2015. It
includes a full account of the set of summary statistics available for higher-
level geographies such as local authority districts, with an example of their
use, and advice on interpreting change over time.
A Technical Report presenting the conceptual framework of the Indices of
Deprivation 2015; the methodology for creating the domains and the overall
Index of Multiple Deprivation; the quality assurance carried out to ensure
reliability of the data outputs; and the component indicators and domains.
All of the data files and supporting documents are available from: www.gov.uk/government/statistics/english-indices-of-deprivation-2015
Previous versions of the Indices of Deprivation (2000, 2004, 2007 and 2010) are
available from:
www.gov.uk/government/collections/english-indices-of-deprivation
A history of the Indices is provided in Appendix N of the Technical Report.
Definitions Indices of Deprivation
The Indices of Deprivation 2015 provide a set of relative measures of deprivation for
small areas (Lower-layer Super Output Areas) across England, based on seven
different domains of deprivation:
Income Deprivation
Employment Deprivation
Education, Skills and Training Deprivation
Health Deprivation and Disability
Crime
Barriers to Housing and Services
Living Environment Deprivation
Each of these domains is based on a basket of indicators. As far as is possible, each
indicator is based on data from the most recent time point available; in practice most
indicators in the Indices of Deprivation 2015 relate to the tax year 2012/13.
The Index of Multiple Deprivation 2015 combines information from the seven
domains to produce an overall relative measure of deprivation. In addition, there are
seven domain-level indices, and two supplementary indices: the Income Deprivation
Affecting Children Index and the Income Deprivation Affecting Older People Index.

26 The English Indices of Deprivation 2015 Statistical Release
A range of summary measures are available for higher-level geographies including
local authority districts and upper tier local authorities, local enterprise partnerships,
and clinical commissioning groups. These are based on the geographic boundaries
for these areas at the time of publication.
The Index of Multiple Deprivation 2015, domain indices and the supplementary
indices, together with the higher area summaries, are collectively referred to as the
Indices of Deprivation 2015.
Index of Multiple Deprivation
The Index of Multiple Deprivation (IMD) combines information from the seven
domains to produce an overall relative measure of deprivation. The domains are
combined using the following weights:
Income Deprivation (22.5%)
Employment Deprivation (22.5%)
Education, Skills and Training Deprivation (13.5%)
Health Deprivation and Disability (13.5%)
Crime (9.3%)
Barriers to Housing and Services (9.3%)
Living Environment Deprivation (9.3%)
The weights were derived from consideration of the academic literature on poverty
and deprivation, as well as consideration of the levels of robustness of the indicators.
A fuller account is given in section 3.7 and Appendix G of the Technical Report.
Income Deprivation Domain
The Income Deprivation Domain measures the proportion of the population
experiencing deprivation relating to low income. The definition of low income used
includes both those people that are out-of-work, and those that are in work but who
have low earnings (and who satisfy the respective means tests).
Employment Deprivation Domain
The Employment Deprivation Domain measures the proportion of the working age
population in an area involuntarily excluded from the labour market. This includes
people who would like to work but are unable to do so due to unemployment,
sickness or disability, or caring responsibilities.
Education, Skills and Training Deprivation Domain
The Education, Skills and Training Deprivation Domain measures the lack of
attainment and skills in the local population. The indicators fall into two sub-domains:
one relating to children and young people and one relating to adult skills.
Health Deprivation and Disability Domain
The Health Deprivation and Disability Domain measures the risk of premature death
and the impairment of quality of life through poor physical or mental health. The

The English Indices of Deprivation 2015 Statistical Release 27
domain measures morbidity, disability and premature mortality but not aspects of
behaviour or environment that may be predictive of future health deprivation.
Crime Domain
The Crime Domain measures the risk of personal and material victimisation at local
level.
Barriers to Housing and Services Domain
The Barriers to Housing and Services Domain measures the physical and financial
accessibility of housing and local services. The indicators fall into two sub-domains:
‘geographical barriers’, which relate to the physical proximity of local services, and
‘wider barriers’ which includes issues relating to access to housing such as
affordability and homelessness.
Living Environment Deprivation Domain
The Living Environment Deprivation Domain measures the quality of the local
environment. The indicators fall into two sub-domains. The ‘indoors’ living
environment measures the quality of housing; while the ‘outdoors’ living environment
contains measures of air quality and road traffic accidents.
Income Deprivation Affecting Children Index
The Income Deprivation Affecting Children Index (IDACI) measures the proportion of
all children aged 0 to 15 living in income deprived families7. This is one of two
supplementary indices and is a sub-set of the Income Deprivation Domain.
Income Deprivation Affecting Older People Index
The Income Deprivation Affecting Older People Index (IDAOPI) measures the
proportion of all those aged 60 or over who experience income deprivation. This is
one of two supplementary indices and is a sub-set of the Income Deprivation
Domain.
Lower-Layer Super Output Areas
Lower-Layer Super Output Areas (LSOAs) are small areas designed to be of a
similar population size, with an average of approximately 1,500 residents or 650
households. There are 32,844 Lower-layer Super Output Areas (LSOAs) in England.
They were produced by the Office for National Statistics for the reporting of small
area statistics. LSOAs are referred to as ‘neighbourhoods’ throughout this release.
Following the 2011 Census, the geography of Lower-layer Super Output Areas was
revised, and the number of areas has increased from 32,482 (as used in the 2010,
2007 and 2004 Indices of Deprivation) to 32,844 (used in the 2015 Indices of
Deprivation).
7 The word ‘family’ is used to designate a ‘benefit unit’, that is the claimant, any partner and any
dependent children (those for whom Child Benefit is received).

28 The English Indices of Deprivation 2015 Statistical Release
The boundaries of the vast majority (96 per cent) of these 32,844 areas are
unchanged since the Indices of Deprivation 2010, 2007 and 2004.
But elsewhere, some neighbourhoods have been combined or split and some new
neighbourhoods have been created; this is to account for significant population
change occurring in these areas between the 2001 and 2011 Censuses. This means
that 31,672 areas have the same boundaries as in previous versions of the Indices,
and can be used in analysis comparing relative deprivation over time (see
‘understanding change over time’ in the ‘Further information’ section below for
guidance on this).
Decile
Deciles are calculated by ranking the 32,844 neighbourhoods in England from most
deprived to least deprived and dividing them into 10 equal groups (i.e. each
containing 3,284 or 3,285 neighbourhoods). These deciles range from the most
deprived 10 per cent of neighbourhoods nationally to the least deprived 10 per cent
of neighbourhoods nationally.
Most deprived or highly deprived neighbourhoods
For the purposes of this Statistical Release, the ‘most deprived’ or ‘highly deprived’
neighbourhoods refer to the 10 per cent of neighbourhoods that are most deprived
nationally according to the Index of Multiple Deprivation. But there is no definitive
threshold above which an area is described as ‘deprived’ or ‘highly deprived’; the
Indices of Deprivation are a continuous scale of deprivation.
Extent
Extent is one of the summary measures used to describe deprivation in larger areas
such as local authorities. The extent measure focuses on the neighbourhoods in the
larger area that are among the most deprived three deciles of deprivation, but it
gives higher weight to the most deprived decile and gradually less weight to each
individual percentile thereafter.
Average score
Average score is another of the summary measures used to describe deprivation in
larger areas such as local authorities. For the Income Deprivation Domain, its
supplementary indices for children and older people (IDACI and IDAOPI), and the
Employment Deprivation Domain, the average score for an area can be interpreted
as the proportion of the relevant population experiencing income deprivation or
employment deprivation.
Local Enterprise Partnerships
The Indices of Deprivation 2015 are being published for Local Enterprise
Partnerships (LEPs) for the first time. LEPs are partnerships in England between

The English Indices of Deprivation 2015 Statistical Release 29
local authorities and businesses8. They were created in 2011 and their role is to help
shape local economic priorities and undertake activities to drive local economic
growth and the creation of jobs. There are 39 LEPs. Every local authority in England
belongs to at least one LEP. However, some local authorities belong to more than
one LEP. One example is the London Borough of Croydon which is in the London
LEP and Coast to Capital9.
Because some LEP areas partially overlap, some neighbourhoods are in more than
one LEP area. The summary statistics for LEPs are based on all the neighbourhoods
within the partnership area, even if some of these also fall in other partnership areas.
Technical notes Methodology and data sources
The Indices of Deprivation 2015 have been constructed for the Department for
Communities and Local Government (DCLG) by Oxford Consultants for Social
Inclusion (OCSI).
The construction of the Indices of Deprivation 2015 broadly consists of the following
seven stages. These stages fulfil the purposes of defining the Indices, data
processing, and producing the Index of Multiple Deprivation and summary measures.
The stages are as follows:
1. Dimensions (referred to as domains) of deprivation are clearly identified.
2. Indicators are chosen which provide the best possible measure of each domain of deprivation.
3. ‘Shrinkage estimation’ is used to improve reliability of the small area data.
4. Indicators are combined to form the domains, generating separate domain scores.
5. Domain scores are ranked and the domain ranks are transformed to a specified exponential distribution.
6. The exponentially transformed domain scores are combined using appropriate domain weights to form an overall Index of Multiple Deprivation at small area level. This stage completes the construction of the Indices of Deprivation 2015 at Lower-layer Super Output Area level.
7. The overall Index of Multiple Deprivation, the domains and the supplementary indices are summarised for higher level geographical areas such as local authority districts.
8 www.gov.uk/government/publications/2010-to-2015-government-policy-local-enterprise-
partnerships-leps-and-enterprise-zones/2010-to-2015-government-policy-local-enterprise-
partnerships-leps-and-enterprise-zones 9 www.coast2capital.org.uk/about-us

30 The English Indices of Deprivation 2015 Statistical Release
Chapter 3 of the Technical Report describes these steps in detail.
The majority of the data used for the indicators is sourced from administrative data
such as benefit records from the Department for Work and Pensions. Census data is
used for a minority of indicators where alternative data from administrative sources is
not available.
As far as is possible, the data sources used in each indicator were based on data
from the most recent time point available. Using the latest available data in this way
means that there is not a single consistent time point for all indicators. However in
practice most indicators in the Indices of Deprivation 2015 relate to 2012/13.
As a result of the time points for which data is available, the indicators do not take
into account changes to policy since the time point of the data used. For example,
the 2012/13 benefits data used do not include the impact of Universal Credit, which
only began to replace certain income related benefits from April 2013.
Chapter 4 and Appendix A of the Technical Report describe the 37 component
indicators in the Indices of Deprivation 2015, including the data sources used, and
the chapter explains how the indicators were combined to create each domain.
Data quality
The Indices of Deprivation 2015 have been carefully designed and developed to
ensure the robustness and reliability of the output datasets and reports. The design
is based on a set of principles and practices that help to ensure data quality. These
are described in Chapter 5 of the Technical Report. For example, the domains and
Index of Multiple Deprivation bring together 37 indicators of deprivation, from a wide
range of data sources. This sheer diversity of inputs leads to more reliable overall
data outputs; to be highly deprived on the Index of Multiple Deprivation, an area is
likely to be highly deprived on a number of the domains. Due to the variety of data
inputs, there is little chance that an area is identified as highly deprived due to a bias
in one of the component indicators; the use of multiple independent indicators
increases robustness of the final outputs.
The construction of the Indices involves a number of different processes. The quality
assurance procedures for the methods, input data sources, data processing steps
and outputs build on the experience held by members of the department’s contractor
(OCSI) in developing the Indices of Deprivation since 2000. These are described in
Chapter 5 of the Technical Report (with further details in Appendices J, K and L) and
include, but are not limited to:
Use of appropriate and robust indicators, based on well understood data
sources. The preference was to use, wherever possible, existing high quality
published data sources that have themselves been validated as National
Statistics (or variations thereof). In the absence of these, the second

The English Indices of Deprivation 2015 Statistical Release 31
preference was to derive indicators from established and well-understood
administrative data sources. In a small number of cases, specially-modelled
were used. In determining whether the data source was suitable for the
purpose of measuring deprivation the quality of each input data source used
was assessed and documented, and there was close communication with
data suppliers to ensure the strengths and weaknesses of the underlying data
were well understood.
Minimising the impact of potential bias and error in the input data sources
through the design principles outlined above.
Using audited, replicable and validated processing steps to construct the
Indices
Real world validation of the data inputs and outputs.
The quality assurance process also drew on the quality assurance and audit
arrangements practice models developed by the UK Statistics Authority to ensure
that the assessment of data sources and methodology carried out is proportionate to
both the level of public interest in the Indices, and the scale of risk over the quality of
the data.
Revisions policy
This policy has been developed in accordance with the UK Statistics Authority Code
of Practice for Official statistics and the Department for Communities and Local
Government Revisions Policy, found at:
www.gov.uk/government/publications/statistical-notice-dclg-revisions-policy
There are two types of revisions that the policy covers:
Non-Scheduled Revisions
The Indices of Deprivation draw upon the best available data at the time of their
production and, as outlined above, undergo a substantial range of quality assurance
checks. However, should an error be identified, the department will consider its
impact and review whether an unscheduled revision is required.
Scheduled Revisions
There are no scheduled revisions to the Indices of Deprivation 2015.
Uses of the data
Since their original publication in 2000 the Indices of Deprivation have been used
very widely for a range of purposes, including:
By national and local organisations to identify places for prioritising resources
and more effective targeting of funding. For example, the Index of Multiple
Deprivation 2010 was used in conjunction with other data to distribute £448m
32 The English Indices of Deprivation 2015 Statistical Release
of funding to local authorities for DCLG’s Troubled Families Programme; and
in policies related to the European Regional Development Fund, targeted
intervention will be prioritised to address concentrated pockets of
deprivation10.
Developing the evidence base for a range of national and local policies and
strategies;
Frequent use in funding bids, including bids made by councillors for their
neighbourhoods, and from voluntary and community sector groups.
The Indices of Deprivation are appropriate for such uses where deprivation is
concentrated at a neighbourhood level. Examples of uses of the Indices are available
in section 1.4 of the research report. These types of uses were confirmed by
responses to the survey of nearly 250 users carried out in July 2014. Indices data
was used for a variety of purposes, and often respondents mentioned multiple uses.
A summary of the findings from the user survey is provided in Appendix C of the
Research Report.
User engagement
The department is grateful to users of the Indices who contributed their thoughts on
the development of this update and on how the outputs could be improved, for
example through its user survey and consultation in 201411
. Following consultation,
as well as introducing new indicators and changes to some of the indicators used in
measuring deprivation, a number of changes have been made to the outputs to meet
the needs highlighted by users, including:
a short guidance note and infographic which communicate how to use the
Indices and are suitable for specialists and non-specialists;
clearer guidance on how to interpret changes between versions of the Indices;
and on the range of summary measures for higher level geographies and how
to aggregate the Indices to other areas;
tools for selecting Indices data based on postcodes, as described in the
Frequently Asked Questions.
It has not been possible to meet all the needs expressed by users, for example:
the department does not publish ward level figures as an additional output as
it would be potentially misleading to publish two small area measures of
deprivation.
10
DCLG, 2015, European Regional Development Fund Operational Programme 2014-2020, see:
www.gov.uk/government/uploads/system/uploads/attachment_data/file/342297/ERDF_Operational_P
rogramme.pdf 11
www.gov.uk/government/consultations/updating-the-english-indices-of-deprivation
The English Indices of Deprivation 2015 Statistical Release 33
many users would find it useful to have the data available on nomis. We have
explored this with Office for National Statistics, the owners of nomis, but it is
not possible at this time. ONS will investigate the possibility of the data being
housed on nomis in future.
there was demand for a supplementary index, like IDACI and IDAOPI, of
income deprivation among working-age people but it was not possible to
accommodate this request within the timetable for this update.
Users are encouraged to continue to provide feedback on how these statistics and
the various outputs are used, and how well they meet their needs. Comments on any
issues relating to this statistical release are also welcomed and encouraged.
Responses should be addressed to the ’Public enquiries‘ contact given in the
‘Enquiries’ section below.
The department will also seek opportunities to disseminate the Indices and meet with
users through seminars, conferences and bespoke events. The department’s
engagement strategy to meet the needs of statistics users is published here: www.gov.uk/government/publications/engagement-strategy-to-meet-the-needs-of-
statistics-users
The views expressed on the Indices during the course of this update and following
this publication, such as on outputs and changes to indicators, will be revisited when
the department embarks on the next update. Information on how users will be kept
informed of future updates and how they can contribute their views is given below
under ‘Date of the next publication’.
Further information
Points to consider when using the data
The neighbourhood-level Indices provide a description of areas, but this description
does not apply to every person living in those areas. Many non-deprived people live
in deprived areas, and many deprived people live in non-deprived areas.
Those areas that are not identified as deprived by the neighbourhood-level Indices
are not necessarily affluent areas. It may also be the case that some highly deprived
areas contain pockets of affluence; that is, an area might contain both deprived and
affluent people. This is because the Index of Multiple Deprivation is designed to
identify aspects of deprivation, not affluence.
For example, the measure of income deprivation is concerned with people on low
incomes who are in receipt of benefits and tax credits. An area with a relatively small
proportion of people (or indeed no people) on low incomes may also have relatively

34 The English Indices of Deprivation 2015 Statistical Release
few or no people on high incomes. Such an area may be ranked among the least
deprived in the country, but it is not necessarily among the most affluent.
In addition, the Indices of Deprivation methodology is designed to reliably distinguish
between areas at the most deprived end of the distribution, but not at the least
deprived end. Differences between less deprived areas in the country are therefore
less well defined than those between areas at the more deprived end of the
distribution.
Comparing deprivation across areas
When comparing areas using the Indices of Deprivation, users should be aware that
it is generally not possible to quantify the differences in deprivation between areas.
The Index of Multiple Deprivation is a measure of relative deprivation. Its ranks
indicate how deprived areas are relative to others in England. The ranks are
generated from scores which summarise deprivation across the seven domains, but
the scores are not meaningful measures of deprivation in the sense that they are not
proportions of the population who are experiencing multiple deprivation.
Similarly, most of the domain indices provide relative measures of deprivation. Their
ranks and scores are not meaningful measures of deprivation in each area, but they
do measure deprivation relative to all other areas in England.
The exceptions are the Income Deprivation Domain and its supplementary Indices,
and the Employment Deprivation domain. Deprivation scores for these indices,
although still relative measures, are meaningful as they are simple proportions of the
relevant population experiencing income or employment deprivation, respectively.
These scores can be used to quantify differences in deprivation between areas.
More information is provided on using and interpreting the Indices in Chapter 3 of the
Research Report.
Exploring changes in deprivation over time
The purpose of Indices of Deprivation is to measure as accurately as possible the
relative distribution of deprivation at a small area level, but this comes at the expense
of ‘backwards’ comparability. The versions of the Indices should not be construed as
a time-series; they provide the best measure of relative deprivation at the time.
When exploring changes in deprivation between the Indices of Deprivation 2015 and
previous versions of the indices, users should be aware that changes can only be
described in relative terms, for example, the extent to which an area has changed
rank or decile of deprivation, as determined by each version of the Indices at the
time. They cannot be used to identify real change over time for the reasons outlined
below. This is the case for the Index of Multiple Deprivation and all of the domain
indices (including the Income Deprivation Domain, Employment Deprivation Domain

The English Indices of Deprivation 2015 Statistical Release 35
and the supplementary indices which are expressed as proportions of the relevant
populations).
The Indices of Deprivation 2015 have been produced using the same approach,
structure and methodology used to create the previous Indices of Deprivation 2010
(and the 2007 and 2004 versions). Keeping a consistent methodology in this way
allows comparisons to be made over time in terms of comparing the rankings
between the Indices of Deprivation 2015 and previous versions of the Indices.
For example, an area can be said to have become more deprived relative to other
areas if it was within the most deprived 20 per cent of areas nationally according to
the 2010 Indices of Deprivation but within the most deprived 10 per cent according to
the 2015 Indices. However, it would not necessarily be correct to state that the level
of deprivation in the area has increased on some absolute scale, as it may be the
case that all areas had improved, but that this area had improved more slowly than
other areas and so been ‘overtaken’ by those areas.
As described in section 3.4 of the Research Report, other changes limit the ability to
make comparisons over time:
changes to the basket of indicators used to measure deprivation, which
includes changes in eligibility criteria for certain benefits used to measure
income deprivation and employment deprivation,
changes to the geography of Lower-layer Super Output Areas, and
revisions following the 2011 Census to population estimates used as the basis
for denominators in producing the previous Indices.
Higher level summaries
The Indices of Deprivation are designed primarily to be small-area or neighbourhood
measures of relative deprivation. But the Indices are commonly used to describe
relative deprivation for higher-level geographies like local authority districts. To
facilitate this, a range of summary measures are produced for larger areas including
local authorities.
These summary measures have been carefully designed to help users understand
deprivation patterns for a set of higher-level areas.
The measures identify the overall intensity of deprivation, how deprivation is
distributed across the larger area, and the overall volume, or ‘scale’, of deprivation.
These measures are described in section 3.8 of the Technical Report and advice on
their interpretation is provided in section 3.3 of the Research Report.
Because patterns of deprivation across larger areas can be complex, there is no
single summary measure that is the ‘best’ measure. Rather, each of the summary
measures that are published highlight different aspects of deprivation, and each

36 The English Indices of Deprivation 2015 Statistical Release
leads to a different ranking of areas. Comparison of the different measures is needed
to give a fuller description of deprivation for larger areas.
It is important to remember that the higher-area measures are summaries; the
Lower-layer Super Output Area level data provides more detail than is available
through the summaries.
This Statistical Release focuses mainly on just one summary measure to describe
relative deprivation at local authority level: the proportion of neighbourhoods that are
in the most deprived decile nationally. But it also makes use of the Extent measure
of the Index of Multiple Deprivation, and average score measures for analysis of
income and employment deprivation. These measures are described under
‘Definitions’ above. More detailed analysis using the range of summary measures is
presented in sections 4.4 and 5.3, and Appendix D of the Research Report.
Devolved administration statistics
Indices of Deprivation data is published for each of the countries in the United
Kingdom. These datasets are based on the same concept and general methodology,
however there are differences in the domains and indicators, the geographies for
which the indices are developed and the time points on which they are based. These
differences mean that the English Indices of Deprivation published here should not
be directly compared with those from the Indices produced in Wales, Scotland and
Northern Ireland.
The Office for National Statistics has put together some information explaining in
more detail the similarities and differences between the four Indices. This includes a
guidance document for comparing across countries, an indicator comparison table
and a table highlighting key components and differences:
www.neighbourhood.statistics.gov.uk/dissemination/Info.do?page=analysisandguida
nce/analysisarticles/indices-of-deprivation.htm
The most recent Indices of Deprivation data for the Devolved Administrations are
available at:
Scottish Index of Multiple Deprivation 2012 www.gov.scot/Topics/Statistics/SIMD
Welsh Index of Multiple Deprivation 2014: www.gov.wales/statistics-and-research/welsh-index-multiple-deprivation/?lang=en
Northern Ireland Multiple Deprivation Measure 2010: www.nisra.gov.uk/deprivation/nimdm_2010.htm
The department will continue its work with the devolved administrations to explore
future opportunities for UK wide alignment.

The English Indices of Deprivation 2015 Statistical Release 37
Enquiries Media enquiries:
0303 444 1201
Email: [email protected]
Public enquiries and Responsible Statistician:
Baljit Gill Email: [email protected]
Queries submitted to the address above will receive an automatic
acknowledgement stating that the query has been received. We will endeavour to
respond to queries within 20 working days, and more quickly when possible.
Complex queries may take longer than 20 working days to resolve.
Where queries relate to how to use the Indices of Deprivation, users will be referred
to the published guidance materials including the frequently asked questions, and
users are encouraged to review these documents prior to emailing the department.
The Indices of Deprivation draws upon the best available data at the time of its
production and, as outlined above, they undergo a substantial range of quality
assurance checks. Where queries relate to the perceived accuracy of the data that
feeds into the Indices, it may not be possible to explore all concerns raised but the
department will consider referring issues with specific data sources to the suppliers.
Information on Official Statistics is available via the UK Statistics Authority website:
www.statisticsauthority.gov.uk
Information about statistics at DCLG is available via the Department’s website:
www.gov.uk/government/organisations/department-for-communities-and-local-
government/about/statistics
Date of the next publication The Indices of Deprivation are typically updated every 3 to 4 years, but the dates of
publication for future Indices have not yet been scheduled.
Users will be kept informed of future updates and how they can contribute their
views. This information will be posted on the Indices of Deprivation webpage:
www.gov.uk/government/collections/english-indices-of-deprivation and in email
alerts to registered users.
To register for e-mails alerts about the Indices, please e-mail
[email protected] with ‘subscribe’ in the subject heading.

38 The English Indices of Deprivation 2015 Statistical Release
NATIONAL STATISTICS STATUS National Statistics status means that official statistics meet the highest standards of trustworthiness, quality and public value. All official statistics should comply with all aspects of the Code of Practice for Official Statistics. They are awarded National Statistics status following an assessment by the Authority’s regulatory arm. The Authority considers whether the statistics meet the highest standards of Code compliance, including the value they add to public decisions and debate. It is a producer’s responsibility to maintain compliance with the standards expected of National Statistics, and to improve its statistics on a continuous basis. If a producer becomes concerned about whether its statistics are still meeting the appropriate standards, it should discuss its concerns with the Authority promptly. National Statistics status can be removed at any point when the highest standards are not maintained, and reinstated when standards are restored.
© Crown copyright, 2015
Copyright in the typographical arrangement rests with the Crown.
You may re-use this information (not including logos) free of charge in any format or medium, under
the terms of the Open Government Licence. To view this licence,
www.nationalarchives.gov.uk/doc/open-government-licence/ or write to the Information Policy Team,
The National Archives, Kew, London TW9 4DU, or email: [email protected].
This document/publication is also available on our website at www.gov.uk/dclg
If you have any enquiries regarding this document/publication, email [email protected]
or write to us at:
Department for Communities and Local Government
2 Marsham Street
London
SW1P 4DF
Telephone: 030 3444 0000
September 2015
For all our latest news and updates follow us on Twitter: https://twitter.com/CommunitiesUK
ISBN: 978-1-4098-4688-8