indicators of ict in education (iie) - world...
TRANSCRIPT

Indicators of ICT in Education (IIE)
Summary of main findings
June 2009

Background and purpose
To identify a set of indicators that are relevant for enabling the regular monitoring of the use and impact of ICT in primary and secondary education.
To describe scenarios for monitoring ICT in Education in the European Union.
32 target countries (EU+) Start: November 2008 End: October 2009

Policy topics Infrastructure. This concerns issues like hardware and software
and within these sub-issues such as access to the Internet, broadband connections, open source software.
Curriculum and content. This covers issues such as pedagogical approach (e.g. autonomous learning), content (e.g. development of methods), assessment (e.g. portfolio’s, digital drivers license)
Opportunities to learn Outcomes, e.g. competencies, digital literacy. School leadership, e.g. change management. Connectedness, e.g. national and/or international cooperation,
public-private partnerships. Teacher training, e.g. teacher competencies, pedagogical drivers
license. Support, e.g. the way technical and/or pedagogical support is
made available. Transversal issues, e.g. equity, financing, safety.

The project from a birds-eye perspective
Concepts
Available and desirable indicators
Proposal indicators
Scenario’s for data collection
Statistics from existing sources
Policy docs Opinions
Research docs
Quality
Feedback national experts
Feasibility
Sustainability
Exist.int.dbases
Natnl.dbases

Monitoring in education-the core
Exist.int.dbases
Natnl.dbases
Intentions
Opportunity to Learn
Outcomes: competencies and attitudes
Indicators

Methodology Policy issues/Concepts
Available indicators
New indicators
Priorities
Proposal
Scenarios
Gaps
Steering Ctee & Nat. experts
Nat. ICT experts
Steering Ctee
Main sources
Policy documents
Existing data bases (IEA,OECD, EU)
National ICT experts (screening: 54 names from 28 countries; indicator survey 55 indicator areas: 76% respondents from 93% countries)

First a few words about monitoring
Navigation tool Common destinations? Compare progress Diagnose deficiencies Interventions for improvement
Need valid indicators

Monitoring in general:as tool for evidence based policy making
1. Policy goals/intended
2. Assessment
3. Evaluation and reflection
4. Diagnosis Secondary indicators
Primary indicators
Policy documents
Research literature
5. Interventions

Monitoring:regular assessments
time Diagnosis
Assessment 1 Assessment 2 Assessment 3
Monitor
Intervention Diagnosis Intervention

Monitoring
Important concepts Policy cycle Primary and secondary indicators:dilemmas Common targets Priorities Periodicity Multi level monitoring Concerns (atomistic versus holistic): conservative
effects? Need for monitoring ICT?

Main conclusions: see handout Need Policy topics High priority indicator areas Focus on learner Indicator and data gaps Validity Multi-level monitoring Differences in indicator needs Inferences about impact? Innovative monitors needed in EU Coordination between main players

Need for international comparative monitoring of ICT in education
0 20 40 60 80 100
Unlikely
No
Maybe, if certain conditions are met
Yes, depending on the kind of indicators
Yes, definitely
Percentage of countries

Percentage need per topic
0 20 40 60 80 100
ICT infrastructure
Curriculum and content
Connectedness
ICT support
Opportunities to learn with and/or about ICT
School leadership
Teacher training
Competencies and attitudes of learners
Percentage
High need Medium need Low/no need
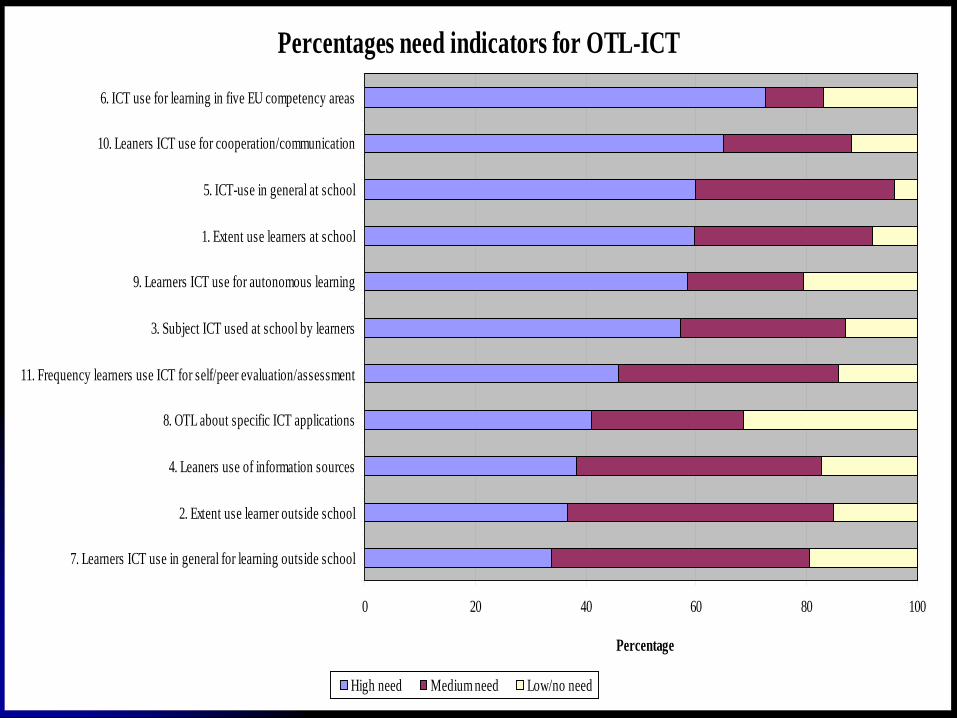
Percentages need indicators for OTL-ICT
0 20 40 60 80 100
7. Learners ICT use in general for learning outside school
2. Extent use learner outside school
4. Leaners use of information sources
8. OTL about specific ICT applications
11. Frequency learners use ICT for self/peer evaluation/assessment
3. Subject ICT used at school by learners
9. Learners ICT use for autonomous learning
1. Extent use learners at school
5. ICT-use in general at school
10. Leaners ICT use for cooperation/communication
6. ICT use for learning in five EU competency areas
Percentage
High need Medium need Low/no need

Percentage students having used computers at all Grade 4
0
20
40
60
80
100
Per
cen
tag
e
PIEA2001 60 59 75 95 85 62 77 91 11 75 58 53 93 92 42 54 78 97 44 60 97 94
TIEA2003 95 86 88 88 79 88 95 95 88 99 97 98
TIEA2007 89 98 99 89 93 67 93 93 96 98 93 96 98 99 94 97
AT BE BG CY CZ DK FR DE EL HU IS IE IT LV LT NL NO RO SK SI SE TR MK UK JP US

Percentage students using ICT at school Grade 4
0
20
40
60
80
100
Per
cen
tag
e
PIEA2001 14 23 31 32 16 61 33 75 35 11 24 12 71 51 16 73 32 8 24 90 87 84
TIEA2003 72 52 33 42 28 27 83 65 38 91 90 85 84
PIEA2006 49 62 34 51 46 78 58 66 45 79 82 36 42 37 15 85 71 43 27 68 46 59 98 96 89
TIEA2007 33 50 33 78 40 42 20 21 80 63 57 32 43 85 86 73 68
AT BFL BFR BG CY CZ DE DK EL ES FR HU IS IT LT LU LV MK NL NO PL RO SE SI SK TR UKE UKS JP US

Percentage students using ICT at school weekly Grade 4
0
20
40
60
80
100
Per
cen
tag
e
PIEA2001 11 15 18 17 13 38 28 59 24 7 17 8 50 22 13 35 16 5 22 67 63 70
PIEA2006 27 28 21 35 24 39 41 41 34 63 63 21 15 24 11 65 41 33 19 31 24 38 85 79 74
AT BFL BFR BG CY CZ DE DK EL ES FR HU IS IT LT LU LV MK NL NO PL RO SE SI SK TR UKE UKS USA

Percentage students using internet outside school daily Grade 4
0
20
40
60
80
100
Per
cen
tag
e
TIEA2003 59 41 27 28 33 30 61 53 39 67 67 42 71
TIEA2007 54 64 58 89 62 39 64 70 90 87 87 66 53 83 81 50 74
AT BFL CY CZ DE DK HU IT LT LV NL NO SE SI SK UKE UKS JP USA

Use educational software by learners-monthly or more
0
10
20
30
40
50
60
PISA2003 25 17 38 26 33 39 12 30 22 23 30 35 30 47 32 15 36 42 44 3 36
PISA2006 27 22 56 44 32 28 47 29 13 36 27 30 39 48 26 29 49 47 15 38 55 7
AT BE BG CZ DE DK EL ES FI FR HR HU IE IS IT LU LV NL NO PL PT SE SK TR UK JP US


GENERIC SCENARIO
time Diagnostic and developmental research
Assessment 1 Assessment 2 Assessment 3
Legend Indicators first used in assessment 1 Indicators first used in assessment 2 Indicators first used in assessment 3

The End
THANK YOU FOR YOUR ATTENTION!