indicator-supporting fixture based on a time and motion study
TRANSCRIPT

The University of AkronIdeaExchange@UAkron
Honors Research Projects The Dr. Gary B. and Pamela S. Williams HonorsCollege
Spring 2018
Indicator-Supporting Fixture based on a Time andMotion StudyJames [email protected]
Please take a moment to share how this work helps you through this survey. Your feedback will beimportant as we plan further development of our repository.Follow this and additional works at: http://ideaexchange.uakron.edu/honors_research_projects
Part of the Computer-Aided Engineering and Design Commons, and the ManufacturingCommons
This Honors Research Project is brought to you for free and open access by The Dr. Gary B. and Pamela S. WilliamsHonors College at IdeaExchange@UAkron, the institutional repository of The University of Akron in Akron, Ohio,USA. It has been accepted for inclusion in Honors Research Projects by an authorized administrator ofIdeaExchange@UAkron. For more information, please contact [email protected], [email protected].
Recommended CitationAnthony, James, "Indicator-Supporting Fixture based on a Time and Motion Study" (2018). Honors ResearchProjects. 682.http://ideaexchange.uakron.edu/honors_research_projects/682

1
Senior Design/Honors Research Project
James Anthony
Spring 2018
Indicator-Supporting Fixture Based on a Time and Motion Study
Abstract
The design goal of this project was proposed by the company I completed my co-op rotations at,
Jay-Em Aerospace. I was tasked with observing a process carried out in our Assembly department by
multiple people and charged with coming up with a fixture to improve safety, speed, and accuracy of
this task. To determine how to make the process safer I conducted interviews with the people who
would usually be carrying out this process and determined their top concerns and issues with how it is
carried out currently. To improve the speed and accuracy of the process, I conducted a "time and
motion study" across a period of a week and observed different methods and employees carrying out
the process with exact tasks and times being recorded. Once I had my basic ideas for design
determined, I used design concepts presented in the "Concepts of Design" course taken at the
University of Akron to pick a specific layout and fixture shape. A large consideration in this design
process was cost and assembly time; I was instructed to use as many spare stocked parts as I could that
Jay-Em Aerospace had as well as off-the-shelf standard size parts for cheaper, quicker assembly. 3D
models were constructed and are shown. Finally, a small project projection is demonstrated at the end
of this report to estimate/propose how much time and cost can be saved over the course of a year by
constructing and using this proposed fixture.

2
Introduction
When working on my last co-op rotation at Jay-Em Aerospace, the shop foreman approached
me about a project idea that he had been thinking about for several weeks. He had observed a few
employees having difficulty with an inspection process in our assembly department and proposed I
come up with a fixture to alleviate some of the time lost and concerns associated with this process. I
didn't have enough time left I my rotation but I kept the issue in the back of my mind and was happy to
inform Jay-Em I could take on this problem in the form of my senior project.
Jay-Em Aerospace is a small, family owned business with deep ties to the aerospace industry
and Akron, Ohio. Jay-Em's main products manufactured are aerospace wheel and brake assemblies with
clientele including major air framers as well as multiple United States Military branches. Two very
important inspections done to each wheel half after machining and painting are radial and lateral runout
readings. The runout measurements give certainty that there is little to no "wobble" around the
diameter of the wheel referenced to a central axis. Currently, these measurements are taken by hand
with a single dial indicator. The wheel is loaded onto a "balance" machine as the central axis can be
used as the reference axis for these measurements and the magnetic indicator is secured on a support
of the balance machine. Note that this machine (the balancing machine) is not intended for runout
indicator readings but for simplicity's sake it is used for both the runout readings then the wheel half
balancing. This setup is shown on the following page as Image 1. The indicator is manually moved to the
two locations of interest on each wheel half, making a total of four indicator readings for one total
assembly (consisting of one inboard and one outboard wheel half each). Once these measurements are
taken for each lot of wheels, the in-house tooling used on the balance machine is removed and it is used
as intended, showing employees where to counterweight the wheel assemblies.

3
IMAGE 1: Current table and configuration used for radial and lateral
runout measurement

4
Jay-Em's request was a very open ended one: come up with a fixture and/or tooling system to
improve this process overall and estimate how the design saves time over the course of a year. A new
fixture and system of tooling was deemed ideal as the balancing machine could be used simultaneously
with a new measurement system, further streamlining the assembly process. Given the open-
endedness of this project, more details about design criteria are discussed in the following pages.
Design Criteria
Coming up with a design to improve this process involved identifying what I could positively
change. I decided to use some basic design criteria that could be quantified through user experience
and data collection. I decided I would design a fixture and some in-house tooling to improve:
1. Speed
2. Safety
3. Accuracy
Improving speed meant performing a time and motion study to determine what actions and tasks could
be improved as well as study the workflow as a whole. Improving safety could be attained through
discussion with employees who use the current process and identifying their concerns as well as
observe any physical difficulty they experience while carrying out this task. Improving accuracy meant
identifying alternative methods of data collection and removing any sources of "operator error" or
equipment failure/error. Once I had these considerations leading my design, I began brainstorming
potential fixtures and tooling that would improve each one of these aspects of the process.
Other limitations I considered while coming up with potential solutions are addressed in the
"Conceptual Design" section of this report. Jay-Em recommended I keep the cost as low as possible by

5
using any spare/extra parts wherever I could as well as purchase standard, off-the-shelf parts for ease
of assembly and cost efficiency.
Time and Motion Study
To ensure all or most difficulty associated with the current process would be addressed in the
design stages, a time and motion study was conducted to exactly quantify the amount of time spent on
each single step. Since Jay-Em is a small company, I studied the two people that take these
measurements on a regular basis, noting that if business was hectically busy, a temporary employee
would be brought on to take these measurements and help out in general in the assembly process.
Noting that a temp may have to be brought up to speed on how to take these measurements would play
a factor in how simple or detailed the design would be. Each employee was asked to carry out the
measurement process with the current method as normally as they could, as there was no pressure
associated with my study; it was merely an observation and would be used to improve their process.
Shown on the next page is a spreadsheet with the results of the tasks carried out and the time in
seconds it took each employee to complete each task.

6
Bria
n
(sec
onds
)
actio
n #
Actio
nTi
me
take
n tr
ial 1
Tim
e ta
ken
tria
l 2Ti
me
take
n tr
ial 3
Tim
e ta
ken
tria
l 4Ti
me
take
n tr
ial 5
Aver
age
time
for A
ctio
n
1Ga
ther
ing
tool
ing
and
mov
ing
cart
145
00
00
29.0
0
2O
utbo
ard
spac
er p
ut o
n ro
d2.
452.
252.
212.
452.
332.
34
3O
utbo
ard
bear
ing
set o
n sp
acer
2.5
3.1
3.01
2.41
2.54
2.71
4O
utbo
ard
whe
el h
alf s
et o
n be
arin
g16
.43
6.2
6.3
6.22
6.45
8.32
5In
boar
d w
heel
hal
f put
on
11.8
610
10.5
410
.22
10.2
310
.57
6in
boar
d be
arin
g pu
t on
whe
el h
alf
10.1
96.
356.
315.
255.
516.
72
7in
boar
d sp
acer
put
on
bear
ing
7.2
7.1
6.78
6.59
6.88
6.91
8"l
ocki
ng" s
pace
r put
dow
n5.
223.
253.
194.
183.
333.
83
9in
dica
tor s
et: I
B ra
dial
19.6
11.7
19.4
418
.82
19.7
117
.85
10Re
adin
g of
indi
cato
r18
.79
9.45
15.2
216
.06
18.5
15.6
0
11w
ritin
g va
lue
2.1
2.3
2.2
2.1
2.1
2.16
12in
dica
tor s
et: O
B ra
dial
30.7
512
.829
.41
18.2
420
.21
22.2
8
13re
adin
g15
.43
8.02
10.6
510
.88
12.2
111
.44
14w
ritin
g va
lue
2.2
2.1
2.1
2.1
2.3
2.16
15in
dica
tor s
et: O
B la
tera
l40
.92
20.7
322
.34
40.0
231
.82
31.1
7
16re
adin
g11
.19
13.1
311
.95
10.2
610
.21
11.3
5
17w
ritin
g va
lue
2.5
2.3
2.1
2.2
2.2
2.26
18in
dica
tor s
et: I
B la
tera
l27
.18
8.26
26.6
621
.43
10.2
418
.75
19Re
mov
e in
dica
tor
10.1
10.1
10.2
110
.410
.110
.18
20re
mov
e al
l com
pone
nt fo
r nex
t tes
t45
.65
43.2
40.1
44.6
745
.21
43.7
7
TOTA
L TIM
E: (s
ec)
427.
2618
2.34
230.
7223
4.5
222.
0825
9.38
Aver
age
tota
l tim
e:25
9.38
Pers
on S
tudi
ed: #
1

7
To briefly describe each action:
1. Gathering tooling and moving cart - Each wheel assembly has an "adapter" for each half, which
they call the "spacer" An image of this spacer is shown in Appendix B in Images 2 and 3. These
are used to adapt the diameter of the shaft the wheel is put on to the size of each wheel half's
tapered roller bearing, which is necessary to rotate the wheel and take the measurements.
Currently these bearings and spacers are scattered on a table to the left of the balancing table
and before each person started their first trial they had to look around the assembly
department to find these parts. This is considered for improvement in the design process. Each
cart moves eight wheels at a time.
2. Outboard spacer put on rod - OB wheel half "spacer" described in point 1 set onto shaft
3. Outboard bearing set on spacer - each wheel half uses one TIMKEN tapered roller bearings.
These bearing sizes are different between each half and are different for each wheel assembly.
How these are set on is shown in Image 3 of Appendix B.
4. Outboard Wheel half set on bearing - wheel half placed on shaft, resting on roller bearing
5. Inboard wheel half put on - the inboard wheel half is placed on shaft, resting on the outboard
wheel half as it will after final assembly.
6. inboard bearing put on wheel half - same as #3 except outboard size
7. Inboard spacer put on bearing - same as #2, except this spacer fits onto the inboard bearing and
is necessary to ensure wheel halves are pressed together and not rotating about the shaft
separately
8. "Locking" spacer put down - this is a sort of metal sleeve that fits onto the shaft on top of the
inboard spacer. this piece is used to provide extra weight so the wheel halves are pressed
together and not rotating about the shaft separately

8
9. Indicator set: IB radial - The first indicator reading taken is along the diameter of the inboard
wheel half. The indicator is secured onto the balance machine and the tip is moved to the
correct place.
10. Reading of indicator - once the indicator tip is in place, the wheel is rotated about the central
shaft and the indicator is manually observed and read. The wheel must make at least one whole
rotation but is usually rotated more than that to ensure accuracy.
11. Writing value - The operator records their largest indicator reading on a sheet of paper in the
correct column, as prepared by Jay-Em's Quality manager.
Actions 12-18 are repetitions of 9-11 so they will not be described again here. After all the
measurements are made, the indicator is removed and all components described as "put on" in actions
2-8 are removed so the next wheel half can be put on. The second time and motion study table is
attached in Appendix A.
Analysis of Data
After each action was timed and average times were determined, the time data collected was
scrutinized to find areas of most time spent that could be improved. To simplify the time spent into an
easier to read comparison, the average times for each action were grouped into three overarching
categories: Material Gathering and Setup, Taking and Logging Measurements, and Breakdown. The
results of comparing this data is shown on the next page on Figure 1.

9
Since the largest concentration of time spent during the process is in taking and logging
measurements, I focused on improving this part of the process the most. The material gathering and
setup time also stood out to me as a part of the process that could be improved, which I also considered
in the brainstorming process of design. One of the employees I observed (Person #2) was not as
acquainted with this measurement process as Person #1 and therefore took more time and was less
certain of the steps. I considered the fact that the current process seemed difficult for someone to just
"pick up" and relied on more experienced-based knowledge than tooling ingenuity. Throughout the
design process for the new fixture and tooling I would consider details to make the process easier for
someone to set up with little prior knowledge of how the measurements are taken.
0.00
20.00
40.00
60.00
80.00
100.00
120.00
140.00
160.00
Material Gathering and Setup:
Taking and Logging Measurements:
Breakdown
Tim
e T
ake
n (
Seco
nd
s)
Task Category
Comparison of Time Taken for Each Task Category: Person #1
Time Taken (Average)
FIGURE 1: Comparison of time taken for each task category

10
Conceptual Design
To begin the design process, I spent an afternoon brainstorming potential designs that could at
least support the measurement process. These designs were based on the existing method used but
with significant changes to improve the process that I would refine further in the design stages. I
determined using a fixture based off of the existing method would be more beneficial to cost
effectiveness of the project as the "spacers" were already manufactured and the familiarity of the
design would be easier to get used to. Sketches of three potential designs are shown as follows:
FIGURE 2: Conceptual Design #1

11
FIGURE 3: Conceptual Design #2
FIGURE 4: Conceptual Design #3

12
Conceptual and Embodiment Design principles were followed based on processes and
information presented in the textbook used in C.O.D. class at the University of Akron, Engineering
Design, Fifth Edition by George E. Dieter and Linda C. Schmidt. Each of these designs improved the
measurement process by including four adjustable indicators fixed on shafts. This design consideration
allows the indicators to be set once on the first wheel and simply swung in or out between each
following wheel assembly. Thus, the setup time gets distributed between each wheel in a lot yet is only
done once. Additionally, the height of each table would be optimized to an average height so the strain
of lifting the largest wheel halves over the main shaft would be decreased for anyone who may use it.
After sketching and deciding weight factors I also decided each design would also include a "rack" (not
sketched) to keep the spacers and bearings used for each wheel half and assembly , thus decreasing the
amount of time spent gathering material before each lot of started.
Once I determined this was the design shape I wanted to move forward with, I considered the
size constraint of room I would have for this fixture as well as the size and weight constraints of wheel
assemblies that would use this new fixture. The fixture needed to fit within a 5' x 4' x 8' space. The
largest diameter wheel that would be used had a 18.5 in diameter and the smallest bore size the shaft
would have to was 1.25 in. The heaviest wheel assembly would weigh 48 lbs at an absolute max and
would have to be supported by the frame and table of the fixture.
Weighted Decision Matrix Weight Factor Design 1 Design 2 Design 3 Design 1 Design 2 Design 3
Material Cost 0.25 5 7 6 1.25 1.75 1.5
Manufacturing Time 0.15 5 6 5 0.75 0.9 0.75
Operator Safety 0.30 4 7 5 1.2 2.1 1.5
Repairability 0.05 5 5 5 0.25 0.25 0.25
Repair Costs 0.05 5 5 5 0.25 0.25 0.25
Assembly Time 0.15 4 8 6 0.6 1.2 0.9
Reliability of Design 0.05 5 8 6 0.25 0.4 0.3
TOTALS: 4.55 6.85 5.45

13
Embodiment Design
CLARITY - Each component has a discernible use within the design. The legs and frame support the
weight of the table and wheel assembly, the central shaft gives a center point of reference for the wheel
to be rotated about for measurement, the vertical shafts on the sides of the table allow the heights of
the indicators to be moved, the horizontal shafts attached to the vertical shafts allow the indicators to
move, and the indicators take the measurements necessary. Additionally, these vertical and horizontal
shafts will have notches cut into them with etched labeling to quickly locate where the indicators need
to be for each different wheel assembly/size. The rack will help organize the tooling used for each
wheel assembly and cut down on setup time.
SIMPLICITY - This design can be built using standard, off the shelf parts that are described later in the bill
of materials. Standard parts and sizes make for a simpler and cheaper design. The vertical and
horizontal shafts used to position the indicators will be tightened into position with hand-tightened
clamps which I believe is the simplest way to connect these pieces (as opposed to tapping and threading
several locations on the shafts. I chose to orient the wheel on a vertical central shaft as opposed to a
horizontal orientation as I believe using the center of the wheel bore for location is the simplest way of
doing so, as well as supporting the weight of the wheel against the table and support instead of along a
horizontal shaft.
SAFETY - The biggest concern employees voiced in regards to safety was for the design to be stable and
the lifting of some wheels being too heavy or cumbersome. To account for this, I picked a table height
of roughly three and a half feet tall with the central shaft extending an extra foot and a half to give the
maximum lifting height of any wheel around five foot high. This was chosen specifically to
accommodate the average height of an employee as to not overextend the arms and shoulders with any
wheel. In addition to this consideration I am recommending Jay-Em consider relocating a 500lb. max

14
load jib crane to the side of the table since there will be enough room left over in floor space. This crane
is not currently in use and fits the size constraint of the area and is not too oversized to the point where
it would make loading and unloading cumbersome. This will further increase the safety and decrease the
physical strain the average employee may encounter while using this fixture.
3D Model and Detail Design
FIGURE 5: SoildWorks rendering of chosen design with details

15
The legs and table base would be welded together with a 3/4" fillet welds which is customary
for in-house jobs we have done in the past. The steel plate "table" area would be joined to the frame
with four, 1/2"-13, 4" long socket head cap screws. The holes and counterbores for these socket head
cap screws are seen in Figure 5. This length gives enough room for the screw to come through the table
and through the frame with enough thread left on the end to put a nut on and weld for additional
strength. The shaft support bar in the center of the table would be joined in this similar way but with 3"
long screws through tapped holes in the shaft support through the table instead. These screws were
chosen since we have a large stock available and would come at no cost to Jay-Em. For the sake of
completeness they are included in Bill of Material, attached as Appendix C, anyhow.
Additionally, the 1/2" and 3/8" diameter rods used in the swinging arm design are connected by
mini clamps to be designed and cut to size in house. These clamps feature a small tapped hole to fit a
small knob which comes as a standard indicator base size (see Bill of Material, Appendix C), a hole cut
for the rod diameter it is free to move up and down on, and a tapped hole to fit the part of the arm that
swings in and out. This design ensures the arms can only swing in and out with respect to the 1/2" rods,
meaning once the indicators are set in the correct orientation for the wheel size measured, wheels can
be changed by swinging the arms in and out with the indicators still set in correct position. The
indicators are then joined to the arms by the base connection kits as shown in Appendix C, minus the
magnetic bases. Notches will be cut into the 1/2" and 3/8" rods which will be measured and labeled to
correspond to a specific wheel type and size. Moving the mini clamps into these pre-cut and measured
notches will take out a lot of the "guess work" associated with setting up the indicators.

16
A wooden "rack" is shown mocked up on the model which will feature printed descriptions and
spaces for each wheel assemblies spacers and bearings, which will greatly improve the set up times for
each wheel. Lastly, the central rod which the spacers and bearings rest on is threaded on the bottom
2.25" and this is engaged by tapped holes at the bottom of the shaft support through the table width. A
Bill of Material and cost projection are shown below using standard parts website prices (references are
attached in Appendix C).
Cost Efficiency Study
To quantify what kind of impact this design would make on the assembly and inspection
process, I made educated estimates for the time it would take to carry out the tasks with my new fixture
design, as it is not built and cannot be observed at this time. Suppose, with the tooling components
organized on the rack as designed, it takes an employee 10 seconds to locate and gather their materials.
It then would take the same amount of time (more or less) to load all the components onto the shaft
like before, which was an average time of 70.5 seconds. Suppose then that it takes the employee 10
seconds to locate and tighten all four of the measurements shafts into position with the newly designed
swinging arm shafts on the sides of the table, with an additional 20 seconds to ensure all indicators are
in correct position. The employee would then swing the "arms" with the indicators into position on the
wheel assembly, taking another 10 seconds. At this point since digital indicators are being used the
wheel assembly is spun around the central shaft twice by hand to ensure total diameter measurement,
FIGURE 6: SolidWorks rendering of designed clamp
17
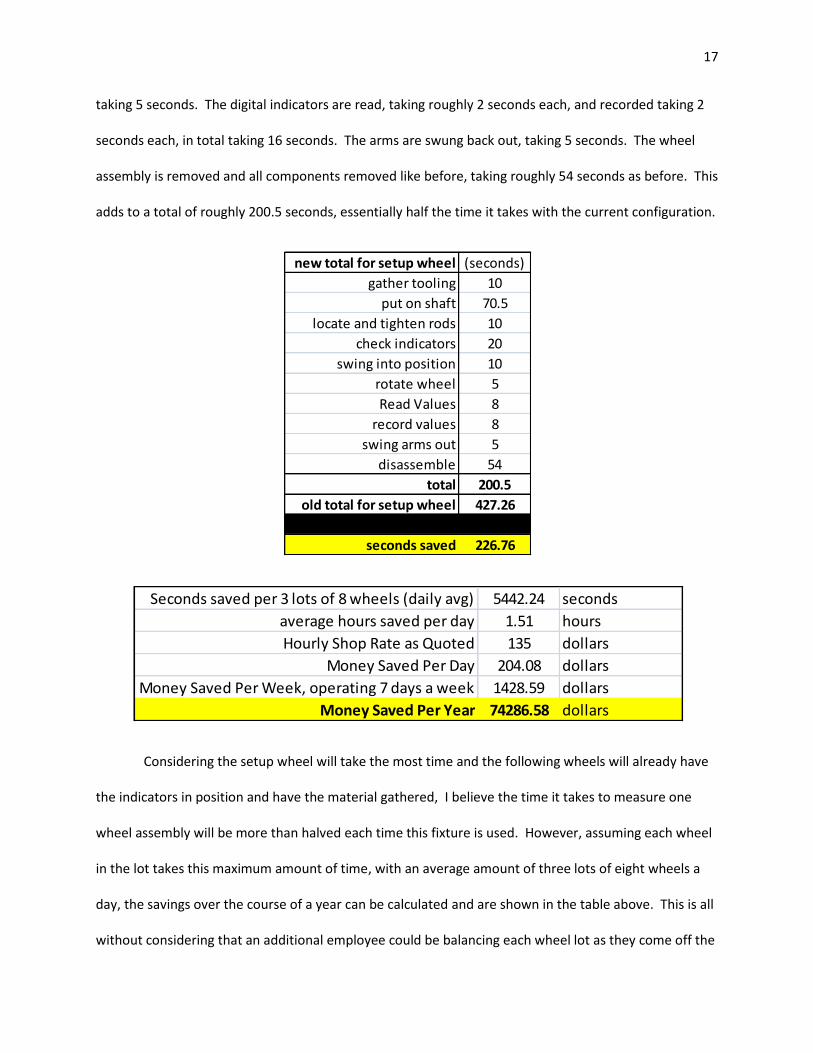
taking 5 seconds. The digital indicators are read, taking roughly 2 seconds each, and recorded taking 2
seconds each, in total taking 16 seconds. The arms are swung back out, taking 5 seconds. The wheel
assembly is removed and all components removed like before, taking roughly 54 seconds as before. This
adds to a total of roughly 200.5 seconds, essentially half the time it takes with the current configuration.
Considering the setup wheel will take the most time and the following wheels will already have
the indicators in position and have the material gathered, I believe the time it takes to measure one
wheel assembly will be more than halved each time this fixture is used. However, assuming each wheel
in the lot takes this maximum amount of time, with an average amount of three lots of eight wheels a
day, the savings over the course of a year can be calculated and are shown in the table above. This is all
without considering that an additional employee could be balancing each wheel lot as they come off the
new total for setup wheel (seconds)
gather tooling 10
put on shaft 70.5
locate and tighten rods 10
check indicators 20
swing into position 10
rotate wheel 5
Read Values 8
record values 8
swing arms out 5
disassemble 54
total 200.5
old total for setup wheel 427.26
seconds saved 226.76
Seconds saved per 3 lots of 8 wheels (daily avg) 5442.24 seconds
average hours saved per day 1.51 hours
Hourly Shop Rate as Quoted 135 dollars
Money Saved Per Day 204.08 dollars
Money Saved Per Week, operating 7 days a week 1428.59 dollars
Money Saved Per Year 74286.58 dollars

18
new runout measurement fixture, streamlining the inspection process and cutting down on amount of
time spent in between, which would amount to even more money saved. For a small business dealing
in aerospace parts and design, profit margins can be razor thin and any cost saving measures are
encouraged to compete with the large, global industry, so I believe this change would benefit Jay-Em
Aerospace enough to warrant building and testing.
Conclusion
In conclusion, I believe my design contributes to an improvement on the speed, safety, and
accuracy of the runout measurement process enough to warrant Jay-Em building and testing. The speed
of the setup and measurement process is greatly improved by the rack on the bottom of the fixture for
organization as well as the adjustable, "swinging" arms shown in the rendering. I also believe the overall
speed of the inspection and assembly process for any wheel will be greatly improved as an employee
can now also be using the balance machine as intended while wheel runout measurements are taken,
streamlining the process from measurement to balancing. Another recommendation I am making in this
design is to purchase and implement digital indicators that feed measurements directly into a document
so the measurement time and reading/writing time of values is greatly improved, with improved data
retention ability and less floating paperwork. The safety of the process is improved with the design's
height consideration, ensuring any one employee won't have to over extend their arms and shoulders to
get a wheel half on the fixture shaft. The accuracy of the measurement process is improved by using the
pre-cut notches in the adjustable arms and implementing digital indicators. The pre-cut notches will
ensure the indicators are in correct position relative to which wheel they are measuring and the digital
indicators ensure the most accurate measurement is taken without any human "eyeballing" error. This
document will serve as a proposal for Jay-Em Aerospace to purchase the necessary parts and assemble

19
this fixture and I believe with the results shown for potential time and monetary savings it will be
approved.
References
Dieter, George Ellwood, and Linda C. Schmidt. Engineering Design. McGraw-Hill higher Education, 2012

20
Heid
i
(sec
onds
)
actio
n #
Actio
nTi
me
take
n tr
ial 1
Tim
e ta
ken
tria
l 2Ti
me
take
n tr
ial 3
Tim
e ta
ken
tria
l 4Ti
me
take
n tr
ial 5
Aver
age
time
for A
ctio
n
1Ga
ther
ing
tool
ing
and
mov
ing
cart
155
00
00
31.0
0
2O
utbo
ard
spac
er p
ut o
n ro
d3.
013.
112.
252.
142.
892.
68
3O
utbo
ard
bear
ing
set o
n sp
acer
33.
12.
892.
992.
972.
99
4O
utbo
ard
whe
el h
alf s
et o
n be
arin
g15
.28
10.7
810
.55
9.72
10.3
111
.33
5In
boar
d w
heel
hal
f put
on
12.5
812
.54
10.2
210
.83
10.2
511
.28
6in
boar
d be
arin
g pu
t on
whe
el h
alf
11.2
311
.54
11.1
810
.88
9.65
10.9
0
7in
boar
d sp
acer
put
on
bear
ing
7.84
7.82
6.95
6.95
6.83
7.28
8"l
ocki
ng" s
pace
r put
dow
n5.
193.
333.
383.
263.
283.
69
9in
dica
tor s
et: I
B ra
dial
24.4
820
.35
21.1
120
.69
18.4
221
.01
10Re
adin
g of
indi
cato
r19
.65
18.0
218
.08
17.7
217
.84
18.2
6
11w
ritin
g va
lue
2.5
2.5
2.5
2.5
2.5
2.50
12in
dica
tor s
et: O
B ra
dial
26.6
522
.81
22.7
23.0
622
.35
23.5
1
13re
adin
g18
.34
18.0
918
.217
.92
17.8
418
.08
14w
ritin
g va
lue
2.5
2.6
2.5
2.2
2.4
2.44
15in
dica
tor s
et: O
B la
tera
l45
.62
36.7
436
.56
38.8
836
.21
38.8
0
16re
adin
g18
.55
17.2
917
.61
18.3
517
.18
17.8
0
17w
ritin
g va
lue
2.4
2.1
2.2
2.2
2.3
2.24
18in
dica
tor s
et: I
B la
tera
l28
.31
28.1
24.9
724
.32
23.9
125
.92
19Re
mov
e in
dica
tor
9.85
8.91
9.22
9.85
9.26
9.42
20re
mov
e al
l com
pone
nt fo
r nex
t tes
t48
.546
.23
46.8
246
.29
45.5
146
.67
TOTA
L TIM
E: (s
ec)
460.
4827
5.96
269.
8927
0.75
261.
930
7.79
6
Aver
age
tota
l tim
e:30
7.79
6
Pers
on S
tudi
ed: #
2
APPENDIX A: SECOND TIME AND MOTION STUDY

21
APPENDIX A: SECOND TIME AND MOTION STUDY (CONTINUED)
NOTE: Results of second "Time and Motion Study" are strikingly similar to first " Time and Motion"
study, so no preference was given to one over the other.
0.00
20.00
40.00
60.00
80.00
100.00
120.00
140.00
160.00
180.00
Material Gathering and Setup:
Taking and Logging Measurements:
Breakdown
Tim
e T
ake
n (
Seco
nd
s)
Task Category
Comparison of Time Taken for Each Task Category: Person #2
Time Taken (Average)

22
APPENDIX B: ADDITIONAL FIGURES / IMAGES TO EXPLAIN PROCESS AND DESIGN
IMAGE 2: Previously designed and cut "spacer" shown next to tapered roller
bearing that fits on it
IMAGE 3: Previously designed and cut "spacer" shown with tapered roller
bearing fitted onto it

23
APPENDIX C: BILL OF MATERIAL AND SOURCES
Co
mp
on
en
tQ
uan
tity
Pri
ce
Ind
icat
ors
(d
igit
al)
436
7.72
$
304
Stai
nle
ss s
tee
l ro
d, 1
.5"
dia
me
ter,
3 f
t lo
ng
195
.29
$
4130
we
ldab
le a
llo
y st
ee
l pip
e f
or
fram
e, 2
" sq
uar
e b
y 6'
lon
g, 3
/16"
wal
l th
ickn
ess
(30
ft)
132
5.30
$
304
Stai
nle
ss s
tee
l ro
d, 0
.5"
dia
me
ter,
3 f
t lo
ng
230
.26
$
ind
icat
or
bas
e c
on
ne
ctio
n k
its
459
.80
$
ind
icat
or
bas
e u
niv
ers
al c
lam
p4
51.7
6$
3/8"
dia
me
ter
304
stai
nle
ss s
tee
l ro
d, 2
ft
lon
g2
15.7
2$
A36
ste
el p
late
, 2' s
qu
are
by
3/4"
th
ick
(fo
r to
p o
f ta
ble
)1
158.
64$
6061
Alu
min
um
blo
cks
for
min
i-cl
amp
s to
mac
hin
e2
-$
6061
Alu
min
um
ro
d f
or
shaf
t su
pp
ort
(6"
dia
me
ter,
6"
lon
g)1
94.7
1$
1/2"
-13
Sock
et
He
ad C
ap S
cre
w, 4
" lo
ng
414
.80
$
1/2"
-13
coar
se t
hre
ad n
ut
123.
84$
1/2"
-13
Sock
et
He
ad C
ap S
cre
w, 3
" lo
ng
817
.52
$
TOTA
L M
ATE
RIA
L C
OST
:1,
235.
36$

24
APPENDIX C: BILL OF MATERIAL AND SOURCES (CONTINUED)
304 stainless steel rods - https://www.mcmaster.com/#standard-stainless-steel-rods/=1c95m9s
electronic indicators - https://www.mcmaster.com/#test-indicators/=1c95uvg
4130 easy-to-weld alloy steel - https://www.mcmaster.com/#steel-hollow-bars/=1c95o0j
indicator base universal clamp - https://www.mscdirect.com/product/details/02714301?fromRR=Y
indicator base connection kits: https://www.amazon.com/All-Industrial-Pro-Shop-Magnetic-
Indicators/dp/B004EHHPDU/ref=pd_lpo_vtph_469_lp_t_3?_encoding=UTF8&psc=1&refRID=X0Q52FY2J7Z9GZH48
0XR
A36 Steel Plate - https://www.midweststeelsupply.com/store/a36steelplate
6061 aluminum bar - https://www.mcmaster.com/#standard-aluminum-rods/=1canvry
Hex Nuts - https://www.boltdepot.com/Hex_nuts_Stainless_steel_18-8.aspx
socket cap screws - https://www.boltdepot.com/Socket_cap_Stainless_steel_18-8_1_2-13.aspx
IMAGE 4: Indicator base connection kits, shown above, are used to secure the
indicators to the adjustable, swinging arms.

25
APPENDIX D: INTERVIEWS WITH CURRENT EMPLOYEES
The following are real recordings of actual conversations I held with the current full-time employees of
Jay-Em Aerospace in Cuyahoga Falls, Ohio discussing the current method of taking runout
measurements and how it could be improved. Per their request, full names will not be used.
Employee 1: Heidi
Question: First of all, do you know how to take these measurements and read the dial indicators?
Answer: "Yes, but this is all newer to me. I know how to set the wheels up but sometimes I'm unsure
I'm doing the readings correctly. The paperwork and forms kinda help guide me, but sometimes I still
ask for help."
Q: Can you think of what you would like improved since it sounds like you still could use a little help?
A: "Well, for one thing the bearings and space cup things we use are usually unorganized or not even
where they're supposed to be so I have to go find them and that can be frustrating. There are also
instructions on the presses and other machines and there aren't any formal written instructions for this
so that’s why I said I ask for help sometimes."
Q: What's more difficult for you, lifting the wheels straight up or straight forward?
A:" I don’t usually have any trouble with that. Some of the real heavy ones I just ask someone else to
come get for me so I guess it could be a pain but it hasn’t really been yet. Some other fixtures have a
small crane next to them for the heavier wheels I guess that would be helpful."
Q: Ok, well which causes you more issue, the larger wheels or large amounts of wheels to do in a day?

26
A: "When there are a lot of wheels to do it can be frustrating to use the balance machine to do one thing
then use it for another thing. If I could be doing one and handing wheels off to someone else to do the
other the whole process would go a lot faster. Like I said before, the larger wheels I just get someone to
help but if there was a smaller crane beside here I could do them all myself."
Q: How many runout measurements would you do on an average day, and how many have you messed
up at a time?
A: "I would say I do around 16 wheels a day myself and there's usually another lot of 8 wheels someone
else does so, 24 a day on average. That can go way up though depending on what's being run. I really
don’t mess them up but if I'm not sure about what I'm doing is right I'll go find someone for help, so that
can add on time."
Employee 2: Brian
Q: How many wheels would you say you measure a day?
A: "It really depends on what we have running. Right now it's probably like 20 a day but in the busy
season it can be over 50-60 a day so on average I'd guess 30."
Q: What's the biggest pain about taking these measurements for you?
A: "Its really not that bad, I've been doing it a while so I can do it pretty decently time-wise but I will say,
some of the halves can be heavy and lifting the elbows up to the shoulders can get real tiring real fast."
Q: what about gathering the spacers and bearings? Are they ever out of place?
A: "oh yeah, almost always. You can walk around a little bit before you find them too. Sometimes you
have to go to stock to get one because you can't find the last one used."

27
Q: Can you think of any improvements to be made to the runout reading process?
A: "Well readjusting the indicator four times a wheel gets really tedious and there's gotta be a way to
make that quicker. If the bearings and spacers were always at the right spot it would be a lot quicker I
think, and moving one of our smaller cranes to help lift would benefit us I think."