indicator reporting information system (iris) under unep live filethe iris aims to help government...
TRANSCRIPT

.
Indicator Reporting Information System (IRIS) under UNEP Live
12th meeting of the Joint Task Force on Environmental
Statistics and Indicators 18 November 2016, Geneva
Tomas Marques
Programme Officer, Science-Policy Interface
UN Environment, Europe Office
Email: [email protected]

What is UNEP Live?
• UNEP’s on-line knowledge management platform
• Supports more dynamic, interactive assessment and reporting processes
• Focus on open access to global, regional and national environmental data and knowledge
• Includes a range of analytical, mapping, search, and visualization tools
• SDGs/ MEAs Synergies Portal
• Web intelligence portal
• Indicator Reporting Information System (IRIS)
UNEP Live
www.uneplive.org
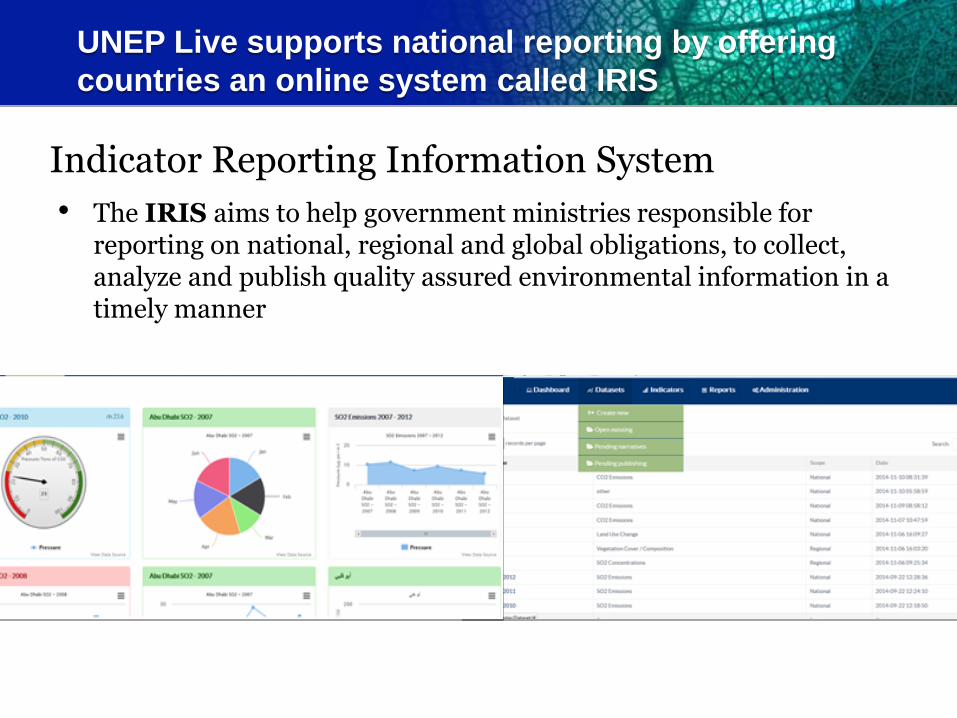
Indicator Reporting Information System
• The IRIS aims to help government ministries responsible for reporting on national, regional and global obligations, to collect, analyze and publish quality assured environmental information in a timely manner
UNEP Live supports national reporting by offering
countries an online system called IRIS

Key value propositions for IRIS
National tool:
• IRIS technology will be transferred to interested countries so that they own and
manage the software and its use locally (i.e. deployed on local servers).
Automation:
• IRIS reduces the burden of routine reporting by automation. Once indicator
definitions have been set up in an IRIS instance it is anticipated human interaction
will be limited as the system will automatically calculate Indicator values and
generate Indicator Instances.
• Once report templates are uploaded they can be used to generate automated periodic
reports using the latest published indicator instance.
Improved data Sharing :
• IRIS provides users the ability (with user approval) to transfer data up the reporting
hierarchy as part of the reporting mechanism.

Dashboard: provides a graphical snap-shot of key data/indicators that together highlight, in a quick, easy way, the state and trends of the environment. Datasources is where users will be able to upload data so they are available for multiple reporting needs. This is the starting point for reporting. Indicator Workbooks can be generated using formulae’s and multiple datasets and Indicator Instances (chart, map, values) saved for use in reporting Reports allow users to generate reports, using reporting templates, that bring in relevant datasets and indicators available in the NRS. The Administration menu option is not available to all users. Administrators have the option to add new users and upload reporting templates.
IRIS menu of options

Upload using an API
Upload from a Database
Upload from an Excel spreadsheet
IRIS – Datasources Upload data for use in Reporting at any time (works with existing national
databases, data repositories)
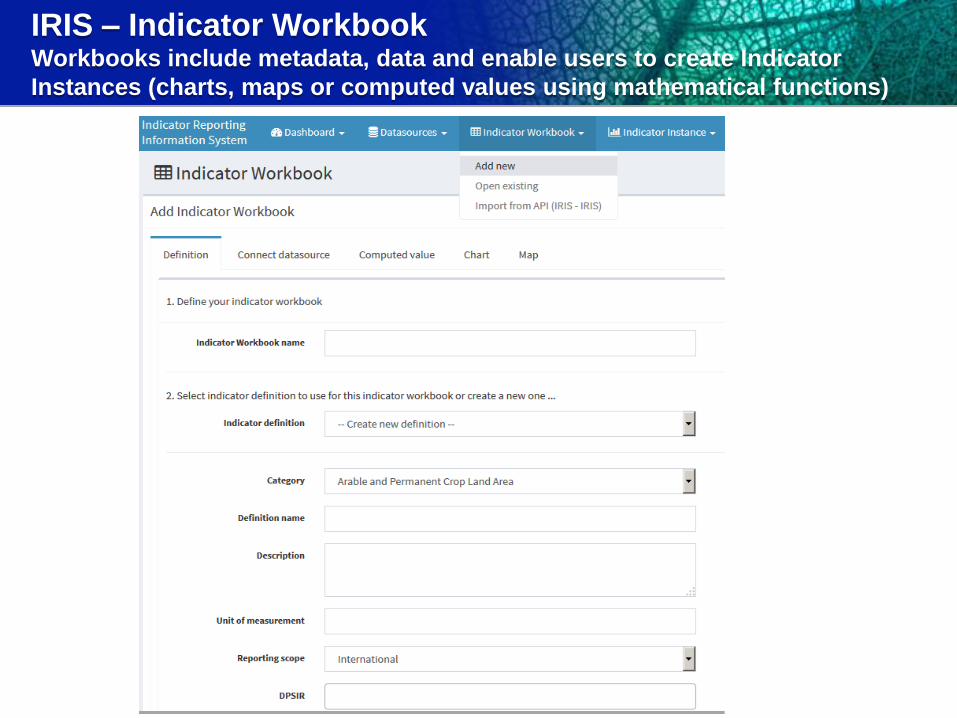
IRIS – Indicator Workbook Workbooks include metadata, data and enable users to create Indicator
Instances (charts, maps or computed values using mathematical functions)

IRIS – Indicator Workbook Create Indicator Instance: Chart

IRIS – Indicator Workbook Create Indicator Instance: Map

IRIS – Indicator Instances Add Narratives to provide context to the illustrated data

IRIS – Reports Use reports templates to populate SoE, MEA and other reports

IRIS – Dashboard Information at your fingertips: Use Indicator Instances to populate multiple Dashboards
that include Indicator Instances showing state and trends of the environment

Expected benefits of using IRIS
1. Improved coordination between agencies
2. Reporting obligations and templates are readily accessible
3.Quick access to the latest data and analysis on the state
and trends of the environment at all times
4.Streamlined reporting
5. Data can be uploaded from remote servers very easily
6.Low investment costs

Demonstration and testing of IRIS at country level
• IRIS is being /will be demonstrated and tested in a selection of countries
including Bosnia and Herzegovina, Cameroon, Dominican
Republic and Samoa
• UNEP will work with 6 other countries in Africa and Asia in the
context of managing air quality data and indicators
• 8th November : IRIS hands-on training session held in Sarajevo
under the scope of GEF-funded project on "Capacity development for the
integration of global environmental commitments into national policies
and development decision making in Bosnia and Herzegovina"(CCCD)
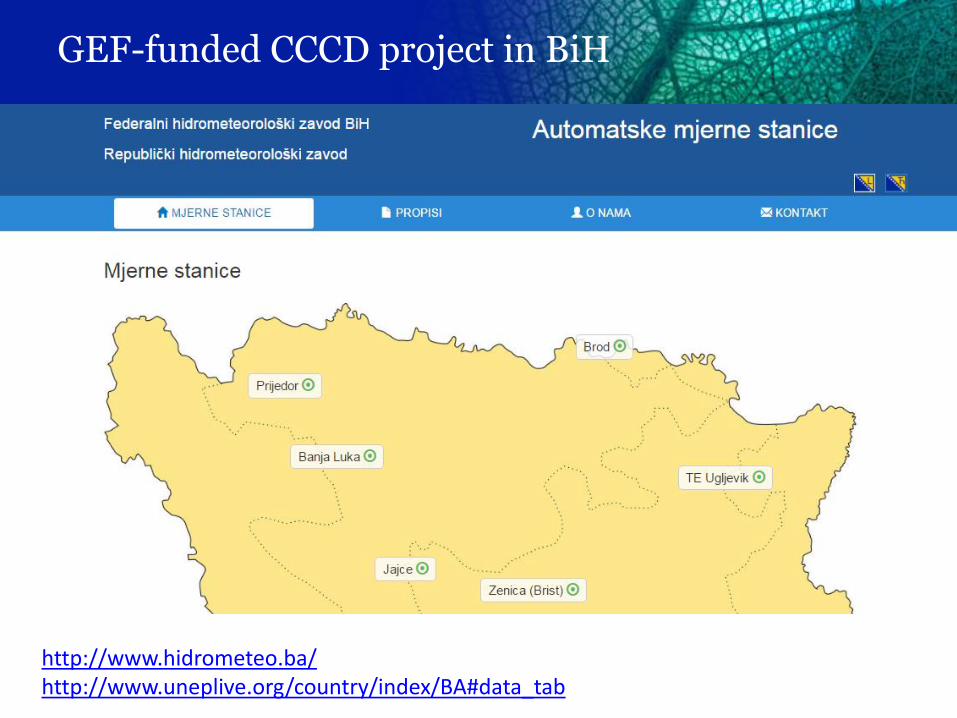
GEF-funded CCCD project in BiH
http://www.hidrometeo.ba/ http://www.uneplive.org/country/index/BA#data_tab

More information on UNEP Live and on IRIS
UNEP Live – http://www.uneplive.org/
Contact us at: [email protected]
Tomas Marques
Programme Officer, Science-Policy Interface
UN Environment, Europe Office
Email: [email protected]
THANK YOU!