indicator definitions edited en rev redouane - unesco...
TRANSCRIPT
1
Education Indicators Technical guidelines
November 2009

2
SUMMARY
ADULT LITERACY OR ILLITERACY RATE ..........................................................................................................3 NUMBER OF ADULT ILLITERATES........................................................................................................................4 GROSS INTAKE RATIO (GIR) IN THE FIRST GRADE OF PRIMARY ..............................................................5 NET INTAKE RATE (NIR) IN THE FIRST GRADE OF PRIMARY......................................................................6 SCHOOL-LIFE EXPECTANCY (SLE) .......................................................................................................................7 TRANSITION RATE (TR) ............................................................................................................................................8 GROSS ENROLMENT RATIO (GER) ........................................................................................................................9 NET ENROLMENT RATE (NER) .............................................................................................................................10 AGE SPECIFIC ENROLMENT RATE (ASER) .......................................................................................................12 REPETITION RATE BY GRADE (RR).....................................................................................................................13 SURVIVAL RATE BY GRADE (SR) .........................................................................................................................14 COEFFICIENT OF EFFICIENCY .............................................................................................................................15 YEARS-INPUT PER GRADUATE .............................................................................................................................17 PERCENTAGE OF REPEATERS ..............................................................................................................................19 PUBLIC EXPENDITURE ON EDUCATION AS % OF GROSS NATIONAL INCOME....................................20 PUBLIC EXPENDITURE ON EDUCATION AS % OF TOTAL GOVERNMENT EXPENDITURE ...............21 PERCENTAGE DISTRIBUTION OF PUBLIC CURRENT EXPENDITURE ON EDUCATION BY LEVEL .22 PUBLIC CURRENT EXPENDITURE PER PUPIL (STUDENT) AS % OF GROSS NATIONAL INCOME
(GNI) PER CAPITA .....................................................................................................................................................23 PUPIL-TEACHER RATIO (PTR) ..............................................................................................................................25 PERCENTAGE OF FEMALE TEACHERS ..............................................................................................................26 PERCENTAGE DISTRIBUTION OF STUDENTS IN TERTIARY EDUCATION BY ISCED LEVEL ............27 PERCENTAGE OF FEMALE STUDENTS IN EACH ISCED LEVEL OF TERTIARY EDUCATION ............28 PERCENTAGE DISTRIBUTION OF STUDENTS IN TERTIARY EDUCATION BY ISCED FIELDS OF
EDUCATION. ...............................................................................................................................................................29 PERCENTAGE DISTRIBUTION OF GRADUATES BY ISCED FIELDS OF EDUCATION AT THE
TERTIARY LEVEL .....................................................................................................................................................30 PERCENTAGE OF PRIVATE ENROLMENT.........................................................................................................31 PERCENTAGE OF TEACHING STAFF IN PRIVATE EDUCATIONAL INSTITUTION ................................32 EDUCATIONAL ATTAINMENT OF THE POPULATION AGED 25 YEARS AND ABOVE ...........................33 NUMBER OF STUDENTS IN TERTIARY EDUCATION PER 100,000 INHABITANTS...................................34 PERCENTAGE DISTRIBUTION OF ENROLMENT IN SECONDARY EDUCATION BY ORIENTATION
OF EDUCATION PROGRAMME .............................................................................................................................35 PUBLIC CURRENT EXPENDITURE ON EDUCATION AS % OF TOTAL PUBLIC EXPENDITURE ON
EDUCATION ................................................................................................................................................................36 PERSONNEL COMPENSATION AS % OF PUBLIC CURRENT EXPENDITURE ON EDUCATION...........37 GROSS INTAKE RATIO IN THE LAST GRADE OF PRIMARY (GIRLG) ........................................................38 EXPECTED GROSS INTAKE RATIO IN THE LAST GRADE OF PRIMARY (EGIRLG)...............................39 GROSS PRIMARY GRADUATION RATIO (GPGR) .............................................................................................40 EXPECTED GROSS PRIMARY GRADUATION RATIO (EGPGR) ....................................................................41 OUT-OF-SCHOOL CHILDREN-PRIMARY (OOS) ................................................................................................42 PROMOTION RATE BY GRADE (PR) ....................................................................................................................43 DROPOUT RATE BY GRADE (DR)..........................................................................................................................44 GROSS ENROLMENT RATIO IN EARLY CHILDHOOD CARE AND EDUCATION (GER/ECCE).............45 PERCENTAGE OF NEW ENTRANTS TO PRIMARY EDUCATION WITH ECCE EXPERIENCE...............46 PERCENTAGE OF TRAINED TEACHERS.............................................................................................................47 PUBLIC EXPENDITURE ON A SPECIFIC ISCED LEVEL AS % OF TOTAL PUBLIC EXPENDITURE
ON EDUCATION .........................................................................................................................................................48 GENDER PARITY INDEX (GPI) ...............................................................................................................................49 YOUTH LITERACY RATE ........................................................................................................................................50

3
ADULT LITERACY OR ILLITERACY RATE
Definition: The percentage of population aged 15 years and over who can both read and write with understanding a
short simple statement on his/her everyday life. Generally, ‘literacy’ also encompasses ‘numeracy’, the ability to
make simple arithmetic calculations. Adult illiteracy is defined as the percentage of the population aged 15 years and
over who cannot both read and write with understanding a short simple statement on his/her everyday life.
Purpose: To show the accumulated achievement of primary education and literacy programmes in imparting basic
literacy skills to the population, thereby enabling them to apply such skills in daily life and to continue learning and
communicating using the written word. Literacy represents a potential for further intellectual growth and contribution
to economic-socio-cultural development of society.
Calculation method: Divide the number of literates aged 15 years and over by the corresponding age group
population and multiply the result by 100. Alternatively, apply the same method using the number of illiterates to
derive the illiteracy rate; or by subtracting literacy rate from 100%.
Formula:
P
LLIT t
15
t15t
15
+
++ = * 100 or
P
IILL t
15
t15t
15
+
++ = * 100
Where:
LITt15+ Adult Literacy Rate (15+) in year t ILL
t15+ Adult Illiteracy Rate (15+) in year t
Lt15+ Adult Literate Population (15+) in year t I
t15+ Adult Illiterate Population (15+) in year t
Pt15+ Adult Population (15+) in year t
LITt15+ + ILL
t15+ = 100%
Data required: Population and number of literates (or illiterates) aged 15 years and over.
Data source: Mainly national population census; household and/or labour force surveys.
Types of disaggregation: By gender, geographical location (region, urban/rural) and by the following five-year age
groups: 15-19; 20-24; 25-29; 30-34; 35-39; 40-44; 45-49; 50-54; 55-59; 60-64; 65 and above.
Interpretation: High literacy rate (or low illiteracy rate) suggests the existence of an effective primary education
system and/or literacy programmes that have enabled a large proportion of the population to acquired the ability of
using the written word (and making simple arithmetic calculations) in daily life and to continue learning. It is
common practice to present and analyse literacy rates together with the absolute number of adult illiterates as
improvements in literacy rates may sometimes be accompanied by increases in the illiterate population due to the
changing demographic structure.
Quality standards: The rate cannot exceed 100%. It will be useful to align measurements of literacy with the
standard international definition given above, and to administer literacy tests on a sample basis to verify and improve
the quality of literacy statistics.
Limitations: It has been observed that some countries apply definitions and criteria for literacy which are different
from the international standards defined above, or equate persons with no schooling to illiterates, or change
definitions between censuses. Practices for identifying literates and illiterates during actual census enumeration may
also vary, as well as errors in literacy self-declaration can affect the reliability of literacy statistics.

4
NUMBER OF ADULT ILLITERATES
Definition: The population aged 15 years and above who cannot both read and write with understanding a short
simple statement on their every day life.
Purpose: To identify the size and, if possible, the whereabouts and characteristics of the illiterate population aged 15
years and above who should be targeted for policies and efforts in expanding adult literacy programmes.
Calculation method: Either use data on the number of adult illiterates collected during population census or survey
or subtract the number of adult literates from the total population aged 15 years and above.
Data required: Population and number of illiterates aged 15 years and above.
Data sources: Population census, household surveys, fertility and labour force surveys.
Type of disaggregation: By gender, geographical location, (region, rural/urban areas) and by the following five-year
age groups : 15-19, 20-24, 25-29,...,60-64, 65 and above.
Interpretation: The higher the illiterate population of the country, the greater the need to expand primary education
and adult literacy programmes. When disaggregated by geographical locations, it can pinpoint the areas needing
most literacy efforts, and policies may be set to target such efforts at priority population groups of a particular gender
and age group(s).
Quality standards: It will be useful to align all measurements of literacy with the standard international definition
and to administer literacy tests on sample basis to verify and improve the quality of literacy statistics.
Limitations: Some countries apply definitions and criteria of literate (illiterate) which are different from the
international standards or equate persons with no schooling as illiterates. Practices for identifying literates and
illiterates during actual census enumeration may also vary, as well as errors in literacy self-declaration can also affect
the reliability of literacy statistics.

5
GROSS INTAKE RATIO (GIR) IN THE FIRST GRADE OF PRIMARY
Definition: Total number of new entrants in the first grade of primary education, regardless of age, expressed as a
percentage of the population at the official primary school-entrance age.
Purpose: To indicate the general level of access to primary education. It also indicates the capacity of the education
system to provide access to grade 1 for the official school-entrance age population.
Calculation method: Divide the number of new entrants in grade 1, irrespective of age, by the population of official
school-entrance age, and multiply the result by 100.
Formula:
100*
P
NGIR t
a
t
t=
Where:
GIRtGross Intake Ratio in school year t
NtNumber of new entrants in the first grade of primary education, in school year t
Pta Population of official primary school entrance-age a, in school year t
N.B.: When data on new entrants are not separately reported, they can be derived by subtracting the number of repeaters from enrolment in the
first grade.
Data required: New entrants in the first grade of primary education (or enrolment minus repeaters in the first grade);
population of the official primary school-entrance age.
Data source: School register, school survey or census for data on new entrants by age. Population census or
estimates for primary school-entrance age population.
Type of disaggregation: By gender and by geographical location (region, rural/urban).
Interpretation: A high GIR indicates a high degree of access to primary education. As this calculation includes all
new entrants to first grade (regardless of age), the ratio can exceed 100%, due to over-aged and under-aged children
entering primary school for the first time.
Quality standards: Data on population used in deriving this indicator should refer strictly to the official school-
entrance age. Care should be taken not to include repeaters in grade 1 in the calculation, since this will lead to an
inflated GIR.
Limitations: A high GIR may be the effect of a backlog of over-aged children who have not entered school when
they were at the official primary school-entrance age.

6
NET INTAKE RATE (NIR) IN THE FIRST GRADE OF PRIMARY
Definition: New entrants in the first grade of primary education who are of the official primary school-entrance age,
expressed as a percentage of the population of the same age.
Purpose: To precisely measure access to primary education by the eligible population of primary school-entrance
age.
Calculation method: Divide the number of children of official primary school-entrance age who enter the first grade
of primary education for the first time by the population of the same age, and multiply the result by 100.
Formula:
100*P
NNIR t
a
tat =
Where:
NIRtNet Intake Rate in school year t
Nta Number of children of official primary school-entrance age a who enter the first grade of primary education for the first time, in school
year t
Pta Population of official primary school-entrance age a, in school year t
Data required: New entrants in first grade of primary education by single years of age; population of official primary
school-entrance age.
Data source: School register, school survey or census for data on new entrants by age; population census or
estimates for school-entrance age population.
Type of disaggregation: By gender and by geographical location (region, rural/urban).
Interpretation: A high NIR indicates a high degree of access to primary education for the official primary school-
entrance age children. NIR of 100% is a necessary condition for the policy goal of universal primary education.
Quality standards: Data on both new entrants and population used in deriving this indicator should refer strictly to
the official school-entrance age. NIR in principle should not exceed 100%.
Limitations: This indicator can be distorted by an incorrect distinction between new entrants and repeaters in the first
grade. This can be the case especially for under-aged pupils who may repeat the first grade at the official entrance
age.

7
SCHOOL-LIFE EXPECTANCY (SLE)
Definition: The total number of years of schooling which a child of a certain age can expect to receive in the future,
assuming that the probability of his or her being enrolled in school at any particular age is equal to the current
enrolment ratio for that age.
Purpose: To show the overall level of development of an educational system in terms of the average number of years
of schooling that the education system offers to the eligible population, including those who never enter school.
Calculation method: For a child of a certain age a, the school life expectancy is calculated as the sum of the age
specific enrolment rates for the levels of education specified. The part of the enrolment that is not distributed by age
is divided by the school-age population for the level of education they are enrolled in, and multiplied by the duration
of that level of education. The result is then added to the sum of the age-specific enrolment rates.
Formula:
∑∑==
+=educationlevell
l
t
llevelofage
t
unknownn
ait
i
t
it
a
DPE
PE
SLE_
___ /
Where:
SLEta School life expectancy at an age a in year t
Eti Enrolment of the population of age i (for i = a, a+1,…, n) in school year t; n denotes the theoretical upper age-limit of schooling
tiP Population of age i in school year t. Age of level l denotes the total school age population of that level
lD Theoretical duration of level l
Data required: Enrolment by age and of age unknown at all levels of education; population by single years of age;
or, alternatively, the age-specific enrolment ratios for all levels of education.
Data source: School register, school survey or census for data on enrolment by age. Population censuses and
estimates for school-age population.
Type of disaggregation: By levels of education and by gender.
Interpretation: A relatively high SLE indicates greater probability for children to spend more years in education and
higher overall retention within the education system. It must be noted that the expected number of years does not
necessarily coincide with the expected number of grades of education completed, because of repetition. Since school
life expectancy is an average based on participation in different levels of education, the expected number of years of
schooling may be pulled down by the magnitude of children who never go to school. Those children who are in
school may benefit from many more years of education than the average.
Quality standards: Requires complete and reliable data on enrolment and population by single-years of age
corresponding to all levels of education for the entire duration of schooling, including tertiary education.
Limitations: Caution is required when making cross-country comparisons; neither the length of the school year nor
the quality of education is necessarily the same in each country. In addition, as this indicator does not directly take
into account the effects of repetition, it is not strictly comparable between countries with automatic promotion and
those allowing grade repetition. It should also be noted that, depending on countries, the enrolment data do not
account for many types of continuing education and training. For these reasons, this indicator should be interpreted in
the light of complementary indicators, particularly percentage of repeaters.

8
TRANSITION RATE (TR)
Definition: The number of pupils (or students) admitted to the first grade of a higher level of education in a given
year, expressed as a percentage of the number of pupils (or students) enrolled in the final grade of the lower level of
education in the previous year.
Purpose: To convey information on the degree of access or transition from one cycle or level of education to a higher
one. Viewed from the lower cycle or level of education, it is considered as an output indicator, viewed from the
higher educational cycle or level, it constitutes an indicator of access. It can also help in assessing the relative
selectivity of an education system, which can be due to pedagogical or financial requirements.
Calculation method: Divide the number of new entrants in the first grade of the specified higher cycle or level of
education by the number of pupils who were enrolled in the final grade of the preceding cycle or level of education in
the previous school year, and multiply by 100.
Formula:
100*E
RETR
tn,h
1t1,1h
1t1,1ht
1h,h
++
++
+
−=
Where:
t1h,hTR + Transition rate (from cycle or level of education h to h+1 in school year t)
1t1,1hE
++ Number of pupils enrolled in the first grade at level of education h+1 in school year t+1
1t1,1hR +
+ Number of pupils repeating the first grade at level of education h+1 in school year t+1
tn,hE Number of pupils enrolled in final grade n at level of education h in school year t
Data required: Enrolment in the final grade of a given cycle or level of education for year t and new entrants to (or
enrolment minus repeaters) the first grade of the higher cycle or level of education for year t+1.
Data source: School register, school survey or census.
Data disaggregation: By gender, level of education and geographical location (region, rural/urban).
Interpretation: High transition rates indicate a high level of access or transition from one level of education to the
next. They also reflect the intake capacity of the next level of education. Inversely, low transition rates can signal
problems in the bridging between two cycles or levels of education, due to either deficiencies in the examination
system, or inadequate admission capacity in the higher cycle or level of education, or both.
Quality standards: This indicator should be based on reliable data on new entrants (or on enrolment and repeaters),
especially in the first grade of the higher cycle or level of education.
Limitations: This indicator can be distorted by incorrect distinction between new entrants and repeaters, especially in
the first grade of the specified higher level of education. Students who interrupted their studies for one or more years
after having completed the lower level of education, together with the migrant students, could also affect the quality
of this indicator.

9
GROSS ENROLMENT RATIO (GER)
Definition: Total enrolment in a specific level of education, regardless of age, expressed as a percentage of the
eligible official school-age population corresponding to the same level of education in a given school year.
Purpose: To show the general level of participation in a given level of education. It indicates the capacity of the
education system to enrol students of a particular age group. It can also be a complementary indicator to net
enrolment rate (NER) by indicating the extent of over-aged and under-aged enrolment.
Calculation method: Divide the number of pupils (or students) enrolled in a given level of education regardless of
age by the population of the age group which officially corresponds to the given level of education, and multiply the
result by 100.
Formula:
100*P
Eta,h
tht
hGER =
Where:
GERth Gross Enrolment Ratio at level of education h in school year t
thE Enrolment at the level of education h in school year t
ta,hP Population in age group a which officially corresponds to the level of education h in school year t
Example: If the entrance age for primary education is 7 years with a duration of 6 years then a is (7-12) years.
Data required: Total enrolment for a given level of education. Population of the age group corresponding to the
specified level.
Data source: School register, school survey or census for data on enrolment by level of education. Population
censuses or estimates for school-age population normally obtained from the central statistical office.
Types of disaggregation: By gender, geographical location (region, urban/rural) and by level of education.
Interpretation: A high GER generally indicates a high degree of participation, whether the pupils belong to the
official age group or not. A GER value approaching or exceeding 100% indicates that a country is, in principle, able
to accommodate all of its school-age population, but it does not indicate the proportion already enrolled. The
achievement of a GER of 100% is therefore a necessary but not sufficient condition for enrolling all eligible children
in school. When the GER exceeds 90% for a particular level of education, the aggregate number of places for pupils
is approaching the number required for universal access of the official age group. However, this is a meaningful
interpretation only if one can expect the under-aged and over-aged enrolments to decline in the future to free places
for pupils from the expected age group.
Quality standards: GER at each level of education should be based on total enrolment in all types of schools and
education institutions, including public, private and all other institutions that provide organized educational
programmes.
Limitations: GER can exceed 100% due to the inclusion of over-aged and under-aged pupils/students because of
early or late entrants, and grade repetition. In this case, a rigorous interpretation of GER needs additional information
to assess the extent of repetition, late entrants, etc.

10
NET ENROLMENT RATE (NER)
Definition: Enrolment of the official age group for a given level of education expressed as a percentage of the
corresponding population.
Purpose: To show the extent of coverage in a given level of education of children and youths belonging to the
official age group corresponding to the given level of education.
Calculation method: Divide the number of pupils (or students) enrolled who are of the official age group for a given
level of education by the population for the same age group and multiply the result by 100.
Formula:
100*P
E
ta,h
ta,ht
hNER =
Where:
NERth Net Enrolment Rate at level of education h in school year t
ta,hE Enrolment of the population of age group a at level of education h in school year t
ta,hP Population in age group a which officially corresponds to level of education h in school year t
Example: If the entrance age for primary education is 7 years with a duration of 6 years then a is (7-12) years.
Data required: Enrolment by single years of age for a given level of education. Population of the age group
corresponding to the given level of education.
Data source: School register, school survey or census for data on enrolment by age; population censuses or estimates
for school-age population normally obtained from the central statistical office.
Types of disaggregation: By gender, geographical location (region, urban/rural) and by level of education.
Interpretation: A high NER denotes a high degree of coverage for the official school-age population. The
theoretical maximum value is 100%. Increasing trends can be considered as reflecting improving coverage at the
specified level of education. When the NER is compared with the GER, the difference between the two highlights the
incidence of under-aged and over-aged enrolment. If the NER is below 100%, then the complement, i.e. the
difference with 100%, provides a measure of the proportion of children not enrolled at the specified level of
education. However, since some of these children/youth could be enrolled at other levels of education, this difference
should in no way be considered as indicating the percentage of students not enrolled. To measure universal primary
education, for example, adjusted primary NER is calculated on the basis of the percentage of children in the official
primary school age range who are enrolled in either primary or secondary education. A more precise complementary
indicator is the age-specific enrolment ratio (ASER) which shows the participation in education of the population of
each particular age, regardless of the level of education.
Quality standards: NER at each level of education should be based on enrolment of the relevant age group in all
types of schools and education institutions, including public, private and all other institutions that provide organized
educational programmes.
Limitations: For tertiary education, this indicator is not pertinent because of the difficulties in determining an
appropriate age group due to the wide variations in the duration of programmes at this level of education. As regards
primary and secondary education, difficulties may arise when calculating an NER that approaches 100% if:
1. the reference date for entry to primary education does not coincide with the birth dates of all of the cohort
eligible to enrol at this level of education;
2. a significant portion of the population starts primary school earlier than the prescribed age and consequently
finishes earlier as well;

11
3. there is an increase in the entrance age to primary education but the duration remains unchanged.
N.B. Although the NER cannot exceed 100%, values up to 105% have been obtained reflecting inconsistencies in the
enrolment and/or population data.

12
AGE SPECIFIC ENROLMENT RATE (ASER)
Definition: Enrolment of a specific single age enrolled, irrespective of the level of education, as a percentage of the
population of the same age.
Purpose: To show the extent of the educational participation of a specific age cohort.
Calculation method: Divide the number of pupils (or students) of a specific age enrolled in educational institutions
at all levels of education by the population of the same age and multiply the result by 100.
Formula:
100*P
Eta
tat
aASER =
Where :
ASERta Age Specific Enrolment Rate of the population of age a in school year t
taE Enrolment of the population of age a in school year t
taP Population of age a in school year t
N.B. This method may also be used separately to calculate ASER by individual levels of education. The calculation is the same, the sole
difference being that the enrolment refers only to one level of education, for example primary education.
Data required: Enrolment by single years of age. Population of the corresponding age.
Data source: School register, school survey or census for data on enrolment by age. Population censuses or estimates
for single year school-age population normally obtained from the Central statistical office.
Types of disaggregation: By gender, geographical location (region, urban/rural) and by level of education.
Interpretation: A high ASER denotes a high degree of educational participation of the population of the particular
age. The theoretical maximum value is 100%. Increasing trends can be considered as reflecting improving
participation of the particular age.
If the ASER is below 100%, then the complement, i.e. the difference with 100% provides a measure of the proportion
of the population of the particular age who are not enrolled.
Quality standards: ASER at each level of education should be based on total enrolment in all types of schools and
education institutions, including public, private and all other institutions that provide organized educational
programmes. The enrolment and population data should refer to the same date. Further, it must be ensured that the
enrolment data covers all levels of education to avoid excluding some members of the age cohort.
Limitations: This indicator does not give an indication of the grade or the level of education in which pupils or
students are enrolled except when it is calculated by level of education.

13
REPETITION RATE BY GRADE (RR)
Definition: Proportion of pupils from a cohort enrolled in a given grade at a given school year who study in the same
grade in the following school year.
Purpose: To measure the rate at which pupils from a cohort repeat a grade, and its effect on the internal efficiency of
educational systems. In addition, it is one of the key indicators for analysing and projecting pupil flows from grade to
grade within the educational cycle.
Calculation method: Divide the number of repeaters in a given grade in school year t+1 by the number of pupils
from the same cohort enrolled in the same grade in the previous school year t.
Formula:
t
i
t
it
iE
RRR
1+
=
Where:
RRt
i Repetition Rate at grade i in school year t
1tiR +
Number of pupils repeating grade i, in school year t+1
tiE Number of pupils enrolled in grade i, in school year t
Data required: Enrolment by grade for school year t and number of repeaters from the same cohort by grade for year
t+1.
Data source: School register, school survey or census for data on enrolment and repeaters by grade.
Type of disaggregation: By grade, gender, geographical location (regions, urban/rural) and by type of institution
(public/private).
Interpretation: Repetition Rate ideally should approach zero percent. High repetition rate reveals problems in the
internal efficiency of the educational system and possibly reflect a poor level of instruction. When compared across
grades, the patterns can indicate specific grades for which there is higher repetition, hence requiring more in depth
study of causes and possible remedies.
Quality standard: Like other pupil-flow rates (promotion and dropout rates), repetition rate is derived by analysing
data on enrolment and repeaters by grade for two consecutive years. One should therefore ensure that such data are
consistent in terms of coverage over time and across grades. Special attention should also be paid to minimizing some
common errors which may bias these flow rates, such as: Over-reporting enrolment/repeaters (particularly in grade
one); incorrect distinction between new entrants and repeaters; transfers of pupils between grades and schools.
Limitations: In some cases, low repetition rates merely reflect policies or practices of automatic promotion. The
level and maximum number of grade repetitions allowed can in some cases be determined by the educational
authorities with the aim of coping with limited grade capacity and increasing the internal efficiency and flow of
pupils (or students). Care should be taken in interpreting this indicator, especially in comparisons between education
systems.

14
SURVIVAL RATE BY GRADE (SR)
Definition: Percentage of a cohort of pupils (or students) enrolled in the first grade of a given level or cycle of
education in a given school year who are expected to reach successive grades.
Purpose: To measure the retention capacity and internal efficiency of an education system. It illustrates the situation
regarding retention of pupils (or students) from grade to grade in schools, and conversely the magnitude of dropout
by grade.
Calculation method: Divide the total number of pupils belonging to a school-cohort who reached each successive
grade of the specified level of education by the number of pupils in the school-cohort i.e. those originally enrolled in
the first grade of primary education, and multiply the result by 100. The survival rate is calculated on the basis of the
reconstructed cohort method, which uses data on enrolment and repeaters for two consecutive years.
Formula:
100*E
PSR k
g
m
1t
ti,g
ki,g
∑== Where: REP
1t1i,g
1t1i,g
ti,g
++
++ −=
i grade (1, 2, 3,…,n)
t year (1, 2, 3, …,m)
g pupil-cohort
SRki,g Survival Rate of pupil-cohort g at grade i for a reference year k
kgE Total number of pupils belonging to a cohort g at a reference year k
ti,gP Promotees from
kgE who would join successive grades i throughout successive years t
Rti Number of pupils repeating grade i in school year t
Data required: Enrolment by grade for two consecutive years (years t and t+1); number of repeaters by grade for
year t+1.
Data source: School register, school survey or census.
Type of disaggregation: By gender, geographical location (region, urban/rural) and by type of institution
(private/public). Survival rates can also be disaggregated with or without grade repetition.
Interpretation: Rates approaching 100% indicate a high level of retention and low incidence of dropout. The
distinction between survival rate with and without repetition is necessary to compare the extent of wastage due to
dropout and repetition. Survival rate to the last grade of primary education is of particular interest for monitoring
universal primary education, a central objective for Education for All and the Millennium Development Goals.
Quality standards: Since the calculation of this indicator is based on pupil-flow rates, the reliability of the Survival
Rate depends on the consistency of data on enrolment and repeaters in term of coverage over time and across grades.
Limitations: Given that this indicator is usually estimated using cohort analysis models that are based on a number
of assumptions (i.e. the observed flow rates will remain unchanged throughout the cohort life), care should be taken
in using of the results in comparisons. Care should also be taken in calculating the indicator at sub-national level
because of possible pupils’ transfers between localities.

15
COEFFICIENT OF EFFICIENCY
Definition: The ideal (optimal) number of pupil-years required (i.e. in the absence of repetition and dropout) to
produce a number of graduates from a given school-cohort for a cycle or level of education expressed as a percentage
of the actual number of pupil-years spent to produce the same number of graduates. Input-output ratio, which is the
reciprocal of the coefficient of efficiency, is often used as an alternative. N.B. One school year spent in a grade by a
pupil is counted as one pupil-year.
Purpose: This is a synthetic indicator of the internal efficiency of an educational system. It summarises the
consequences of repetition and dropout on the efficiency of the educational process in producing graduates.
Calculation method: Divide the ideal number of pupil-years required to produce a number of graduates from a given
school-cohort for the specified level of education, by the actual number of pupil-years spent to produce the same
number of graduates, and multiply the result by 100. The coefficient of efficiency is calculated on the basis of the
reconstructed cohort method, which uses data on enrolment and repeaters for two consecutive years.
Formula:
100*
**
*
1
,,
,
+
=
∑∑
∑+
=
+
=
+
=
kn
j
jg
kn
nj
jg
kn
njjg
g
jDjG
nGCE For more details, see the flow diagram on cohort analysis.
Where:
CEg Coefficient of Efficiency for a pupil-cohort g
n,gG Number of pupils graduating from cohort g in final grade n after n years of study (without repetition)
j,gG Number of pupils graduating from cohort g in final grade n after j years of study
j,gD Number of pupils (of the cohort g) dropping out after j years of study
k Number of repetitions allowed
n Normal duration of study for a cycle or level of education
g Pupil-cohort
j Number of years of study.
Data required: Number of graduates and dropouts by length of study. These data can also be derived by using the
reconstructed cohort model, which requires enrolment by grade for two consecutive years (years t and t+1); number
of repeaters by grade for year t+1 and number of graduates for year t.
Data source: School register, school survey or census for data on repeaters and enrolment.
Type of disaggregation: By gender, geographical location (region, urban/rural) and by school type (private/public).
Interpretation: Results approaching 100% indicate a high overall level of internal efficiency in producing graduates
and no wastage due to repetition and dropout. Coefficients below 100% reflect the impact of repetition and dropout
on the efficiency of the educational process in producing graduates. As the reciprocal, the optimum input-output ratio
is one, and inefficiency arises from any point which is greater than one.
Quality standards: Since the calculation of this indicator is based on pupil-flow rates, its reliability depends on the
consistency of data on enrolment and repeaters in term of coverage over time and across grades. Differences in

16
national regulations concerning the number of repetitions allowed constitute an aspect to be taken into account when
using this indicator for cross-country comparisons.
Limitations: Given that this indicator is usually derived using cohort analysis models that are based on a number of
assumptions, and owing to the highly synthetic nature of this indicator, care should be taken in the use of the results
in comparing education systems. From a conceptual viewpoint, having most pupils (or students) graduating within the
prescribed duration of the cycle is optimal with regard to economic efficiency and resource utilization, but this does
not necessarily imply achievement of the expected learning outcomes. Also, according to this calculation method,
early dropouts (i.e. from lower grades) can result in higher internal efficiency than late dropout (i.e. from higher
grades); this means that efficiency from the economic point of view can be in contradiction with educational
objectives aiming at retaining pupils in schools until higher grades when they would have acquired the desired
knowledge and skills.

17
YEARS-INPUT PER GRADUATE
Definition: The estimated average number of pupil-years spent by pupils (or students) from a given cohort who
graduate from a given cycle or level of education, taking into account the pupil-years wasted due to dropout and
repetition. N.B. One school year spent in a grade by a pupil is equal to one pupil-year.
Purpose: To assess the extent of educational internal efficiency in terms of the estimated average number of years to
be invested in producing a graduate.
Calculation method: Divide the total number of pupil-years spent by a pupil-cohort (graduates plus dropouts) in the
specified level of education by the sum of the successive batch of graduates belonging to the same cohort. This
indicator is calculated on the basis of the reconstructed cohort method, which uses data on enrolment and repeaters
for two consecutive years.
Formula:
∑
∑∑
+
=
+
=
+
=
+
=kn
njj,g
kn
1jj,g
kn
njj,g
g
GYIG
j*Dj*G
For more details, see the flow diagram on cohort analysis
Where:
YIGg Years input per graduate (for graduates belonging to cohort g)
G jg , Graduates from cohort g after j years of study
j,gD Dropouts from cohort g after j years of study
k Number of repetitions allowed
n Normal duration of study for a cycle or level of education
g Pupil-cohort
j Number of years of study.
Data required: Total number of pupil-years spent by the pupil-cohort and the total number of graduates from the
same cohort. These data can be derived using cohort reconstructed model, which requires enrolment by grade for two
consecutive years (years t and t+1); number of repeaters by grade for year t+1 and number of graduates for year t.
Data source: School register, school survey, census or records.
Type of disaggregation: By gender, geographical location (region, urban/rural) and by type of institution
(private/public).
Interpretation: The closer the value of this indicator is to the theoretical number of grades (or duration) of the
specified education cycle, the higher the internal efficiency and the lesser the negative effects of repetition and
dropout. A high number of pupil-years per graduate as compared to the normal duration, denotes waste of resources
and hence inefficiency.
Quality standards: Since the calculation of this indicator is based on pupil-flow rates, its reliability depends on the
consistency of data on enrolment and repeaters in terms of coverage over time and across grades. Differences in
national regulations concerning the number of repetitions allowed constitute an aspect to be taken into account when
using this indicator for cross-country comparisons.
Limitations: From a conceptual viewpoint, having most pupils (or students) graduating within the prescribed
duration of the cycle is optimal with regard to economic efficiency and resource utilization, but this does not

18
necessarily imply achievement of the expected learning outcomes. Also, according to this calculation method, early
dropouts (i.e. from lower grades) can result in higher internal efficiency than late dropout (i.e. from higher grades);
this means that efficiency from the economic point of view can be in contradiction with educational objectives aiming
to retain pupils in schools until higher grades when they would have acquired the desired knowledge and skills.

19
PERCENTAGE OF REPEATERS
Definition: Total number of pupils who are enrolled in the same grade as in a previous year, expressed as a
percentage of the total enrolment to the specified grade.
Purpose: To measure the extent and patterns of repetition by grade, as part of the internal efficiency of education
system.
Calculation method: Divide the number of pupils/students repeating a given grade in a given school year by the
number of pupils or students enrolled in the same grade in the same school year and multiply by 100. It can be
calculated for the whole level of education by dividing the sum of repeaters in all grades of the given level by the
total enrolment of that level of education and multiply the result by100.
Formula:
100*Eti
R ti
PR ti=
Where :
PR ti Percentage of repeaters in grade i, in school year t
R ti Number of pupils repeating grade i in school year t
Eti Number of pupils enrolled in grade i, in school year t
Data required: Number of repeaters and enrolment by grade for the same school year.
Data source: School register, school census or surveys for data on repeaters and enrolment by grade.
Types of disaggregation: By gender, geographical location (region, rural/urban areas) and level of education.
Interpretation: High values reflect serious problems of grade repetition or the internal efficiency of the education
system.
Quality standards: The definition of repeaters should be unambiguously applied to include even pupils or students
repeating more than once in the same grade and those who repeat the same grade while transferring from one school
to another. Pupils or students who were not studying in the same grade in the previous year should be excluded.
Limitations: The level and maximum number of grade repetitions allowed can in some cases be determined by the
educational authorities with the aim of coping with limited grade capacity and increasing the internal efficiency and
flow of pupils (or students). Care should be taken in interpreting this indicator, especially in comparisons between
education systems.

20
PUBLIC EXPENDITURE ON EDUCATION AS % OF GROSS NATIONAL INCOME
Definition: Total public expenditure on education (current and capital) expressed as a percentage of the Gross
National Income (GNI) in a given financial year. GNI is also referred to as Gross National Product (GNP).
Purpose: This indicator shows the proportion of a country’s wealth generated during a given financial year that has
been spent by government authorities on education. The indicator can be also calculated based on Gross Domestic
product (GDP)
Calculation method: Divide total public expenditure on education in a given financial year by the GNI of the
country for the corresponding year and multiply by 100.
Formula:
100*%GNI
PXEXGNI
t
tt =
Where :
XGNI t% Percentage public expenditure on education in financial year t
PXEt Total Public expenditure on Education in financial year t
GNI t Gross National Income in financial year t
Data required: Total public expenditure on education and the Gross National Income for a given financial year.
Data sources: Annual financial reports by central or federal governments, state or provincial or regional
administrations. Data on GNI are normally available from National accounts reports from the Bureau of Statistics.
Type of disaggregation: This indicator is normally calculated at the national level only.
Interpretation: In principle a high percentage of GNI devoted to public expenditure on education denotes a high
level of attention given to investment in education by the government; and vice versa.
Quality standards: Total public expenditure on education should include those incurred by all concerned ministries
and levels of administration. Total public expenditure on education refers to all expenditure on education by the
central or federal government, state governments, provincial or regional administrations and expenditure by
municipal and other local authorities. Central government includes ministerial departments, agencies and autonomous
institutions which have education responsibilities. The statistics on expenditure should cover transactions made by all
departments or services with education responsibility at all decision-making levels. Public expenditure on education
as a percentage of GNI cannot exceed or even approach 100%.
Limitations: In some instances data on total public expenditure on education refers only to the Ministry of education,
excluding other ministries that spend a part of their budget on educational activities.

21
PUBLIC EXPENDITURE ON EDUCATION AS % OF TOTAL GOVERNMENT EXPENDITURE
Definition: Total public expenditure on education (current and capital) expressed as a percentage of total government
expenditure in a given financial year.
Purpose: To assess a government's policy emphasis on education relative to the perceived value of other public
investments. It reflects also the commitment of a government to invest in human capital development.
Calculation method: Divide total public expenditure on education incurred by all government agencies/departments
in a given financial year by the total government expenditure for the same financial year and multiply by 100.
Formula:
100*TPX
PXEPXE%
t
tt =
Where :
PXE% t Public expenditure on education as a percentage of total government expenditure in financial year t
PXEt Total public expenditure on education in financial year t
TPX t Total government expenditure in financial year t
Data required: Total public expenditure on education; and total government expenditure.
Data sources: Annual financial reports prepared by the ministry of finance; national accounts reports by the central
statistical office and financial reports from the various government departments engaged in education activities
especially the ministry of education.
Data disaggregation: By level of administration, geographical location (region, urban/rural), and by purpose of
expenditure (emoluments, teaching material, etc.).
Interpretation: A higher percentage of government expenditure on education shows a high government policy
priority for education relative to the perceived value of other public investments, including defence and security,
health care, social security for unemployment and elderly, and other social or economic sectors.
Quality standards: Total public expenditure on education should include those incurred by all concerned ministries
and levels of administration. This indicator can never be 100% since the latter includes expenditure on many
economic and social sectors, besides education. The fact that the fiscal year and educational year budget periods may
be different should also be taken into consideration.
Limitations: In some instances data on total public expenditure on education refers only to the ministry of education,
excluding other ministries that spend a part of their budget on educational activities.

22
PERCENTAGE DISTRIBUTION OF PUBLIC CURRENT EXPENDITURE ON EDUCATION BY LEVEL
Definition: Public current expenditure for each level of education, expressed as a percentage of total public current
expenditure on education.
Purpose: To show how financial resources for education have been distributed across the different levels or stages of
education. It measures the relative emphasis of government spending on a particular level of education within the
overall educational expenditure.
Calculation method: Divide public current expenditure devoted to each level of education by the total public current
expenditure on education, and multiply the result by 100.
Formula:
100*PCXE
PCXE% n
1h
th
tht
h
PCXE∑=
=
Where :
PCXE%th Percentage public current expenditures on level of education h in financial year t
PCXEth Total public current expenditures on level of education h in financial year t
Data required: Total public current expenditure on education; current public expenditures by level of education.
Data source: Annual financial reports prepared by the ministry of finance; national accounts reports by the central
statistical office and financial reports from the various government departments engaged in educational activities
especially the ministry of education.
Type of disaggregation: By level of administration, geographical location (region, urban/rural) and by various
purposes of current expenditures (emoluments, teaching materials, scholarships, welfare services, etc.).
Interpretation: Relatively high percentage of current expenditures devoted to a specific level of education denotes
the priority given to that level in national educational policy and resource allocation. When interpreting this indicator,
one may also take into account the corresponding distribution of enrolment by level and then assess the relative
current expenditure per student.
Quality standards: This indicator should be based on consistent data on current expenditure for each level of
education that cover public funding for both public and private educational institutions at all levels of the educational
administration. The sum of the percentage distributions for all levels of education should add up to 100%.
Limitations: In some instances data on current public expenditure on education refers only to the ministry of
education, excluding other ministries that spend a part of their budget on educational activities.

23
PUBLIC CURRENT EXPENDITURE PER PUPIL (STUDENT) AS % OF GROSS NATIONAL INCOME
(GNI) PER CAPITA
Definition: Public current expenditure per pupil (or student) at each level of education, expressed as a percentage of
GNI per capita in a given financial year.
Purpose: To measure the share of per capita income spent on each pupil or student. It helps in assessing a country’s
level of investment in human capital development. When calculated by level of education, it also indicates the
relative costs and emphasis placed by the country on a particular level of education. The indicator can be also
calculated based on gross domestic product (GDP).
Calculation method: Divide per pupil public current expenditure on each level of education in a given year by the
GNI per capita for the same year and multiply by 100.
Formula:
100*/% ,
P
GNIt
t
th
tht
GNIch
E
PCXEPCXE =
Where,
%PCXEtGNIch, Public current expenditure per pupil of education level h as percentage of GNI per capita in
financial year t
PCXEth Public current expenditure on education level h in financial year t
GNIt Gross National Product in financial year t
thE Total enrolment in education level h in school year t
Pt Total national population in year t
Data required: Public current expenditure by level of education; the number pupils enrolled in each level of
education; GNI; population.
Data sources: Annual financial reports prepared by the ministry of finance; national accounts reports by the central
statistical office; Financial reports from various government departments engaged in educational activities especially
the ministry of education; school register, school survey or census for data on enrolment; population census.
Data disaggregation: By level of education.
Interpretation: A high percentage figure for this indicator denotes a high share of per capita income being spent on
each pupil/student in a specified level of education. It represents a measure of the financial cost per pupil/student in
relation to average per capita income. A high level of spending per pupil should be interpreted with caution because
this could simply reflect low enrolment. This indicator should therefore be used in conjunction with enrolment ratios.
Low expenditure per pupil and low enrolment in primary education when compared to high expenditure and/or low
enrolment in tertiary education suggests a need to reconsider resource allocations within the education sector,
especially if universal primary education is a priority.
Quality standards: This indicator can exceed 100% in countries where GNI per capita is low and the current cost
per pupil is high. This indicator should be based on consistent data on public expenditure that covers all subsidies to
both public and private educational institutions. The use of this indicator must take into account the degree of
coverage represented by the educational expenditure figure and the ability of the GNI estimate to accurately represent
the level of national economic capacity.

24
Limitations: This indicator may be distorted by inaccurate estimation of GNI, current population or enrolment by
level of education. The fact that fiscal year and educational year budget periods may be different should also be taken
into consideration.
25
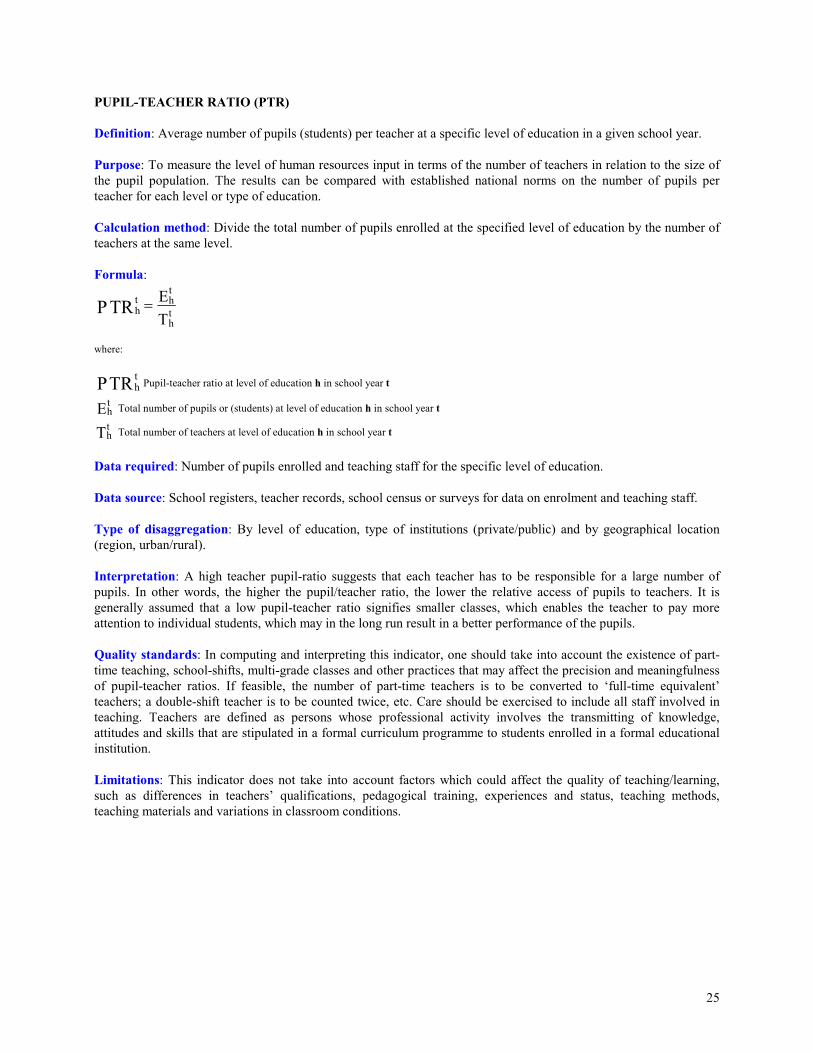
PUPIL-TEACHER RATIO (PTR)
Definition: Average number of pupils (students) per teacher at a specific level of education in a given school year.
Purpose: To measure the level of human resources input in terms of the number of teachers in relation to the size of
the pupil population. The results can be compared with established national norms on the number of pupils per
teacher for each level or type of education.
Calculation method: Divide the total number of pupils enrolled at the specified level of education by the number of
teachers at the same level.
Formula:
T
Eth
tht
hTRP =
where:
TRPth Pupil-teacher ratio at level of education h in school year t
Eth Total number of pupils or (students) at level of education h in school year t
Tth Total number of teachers at level of education h in school year t
Data required: Number of pupils enrolled and teaching staff for the specific level of education.
Data source: School registers, teacher records, school census or surveys for data on enrolment and teaching staff.
Type of disaggregation: By level of education, type of institutions (private/public) and by geographical location
(region, urban/rural).
Interpretation: A high teacher pupil-ratio suggests that each teacher has to be responsible for a large number of
pupils. In other words, the higher the pupil/teacher ratio, the lower the relative access of pupils to teachers. It is
generally assumed that a low pupil-teacher ratio signifies smaller classes, which enables the teacher to pay more
attention to individual students, which may in the long run result in a better performance of the pupils.
Quality standards: In computing and interpreting this indicator, one should take into account the existence of part-
time teaching, school-shifts, multi-grade classes and other practices that may affect the precision and meaningfulness
of pupil-teacher ratios. If feasible, the number of part-time teachers is to be converted to ‘full-time equivalent’
teachers; a double-shift teacher is to be counted twice, etc. Care should be exercised to include all staff involved in
teaching. Teachers are defined as persons whose professional activity involves the transmitting of knowledge,
attitudes and skills that are stipulated in a formal curriculum programme to students enrolled in a formal educational
institution.
Limitations: This indicator does not take into account factors which could affect the quality of teaching/learning,
such as differences in teachers’ qualifications, pedagogical training, experiences and status, teaching methods,
teaching materials and variations in classroom conditions.

26
PERCENTAGE OF FEMALE TEACHERS
Definition: The number of female teachers at a given level of education expressed as a percentage of the total number
of teachers (male and female) at the same level in a given school year.
Purpose: To show the gender composition of the teaching force. It helps also in assessing the need for opportunities
and/or incentives to encourage women to participate in teaching activities at a given level of education.
Calculation method: Divide the total number of female teachers at a given level of education by the total number of
teachers (male and female) at the same level in a given school year, and multiply by 100.
Formula:
100*T
FTFT% t
h
tht
h =
Where:
FT%th Percentage female teachers in educational level h in year t
FTth Number of female teachers in educational level h in year t
Tth Total number of teachers (male and female) in educational level h in year t
Data required: Number of teachers by gender.
Data source: School census or surveys and teachers’ records.
Type of disaggregation: By level of education, geographical location (region, rural/urban), by type of institutions
(public and private), by teacher age groups and teacher qualifications.
Interpretation: Percentage of female teachers approaching 50% indicates gender parity in the composition of the
teaching force. A value of greater than 50% reveals more opportunities and/or preference for women to participate in
teaching activities at a specific level, grade or programme of education.
Quality standards: This indicator should be based on reliable data on teaching staff by gender (full and/or part-time
teachers) at each level of education. When calculating this indicator, care should be exercised to ensure that the
number of female teachers and the total number of teachers correspond to the same type of institution, full or part-
time. Such calculation should include all staff involved in teaching. Teachers are defined as persons whose
professional activity involves the transmitting of knowledge, attitudes and skills that are stipulated in a formal
curriculum programme to students enrolled in a formal educational institution.
Limitations: This indicator measures the level of gender representation in the teaching profession rather than the
effectiveness and quality of teaching.

27
PERCENTAGE DISTRIBUTION OF STUDENTS IN TERTIARY EDUCATION BY ISCED LEVEL
Definition: Enrolment in tertiary education at each ISCED level as a percentage of total enrolment in tertiary
education.
Purpose: To show the distribution of tertiary students by ISCED levels. It also helps to understand the way in which
degrees and qualification structures for tertiary education are organized within countries.
Calculation method: Divide the number of students in each tertiary ISCED level by the total enrolment in tertiary
education in a given academic year, and multiply the result by 100.
Formula:
100*
)6,5,5(
%∑
∈
=
BAh
t
h
t
ht
h
E
EE
Where:
E%th Percentage of tertiary students in ISCED level h in academic year t
Eth Enrolment in tertiary ISCED level h in academic year t
Data required: Enrolment in tertiary education by ISCED level.
Data source: Censuses, surveys or records of tertiary educational institutions and programmes.
Type of disaggregation: By gender and mode of enrolment (part/full-time students, distance learning).
Interpretation: The relative concentration of students in particular programmes (long/short programmes) or levels is
likely to be driven by job opportunities related to those levels. It also reflects capacities and policies for the
development of a particular ISCED level.
Quality standards: This indicator requires complete and reliable data on enrolment in tertiary education and
consistency in definitions of different levels and programmes according to ISCED. The percentage in all levels of
tertiary education must equal 100.
Limitations: Caution is required when using this indicator for cross-country comparison and over time, since tertiary
education programmes can vary widely in duration, intensity and degree of theoretical and applied content, and their
correspondence to ISCED may be subject to change.

28
PERCENTAGE OF FEMALE STUDENTS IN EACH ISCED LEVEL OF TERTIARY EDUCATION
Definition: Female enrolment in each ISCED tertiary education level as a percentage of total enrolment (male plus
female) in the same ISCED level.
Purpose: To assess gender disparity with regard to participation in different levels of tertiary education.
Calculation method: Divide the number of female tertiary students enrolled in a specified ISCED level by the total
number of students (male plus female) in that level in a given academic-year, and multiply the result by 100.
Formula:
100*E
FEFE% t
h
tht
h =
Where:
FE%th Percentage of female students in ISCED tertiary education level h in academic year t
FEth Female students in ISCED tertiary education level h in academic year t
Eth Total enrolment (male plus female) in ISCED tertiary education level h in academic year t
Data required: Enrolment in tertiary education by ISCED level and by gender.
Data source: Census, surveys or records of tertiary educational institutions and programmes.
Type of disaggregation: By field of education and mode of enrolment (part/full-time students, distance learning).
Interpretation: A figure approaching 50% indicates a good level of gender parity. It is also useful to compare the
percentages of female students for different levels and fields of education. When disaggregated by field of education,
this indicator can identify those fields more or less attractive for a specified gender.
Quality standards: This indicator requires complete and reliable data on enrolment by gender in tertiary education
and consistency in definitions of different levels and programmes according to ISCED.
Limitations: Caution is required when using this indicator for cross-country comparison and over time, since tertiary
education programmes vary widely in duration, intensity and degree of theoretical and applied content and their
correspondence to ISCED may be subject to change.

29
PERCENTAGE DISTRIBUTION OF STUDENTS IN TERTIARY EDUCATION BY ISCED FIELDS OF
EDUCATION.
Definition: Enrolment in each ISCED field of education at the tertiary level, expressed as a percentage of the total
enrolment in tertiary education.
Purpose: To gauge the level of development of tertiary education in terms of the range of fields offered, the capacity
in each field as well as student preferences, thus reflecting both the potential demand and supply of qualified human
resources in different specializations.
Calculation method: Divide the number of students enrolled in each field of education by total enrolment in tertiary
education in a specific academic-year and multiply the result by 100.
Formula:
100*n
1f
tf
tft
f
E
EE%
∑=
=
Where:
E%tf Percentage of students enrolled in field of education f in academic-year t
Etf Number of students enrolled in field of education f in academic-year t
n Number of fields of education
Data required: Enrolment in tertiary education by field of education.
Data source: Censuses, surveys or records of tertiary educational institutions and programmes.
Type of disaggregation: By gender, ISCED level in tertiary education and by mode of enrolment (part/full-time).
Interpretation: Relative concentration of students in particular fields of education depicts on the one hand high
preference and capacity, and on the other hand may reflect job opportunities as well as relative earnings across
different occupations and industries.
Quality standards: This indicator requires complete and reliable data on enrolment by fields of education at the
tertiary level and clear distinction between different educational fields. The sum of percentages for all fields of
tertiary education should equal 100.
Limitations: Cross-country comparisons rely heavily on how far countries have used consistent field definitions.
Detailed or aggregated information may not be fully comparable at the international level due to exclusions, double
counting of students, partial data, etc. Also, differences in duration, intensity and degree of theoretical and applied
content, together with inappropriate correspondence with ISCED, can bias comparisons between countries.

30
PERCENTAGE DISTRIBUTION OF GRADUATES BY ISCED FIELDS OF EDUCATION AT THE
TERTIARY LEVEL
Definition: The number of graduates from each ISCED field of education in tertiary education, expressed as a
percentage of the total number of graduates in tertiary education.
Purpose: To show the distribution of tertiary graduates over different fields of education. It also reflects the
development of tertiary education in terms of the range of fields offered as well as the supply of qualified human
resources in different specializations.
Calculation method: Divide the number of graduates in each field of education by the total number of graduates in
tertiary education in a given academic-year, and multiply the result by 100.
Formula:
100*n
1f
tf
tft
f
G
GG%
∑=
=
Where:
G%tf Percentage of students graduating from the field of education f in academic-year t
Gtf Number of students graduating from the field of education f in academic-year t
n Number of fields of education
Data required: Graduates in tertiary education by field of education.
Data source: Census, surveys or records of tertiary educational institutions and programmes.
Type of disaggregation: By gender and ISCED levels of tertiary education.
Interpretation: Relative concentration of graduates in particular fields of education depicts high preference and
capacity in these programmes as well as related job opportunities.
Quality standards: This indicator requires complete and reliable data on the number of graduates by field of
education in tertiary level and clear distinction between different fields of education. The percentage in all fields of
tertiary education must sum up to 100.
Limitations: Cross-country comparisons rely heavily on how far countries have used consistent field definitions.
Detailed or aggregated information may not be fully comparable at the international level due to exclusions, double
counting of students, partial data, etc. Also, differences in duration, intensity and degree of theoretical and applied
content can bias comparisons between countries.

31
PERCENTAGE OF PRIVATE ENROLMENT
Definition: Enrolment in private educational institutions at a given level of education expressed as a percentage of
total enrolment at the same level.
Purpose: To measure the relative weight of private education in terms of enrolment, hence the scale and capacity of
private education within a country.
Calculation method: Divide the number of pupils (or students) enrolled in private educational institutions in a given
level of education by total enrolment (public and private) at the same level of education, and multiply the result by
100.
Formula:
100*E
EpEp%
th
t
ht
h=
where
Ep%t
h Percentage of pupils enrolled in private institutions at level of education h in school year t
Ept
h Number of pupils enrolled in private institutions at level of education h in school year t
Eth Total number of pupils enrolled in all types of institutions at level of education h in school year t
Data required: Enrolment by level of education and by type of institution (public/private).
Data source: Schools census or surveys.
Type of disaggregation: By gender, geographical location (region, urban/rural) and by level of education.
Interpretation: A high percentage indicates strong involvement of the non-governmental sector (including religious
bodies, other organizations, associations, communities, private enterprises or persons) in providing organized
educational programmes.
Quality standards: This indicator should be based on complete and reliable data on enrolment in each of the
different types of educational institutions, applying consistent definitions and criteria to distinguish between public
and private educational institutions. 'Private' refers to all educational institutions not operated by a public authority,
regardless of whether they receive financial support from such authorities.
Limitations: In countries where private institutions are substantially subsidized or aided by the government, the
distinction between private and public educational institutions may be less clear-cut especially when certain pupils (or
students) are directly financed through government scholarships. The fact that some religious or private schools are
not registered with the government nor follow the common national curriculum may also result in them not being
included in official statistics, hence preventing a realistic assessment of the share of enrolment in private education.
32
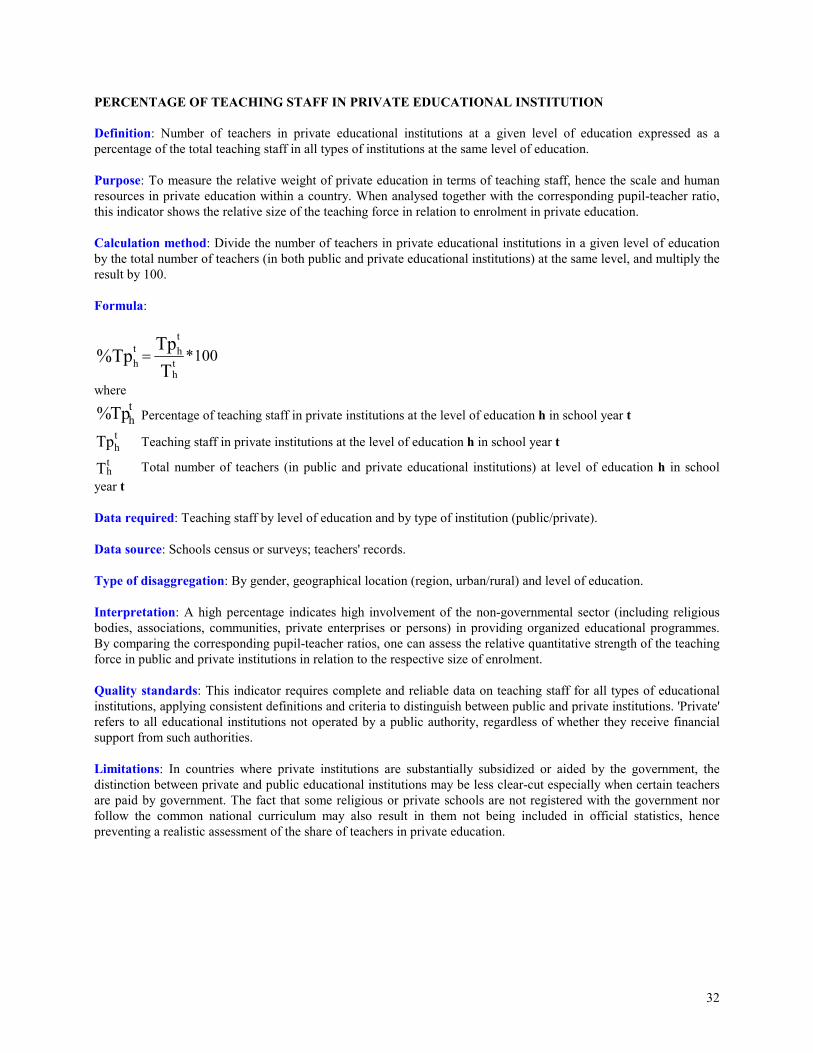
PERCENTAGE OF TEACHING STAFF IN PRIVATE EDUCATIONAL INSTITUTION
Definition: Number of teachers in private educational institutions at a given level of education expressed as a
percentage of the total teaching staff in all types of institutions at the same level of education.
Purpose: To measure the relative weight of private education in terms of teaching staff, hence the scale and human
resources in private education within a country. When analysed together with the corresponding pupil-teacher ratio,
this indicator shows the relative size of the teaching force in relation to enrolment in private education.
Calculation method: Divide the number of teachers in private educational institutions in a given level of education
by the total number of teachers (in both public and private educational institutions) at the same level, and multiply the
result by 100.
Formula:
100*T
TpTp%
th
t
ht
h=
where
Tp%t
h Percentage of teaching staff in private institutions at the level of education h in school year t
Tpt
h Teaching staff in private institutions at the level of education h in school year t
Tth Total number of teachers (in public and private educational institutions) at level of education h in school
year t
Data required: Teaching staff by level of education and by type of institution (public/private).
Data source: Schools census or surveys; teachers' records.
Type of disaggregation: By gender, geographical location (region, urban/rural) and level of education.
Interpretation: A high percentage indicates high involvement of the non-governmental sector (including religious
bodies, associations, communities, private enterprises or persons) in providing organized educational programmes.
By comparing the corresponding pupil-teacher ratios, one can assess the relative quantitative strength of the teaching
force in public and private institutions in relation to the respective size of enrolment.
Quality standards: This indicator requires complete and reliable data on teaching staff for all types of educational
institutions, applying consistent definitions and criteria to distinguish between public and private institutions. 'Private'
refers to all educational institutions not operated by a public authority, regardless of whether they receive financial
support from such authorities.
Limitations: In countries where private institutions are substantially subsidized or aided by the government, the
distinction between private and public educational institutions may be less clear-cut especially when certain teachers
are paid by government. The fact that some religious or private schools are not registered with the government nor
follow the common national curriculum may also result in them not being included in official statistics, hence
preventing a realistic assessment of the share of teachers in private education.

33
EDUCATIONAL ATTAINMENT OF THE POPULATION AGED 25 YEARS AND ABOVE
Definition: Percentage distribution of population aged 25 years and above according to the highest level of education
attained or completed with reference to ISCED.
Purpose: To show the educational composition of the population aged 25 years and above, hence the stock and
quality of human capital within a country, so as to gauge needs and establish policies for upgrading it. This indicator
also reflects the structure and performance of the education system and its accumulated impact on human capital
formation.
Calculation method: Divide the number of persons aged 25 years and above with respect to the highest level of
education attained by the total population of the same age group and multiply the result by 100.
Formula:
100*P
PP% t
25
th,25t
h,25
+
++ =
where
P%t
h,25+ Percentage of the population aged 25 years and above that attained educational level h, in year t
Pt
h,25+ Population aged 25 years and above that attained educational level h, in year t
Pt25+ Total population aged 25 years and above in year t
Data required: Population aged 25 years and above by highest level of education attained.
Data source: Mainly national population census; household and/or labour force surveys.
Type of disaggregation: By gender, by geographical location (region, urban/rural), by age group, and by
professional sector.
Interpretation: A relative high concentration of the adult population in a given level of education reflects the
capacity of the educational system in the corresponding level of education. Educational attainment is closely related
to the skills and competencies of a country's population, and could be seen as a proxy of both the quantitative and
qualitative aspects of the stock of human capital.
Quality standards: This indicator should be based on complete and reliable census or survey data, applying clear
classification of levels of education in accordance with ISCED.
Limitations: Caution is required when using this indicator for cross-country comparison, since the countries do not
always classify degrees and qualifications at the same ISCED levels, even if they are received at roughly the same age
or after a similar number of years of schooling. Also, certain educational programmes and study courses cannot be
easily classified according to ISCED. This indicator only measures educational attainment in terms of level of
education attained, i.e. years of schooling, and do not necessarily reveal the quality of the education (learning
achievement and other impacts).

34
NUMBER OF STUDENTS IN TERTIARY EDUCATION PER 100,000 INHABITANTS
Definition: Number of students enrolled in tertiary education in a given academic-year per 100,000 inhabitants.
Purpose: This indicator shows the general level of participation in tertiary education by indicating the proportion (or
density) of students within a country’s population.
Calculation method: Divide the total number of students enrolled in tertiary education in a given academic-year by
the country’s population and multiply the result by 100,000.
Formula:
000,100*)6,5,5(
000,100
P
ES t
BAh
t
ht
∑∈=
where
St
000,100 Number of students in tertiary education per 100,000 inhabitants in year t
Eth Number of student enrolled in ISCED level h in tertiary education in year t
Pt Country’s population in year t
Data required: Enrolment in tertiary education and total population.
Data source: Censuses, surveys or records of tertiary educational institutions and programmes, and population
census.
Type of disaggregation: By gender and by region.
Interpretation: A high number of students per 100,000 inhabitants indicates a generally high level of participation in
tertiary education in relation to a country's population.
Quality standards: This indicator should be based on complete and reliable data on students in all levels and types
of tertiary education. In principle, it should refer to all students within a country's territory, irrespective of nationality
or origin, and it should not take into account nationals studying in another country nor those enrolled in branches of
national tertiary education in another country.
Limitations: As this indicator takes into account the entire population in a country instead of the age group
corresponding to tertiary education, its comparability may be affected by the relative weight of this latter within the
entire population. When data are available for students and/or population by age, more precise assessment of
participation in tertiary education can be made by using the age specific and/or gross enrolment ratios. (ASER,
GER).

35
PERCENTAGE DISTRIBUTION OF ENROLMENT IN SECONDARY EDUCATION BY ORIENTATION
OF EDUCATION PROGRAMME
Definition: Percentage distribution of students enrolled in secondary education, according to the orientation of the
education programme, i.e. general and vocational/technical education, including teacher training.
Purpose: To reflect the orientation and capacity of secondary education programmes as well as the potential supply
of skilled workers in different specializations.
Calculation method: Divide the number of students enrolled in each type of secondary education programme
(classified by orientation) by total enrolment in secondary education in a given year, and multiply the result by 100.
Formula:
100*n
1s
ts
tst
s
E
EE%
∑=
=
Where:
E%ts Percentage of students enrolled in orientation s of secondary education in school year t
Ets Number of students enrolled in orientation s of secondary education in school year t
n Number of orientations of secondary education
Data required: Enrolment in secondary education by orientation of education.
Data source: Census, surveys or records of secondary educational institutions and programmes.
Type of disaggregation: By gender, type of institution (public/private), and geographical location (region,
urban/rural).
Interpretation: The relative concentration of students in a particular orientation of education depicts on the one hand
high preference and capacity, on the other hand may reflect job opportunities as well as relative earnings across
different occupations and industries.
Quality standards: This indicator requires complete and reliable data on enrolment by orientation of secondary
education and clear distinction between different orientations of education. The percentage in all orientations of
education must sum up to 100.
Limitations: Cross-country comparability of this indicator can be affected by different ways in which national
secondary education systems are organized according to different orientations (e.g. general, technical-vocational,
etc.).

36
PUBLIC CURRENT EXPENDITURE ON EDUCATION AS % OF TOTAL PUBLIC EXPENDITURE ON
EDUCATION
Definition: Public current expenditure on education expressed as a percentage of total public expenditure on
education (current and capital) in a given financial year.
Purpose: To show the share of current expenditure within total public expenditure, thereby indicating the pattern of
government spending on education in terms of the relative weight between current and capital expenditure.
Calculation method: Divide public current expenditure on education in a given financial year by the total public
expenditure on education for the same financial year and multiply the result by 100.
Formula:
100*TPXE
PCXEPCXE%
t
tt =
Where :
PCXE% t Percentage public current expenditure on education in financial year t
PCXEt Total public current expenditure on education in financial year t
TPXEt Total public expenditure on education in financial year t
Data required: Total public current expenditure on education and total public expenditure on education (current plus
capital).
Data sources: Annual financial reports prepared by the ministry of finance; national accounts reports by the central
statistical office and financial reports from the various government departments engaged in education activities
especially the ministry of education.
Data disaggregation: This indicator is usually calculated at the national level only. It can be disaggregated by level
of administration (central, regional, local government).
Interpretation: A high percentage reflects the need to devote a large share of public funding to maintain operations
of the education system as well as current and projected changes in enrolment, salary levels of personnel and other
operational costs. The difference between this percentage and 100 reflects the proportion of public expenditure on
education devoted to capital expenditure.
Quality standards: This indicator should be based on consistent and comprehensive data on all public current
expenditure on education, including those incurred by regional and local government, and other ministries than the
ministry of education.
Limitations: In many instances data on total public current expenditure on education cover only the ministry of
education, excluding other ministries that spend a sizeable part of their budget on educational activities.

37
PERSONNEL COMPENSATION AS % OF PUBLIC CURRENT EXPENDITURE ON EDUCATION.
Definition: Public expenditure devoted to personnel compensation expressed as a percentage of total public current
expenditure on education.
Purpose: To measure the share of personnel compensation within public current expenditure on education, in relation
to spending on administration, teaching materials, scholarships, etc.
Calculation Method: Divide public current expenditure devoted to personnel compensation in a given financial year
by the total public current expenditure on education for the same financial year and multiply by 100.
100*%PCXE
PXPX
t
t
t=
Where :
PX t% Percentage of public current expenditure on education devoted to personnel’s compensation in financial
year t
PX t Total public current expenditure on personnel compensation in financial year t
PCXEt Total public current expenditure on education in financial year t
Data required: Total public current expenditure on education and public current expenditure on personnel
compensation.
Data sources: Annual financial reports prepared by the ministry of finance; national accounts reports by the central
statistical office and financial reports from the various government departments engaged in education activities
especially the ministry of education.
Data disaggregation: By level of education and level of administration (central, regional, local government).
Interpretation: A higher percentage denotes the preponderance of spending on personnel compensation to the
detriment spending on administration, teaching materials, scholarships, etc. The way in which educational spending is
allocated between these different purposes i.e. teacher salaries and the condition of education facilities (e.g.
expenditure on teaching materials, etc) can affect the quality of education. ‘Personnel’ refers to teaching and non
teaching staff.
Quality standard: This indicator should be based on reliable data on personnel compensation, including emoluments
of all staff (full and/or part-time) working in educational institutions, covering both salaries and fringe benefits.
Limitations: In many instances data on total public current expenditure on education cover only the ministry of
education, excluding other ministries that spend a part of their budget on educational activities.

38
GROSS INTAKE RATIO IN THE LAST GRADE OF PRIMARY (GIRLG)
Definition: Total number of new entrants in the last grade of primary education, regardless of age, expressed as a
percentage of the population at the theoretical entrance age to the last grade of primary.
Purpose: This proxy measure of primary completion also reflects the impact of policies shaping the early grades of
primary school can impact the final grade of this education level. It also indicates the capacity of the education
system to provide primary completion for the theoretical entrance age population to the last grade of primary.
Calculation method: Divide the number of new entrants in last grade of primary, irrespective of age, by the
population of theoretical entrance age to the last grade of primary, and multiply the result by 100.
Formula:
100*
PNE
GIRLG t
a
t
lt=
Where:
GIRLGt Gross Intake Ratio in the Last Grade of primary in school year t
NEt
l Number of new entrants in the last grade l of primary education, in school year t
Pta Population of theoretical entrance age a in the last grade of primary, in school year t
N.B.: When data on new entrants are not separately reported, they can be derived by subtracting the number of repeaters from enrolment in the
last grade.
Data required: New entrants in the last grade of primary education (or enrolment minus repeaters in the last grade);
population of the theoretical entrance age in the last grade of primary.
Data source: School register, school survey or census for data on new entrants. Population census or estimates for
population of the theoretical entrance age in the last grade of primary.
Type of disaggregation: By gender and geographical location (region, rural/urban).
Interpretation: A high ratio indicates a high degree of current primary education completion.
Quality standards: Data on population used in deriving this indicator should refer strictly to the theoretical entrance
age in the last grade of primary. Care should be taken not to include repeaters in the last grade, which would inflate
the ratio.
Limitations: The calculation includes all new entrants to last grade (regardless of age). Therefore, the ratio can
exceed 100%, due to over-aged and under-aged children who enter primary school late/early and/or repeat grades.

39
EXPECTED GROSS INTAKE RATIO IN THE LAST GRADE OF PRIMARY (EGIRLG)
Definition: Total number of new entrants to the first grade of primary in a given year, regardless of age, who are
expected to reach the last grade of primary education, regardless of repetition, expressed as a percentage of the
population at the official entrance age to primary education in the same year.
Purpose: To estimate the future gross intake in the last grade of primary education based on current new entrants to
the first grade of primary education assuming current grade transition and repetition rates remain unchanged. It
therefore predicts the effect on last grade intake of current education policies on entrance to primary education and
future years of schooling.
Calculation method: Multiply the gross intake ratio to the first grade of primary education by the survival rate to the
last grade of primary. The survival rate is calculated on the basis of the reconstructed cohort method, which uses data
on enrolment and repeaters for two consecutive years.
Formula:
SRGIREGIRLGt
lg
t
Xt 1
,
−
=
Where:
EGIRLGt Expected Gross Intake Ratio in the last grade of primary in school year t
GIRt Gross Intake Ratio in the first grade of primary in school year t (see Glossary for GIR definition and formula)
SRt
lg
1
,
− Survival Rate of pupil-cohort g at last grade l for a reference year t-1 (see Glossary for SR definition and formula)
Data required: Enrolment by grade for two consecutive years (years t-1 and t); number of repeaters by grade for
year t; population of the official primary school-entrance age for year t.
Data source: School register, school survey or census for enrolment and repeaters; population census or estimates.
Type of disaggregation: By gender and geographical location (region, rural/urban). Care should be taken in
calculating the indicator at sub-national level because of pupils may transfer between localities.
Interpretation: A high ratio indicates a high degree of future primary education completion.
Quality standards: Since the calculation of this indicator is based on pupil-flow rates, its reliability depends on the
consistency of data on enrolment and repeaters in term of coverage over time and across grades.
Limitations: Given that this indicator is estimated using cohort analysis models that are based on a number of
assumptions (i.e. the observed flow rates will remain unchanged throughout the cohort life), care should be taken in
making comparisons.

40
GROSS PRIMARY GRADUATION RATIO (GPGR)
Definition: Total number of graduates from the last grade of primary education, regardless of age, expressed as a
percentage of the population at the theoretical graduation age for primary.
Purpose: To indicate the general level of primary education graduation. This proxy measure of primary completion
reports the current primary outputs stemming from previous years of schooling and past education policies on
entrance to primary education. It also indicates the capacity of the education system to provide primary graduation for
the theoretical graduation age population.
Calculation method: Divide the number of primary graduates, irrespective of age, by the population of theoretical
primary graduation, and multiply the result by 100.
Formula:
100*
P
GGPGR t
a
t
t=
Where:
GPGRt Gross Primary Graduation Ratio in school year t
Gt Number of primary graduates, in school year t
Pt
a Population of theoretical graduation age a in the last grade of primary, in school year t
Data required: Number of graduates in the last grade of primary education; population of the theoretical graduation
age in the last grade of primary.
Data source: School register, school survey or census for data on graduates; population census or estimates for
population of the theoretical graduation-age in the last grade of primary.
Type of disaggregation: By gender and geographical location (region, rural/urban).
Interpretation: A high ratio indicates a high degree of current primary education outputs.
Quality standards: Data on population used in deriving this indicator should refer strictly to the theoretical
graduation age in the last grade of primary.
Limitations: As this calculation includes all graduates (regardless of age), the ratio can exceed 100%, due to over-
aged and under-aged children who enter primary school for the first time early/late or/and repeat a grade. In some
countries, the results of graduation might be driven by the availability of places in secondary education, so care
should be taken in making comparisons.

41
EXPECTED GROSS PRIMARY GRADUATION RATIO (EGPGR)
Definition: Total number of new entrants to the first grade of primary in a given year, regardless of age, who are
expected to graduate from the last grade of primary education, regardless of repetition, expressed as a percentage of
the population at the official graduation age from primary education in the same year.
Purpose: To estimate the future outputs of primary education based on current new entrants to the first grade of
primary education assuming current grade transition and repetition rates as well as last grade graduation probability
remain unchanged. It therefore predicts the effect on last grade graduation of current education policies on entrance
to primary education and future years of schooling.
Calculation method: Multiply the expected gross intake ratio to the last grade of primary education by the
probability of graduation at the last grade of primary. This indicator is calculated on the basis of the reconstructed
cohort method.
Formula:
PGEGIRLGEGPGRtt
Xt =
Where:
EGPGRt Expected Gross Primary Graduation Ratio in school year t
EGIRLGt Expected Gross Intake Ratio in the last grade of primary in school year t (see Glossary for EGIRLG definition and formula)
PGt Probability of Graduation from the last grade of primary in school year t
t
l
tt
NE
GPG =
Where:
Gt Number of Graduates from the last grade of primary in school year t
NEt
l Number of new entrants in the last grade l of primary education, in school year t
Data required: Number of graduates in the last grade of primary education for year t; enrolment by grade for two
consecutive years (years t-1 and t); number of repeaters by grade for year t; population of the official primary school-
entrance age for year t.
Data source: School register, school survey or census for graduates, enrolment and repeaters; population census or
estimates.
Type of disaggregation: By gender and geographical location (region, rural/urban). Care should be taken in
calculating the indicator at sub-national level because pupils may transfer between localities.
Interpretation: A high ratio indicates a high degree of future primary education outputs.
Quality standards: Since the calculation of this indicator is based on pupil-flow rates, its reliability depends on the
consistency of data on enrolment and repeaters in term of coverage over time and across grades.
Limitations: Given that this indicator is estimated using cohort analysis models that are based on a number of
assumptions (i.e. the observed flow rates will remain unchanged throughout the cohort life), care should be taken in
using the results for cross-country comparisons. In some counties, the results of graduation might be driven by the
availability of places in secondary education.

42
OUT-OF-SCHOOL CHILDREN-PRIMARY (OOS)
Definition: Children in the official primary school age range who are not enrolled in either primary or secondary
schools.
Purpose: To identify the size of the population in the official primary school age range who should be targeted for
policies and efforts in achieving universal primary education.
Calculation method: Subtract the number of primary school-age pupils enrolled in either primary or secondary
school from the total population of the official primary school age range.
Data required: Population of the official primary school age range and number of pupils of primary school age
enrolled in either primary or secondary school.
Data sources: School register, school survey or census for enrolment; population census or estimates.
Type of disaggregation: By gender and geographical location, (region, rural/urban areas).
Interpretation: The higher the number of out-of-school children, the greater the need to focus on achieving universal
primary education. Some children of primary school-age who have never been in school may or may not eventually
enrol as late entrants. Other children may have initially enrolled but dropped out before reaching the ‘official’ age of
primary completion. When disaggregated by geographical location, this indicator can identify areas needing the
greatest efforts. Policies can also focus efforts on priority population groups or a particular gender.
Quality standards: Enrolment count should include in all types of schools and education institutions, including
public, private and all other institutions that provide organized educational programmes.
Limitations: Discrepancies between enrolment and population data coming from different sources may not give the
exact magnitude of out-of-school children.

43
PROMOTION RATE BY GRADE (PR)
Definition: Proportion of pupils from a cohort enrolled in a given grade at a given school year who study in the next
grade in the following school year.
Purpose: To measure the performance of the education system in promoting pupils from a cohort from grade to
grade, and its effect on the internal efficiency of educational systems. It is also a key indicator for analysing and
projecting pupil flows from grade to grade within the educational cycle.
Calculation method: Divide the number of new enrolments in a given grade in school year t+1 by the number of
pupils from the same cohort enrolled in the preceding grade in the previous school year t.
Formula:
t
i
t
it
iE
NEPR
1
1
++=
Where:
PRt
i Promotion Rate at grade i in school year t
1
1
++t
iNE New entrants to grade i+1, in school year t+1
tiE Number of pupils enrolled in grade i, in school year t
Data required: Enrolment by grade for school year t and enrolment and number of repeaters by grade for year t+1.
Data source: School register, school survey or census for data on enrolment and repeaters by grade.
Type of disaggregation: By grade, gender, geographical location (regions, urban/rural) and type of institution
(public/private).
Interpretation: Ideally, the rate should approach 100%; a high rate reflects high internal efficiency of the
educational system. When compared across grades, the patterns can indicate specific grades for which there is low
promotion.
Quality standard: Like other pupil-flow rates (repetition and dropout rates), the promotion rate is derived by
analysing data on enrolment and repeaters by grade for two consecutive years. One should therefore ensure that such
data are consistent in terms of coverage over time and across grades. These flow-rates can be biased by: over-
reporting enrolment/repeaters (particularly in grade one); incorrect distinction between new entrants and repeaters;
pupil transfers between schools (at sub-national level).
Limitations: Automatic promotion can in some cases be determined by the educational authorities with the aim of
coping with limited grade capacity and increasing the internal efficiency and flow of pupils (or students). Care
should be taken in interpreting this indicator, especially when comparing education systems.

44
DROPOUT RATE BY GRADE (DR)
Definition: Proportion of pupils from a cohort enrolled in a given grade at a given school year who are no longer
enrolled in the following school year.
Purpose: To measure the phenomenon of pupils from a cohort leaving school without completion, and its effect on
the internal efficiency of educational systems. In addition, it is one of the key indicators for analysing and projecting
pupil flows from grade to grade within the educational cycle.
Calculation method: Dropout rate by grade is calculated by subtracting the sum of promotion rate and repetition rate
from 100 in the given school year. For cumulative dropout rate in primary education, it is calculated by subtracting
the survival rate from 100 at a given grade (see survival rate).
Formula:
)(100 t
i
t
i
t
i RRPRDR +−=
Where:
tiDR Dropout Rate at grade i in school year t
tiPR Promotion Rate at grade i in school year t
tiRR Repetition Rate at grade i in school year t
Data required: Enrolment by grade for school year t and enrolment and number of repeaters by grade for year t+1.
Data source: School register, school survey or census for data on enrolment and repeaters by grade.
Type of disaggregation: By grade, gender, geographical location (regions, urban/rural) and type of institution
(public/private).
Interpretation: Ideally, the rate should approach 0%; a high dropout rate reveals problems in the internal efficiency
of the educational system. By comparing rates across grades, it is possible to identify those which require greater
policy emphasis.
Quality standard: Like other pupil-flow rates (promotion and repetition rates), the dropout rate is derived by
analysing data on enrolment and repeaters by grade for two consecutive years. One should therefore ensure that such
data are consistent in terms of coverage over time and across grades. Special attention should also be paid to
minimizing some common errors which may bias these flow-rates, such as: Over-reporting enrolment/repeaters
(particularly in grade one); incorrect distinction between new entrants and repeaters; transfers of pupils between
grades and schools.
Limitations: The level and maximum number of grade repetitions allowed can in some cases be determined by the
educational authorities with the aim of coping with limited grade capacity and increasing the internal efficiency and
flow of pupils (or students). Care should be taken in interpreting this indicator, especially when comparing education
systems.

45
GROSS ENROLMENT RATIO IN EARLY CHILDHOOD CARE AND EDUCATION (GER/ECCE)
Definition: Total number of children enrolled in early childhood care and education programmes, regardless of age,
expressed as a percentage of the population in the relevant official age group.
Purpose: To measure the general level of participation of young children in ECCE programmes. It also indicates a
country's capacity to prepare young children for primary education.
Calculation method: Divide the total number of children enrolled in ECCE programmes, regardless of age, by the
population in the relevant official age group in a given school year, and multiply by 100.
Formula:
100*P
EGER t
ECCE
tECCE=t
ECCE
Where,
GERtECCE Gross enrolment ratio in ECCE programmes in school year t
EtECCE Number of children enrolled in ECCE programmes in school year t
PtECCE Population in relevant official age group concerned with ECCE in school year t
Data required: Total enrolment in ECCE programmes; population in the relevant official age group.
Data source: School register, school survey or census for data on enrolment; population censuses or estimates for
school-age population normally obtained from the central statistical office.
Types of disaggregation: By gender and geographical location (region, urban/rural).
Interpretation: A ratio indicates adequate capacity for this type of programme within the country. A ratio
approaching or surpassing 100% indicates that the country is, in principle, able to accommodate all children in the
ECCE age group.
Quality Standards: The data on enrolment should cover both public and private institutions and programmes. Since
gross enrolment does not take the age factor into account, children below 3 years and above 5 years (or whatever the
official age group may be) will also be included. Therefore, gross enrolment can exceed 100 percent. Only countries
that require official registration of any ECCE provision are likely to have official data for this indicator. Countries
that have data only for public or state-supervised pre-school educational programmes will need to supplement these
data with information on enrolment in other types of ECCE programmes, possibly through case studies and/or sample
surveys.
Limitations: Enrolment data for ECCE programmes can be affected by differences in reporting practices, namely by
the extent to which childcare programmes with little or no pedagogical component are included in the statistics. The
distinction between ECCE programmes and organized, custodial childcare can be difficult to define in an
internationally consistent way, especially with regard to very young children, for whom the natural pace of
development limits the pedagogical possibilities. Countries may also differ widely in their approaches to ECCE, with
some focusing on experiential education while others stress skill development, academic development, the visual arts,
etc.

46
PERCENTAGE OF NEW ENTRANTS TO PRIMARY EDUCATION WITH ECCE EXPERIENCE.
Definition: Number of new entrants to primary grade 1 who have attended some form of organized early childhood
care and education (ECCE) programme for the equivalent of at least 200 hours, expressed as a percentage of total
number of new entrants to primary grade 1.
Purpose: To assess the proportion of new entrants to grade 1 who presumably have received some preparation for
primary schooling through ECCE programmes.
Calculation Method: Divide the number of new entrants to grade 1 of primary education who have attended some
form of organized ECCE programme by the total number of new entrants to primary grade 1 in a given school year,
and multiply by 100.
Formula:
100*NE
NE%NE t
1
tECCE1,t
ECCE1, ====
Where,
%NEt
ECCE1, Percentage of new entrants to grade 1 of primary education in school year t who have attended some form of organized ECCE
programme
NEt
ECCE1, Number of new entrants to grade 1 of primary education in school year t who have attended some form of organized ECCE
programme
NEt1 Total number of new entrants to primary grade 1 in school year t
Data Required: New entrants to grade 1 of primary education who have attended some form of organized ECCE
programme, and total number of new entrants to primary grade 1.
Data source: School register, school survey or census for data on enrolment.
Types of disaggregation: By gender and geographical location (region, urban/rural).
Interpretation: A high percentage of new entrants to grade 1 of primary education who have attended some form of
organized ECCE programme indicates that a large proportion of these children have participated in organized
learning activities prior to entering primary school. Progress in schooling is often associated with cognitive abilities
acquired at young ages. It is commonly recognized that prior participation in ECCE programmes can play an
important role in a child's future education, because they shape attitudes toward learning and develop basic social
skills, but the effect of ECCE activities on children’s cognitive development may vary according to the programme
attended.
Quality Standards: The percentage of new entrants to primary grade 1 who have attended some form of organized
ECCE programme cannot exceed 100%. Obtaining data for this indicator will be a problem in many countries. Useful
data may exist in school registration records, and school census instruments may also be geared to collecting this
information. Otherwise, the data could be gathered through a sample survey of schools or through household surveys.
Limitations: This indicator may give an exaggerated picture of access to ECCE, since those children who have
access to these programmes are also more likely to have access to primary schools.
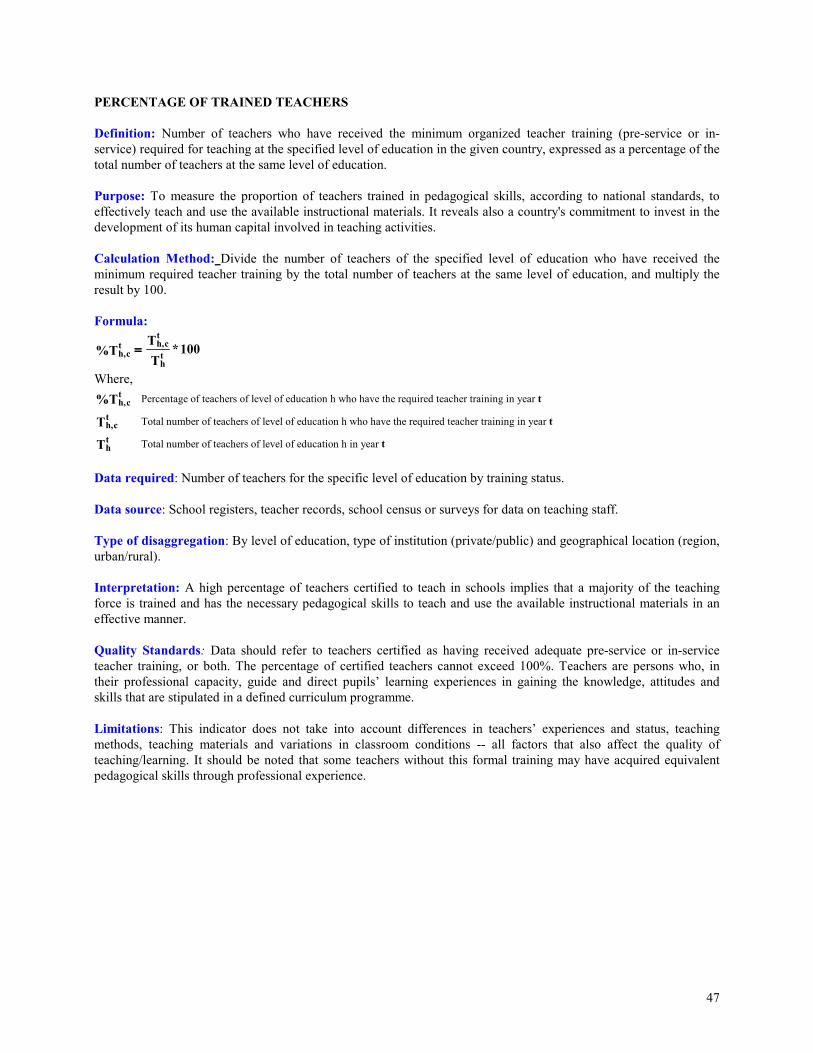
47
PERCENTAGE OF TRAINED TEACHERS
Definition: Number of teachers who have received the minimum organized teacher training (pre-service or in-
service) required for teaching at the specified level of education in the given country, expressed as a percentage of the
total number of teachers at the same level of education.
Purpose: To measure the proportion of teachers trained in pedagogical skills, according to national standards, to
effectively teach and use the available instructional materials. It reveals also a country's commitment to invest in the
development of its human capital involved in teaching activities.
Calculation Method: Divide the number of teachers of the specified level of education who have received the
minimum required teacher training by the total number of teachers at the same level of education, and multiply the
result by 100.
Formula:
100*T
T%T t
h
tch,t
ch, ====
Where,
%Tt
ch, Percentage of teachers of level of education h who have the required teacher training in year t
Tt
ch, Total number of teachers of level of education h who have the required teacher training in year t
Tth Total number of teachers of level of education h in year t
Data required: Number of teachers for the specific level of education by training status.
Data source: School registers, teacher records, school census or surveys for data on teaching staff.
Type of disaggregation: By level of education, type of institution (private/public) and geographical location (region,
urban/rural).
Interpretation: A high percentage of teachers certified to teach in schools implies that a majority of the teaching
force is trained and has the necessary pedagogical skills to teach and use the available instructional materials in an
effective manner.
Quality Standards: Data should refer to teachers certified as having received adequate pre-service or in-service
teacher training, or both. The percentage of certified teachers cannot exceed 100%. Teachers are persons who, in
their professional capacity, guide and direct pupils’ learning experiences in gaining the knowledge, attitudes and
skills that are stipulated in a defined curriculum programme.
Limitations: This indicator does not take into account differences in teachers’ experiences and status, teaching
methods, teaching materials and variations in classroom conditions -- all factors that also affect the quality of
teaching/learning. It should be noted that some teachers without this formal training may have acquired equivalent
pedagogical skills through professional experience.

48
PUBLIC EXPENDITURE ON A SPECIFIC ISCED LEVEL AS % OF TOTAL PUBLIC EXPENDITURE
ON EDUCATION
Definition: Public expenditure for a given education level expressed as a percentage of total public expenditure on
education.
Purpose: To show the relative share of expenditure for a specific education level within overall public expenditure
on education.
Calculation Method: Divide public expenditure devoted to the given level of education by total public expenditure
on all levels of education, and multiply the result by 100.
Formula:
100*
PXE
PXE%PXE
∑=
=n
1h
th
tit
i
Where,
%PXEti Public expenditure on a given level of education i as a percentage of total public expenditure on education in financial year t
PXEti Public expenditure on a given level of education i in financial year t
PXEth Public expenditure on education at level h in financial year t
Data required: Total public expenditure on education; public expenditure on the given level of education.
Data source: Annual financial reports prepared by the ministry of finance; national accounts reports by the central
statistical office and financial reports from the various government departments engaged in educational activities
especially the ministry of education.
Type of disaggregation: By level of administration and region.
Interpretation: A relatively high percentage denotes the priority given to that level in national educational policies
and resource allocation. When interpreting this indicator, one should take into account the corresponding enrolment
level, and then assess the relative current expenditure per pupil accordingly.
Quality Standards: This indicator should be based on consistent data on public expenditure for each level of
education that cover public funding for both public and private educational institutions.
Limitations: In some instances data on public expenditure on education refers only to the ministry of education,
excluding other ministries that spend a part of their budget on educational activities at a given level of education.

49
GENDER PARITY INDEX (GPI)
Definition: Ratio of female to male values of a given indicator.
Purpose: The GPI measures progress towards gender parity in education participation and/or learning opportunities
available for women in relation to those available to men. It also reflects the level of women’s empowerment in
society.
Calculation Method: Divide the female value of a given indicator by that of the male.
Formula:
M
FGPI t
tt
i
i
i====
Where,
GPIti Gender parity index of a given indicator i in year t
Fti Female value of a given indicator i in year t
Mti Male value of the same indicator i in year t
Data Required: Female and male values of the given indicator.
Data source: See source of the given indicator.
Type of disaggregation: By level of education, type of institution (private/public) and geographical location (region,
urban/rural).
Interpretation: A GPI equal to 1 indicates parity between females and males. In general, a value less than 1
indicates disparity in favour of boys/men and a value greater than 1 indicates disparity in favour of girls/women.
However, the interpretation should be the other way round for indicators that should ideally approach 0% (e.g.
repetition, dropout, illiteracy rates, etc). In these cases, a GPI of less than 1 indicates a disparity in favour of
girls/women and a value greater than 1 indicates a disparity in favour of boys/men.
Quality Standards: See quality standards for the underlying indicators.
Limitations: The index does not show whether improvement or regression is due to the performance of one of the
gender groups. Interpretation requires trend analysis of the underlying indicators.

50
YOUTH LITERACY RATE
Definition: The number of persons aged 15 to 24 years who can both read and write with understanding a short
simple statement on their everyday life, divided by the population in that age group. Generally, ‘literacy’ also
encompasses ‘numeracy’, the ability to make simple arithmetic calculations.
Purpose: To reflect recent outcomes of the basic education process. It is a summary measure of the effectiveness of
the education system.
Calculation Method: Divide the number of people aged 15 to 24 years who are literate by the total population in the
same age group and multiply the result by 100.
Formula:
P
LLIT t
2415
t2415t
2415
−
−− = * 100
Where,
t2415LIT − Literacy Rate of persons aged 15-24 years old in year t
Lt
2415− Literate Population aged 15-24 years old in year t
Pt
2415− Population aged 15-24 years old in year t
Data required: Population and number of literates (or illiterates) aged 15- to 24-years-old.
Data source: Mainly national population census; household and/or labour force surveys.
Types of disaggregation: By gender and geographical location (region, urban/rural).
Interpretation: A high literacy rate among the 15- to 24-year-olds suggests a high level of participation and
retention in primary education, and its effectiveness in imparting the basic skills of reading and writing. Because
persons belonging to this age group are entering adult life, monitoring their literacy levels is important with respect to
national human resources policies, as well as for tracking and forecasting progress in adult literacy.
Quality Standards: The rate cannot exceed 100%. It is useful to align measurements of literacy with the standard
international definition given above and to administer literacy tests on a sample basis to verify and improve the
quality of the statistics.
Limitations: It has been observed that some countries apply definitions and criteria for literacy which are different
from the international standards defined above, or equate persons with no schooling to illiterates, or change
definitions between censuses. Practices for identifying literates and illiterates during actual census enumeration may
also vary, as well as errors in literacy self-declaration can affect the reliability of the statistics.