indicative plan district mineral foundation
TRANSCRIPT

INDICATIVE PLAN
DISTRICT MINERAL FOUNDATION SUNDARGARH, ODISHA
Centre for Science and Environment
Indicative plan district mineral foundation, Sundergarh, Odisha report.indd 1 11/01/18 3:24 PM
© 2018 Centre for Science and Environment
Published byCentre for Science and Environment41, Tughlakabad Institutional AreaNew Delhi 110 062Phones: 91-11-29955124, 29955125, 29953394Fax: 91-11-29955879E-mail: [email protected] Website: www.cseindia.org
Indicative plan district mineral foundation, Sundergarh, Odisha report.indd 2 11/01/18 3:24 PM

INDICATIVE PLAN
DISTRICT MINERAL FOUNDATION SUNDARGARH, ODISHA
Centre for Science and Environment
Indicative plan district mineral foundation, Sundergarh, Odisha report.indd 3 11/01/18 3:24 PM

Indicative plan district mineral foundation, Sundergarh, Odisha report.indd 4 11/01/18 3:24 PM
5
INDICATIVE PLAN DISTRICT MINERAL SUNDARGARH, ODISHA
ContentsPREFACE ................................................................................................................................................................... 6
SECTION 1: INTRODUCTION AND OVERVIEW ..................................................................................7
SECTION 2: BACKGROUND OF THE DISTRICT ................................................................................10
SECTION 3: SITUATION ANALYSIS THROUGH STOCK-TAKING .......................................... 15
SECTION 4: SITUATION ANALYSIS THROUGH PARTICIPATORY
RURAL APPRAISAL .............................................................................................................53
SECTION 5: RESOURCE MAPPING .........................................................................................................61
SECTION 6: PRIORITIZING ISSUES AND APPROACHES FOR INTERVENTION
THROUGH AN OUTCOME-OUTPUT FRAMEWORK ............................................. 65
REFERENCES .........................................................................................................................................................73
Indicative plan district mineral foundation, Sundergarh, Odisha report.indd 5 11/01/18 3:24 PM

6
District Mineral Foundation (DMF) Rules of various states as well as Pradhan Mantri Khanij Khestra Kalyan Yojana (PMKKKY) specify that DMFs in every district should go through an annual planning exercise for identifying and prioritizing projects and works to be undertaken with DMF funds. Two clear issues have been underscored for DMF planning: districts should practice a bottom-up planning approach involving Gram Sabhas, and intervention should focus on certain “high priority” issues in mining-affected areas to maximize the welfare and benefit of the affected people.
Both of these specifications are given to ensure optimal deployment of financial resources available with DMFs for the “interest and benefit” of people affected by mining-related operations. For this, districts need to develop DMF plans adopting a systematic approach. This will also help to reduce ad hoc and reactive planning, poor investments and chances of special-interest interference.
To this effect, an indicative DMF plan for Sundargarh district is proposed. The purpose of this exercise is to provide a template for identifying priorities and setting plan targets by DMFs based on an output-outcome oriented approach, which can be considered by the district in line with its annual district and DMF budgets. It is also as an attempt to enable more stable investments, as the indicative plan takes into account the opinions people from mining-affected areas, members of Gram Panchayats/wards, civil society representatives and officials at the block and district levels, the stakeholders who are in direct charge of the various bits of the economy.
Preface
Indicative plan district mineral foundation, Sundergarh, Odisha report.indd 6 11/01/18 3:24 PM

7
INDICATIVE PLAN DISTRICT MINERAL SUNDARGARH, ODISHA
1.1 Context of Indicative District Mineral Foundation Plan
Planning and budget allocation of DMFs should happen as per provisions of the Mines and Minerals (Development and Regulation) Act (MMDR), 1957, as amended in 2015, and the Odisha DMF Rules, 2015 (as amended in February 2016). The provisions under both of these emphasize on developing human capital, making people employable, and providing security for the future. The state DMF Rules also specify the requirement of a planning exercise that DMFs in every district should go through for identifying and investing on works and schemes that will benefit the people and areas affected by mining related operations. Districts should practice a bottom-up planning approach to understand people’s needs and include such considerations in the DMF plan. There are also some clear directions in the state DMF Rules, aligned with the Government of India (GOI) scheme, the Pradhan Mantri Khanij Khestra Kalyan Yojana (PMKKKY) guidelines, which all DMFs are required to follow while developing plans and preparing budgets. These include:• Undertaking a bottom-up planning approach involving Gram- Sabhas of
mining-affected areas.• Focusing on certain “high priority areas” such as, drinking water supply, sanitation, health, education, welfare of women and children, welfare of aged
and disabled, skill development, environment preservation and pollution control measures.
• It has been specified that at least 60 per cent of the DMF budget should be earmarked towards addressing and mitigating the “high priority” issues.
• Limiting allocation on physical infrastructure and other big projects which already have funds from the state coffers: The Rules clarify that for areas such as physical infrastructure, irrigation, energy, watershed development etc, no more than 40 per cent of the money should be used.
Besides outlining the intervention issues, the DMF Rules and PMKKKY also emphasize on certain important factors that should be considered in DMF budgets:• In the case of schemes or projects which already enjoy financial support
from the Central or the state government, the developmental and welfare activities to be taken up by the DMF should complement those schemes and projects. This means there is a clear need to review the status of, and the gaps in, the Central/state schemes and projects which are operational in the districts.
• It has been clearly mentioned that a reasonable sum of the annual receipts should be kept as endowment fund for providing sustainable livelihood.
Section 1: Introduction and overview
Indicative plan district mineral foundation, Sundergarh, Odisha report.indd 7 11/01/18 3:24 PM

8
The indicative DMF plan as proposed for Sundargarh district, takes all of these into consideration to provide a template for identifying issues and prioritizing investments that can serve the best interest of the people and areas affected by mining.
1.2 Planning approach
An ‘output and outcome’ oriented approach has been followed for developing the indicative DMF plan. In this approach, outputs are time-bound measurable products of investments and activities that can often be expressed in physical terms or units. The intended outcomes are collective results of the measurable outputs, which are qualitative improvements and sustainable over long-term.
The merit of an output and outcome oriented approach is that is ensures “accountable, pro-active and purposeful” planning as per the defined objective of a particular scheme. For DMF planning, this means fulfilling the objectives of the DMF law, as well as PMKKKY, which has been aligned to DMF.
The GOI has also emphasized on such approach in the latest budget of 2017-18. The GOI has noted that budget outlays need to be presented along with outputs and outcomes in measurable terms, to bring in greater accountability for the agencies involved in the execution of the schemes and projects1.
1.3 Method
The method followed for developing the indicative plan involved the following two major steps:i. Gap analysis of key socio-economic, human development and environmental parameters.ii. Prioritizing issues and identifying approaches for intervention based on DMF objectives.
For both of these steps a bottom-up approach has been followed alongside evaluating factual and recorded information by the government.
i. Gap analysis: The deficiencies in intervention on the priority socio economic, human development and environmental issues in the district has been determined through gap analysis, taking into account quantitative and qualitative information, as well as resources. The gap analysis for various parameters was done through the following steps:
a. Collecting data/information: Collecting data and information on various parameters constitute of both quantitative and qualitative components.• The quantitative part is based on a stock-taking exercise on information
pertaining to various socio-economic, human development and environmental parameters for the district, and specifically for mining-affected areas.
• The qualitative part is based on the approach of participatory rural appraisal (PRA), to capture people’s perception and aspiration. The main PRA methods used for this exercise are focus group discussions (FGD),
Indicative plan district mineral foundation, Sundergarh, Odisha report.indd 8 11/01/18 3:24 PM

9
INDICATIVE PLAN DISTRICT MINERAL SUNDARGARH, ODISHA
and semi structured interviews (SSI). For the purpose of this study, FGDs have been conducted through randomized sampling in village(s)/ settlements, particularly in the mining-affected areas. With respect to SSI, discussions/ interviews were held with district and block officials and people in the mining-affected areas (Refer to section 4 for detail on FGD and SSI process and observations).
b. Data collation and processing: The quantitative and qualitative data/ information collected is collated and compiled in a prescribed format. The data has also to be checked for accuracy, errors, incompleteness and gaps.
Once the data is collated, it is important to analyze the situation. The collated data (both quantitative and qualitative) is thus used to describe the basic characteristics/features (descriptive statistics), and to draw broader inferences (inferential statistics).
c. Resource mapping: This involved identifying the resource envelop(s) to address the priority issues of the district. Since districts have budgets and allocations for every financial year, therefore the finances and allocations for only the last financial (2016-17) has been considered to understand the investments.
ii. Prioritizing issues and identifying approaches for intervention based on DMF objectives: Based on the gap-analysis, finally priority issues have been determined that DMFs need to focus on for intervention through a perspective planning approach. This will help to address issues immediately as well as plan for long-term investments.
Considering the output-outcome approach, a framework has been developed as the final step of the indicative planning exercise. In the framework, against each of the intended outcomes, a number of output factors have been identified which are considered to be crucial for achieving the target outcomes. It is intended that these outputs will be met through short-term, medium-term and long-term investments to achieve the final outcome.
Indicative plan district mineral foundation, Sundergarh, Odisha report.indd 9 11/01/18 3:24 PM

10
2.1 Location and geographical area
Sundargarh is situated in the northern part of Odisha, with Ranchi district of Jharkhand on the north, Raigarh district of Chhattisgarh on the west and north-west, Jharsuguda, Sambalpur and Angul districts of Odisha on the south and south-east and Singhbhum district of Jharkhand and Kendujhar district of Odisha to the east. It is located between 21°36’ N to 22° 32’ N latitude and longitude 83°32’ E to 85° 22’ E longitude. The district covers an area of nearly 9,712 square kilometre (sq.km) or about 971, 200 hectares (ha)2.
Brahmani and Ib are the main river flowing through the district. The Bramhani flows through the Bonai sub-division of the district. The Ib river originates in Chhattisgarh and enters Sundargarh district from the north at Tilijora. The Tumga and Icchha rivers along the western bank and the Safei along the eastern bank are the major tributaries of Ib river. Other significant rivers include Sankh, Koel.
2.2 Administrative areas
The administrative headquarter of Sundargarh district is located at Sundargarh town. There are three subdivisions which include Sundargarh, Panposh and Banei. There are presently 17 blocks in the district and 262 Gram Panchayats (GP). The blocks include Balisankara, Bargaon, Bisra, Bonaigarh, Gurundia, Hemgir, Koida, Kuanrmunda, Kutra, Lahunipara, Lathikata, Lephripara, Nuagaon, Rajagangapur, Subdega, Sundargarh, Tangarpali (See figure 1: Administrative map of Sundargarh district).
2.3 Land use/land cover
Sundargarh district can be divided into three broad natural divisions. Sundargarh and Panposh sub-divisions are long and undulating tracts of varying heights up to about 700 feet (213 metre) above the mean sea level, dotted with hill-ranges and isolated peaks of considerable height. Similarly, the Bonai sub-division is largely an isolated hilly tract with an average elevation of about 800 feet (244 metre) above mean sea level.
The land use/land cover of Sundargarh shows that forest area dominates the district’s landscape. Of the total land use/land cover area, forest area is about 51 per cent. This is followed by land for agricultural activities, with net sown area being 29 per cent of the total land area3 (See table 1: Land use/ land cover in Sundargarh district, and figure 2: Land use /land cover map of
Section 2: Background of the district
Indicative plan district mineral foundation, Sundergarh, Odisha report.indd 10 11/01/18 3:24 PM

11
INDICATIVE PLAN DISTRICT MINERAL SUNDARGARH, ODISHA
Figure 1: Administrative map of Sundargarh district
Source: District Planning Office, Sundargarh
Figure 2: Land use/land cover map of Sundargarh district
Source: District Irrigation Plan, Sundargarh (2016)
Indicative plan district mineral foundation, Sundergarh, Odisha report.indd 11 11/01/18 3:24 PM

12
Sundargarh district). The rich land use/land cover indicates the huge potential of sustainable livelihood opportunities around local resources.
Table 1: Land use/ land cover in Sundargarh districtLand use/ Land cover classes Area (ha) Total area (%)
Forest cover 496,000 51.1
Miscellaneous trees and groves 25,000 2.6
Net sown 284,000 29.2
Permanent Pastures 26,000 2.7
Culturable wasteland 16,000 1.6
Land put to non-agricultural use 29,000 3.0
Current Fallow 29000 3.0
Barren and uncultivable land 66,000 6.8
Source: District irrigation plan, Sundargarh (2016-17)
2.4 Mining activities and mining-affected areas
Sundargarh is one of the major mining district of Odisha as well as the country with rich deposits of iron ore. Besides the district also have significant coal and manganese reserves. In 2016-17, the district produced about 23.63 million tons (MT) of iron ore (See table 2: Iron ore production in Sundargarh district). Coal production for the same period was 13.5 MT and manganese 0.24 MT (See table 3: Coal production in Sundargarh district). Beside the district also produces minerals such as limestone and dolomite4.
The main iron ore mining companies in the district are Rungta Mines Limited, Rungta Sons Private Limited, Steel Authority of India Limited, Odisha Mining Corporation (OMC) Limited, Essel Mining and Industries Limited, Jindal Steel and Power Limited, besides many other players. The major coal mining company is Mahanadi Coalfields Limited (MCL).
Mining-affected areas The mining-affected areas of Sundargarh are rural areas spread across eight blocks. These include Koida, Kutra, Gurundia, Hemgir, Kuanrmunda, Nuagaon, Rajagangapur, Lahunipara. The iron ore and manganese mines are concentrated in Koida, Lahunipada and Gurundia blocks. Limestone is found in the Rajagangapur, Nuangaon, Kutra and Kuanrmunda blocks. Coal mines are restricted to the Ib valley region of the district in Hemgir block. (See Table 4: Mining-affected areas in Sundargarh district).
2.5 Demographic profile
As per Census of India (2011), the population of Sundargarh district is about 21 lakhs of which about 50.68 per cent is male and 49.32 per cent female (See Table 5: Population distribution). A decennial growth nearly 14.35 per cent has been observed for the district’s population in 2011 as compared to 2001.
Indicative plan district mineral foundation, Sundergarh, Odisha report.indd 12 11/01/18 3:24 PM

13
INDICATIVE PLAN DISTRICT MINERAL SUNDARGARH, ODISHA
Table 2: Iron ore production in Sundargarh district (2016-2017)
Name of mines LocationProduction of iron ore (MT)
Aryan Mining and Trading Corporation Private Limited
Narayanposhi, Koida 2.995
B.I.Company Limited Nadidihi 2.695
B.I. Company Limited Teherai 1.089
M.G. Mohanty Patabeda-19.425 HA 0.144
Prabodh Mohanty Nuagaon 0.011
Essel Mining and Industries Limited Nuagaon, Kadodiha,Koida 3.996
Feegrade and Company Private Limited Rengalibeda , Nadikasira 2.329
Jindal Steel and Power Limited Tantra-Raikela-Bandhal 2.722
Korp Resources Private Limited Tantra 0.120
M.G. Mohanty Patabeda 0.073
MGM Minerals Limited Patabeda 0.294
National Enterprises Raikela 0.500
OMC Limited KurmitarPahar 2.400
Penguin Trading and Agencies Limited Raikela 0.764
Rungta Sons Private Limited Oraghat 2.018
Rungta Sons Private Limited Sanindupur 2.565
S.N. Mohanty (KJST-Jaldihi) KJST,Jaldihi 1.896
Steel Authority of India Limited Kalta 1.230
Steel Authority of India Limited Taldih 0.248
Source: Directorate of Mines, Department of Steel and Mines, Odisha (January, 2018)
Table 3: Coal production in Sundargarh district (2016-2017)
Name of mines LocationProduction of
coal (MT)
MCL Basundhara 3.5076
MCL Kulda 9.9960
Source: Directorate of Mines, Department of Steel and Mines, Odisha (January, 2018)
Table 4: Mining-affected areas in Sundargarh districtBlock name Total number of panchayats Number of affected panchayats
Koida 12 7
Kutra 16 6
Nuagaon 20 5
Lahunipara 17 4
Hemgir 19 4
Rajagangapur 12 3
Kuanrmunda 20 3
Gurundia 13 1
Source: Office of the District Magistrate, Sundargarh (January, 2018)
Indicative plan district mineral foundation, Sundergarh, Odisha report.indd 13 11/01/18 3:24 PM
14
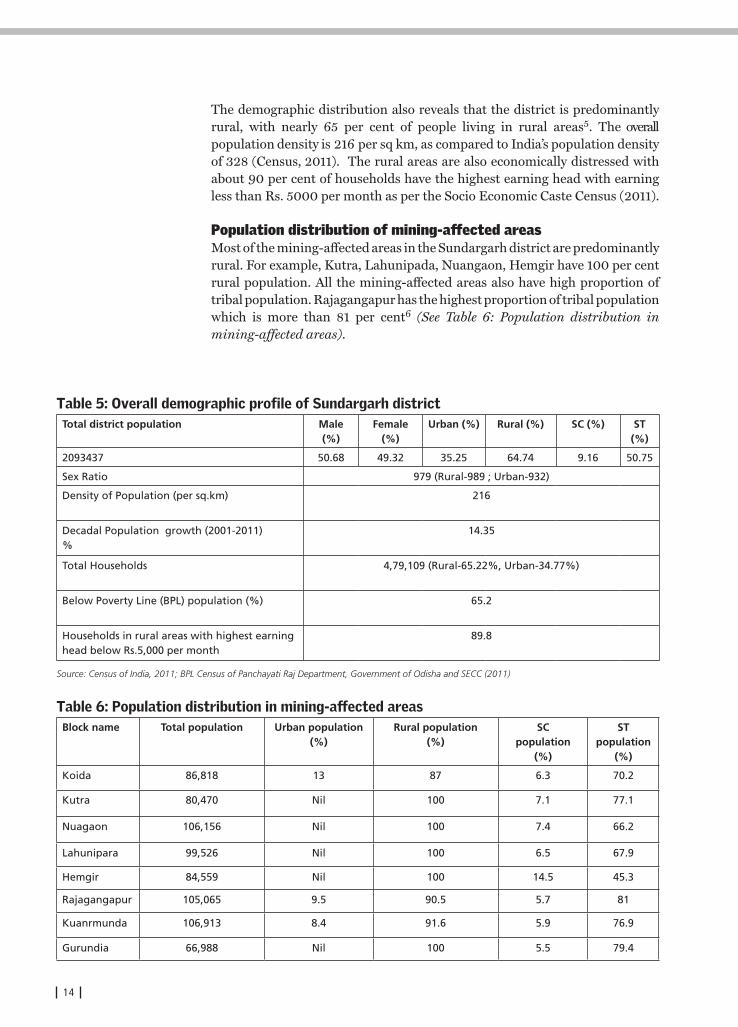
The demographic distribution also reveals that the district is predominantly rural, with nearly 65 per cent of people living in rural areas5. The overall population density is 216 per sq km, as compared to India’s population density of 328 (Census, 2011). The rural areas are also economically distressed with about 90 per cent of households have the highest earning head with earning less than Rs. 5000 per month as per the Socio Economic Caste Census (2011).
Population distribution of mining-affected areasMost of the mining-affected areas in the Sundargarh district are predominantly rural. For example, Kutra, Lahunipada, Nuangaon, Hemgir have 100 per cent rural population. All the mining-affected areas also have high proportion of tribal population. Rajagangapur has the highest proportion of tribal population which is more than 81 per cent6 (See Table 6: Population distribution in mining-affected areas).
Table 5: Overall demographic profile of Sundargarh districtTotal district population Male
(%)Female
(%)Urban (%) Rural (%) SC (%) ST
(%)
2093437 50.68 49.32 35.25 64.74 9.16 50.75
Sex Ratio 979 (Rural-989 ; Urban-932)
Density of Population (per sq.km) 216
Decadal Population growth (2001-2011)%
14.35
Total Households 4,79,109 (Rural-65.22%, Urban-34.77%)
Below Poverty Line (BPL) population (%) 65.2
Households in rural areas with highest earning head below Rs.5,000 per month
89.8
Source: Census of India, 2011; BPL Census of Panchayati Raj Department, Government of Odisha and SECC (2011)
Table 6: Population distribution in mining-affected areasBlock name Total population Urban population
(%)Rural population
(%)SC
population (%)
STpopulation
(%)
Koida 86,818 13 87 6.3 70.2
Kutra 80,470 Nil 100 7.1 77.1
Nuagaon 106,156 Nil 100 7.4 66.2
Lahunipara 99,526 Nil 100 6.5 67.9
Hemgir 84,559 Nil 100 14.5 45.3
Rajagangapur 105,065 9.5 90.5 5.7 81
Kuanrmunda 106,913 8.4 91.6 5.9 76.9
Gurundia 66,988 Nil 100 5.5 79.4
Indicative plan district mineral foundation, Sundergarh, Odisha report.indd 14 11/01/18 3:24 PM

15
INDICATIVE PLAN DISTRICT MINERAL SUNDARGARH, ODISHA
The stock-taking exercise of various socio-economic, human development and environmental parameters has been done by analyzing district and block level data/information pertaining to these. The main sources of the data, including contextual information, include various Government documents and reports as published by accredited agencies. Some key sources from where data has been obtained include-• Census of India reports- District Census handbook, Sundargarh, 2011.• National Sample Survey (NSS) data, Ministry of Statistics and Program
Implementation.• Socio Economic Caste Census data, Ministry of Rural Development• Rural Health Statistics Report (2014-15), Ministry of Health and Family
Welfare.• District Information System for Education (DISE): School Reports
maintained by National University of Educational Planning and Administration (NUEPA).
• Mahatma Gandhi National Rural Employment Guarantee Act (MGNREGA) MIS Reports for districts, Ministry of Rural Development.
• District level authorities and departments- such as District Rural Development Agency, health department, education department, water supply and sanitation department, social welfare department etc.
• Reports prepared by Government, accredited institutions/ agencies (latest ones)- National Family Health Survey of India. Census of India, Annual Health Survey. Ministry of Drinking Water and Sanitation, reports on Swachh Bharat
Mission. Central Ground Water Board (CGWB), District ground water brochures.
3.1 Analysis of human development parameters
Human development indicators typically reflect average achievement with respect to three key dimensions of human development. These include7:• A long and healthy life.• Having education and being knowledgeable.• Having a decent standard of living.
Therefore, for a district, the key parameters of measure of human-development include the status of public health, nutrition and concerns of food security and livelihood of people. To ascertain the status of each of these a situation analysis was done through stocking-taking of data/ information at the district and the block levels.
Section 3: Situation analysis through stock-taking
Indicative plan district mineral foundation, Sundergarh, Odisha report.indd 15 11/01/18 3:24 PM

16
3.1.1 Public Health
The public health and healthcare status of Sundargarh district, and particularly the mining-affected blocks has been reviewed on the basis of the following key parameters:a. Disease prevalence.b. Healthcare infrastructure and resources- primary and secondary facilities
and healthcare staff.
Based on the situation on each of these, the overall gaps in the public healthcare sector have been identified.
A. Review of healthcare parameters
a. Disease prevalenceThe available data on disease prevalence at the district-level and particularly at the block-level is poor. The situation has been largely captured through review of the Annual Health Survey Report of the GOI (2012-2013), and through interviews with health officials, health centre visits and interaction with communities in mining-affected areas. Reportedly, the most common diseases in the mining-affected areas are gastro-intestinal problems, malaria and tuberculosis (Refer to section 4).
With respect to waterborne diseases such as diarrhoea and malaria, statistics of the Ministry of Health and Family Welfare (2017), indicates that children below the age of five years are particularly vulnerable to these (See table 7: Percentage of diarrhea, dehydration, and malaria in children 0-5 years of age to total reported childhood diseases of 0-5 years)8. A primary reason for such illnesses is unavailability of clean drinking water and sanitation facilities. These conditions also have a strong bearing on the development of children, as identified in the Global Hunger Index Report (2017), that has identified lack of proper sanitation has a strong effect on child health and their nutrition absorption capacity9.
Besides, there are also significant reported cases of respiratory ailments, particularly tuberculosis (TB). In Sundargarh the TB prevalence is 280 per one lakh people in rural areas10, which is much higher than the national average, which is 195 per one lakh people (See table 8: Some key health conditions in Sundargarh district)11. It is to be noted here, that even the India average is extremely problematic as the country has been identified as one of the countries with a high TB burden and has a target of eradicating TB by 2030 under the Sustainable Development Goals (SDG)12.
Another notable problem in the district is high proportion of disabled people which has made the district occupy the 21st position in the list of 100 districts of the country with the highest prevalence of disability. As per the Annual Health Survey Report (2012-13), 2,738 per one lakh people suffer from disability which is higher than the state average of 2,358 per one lakh people.
Indicative plan district mineral foundation, Sundergarh, Odisha report.indd 16 11/01/18 3:24 PM

17
INDICATIVE PLAN DISTRICT MINERAL SUNDARGARH, ODISHA
Table 7: Percentage of diarrhoea, dehydration and malaria in children 0-5 years of age to total reported childhood diseases of that age (2016-17) Block name Diarrhoea and Dehydration (%) Malaria (%)
Koida 48.6 51.4
Kutra 98.1 1.8
Nuagaon 94.2 5.8
Lahunipara 1.5 98.4
Hemgir 69.6 30.4
Rajagangapur 50.9 49.1
Kuanrmunda 75.3 24.7
Gurundia 44.4 55.6
Balisankara 51.9 48
Bargaon 47.1 52.9
Bisra 63.2 35.8
Bonaigarh 66.6 33.4
Lathikata 38.9 61.1
Lephripara 97.6 2.4
Subdega 96.3 3.7
Sundargarh 90.4 9.6
Tangarpali 95.8 4.2
Source: Ministry of Health and Family Welfare (August 2017)
Table 8: Some key health conditions in Sundargarh districtIllnesses (per lakh people)
Person in Odisha state Person in Sundargarh district
Total Rural Urban Total Rural Urban
Diabetes 1047 733 2676 1024 505 2110
Hypertension 1776 1541 2993 2161 1424 3701
Tuberculosis 185 193 141 250 280 187
Source: Annual Health Survey (2012-2013)
b. Healthcare Infrastructure and resourcesGiven the severity of poor health conditions of people as reported during ground interaction, the availability of good and adequate healthcare infrastructure, along with qualified health staff at the facilities is critical. Considering these factors, in this section review has been done separately for primary and secondary healthcare facilities.
Primary healthcare: Health sub centres , Primary Health Centres (PHC) and Community Health Centres (CHC), together constitute primary healthcare facilities. Besides, mobile medical units also supplement for primary healthcare facilities particularly in rural areas. Data as obtained from district and block levels gives an overall understanding of the number of these facilities in every block and the health staff available there (See table 9: Number of primary healthcare facilities and staff strength).
Indicative plan district mineral foundation, Sundergarh, Odisha report.indd 17 11/01/18 3:24 PM

18
Table 9: Number of primary healthcare facilities (Government) and staff strengthBlock name Sub centres PHC CHC
Number Staff strength
Number Staff strength
Number Staff strength
Koida 24 24 3 9 1 5
Kutra 21 21 3 9 1 4
Nuagaon 26 26 4 11 1 2
Lahunipara 27 27 3 9 1 5
Hemgir 21 21 5 14 1 5
Rajagangapur 26 26 3 9 2 10
Kuanrmunda 27 27 3 9 2 3
Gurundia 19 19 4 11 1 3
Balisankara 28 28 4 12 1 3
Bargaon 17 17 3 9 2 3
Bisra 23 23 2 6 1 5
Bonaigarh 19 19 2 6 1 2
Lathikata 33 33 5 15 1 2
Lephripara 24 24 6 18 1 4
Subdega 20 20 2 6 1 5
Sundargarh 18 18 3 9 1 3
Tangarpali 17 17 4 12 1 3
Source: National Health Mission, Government of Odisha
The Indian Public Health Standard (IPHS), as provided under the National Health Mission (NHM), stipulates the minimum requirements of public healthcare facilities in rural areas. Considering that Sundargarh district is primarily rural in nature, the IPHS norm has been considered as the overall benchmark. According to IPHS, in the rural areas, there should be at least one sub-centre for every 5000 people, one PHC per 30,000 people, and one CHC per 1,20,000 people. For tribal and hilly areas the norms are further stringent. For these areas there should be at least one sub centre for every 3,000 people13, one PHC per 20,000 people14, and one CHC per 80,000 people15.
When evaluated against the IPHS benchmark, data on primary healthcare facilities indicate that in some of the mining-affected blocks, such as Lahunipara, Kutra, Kuanrmunda and Nuagaon, both sub centres and PHCs are serving nearly one and a half times their reach.
The poor status of primary healthcare becomes much more pronounced when healthcare staff is considered. For example, according to IPHS, there should be at least (“essential”) three health workers in sub centres, 15-20 health staff at PHCs (depending on the PHC type A or B), and 35- 40 health staff of various competence, specializations and responsibilities at CHCs16. Taking this as a benchmark, if the overall number of health workers and health staff as made available for various primary healthcare facilities are considered, it shows that the average staff strength falls far below that what is required17. Particularly in PHCs and CHCs, the shortfall is about 50 per cent.
Indicative plan district mineral foundation, Sundergarh, Odisha report.indd 18 11/01/18 3:24 PM

19
INDICATIVE PLAN DISTRICT MINERAL SUNDARGARH, ODISHA
Secondary healthcare: The secondary healthcare system constitutes of sub-district/sub-divisional hospitals and district hospital. They both are important components of more specialized and comprehensive healthcare facilities for a district’s rural as well as the urban population.
The sub-district/ sub-divisional hospitals also form an important link between SC, PHC and CHC on one end and district hospitals on other end, and are the first referral units for the tehsil/ taluk/ block population in which they are located. The National Health Mission (NHM), also identifies sub-divisional hospitals to be significant for bringing down the Maternal Mortality Rate (MMR) and Infant Mortality Rate (IMR) as these facilities are meant to provide emergency obstetrics care and neonatal care18.
The district hospital on the other hand functions as a secondary level referral centre. While all district hospitals are required to be equipped to provide all basic specialty services, but they should also be developed into super-specialty services gradually, particularly for bigger districts identifies the NHM19.
In Sundargarh district, there are two district hospitals, one in the district head quarter Sundargarh and another in Rourkela. Besides there are two sub-divisional hospitals in Bonaigarh and Rourkela, and four area hospitals in Hemgir, Nuangaon, Biramitrapur and Rajagangapur.
One of the key concerns for these facilities is the bed capacity. This has also been repeatedly highlighted in the FGDs and SSIs (Refer to section 4). Though comprehensive data on bed capacities for all facilties could not be obtained at the time of research, but as per available information from the district, there are 197 beds in the district headquarter hospital, 56 beds in Bonai sub-divisional hospital, 16 beds in Panposh sub-divisional hospital and 128 beds in Rourkela sub-divisional hospital.
B. Gaps in the public healthcare
The status of the health sector in the mining-affected areas as identified from analysis of the official data shows gaps/deficits both in infrastructure as well as resources. The key deficits include:a. Inadequate number of primary healthcare facilities and their access.b. Inadequate human resources – doctors and health workers etc.c. Lack of human resources and infrastructure in hospitals.
a. Inadequate number of primary healthcare facilities and their accessThe primary healthcare infrastructure and their access is a major problem in Sundargarh district, including mining-affected areas (See table 10: Deficits in primary healthcare facilities and staff). Both sub centres and PHCs are serving about 1.5 times their capacity in the mining areas. Additionally studies have indicated that on a average in the district only about 33 per cent villages have CHCs within 10 km radius, 45 per cent villages have sub centres within five km radius and only five per cent villages have PHCs within five km radius20.
Indicative plan district mineral foundation, Sundergarh, Odisha report.indd 19 11/01/18 3:24 PM

20
Table 10: Deficits in primary healthcare facilities and staffSub centre
Block name Average no. of people served per sub-centre
Serving over IPHS norm
Average Staff Strength per sub-centre
Shortfall in no. of health staff
compared to IPHS norms (3nos.)
Koida 3149 1.1 1 2
Kutra 3831 1.3 1 2
Nuagaon 4082 1.4 1 2
Lahunipara 3686 1.2 1 2
Hemgir 4026 1.3 1 2
Rajagangapur 3659 1.2 1 2
Kuanrmunda 3624 1.2 1 2
Gurundia 3525 1.2 1 2
Balisankara 3060 - 1 2
Bargaon 4190 1.4 1 2
Bisra 2983 - 1 2
Bonaigarh 3305 1.1 1 2
Lathikata 2494 - 1 2
Lephripara 3283 1.1 1 2
Subdega 3212 1.1 1 2
Sundargarh 3939 1.3 1 2
Tangarpali 3786 1.3 1 2
PHC
Block name Average no. of people served
per PHC
Serving over IPHS norm
Average staff strength per
PHC
Shortfall in no. of health staff
compared to IPHS (15-20 nos.)
Koida 25,195 1.3 9 6
Kutra 26,823 1.3 9 6
Nuagaon 26,539 1.3 11 4
Lahunipara 33,175 1.7 9 6
Hemgir 16,911 - 14 1
Rajagangapur 31,714 1.6 9 6
Kuanrmunda 32,623 1.6 9 6
Gurundia 16,747 - 11 4
Balisankara 21,422 1.1 12 3
Bargaon 23,747 1.2 9 6
Bisra 34,314 1.7 6 9
Bonaigarh 31,405 1.6 6 9
Lathikata 16,464 - 15 -
Lephripara 13,134 - 18 -
Subdega 32,127 1.6 6 9
Sundargarh 23,637 1.2 9 6
Tangarpali 16,093 - 12 3
Indicative plan district mineral foundation, Sundergarh, Odisha report.indd 20 11/01/18 3:24 PM
21
INDICATIVE PLAN DISTRICT MINERAL SUNDARGARH, ODISHA
CHC
Block name Average no. of people served
per CHC
Serving over IPHS norm
Average Staff Strength per
CHC
Shortfall in no. of health staff
compared to IPHS norm (35-40 nos.)
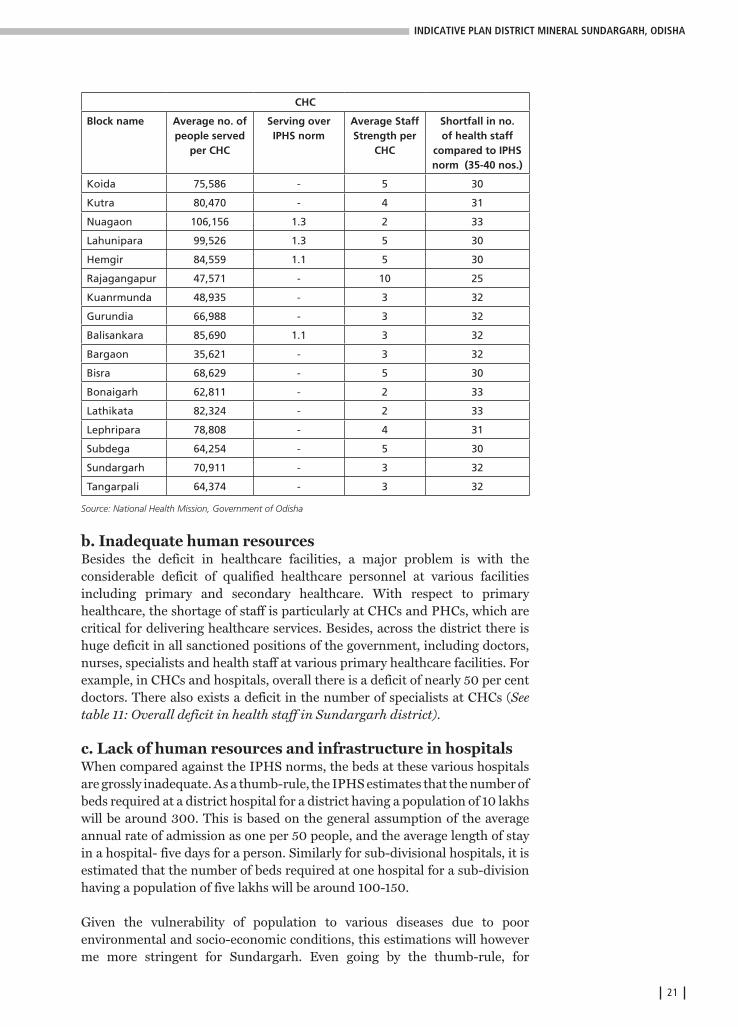
Koida 75,586 - 5 30
Kutra 80,470 - 4 31
Nuagaon 106,156 1.3 2 33
Lahunipara 99,526 1.3 5 30
Hemgir 84,559 1.1 5 30
Rajagangapur 47,571 - 10 25
Kuanrmunda 48,935 - 3 32
Gurundia 66,988 - 3 32
Balisankara 85,690 1.1 3 32
Bargaon 35,621 - 3 32
Bisra 68,629 - 5 30
Bonaigarh 62,811 - 2 33
Lathikata 82,324 - 2 33
Lephripara 78,808 - 4 31
Subdega 64,254 - 5 30
Sundargarh 70,911 - 3 32
Tangarpali 64,374 - 3 32
Source: National Health Mission, Government of Odisha
b. Inadequate human resourcesBesides the deficit in healthcare facilities, a major problem is with the considerable deficit of qualified healthcare personnel at various facilities including primary and secondary healthcare. With respect to primary healthcare, the shortage of staff is particularly at CHCs and PHCs, which are critical for delivering healthcare services. Besides, across the district there is huge deficit in all sanctioned positions of the government, including doctors, nurses, specialists and health staff at various primary healthcare facilities. For example, in CHCs and hospitals, overall there is a deficit of nearly 50 per cent doctors. There also exists a deficit in the number of specialists at CHCs (See table 11: Overall deficit in health staff in Sundargarh district).
c. Lack of human resources and infrastructure in hospitalsWhen compared against the IPHS norms, the beds at these various hospitals are grossly inadequate. As a thumb-rule, the IPHS estimates that the number of beds required at a district hospital for a district having a population of 10 lakhs will be around 300. This is based on the general assumption of the average annual rate of admission as one per 50 people, and the average length of stay in a hospital- five days for a person. Similarly for sub-divisional hospitals, it is estimated that the number of beds required at one hospital for a sub-division having a population of five lakhs will be around 100-150.
Given the vulnerability of population to various diseases due to poor environmental and socio-economic conditions, this estimations will however me more stringent for Sundargarh. Even going by the thumb-rule, for
Indicative plan district mineral foundation, Sundergarh, Odisha report.indd 21 11/01/18 3:24 PM

22
Sundargarh district with a population of nearly 21 lakhs, the total number of beds required at the district hospital will be over 600. However, the current bed capacity in Sundargarh district headquarter hospital is 197, in Rourkela general hospital it is 128, combining both which is about 325. This is nearly 50 per cent of the requirement for the district.
Table 11: Overall deficit in health staff in Sundargarh districtType of healthcare personnel and facility Sanctioned
(Government positions)
In position (Government
positions)
Total Health workers at sub centers (male) 216 184
Total Health workers at sub centers (female) 467 400
Total Health workers at PHCs (male) Not available Not available
Total Health workers at PHCs (female) Not available Not available
Total no. of specialists at CHCs 49 32
Total no. of doctors at CHCs 28 16
Total staff nurses in CHCs 49 45
Total doctors in sub divisional and district hospital
18 15
Total nurses in sub divisional and district hospital
Not available Not available
ASHA 2,429 2,410
Source: National Health Mission, Government of Odisha
3.1.2 Nutrition and food security
With respect to nutrition and food security, the primary parameters looked at include:a. Infant mortality, under five mortality and malnourishment.b. Coverage under Integrated Child Development Services.c. Coverage under National Food Security Act (public distribution system).
Based on the situation on each of these, the overall gaps with respect to nutrition and food security have been identified.
A. Review of nutrition and food security parameters
a. Infant mortality, under five mortality and malnourishmentIn Sundargarh district the average infant mortality rate (IMR) is 47 and the under five mortality rate (U5MR) is 57. Both of these indicators are worse for the rural parts of the districts, where IMR is 55 and U5MR is 67 (See table 12: Mortality rates among various groups in Sundargarh district)21. The indicators fall far short of what is envisioned against international benchmarks, such as the Sustainable Development Goals (SDG), necessitating serious intervention22. Under SDG, the target for U5MR is 25 by the year 2030.
Indicative plan district mineral foundation, Sundergarh, Odisha report.indd 22 11/01/18 3:24 PM

23
INDICATIVE PLAN DISTRICT MINERAL SUNDARGARH, ODISHA
Table 12: Mortality rates among various groups in Sundargarh districtIndicators Total Rural Urban
IMR 47 55 25
U5MR 57 67 32
Source: Annual Health Survey (2012-2013)
Besides, mortality indicators, growth and weight indicators are also critical for good health. Various malnutrition symptoms are important in this respect. The most prominent symptoms of malnutrition in Sundargarh district are stunted growth and underweight. On an average more than 47 per cent of the male child and 49 per cent of the female child below five years of age are stunted. Further, within this age group more than 33.5 per cent of male child are underweight, for female child it is further higher which is nearly 46.5 per cent (See table 13: Symptoms of malnutrition below five years age)23.
The National Family Health Survey (2015-16), further shows that more than 75.3 per cent of children between the age of six to 59 months (i.e., about six months to five years age group), suffer from anaemia. The condition is largely related to high prevalence of anaemia among pregnant women. About 52.6 per cent of pregnant women within 15-49 years of age are anaemic24.
Table 13: Symptoms of malnutrition below five years ageNutritional status Male Female
Below -2 SD Wasting (%) 12.9 15.7
Below -3 SD Wasting (%) 5.0 4.6
Below -2 SD Stunting (%) 47.2 49.0
Below -3SD Stunting (%) 25.9 30.1
Below -2 SD Underweight (%) 33.5 46.5
Below -3 SD Underweight (%) 9.8 14.4
Below -2 SD Undernourished (%) 14.0 16.2
Below -3 SD Undernourished (%) 7.8 6.9
Source: Annual Health Survey (2012-2013); Clinical, Anthropometric and Biochemical (2014)
b. Coverage under Integrated Child Development ServicesThe primary goal of Integrated Child Development Services (ICDS) as identified by the GOI is to reduce malnutrition, and morbidity and mortality caused by nutritional deficiencies. To achieve this, the government identifies six services that must be assured. These include- supplementary nutrition, health and nutrition education, non-formal pre-school education, immunization, health check-up and monitoring, and referral services. Among these the former three are required to be provided and supported by the network of AWCs, while the later three are designed to be delivered through the primary healthcare infrastructure25.
Indicative plan district mineral foundation, Sundergarh, Odisha report.indd 23 11/01/18 3:24 PM

24
The status of AWCs has been looked into through three parameters, the adequacy of AWCs, staff at AWCs and availability of other infrastructure facilities such as drinking water and toilet.
All children below six years of age constitute the target group of ICDS. Further the government has stipulated coverage norms for ICDS for this age group. This requires that in non-tribal areas each AWC should cover 40 beneficiaries, and in tribal areas each AWC should cover 42 beneficiaries.
When analyzed against such benchmark, all the mining-affected blocks (and others as well), appear to have inadequate number of AWCs. In each of the mining-affected blocks the AWCs are catering to on average minimum of 1.5 times and maximum of 2.5 times the number of children they are equipped to support (See table 14: Status of existing AWCs and average number of children covered in mining-affected areas).
The problem is compounded by the lack of proper infrastructure at these facilities. For example, categorically in most mining-affected blocks including Gurundia, Hemgir, Koida, Kuanrmunda, Lahunipara, Nuagaon and Rajagangapur, many AWCs do not have permanent structures; on an average about 70 per cent have so. Further in these areas, only about 30 to 40 per cent have toilet facilities within the premises (See table 15: Status of infrastructure at AWCs in mining-affected areas).
Table 14: Status of existing AWCs and average number of children covered in mining-affected areasBlock name Total number
of AWCsChildren
below 6 yrsAverage number of children
presumably covered by one AWC
Koida 167 16442 99
Kutra NA* 10067 NA
Nuagaon 228 14290 63
Lahunipara 250 16306 65
Hemgir 214 9852 46
Rajagangapur 267 14710 55
Kuanrmunda 234 14600 62
Gurundia 186 10398 56
*Data not available Source: District Rural Development Department, Sundargarh
c. Coverage under National Food Security ActThe coverage of people under the National Food Security Act (NFSA), 2013, is satisfactory as per official information. The NFSA aims to ensure people’s access to adequate quantity of quality food at affordable prices through public distribution system26.
In Odisha, the NFSA implementation has been made more targeted by including “inclusion and exclusion criteria” for identification of beneficiaries based on economic well being. There are six auto inclusion criteria to cover particularly all vulnerable people through public distribution system. There
Indicative plan district mineral foundation, Sundergarh, Odisha report.indd 24 11/01/18 3:24 PM

25
INDICATIVE PLAN DISTRICT MINERAL SUNDARGARH, ODISHA
include, household without shelter, household with destitute who is living on alms, all households of Primitive Tribal Groups (PTG), household having a widow pension holder, household having a person with disabilities of 40 per cent or more and any transgender person.
On the other hand, nine exclusion criteria have also been provided to determine the beneficiaries. Families covered under any of the eight criteria are excluded from being a beneficiary under NFSA. These include, household owning motorized three wheeler (two or more) / a four wheeler/ a heavy vehicle/ a fishing boat (requiring registration), household owning mechanized agricultural equipment (such as tractors or harvesters), household with any member who is a regular employee - gazetted or non-gazetted - of Central or State Government, Public Sector Undertaking (PSU), Government aided autonomous bodies and local bodies (excludes incentive and other honorarium based workers),household with any member in the family earning more than Rs. 10,000 per month in rural areas and Rs. 15,000 per month in urban areas, pensioners with monthly income of more than Rs. 10,000 per month in rural areas and Rs. 15,000 per month in urban areas, household with enterprisers (other than micro-enterprisers) registered with the Government for manufacturing and services, households paying income tax or professional tax, household having domestic electric connection with a load of two kilowatt or more and consuming an average of 300 units of energy (kilowatt hour) per month and household with three or more rooms with pucca walls and pucca roof27.
In Sundargarh district, the total number of beneficiaries covered under the NFSA is about 15 lakhs, which is about 72 per cent of the total population (See table 16: Beneficiaries under NFSA in Sundargarh district). In all mining-affected blocks the coverage is nearly on average 80-90 per cent. As per the beneficiary criteria the coverage in rural areas is particularly important, as 95 per cent of the rural households have highest earning heads getting below Rs. 10,000 per month. Moreover, under most Government pension schemes, such as the Indira Gandhi National Old Age Pension and the Indira Gandhi National Disability Pension, the coverage per beneficiary is only Rs. 300 per month.
Table 15: Status of infrastructure at AWCs in mining-affected areasBlock name Total
number of AWCs
AWCs with permanent structure
AWCs with drinking water
facility
AWCs with toilet facilities
Koida 167 115 167 50
Kutra NA* NA NA NA
Nuagaon 228 130 117 35
Lahunipara 250 194 250 56
Hemgir 214 153 90 87
Rajagangapur 267 198 267 150
Kuanrmunda 234 152 163 91
Gurundia 186 133 184 67
*Data not available Source: District Rural Development Department, Sundargarh
Indicative plan district mineral foundation, Sundergarh, Odisha report.indd 25 11/01/18 3:24 PM

26
Table 16: Beneficiaries under NFSA in Sundargarh districtBlock name/municipality No. of fair price shops No. beneficiaries
Koida 12 68,908
Kutra 16 70,187
Nuagaon 20 93,183
Lahunipara 17 80,412
Hemgir 19 64,017
Rajagangapur 12 92,357
Kuanrmunda 20 92,882
Gurundia 13 61,890
Balisankara 13 75,019
Bargaon 15 61,764
Biramitrapur (M) 6 21,323
Bisra 16 62,827
Bonaigarh 13 56,087
Lathikata 21 96,414
Lephripara 17 67,104
Rajagangapur (M) 9 31,722
Rourkela (M) 176 234,052
Subdega 14 55,054
Sundargarh 16 57,260
Sundargarh (M) 1 18,573
Tangarpali 13 52,684
Total 459 1,513,719
Source: NFSA database (December, 2017)
B. Gaps in nutrition and food security
The gaps or deficits with respect to nutrition related issues and supporting infrastructure in the mining- affected areas as identified from analysis of the official data shows deficits both in infrastructure as well as resources. The key deficits include:a. Inadequate number of AWCs as compared to the population to be served.b. AWCs not having a permanent structure.c. AWCs lacking toilet facilities.
a. Inadequate number of AWCs as compared to the population to be served As analyzed, on an average, AWCs are serving on average 1.5 times more than as per the prescribed norms, in all blocks (See table 17: Overall infrastructure gap in AWCs).
b. AWCs not having a permanent structureThe data also clearly reveals that not only the number of AWCs is of concern, but even in the existing ones do not have permanent structures. Overall about 30 per cent of the AWCs lack permanent structure.
Indicative plan district mineral foundation, Sundergarh, Odisha report.indd 26 11/01/18 3:24 PM

27
INDICATIVE PLAN DISTRICT MINERAL SUNDARGARH, ODISHA
c. AWCs lacking toilet facilitiesWith respect to availability of proper sanitation facilities, which are critical for children, about 30-40 per cent AWCs lack toilet facilities within premises.
Table 17: Overall infrastructure gap in AWCsBlock name Coverage
of children exceeding capacity
AWCs lacking permanent structure
(%)
AWCs lacking water facilities
(%)
AWCs lacking functional toilet
(%)
Koida 2.35 31.13 NA 70.05
Kutra NA NA NA NA
Nuagaon 1.5 42.98 48.68 84.64
Lahunipara 1.54 22.4 - 77.0
Hemgir 1.09 28.50 57.94 59.3
Rajagangapur 1.30 25.84 - 43.82
Kuanrmunda 1.47 35.04 30.34 61.11
Gurundia 1.33 28.49 1.07 63.97
NA:Data not available
3.1.3 Education
The education status of Sundargarh district, including the mining-affected areas has been reviewed on the basis of the following parameters:a. Status of literacy and level of education.b. Educational infrastructure- number of schools for various grades,
availability of basic amenities in schools-drinking water, toilets and electricity.
c. Enrollment and dropout at various education levels.d. Pupil teacher ratio (PTR).
Based on the situation on each of these, the overall gaps in the education sector have been identified.
A. Review of educational parameters
a. Status of literacy and level of educationThe literacy rate of Sundargarh district is 73.34 per cent, which is slightly above than the state’s average of 72.9 per cent28. Among the literate population, the male literacy (nearly 81 per cent) is better than the female literacy (about 65.48 per cent). However, for the marginalized sections the literacy rate is relatively poor. It is about 70.9 per cent for SC and about 65 per cent for ST populations (See table 18: Literacy in Sundargarh district). Among the mining-affected areas, Koida has the lowest proportion of literacy which is 57.3 per cent. In other mining-affected blocks also it is hovering around 60 per cent (See table 19: Block / municipality-wise literacy).
Indicative plan district mineral foundation, Sundergarh, Odisha report.indd 27 11/01/18 3:24 PM

28
Table 18: Literacy in Sundargarh districtCategory Total literates
(%)SC literates
(% )ST literates
(%)
Total 73.34 70.92 65.08
Male 81.01 79.75 73.98
Female 65.48 62.03 56.39
Source: Census of India (2011)
Table 19: Block/municipality-wise literacyBlock name/ municipality Literate population (%)
Koida 57.30
Kutra 68.76
Nuagaon 61.91
Lahunipara 58.96
Hemgir 74.59
Rajagangapur 66.51
Rajagangapur (M) 84.31
Kuanrmunda 65.65
Gurundia 63.39
Balisankara 67.53
Bargaon 69.30
Bisra 72.42
Bonaigarh 73.55
Lathikata 73.05
Lephripara 68.38
Subdega 69.03
Sundargarh 74.04
Sundargarh (M) 88.87
Biramitrapur(M) 78.12
Tangarpali 71.56
Rourkela (M+OG*) 86.59
Rourkela (ITS+OG) 85.61
M= municipality, OG= outer growth, ITS= industrial townshipSource: Adapted from Census of India (2011)
While the percentage of literate population is high, the education level that is required for securing a decent employment (such as at least higher secondary or graduate level education) is far from impressive.
For example, among the 20-39 years age group, which is the most employable age, while 77 per cent of the people are literate, about 14 per cent have completed higher secondary education, and slightly over 12 per cent have completed graduation (See table 20: Level of education in Sundargarh district).
Indicative plan district mineral foundation, Sundergarh, Odisha report.indd 28 11/01/18 3:25 PM

29
INDICATIVE PLAN DISTRICT MINERAL SUNDARGARH, ODISHA
Table 20: Level of education in Sundargarh districtAge group 18-19 20-39 40-59
Illiterates 12.77 22.66 41.36
Literates 87.22 77.33 58.63
Literates without education level 2.47 3.52 4.37
Below primary 6.48 8.47 14.41
Primary 20.02 20.17 14.74
Middle 21.86 20.87 15.67
Matric/Secondary 19.23 17.66 19.56
Higher Secondary 26.11 14.07 6.44
Graduate and above - 12.15 12.25
Source: Census of India (2011)
b. Educational infrastructureThe educational infrastructure has been evaluated with respect to some key infrastructural issues such as, number of schools of various grades (including schools for marginalized groups) and schools with basic amenities such as tap water supply, toilet facilities and electricity.
Number of schools for various grades: Official statistics show the presence of all levels of schools for elementary, secondary and higher secondary education29. However, the numbers of schools for various levels vary, with much higher proportion of elementary level schools as compared to secondary and higher secondary (See table 21: Distribution of schools).
In all blocks that are mining-affected, the number of schools providing elementary education (primary and upper primary levels) is considerably more than the number of secondary and higher secondary schools. During ground level interaction as well (Refer to section 4), most people pointed out the shortage of secondary and higher secondary schools (including their poor accessibility), often leading to drop-outs.
Beside the regular schools, there are some schools exclusively for SC/ST students in the district, including mining-affected blocks. These are called the sevashram schools which provide education from primary to class ten level30 (See table 22: Sevashram schools).
Availability of basic amenities in schools - drinking water, toilet, electricity: Guidelines under both Right to Education (RTE) Act (2009) and the Rashtriya Madhyamik Shiksha Abhiyan (RMSA) stipulate the need for infrastructure support to enhance access and provide quality education. Supporting infrastructure include, having toilets for boys and girls at all levels of education, availability of clean drinking water at premises and electricity supply in schools.
Indicative plan district mineral foundation, Sundergarh, Odisha report.indd 29 11/01/18 3:25 PM

30
Table 22: Sevashram SchoolsBlock name No. of sevashram schools
Koida 15
Kutra 5
Nuagaon 8
Lahunipara 10
Hemgiri 6
Rajagangapur 3
Kuanrmunda 9
Gurundia 4
Balisankara 5
Bargaon 10
Bisra 3
Bonai 7
Lathikata 3
Lephripara 7
Subdega 2
Sundargarh 1
Tangarpali 6
Total 103
Source: District Education Department, Sundargarh (2016-17)
Table 21: Distribution of schoolsBlock name/municipality
Pr. Pr.+ UP
Pr. + UP + Sec. + HS
UP Pr + UP+ Sec.
UP+Sec.
UP+ Sec. + HS
Sec Sec. + HS
HS Total
Koida 114 49 0 2 5 13 0 0 0 1 184
Kutra 72 33 0 10 9 14 0 1 1 3 142
Nuagaon 118 35 0 6 6 9 0 8 0 1 183
Lahunipara 127 60 0 5 7 1 1 15 0 3 219
Hemgir 98 56 2 4 9 10 0 5 0 3 186
Rajagangapur 99 23 0 10 6 9 2 3 0 1 153
Kuanrmunda 109 29 0 13 12 12 0 1 0 4 180
Gurundia 124 48 0 13 3 7 0 8 0 1 204
Balisankara 125 44 0 11 4 15 1 1 0 2 203
Bargaon 101 33 0 12 3 12 0 1 0 3 165
Biramitrapur (M) 12 10 0 1 3 3 0 0 0 2 31
Bisra 69 39 1 6 11 6 0 5 0 2 139
Bonaigarh 70 37 0 9 5 15 0 1 0 4 141
Lathikata 108 57 2 11 4 6 0 10 0 2 194
Lephripara 94 38 0 8 5 20 1 0 0 3 169
Rajagangapur (M) 14 18 0 1 4 6 0 2 0 1 46
Rourkela (M) 87 55 14 27 11 47 2 2 0 13 258
Subdega 82 30 0 6 5 10 0 4 0 2 139
Sundargarh 82 42 0 5 2 17 1 1 0 6 156
Sundargarh (M) 18 15 1 1 3 6 0 1 0 3 48
Tangarpali 79 39 0 4 4 12 0 0 0 3 140
Source: DISE Report (2015-16)
Indicative plan district mineral foundation, Sundergarh, Odisha report.indd 30 11/01/18 3:25 PM
31
INDICATIVE PLAN DISTRICT MINERAL SUNDARGARH, ODISHA
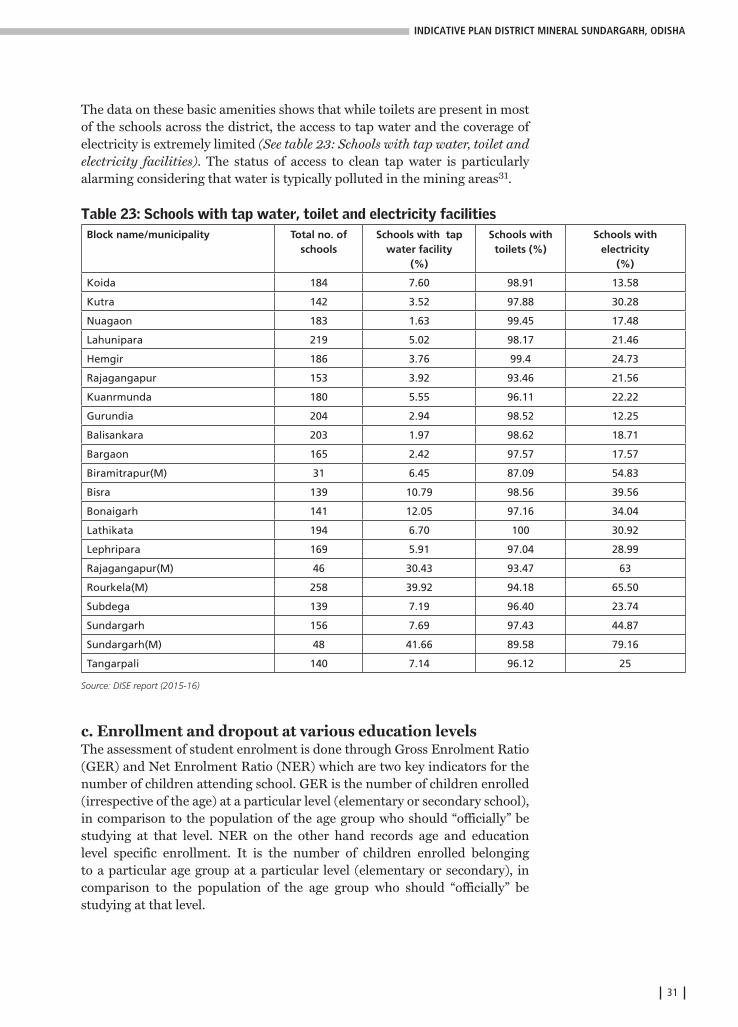
The data on these basic amenities shows that while toilets are present in most of the schools across the district, the access to tap water and the coverage of electricity is extremely limited (See table 23: Schools with tap water, toilet and electricity facilities). The status of access to clean tap water is particularly alarming considering that water is typically polluted in the mining areas31.
Table 23: Schools with tap water, toilet and electricity facilitiesBlock name/municipality Total no. of
schoolsSchools with tap
water facility(%)
Schools with toilets (%)
Schools withelectricity
(%)
Koida 184 7.60 98.91 13.58
Kutra 142 3.52 97.88 30.28
Nuagaon 183 1.63 99.45 17.48
Lahunipara 219 5.02 98.17 21.46
Hemgir 186 3.76 99.4 24.73
Rajagangapur 153 3.92 93.46 21.56
Kuanrmunda 180 5.55 96.11 22.22
Gurundia 204 2.94 98.52 12.25
Balisankara 203 1.97 98.62 18.71
Bargaon 165 2.42 97.57 17.57
Biramitrapur(M) 31 6.45 87.09 54.83
Bisra 139 10.79 98.56 39.56
Bonaigarh 141 12.05 97.16 34.04
Lathikata 194 6.70 100 30.92
Lephripara 169 5.91 97.04 28.99
Rajagangapur(M) 46 30.43 93.47 63
Rourkela(M) 258 39.92 94.18 65.50
Subdega 139 7.19 96.40 23.74
Sundargarh 156 7.69 97.43 44.87
Sundargarh(M) 48 41.66 89.58 79.16
Tangarpali 140 7.14 96.12 25
Source: DISE report (2015-16)
c. Enrollment and dropout at various education levelsThe assessment of student enrolment is done through Gross Enrolment Ratio (GER) and Net Enrolment Ratio (NER) which are two key indicators for the number of children attending school. GER is the number of children enrolled (irrespective of the age) at a particular level (elementary or secondary school), in comparison to the population of the age group who should “officially” be studying at that level. NER on the other hand records age and education level specific enrollment. It is the number of children enrolled belonging to a particular age group at a particular level (elementary or secondary), in comparison to the population of the age group who should “officially” be studying at that level.
Indicative plan district mineral foundation, Sundergarh, Odisha report.indd 31 11/01/18 3:25 PM

32
As per information made available by district officials and reports, the GER at elementary level is about 97 per cent, while NER is about 91.6 per cent. The dropout rate is around 2.4 per cent32.
However, the indicators are not satisfactory at the secondary level when compared to elementary levels. The GER at the secondary level is about 77.7 per cent, while NER is about 68 per cent. Not only enrollment drops by nearly 25 per cent, the dropout rate at this level also increases, which is about 3.5 per cent (See table 24: Enrollment and dropout at elementary and secondary levels).
Table 24: Enrollment and dropout rate at elementary and secondary levelsEducation indicators Elementary level Secondary level
GER 97.02 77.65
NER 91.57 68.20
Dropout rate 2.41 3.46
Source: OPEPA (2015-16)
The problem has also been captured through FGDs and SSI (Refer to section 4). Interactions with the community suggests that distance to schools, poor quality of education, shortage of teachers, as well as financial situation of the family are big contributors to lower proportions of enrollment and dropouts in secondary levels. This also indicates that there is a serious deficit in creating an educated workforce for procuring decent employment and livelihood opportunities.
d. Pupil Teacher RatioPupil teacher ratio (PTR) is described as average number of pupils/students per teacher at a given level of education, based on headcounts of both pupils and teachers33. As per standards (RTE for elementary and RMSA for secondary), the PTR for primary level should not exceed 30:1, for upper primary 35:1 and for secondary level 30:1.
For the purpose of this analysis, PTR of 30:1 has been taken as a uniform benchmark for both elementary and secondary education. The availability of adequate teachers at various grades vary significantly. (See table 25: Status of PTR at elementary, secondary and higher secondary schools).
B. Gaps in the education sector
The gaps or deficits in the education sector in Sundargarh district as identified from analysis of the official data shows deficits in both infrastructure as well as resources. The key deficits include:a. Inadequate number of secondary and higher secondary schools.b. Inadequate teachers in schools, particularly at secondary and higher
secondary levels.c. Lack of clean drinking water (tap water) and electricity in schools.d. Lower enrollment in secondary schools as compared to elementary levels.
Indicative plan district mineral foundation, Sundergarh, Odisha report.indd 32 11/01/18 3:25 PM

33
INDICATIVE PLAN DISTRICT MINERAL SUNDARGARH, ODISHA
Table 25: Status of PTR at elementary, secondary and higher secondary schoolsBlock name/municipality
Elementary schools with PTR< 30
(%)
Secondary schools with PTR< 30
(%)
Higher secondary schools with PTR< 30
(%)
Koida 71 61 Nil
Kutra 73 56 Nil
Nuagaon 78 70 Nil
Lahunipara 83 88 50
Hemgir 88 58 Nil
Rajagangapur 70 50 33
Kuanrmunda 66 24 25
Gurundia 89 88 Nil
Balisankara 85 61 Nil
Bargaon 91 69 Nil
Biramitrapur(M) 62 33 Nil
Bisra 85 61 Nil
Bonaigarh 91 76 Nil
Lathikata 82 55 Nil
Lephripara 83 58 Nil
Rajagangapur(M) 49 33 Nil
Rourkela(M) 62 54 17
Subdega 86 68 Nil
Sundargarh 95 86 43
Sundargarh(M) 52 45 25
Tangarpali 95 73 Nil
Source: DISE Report (2015-16)
a. Inadequate number of secondary and higher secondary schoolsThe comparative account between facilities providing elementary education versus facilities providing secondary and higher secondary education clearly shows that secondary and higher secondary schools are much less (See table 26: Comparison of educational facilities offering various grades of education). In most areas, including mining-affected areas, the number of secondary schooling facilities is only 10 to 20 per cent of elementary education facilities. For higher secondary it is further low, as low as two to three per cent. The shortage is also heavily emphasized by the members of the community as well as district officials during ground interactions (Refer to section 4).
b. Inadequate teachers in schools, particularly at secondary and higher secondary levelsThere is a dearth of teachers across the district when it comes to secondary and higher secondary level education. In mining-affected areas, nearly 35 per cent of secondary level institutions do not have the required number of teacher, i.e., not fulfilling the required PTR of 30:1 as stipulated under RMSA (See table 27: Deficits in human resources).
Indicative plan district mineral foundation, Sundergarh, Odisha report.indd 33 11/01/18 3:25 PM

34
Table 26: Comparison of educational facilities offering various grades of educationBlock name/municipality Elementary Secondary Higher secondary
Koida 183 18 1
Kutra 138 25 4
Nuagaon 174 23 1
Lahunipara 201 24 4
Hemgir 179 26 5
Rajagangapur 149 20 3
Kuanrmunda 175 25 4
Gurundia 195 18 1
Balisankara 200 21 3
Bargaon 161 16 3
Biramitrapur (M) 29 6 2
Bisra 132 23 3
Bonaigarh 136 21 4
Lathikata 188 22 4
Lephripara 166 26 4
Subdega 133 19 2
Sundargarh 149 21 7
Tangarpali 137 15 3
Rajagangapur (M) 43 12 1
Rourkela (M) 243 76 29
Sundargarh (M) 44 11 4
Source: DISE Report (2015-16)
Table 27: Deficits in human resourcesBlock name/municipality
Elementary schools with PTR >30 (%)
Secondary schools with PTR >30 (%)
Higher secondary schools with PTR >30 (%)
Koida 29 39 Nil
Kutra 27 44 Nil
Nuagaon 22 30 Nil
Lahunipara 17 12 50
Hemgir 12 42 Nil
Rajagangapur 30 50 67
Kuanrmunda 34 76 75
Gurundia 11 12 Nil
Balisankara 34 76 75
Bargaon 27 44 Nil
Biramitrapur (M) 17 12 50
Bisra 18 45 Nil
Bonaigarh 17 42 Nil
Lathikata 18 45 Nil
Lephripara 17 42 Nil
Subdega 14 32 Nil
Sundargarh 5 14 57
Indicative plan district mineral foundation, Sundergarh, Odisha report.indd 34 11/01/18 3:25 PM

35
INDICATIVE PLAN DISTRICT MINERAL SUNDARGARH, ODISHA
Tangarpali 5 27 Nil
Rajagangapur (M) 51 67 Nil
Rourkela (M) 38 46 83
Sundargarh (M) 48 55 75
Source: DISE Report (2015-16)
Table 28: Deficit in basic amenities in schoolsBlock name/municipality Schools without tap water
(%)Schools without electricity
(%)
Koida 92.4 86.42
Kutra 96.48 69.72
Nuagaon 98.37 82.52
Lahunipara 94.98 78.54
Hemgir 96.24 75.27
Rajagangapur 96.08 78.44
Kuanrmunda 94.45 77.78
Gurundia 97.06 87.75
Balisankara 98.03 81.29
Bargaon 97.58 82.43
Biramitrapur (M) 93.55 45.17
Bisra 89.21 60.44
Bonaigarh 87.95 65.96
Lathikata 93.3 69.08
Lephripara 94.09 71.01
Subdega 92.81 76.26
Sundargarh 92.31 55.13
Tangarpali 92.86 75
Rajagangapur (M) 69.57 27
Rourkela (M) 60.08 34.5
Sundargarh (M) 58.34 20.84
Source: DISE Report (2015-16)
c. Lack of clean drinking water (tap water) and electricity in schoolsTap water availability in schools is one of the most severe infrastructure deficits all across the district. In most of the mining-affected areas around 95 per cent schools lack tap water facility.
The other deficit is with respect to electricity access. In mining-affected areas such as Koida and Gurundia, Lahunipara etc., categorically around 80 per cent of schools (or more in certain areas) do not have electricity (See table 28: Deficit in basic amenities in schools).
Indicative plan district mineral foundation, Sundergarh, Odisha report.indd 35 11/01/18 3:25 PM
36
d. Lower enrollment in secondary level schools as compared to elementary level Analysis of the enrolment data for the district shows a clear drop in enrollment for secondary level education as compared to elementary. The GER at secondary level drops by nearly twenty per cent more as compared to elementary levels. The dropout also increases simultaneously at secondary level as indicated earlier.
3.2 Employment and Livelihood
Employment and livelihood is a key factor that is often related to the well-being of a population. A significant population being engaged in secure and safe livelihood is therefore important. In Sundargarh district, the employment and livelihood situation has been analyzed on basis of the following:a. Distribution of population employment wise.b. Income distribution.c. Key sources of employment and livelihood.d. Intervention through other schemes to ensure livelihoods- Mahatma
Gandhi National Rural Employment Guarantee Scheme (MGNREGS), Self Help Groups (SHGs) as promoted under National Rural Livelihoods Mission (NRLM).
A. Review of employment and livelihood parameters
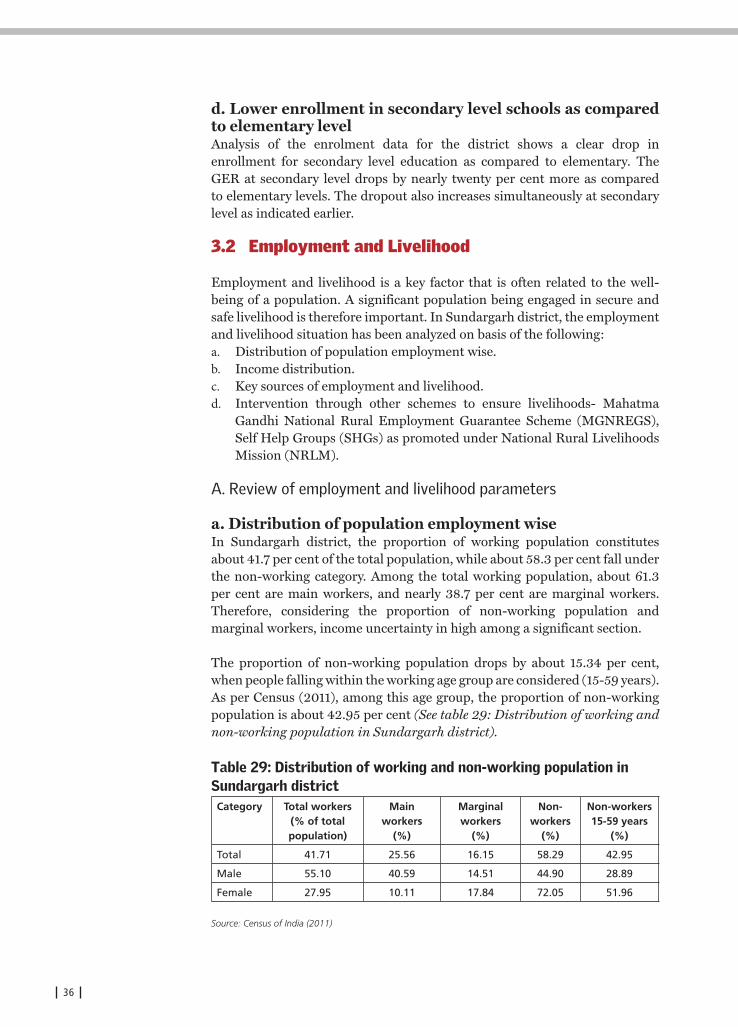
a. Distribution of population employment wiseIn Sundargarh district, the proportion of working population constitutes about 41.7 per cent of the total population, while about 58.3 per cent fall under the non-working category. Among the total working population, about 61.3 per cent are main workers, and nearly 38.7 per cent are marginal workers. Therefore, considering the proportion of non-working population and marginal workers, income uncertainty in high among a significant section.
The proportion of non-working population drops by about 15.34 per cent, when people falling within the working age group are considered (15-59 years). As per Census (2011), among this age group, the proportion of non-working population is about 42.95 per cent (See table 29: Distribution of working and non-working population in Sundargarh district).
Table 29: Distribution of working and non-working population in Sundargarh districtCategory Total workers
(% of total population)
Main workers
(%)
Marginal workers
(%)
Non-workers
(%)
Non-workers 15-59 years
(%)
Total 41.71 25.56 16.15 58.29 42.95
Male 55.10 40.59 14.51 44.90 28.89
Female 27.95 10.11 17.84 72.05 51.96
Source: Census of India (2011)
Indicative plan district mineral foundation, Sundergarh, Odisha report.indd 36 11/01/18 3:25 PM
37
INDICATIVE PLAN DISTRICT MINERAL SUNDARGARH, ODISHA
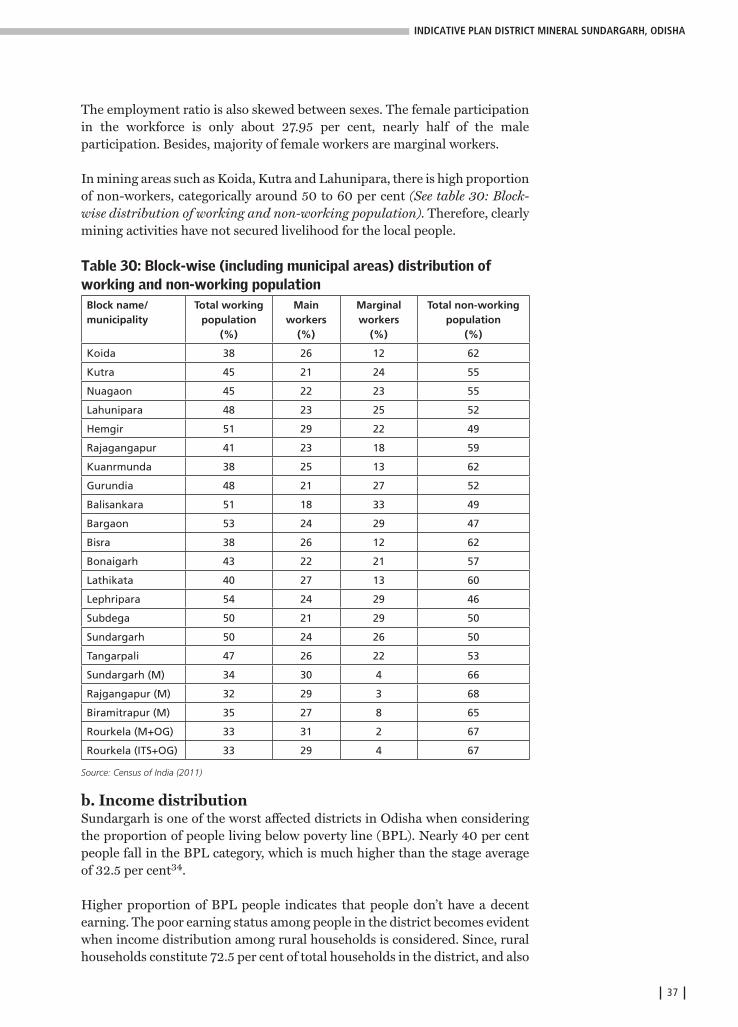
The employment ratio is also skewed between sexes. The female participation in the workforce is only about 27.95 per cent, nearly half of the male participation. Besides, majority of female workers are marginal workers.
In mining areas such as Koida, Kutra and Lahunipara, there is high proportion of non-workers, categorically around 50 to 60 per cent (See table 30: Block-wise distribution of working and non-working population). Therefore, clearly mining activities have not secured livelihood for the local people.
Table 30: Block-wise (including municipal areas) distribution of working and non-working populationBlock name/municipality
Total working population
(%)
Main workers
(%)
Marginal workers
(%)
Total non-working population
(%)
Koida 38 26 12 62
Kutra 45 21 24 55
Nuagaon 45 22 23 55
Lahunipara 48 23 25 52
Hemgir 51 29 22 49
Rajagangapur 41 23 18 59
Kuanrmunda 38 25 13 62
Gurundia 48 21 27 52
Balisankara 51 18 33 49
Bargaon 53 24 29 47
Bisra 38 26 12 62
Bonaigarh 43 22 21 57
Lathikata 40 27 13 60
Lephripara 54 24 29 46
Subdega 50 21 29 50
Sundargarh 50 24 26 50
Tangarpali 47 26 22 53
Sundargarh (M) 34 30 4 66
Rajgangapur (M) 32 29 3 68
Biramitrapur (M) 35 27 8 65
Rourkela (M+OG) 33 31 2 67
Rourkela (ITS+OG) 33 29 4 67
Source: Census of India (2011)
b. Income distributionSundargarh is one of the worst affected districts in Odisha when considering the proportion of people living below poverty line (BPL). Nearly 40 per cent people fall in the BPL category, which is much higher than the stage average of 32.5 per cent34.
Higher proportion of BPL people indicates that people don’t have a decent earning. The poor earning status among people in the district becomes evident when income distribution among rural households is considered. Since, rural households constitute 72.5 per cent of total households in the district, and also
Indicative plan district mineral foundation, Sundergarh, Odisha report.indd 37 11/01/18 3:25 PM

38
reflect a major proportion of mining-affected people, therefore for this study the income distribution among this population (as per data of SECC of 2011) has been reviewed.
In rural areas, about 89.8 per cent of households have the highest earning head with earning less than Rs. 5000 per month, which is extremely low (See table 31: Income distribution in rural areas of Sundargarh district). Further, a majority of the rural households (53.11 per cent) are dependent on manual or casual labor for earning a living, reflecting income uncertainty and instability (See table 32: Main sources of income for households in rural areas in Sundargarh district). Therefore, securing a stable and decent livelihood for people, especially for tribals and other marginalized sections in the rural areas is of utmost importance.
Table 31: Income distribution in rural areas of Sundargarh districtIncome/ Earnings Proportion of households earning
(with highest earning heads )(%)
Earning less than Rs. 5,000 per month 89.81
Earning Rs. 5,000 to Rs. 10,000 per month 5.34
Earning more than Rs. 10,000 per month 4.79
With salaried job 7.62
Source: Socio Economic Caste Census (2011)
Table 32: Main sources of income for households in rural areas of Sundargarh districtMain sources of income Proportion of dependent households (%)
Cultivation 30.43
Manual/casual labor 53.11
Domestic service, part time/ full time 2.10
Non-agricultural own account enterprise 0.75
Begging/alms collection/charity support 0.33
Foraging/rag picking 0.21
Other (unspecified) sources 13.01
Source: Socio Economic Caste Census (2011)
c. Key sources of employment and livelihoodConsidering sector-wise distribution of the working population, especifically main workers, it can be seen that there is a clear distinction between predominantly rural areas of the districts and areas with municipalities and urban population.
In areas with considerable proportion of urban population such as Rourkela, Rajagangapur and Biramitrapur, a majority of the main workers fall under the “other workers” category, in Rourkela it is as high as 96 per cent. This category includes employments related to construction, mining, trade, government workers teachers etc.
Indicative plan district mineral foundation, Sundergarh, Odisha report.indd 38 11/01/18 3:25 PM
39
INDICATIVE PLAN DISTRICT MINERAL SUNDARGARH, ODISHA
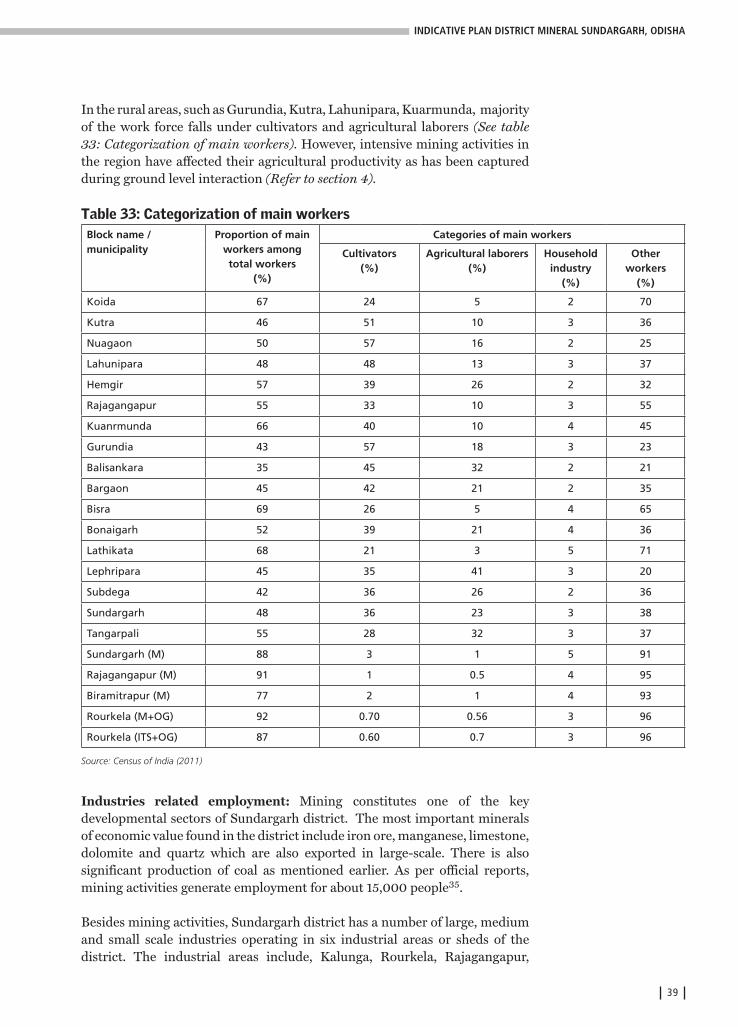
In the rural areas, such as Gurundia, Kutra, Lahunipara, Kuarmunda, majority of the work force falls under cultivators and agricultural laborers (See table 33: Categorization of main workers). However, intensive mining activities in the region have affected their agricultural productivity as has been captured during ground level interaction (Refer to section 4).
Table 33: Categorization of main workersBlock name / municipality
Proportion of main workers among total workers
(%)
Categories of main workers
Cultivators(%)
Agricultural laborers(%)
Household industry
(%)
Other workers
(%)
Koida 67 24 5 2 70
Kutra 46 51 10 3 36
Nuagaon 50 57 16 2 25
Lahunipara 48 48 13 3 37
Hemgir 57 39 26 2 32
Rajagangapur 55 33 10 3 55
Kuanrmunda 66 40 10 4 45
Gurundia 43 57 18 3 23
Balisankara 35 45 32 2 21
Bargaon 45 42 21 2 35
Bisra 69 26 5 4 65
Bonaigarh 52 39 21 4 36
Lathikata 68 21 3 5 71
Lephripara 45 35 41 3 20
Subdega 42 36 26 2 36
Sundargarh 48 36 23 3 38
Tangarpali 55 28 32 3 37
Sundargarh (M) 88 3 1 5 91
Rajagangapur (M) 91 1 0.5 4 95
Biramitrapur (M) 77 2 1 4 93
Rourkela (M+OG) 92 0.70 0.56 3 96
Rourkela (ITS+OG) 87 0.60 0.7 3 96
Source: Census of India (2011)
Industries related employment: Mining constitutes one of the key developmental sectors of Sundargarh district. The most important minerals of economic value found in the district include iron ore, manganese, limestone, dolomite and quartz which are also exported in large-scale. There is also significant production of coal as mentioned earlier. As per official reports, mining activities generate employment for about 15,000 people35.
Besides mining activities, Sundargarh district has a number of large, medium and small scale industries operating in six industrial areas or sheds of the district. The industrial areas include, Kalunga, Rourkela, Rajagangapur,
Indicative plan district mineral foundation, Sundergarh, Odisha report.indd 39 11/01/18 3:25 PM

40
Mandiakudar, Sundergarh and commercial estate. Major industries include iron and steel, sponge iron, cement and refractory. Some of the key industrial players in the district are Rourkela Steel Plant Limited, OCL Iron and Steel Limited, OCL India Limited, Rungta Mines Limited, Jindal Steel and Power Limited, IFGL Refractories Limited and Adhunik Metalliks Limited.
Besides these industries, there are various micro and small scale enterprises in the district. This category include enterprises and manufactures related to food and allied, chemical, metal based, ceramics, textile, various repairing and services etc. (See table 34: Micro and small scale industries and employment).
Table 34: Micro and small scale industries and employment
Types of Industry No. of units No. of people employed
Food and allied 2,093 7,984
Chemical and allied 301 3,107
Engineering and metal based 2,432 28,921
Miscellaneous manufacturing 880 5,653
Glass and ceramics 704 18,877
Forest and wood based 311 1,993
Paper and paper products 313 1,972
Textile 442 2,176
Rubber and plastics 219 1,628
Electrical and electronics 191 1,223
Livestock and leather 52 254
Repairing and servicing 8,168 29,732
Total 16,106 103,520
Source: Department of MSME Report (2016-17)
Forest-based livelihood: The landscape of Sundargarh district is dominated by forest area followed by agricultural land. These two therefore constitute an important resource for sustainable livelihood opportunities for local people (See table 35: Distribution of main land use pattern)36.
In Sundargarh, more than 51 per cent of the total land area is forest, which is about 496,000 ha. The district has three forest divisions, Bonai (about 202,830 ha forest areas), Sundargarh (185,339 ha) and Rourkela (107, 563 ha). Gurundia block has the highest land area under forest which is more than 80 per cent. In other mining-blocks such as Kuarmunda and Koida, the forest area is around 45 to 50 per cent.
Sal is the main tree species in the area. Besides timber (from sal, asan and bija), bamboo and kendu leaves are the principal forest products of the district. Minor forest products like siali leaves, myobalance, char, seeds, kusum seeds, sunari bark, honey, lac, sabai grass, mahua flowers and mahua seeds are important sources of income for the tribals and other people living around the forest areas37.
Indicative plan district mineral foundation, Sundergarh, Odisha report.indd 40 11/01/18 3:25 PM

41
INDICATIVE PLAN DISTRICT MINERAL SUNDARGARH, ODISHA
While, forest based resources are potentially a key source of livelihood for a very significant part of the population, the enumeration of livelihoods based on forest resources is poor. The poor status can be owed to the extremely poor settlement of forest rights under the provisions of Forest Rights Act (FRA, 2006). As per information obtained at the time of research, under community forest rights (CFR) no CFR titles in the entire Sundargarh district have been given so far (till April, 2017). The claims considered are also extremely low, which is only 20 as per available information38.
Table 35: Distribution of main land use patternBlock name Net sown area
(%)Forest area
(%)Wasteland area
(%)
Koida 18 48 6
Kutra 61 12 6
Nuagaon 71 6 5
Lahunipara 25 51 4
Hemgir 21 56 1
Rajagangapur 54 18 6
Kuanrmunda 39 44 7
Gurundia 13 81 2
Balisankara 17 70 6
Bargaon 46 13 3
Bisra 42 30 2
Bonaigarh 63 14 6
Lathikata 33 17 1
Lephripara 25 63 3
Subdega 51 33 12
Sundargarh 53 24 3
Tangarpali 69 8 4
Source: District Irrigation Plan of Sundargarh, Odisha (March, 2016)
The FRA recognizes and emphasizes community-based governance of forests. The Act specifically provides for the recognition of forestlands as community forest resource areas and exercising community rights over it. This offers two crucial benefits for the forest-dwelling communities. First it gives communities the right to manage forest resources, and secondly to secure livelihoods from such resources. However, the success remains far away from the potential due to poor settlement of rights.
The recognition of CFR rights have enormous potential for decentralized management of forest resources and improvement of ecological and economic services in CFR areas, contributing to well-being of communities. If CFR is awarded appropriately to forest communities, they would be entitled for better management of forest resources for productive use, support from the government in terms value addition for their products, improved market linkages and get better pricing for their products etc.
Indicative plan district mineral foundation, Sundergarh, Odisha report.indd 41 11/01/18 3:25 PM

42
The settlement of rights under individual forest rights (IFR) as per available data is better. Of the total claims received till April 2017, about 94 per cent has been settled . The settlement of rights under IFR provides communities the opportunity to avail agricultural subsidies, loans and other schemes for development of their agricultural lands (See table 36: Settlement of individual and community forest rights in Sundargarh district).
Table 36: Settlement of individual and community forest rights in Sundargarh districtItems IFR CFR
No. of claims received by the District Level Committee under FRA ( as of 30 April 2017) 22,140 20
No. of title deeds issued by the District Level Committee under FRA (as of 30 April 2017) 20,940 0
Source: District Forest Department, Sundargarh, and Ministry of Tribal Affairs (April, 2017)
Also if the implementation of CFR and IFR is converged with other government schemes and worked upon properly, the economic conditions of tribals and people who are dependent on and derive livelihoods from forest resources can change significantly.
Agriculture related livelihood: In Sundargarh district overall, more than 29 per cent of the land area comes under net sown area. In many of the rural parts of the district, including in some of the mining-affected blocks such as Kutra and Nuagaon, net sown area is around 60 to 70 per cent. Paddy is the main cultivated crop of the district, besides various types of pulses and oil seeds.
A significant proportion of the district’s population, particularly in the rural areas, is dependent on agriculture for livelihoods. According to the state agricultural statistics, nearly 64.5 per cent of the total households in the district constitute farm households. However, out of them majority are marginal farmers, which are more than 52 per cent of the total farm households. The average operational land holding of marginal farmers is only about 0.59 ha. Besides, marginal farmers, small farmers with average 1.43 ha of land holding constitute about 30.9 per cent of the total farm households. Besides these two categories there are 13.4 percent semi-medium farm households, three per cent medium farm households and only 0.25 per cent large farm households39.
Agriculture and the allied activities is significantly less in major mining-affected areas such as Koida. Also in Kutra and Nuagoan, which are significantly affected, the potential for agriculture based livelihoods is not properly realized due to concerns of water availability, pollution etc. However, in sparsely mining-affected blocks such as Gurundia agriculture is a major source of livelihood for many, where 57 per cent of main workers are cultivators and additional 18 per cent are agricultural laborers.
Indicative plan district mineral foundation, Sundergarh, Odisha report.indd 42 11/01/18 3:25 PM

43
INDICATIVE PLAN DISTRICT MINERAL SUNDARGARH, ODISHA
d. Intervention through other schemes to ensure livelihoodsThe MGNREGS is aimed at improving livelihood security of the rural and ensure wage employment of at least 100 days per household annually. In the district MGNREGS has not been very successful in securing wage employment in the mining-affected areas. The viability of this scheme has not achieved to its full potential due to a variety of reasons. These include, availability of land in the mining areas, sufficient work, availability of work as per skills of people, accessibility/ distance to work, timely payment of wages etc.
In mining-affected areas such as Koida and Lahunipara only a fraction of the households who had taken up work under MGNREGS have completed 100 days of wage employment. The proportion is about two per cent of households in Lahunipara and one per cent in Koida (See table 37: Average days of employment generated and completed under MGNREGS).
However, the kinds of work taken up under MGNREGS if envisioned well, and converged with the prospects of other schemes, can create better earning opportunities and also create sustainable assets. For example, in rural areas, drinking water projects can be a key area to focus on. Also increasing scope of micro irrigation works, food grain storage etc., can help to secure agriculture-based livelihoods in these areas.
Table 37: Average days of employment generated and completed under MGNREGSBlock name Average days
of employment generated
Total no. of households worked
Total no. of households completed 100 days of wage
employment
Koida 42 5,037 57
Kutra 45 7,372 41
Nuagaon 38 11,843 269
Lahunipara 47 9,089 225
Hemgir 51 8,801 760
Rajagangapur 39 7,563 180
Kuanrmunda 44 10,114 269
Gurundia 45 7,604 268
Balisankara 47 9,637 282
Bargaon 47 7,340 299
Bisra 48 6,540 275
Bonaigarh 48 9,860 317
Lathikata 45 7,665 237
Lephripara 40 7,177 133
Subdega 46 6,944 181
Sundargarh 51 7,323 250
Tangarpali 49 7,725 188
Source: MGNREGA MIS report (2016-17)
The NRLM aims at reducing rural poverty by enabling poor households to access gainful self-employment and skilled wage employment opportunities
Indicative plan district mineral foundation, Sundergarh, Odisha report.indd 43 11/01/18 3:25 PM

44
through women SHGs. The mission has been designed to bring about a sustainable improvement in the livelihoods of the poor through building strong community institutions. A central objective of the mission is to establish efficient and effective institutional platforms of the rural poor that can enable them to increase household incomes through livelihood enhancements and improved access to financial and public services.
In Sundargarh district, latest (as of November, 2017) official data shows that there are about 15,020 women SHGs in the district. The engagement of women population in the rural areas in these SHGs varies between 559 to over 1426 in various blocks. In the mining-affected areas such as Kutra, Gurundia, Lahunipara, Kuarmunda, about 20 to 30 per cent of women in rural areas are engaged in these SHGs (See table 38: SHGs in various blocks in Sundargarh district). As per official information available from the district, most of the women SHGs have bank linkages.
Table 38: SHGs in various blocks in Sundargarh districtBlock name Total No of
SHGsTotal No of members
Female rural population
SHG members (%)
Koida 559 5,733 37,660 15
Kutra 880 9,735 40,090 24
Nuagaon 786 8,431 53,426 16
Lahunipara 1,009 10,626 50,016 21
Hemgir 692 7,470 41,889 18
Rajagangapur 1,132 9,908 47,773 21
Kuanrmunda 1,426 15,029 49,022 31
Gurundia 708 7,515 33,801 22
Balisankara 1,334 14,405 43,603 33
Bargaon 788 8,596 35,643 24
Bisra 686 7,177 34,321 21
Bonaigarh 1157 12,564 31,780 40
Lathikata 585 6,628 41, 000 16
Lephripara 697 7,557 39,354 19
Subdega 763 8,097 32,303 25
Sundargarh 638 6,856 35,388 19
Tangarpali 1,180 12,321 32,203 38
Source: NRLM database (November 2017) and Census of India (2011)
B. Gaps in employment and livelihood
Considering the overall employment situation and livelihood opportunities in the district, the following outstanding issues emerge which needs attention:a. About 43 per cent of people within the working age-group are non-
workers.b. Earnings are very low in rural areas; about 89.9 per cent of households
have the highest earning head with earning less than Rs. 5,000 per
Indicative plan district mineral foundation, Sundergarh, Odisha report.indd 44 11/01/18 3:25 PM

45
INDICATIVE PLAN DISTRICT MINERAL SUNDARGARH, ODISHA
month. Income insecurity is also high, about 53 per cent rural households are dependent on manual or casual labor.
c. Opportunities of livelihood enhancement around local resources undermined, particularly forest and agriculture based.
d. Rural livelihood schemes (MGNREGS) ineffective in enhancing earnings, engagement of women in rural livelihood schemes such as women SHGs far lower than the potential.
All of this together contributes to insecurity in employment and livelihood, particularly for the poor and vulnerable sections of the society.
2.2 Public Amenities and infrastructure
The status of basic public amenities in Sundargarh district, and particularly the mining-affected blocks has been reviewed on the basis of the following key parameters: a. Access of households to clean drinking water.b. Sanitation/ latrine facilities.c. Electricity access.d. Road connectivity.
The data of all these parameters has been reviewed sub-district wise, as available from the Census of India (2011). Additional information as made available by district officials has also been taken into account. Based on the situation on each of these, the overall gaps in basic amenities have been identified.
A. Review of public amenities and infrastructure
a. Access of households to clean drinking waterAvailability of clean drinking water is a major challenge in the district, particularly in the mining areas. Given the high levels of pollution, only treated tap water/treated piped water supply can be assumed to be relatively safe. However, most of the households rely heavily on untreated groundwater sourced through hand pumps or uncovered wells. This is particularly true for all rural areas including the mining-affected areas.
In rural areas of the district, on an average 2.6 per cent of households have access to treated tap water. Among mining-affected areas, the proportion is a mere 0.2 per cent in Gurundia, in Kutra it is only 1.3 per cent (See table 39: Households by main source of drinking water). Additionally, the coverage of households through piped water supply over the years has also been far from satisfactory in the district, including mining-affected areas, under Government schemes (See table 40:Households with piped water supply).
b. Sanitation/ latrine facilitiesOpen defecation has been observed to be very high particularly in the rural areas of Sundargarh district (See table 41: Households by type of latrine facility). As per Census of India (2011), more than 90 per cent of the rural households defecate in open.
Indicative plan district mineral foundation, Sundergarh, Odisha report.indd 45 11/01/18 3:25 PM

46
However, there has been some progress in the district for making villages and towns open defecation free (ODF) through funds available under Swachh Bharat Mission (SBM). As per latest statistics of GOI, the district has managed to construct household toilets for nearly 57.5 per cent households.40
However, it can be said with little certainty that the situation has improved in many of the mining-affected blocks. The responses of communities as captured
Table 39: Households by main source of drinking waterSub District Tap water from
treated source(%)
Tap water from
untreated source (%)
Covered wells(%)
Un- covered wells (%)
Hand pumps (%)
Tube wells/
bore holes (%)
Others (%)
Hemgir 3.48 8.27 0.9 30.53 40.93 10.44 5.45
Lephripada 1.66 4.32 3.06 14.74 59.6 11.46 5.16
Bhamsa 2.45 2.35 2.14 10.26 57.09 24.39 1.32
Daraudihi 6.06 3.14 0.47 15.98 60.79 12.5 1.06
Sundargarh Town 39 1.28 8.35 20.04 8.62 21.29 1.42
Sundargarh 2.12 1.81 2.04 17.55 55.17 17.91 3.4
Kinjirkela 0.42 0.29 0.71 29.36 55.97 7.39 5.86
Talsara 4.27 0.59 0.62 23.4 49.71 16.46 4.95
Badagaon 1.01 3.77 1.14 16.46 61.24 15 1.38
Kutra 1.31 2.9 1.05 25.06 45.34 22.6 1.74
Rajagangapur 11.72 1.45 1.42 17.91 45.45 19.79 2.26
Raiboga 0.32 1.95 1.72 30.81 32.65 27.8 4.75
Biramitrapur 9.61 1.52 1.67 25.81 19.98 38.02 3.39
Hatibadi 1.46 0.4 3.13 44.09 30.74 15.21 4.97
Bisra 3.17 2.23 3.03 29.43 38.23 20.25 3.66
Bondamunda 5.87 2.3 6.6 13.44 37.71 33.24 0.84
Bramhini 2.35 0.94 2.22 23.54 20.47 47.23 3.25
Raghunathpalli 1.98 0.4 2.14 10.73 29.69 54.53 0.53
Tangarpali 0.6 0.17 2.32 21.34 21.94 52.41 1.22
Lathikata 9.33 0.4 2.82 15.02 25.11 44.28 3.04
Chandiposh 0.8 0.09 1.45 21.62 34.69 30.39 10.96
Kamarposh 0.54 0.23 1.47 24.17 44.76 15.84 12.99
Koida 9.65 3.31 2.99 27.33 6.69 14 36.03
Lahunipada 10.49 1.46 0.79 6.72 43.29 23.9 13.35
Gurundia 0.2 0.19 1.23 37.17 15.15 38.68 7.38
Tiketpali 0.18 0.37 2.14 10.8 62.13 20.38 4
Banei 3.44 4.74 0.84 6.76 44.06 37.5 2.66
Mahulapada 1.14 1.3 1.39 16.92 22.07 30.18 27
Rourkela (M) 47.31 4.25 4.02 5.09 15.29 23.24 0.8
Rourkela 59.87 3.83 1.93 8.99 9.78 14.5 1.1
Source: Census of India, 2011
Indicative plan district mineral foundation, Sundergarh, Odisha report.indd 46 11/01/18 3:25 PM

47
INDICATIVE PLAN DISTRICT MINERAL SUNDARGARH, ODISHA
through FGDs and ground interactions has typically brought out that a high percentage of households in the mining-affected areas either do not have toilets. In many cases, where toilets have been built they are not functional as these facilities do not have the required water supply and proper drainage systems, preventing people from using such facilities (Refer to section 4).
Table 40: Households with piped water supplyBlock name Total no. of
householdNo. of household covered
by piped waterCoverage
(%)
Koida 17,799 2,325 13.1
Kutra 17,336 4,928 28.4
Nuagaon 22,746 4,730 20.8
Lahunipara 22,602 5,043 22.3
Hemgir 20,601 8,167 39.6
Rajagangapur 20,844 3,174 15.2
Kuanrmunda 22,216 7,025 31.6
Gurundia 14,051 3,308 23.5
Balisankara 20,787 4,068 19.6
Bargaon 16,432 7,254 44.2
Bisra 14,218 4,929 34.7
Boneigarh 16,235 6,237 38.4
Lathikata 18,479 3,867 20.9
Lephripara 18,813 5,494 29.2
Subdega 15,538 4,268 27.5
Sundargarh sadar 17,369 5,184 29.9
Tangarpali 16,250 8,007 49.3
Total 312,316 88,008 28.2
Source: Department of Drinking Water and Sanitation (2017)
Indicative plan district mineral foundation, Sundergarh, Odisha report.indd 47 11/01/18 3:25 PM

48
Table 41: Households by type of latrine facilitySub District Flush /Pour
Latrine (%)Pit Latrine
(%)Night soil
disposed into open drain (%)
Service Latrines
(%)
Public Latrines (%)
Open Defecation (%)
Hemgir 9.21 1.41 0.95 0.08 1.48 86.87
Lephripada 8.65 0.78 0.11 0.13 0.03 90.29
Bhamsa 11.19 0.68 0.27 0.51 0.73 86.61
Daraudihi 5.22 0.29 0.19 0.05 3.25 91
Sundargarh Town 65.03 3.16 0.18 0 1.01 30.62
Sundargarh 8.4 0.61 0.27 0.58 1.94 88.19
Kinjirkela 3.64 0.62 0.08 0.05 1.75 93.87
Talsara 6.26 0.63 0.19 0.07 1.19 91.65
Badagaon 7.41 1.49 0.17 0.12 1.2 89.61
Kutra 6.31 1.75 0.18 0.14 2.14 89.47
Rajagangapur 29.23 0.89 0.26 0.21 1.18 68.23
Raiboga 3.49 0.46 0.12 0.48 5.11 90.34
Biramitrapur 22.6 1.06 0.77 0.07 0.77 74.73
Hatibadi 6.47 2.11 0.24 0.08 0.13 90.98
Bisra 6.58 0.79 0.33 0.53 2.34 89.42
Bondamunda 14.81 1.17 0.13 1.33 1.2 81.36
Bramhini 7.03 0.37 0.34 1.77 1.32 89.17
Raghunathpalli 31.94 1.42 0.35 4.66 7.27 54.36
Tangarpali 10.93 0.09 0.17 0.09 0 88.73
Lathikata 15.72 1.52 0.3 1.59 3.82 77.05
Chandiposh 3.45 0.63 0.04 0.07 2.07 95.29
Kamarposh 3.25 0.54 0.12 0.13 2.07 93.89
Koida 14.59 0.83 0.17 0.05 0.67 83.69
Lahunipada 12.24 0.96 0.1 0.13 0.11 86.47
Gurundia 2 0.44 0.29 0.09 4.44 92.73
Tiketpali 2.11 0.28 0.46 0.13 2.71 94.32
Banei 11.62 1.86 0.23 0.27 1.58 84.44
Mahulapada 3.03 0.07 0.02 0.52 3.37 92.99
Rourkela (M) 67.45 1.43 0.47 0.75 2.28 27.24
Rourkela 61.95 2.41 0.72 0.89 2.51 31.52
Source: Census of India (2011)
c. Electricity access As is the case with other public amenities, electricity availability and reliability is particularly a concern in the rural mining areas (See table 42: Households by main source of lighting). As per Census of India (2011), on an average 25 per cent of rural households have access to electricity. A key problem with electricity is also reliable availability. Electricity access and reliable availability of it at important facilities such as schools, healthcare centres also is a major concern. This has been particularly captured through FGDs and interviews
Indicative plan district mineral foundation, Sundergarh, Odisha report.indd 48 11/01/18 3:25 PM

49
INDICATIVE PLAN DISTRICT MINERAL SUNDARGARH, ODISHA
with various stakeholders and for schools as analyzed on the basis of DISE report in earlier sections.
Table 42: Households by main source of lightingSub District Electricity
(%)Kerosene
(%)Other sources (%)
Hemgir 33.44 65.49 1.07
Lephripada 32.88 66.37 0.75
Bhamsa 41.74 57.38 0.88
Daraudihi 27.88 71.33 0.79
Sundargarh Town 85.85 13.12 1.03
Sundargarh 32.78 65.08 2.14
Kinjirkela 11.5 85.75 2.75
Talsara 17.23 81.46 1.31
Badagaon 21.12 77.69 1.19
Kutra 24.11 75.33 0.56
Rajagangapur 54.77 43.81 1.42
Raiboga 17.6 78.68 3.72
Biramitrapur 42.62 52.49 4.89
Hatibadi 16.78 81.13 2.09
Bisra 29.37 69.23 1.4
Bondamunda 56.42 41.28 2.3
Bramhini 32.35 64.44 3.21
Raghunathpalli 68.22 28.61 3.17
Tangarpali 51.81 45.87 2.32
Lathikata 42.37 51.2 6.43
Chandiposh 11.72 85.76 2.52
Kamarposh 12.23 86.28 1.49
Koida 37.93 59.07 3
Lahunipada 31.2 66.78 2.02
Gurundia 4.23 90.44 5.33
Tiketpali 9.34 81.55 9.11
Banei 34.47 60.59 4.94
Mahulapada 7.04 86.06 6.9
Rourkela (M) 93.13 5.79 1.08
Rourkela 89.69 8.39 10.31
Source: Census of India (2011)
d. Road connectivityRoad connectivity is a particular problem in mining-affected areas of Sundargarh district. The situation is well acknowledged in the district’s development report41, as well as has been captured through ground level interactions. Lack of all weather roads limits people’s access to basic facilities such as healthcare, education etc. (Refer to section 4).
Indicative plan district mineral foundation, Sundergarh, Odisha report.indd 49 11/01/18 3:25 PM

50
As per official reports, the district has about 168 kms of national highway, 218 kms of state highways , 297 kms of major district roads, 516 kms of other district roads and 688 kms of forest roads. The total length of Gram Panchayat roads is about 7,682 kms and that of panchayat samiti roads is 3,067 kms42.
B. Gaps in access to basic public amenities
The key gaps or deficits with respect to access of basic public amenities in mining-affected areas as identified from analysis of the official data include:a. Poor access to treated tap water in rural areas.b. High levels of open defecation due to lack of proper sanitation facilities. c. Access and reliability of electricity in rural areas.d. Connectivity in rural areas (all-weather roads).
a. Poor access to treated tap water in rural areasMost of the rural mining areas have very poor access to treated tap water. As indicated in mining-affected areas such as Kurta and Gurundia, a mere 0.2 and 1.3 per cent of households of access to it. The reliance of untreated sources of water adds of the health burden of people in these areas.
b. High levels of open defecation due to lack of proper sanitation facilitiesOpen defecation continues to be a major challenge in various parts of the district due to lack of toilets, and more particularly functional toilets. While under SBM many toilets have been constructed, people have pointed to lack of water, poor drainage systems as a impediment towards using toilets.
c. Access and reliability of electricity in rural areasElectricity access is very limited for people in rural areas, with mining-affected areas such as Gurundia having 4.2 per cent of households with access to it. Even in other rural areas the proportion is very low, categorically around only 20 to 30 per cent as analyzed above.
d. Connectivity in rural areas (all-weather roads)As acknowledged in Government reports as well as captured during ground interactions and FGDs, connectivity in mining-affected areas is a major problem. The situation is worsened by high truck movements in these areas.
3.3. Environmental pollution and degradation
Sundargarh is known for its rich mineral reserves which have attracted extensive mining activities. Besides there are a number of industries in the district, including highly polluting sponge iron industries. These have contributed to significant air, water and soil pollution in various parts of the district.
The two pollution factors considered to gauge the status of environmental pollution and degradation in the mining-affected areas are:a. Air pollution/Ambient Air Quality (AAQ)b. Water pollution and ground water depletion
Indicative plan district mineral foundation, Sundergarh, Odisha report.indd 50 11/01/18 3:25 PM

51
INDICATIVE PLAN DISTRICT MINERAL SUNDARGARH, ODISHA
a. Air Pollution/Ambient Air Quality (AAQ)Air pollution is particularly visible in the coalfields of Ib Valley and in Bonai and other mining-affected areas of Sundargarh district. The severe air pollution in that area is due to open-cast mining, blasting, transportation etc. Dispersion of pollutants from the neighboring Ib valley- Jharsuguda industrial region, that have been identified as critically polluted area by the Central Pollution Control Board (CPCB) in 2011, contributes to pollution in the area. However, the recorded data on air-quality captures little of the perceived situation. The data as obtained from the officials at the time of research, shows that in most areas ambient air pollutants such as suspended particulate matter (SPM), PM10, oxides of sulphur (SOx) and Oxides of nitrogen (NOx) are within permissible range. During FGDs and ground interactions, air pollution however was noted to be a major concern by respondents (Refer to section 4).
The observations during FGDs are also supported by some of the scholarly studies on pollution in the region. Overall, the Rourkela-Rajagangapur zone in Sundargarh district has been identified as one of the hot spots of industrial pollution in India, including air pollution. Concentration of sponge iron plants in the area contributed to air pollutants such as total suspended particulate matter (TSPM), respirable suspended particulate matter (RSPM), which have higher values than the prescribed standards of the union environment ministry43.
b. Water Pollution and Ground Water DepletionSundargarh district, including the mining-affected areas, has severe problems of water pollution and ground-water depletion/stress owing to various industrial activities. Scientific studies in the Ib valley coalfields on surface water quality has repeatedly indicated pollution problem.
Various industrial activities in the industrial areas of Sundargarh and Panposh subdivisions in the district is a major source of surface water pollution, particularly for Bramhani river and its tributaries. Pollution sources include effluent discharges from industries, ash pond overflow, and runoffs from stock piles in the mining areas. A report of the Department of Forest and Environment of the Government of Odisha (2014), the analyzed six pollution parameters - pH, dissolved oxygen (DO), biological oxygen demand (BOD), chemical oxygen demand (COD), conductivity and total coliform (TC) - in various stretches of the river over a period of eight years and concluded that all of these exceeded the standard limits. The report recommended necessary actions that must be taken to improve on all of these44.
Besides water pollution, water stress is critical in various parts of the district. The evaluation of the situation by the district irrigation committee clearly brings out the problem. All the mining-affected areas in Sundargarh district fall within poor or poor to moderate categories in terms of water stress.
The situation will worsen owing to increasing demand for water for industry purposes, agriculture, livestock, power generation and domestic use in the coming years. A review of the water budget of the district shows that the existing water availability combining surface and ground water sources is
Indicative plan district mineral foundation, Sundergarh, Odisha report.indd 51 11/01/18 3:25 PM

52
about 1.46 billion cubic meter (BCM)45. However, the current water demand is 3.86 BCM, and is projected to be 4.39 BCM by 2020. Therefore, the water gap will also increase from current 2.4 BCM to 2.94 BCM by 2020.
The situation is evidently going to worsen in all mining-affected areas, which are already water-stressed (See table 43: Water availability and projected demand in the mining-affected blocks). An integrated and sustainable approach needs to be adopted to address the scarcity and meet the demand, particularly pertaining to domestic needs and livelihoods.
Table 43: Water availability and projected demand in the mining-affected blocksBlock name Existing Water Availability Water demand
Surface Water
Ground Water
Total (BCM) Present(BCM)
By 2020 (BCM)
Koida 0.0333 0.0054 0.0387 0.2012 0.2287
Kutra 0.0650 0.0132 0.0782 0.2137 0.2430
Hemgir 0.0455 0.0112 0.0568 0.2284 0.2597
Kuanrmunda 0.0544 0.0132 0.0676 0.2801 0.3185
Rajagangapur 0.1374 0.0076 0.1451 0.2122 0.2412
Lahunipara 0.1107 0.0077 0.1184 0.2414 0.2745
Nuagaon 0.0611 0.0144 0.0755 0.3500 0.3980
Gurundia 0.0335 0.0081 0.0417 0.2046 0.2326
Source: District Irrigation Plan of Sundargarh (2016)
Indicative plan district mineral foundation, Sundergarh, Odisha report.indd 52 11/01/18 3:25 PM

53
INDICATIVE PLAN DISTRICT MINERAL SUNDARGARH, ODISHA
4.1 Background of process
To complement the quantitative data and to understand the status of various socio-economic, human development and environmental issues further, a process of Participatory Rural Appraisal (PRA) was followed by engaging with concerned stakeholders. This constituted of conducting Focus Group Discussions (FGD) with various demographic groups and holding semi-structures interviews (SSI).
Focus Group Discussion (FGD): FGD is a ‘structured group review’ process, conducted to stimulate participants to reveal their views, beliefs, and perceptions about particular issue(s) and capture their understanding and opinion objectively.
For the purpose of this study, FGDs has been conducted through randomized sampling of representative population in six village(s)/habitations in two mining-affected areas –Koida, Lahunipara along with block panchayat functionaries and block development officials (See table 44: Focus Group Discussions in mining-affected areas). One FGD was also held with people of Bisra block, a non mining-affected area, as a control group. The total sample size considering all FGDs conducted in mining-affected areas is 198.
To capture the maximum possible diversity in people’s perceptions and needs, the following types of FGDs were conducted in each mining-affected area:1. Various demographic group FGD- This was held with three constituencies,
including:i. General populace FGD - This included representative population-
bothmale and female, from various demographic groups including, Scheduled Castes (SC), Scheduled Tribes (ST) and Other Backward Classes (OBC).
ii. Women FGD –Held with women separately to understand their specificissues. This had representation from teachers, SHG representatives, and various frontline workers such as ASHAs and AWC workers.
iii. Scheduled group FGD- Held with the scheduled populace.2. Block panchayat FGD- Held with block panchayat functionaries.3. Block development official FGD- Held with block development officials.
Section 4: Situation analysis through participatory rural appraisal
Indicative plan district mineral foundation, Sundergarh, Odisha report.indd 53 11/01/18 3:25 PM

54
Table 44: Focus Group Discussions in mining-affected areasBlock name Place where
focus group was held with communities
Type of focus group
No. of total participants
Composition ofParticipants
Koida Patmunda General 39 M: 17; F: 22OBC: 2; ST:32
Patmunda Women 15
Patmunda Scheduled groups
13
Patmunda Block panchayat members
10
Koida Block development officials
3
Lahunipara Bhutuda General 35 M: 15; F: 20ST:32
Bhutuda Women 17
Bhutuda Scheduled tribe 20
Bhutuda Block panchayat members
13
Lahunipada Block development officials
6
Semi structured interviews (SSI): SSI is a method of social evaluation and collecting information which is done on the basis of predetermined but open-ended questions. It provides an opportunity to receive information from (as well as give information to) the interviewees in a conversational but focused manner46. For the purpose of this exercise, SSI was particularly held with communities during site visits in mining-affected areas including tribal hamlets of those areas, civil society organization (CSO) representatives, and concerned district and block officials. The total sample consulted through SSIs was about 50.
Therefore between all FGDs and SSIs held in the mining-affected areas, and also the group discussion held in the control block, a total of 248 people have been consulted through the process of PRA.
Indicative plan district mineral foundation, Sundergarh, Odisha report.indd 54 11/01/18 3:25 PM
55
INDICATIVE PLAN DISTRICT MINERAL SUNDARGARH, ODISHA
4.2 Observations from Focus Group Discussions
The FGDs as held with various socio-demographic groups in the mining-affected area brings out the key challenges with respect to various socio-economic, human-development and environmental conditions as perceived by the communities. It also provides an understanding on the key issues that DMFs should consider for intervention so that the needs of the people are appropriately addressed.
For the purpose of concise representation, the key issues/ problems identified by the people and those need to be addressed have been highlighted. The issues also capture the opinion of the majority, that represents the observation and opinion of at least 50 per cent or more of the representative sample. However, in most cases the majority opinion reflects the response of 70 to 90 per cent of participants/ respondents.
In the sector-wise observation tables of FGDs, the majority response (70 per cent and above where people identified it as a major problem/issue) is denoted as “very poor” as applicable for respective mining-affected blocks. A mid-range response of 50 to 70 per cent of participant’s response is denoted as “poor”. Where only a handful number of people have mentioned a problem it has been noted as “not significant”, and an absence of a response by the participants has been denoted as “no response”.
Indicative plan district mineral foundation, Sundergarh, Odisha report.indd 55 11/01/18 3:25 PM

56
4.3 Key issues highlighted by community for improvement
To capture the perception and need of mining-affected people in a comprehensive fashion, FGDs were held separately with various constituencies. The key issues highlighted by communities which they consider improvement is required on in outlined below (See table 45: Key issues highlighted by communities in mining-affected areas).
Table 45: Key issues highlighted by communities in mining-affected areasBlock name Constituency Key issues
Koida General Clean and adequate drinking waterPoor access to healthcareQuality educationLivelihoodPoor road connectivity
Women Air pollutionClean drinking waterPoor access to healthcareNutrition monitoring, knowledgeLivelihoodEducation
Scheduled Group Clean and adequate drinking water Poor access to healthcareEducation LivelihoodPoor road connectivity
Block Panchayat Clean drinking waterAir pollutionLivelihoodPoor access to healthcare
Block officials Poor access to healthcareClean and adequate drinking waterLivelihood
Lahunipara General Pollution –air and waterPoor access to healthcareQuality of educationLivelihood
Women Clean drinking water Poor access to healthcareLack of access to secondary education
Scheduled Group Clean drinking water LivelihoodPoor access to healthcare
Block Panchayat Pollution –air, water, soilPoor access to healthcareLivelihood
Block officials PollutionPoor access to healthcareEducation
Indicative plan district mineral foundation, Sundergarh, Odisha report.indd 56 11/01/18 3:25 PM

57
INDICATIVE PLAN DISTRICT MINERAL SUNDARGARH, ODISHA
4.4 Perception on issues sector-wise
a. Perception on health and public healthcare systemMost people in the mining-affected areas reported poor health conditions, particularly chronic ailments like TB and cancer and water and vector-borne diseases like jaundice and malaria. Some people also reported respiratory issues as well as gastro-intestinal problems.
Further, poor healthcare infrastructure, inadequate financial resources, poor connectivity and accessibility to health centres, were some of the key challenges reported. People as well as district officials particularly reported that the access to the closest hospital is very poor. In both blocks, the nearest health facility is reported to be at least 20 kilometers away. In the existing health facilities, people reported a shortage of doctors and health staff and infrequent and unreliable ambulance services. (See table 46: Key concerns and factors regarding public health).
Table 46: Key concerns and factors regarding public healthIssues Key challenges and factors identified Block name
Koida Lahunipara
Disease burden Tuberculosis High High
Gastro-intestinal problems High High
Cancer High Not significant
Malaria High High
Jaundice High High
Infrastructure Number of primary healthcare facilities Very poor Very poor
Poor health infrastructure- beds, ambulances Very poor Very poor
Resources and access Lack of paramedical staff including full time doctors Very poor Very poor
Poor access to nearest health facility (average distance travelled about 5-10 kms)
Very poor Very poor
No or inadequate health coverage Poor Not significant
b. Perception on nutrition and food securityThe response on nutrition was considerably poor as people have little knowledge on the extent and kind of support they are supposed to receive through schemes such as ICDS. The incidence was largely captured the poor status of nutrition and health that particularly women complained about during ground interactions (See table 47: Key concerns and factors regarding nutrition and food security).
Table 47: Key concerns and factors regarding nutrition and food securityIssues Key challenges and factors identified Block name
Koida Lahunipara
ICDS related Irregularity of ICDS support No response No response
Inadequate nutrition supply No response No response
Nutrition education Very poor Very poor
Health monitoring Poor Poor
PDS related Timely ration Not significant Not significant
Indicative plan district mineral foundation, Sundergarh, Odisha report.indd 57 11/01/18 3:25 PM

58
c. Perception on educationThe key problems with education involve both infrastructure and resource issues (See table 48: Key concerns and factors regarding education). On the infrastructure front, respondents reported presence of elementary level schools but remarked that they were in poor condition regarding buildings as well as supporting resources like furniture, toilets etc. All respondents pointed that secondary schools are far and hence, inaccessible. People also reported that high levels of poverty in the district, combined with lack of awareness and access, leads to drop-outs among children after elementary level.
The problem across all levels is also of soft resources. People reported that the elementary and secondary schools did not have adequate teachers. Officials also reported deficiency in staff as a major concern in secondary and higher secondary concerns. Women in Lahunipara particularly expressed interest in women and adult education.
d. Perception on employment and livelihoodLivelihood is a key concern across communities in the mining-affected areas. The local people lack full-time employment. The respondents reported that most people in the area are mine workers or daily agricultural laborers. This leaves them with poor incomes and low job security. The government programs for rural employment are operational but reportedly ineffective as under MGNREGA only construction works are available for a short duration. (See table 49: Key concerns and factors regarding employment and livelihood).
Table 48: Key concerns and factors regarding educationIssues Key challenges and factors identified Block name
Koida Lahunipara
Infrastructure Schools for elementary education Poor Poor
Schools for secondary education Very poor Very poor
Basic infrastructure in schools; particularly toilet and electricity Very poor Very poor
Resources and access
Quality of teacher Not significant No response
Inadequate teachers in school Poor Poor
Access to schools (particularly secondary level) Very poor Very poor
Women education Support for women education and their education level Poor Very poor
Table 49: Key concerns and factors regarding employment and livelihoodIssues Key challenges and factors identified Block
Koida Lahunipara
Employment Full-time employments, mostly day laborers Very poor Very poor
Work training that provides job Poor Poor
Loan support Poor Poor
Support for small businesses (handloom, dairy farming) Poor Poor
Livelihood around local resources
Support for agriculture based livelihoods Poor Poor
Support for forest based livelihoods (minor forest products) Poor Poor
Government schemes Work availability under MGNREGA Very poor Very poor
Indicative plan district mineral foundation, Sundergarh, Odisha report.indd 58 11/01/18 3:25 PM

59
INDICATIVE PLAN DISTRICT MINERAL SUNDARGARH, ODISHA
Given the predominantly rural nature of the mining areas, people are mostly skilled and knowledgeable of agricultural activities. However, employment is the agricultural sector remains a major challenge. This is due to acquisition of land, degradation of cultivable lands, degrading in environmental conditions, poor financial support.
Most villagers feel the need of safeguarding their livelihood opportunities. Officials as well as locals point to the need for relevant skill development around natural resources in the region.
e. Perception on welfare support available for vulnerable groupsThe key concern regarding pension that emerged is the inadequate amount of money as well as poor delivery of services (See table 50: Key concerns and factors regarding welfare support to vulnerable groups). The money that people currently get is clearly inadequate to meet their basic needs, such as the pension support which is as low as Rs. 300 per month. Receiving pension is also a challenge as people have to go to the panchayat to get their pension, which is tough for old people. Additionally, people also reported the same challenge for maternity benefits in many cases. In the absence of bank accounts in the name of women, the money provided to mothers under the concerned schemes has to be physically fetched.
Table 50: Key concerns and factors regarding welfare support to vulnerable groupsIssues Key challenges and factors
identifiedBlock name
Koida Lahunipara
Pension funds and delivery
Adequate pension Poor Poor
Delayed pension Not significant Not significant
Difficulty in receiving pension due to access issues, no doorstep delivery of pension
Poor Poor
f. Perception on supply of and access to public amenitiesTwo key issues emerged as a challenge with regard to public amenities. These include drinking water and sanitation (See table 51: Key concerns and factors regarding public amenities).
Clean drinking water: Most respondents said that the water available is contaminated and yellow/reddish in colour. Most people either rely on groundwater sources or tankers. Both of these are provided to people without treatment. Some people also pointed to the depleting groundwater table which is leading to inadequate water availability.
Sanitation: Open defecation is rampant in the region with households either having no toilets or no water to use the toilets constructed under SBM. Officials also pointed out the need to bring about a behavioural change to deal with sanitation issues.
Indicative plan district mineral foundation, Sundergarh, Odisha report.indd 59 11/01/18 3:25 PM

60
Table 51: Key concerns and factors regarding public amenitiesIssues Key challenges and factors identified Block name
Koida Lahunipara
Clean drinking water
Availability of treated clean water Very poor Very poor
Reliable and adequate supply Poor Very poor
Delivery by government schemes/works
Poor Poor
Sanitation Functional toilet facilities and SBM implementation
Poor Very poor
Electricity Electricity supply especially at night Not significant Poor
g. Perception on environmental pollutionIn all FGDs, the major concern was about environmental pollution, including of air, water and soil (See table 52: Key concerns and factors regarding environmental pollution). One of the main concerns is air pollution which people say is always persistent and is affecting their health and well-being. They reported respiratory, skin, and kidney problems. The soil contamination is reported to be having a negative impact on the agricultural productivity. The respondents expressed concerns about the poor status of environmental management by mining companies and authorities.
Table 52: Key concerns and factors regarding environmental pollutionIssues Key challenges and factors
identifiedBlock name
Koida Lahunipara
Air pollution Pollution related health problems
Very poor Very poor
Working ability reduction No response No response
Water pollution and water table depletion
Water availability for drinking Poor Poor
Water availability for agriculture affecting productivity
Poor Poor
Soil pollution Agricultural productivity and livelihood
Poor Not significant
Indicative plan district mineral foundation, Sundergarh, Odisha report.indd 60 11/01/18 3:25 PM

61
INDICATIVE PLAN DISTRICT MINERAL SUNDARGARH, ODISHA
5.1 Background of analysis
The funds accrued to DMF and that estimated to be coming per annum in the near future is substantial. The broad heads that the use of the funds should focus on are also clearly outlined. However, many of the sectors that DMF should focus on, are also the ones which are financed by the districts own financial resources, as well as through Centre and State Government schemes. In many aspects, thus DMF funds are potentially add-ons to the various socio-economic and human-development works that are undertaken in the district.
For identifying the issues for which DMF funds must be directed and to what extent, a review of the existing resource envelops is therefore important. Such review of financial resources, alongside the stocktaking exercise of district and block data on various parameters, and the Participatory Rural Appraisal (PRA) process followed to capture people’s perception, will help to identify and prioritize on factors for DMF fund investments in the most efficient manner.
For the purpose of this exercise, two sources of resources have been considered. These include:• The proposed outlay for various sectors/heads in the district annual
budget.• Spending under Corporate Social Responsibility (CSR) by key industries.
5.2 District annual budget and fund availability for various sectors
A review of the financial allocation for various heads under the district annual budget of 2016-17, has been done to understand the allocation for sectors/ issues which also fall under the ambit of DMF investments. Overall, out of the total budget of Rs. 1667.14 crores, the highest proportion of allocation is the combined allocation for various heads under “social services” sector, which is 31.5 per cent of the total budget. The allocations for various sub-heads under this have varied thrust (See table 52: Sectoral outlay in district annual budget). Beside this, another significant proportion in the budget is allocated to “transport” sector which is about 29.5 per cent.
Most of the major sub-heads under the “social services” sector are also the ones which are priority areas under the DMF law. These include Education, public health, water supply and sanitation, and housing (which under DMF laws are ‘pucca’ houses for the poor). Among these the allocation for education is by far the most significant (Rs.130.05 crore) which is about 24.7 per cent
Section 5: Resource mapping
Indicative plan district mineral foundation, Sundergarh, Odisha report.indd 61 11/01/18 3:25 PM

62
Table 52: Sectoral outlay in district annual budget (2016-17)Heads/ sectors Subsectors/ areas covered Fund outlay (In Rs.
Crore)% of outlay
Agriculture and Allied Activities
Crop husbandry 32.3 6.91
Horticulture 8.34
Soil and water conservation 44.45
Animal Resource Development 0.09
Fisheries 3.97
Total agriculture and allied activities 115.27
Rural Development Special programmes for rural development 4.35 10.05
District panchayat office 13.07
Rural employment schemes 150.16
Total rural development 167.59
Special Area Programmes Special area programmes 62.72 3.76
Total special area programmes 62.72
Irrigation and Flood Control Minor irrigation 55.62 9.82
Lift irrigation 98.69
Irrigation division, Sundargarh 9.52
Total irrigation and flood control 163.84
Energy Power 8.16 1.25
Non-conventional Sources of Energy 12.83
Total energy 20.99
Industry and Minerals Village and small enterprises 1.03 0.33
Handlooms 0.08
Textile 0.06
Sericulture 3.64
Total industry and minerals 5.56
Transport Road and bridges Sundargarh 229.49 29.48
Road and bridges Rourkela 111.72
National highways division, Rourkela 1
Rural works department Sundargarh 74.57
Rural works department Rourkela 74.73
Total transport 491.52
Science, Technology and Environment
DFO, Sundargarh 2.23 3.18
DFO, Rourkela 46.82
DFO, Bonai 4.04
Total science, technology and environment 53.09
General Economic Services Tourism 2.99 3.62
Civil supplies 0.04
District PMU, Sundargarh 57.35
Total general economic services 60.39
Indicative plan district mineral foundation, Sundergarh, Odisha report.indd 62 11/01/18 3:25 PM

63
INDICATIVE PLAN DISTRICT MINERAL SUNDARGARH, ODISHA
of the social sector budget. However, pressing issues in the district such as clean drinking water, public health, child development, welfare of scheduled communities (particularly tribal communities) has very limited earmarking in the budget.
Besides heads under “social services”, two other important sectors for consideration are “rural development” and “special area programmes”, which also pertains to the mining-affected communities. The combined fund available from these two sectors for investments in various development issues is nearly 13.8 per cent of the budget.
Many of the heads are supported by fund flow from Centre and State Government schemes, in varied proportions. Some of the key ones pertaining to human Development, social services, rural development and alike include, Gopobandhu Gramin Yojana (GGY) for overall district development programs such rural electrification, water supply and roads; Integrated Child Development Scheme (ICDS), Midday Meal Scheme for improving nutrition among children; Sarva Siksha Abhiyan (SSA) and Rashtriya Madhyamik Siksha Abhiyan (RMSA) for education; Mahatma Gandhi National Rural Employment Guarantee Scheme (MGNREGS) and National Rural Livelihoods (NRLM) for livelihood enhancement; National Rural Drinking Water Programme (NRDWP) for water supply; Swachh Bharat Mission (SBM) for sanitation; Pradhan Mantri Awas Yojana (PMAY) and Biju Pucca Ghar Yojana (BPGY) for Housing; and Madhubabu Pension Yojana (State scheme aligned to Indira Gandhi National Old Age Pension) for welfare support for the elderly.
5.3 Corporate Social Responsibility funds
Sundargarh district also receives a significant amount of investments through Corporate Social Responsibility (CSR) funds. The major share of CSR comes from some companies such as Rungta Sons Private Limited, Mahanadi Coalfields Limited, Bonai Industrial Company, Feegrade and Company Private Limited and Odisha Mining Corporation (See table 53: CSR funds spent in Sundargarh district by major industries). The total spent amount by the companies in 2016-17 (on completed projects) through CSR in the district was
Social Services General education 130.05 31.55
Sports 16.03
Youth services 0
Culture 0.84
Medical and public health 38.46
Water supply and sanitation 28.34
Housing 100.68
Urban development 55.68
Development of SC/ST and OBC 58.74
Social security and social welfare 97.26
Total social services 526.12
Total District Outlay 1667.14
Indicative plan district mineral foundation, Sundergarh, Odisha report.indd 63 11/01/18 3:25 PM
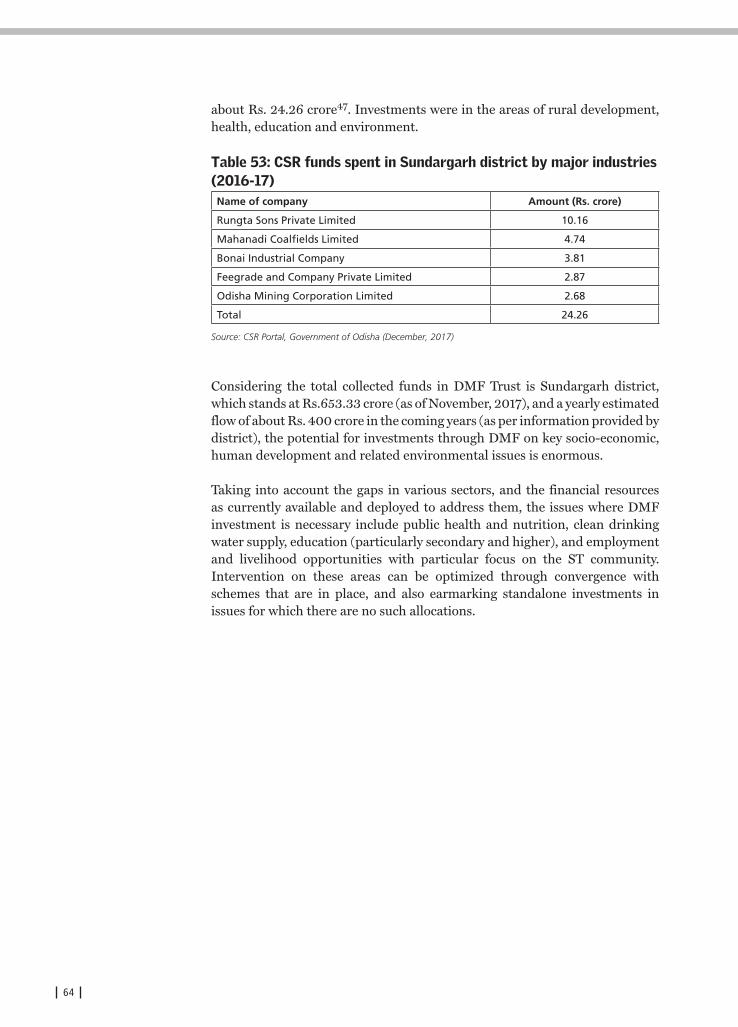
64
about Rs. 24.26 crore47. Investments were in the areas of rural development, health, education and environment.
Table 53: CSR funds spent in Sundargarh district by major industries (2016-17)Name of company Amount (Rs. crore)
Rungta Sons Private Limited 10.16
Mahanadi Coalfields Limited 4.74
Bonai Industrial Company 3.81
Feegrade and Company Private Limited 2.87
Odisha Mining Corporation Limited 2.68
Total 24.26
Source: CSR Portal, Government of Odisha (December, 2017)
Considering the total collected funds in DMF Trust is Sundargarh district, which stands at Rs.653.33 crore (as of November, 2017), and a yearly estimated flow of about Rs. 400 crore in the coming years (as per information provided by district), the potential for investments through DMF on key socio-economic, human development and related environmental issues is enormous.
Taking into account the gaps in various sectors, and the financial resources as currently available and deployed to address them, the issues where DMF investment is necessary include public health and nutrition, clean drinking water supply, education (particularly secondary and higher), and employment and livelihood opportunities with particular focus on the ST community. Intervention on these areas can be optimized through convergence with schemes that are in place, and also earmarking standalone investments in issues for which there are no such allocations.
Indicative plan district mineral foundation, Sundergarh, Odisha report.indd 64 11/01/18 3:25 PM

65
INDICATIVE PLAN DISTRICT MINERAL SUNDARGARH, ODISHA
The MMDR Act (1957), under which DMF has been instituted through an amendment in 2015, specifies that the objective of the DMF is to “work for the interest and benefit of persons and areas affected by mining related operations”.
The PMKKKY, a scheme launched in September 2015 by the GOI to for the welfare of people in mining-affected areas, and aligned to DMF funds for implementation, also outlines three objectives to guide the appropriate use of DMF funds. These include:• To implement various developmental and welfare projects/programs in
mining-affected areas that complement the existing ongoing schemes/projects of State and Central Government.
• To minimize/mitigate the adverse impacts, during and after mining, on the environment, health and socio-economics of people in mining districts.
• To ensure long-term sustainable livelihoods for the affected people in mining areas.
The sector and issues that have been analyzed in this document for identifying the critical gaps and capturing the need of the people are corresponding to the objectives of the DMF law and the PMKKKY objectives. Based on such analysis and observation, priority issues have been identified for DMF investments for effective intervention.
6.1 Identifying priority issues
The priority issue for DMF investments is determined on the basis of a participatory approach, as well as through analysis of baseline information. Considering the qualitative and the quantitative information together, helps to capture the complete perspective on issues. It also makes the planning exercise purposeful, optimizes allocations, and can ensure that critical issues are addressed in the most effective manner.
Section 6 : Prioritizing issues and approaches for intervention through an outcome-output framework
Indicative plan district mineral foundation, Sundergarh, Odisha report.indd 65 11/01/18 3:25 PM

66
6.2 Output-outcome framework for investments
As noted, the indicative planning exercise is based on an output and outcome oriented approach. In the proposed framework based on this approach, the intended outcomes have been determined on the basis of the following:• Critical needs as identified through participatory approach. • Government and scientific information as analyzed.• With reference to government and internationally accepted benchmarks
as appropriate.
The outputs against each outcome had been chosen on the basis of the following:• Are related to and representative of the condition(s) in question.• Are based on the best available information of acceptable quality, and that
can be collected or monitored with a reasonable time.• Relevant for policy and planning purposes.• Easily understood and applied by potential users.• Acceptable by stakeholders.
6.3 Priority sectors for DMF investments in Sundargarh district
The sectors that DMF should focus on for investments in Sundargarh district over the next five years have been determined on the basis of deficits in these sectors, their contribution in human development and creating long- term development dividend and sustainable assets. The deficits in each of these sector takes into consideration the observations based on official data/information, as well as people’s perception as captured through the process of PRA (Refer Sections 3 and 4).
For each of these priority sectors/issues, some target outcomes has been identified that DMF should aim to achieve. A number of intermediary outputs have also been identified that can help to achieve the target outcome. The outputs have been divided into two timeframes to ensure time-bound results and improve on intervention mechanisms. The framework also takes into consideration investments in simultaneous/parallel sectors that will help optimize the outcome for a specific issue. The sectors/issues as prioritized for intervention include:a. Nutrition and public health.b. Clean drinking water supply and enhancement of water quality and
availability.c. Education.d. Livelihood enhancement.
a. Nutrition and public healthImproving nutrition and public health status are crucial for maximizing demographic dividend and increasing economic productivity of a population. The two need to be considered simultaneously for effective investments and achieving desired outcomes.
Indicative plan district mineral foundation, Sundergarh, Odisha report.indd 66 11/01/18 3:25 PM
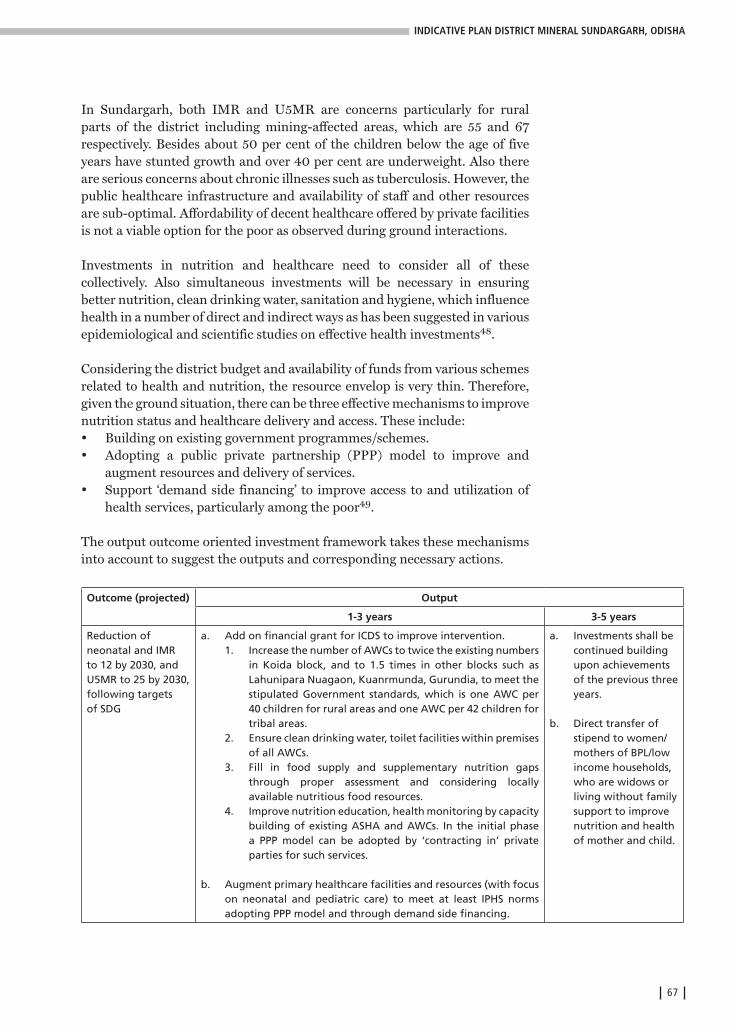
67
INDICATIVE PLAN DISTRICT MINERAL SUNDARGARH, ODISHA
In Sundargarh, both IMR and U5MR are concerns particularly for rural parts of the district including mining-affected areas, which are 55 and 67 respectively. Besides about 50 per cent of the children below the age of five years have stunted growth and over 40 per cent are underweight. Also there are serious concerns about chronic illnesses such as tuberculosis. However, the public healthcare infrastructure and availability of staff and other resources are sub-optimal. Affordability of decent healthcare offered by private facilities is not a viable option for the poor as observed during ground interactions.
Investments in nutrition and healthcare need to consider all of these collectively. Also simultaneous investments will be necessary in ensuring better nutrition, clean drinking water, sanitation and hygiene, which influence health in a number of direct and indirect ways as has been suggested in various epidemiological and scientific studies on effective health investments48.
Considering the district budget and availability of funds from various schemes related to health and nutrition, the resource envelop is very thin. Therefore, given the ground situation, there can be three effective mechanisms to improve nutrition status and healthcare delivery and access. These include:• Building on existing government programmes/schemes.• Adopting a public private partnership (PPP) model to improve and
augment resources and delivery of services.• Support ‘demand side financing’ to improve access to and utilization of
health services, particularly among the poor49.
The output outcome oriented investment framework takes these mechanisms into account to suggest the outputs and corresponding necessary actions.
Outcome (projected) Output
1-3 years 3-5 years
Reduction of neonatal and IMR to 12 by 2030, and U5MR to 25 by 2030, following targets of SDG
a. Add on financial grant for ICDS to improve intervention. 1. Increase the number of AWCs to twice the existing numbers
in Koida block, and to 1.5 times in other blocks such as Lahunipara Nuagaon, Kuanrmunda, Gurundia, to meet the stipulated Government standards, which is one AWC per 40 children for rural areas and one AWC per 42 children for tribal areas.
2. Ensure clean drinking water, toilet facilities within premises of all AWCs.
3. Fill in food supply and supplementary nutrition gaps through proper assessment and considering locally available nutritious food resources.
4. Improve nutrition education, health monitoring by capacity building of existing ASHA and AWCs. In the initial phase a PPP model can be adopted by ‘contracting in’ private parties for such services.
b. Augment primary healthcare facilities and resources (with focus on neonatal and pediatric care) to meet at least IPHS norms adopting PPP model and through demand side financing.
a. Investments shall be continued building upon achievements of the previous three years.
b. Direct transfer of stipend to women/ mothers of BPL/low income households, who are widows or living without family support to improve nutrition and health of mother and child.
Indicative plan district mineral foundation, Sundergarh, Odisha report.indd 67 11/01/18 3:25 PM

68
1. A PPP model can be adopted to improve and augment resources at primary health care facilities. This should focus on adequate numbers of trained healthcare personnel, scientific diagnosis and monitoring facilities, providing ambulances and mobile healthcare infrastructure.
2. Provide ‘health vouchers’ to women/mothers to avail treatments and check-ups at both public and private facilities, to improve on the existing service as provided under Janani Shishu Suraksha Karyakram (JSSK).
Augmentation of primary and secondary healthcare infrastructure/resources as per IPHS norms as specified for tribal areas
a. Increase primary and secondary healthcare facilities to meet at least IPHS norms1. Increase sub-centre capacity by 50 per cent in the mining-
affected blocks of Kutra, Hemgir and Nuagaon. 2. Increase PHC capacity by 50 per cent in Kutra, Lahunipara
and Kuanrmunda blocks. 3. In cases where private clinics already exist in the
underserved areas, the government could also contract with those clinics (through PPP) in a way that allows them to expand capacity to provide more primary care.
4. The bed capacity combining Sundargarh and Rourkela district hospitals should be doubled by adding about 300 extra beds combining these two facilities, to meet the IPHS norms.
b. Fill in deficits of healthcare personnel and improve delivery of services through PPP model1. ‘Contracting-in’ can be done to fill vacant positions in
health units. Doctors, nurses, technicians and other staff as required can be recruited on contracts for a stipulated time period. There is currently about 50 per cent deficit of doctors and nurses in hospitals and CHCs as compared to the requirement50.
2. A ‘management contract’ can be arranged to expand health services. In this, obligation for service provision will remain with the public sector, while daily management and delivery will be the responsibility of the private partner.
Public institutions will also be responsible for establishing performance standards and ensuring compliance.
c. Improve health access through demand side financing1. A ‘voucher system’ can be introduced to improve health
access at public as well as private facilities (particularly for people BPL and marginalized people). The voucher can be exchanged for defined goods or services as a token of payment. Vouchers can be provided against health packages for various common ailments / conditions, which can be bought by the people at specific intervals (two or three times a year). These vouchers can then be redeemed for receiving a set of services such as consultations, lab tests, and procedures, from accredited hospitals / partner clinics.
2. For treatments that entail higher costs, a standard deductable can be stipulated (payable by the voucher user/patient), to cover part of the extra cost.
a. Investments shall be continued building upon achievements of the previous three years.
b. Build on health insurance schemes. Build on coverage of national health insurance schemes, such as Rashtriya Swasthiya Bima Yojana (RSBY) providing coverage to BPL families, Aam Aadmi Bima Yojana (AABY) providing coverage for rural landless households, for people in mining-affected areas.
Indicative plan district mineral foundation, Sundergarh, Odisha report.indd 68 11/01/18 3:25 PM

69
INDICATIVE PLAN DISTRICT MINERAL SUNDARGARH, ODISHA
b. Clean drinking water supply and enhancement of water quality and availabilityDrinking water is closely related to the health and well-being of people. The outstanding concerns with respect to clean drinking water supply and availability include high percentages of households without treated tap water accessibility, lack of tap water facilities within premises of majority AWCs, lack of treated tap water facilities in schools across all levels.
While these problems and deficits need to be tackled on an immediate basis, but given vast surface and ground water pollution in mining areas and water distress in the region, a long term ‘watershed approach’ must be adopted. A watershed approach has been considered and advised as best water management practice by the Ministry of Rural Development of the GOI51, as well as international regulatory agencies such as the US Environment Protection Agency (US EPA). Such approach can help in drinking water protection, pollution control, agriculture enhancement, fish and wildlife habitat protection and preservation of native vegetation. It is also economic and efficient as it builds upon existing resources and saves management costs, improves coordination and reduces duplication among management practices and creates opportunities for long-term community development52.
The proposed framework for augmenting clean drinking water supply and enhancement of water quality and availability, takes into consideration the immediate needs and the initiation of long term investment.
Outcome (projected) Output
1-3 years 3-5 years
Safe and adequate drinking water for all households and service facilities in mining-affected areas
a. Ensure treated clean water supply in all panchayats in the mining-affected areas.
b. A mechanism of PPP can be adopted in the first phase. In this phase the contracted enterprise can be the technology provider and the management body for the delivery of services. The public partner can provide the infrastructure component such as land and any construction work that is required to be undertaken.
a. Investments to be continued building upon achievements of the previous three years.
Enhancement of water quality and water availability through watershed based approach
Initiation of a long term approach for watershed management in convergence with various concerned departments and through public private efforts, as a coordinating framework for environmental management and augmenting water resources.
The approach to be continued as a long term measure.
Indicative plan district mineral foundation, Sundergarh, Odisha report.indd 69 11/01/18 3:25 PM
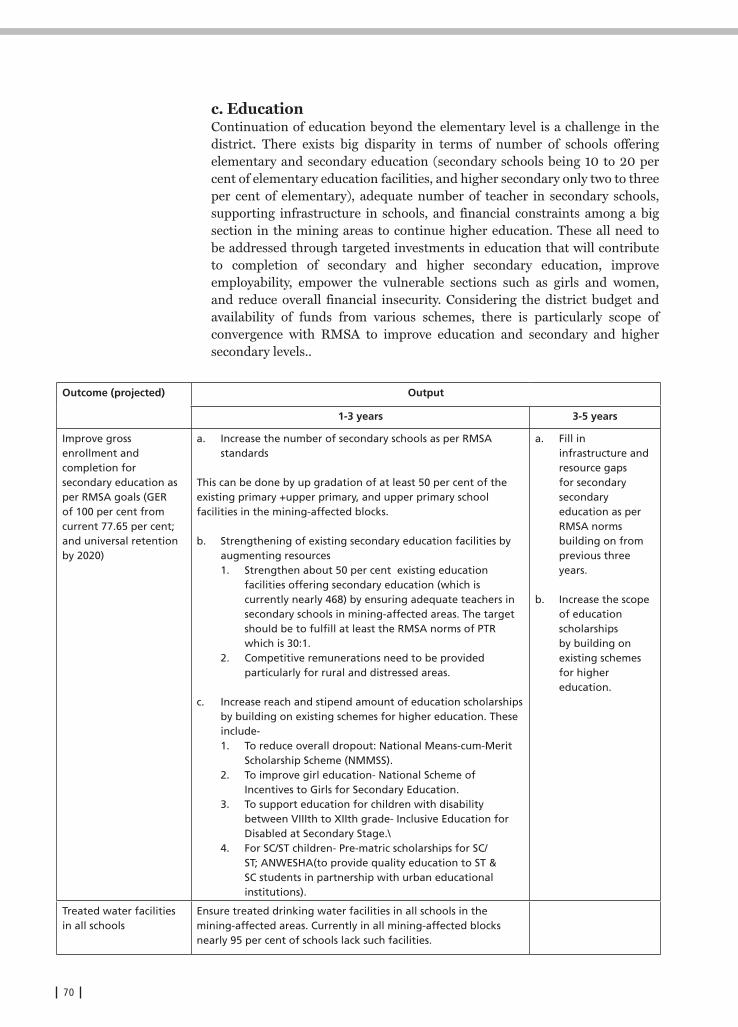
70
c. EducationContinuation of education beyond the elementary level is a challenge in the district. There exists big disparity in terms of number of schools offering elementary and secondary education (secondary schools being 10 to 20 per cent of elementary education facilities, and higher secondary only two to three per cent of elementary), adequate number of teacher in secondary schools, supporting infrastructure in schools, and financial constraints among a big section in the mining areas to continue higher education. These all need to be addressed through targeted investments in education that will contribute to completion of secondary and higher secondary education, improve employability, empower the vulnerable sections such as girls and women, and reduce overall financial insecurity. Considering the district budget and availability of funds from various schemes, there is particularly scope of convergence with RMSA to improve education and secondary and higher secondary levels..
Outcome (projected) Output
1-3 years 3-5 years
Improve gross enrollment and completion for secondary education as per RMSA goals (GER of 100 per cent from current 77.65 per cent; and universal retention by 2020)
a. Increase the number of secondary schools as per RMSA standards
This can be done by up gradation of at least 50 per cent of the existing primary +upper primary, and upper primary school facilities in the mining-affected blocks.
b. Strengthening of existing secondary education facilities by augmenting resources1. Strengthen about 50 per cent existing education
facilities offering secondary education (which is currently nearly 468) by ensuring adequate teachers in secondary schools in mining-affected areas. The target should be to fulfill at least the RMSA norms of PTR which is 30:1.
2. Competitive remunerations need to be provided particularly for rural and distressed areas.
c. Increase reach and stipend amount of education scholarships by building on existing schemes for higher education. These include-1. To reduce overall dropout: National Means-cum-Merit
Scholarship Scheme (NMMSS).2. To improve girl education- National Scheme of
Incentives to Girls for Secondary Education.3. To support education for children with disability
between VIIIth to XIIth grade- Inclusive Education for Disabled at Secondary Stage.\
4. For SC/ST children- Pre-matric scholarships for SC/ST; ANWESHA(to provide quality education to ST & SC students in partnership with urban educational institutions).
a. Fill in infrastructure and resource gaps for secondary secondary education as per RMSA norms building on from previous three years.
b. Increase the scope of education scholarships by building on existing schemes for higher education.
Treated water facilities in all schools
Ensure treated drinking water facilities in all schools in the mining-affected areas. Currently in all mining-affected blocks nearly 95 per cent of schools lack such facilities.
Indicative plan district mineral foundation, Sundergarh, Odisha report.indd 70 11/01/18 3:25 PM

71
INDICATIVE PLAN DISTRICT MINERAL SUNDARGARH, ODISHA
d. Employment and LivelihoodImproving the status of employment and livelihood in Sundargarh will require a multi-pronged approach considering the potential of local resources (such as forest resources and agricultural land), the traditional knowledge of the local communities and education and skill levels among youth people within employable age. Therefore, improving employment and livelihood opportunities are also simultaneously dependent on other areas of investments such as in education, watershed management, and also the Government’s action in effective implementation of certain regulations/policies as related to forest rights.
The districts huge forest resource is crucial for improving sustainable livelihood opportunities in the district. With respect to livelihoods around forest based resources, fundamental issue is settlement of forest rights, particularly CFR, which is currently nil. Providing necessary forward and backward market linkages for forest-based products and supporting implementation of Minimum Support Price for Minor Forest Produce Scheme (MSP for MFP), can be of significance to help communities procure a better price for their products53.
Besides forest, agriculture is another sector for augmenting and improving sustainable livelihood opportunities for the local. On this front, the major focus should be soil and water conservation and enhancement of their quality. The issue needs to be tackled with a long-term focus adopting a watershed based approach for improving agricultural productivity.
Besides these, there should be also focus on improving employability of people and supporting entrepreneurship. The budget for skill development for promoting entrepreneurship is extremely limiting. As per the flagship scheme Pradhan Mantri Kaushal Vikas Yojana (PMKVY), the total training target between 2017-2020, in all of Odisha is for about 58,000 people. The total budget for three years for the entire state is about Rs. 89 crore. However, in Sundargarh itself, with 15-39 age groups, there are about nine lakhs non-workers. Therefore, convergence in this area is an utmost requirement to improve people’s employability and earning opportunity.
Indicative plan district mineral foundation, Sundergarh, Odisha report.indd 71 11/01/18 3:25 PM
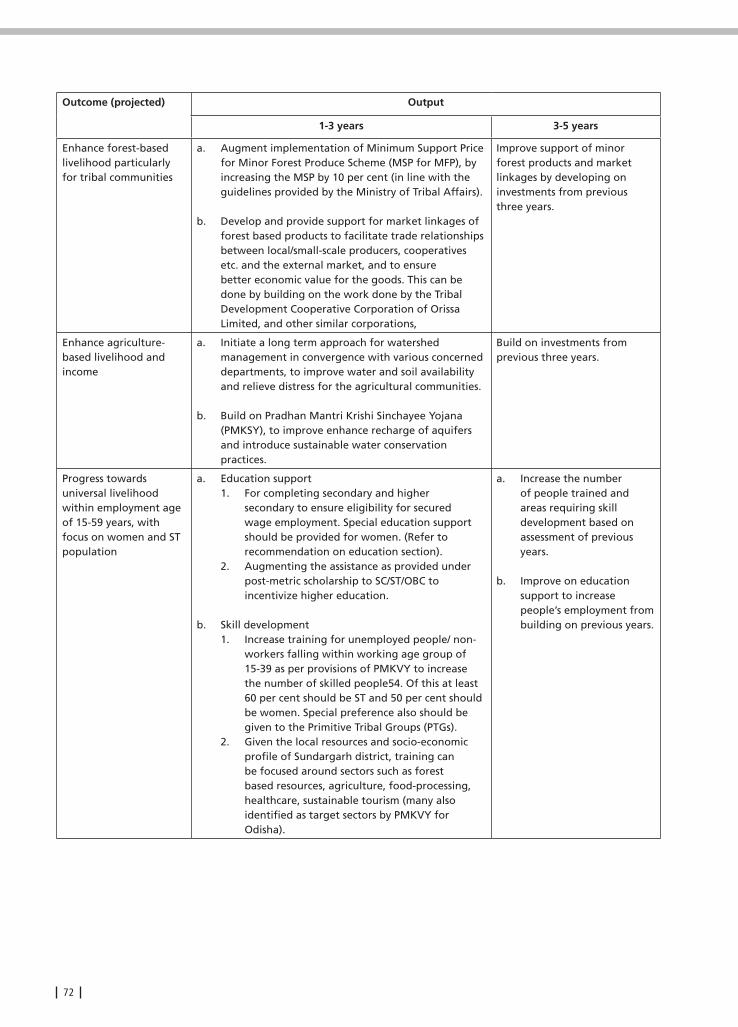
72
Outcome (projected) Output
1-3 years 3-5 years
Enhance forest-based livelihood particularly for tribal communities
a. Augment implementation of Minimum Support Price for Minor Forest Produce Scheme (MSP for MFP), by increasing the MSP by 10 per cent (in line with the guidelines provided by the Ministry of Tribal Affairs).
b. Develop and provide support for market linkages of forest based products to facilitate trade relationships between local/small-scale producers, cooperatives etc. and the external market, and to ensure better economic value for the goods. This can be done by building on the work done by the Tribal Development Cooperative Corporation of Orissa Limited, and other similar corporations,
Improve support of minor forest products and market linkages by developing on investments from previous three years.
Enhance agriculture-based livelihood and income
a. Initiate a long term approach for watershed management in convergence with various concerned departments, to improve water and soil availability and relieve distress for the agricultural communities.
b. Build on Pradhan Mantri Krishi Sinchayee Yojana (PMKSY), to improve enhance recharge of aquifers and introduce sustainable water conservation practices.
Build on investments from previous three years.
Progress towards universal livelihood within employment age of 15-59 years, with focus on women and ST population
a. Education support 1. For completing secondary and higher
secondary to ensure eligibility for secured wage employment. Special education support should be provided for women. (Refer to recommendation on education section).
2. Augmenting the assistance as provided under post-metric scholarship to SC/ST/OBC to incentivize higher education.
b. Skill development 1. Increase training for unemployed people/ non-
workers falling within working age group of 15-39 as per provisions of PMKVY to increase the number of skilled people54. Of this at least 60 per cent should be ST and 50 per cent should be women. Special preference also should be given to the Primitive Tribal Groups (PTGs).
2. Given the local resources and socio-economic profile of Sundargarh district, training can be focused around sectors such as forest based resources, agriculture, food-processing, healthcare, sustainable tourism (many also identified as target sectors by PMKVY for Odisha).
a. Increase the number of people trained and areas requiring skill development based on assessment of previous years.
b. Improve on education support to increase people’s employment from building on previous years.
Indicative plan district mineral foundation, Sundergarh, Odisha report.indd 72 11/01/18 3:25 PM

73
INDICATIVE PLAN DISTRICT MINERAL SUNDARGARH, ODISHA
1 Ministry of Finance, Department of Economic Affairs,2017,output Outcome Framework for Schemes 2017-2018, as available from http://dea.gov.in/sites/default/files/OutcomeBudgetE2017_2018.pdf
2 District of Sundargarh, Odisha, as available from http://ordistricts.nic.in/, accessed on November, 2017
3 District irrigation plan of Sundargarh, as available from http://www.dowrorissa.gov.in/DIP/2015-20/SUNDARGARH.pdf , accessed on November 2017
4 Directorate of Mines, Department of Steel and Mines, Odisha5 Census of India, 2011, District Census Handbook, Odisha, Government of India, as
available from http://www.censusindia.gov.in/2011census/dchb/2105_PART_B_DCHB_SUNDARGARH.pdf, accessed on September 2017
6 ibid7 United Nations Development Programme (UNDP), Human Development Index, as
available from http://hdr.undp.org/en/content/human-development-index-hdi, accessed on October 2017
8 Ministry of Health and Family Welfare, August 2017,MIS9 Global Hunger Index, 2017: The inequalities of Hunger, International Food Policy
Research Institute, as available from https://www.ifpri.org/publication/2017-global-hunger-index-inequalities-hunger, accessed on October 2017
10 Central Tuberculosis division, Directorate General of Health Services, Ministry of Health & Family Welfare, Government of India.
11 Ministry of Home Affairs, Annual Health Survey, 2012-13,Odisha, as available from http://www.censusindia.gov.in/vital_statistics/AHSBulletins/AHS_Factsheets_2012_13/FACTSHEET-Odisha.pdf accessed on November 2017, accessed on November 2017
12 The End TB strategy , World Health Organisation, as accessed from http://www.who.int/tb/End_TB_brochure.pdf?ua=1, accessed on October 2017.
13 Indian Public Health Standards,2012, as available from http://nhm.gov.in/nhm/nhrm/guidelines/indian-public-health-standards.html, accessed on July 2017, Ministry of Health & Family Welfare, Government of India.
14 Ibid15 Ibid16 Ministry of Health and Family Welfare,2015, Rural Health Statistics Report(2014-15), as
available from http://wcd.nic.in/sites/default/files/RHS-1.pdf , accessed on November 201717 The numbers are excluding average requirements of administration staff, cleaning
personnel etc.18 Indian Public Health Standards(IPHS), 2012, Guidelines for Sub-District/Sub-Divisional
Hospitals, as available from ,http://nhm.gov.in/images/pdf/guidelines/iphs/iphs-revised-guidelines-2012/sub-district-sub-divisional-hospital.pdf, accessed on September 2017
19 Indian Public Health Standards (IPHS), 2012, Guidelines for District Hospitals, as available from http://nhm.gov.in/oimages/pdf/guidelines/iphs/iphs-revised-guidelines-2012/district -hospital.pdf, accessed on September 2017
20 Ravi, Shamika and Mudit Kapoor, January, 2018, Brookings India health monitor, as available from www.brookings.edu/research/brookings-india-health-monitor/, accessed on January 2018
21 ibid22 Global Health Observatory(GHO) data, World Health Organization, as available from
http://www.who.int/gho/child_health/mortality/mortality_under_five_text/en/, accessed on October 2017
23 Government of India, Clinical, Anthropometric and Biochemical(CAB),2014, Odisha , as available from http://www.censusindia.gov.in/2011census/hh-series/HH-2/Odisha%20CAB%20Factsheet%202014.pdf, accessed on November 2017
References
Indicative plan district mineral foundation, Sundergarh, Odisha report.indd 73 11/01/18 3:25 PM

74
24 International Institute of population Sciences, 2017,National Family Health Survey(2015-16) Sundargarh district, as available from http://rchiips.org/NFHS/FCTS/OR/OR_FactSheet_374_Sundargarh.pdf , accessed on November 2017
25 Planning Commission of India, 2011,Evalution Study on Integrated Child Development Schemes, government of India, as available from http://planningcommission.nic.in/reports/peoreport/peoevalu/peo_icds_v1.prdf , accessed on July 2017
26 Ministry of Consumer Affairs, Food and Public Distribution, 2013, National Food Security Act(2013), Government of India
27 Food supplies and Consumer Welfare Department, Notification dated July 17,2014, Government of Odisha.
28 Ibid29 District Information System for Education (DISE): School Reports card,2015-16
,Government of India.30 ST and SC Development, Minorities and Backward Classes Welfare Department, Government of
Odisha 31 ibid32 Odisha Primary Education Programme Authority,2016, as available from http://opepa.
odisha.gov.in/website/Download/2015-16.pdf, accessed on December 201733 Student-Teacher Ratio, Ministry of Human Resource Development, Department of Higher
education, as available from http://mhrd.gov.in/sites/upload_files/mhrd/files/Student-Teacher%20Ratio.pdf , accessed on November, 2017
34 Poverty and Human Development Monitoring Agency (PHDMA), 2015, District Human Development Report, Sundargarh, Government of Odisha, as available from, www.phdmodisha.nic.in/Reports/HDRS/Sundargarh-DHDR.pdf, accessed on December, 2017
35 ibid36 ibid37 ibid38 Status of implementation of community rights and community forest resource rights as of April
2017, Ministry of Tribal Affairs, as available from https://tribal.nic.in/FRA/data/Odishadata.pdf, accessed on December 2017
39 ibid40 Ministry of Drinking Water and Sanitation, Government of India, as available from http://
sbm.gov.in/sbmdashboard/DistrictRanking.aspx, accessed on January, 201841 ibid42 ibid43 A.K Mishra et al, 2014, Sources of Air Pollution and Ambient Air Quality Status of Rajagangapur-
Kalunga Sponge Iron Industrial Area of Sundargarh District, IJEP 35 (5) : 353-36644 Centre for Environmental Studies, 2014, Water quality of Bhahmani river, Department of Forest
and Environment, Government of Odisha.45 ibid46 http://www.fao.org/docrep/x5307e/x5307e08.htm47 CSR portal, Government of Odisha, as available from http://csr.odisha.gov.in ,accessed on
November, 201748 Ministry of Foreign Affairs of the Netherlands, 2013, Public-Private Partnerships in developing
countries, IOB Study No. 378, as available from https://www.oecd.org/dac/evaluation/IOBstudy378publicprivatepartnershipsindevelopingcountries.pdf, accessed on November, 2017
49 Indrani Gupta, William Joe, Shalini Rudra, 2010, Demand Side Financing in Health: How far can it address the issue of low utilization in developing countries? World Health Report (2010), World Health Organization
51 Integrated watershed management programme, Ministry of Rural Development, Government of India
52 United States Environmental Protection Agency, 1996, Watershed Approach Framework, Office of Water, USA
50 * Exact number could not be specified here due to in conclusive data53 Ministry of Tribal Affairs, Communication dates October 2016, as available from http://tdccorissa.
org/mspmfp/Revised-Guideline.pdf, accessed on November 201754 Ministry of Skill Development and Entrepreneurship, 2017, Communication dated August 2017, as
available from http://www.skilldevelopment.gov.in/assets/images/Sanction/Odisha%20Sanction%20order.pdf, accessed on November, 2017
Indicative plan district mineral foundation, Sundergarh, Odisha report.indd 74 11/01/18 3:25 PM

Indicative plan district mineral foundation, Sundergarh, Odisha report.indd 75 11/01/18 3:25 PM

76
Centre for Science and Environment41, Tughlakabad Institutional Area, New Delhi 110 062Phones: 91-11-29955124, 29955125, 29953394Fax: 91-11-29955879 E-mail: [email protected] Website: www.cseindia.org
Indicative plan district mineral foundation, Sundergarh, Odisha report.indd 76 11/01/18 3:25 PM