india’s trade barriers - centre for public policy ... · pdf fileto india’s trade...
TRANSCRIPT

1
India’s trade barriers; an analysis with reference to tariffs and customs
procedures
India’s trade barriers:
an analysis with
reference to tariffs and
customs procedures January 28, 2015
ABSTRACT India is the seventh largest economy in the
world. However, it is only the sixteenth largest
exporter, in terms of value with its exports
accounting for around USD 336.6 billion. In
contrast, India is the 12th largest importer
demanding USD 477.3 billion as of 2013. This
article tries to answer major questions pertaining
to India’s trade barriers in order to understand
India’s current limitations and to identify
untapped opportunities.
Pinak Sarkar and Dr. (Prof.) Martin Patrick Centre for Public Policy Research
Centre for Public Policy Research

2
1.0 Introduction
India is the seventh largest economy in the world, but it has managed to position itself only as the
16th largest exporter in value terms which accounts for around USD 336.6 billion and the 12th
largest importer demanding USD 477.3 billion in 2013.i Although it is claimed that the
liberalisation of the Indian economy in 1991 has greatly transformed it by removing many trade
barriers and de-licensing of the industrial sector, its value or trade flow has remained very ordinary
for a country with a population size of 1.26 billion (Census, 2011).
India witnesses much lesser trade flow by value not only when compared to the bigger economies
such as the US and China, but also in comparison with smaller economies, such as Singapore and
the Netherlands (Table-1).
Table 1: Trade value flow across some major counties
Countries
Export value in 2013
US $ Billion
Import value in 2013
US $ Billion
China 2210 1949
United States of America 1578 2328
Germany 1458 1194
Japan 715 833
Netherlands 664 590
United Kingdom 548 655
Singapore 410 373
India 336 466
Source: International Trade Statistics. 2013
The reason behind such a peculiar trade scenario is that despite its network of trade agreements and
commitments under the WTO, India still has significant tariff and non-tariff barriers that limits its
trade with the world.ii. Most of the agreements offer only partial access to markets limited to
specific goods. India imposes and maintains an average applied tariff of 12.4 per cent, which is
among the highest in the world.
In order to understand India‘s current limitations and identify untapped opportunities, this report
answers questions such as: What are India‘s main trade partners and current trade balance? How

3
does India compare in terms of current trade patterns compared with the rest of the world? How are
trade policies formulated in India? How consistent are these policies with international trading
requirements and practices? What are the import procedures? What are the different costs borne by
importers due to these policies and procedures? Are there specific imports for which these costs are
unreasonably high? What are these costs in quantitative terms? How distortive are these costs?
2.0 India’s main trade partners, current trade patterns and current trade balance
The USA, UAE, China and Saudi Arabia are very important for India‘s international trade, because
these countries are both major sellers and buyers to India. According to the International Trade
Organization (2014), the major export partners of India are the US (12 per cent), United Arab
Emirates (10 per cent), China (5 per cent), Singapore (4 per cent), Hong Kong (4 per cent), Saudi
Arabia (4 per cent), and the UK (3 per cent); these constitute around 42 per cent of the total export
in value terms (Graph-1). The US, UAE, China, Singapore and Hong Kong account for 35 per cent
of Indian exports.
Graph 1: Major Export Partners of India Graph 2: Major Import Partners
Source: Compiled from International Trade Centre (ITC) data, http://www.intracen.org.
The major suppliers to India (import partners) are China (11 per cent), Saudi Arabia (8 per cent),
UAE (7 per cent), the US (5 per cent), Switzerland (5 per cent) and Iraq (4 per cent); import from
these countries constitutes around 40 per cent of the total value of Import in India (Graph-2).
However, trade relations with major import partners such as China, Saudi Arabia, Switzerland, and
Iraq are also vital as India witnesses a negative trade balance with these countries. The major
imports from these countries are oil and natural gas, manufacturing, machinery and electronics.

4
It must be noted that India‘s exports are much more diversified than the imports. Nearly 80 per cent
of the total exports are represented by 22 chapters of the harmonized system (HS).iii
The first two
chapters accounts from around 33 per cent of the total Indian exports which means export is
moderately skewed towards these products. The first two chapters are mineral fuels, oils and
distillation products (HS Code: 27) and pearls, precious stones and metals (HS Code: 71). On the
other hand, Indian imports are highly concentrated in a few products. Nine chapters of the
harmonized system represents around 80 per cent of India‘s total imports: mineral fuel, oil and
distillation products (HS Code:27), pears and precious stones and metals (HS Code:71), machinery
(HS Code:84), electrical, electronic equipment (HS Code: 85), organic chemicals (HS Code:29),
commodities not elsewhere specified (HS Code: 99), Iron and Steel (HS Code: 72), plastics and
articles (HS Code: 39), animal and vegetable fats and oils (HS Code:15). Among these, the first two
categories alone accounts for 54 per cent of total Indian imports.
The trade balanceiv
between India and the partner countries provides a picture of the extent of
India‘s trade dependence (see table-2) in the international market especially with the partner
countries.

5
Table 2: India’s trade balance in 2013 with major export and import partners ( USD Billion)
India‘s Major Export and
Import Partners
Exported
value
Imported
value
India‘s Trade
Balance
World 337 466 -129
United States of America (Ex-
Im P) 42 23 19
United Arab Emirates (Ex-
Im P) 34 33 1
China
(Ex-Im P) 16 52 -35
Singapore
(Ex-P) 14 7 7
Hong Kong, China (Ex-
P) 14 8 6
Saudi Arabia (Ex-
Im P) 12 37 -24
United Kingdom (Ex-
P) 11 6 4
Switzerland (Im-
P) 2 25 -23
Iraq
(Im-P) 1 20 -19
Note: Ex-Im P=both export and import partner; Ex-P=Major export partner; Im-P=Major import
partner. Source: Compiled from International Trade Centre (ITC) data, http://www.intracen.org/.
3.0 Trade Policies: Are they consistent with International Trade Requirements?
India‘s trade policy is formulated and implemented mainly by the Ministry of Commerce and
Industry, along with other ministries and agencies including the Ministry of Finance, the Ministry
of Agriculture, and the Reserve Bank of India.v Are the trade policies consistent with international
trade requirements? The answer is in negative affirmative. It is as evident from the study on ease to
do business in India. India fell three positions in the ease to do business according to the World
Bank (2014) from 131 in 2013 to 134 in 2014 out of 189.

6
Graph 3. India’s ease to trade- compared with selected countries
Source: World Bank, Doing Business (2014B).
Analysing the reasons, it can be noted that trading across borders, together with dealing with
construction permits; the ease to start a business, enforcing contracts and paying taxes are the worst
rated categories for India. The disaggregated picture is shown in Graph 4.
Graph 4: Disaggregation of Ease of Doing Business in India
Source: World Bank, Doing Business (2014B)

7
In the case of trading across borders, India, has again slipped three positions compared with
2013. India‘s performance is behind some direct competitors such as China, Brazil and
Indonesia; however, the country performs similarly to its region (South Asia) and has a
significant advantage with other BRICS, such as Russia. In The Report on Technical Barriers to
Trade, the USTR (2014B) lists a series of measures that the US identifies as technical barriers to
trade and which the country is currently discussing with India in bilateral and multilateral
mechanisms.

8
Table 3: Technical Tariff Barriers Identified by USTR
Technical Tariff
Barrier
Description
Legal Metrology -
Packaged Commodities
Rules
These rules stipulate that all pre-packaged commodities are
prohibited, unless they are in a standard quantity and carry all
prescribed declarations. The different interpretations and ways to
enforce them conflict with labeling and packaging requirements
maintained by Food Safety and Standards Authority (FSSAI) and
the Ministry of Commerce (MOCI). Such circumstances create
uncertainty causing detention of shipments at the port of entry and
cancellation of import contracts.
Food Safety and
Standard Regulations
(FSSR)
These are mentioned by the USTR as ―onerous India-specific
labeling‖ provisions, which appears inconsistent with the Codex
General Standard for the Labelling of Prepackaged Foods
recommended practices or international practice.
Security Regulations
for
Telecommunications
Equipment
India retained the objective of testing all ―security-sensitive‖
telecommunications equipment in India by April 2013.
Electronics and
Information
Technology Equipment
– Safety Testing
Requirements
The policy mandates exporters to register their products with
laboratories affiliated or certified by the Bureau of Indian Standards
(BIS). This is regardless any other type of certification
internationally recognized laboratories.
Proposed Amendment
to the Hazardous Waste
Act
The concern is that controls on imports of used electrical and
electronic equipment (EEE) for direct reuse and imports of
refurbished EEE would impose unnecessary burdens on trade that
facilitates reuse and extension of life of EEE.
Source: United States Representative, Report on Technical Barriers to Trade (2014B).

9
The barriers, general or technical, are clear reflections of trade policies that India follows. Apart
from that, import procedures, which are also the outcome of trade policies, hinder smooth
international trade.
3.1 Import procedures and Costs borne by importers
Table-4 summarizes all those factors seen by business executives as the most problematic factors
for importing in India (Methodologyvi
adopted by the ‗The Global Enabling Trade Report‘ 2014).
Among all the eight factors, the first two factors, i.e., the burdensome import procures and tariffs
together scoresvii
45.1, which means they alone represent 45.1 per cent of the total problems or
difficulties faced by importers and business executives. Therefore, it becomes imperative to focus
on these two vital aspects of importing in India.
Table 4: Most problematic factors for importing in India
Most problematic factors for importing in India Score
A. Burdensome import procedures 23.7
B. Tariffs 21.4
C. Corruption at the border 15.5
D. High cost or delay caused by domestic transportation 14.0
E. High cost or delay caused by international
transportation 9.3
F. Domestic technical requirements and standards 7.1
G. Crime and theft 6.1
H. Inappropriate telecommunication infrastructure 2.9
Source: Compiled from ‗Doing Business 2014‘ http://www.doingbusiness.org/
For clearance of import goods, the importer or his agents have to undertake various formalities and
rules which are very tedious and make the import process much difficult. There are 11 essential
documents (among the highest in the world) required to Import in India (among the highest in the
world) compared to only four documents in the OECDviii
countries which makes the import process
tedious and burdensome (Table 5). The documents to imports are as follows: 1) Bill of Entry
(customs import declaration), 2) Bill of landing, 3) Cargo release order, 4) Certificate of Origin, 5)
Certified Engineer‘s Report (technical standard certificate), 6) Commercial Invoice, 7) Foreign
Exchange Control Form, 8) Inspection Report, 9) Packing List, 10) Product Manual, and 11)

10
Terminal Handling Receipts. India also requires double the time (days) compared to the OECD
countries to import.
Table 5: Comparing India with South-Asia and OECD countries
Indicator India
South Asia
(Average)
OECD
(Average)
High Income
Documents to import (numbers) 11 10 4
Time to import (days) 20 34 10
Cost to import (US $ per
container) 1,250 1,968 1,090
Source: Compiled from ‗Doing Business 2014‘ http://www.doingbusiness.org/
Table-6 provides the detailed import procedure and the estimated cost per container.
Table6: Disaggregated Import procedures and cost for import in India
Import Procedures in India
Time
(days)
Cost per
container
(USD)
Customs clearance and technical
control 4 200
Ports and terminal handlings 5 250
Inland transportation and handling 3 400
Totals* (includes other procedures not
mentioned) 20 1,250
Source: Compiled from ‗Doing Business 2014‘ http://www.doingbusiness.org/
Table 6 makes it clear that there occurs heavy delay and huge costs due to cumbersome import
procedures. By taking 20 days to clear the procedure, the importers have to bear USD 1250 per
container. This is really a heavy toll on the shoulder of importers. This is despite the tariff imposed
on the imported goods.
Tariff is the next component to the costs borne by the importers. Lobbying and business groups is
another factor in influencing import restrictions. Though lobbying is illegal in India it plays a very
important role in influencing or imposing new restrictions on imports in India. An example:

11
recently added restriction on imported televisionix
and petrochemicals. Licence also plays a
negative role for the smooth and continuous international trade, according to USTR. However, the
USTR describes India‘s custom tariff system as complex and characterized by a lack of
transparency in determining the net effective rates of customs tariffs and excise duties.x In this
context it is essential to analyse the import duty in India.
Despite India‘s efforts for trade liberalization, the country still maintains high peaks on goods such
as flowers (60 per cent), natural rubber (70 per cent), automobiles and motorcycles (60-75 per cent
sometimes even 100 per cent), high-end sports cars (150-175 per cent), raisins and coffee (100 per
cent), alcoholic beverages (150 per cent), and textiles (some rates exceed 300 per cent). India has
also established tariff-rate quotas for products such as corn and dairy.
India‘s tariff regime makes significant disparities in applying tariffs between bound ratesxi
and the
most favoured nation (MFN) applied tariffs compared to other countries. Its trade flow follows the
agreements made in the WTO and the country is subject to dispute settlement panels. Additionally,
under the WTO, India grants Most Favored Nation (MFN) tariffs and it is constrained by a Final
Bound Tariff. Nearly 73.8per cent of India‘s tariff lines have a Bound Tariff. Currently, on average,
India has a Final Bound tariff of 113.1 per cent for agricultural products and 34.5 per cent for non-
agricultural. The average MFN tariff applied in 2012 was 33.5 per cent for agricultural products and
6.1 per cent for non-agricultural.
Table 7: Disparities in average bound rates and the most favoured nation applied tariffs (%)
Countries All products
B MFN
Agricultural product
B MFN
Non-Agricultural product
B MFN
India 48.6 13.7 113.1 33.5 34.5 10.4
China 25.1 6.0 15.8 15.6 9.1 8.7
Singapore 10.2 0.2 26.5 1.4 6.4 0
USA 3.5 3.4 4.7 4.7 3.3 3.2
Source: Compiled from ‗World Tariff Profile 2013‘ B- Average Bound MFN- Most favoured
nation
Such a disparity between bound and applied rates creates uncertainty because India has
considerable flexibility to change tariff rates at any time. So, market access is denied by high tariff
coupled with other factors. The problematic factors for importing in India are further established by
12
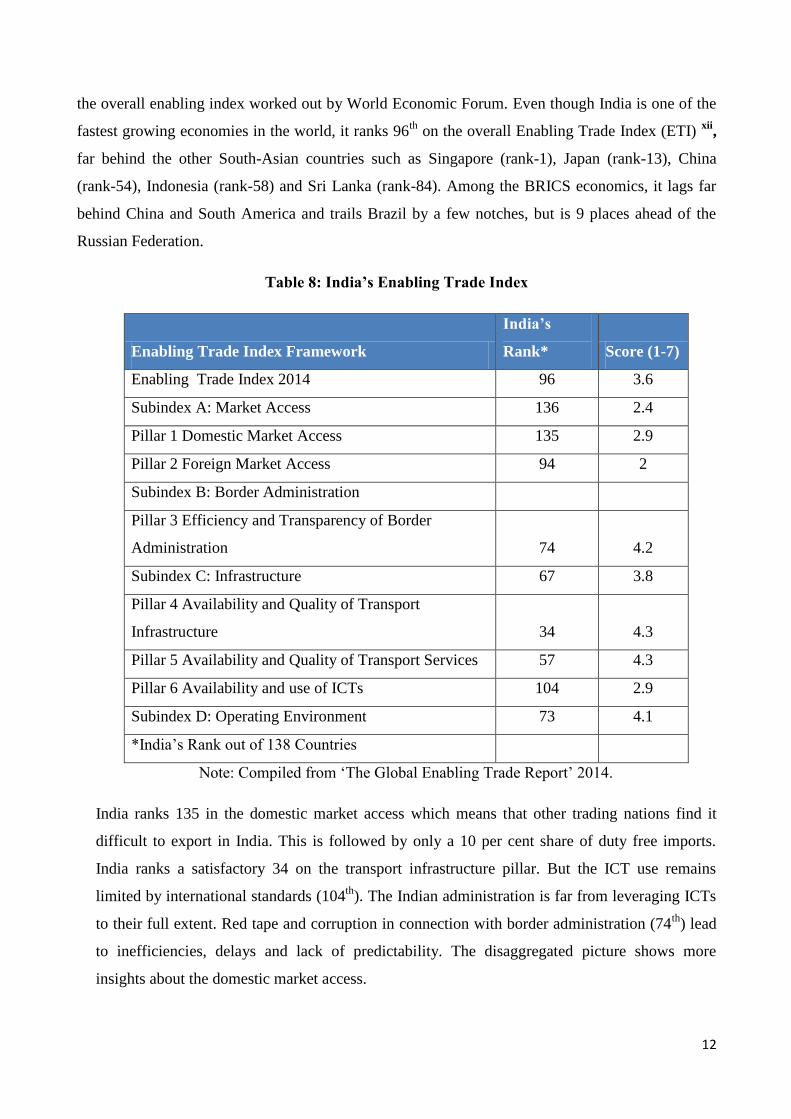
the overall enabling index worked out by World Economic Forum. Even though India is one of the
fastest growing economies in the world, it ranks 96th
on the overall Enabling Trade Index (ETI) xii
,
far behind the other South-Asian countries such as Singapore (rank-1), Japan (rank-13), China
(rank-54), Indonesia (rank-58) and Sri Lanka (rank-84). Among the BRICS economics, it lags far
behind China and South America and trails Brazil by a few notches, but is 9 places ahead of the
Russian Federation.
Table 8: India’s Enabling Trade Index
Enabling Trade Index Framework
India’s
Rank* Score (1-7)
Enabling Trade Index 2014 96 3.6
Subindex A: Market Access 136 2.4
Pillar 1 Domestic Market Access 135 2.9
Pillar 2 Foreign Market Access 94 2
Subindex B: Border Administration
Pillar 3 Efficiency and Transparency of Border
Administration 74 4.2
Subindex C: Infrastructure 67 3.8
Pillar 4 Availability and Quality of Transport
Infrastructure 34 4.3
Pillar 5 Availability and Quality of Transport Services 57 4.3
Pillar 6 Availability and use of ICTs 104 2.9
Subindex D: Operating Environment 73 4.1
*India‘s Rank out of 138 Countries
Note: Compiled from ‗The Global Enabling Trade Report‘ 2014.
India ranks 135 in the domestic market access which means that other trading nations find it
difficult to export in India. This is followed by only a 10 per cent share of duty free imports.
India ranks a satisfactory 34 on the transport infrastructure pillar. But the ICT use remains
limited by international standards (104th
). The Indian administration is far from leveraging ICTs
to their full extent. Red tape and corruption in connection with border administration (74th
) lead
to inefficiencies, delays and lack of predictability. The disaggregated picture shows more
insights about the domestic market access.

13
Table 9: Disaggregation of Pillar 1: Domestic Market Access
Pillar 1 India
China
Singapore
Disaggregation↓ Value Rank Value Rank Value Rank
Domestic Market access (1-7) 2.9 135 4.2 98 7 3
Tariff rate (%) 12.4 122 11.1 114 0 3
Complexity of tariff index (1-7) 4.9 94 6.3 57 6.9 5
Tariff dispersion (standard
deviation) 14.9 121 7.7 45 1.5 5
Tariff peeks (% of tariff lines) 3.2 68 2.3 60 0.1 26
Specific tariffs (% of tariff lines) 6.1 99 0.7 75 0.1 56
Number of distinct tariffs 718 102 106 78 7 28
Share of duty free imports (%) 10.8 120 48.1 89 100 3
Source: Compiled from ‗The Global Enabling Trade Report‘ 2014.
The disaggregation of Pillar 1 (domestic market access) and its comparison with the other Asian
countries such as China and Singapore shows that, in terms of domestic market access India ranks
135 position, much behind China (98) and Singapore (3). The most intriguingxiii
aspect in the list is
the number of distinct tariffs which India imposes on imports; it is shockingly more than 100 times
higher than Singapore and 7 times higher than China (Table-8). The disaggregation of Pillar-1 also
helps us to analyse the reason behind Singapore being ranked1 in the overall ‗Enabling Trade
Index‘ performance, and the reason behind India ranking so badly. The success of Singapore‘s
international trade is that, it imposes zero tariffs (India, 12 per cent average applied tariff) and 100
per cent share of duty free imports (India, only 10 per cent). This has helped Singapore to gain
preferential treatment in the international market for its exports.
The disaggregation of Pillar 2, (foreign market access), shows that India ranks 94 whereas,
Singapore ranks13. Similarly, in terms of percentage of tariff faced, India ranks59, whereas
Singapore ranks5. This helps to argue that, Singapore enjoys preferential treatment because it
provides duty free imports with hardly any restrictions. Which is contrary to India‘s case, as India
imposes too many restrictions, it also faces restrictions in terms of foreign market access for its
exports.

14
Table 10: Disaggregation of Pillar 2: Foreign Market Access
Pillar 2 India
China
Singapore
Disaggregation↓ Value Rank Value Rank Value Rank
Foreign market access (1-7) 2 94 1.9 125 3.9 13
Tariff faced (per cent) 5.4 59 5.4 58 4.2 5
Source: Compiled from ‗The Global Enabling Trade Report‘ 2014.
Graph 5: Comparing ETI of India with Developing Asia, China and Singapore
Graph 5, gives a pictorial representation of India‘s relative position/score (1-7) with developing
Asia, China and Singapore in terms of all the pillars of ‗enabling trade‘. It shows that except pillar-
2, where India scores marginally higher than China, India scores less than both China and
Singapore in all the pillars of ‗Enabling Trade‘ which includes domestic market access, foreign
market access, border administration, infrastructure and operating environment.
3.2 A Case study of coffee
In order to understand better the process of importing a product in India, we chose to exemplify it
using the sub-header 090111 – Coffee-not roasted, not decaffeinated. If the goods are cleared
through the Electronic Data Interchange (EDI) System, no formal bill of entry is filed because it is
generated by the computer. However, the importer is required to file a cargo declaration. In the
non-EDI system, the importer has to have a bill of entry certifying that the goods specified in
description and value are entering the country from abroad. The bill of entry has to be submitted in
different copies and different colours for different purposes. A bill of entry for home consumption
has to be submitted when the imported goods are for full consumption in India. A bill of entry for

15
warehouses has to be presented whenever the imported goods are to be stored in a warehouse
without payment of duty to be clearer later. Finally, a bill of entry for ex-bond clearance is used for
clearing good stored in a warehouse. The goods are classified and valued at the time of clearance
(Government of India 2013).
Along with the bill of entry, other documents are generally required are:
Signed invoice
Packing list
Bill of Landing or Delivery Order/Airway Bill
GATT declaration form duly filled in
Importers declaration
License wherever necessary
Letter of Credit/Bank Draft/wherever necessary
Insurance document
Import license
Industrial License, if required
Test report in case of chemicals
Adhoc exemption order
DEEC Book/DEPB in original
Catalogue, technical write up, literature in case of machineries, spares or chemicals as may
be applicable
Separately split up value of spares, components machineries
Certificate of Origin, if preferential rate of duty is claimed
No Commission declaration
For clearance, except from Bangladesh (0per cent), Bhutan (0 per cent), Maldives (0 per cent),
Nepal (0 per cent), Sri Lanka (0 per cent) and Pakistan (20 per cent) India charges an ad-valorem
tariff of 100 per cent to the imports of coffee (090111) from the world. In addition to the basic
custom duty, customs also charges an education cess, a secondary and higher education cess and
an additional countervailing duty, which increases the price of coffee (090111) in 111.12%
(Government of India 2014).

16
Table 11. Legislation regulating non-tariff measures applied by India for 090111 Coffee,
not roasted, not decaffeinated
Rule Type
Agricultural Produce (Grading and Marketing act 1937),
General Grading & Marketing Rules, 1988, Legal Metrology
(Packaged Commodities) Rules 2011
Technical barrier
Central Board of Excise and Customs – Additional custom
duties
Charges, taxes and other
quantity control measures
Director General Foreign Trade (DGFT) notification –
Identification, Assessment and Collection of Anti-dumping
Duty on Dumped Articles and for Determination of Injury,
Custom notification No 06/2012 (NT)
Price control measure
Food Safety and Standards (Food Products Standards and
Food Additives) Regulations 2011, Food Safety and
Standards (Laboratory and Sample Analysis) Regulations
2011, Food Safety and Standards (Packaging and Labeling)
Regulations 2011, Food Safety and Standards (Licensing and
Registration of Food Business) Regulations 2011, Foreign
Trade Policy 2009-14, Plant Quarantine (Regulation of
Import into India) Order 2003, Food Safety and Standards
(Contaminants, Toxins and Residues) Regulations 2011
Sanitary and phytosanitary
measure
Ministry of Defense – Defense procurement procedure 2011 Trade-related investment
measures
The Prevention of Food Adulteration Rules, 1955 Technical barrier and Sanitary
and phytosanitary measure
Source: International Trade Centre (2014)

17
4.0 High import duties on trade Distortions
In this section an attempt is made to understand the effects of high import duties on major
stakeholders such as domestic customers, business groups, and industries. For an effective
evaluation of this process, i.e., the relation between heavy import duties (on imported finished
goods and raw materials), and the associated multi-dimensional effect on the economy as a whole
can be understood with the help of this analytical framework.
Graph 6: Analytical Framework
The analytical framework includes four channels to describe this phenomenon. It points out the fact
that India‘s international trade describes potential and untapped opportunities for further trade
facilitation. In an empirical study, Topalova and Khandelwal (2011) find that lower input tariff on
final goods and the access to better inputs have increased firm-level productivity. They claim that
the effect was strongest in import competing industries and industries not subject to excessive
domestic regulations. According to Zaki (2014), improvements in trade facilitation to lower red
tape, or administrative barriers, following WTO provisions for expediting the movement, release
and clearance of goods, India can have an export gain of US $35 billion(constant prices 2005) by
2020. Prabir De (2013) affirms that despite services having emerged as crucial economic activities
in India, a growing number of barriers have been impeding India's international market access in

18
the services sector. In his article, an analysis of the linkages between India's services trade flow and
its probable barriers is estimated. He estimates that a 1 per cent improvement in services trade
facilitation measures would lead to a 2 per cent rise in services exports in India.
4.1 A case study of Gold: Effects of High Import Duty
India is the largest importer of gold in the worldxiv
accounting for 20 per cent of the total import
share in 2013. Due to the huge trade deficit (190.91 USD) in the year 2012, the government of
India introduced a hike in the customs duty to 10 per centxv
(Global Average Import Duty- 3.9 per
cent). The immediate effect was that import of gold was reduced to 845 tonnes in 2012-13 as
against 919 tonnes during 2011-12. Although, the hike in duty to some extent has helped in
reducing the current account deficit and has fetched good amount of customs income, it has also
resulted in giving rise to several problems in the Indian economy. The immediate effect is that
increase in duty has raised the price of gold in India (Table13), secondly, it has affected the
jewellery manufacturers/industry and thirdly, high demand and high import duty gave rise to
parallel economy (black marketing and smuggling).
A. Incidence of import duty on domestic consumer
To calculate the incidence of import duty and the loss of consumer welfare, we first calculate the
increase in duty amount after adding the basic duty along with other compulsory duties. India
imported USD 37.71 billion worth of gold in 2013, which is also the CIF Value comprises the cost,
insurance and freight. This CIF value of gold is most important for the calculation of Import duty.
Table12 shows that after adding all the basic and additional duties, the total duty amount becomes
USD 11 billion.

19
Table 12: A Disaggregated calculation of Import duty on Gold in India
Formula
Duty Rates
(in Per cent)
Duty Amount
(USD)
Assessable Value-(A) (CIFxvi
value + 1 % Landing charge
of CIF)
(A)
38088965470
Basic Duty -(B) (A)×Basic Duty Rate 10 % (current rate)
(B)
3808896547
Preferential Duty-(B) (A)×Pref. Duty Rate 0 %
(B)
0
CVD: Additional Duty-(C ) (A+B) × CVD Rate 12 %
(C )
5027743442.04
Central Excise Edu Cess-(D) (C ) × Central Excise Edu
Cess Rate 3 %
(D)
150832303.26
Customs Education Cess-(E) (B+C+D) × Customs Edu.
Cess Rate 3 %
(E )
2696,24,168.77
Special CVD- Special Duty-(F) (A+B+C+D+E) × Spl.
CVD Rate 4 %
(F)
1893842477.24
Total Custom Duty (A+B+C+D+E+F)
11150938938
i. Consumers’ welfare loss under different import restriction regimes
As already discussed, that consumption of gold is not confined to any single community in India,
we have considered the entire Above Poverty Line (APL) population for the stakeholder analysis
for gold consumption. Here, an attempt is made to analyse the incidence of import duty in terms of
per capita consumption of gold in value terms.

20
Table 13: Effect of Import duty on domestic consumers (Major Stakeholder)
APL
Population*
in India
CIF Amount
(USD)
Basic Duty
(B)
Total Duty
Amount
(A+B+C+D+E+F)
Total Value
after Tariff
(USD)
Per Capita
Consumption
(USD)
89,06,89,950 37,711,847,000 Situation-A (0%) 0 37,711,847,000 42.34 $
89,06,89,950 37,711,847,000 Situation-B (2%) 7,483,427,656 45,195,274,656 50.74 $
89,06,89,950 37,711,847,000 Situation-C (10%) 11,150,938,938 48,862,785,938 54.86 $
Note: Census 2011 population in India-1,263,390,000 (1.26 Billion). According to Rangarajan
committee, 29.5 per cent of the India‘s population lives below the poverty line (BPL). APL
Population*- Population living above the poverty line.
Table13 shows that, in case of ‗Situation-A‘ if all the import duties (basic and additional) are
removed, the per capita consumption of gold (in value terms) among the APL population during
2013 is USD 42.34. In case of ‗Situation-B‘ the persistence of 2 per cent duty as before, the per
capita consumption would be USD 50.74. ‗Situation-C‘ (hiking basic duties to 10 per cent), the per
capita consumption in value terms rose to 54.86 USD. This shows that, the hike in duty (a highly
demanded product across population) has increased the per capita consumption on gold by around
USD 12 (burden faced by consumer or welfare loss to consumers equals USD 12, approximately
INR 760).
ii. Indian consumers’ welfare loss compared to the consumers’ in the United Kingdom
Table 14: Price difference between India and United Kingdom
Year
Mumbai
INR/10 grams
London
INR/10 grams
Spread in
Rupees
2013-14 29,190 25,739 3,451
2012-13 30,164 28,919 1,245
2011-12 25,722 25,394 328
2010-11 19,227 18,937 290
2009-10 15,756 15,570 186
Note: INR-Indian Rupees. Source: 1. Bombay Bullion Association Ltd; 2. Economic Times,
Mumbai; 3. Press Trust of India; 4. IMF IFS; 5. London Bullion Market Association.
21
Table14 shows that during 2009-10, the difference between the gold prices in India and UK was
only INR186 per 10 grams, when the import duty on gold was around 1-2 per cent for both the
countries. Although during 2013-14 the prices fell marginally for both the countries (global prices
fell by 5 per centxvii
), the difference of prices between India and the UK rose to INR 3451 per 10
grams of gold. This is due to the increase of basic import duty to 10 per cent during 2012-13,
whereas in the United Kingdom the basic duty is maintained at around 2 per cent. This difference in
price (INR 3451 or USD 54.24) between the two countries can be interpreted as the absolute
welfare loss of Indian consumer compared to the consumer in the UK in buying 10 grams of gold.
B. Effects of high import duty on domestic jewellery manufacturers:
Given the rise in price of gold and gold artefacts such as jewellery in India, Indian manufacturers
are losing business from the NRI customers who constitute major buyers of Indian jewellery. Given
the drastic increase in price of the raw material, i.e. gold, it becomes very difficult to compete in the
international market, as a result the domestic manufacturers suffered loss and was forced to reduce
imports.
C: Illegal activities: black marketing and smuggling:
The hike in import duty on gold has resulted in an increase of smuggling activities in India. It is
estimated that smuggled gold into India is likely to reach 200 tonnes in 2013, 50 per cent higher
than 2012, (estimated World Gold Council). The Minister of State for Commerce and Industry
wrote to Lok Sabha that the number of gold smuggling cases has gone up recently from 500 in
2011-12, to 869 in 2012-13, to further 2441 cases in 2013-14. Gold imports are also serving to
channelize undeclared earnings by importers of India. In doing so, the importers over-invoice their
imports/manipulate to stash black money in other countries. This stashed money abroad is routed to
India by importing gold (official channel or smuggled), which can be disposed in to Indian rupees
as gold commands insatiable demand from rural India.
5.0 Conclusion
A detailed evaluation of the ‗Enabling Trade Index‘ (ETI) suggests that India imposes a lot of duty
restrictions and undue regulations on her imports which is affecting her trade with the rest of the
world. To some extent, it also deprives India of her foreign market access for exports. Not only
that, imposition of high tariffs are also posing as burden for the importers and major stakeholders
such as domestic consumers, traders and manufacturers, as witnessed in the case of gold. What is

22
more significant is the procedure that hinders smooth and progressive imports to the country. It is
very difficult to state which of these factors—tariff and import procedures—is more adverse in
creating conducive import environment. However, this study attempts to suggest that import tariffs
have to be lessened and more importantly import procedures have to be reduced to create an
atmosphere of competition in policy action.
References
De, Prabir. "Assessing Barriers to Trade in Services in India: An Empirical Investigation." Journal
of Economic Integration 28, no. 1 (2013): 108-43.
Government of India. Business.gov.in. 2013. http://business.gov.in/taxation/import_procedures.php
(accessed June 16, 2014).
—. Ice-gate: ecommerce Portal of Central Board of Excise and Customs. 2014.
https://www.icegate.gov.in/Webappl/ (accessed June 16, 2014B).
International Trade Centre. Market Access Map. 2014. http://www.intracen.org/ (accessed May| 27,
2014).
—. Trade Map. 2014. http://www.trademap.org/ (accessed June 16, 2014B).
Miller, Terry, Anthony Kim, and Kim Holmes. 2014 Index of Economic Freedom. New York: The
Wall Street Journal, 2014.
The Heritage Foundation. "2014 Economic Freedom Heat Map." Heritage.org. 2014.
http://www.heritage.org/index/heatmap (accessed June 10, 2014).
Topalova, Petia, and Amit Khandelwal. "Trade Liberalization and Firm Productivity: the case of
India." The Review of Economics and Statistics 93, no. 11 (2011): 995-1009.
United States Trade Representative. 2014 National Trade Estimate Report on Foreign trade
Barriers. Washington D.C.: USTR, 2014.
—. 2014 Report on Technical Barriers to Trade. Washington D.C.: USTR, 2014B.
World Bank. Doing Business. Washington D.C.: World Bank, 2014.
—. Doing Business 2014: India Country Report. Washington DC: World Bank, 2014B.

23
World Economic Forum. Enabling Trade Widget. 2014. http://widgets.weforum.org/global-
enabling-trade-report-2014/ (accessed June 10, 2014).
—. Global Competitiveness Report 2013-2014. Geneva: WEF, 2013B.
—. The Enabling Trade Index. Geneva: WEF, 2014C.
World Trade Organization. "Tariff Profiles: India." World Trade Organization Official Site. 2014B.
http://stat.wto.org/TariffProfiles/IN_E.htm (accessed June 11, 2014).
Zaki, C. "An Epirical assessment of the trade facilitation initiative: econometric evidence and
global economic effects." Worls Trade Review, 2014: 103-30.
i International Trade Statistics database http://www.trademap.org/tradestat/Country_SelProduct_TS.aspx
ii Discussed in details in section- , in Enabling Trade Index (ETI) Framework.
iii Refer the World Customs Organization (WCO) website for more information on Harmonized System (HS):
http://www.wcoomd.org/en/topics/nomenclature/instrument-and-tools/hs-online.aspx
iv Trade balance is the difference between the import and the export value of a country.
v The Director General of Foreign Trade advices the Government in the formulation of India‘s Foreign Trade Policy
(FTP) after consulting with various trade bodies, such as the Federation of Indian Export Organisations, the
Federation of Indian Chambers of Commerce and Industry, the Confederation of Indian Industries, and various
other councils. The Tariff Commission, also within the Ministry, issues recommendations on the appropriate tariff
levels. However, the tariff and other duties are under the purview of the Central Board of Excise and Custom
(CBEC) at the Ministry of Finance.
vi The score shows the responses weighted according to their respective rankings. The information is drawn from the
2013 edition of the World Economic Forum‘s Executive Survey. Respondents were asked to select the most
problematic factors from a list of twelve and eight, respectively for exporting and importing. Respondents were
further asked to rank these from 1 (most problematic) to 5. A score was assigned for each answer based on the rank,
from 5 points for the first-ranked factor to 1 point for the fifth-ranked. These are then put into a percentage
distribution.
vii Score of all these factors adds up to 100.
viii OECD means Organization for Economic Co-operation and Development, member countries are: Australia,
Austria, Belgium, Canada, Chile, Czech Republic, Denmark, Estonia, Finland, France, Germany, Greece, Hungary,
Iceland, Israel, Italy, Japan, Korea, Luxemburg, Mexico, Netherlands, New Zealand, Norway, Poland, Portugal,
Slovak Republic, Slovenia, Spain, Sweden, Switzerland, Turkey, United Kingdom and United States.
ix The CEAMA (Consumer Electronics and Appliances Manufacturers Association of India), for some time, had
been lobbying the government to restrict imports of ‗Flat Panel TVs‘. This resulted in the imposition of 36.05 per
cent of import duty from August 26th
2013 onwards. Previously this item was carried as personal baggage (Zero

24
import duty on electronics valued up to USD 600) by customers and travellers from mainly Dubai, Bangkok or
Singapore where the difference in price is around 30-35 per cent lesser compared to India.
x India, often fails to observe transparency requirements, such as publication of timing and quantity restrictions in its
official gazette or notification to WTO committees.
xi Maximum rate of tariff allowed by WTO to any member state for imports from another member state is called
bound rate. The term MFN means the country which is the recipient of this treatment must, nominally, receive equal
trade advantages as the "most favoured nation" by the country granting such treatment.
xii The ETI framework captures the various dimensions of enabling trade, breaking them into four overall issue
areas, called subindexes: A. Market access measuring tariff regime. B. Border administration assessing the quality,
transparency and efficiency of border administration in the country. C. Infrastructure measuring the quality and
availability of infrastructure necessary for trade. D. Operating environment: (The Global Enabling Trade Report,
2014).
xiii Lot of variations exist between tariffs of similar products such as garments. For example, the tariff on ski suits is
18 per cent, other garments, men‘s or boys is 17 per cent (if made of cotton), 7.5 per cent on clerical or
ecclesiastical garments or vestments (made of man-made fibre and 6 per cent on saris. William Watson, ―Lets end
three digit taxes on imported goods‖, Montreal Gazette, November 5, 2014,
http://montrealgazette.com/news/national/opinion-lets-end-three-digit-taxes-on-imported-goods.
xiv On average India imports in excess of 1000 tonnes annually this includes unofficially smuggled gold. The annual
gold imports were around USD 50 billion (2012) which was only next to crude oil imports. Gold imports cost is
nearly 3 per cent of the GDP. http://en.wikipedia.org/wiki/Gold_Control_Act.
xv This has resulted in the decline in the official imports to 638 tonnes in 2013-14 from 845 tonnes in the previous
fiscal year.
xvii Rahul Oberoi, ―Losing its Glitter‖, Business Today, October 26, 2014,
http://businesstoday.intoday.in/story/gold-prices-us-economy-current-accountdeficit/1/211037.html.