india’s new, high-growth trajectory: implications for
TRANSCRIPT
INDIA’S NEW, HIGH-GROWTH TRAJECTORY: IMPLICATIONS FOR DEMAND,
TECHNOLOGY AND EMPLOYMENT
C.P. Chandrasekhar*
Evidence on trends in surplus generation and utilisation suggest that India’s recent transition to a high-growth trajectory has been accompanied by and partly based on tendencies towards profit inflation and increased inequality. In addition, sectorally, the pattern of growth involves indifferent or dismal performance in the agricultural sector, and poor employment growth despite high output growth in themanufacturing and services sectors. Based on a discussion of the stimuli driving growth and the consequent factors underlying the dissociation between output and employment growth in the non-agricultural sectors, this paper offers an explanation as to why the net implications for employment and conditions of work of the growth trajectory have been adverse.
Two developments have been taken as confirmation of the view that India has transited to a virtuous, high growth trajectory in recent years. One is the evidence of a near sustained 8-9 per cent rate of GDP growth since 2003-04 and the rather quick and sharp recovery of GDP growth after the deceleration triggered by the global financial and economic crisis. The second is the evidence of a significant pick-up in the rates of growth of employment between the 55th and 61st Rounds of the National Sample Survey Organisation (NSSO) relating to 1999-2000 and 2004-05 (National Sample Survey Organisation, 2001 and 2006).
These numbers are seen as indicating that India is now not only placed on a high-growth trajectory, but that this trajectory is beneficial from an employment and social development point of view. However, there are some who still find the need to raise two sets of questions. The first set relates to the sustainability of this growth, given the factors that are responsible for the traverse to this higher growth trajectory. The second relates to the interpretation of the evidence on the employment and distributional outcomes associated with this growth.
The high rate of growth during the last few years was accompanied by a number of important structural changes in the economy. The first of these was a sharp rise in savings and investment rates. The domestic savings rate or the ratio of gross savings to GDP as per the old series of the CSO touched 29.1 per cent in 2004-05. This implies an increase of 5.5 percentage points since 2001-02, before which the rate had remained stagnant and even declined since the mid-1990s. As per the series with 2004-05 as the base, the gross savings
The Indian Journal of Labour Economics, Vol. 54, No. 1, 2011
* Professor, Centre for Economic Studies and Planning, School of Social Sciences, Jawaharlal Nehru University, New Delhi. Email: [email protected]. This paper is based on the V.B. Singh Memorial Lecture delivered at the 52nd Conference of the Indian Society of Labour Economics, 17-19 December 2010, Karnatak University, Dharwad, India.
32 THE INDIAN JOURNAL OF LABOUR ECONOMICS
rate rose from 32.2 per cent in 2004-05 to 36.4 per cent in 2007-08, before falling to 32.5 per cent in 2008-09. The fall in 2008-09 was because of a fall in public sector savings, possibly as a result of the implementation of the Sixth Pay Commission’s recommendations. Overall, the rise in the savings rate has coincided with an increase in the rate of investment, which explains the higher rate of growth over the last few years, suggesting that the economy is transiting to a sustainable, higher growth trajectory, financed by domestic resources.
The second structural change was a shift in the source of private savings in the economy away from the household to the corporate sector. The share of the corporate sector in the gross domestic savings rose from 20.4 per cent in 2004-05 to 24 per cent in 2007-08, while that of the household sector fell from 72.3 per cent to 62.2 per cent.
The third was a turnaround in the tax-to-GDP ratio. Between 2001-02 and 2007-08, the tax to GDP ratio at the Centre rose from 5.9 per cent to 9.3 per cent. The aggregate tax-GDP ratio of the Centre and the states rose even more sharply from 13.8 per cent to 19.1 per cent between 2001-02 and 2008-09. It must be noted that the period after 2002-03 was one in which profits in the organised sector rose sharply, while the ratio of profits to value added also rose significantly, and the saving and investment rates in the corporate sector recorded sharp increases. Thus, the improvement in the tax-to-GDP ratio was not just the result of higher growth, but was due to the fact that high growth was accompanied by significantly increased inequalities in the organised sector.
Thus, growth in recent years appears to have been accompanied by and partly based on tendencies towards profit inflation and increased inequality. It is to be expected that a growth trajectory with these features would have adversely impacted the labour market, influencing the volume, pattern and nature of employment. Yet, there is much optimism, based on the short run evidence, that employment in India is far more responsive to output growth and far more resilient in the face of shocks than elsewhere in the world. The source of that optimism is the evidence of a quick and sharp recovery in employment growth after the deceleration triggered by the global financial and economic crisis. Thus, according to the limited, inadequately comparable and not too reliable quarterly surveys of employment trends in selected sectors by the Labour Bureau of the Government of India, the recession-induced decline in employment of 4.91 lakh workers during the period October–December 2008, had been followed by employment increases in all quarters except one (April–June 2009) over the year ending December 2009. The net increase in employment during that year has been placed at 12.8 lakh workers. What is more, subsequent surveys over the first three quarters of the calendar year 2010 suggest that employment increased by 0.61 lakh during the period January to March, by 1.62 lakh during the period April to June, and by 4.35 lakh over the period July to September that year (Labour Bureau, 2009, January, May, July, and November; and 2010, February, May, October and November). In sum, the return to the post-2003 high growth trajectory signalled by the quarterly GDP growth rates seems to have had a positive impact on employment. However, the limited scope of these ‘quick’ surveys of selected sectors makes them inadequate assessments of employment trends across the economy.

INDIA’S NEW, HIGH-GROWTH TRAJECTORY 33
Such an assessment necessitates turning to data that is more reliable. As is widely acknowledged, the quinquennnial large sample rounds of the NSSO provide the most exhaustive data on employment trends and conditions in India. Unfortunately, the results of the latest such survey on this subject—the 66th Round, covering the year 2009-10—are yet to be released, making it difficult to assess the impact on employment of the transition to high growth since 2003-04, since the previous large sample round relates to the year 2004-05.
However, the 64th Round of the NSS (National Sample Survey Organisation, 2010), which had migration as its focus and includes the annual ‘thin’ sample coverage of employment and unemployment, does provide us with an additional source of data. Since the 60th Round, the annual thin sample rounds covering employment have used a separate schedule (Schedule 10) on employment and unemployment, which is canvassed over a separate set of sample households. Moreover, the overall sample size for the NSS 64th Round is seen as being comparable with that of the large sample NSS 61st round (National Sample Survey Organisation, 2006) and both were oriented towards households and persons as opposed to being enterprise-based. The real difference is that the second stage stratum (SSS) in the NSS 64th Round was designed to net more migrants and remittance-recipient households, since migration was the main focus of this round. On the other hand, the SSS in the NSS 61st Round was tailored to provide adequate representation to the different strata of the population to facilitate a study of their employment characteristics. This difference notwithstanding, it could be argued that we have a reasonably comparable set of estimates for the years till 2007-08.
Chart 1Annual Rates of Employment Growth for Usual Status Workers (Per Cent)
1.36
2.77
2.03
3.39
0.66
2.27
1.97
3.22
1.27
2.64
0
0.5
1
1.5
2
2.5
3
3.5
4
Rural Urban
1983 to 1987-88 1987 -88 to 1993-94 1993-94 to 1999-2000 1999- 2000 to 2004- 05 1999 -2000 to 2007-08
Sources: NSSO, 1992; 1997; 2001; 2006; 2010.
The availability of the 2007-08 estimates is of significance because of the important changes that had occurred with respect to employment during the first five years of this millennium relative to the earlier periods. The first important change, when compared with the previous period, relates to aggregate employment growth itself. (Aggregate employment
34 THE INDIAN JOURNAL OF LABOUR ECONOMICS
is calculated here by using the NSS workforce participation rates and population estimates of the Registrar General of India based on Census data.) The late 1990s constituted a period of quite dramatic deceleration of aggregate employment generation, which fell to the lowest rate recorded since such data began being collected in the 1950s. However, the period 1999-2000 to 2004-05 witnessed a recovery, as shown in Chart 1.
What is noteworthy, however, is that if we include another relatively high growth year, that is, 2007-08, the rate of growth over the period 1999-2000 to 2007-08 points to much less acceleration in employment growth. To recall, the period between 2004-05 and 2007-08 was the period when India had moved to the much higher, close-to-9 per cent GDP growth trajectory. A slower rate of employment expansion during this period points to a significant fall in the elasticity of employment with respect to output. The increase in employment growth rates between 1993-94 and 1999-2000, and between 1999-2000 and 2007-08 in urban areas was marginal, going up from 2.27 per cent to 2.64 per cent. What is more striking are the figures on the rates of growth of rural employment. That figure had risen from 0.66 per cent during 1993-94 to 1999-2000 to 1.97 per cent during 1999-2000 and 2004-05, which, it must be noted, was a year of indifferent agricultural performance. On the other hand, the rate was significantly lower at 1.27 per cent over the period 1999-2000 to 2007-08, which was a good agricultural year.
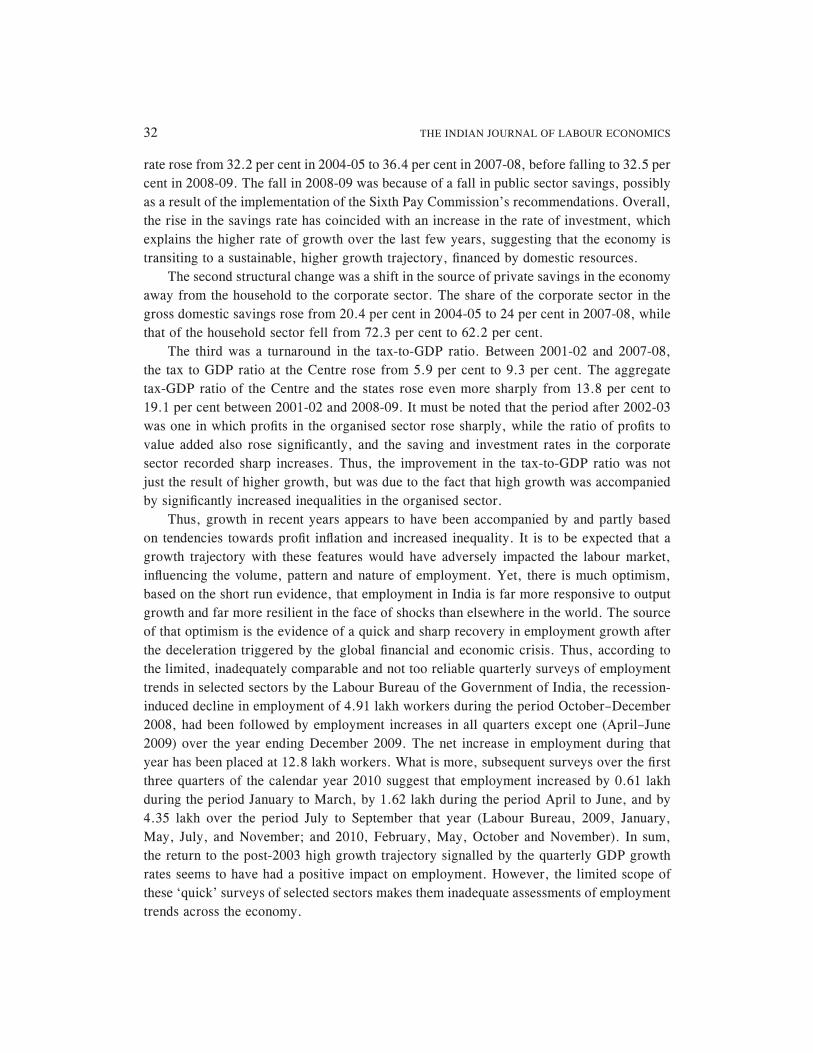
The importance of the years concerned being good or bad agricultural years come through from an examination of labour force participation rates (LFPRs). There was an increase in the labour force participation rates for both men and women in 2004-05 relative to 1999-2000 (see Table 1). This includes both those who were actively engaged in work and those who were unemployed but looking for work. The significant increase in female participation may have been because of the need to substitute (in the lands cultivated by individual households) for male workers who were looking for better opportunities outside agriculture in a poor agricultural year. Or it may be a reflection of the need to augment household earnings in a bad year. These possibilities are corroborated by the fact that in the good agricultural year 2007-08, while male participation rates increased marginally, those of women fell significantly, possibly because the compulsions operating in a bad
Table 1Labour Force Participation Rates
Usual Status (PS+SS) Current Daily Status1993-94 1999-2000 2004-05 2007-08 1993-94 1999-2000 2004-05 2007-08
Rural males
56.1 54 55.5 55.9 53.4 51.5 53.1 53.6
Rural females
33 30.2 33.3 29.2 23.2 22 23.7 20.4
Urban males
54.3 54.2 57 57.6 53.2 52.8 56.1 56.8
Urban females
16.5 14.7 17.8 14.6 13.2 12.3 15 12.5
Sources: NSSO, 1997; 2001; 2006; 2010.
INDIA’S NEW, HIGH-GROWTH TRAJECTORY 35
year were not operative. This suggests that higher participation rates as in 2004-05 need not necessarily be a reflection of improved employment performance. In fact, it warrants noting that the increase in aggregate LFPRs in 2004-05 incorporates the declining rates of labour force participation among the youth, that is the age group of 15-29 years, and a rise for the older age cohorts.
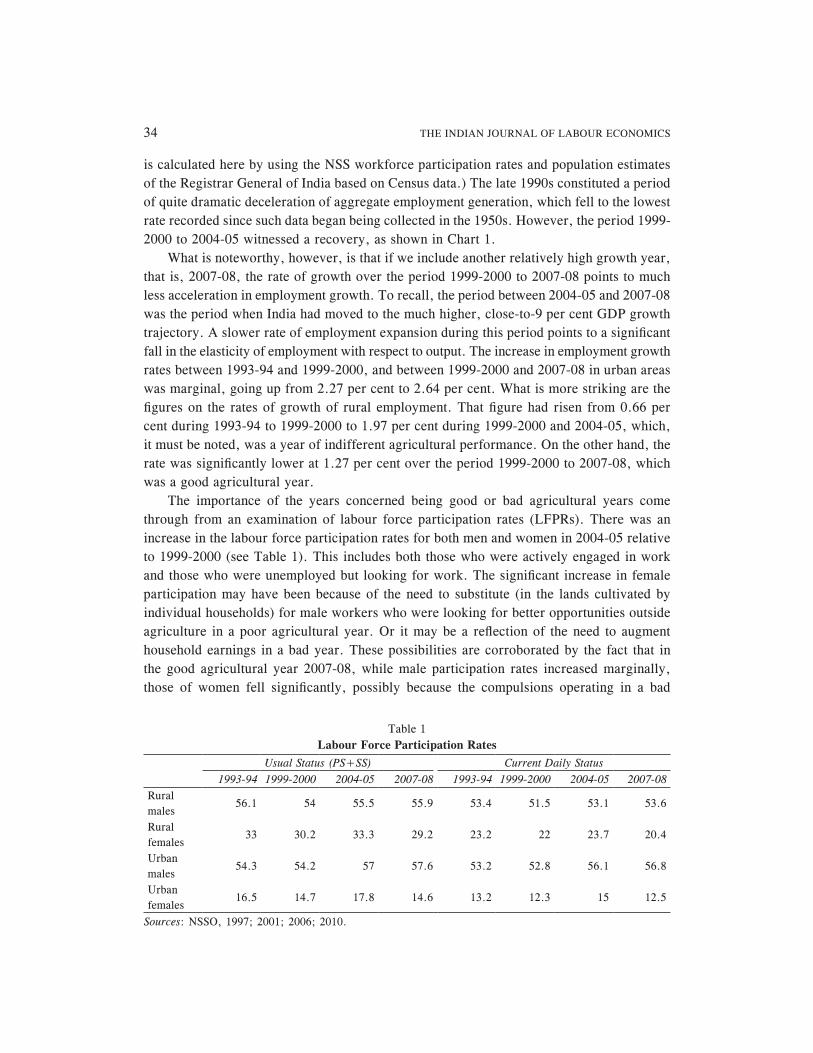
The changes in work force participation, provided in Chart 2, mirror the changes in labour force participation for 2004-05, but to a lesser extent. The biggest change here was for urban males, many more of whom describe themselves as working in some fashion than during the two preceding survey periods. On the other hand, in 2007-08, not only was there
Chart 2Work Participation Rates by Current Daily Status (Per Cent)
50.4
21.9
49.6
12
47.8
20.4
49
11.1
48.8
21.6
51.9
13.3
49
18.7
52.9
11.3
0
10
20
30
40
50
60
Rural males Rural females Urban males Urban females
1993 -94 1999 -2000 2004 -05 2007 -08
Sources: Same as for Table 1.
Sources: Same as for Chart 1.
29.2
31.4
33.8
36.2
32.9
35.5
35.3 35.5
38.739.6
32.6
37.6
15.414.6
16.3 16.8
14.615.4
28.4
25.4 25.8
21.4
16.7
19.9
10
15
20
25
30
35
40
45
1983 1987-88 1993-94 1999-2000 2004-05 2007-08
Rural males Rural females Urban males Urban females
Chart 3Share of Casual Labour in Total Usual Status Employment
36 THE INDIAN JOURNAL OF LABOUR ECONOMICS
no similar significant increase in male work force participation, but there was actually a significant fall in the case of female participation in work in both rural and urban areas. This partly corroborates the argument advanced above.
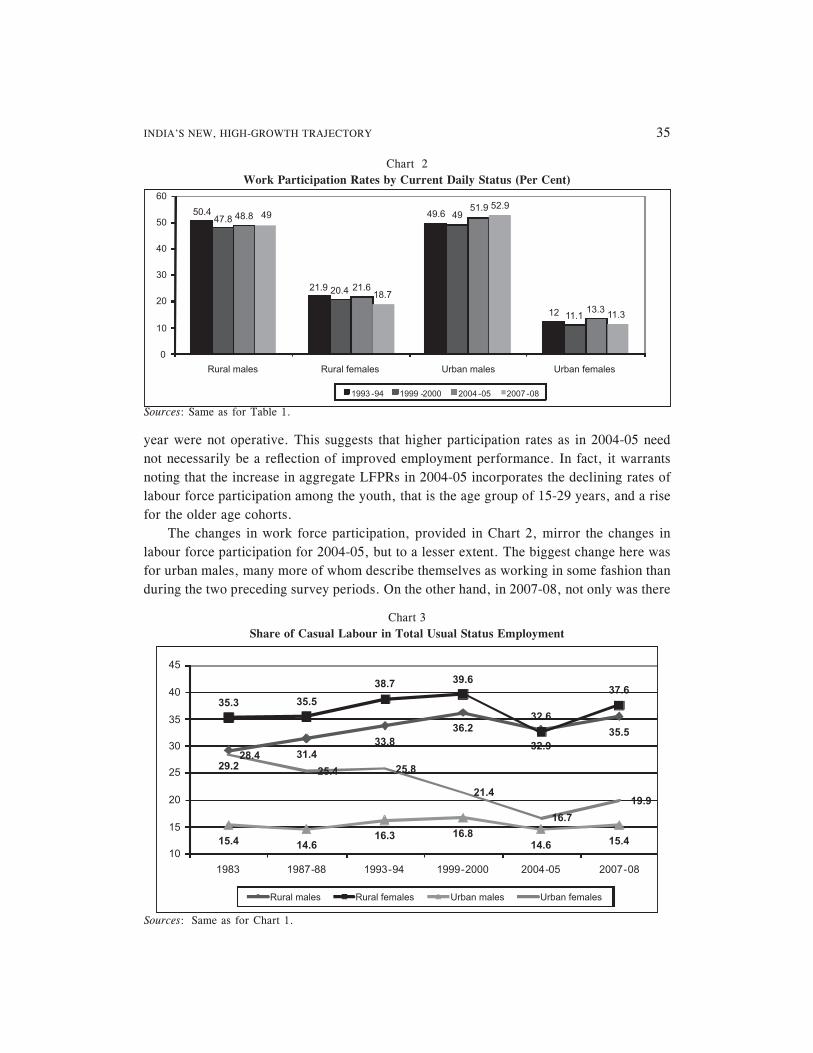
One of the more interesting features that emerged from the data for 2004-05 was the shift in the type of employment. There had been a significant decline in wage employment in general. While regular employment had been declining as a share of the total usual status employment for some time (except for urban women workers), wage employment had continued to grow in share because employment on casual contracts had been on the increase. But the 2004-05 Round pointed to a fall even in casual employment as a proportion to the total employment, as indicated in Chart 3.
Going by the evidence for 2004-05, it appeared that for urban male workers, the total wage employment was at the lowest than it had been in at least two decades, driven by declines in both regular and casual paid work. For women, in both rural and urban areas, the share of regular work has increased but that of casual employment has fallen so sharply that the aggregate share of wage employment has fallen. Thus, members of the working population faced a real and increasing difficulty in finding jobs, whether they be in the form
60.5
58.657.7
55
58.1
55.4
61.960.8
58.657.3
63.7
58.3
40.941.7 41.7 41.5
44.8
42.7
45.847.1
45.8 45.3
47.7
42.3
35
40
45
50
55
60
65
1983 1987-88 1993-94 1999-2000 2004-05 2007-08
Rural males Rural females Urban males Urban females
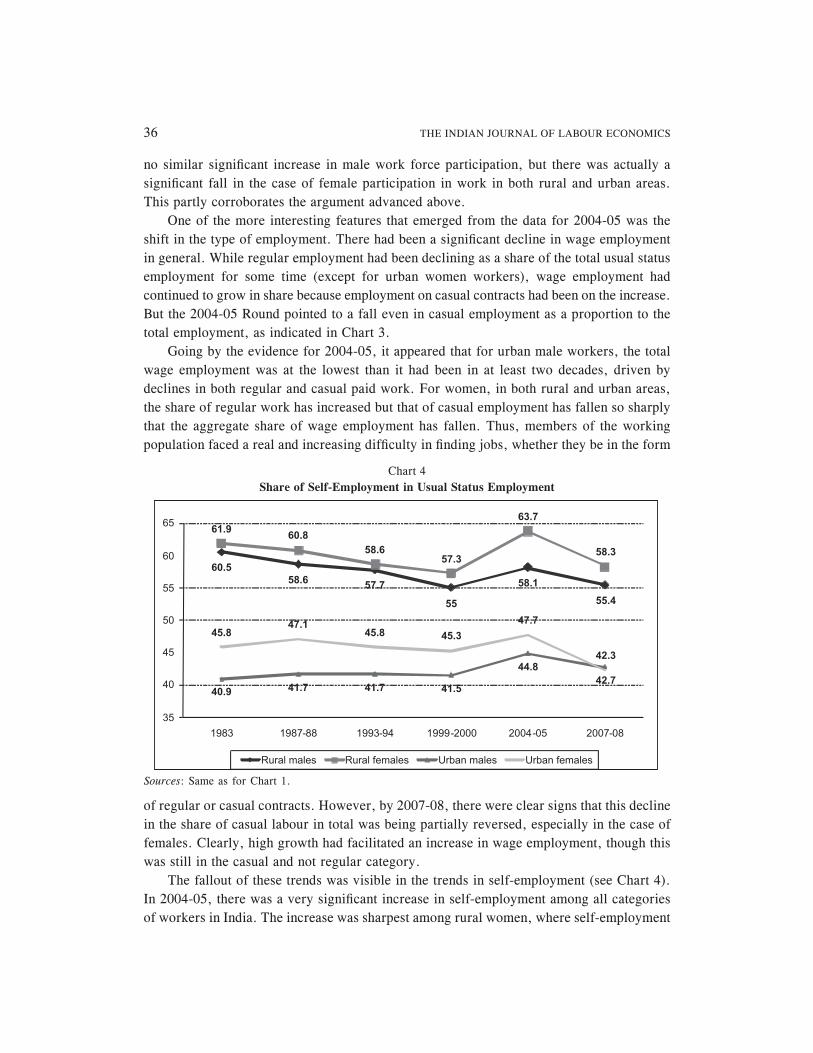
Chart 4Share of Self-Employment in Usual Status Employment
Sources: Same as for Chart 1.
of regular or casual contracts. However, by 2007-08, there were clear signs that this decline in the share of casual labour in total was being partially reversed, especially in the case of females. Clearly, high growth had facilitated an increase in wage employment, though this was still in the casual and not regular category.
The fallout of these trends was visible in the trends in self-employment (see Chart 4). In 2004-05, there was a very significant increase in self-employment among all categories of workers in India. The increase was sharpest among rural women, where self-employment

INDIA’S NEW, HIGH-GROWTH TRAJECTORY 37
Per Cent of Usual Status Employment (PS+SS)1993-94 1999-2000 2004-05 2007-08
AgricultureRural males 74.1 71.4 66.5 66.5Rural females 86.2 85.4 83.3 83Urban males 9 6.6 6.1 5.8Urban females 24.7 17.7 18.1 15.3
ManufacturingRural males 7 7.3 7.9 7.7Rural females 7 7.6 8.4 7.4Urban males 23.5 22.4 23.5 23.5Urban females 24.1 24 28.2 27.5
ConstructionRural males 3.2 4.5 6.8 7.7Rural females 0.9 1.1 1.5 2Urban males 6.9 8.7 9.2 9.5Urban females 4.1 4.8 3.8 4.3
Trade, hotels and restaurantsRural males 5.5 6.8 8.3 7.6Rural females 2.1 2 2.5 2.3Urban males 21.9 29.4 28 27.8Urban females 10 16.9 12.2 12.8
Transport, storage and communicationsRural males 2.2 3.2 3.8 4Rural females 0.1 0.1 2 2Urban males 9.7 10.4 10.7 10.9Urban females 1.3 1.8 1.4 1.8
Other servicesRural males 7 6.1 5.9 5.7Rural females 3.4 3.7 3.9 4.3Urban males 26.4 21 20.8 21Urban females 35 34.2 35.9 37.8
Table 2 Employment By Industry
Sources: Same as for Table 1.
accounted for nearly two-thirds of all jobs. But it was also remarkable for urban workers, both men and women, among whom the self-employed constituted 45 and 48 per cent respectively, of all usual status workers. What seems to have occurred in 2007-08 was that the rise in the share of casual employment had been accompanied by a fall in self-employment, with the fall again being the sharpest in the case of females.1
Table 2 provides details of the industries in which workers are engaged. As is to be expected, given the short period of time involved, there have been no major changes in the structure of employment between 2004-05 and 2007-08, except for a rise in the share of construction among rural males. Thus, the trends in the structure of employment prior to 2004-05 have been more or less sustained. One of the prime trends among these is the fact
38 THE INDIAN JOURNAL OF LABOUR ECONOMICS
that while there has been a significant decline in agriculture as a share of rural employment, the share of manufacturing employment has not gone up commensurately for rural male workers. The share of manufacturing employment has stagnated in the urban areas as well. And there has been some shift towards construction. However, the share of trade, hotels and restaurants seems to be stagnating. And, interestingly, the big shift for urban women workers has been towards manufacturing, the share of which increased by more than 4 percentage points in 2004-05 and more or less maintained that position in 2007-08. However, a substantial part of this is in the form of self-employment.
Thus, overall, the traverse to a high growth trajectory does not seem to have delivered too much on the employment front. The growth rate of employment remains depressed even though not as alarmingly as during the period 1993-94 to 1999-2000. Employment increases seem to occur when workers, especially female workers, are pushed into the workforce by economic circumstances like a poor agricultural year. The elasticity of employment with respect to output increases seems to have deteriorated with accelerated growth. Casual wage and self-employment dominate the employment scenario. And manufacturing and organised services appear to contribute little to additions to employment though these were the sectors that were expected to take up the employment slack once neo-liberal policies succeeded in delivering growth. This implies that the areas in which growth is seen to occur, delivering large surpluses, higher savings and higher tax revenues for the government, are the areas where employment has not been too responsive.
All this suggests that while the years of high growth may have been accompanied by increased employment, that employment has not been manifested either in the productive sectors or in forms which suggest that growth does result in the generation of what has been termed ‘decent work’ of one kind or another. Growth occurs in an environment in which a huge reserve army, unsupported by any form of social security, spills over into casual employment and self-employment, with extremely adverse distributional and social welfare implications. This necessitates an examination of why the ‘new’, high-growth sectors have failed to deliver on the employment front. Answers are needed for two questions. The first relates to the factors that stimulated the high growth recorded over much of this decade. And the second question pertains to the factors that explain why that growth, while seemingly contributing to an increase in employment, has not done so in ways that indicate satisfactory outcomes in the labour market. In what follows, I partially address these questions by focusing on the registered manufacturing sector, which is an important provider of decent employment.
I. EMPLOYMENT TRENDS IN THE REGISTERED MANUFACTURING SECTOR
Interestingly, though there are many sources of information on employment in registered manufacturing, there is no clarity on what has been happening in this area. If we go by the figures on registered manufacturing sector employment available from the Annual Survey of Industries (see Chart 5), registered manufacturing employment, which rose between the mid-1980s and mid-1990s, subsequently declined and touched a low in 2002-03. Since then, it seems to have risen sharply, then equalled and marginally exceeded its 1995-96 peak in 2006-07 and 2007-08. While this does not point to a long run increase in registered

INDIA’S NEW, HIGH-GROWTH TRAJECTORY 39
Chart 5ASI Estimates of Registered Manufacturing Employment
0
1981-8
21982-8
31983-8
41984-8
51985-8
61986-8
71987-8
81988-8
91989-9
01990-9
11991-9
21992-9
31993-9
41994-9
51995-9
61996-9
71997-9
81998-9
91999-0
02000-0
12001-0
22002-0
32003-0
42004-0
52005-0
62006-0
72007-0
8
2000000
4000000
6000000
8000000
10000000
120000006
10
56
22
78
94
25
4
63
12
67
3
81
66
16
8
79
94
40
6
79
81
37
0
75
84
00
7
75
48
75
5
79
03
82
6
78
58
28
1
82
56
71
2
82
79
40
3
83
19
56
3
88
35
95
2
88
37
71
6
92
27
09
7 10
22
21
69
95
36
28
2
10
07
34
85
81
72
83
6
79
87
78
0
77
50
36
6
79
35
94
8
78
70
08
1
84
53
62
4
9111
68
0
10
32
84
34
10
45
25
35
81
98
11
0
78
80
53
6
71
36
09
7
65
99
29
8
60
86
90
8
61
61
49
3
59
57
84
8
61
35
23
8
62
80
65
9
63
64
46
4
76
52
25
4
72
08
14
3
76
32
29
7
69
70
11
6
66
32
32
3
66
49
31
0
62
69
03
9
63
07
14
3
63
26
54
1
60
26
32
8
60
61
78
6
58
06
86
6
58
19
16
9
60
91
40
9
61
58
83
7
Source: Central Statistical Organisation, Annual Survey of Industries data deflated by GDP deflator for manufacturing. Data available at www.mospi.nic.in.
manufacturing employment, it suggests that there has been no absolute decline in employment between the mid-1990s and the mid-2000s.
However, data from the Directorate General of Employment and Training points to a different picture. It shows that while there has been some recovery in employment in the private organised manufacturing sector between 2004 and 2007, the persistent decline of employment in organised manufacturing in the public sector has meant that the overall increase in organised manufacturing employment has been marginal. As a result, employment at the end of March 2007 was significantly below that at the end of March 1997 (see Chart 6).
While differences in coverage and definitions can possibly explain the discrepancy in the level of employment and its direction between these two sources, overall there does not appear to have been any improvement in organised manufacturing employment during the period of high growth, which was also a period of high manufacturing growth (see Table 3).
In order to explain these outcomes, we need to turn to the pattern of organised manufacturing growth during the period since liberalisation, and especially more recently, and the factors determining those patterns. There are three factors that are of relevance here. The first is, of course, public expenditure, which has been extremely unstable since the 1990s. This instability stems, inter alia, from the following three sources: (i) variations in the government’s degree of adherence to its irrational fiscal deficit targets; (ii) a sudden burgeoning of public expenditure towards the end of the 1990s because of the implementation of the Fifth Pay Commission’s recommendations; and (iii) the influence of the political business cycle, which results in a ramping up of public expenditures of certain kinds in the run-up to an election. However, on an average, it appears that government spending has ceased to be as much of

40 THE INDIAN JOURNAL OF LABOUR ECONOMICS
Chart 6Employment in Organised Manufacturing
Source: Ministry of Finance, Government of India, Economic Survey, various issues.
Table 3Annual Trend Rates of Growth Based on the IIP
Total Manufacturing Mining & Quarrying Electricity
1950-51 to 64-65 (a) 7.2 7.1 5.9 13.6
1965-66 to 79-80 (b) 4.7 3.8 6.9 6.2
1965-66 to 74-75 (b) 4.3 2.7 9.4 3.8
1975-76 to 84-85 (c) 4.9 4.3 6.6 7.3
1985-86 to 94-95 (d) 6.2 6.2 4.2 8.3
1994-95 to 2009-10 (e) 6.41 6.87 3.24 5.14
1994-95 to 2002-03 (e) 5.78 6.22 2.40 5.45
2003-04 to 09-10 (e) 7.08 7.56 3.64 5.44
Source: Central Statistical Organisation, Government of IndiaNotes: a) Based on series with base 1950-51 =100 b) Based on series with base 1970 =100 c) Based on series with base 1970 =100 d) Based on series with base 1980-81 =100

INDIA’S NEW, HIGH-GROWTH TRAJECTORY 41
a stimulus to growth, with fiscal conservatism leading to an overall deflationary trend in the system. Unstable government expenditure, while contributing to instability in industrial growth, has not been a long run influence in raising the trend rate of growth.
The second factor influencing manufacturing growth during the post-liberalisation years was the increase in access to domestically assembled or produced import-intensive manufactured goods. Initially, this led to a spurt in demand and production due to the release of the pent-up demand for such goods among sections which had the ability and the desire to consume such goods, but whose consumption of such commodities was limited by controls on imports of both final products, as well as intermediates and components. Inasmuch as such pent-up demand is soon satiated, the spur to growth provided by this specific, ‘once-for-all’ factor evaporated, resulting in a slowing down of the growth rate, pending an expansion of the market for such manufactures among a larger section of the population.
Finally, more recently, manufacturing growth has been the result of a specific way in which that market for manufactures has been expanded, especially in urban India, during the years of neo-liberal reform, that is, through a boom in housing and consumer credit. One consequence of financial liberalisation and the excess liquidity in the system created by the inflow of foreign financial capital, has been the growing importance of credit provided to individuals for specific purposes such as purchases of property, automobiles and consumer durables of various kinds. This implies a degree of dis-saving on the part of individuals and households. It also implies that financial institutions, which are willing to provide such credit without any collateral, are betting on the inter-temporal income profile of these individuals, since they are seen as being in a position to meet their interest payment and amortisation commitments on the basis of speculative projections of their earnings profiles. These projections are speculative because with banks and other financial institutions competing with each other in the housing and consumer finance markets, the tendency is towards an expansion in the universe of borrowers, with individuals being able to easily take on excess debt from multiple sources, without revealing to any individual creditor their possible over-exposure to debt.
One implication of the expansion of the market for manufactures through these means is that the occurrence and the extent of such expansion depend crucially on the ‘confidence’ of both lenders and borrowers. Lenders need to be confident of the future ability of their clients to meet interest and repayment commitments. Borrowers (excluding those consciously involved in fraud) need to be confident of their ability to meet, in the future, the commitments that they are taking on in the present. This crucial role of the ‘state of confidence’ in triggering this form of demand is what is captured in the oft-used phrase: ‘the feel good factor’. Since there is a strong speculative element involved in lenders providing credit and borrowers increasing their indebtedness, the state of confidence of both parties matters. When such confidence is ‘good’, we can experience growth or even a boom. When such confidence is low in the case of either borrowers or lenders, we can experience recessionary conditions. The exogenous, supply-side influenced surge of capital inflows into India has not merely increased liquidity in the system but bolstered such, possibly misplaced, confidence. The result is the growth experienced by the registered manufacturing sector.

42 THE INDIAN JOURNAL OF LABOUR ECONOMICS
Table 4IIP-based Rates of Growth of Manufacturing Production
(Use-based Classification): 1994-95 to 2004-05Growth Rate Contribution
Basic Goods 4.49% 1.59%Capital Goods 6.92% 0.67%
Intermediate Goods 6.39% 1.69%
Consumer Goods 6.45% 1.83%Durables 9.16% 0.47%Non-Durable 5.65% 1.31%General 5.83% 5.83%
Source: Computed from Index of Industrial Production. Data released by the Central Statistical Organisation (CSO).
The role of these factors is partly corroborated by the pattern of manufacturing growth during the 1990s. As Table 4, providing rates of growth of sub-groups based on the used-based classification of the IIP, indicates, a major source of growth has been the contribution made by the consumer goods sector. Moreover, even though its low weight makes its contribution to aggregate manufacturing growth less significant, the growth performance of the consumer durables sector has been the best.
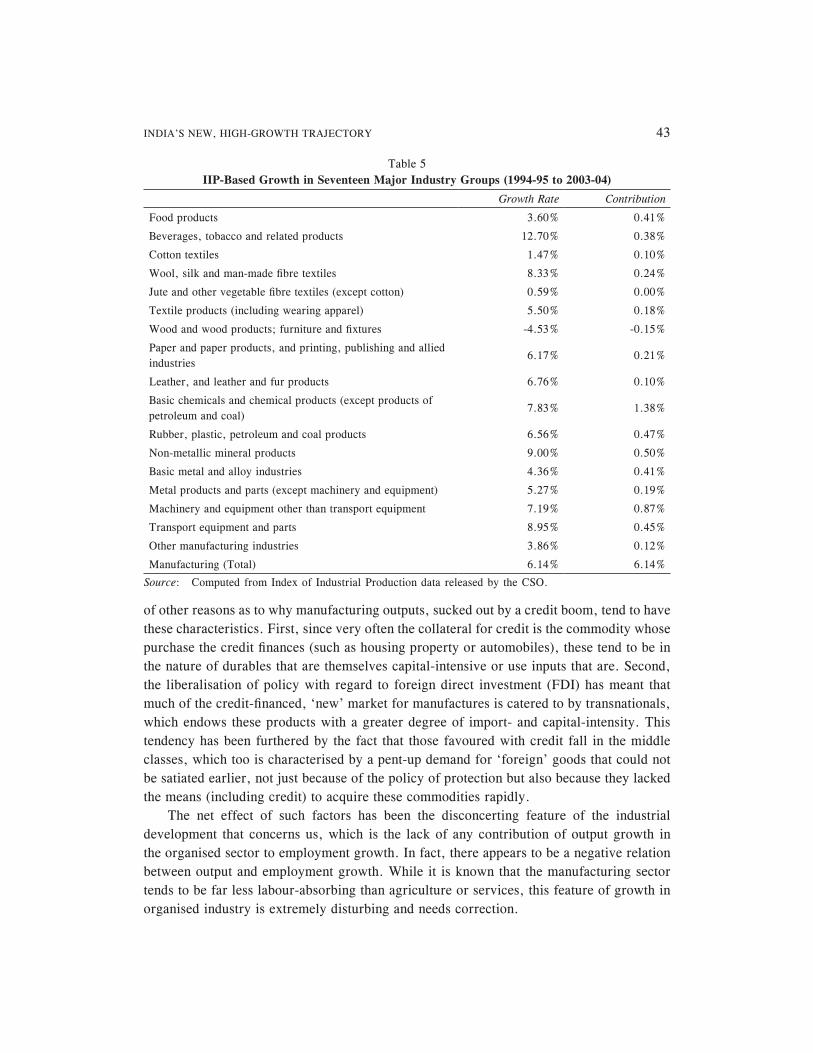
Implicit in these explanations of growth is the understanding that exports triggered by the effects of liberalisation do not constitute an important source of growth, even if they have played a role in specific industries. If we examine the growth performance of the seventeen major industry groups, we find that growth was unevenly distributed across the manufacturing sector with seven of these seventeen groups being characterised by growth rates that were significantly above the manufacturing average, including three by rates close to the average and eight by rates well below the average. It is indeed true that in a couple of the industry groups that have been growing at or above the average rate, such as leather and leather and fur products, and basic chemicals and chemical products (except products of petroleum and coal), export growth has been creditable. However, exports do not account for even a partial explanation for growth in most of the better performing industry groups.
An important implication of debt-financed manufacturing demand is that in the first instance, it is inevitably concentrated in a narrow range of commodities that are the targets of personal finance. Commodities vary from construction materials to automobiles and consumer durables. Their importance in terms of the contribution to growth is corroborated, however tangentially because of the nature of aggregation, by the data provided in Table 5. To the extent that these commodities are capital- and import-intensive in nature, the domestic employment and linkage effects of this expansion would be limited. Not only would employment growth be limited, as has been the case, but sustaining the growth process would necessitate greater generation of the same kind of demand. Manufacturing growth would become increasingly dependent on speculative factors.
It hardly bears stating that a large share of the commodities for which the demand is triggered by credit are both capital- and import-intensive in character. There are a number
INDIA’S NEW, HIGH-GROWTH TRAJECTORY 43
of other reasons as to why manufacturing outputs, sucked out by a credit boom, tend to have these characteristics. First, since very often the collateral for credit is the commodity whose purchase the credit finances (such as housing property or automobiles), these tend to be in the nature of durables that are themselves capital-intensive or use inputs that are. Second, the liberalisation of policy with regard to foreign direct investment (FDI) has meant that much of the credit-financed, ‘new’ market for manufactures is catered to by transnationals, which endows these products with a greater degree of import- and capital-intensity. This tendency has been furthered by the fact that those favoured with credit fall in the middle classes, which too is characterised by a pent-up demand for ‘foreign’ goods that could not be satiated earlier, not just because of the policy of protection but also because they lacked the means (including credit) to acquire these commodities rapidly.
The net effect of such factors has been the disconcerting feature of the industrial development that concerns us, which is the lack of any contribution of output growth in the organised sector to employment growth. In fact, there appears to be a negative relation between output and employment growth. While it is known that the manufacturing sector tends to be far less labour-absorbing than agriculture or services, this feature of growth in organised industry is extremely disturbing and needs correction.
Table 5IIP-Based Growth in Seventeen Major Industry Groups (1994-95 to 2003-04)
Growth Rate Contribution
Food products 3.60% 0.41%
Beverages, tobacco and related products 12.70% 0.38%
Cotton textiles 1.47% 0.10%
Wool, silk and man-made fibre textiles 8.33% 0.24%
Jute and other vegetable fibre textiles (except cotton) 0.59% 0.00%
Textile products (including wearing apparel) 5.50% 0.18%
Wood and wood products; furniture and fixtures -4.53% -0.15%
Paper and paper products, and printing, publishing and allied industries
6.17% 0.21%
Leather, and leather and fur products 6.76% 0.10%
Basic chemicals and chemical products (except products of petroleum and coal)
7.83% 1.38%
Rubber, plastic, petroleum and coal products 6.56% 0.47%
Non-metallic mineral products 9.00% 0.50%
Basic metal and alloy industries 4.36% 0.41%
Metal products and parts (except machinery and equipment) 5.27% 0.19%
Machinery and equipment other than transport equipment 7.19% 0.87%
Transport equipment and parts 8.95% 0.45%
Other manufacturing industries 3.86% 0.12%
Manufacturing (Total) 6.14% 6.14%
Source: Computed from Index of Industrial Production data released by the CSO.
44 THE INDIAN JOURNAL OF LABOUR ECONOMICS
As Patnaik (2006) notes, there are reasons to believe that the pattern of manufacturing growth under an open economic regime is such that the responsiveness of employment growth to the growth in output tends to decline. Thus, the combination of high output growth and low employment growth, is a feature that characterised both India and China during the years when they opened their economies to trade and investment. This makes sense since: (i) with the tastes and preferences of the elite in developing countries being influenced by the ‘demonstration effect’ of lifestyles in the developed countries, new products and processes introduced in the latter very quickly find their way to the developing countries when their economies are open; and (ii) new technologies in the developed countries are characterised by labour productivity that is higher than in developing countries and technological progress in the developed countries is inevitably associated with an increase in labour productivity. Hence, after trade liberalisation, labour productivity growth in developing countries is exogenously given and tends to be higher than it was prior to trade liberalisation, leading to a growing divergence between output and employment growth.
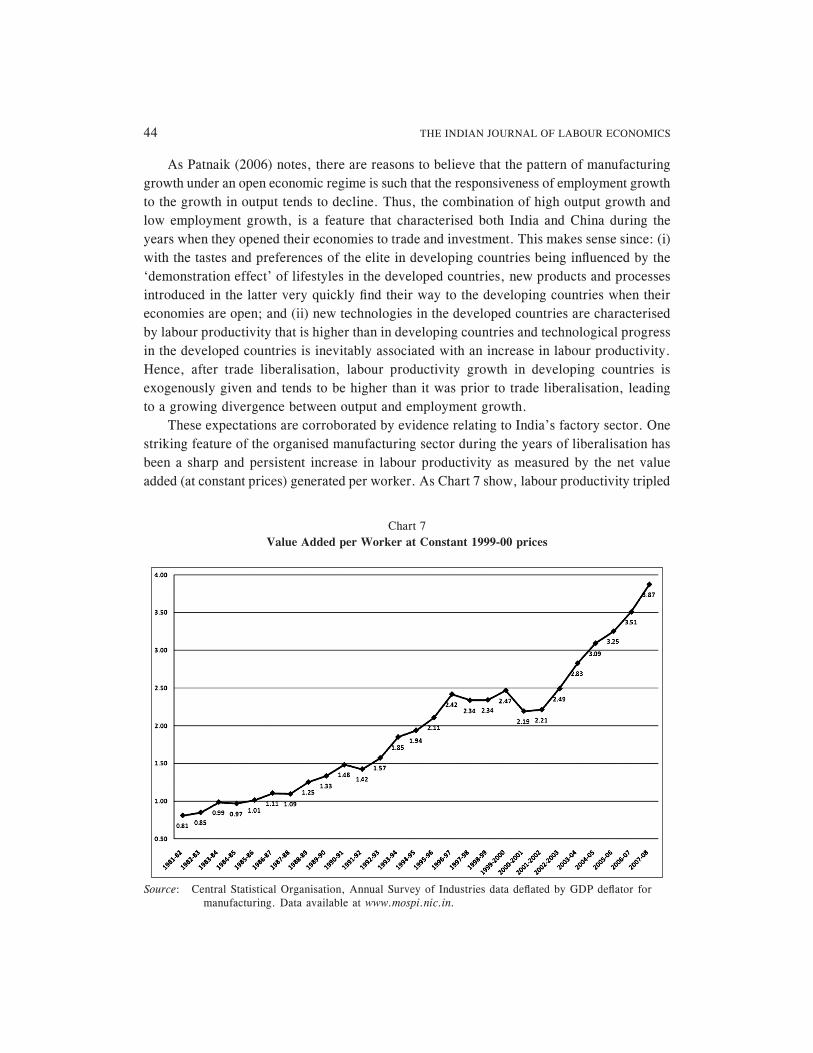
These expectations are corroborated by evidence relating to India’s factory sector. One striking feature of the organised manufacturing sector during the years of liberalisation has been a sharp and persistent increase in labour productivity as measured by the net value added (at constant prices) generated per worker. As Chart 7 show, labour productivity tripled
Chart 7Value Added per Worker at Constant 1999-00 prices
Source: Central Statistical Organisation, Annual Survey of Industries data deflated by GDP deflator for manufacturing. Data available at www.mospi.nic.in.

INDIA’S NEW, HIGH-GROWTH TRAJECTORY 45
between 1981-82 and 1996-97, stagnated and even slightly declined during the years of the industrial slowdown that set in thereafter, and has once again been rising sharply during the last decade. However, the benefits of this increase in labour productivity went largely to those deriving rent, interest and profit incomes, rather than workers. The share of wages in value added, which was stable through most of the 1980s (see Chart 8) has been declining almost consistently since the late 1980s till 1996-97, and then after a period of stability fell sharply to touch less than half its mid 1990s level.
This was the result of two developments. The restructuring of the public sector has meant that public sector manufacturing employment, which was rising during the 1980s (see Chart 6), was on the decline during the years of liberalisation and fell particularly sharply after 1997. Private organised manufacturing employment, which was stagnant during the 1980s, rose marginally during the early 1990s and particularly sharply during the years 1995-97, after which it declined to return to its mid-1990s level by 2003. In the event, aggregate (public and private) organised manufacturing employment rose from 6.1 million in 1981 to 6.4 million in 1994 and to 6.9 million in 1997, and then declined sharply to 6 million in 2003.
The second development of significance is that the average real wage of workers in the organised manufacturing sector has remained more or less constant right through the 1990s (see Chart 9). Together, these have ensured that the benefits of the rise in labour productivity have largely gone to the surplus earners in the sector, which have been the main beneficiaries in the organised manufacturing sectors of the policies of liberalisation in general and trade liberalisation in particular.
Chart 8Ratio of Wages to Value Added in Organised Manufacturing
Source: Central Statistical Organisation, Annual Survey of Industries. Data available at www.mospi.nic.in.

46 THE INDIAN JOURNAL OF LABOUR ECONOMICS
Given these features, it is not surprising that corporate profits, the savings of the corporate sector, and revenues from corporate taxes have been rising while delivering the structural shift in the growth process that we have been witnessing in recent years. Underlying all this is the profit inflation that is inherent in the neo-liberal trajectory of growth which substitutes debt-financed public expenditure with debt-financed private housing investment and consumption expenditure as the principal stimulus to growth.
II. THE ROLE OF SERVICES
This argument is, however, not a complete explanation of the divergence between GDP and employment growth rates because of the dominance of services in total growth. Of the cumulative increase in GDP between 1990 and 2007, while 55 per cent was accounted for by manufacturing in the case of China, as much as 60 per cent was accounted for by services in the Indian case. This shift in favour of services occurred at a time when globally there was a technology-facilitated increase in the exports of services. India’s transition to being a predominantly service economy was at least partly because it benefited from this increase in the global exports of services with its share in world exports of services rising from 1.1 per cent in 2001 to 2.6 per cent in 2006 (Reserve Bank of India, 2009). As a result, India was ranked eleventh among the world’s leading exporters of services. The only other developing country that contributed more than India was China. Within services, India has been the
Chart 9Average Annual Real Wage Per Worker: Organised Manufacturing
Source: Central Statistical Organisation, Annual Survey of Industries. Data deflated by CPI for industrial workers.

INDIA’S NEW, HIGH-GROWTH TRAJECTORY 47
topmost exporter of computer and information services in the international economy since 2005, with its share in the world exports of computer and information services placed at 17 per cent in 2006.
According to the Reserve Bank of India’s (RBI’s) balance of payments data, the gross exports of software, business, financial and communication services amounted to 5.3 per cent of the GDP at market prices in 2007-08, with software services exports touching 3.4 per cent of the GDP. These figures compare with a merchandise exports to GDP ratio of 14.2 per cent.
India’s export success in the Information Technology (IT) and IT-enabled services area has also contributed to an increased presence of these sectors within the domestic economy. In absolute and relative terms, the size of the IT sector in India is now impressive. The Central Statistical Organisation (National Statistical Organisation, Central Statistics Office, 2010) has estimated that the share of ICT services in the total GDP had increased from 3 per cent in 2000-01 to 6 per cent in 2007-08. Information and Communications Technology (ICT) services dominate the ICT industry as a whole, accounting for 90 per cent of the GDP contributed by the sector, and ICT services have increased their share in the service sector GDP from 6 per cent in 2000-01 to 10 per cent in 2007-08. This gives rise to the impression that modern and more productive services are responsible for the dynamism of services and its contribution to GDP growth.
This should have implications for employment growth in the organised sector. Given the technological trajectory, it should be expected that the potential for increases in productivity is far greater in the industry sector than in services. Hence, when services dominate growth, the expectation is that employment growth would be more responsive to output growth. However, in practice, despite the expansion of services, the growth of employment in this sector has been limited. Tertiary sector employment in 2004-05 amounted to only 25 per cent of the workforce despite the fact that more than 50 per cent of the GDP came from this sector. Moreover, between the years 1999-2000 and 2004-05, employment in the tertiary sector increased by only 22 per cent, whereas GDP at constant prices contributed by the service sector expanded by 44 per cent. This was possibly because low-wage employment in traditional services that contributed employment but little in terms of GDP growth combined with high productivity services that delivered substantially in terms of revenues but little in terms of employment.
A typical example of this is the IT sector, the contribution of which to employment does not compare with its role in the generation of income and foreign exchange. Going by NSS figures, employment in computer-related activities (Category 72 of National Industrial Classification 2004) which increased from 314 million in 1999-2000 to 963 million in 2004-05, accounted for 0.2 per cent of the workforce (National Statistical Organisation, Central Statistics Office, 2010). If we consider categories 65 to 74, which cover all business services including financial intermediation, and real estate, renting and business activities, the share of employment in that sector is just 1.7 per cent. This explains, in large measure, the lack of correspondence of the GDP and employment figures. In order to understand this, we

48 THE INDIAN JOURNAL OF LABOUR ECONOMICS
need to turn to the fact that the domestic industry has turned out to be a multi-layered, heterogeneous formation, with firms operating in different hardware, software and services segments, characterised by extremely wide margins. At the top are the successful firms, focusing on the export market for software and IT-enabled services, especially the former. At the bottom are the large numbers of independent assemblers, who find their margins depressed by falling duties on imported systems and components.
According to NASSCOM figures, in 2003-04, the top twenty software and IT services exporters accounted for as much as 61 per cent of the total export revenues. But even within the services segment, the industry is highly differentiated. The revenues per employee are distributed extremely unequally, with the few top players obtaining high margins and a large share of the market, and the industry being overcrowded with a number of small firms with low turnovers and extremely low margins.
A study of 65 small and medium enterprises in the IT sector (Shirsat, 2006), with revenues ranging from Rs. 100 million to Rs. 2 billion, found that their revenues in 2005-06 amounted to just 8.9 per cent of the revenue garnered by the top four IT firms (TCS, Wipro, Infosys Technologies and Satyam Computers). Their profits aggregated Rs. 5.8 billion or 6.9 per cent of the Rs. 84 billion earned by the top four. Thus, high revenue and value added growth reflect growth in profits and not in employment and the wage bill, since the sector is based on the exploitation of the benefits of a cheap, English-educated workforce, often with technical qualifications.
This resulting skewed distribution explains the ‘winner-takes-all’ scenario in the industry, showcased by a few highly successful firms with skyrocketing stock values and billionaire owners, while the fact that the experience of a majority of firms in the sector does not match this scenario goes unnoticed. Extreme concentration with the attendant implications for income inequality is a core feature of the industry. And underlying that inequality is a sharp divergence in employment and ‘output’ growth rates.
The net result has been that despite the rapid growth of services in the Indian economy, employment growth has failed to respond significantly to output growth.
III. CONCLUSION
Thus, the net implications for employment and conditions of work of this process of growth involving indifferent or dismal performance in the agricultural sector, and poor employment growth despite high output growth in the manufacturing and services sectors has been adverse. Ceteris paribus, higher growth rates should lead to higher employment growth. However, the problem here is with the ceteris paribus assumption. It does not take account of the implications of the pattern of growth.
A consequence of that pattern of growth has been that the output per worker has risen significantly in the non-agricultural sector where output growth has been particularly high. Overall, the GDP per worker, which rose by 2.30 per cent and 1.87 per cent, respectively during the 1950s and 1960s, fell to a low of 0.69 per cent in the 1970s. Since then, the rate of increase has been remarkable, standing at 3.53 per cent and 4.32 per cent, respectively,

INDIA’S NEW, HIGH-GROWTH TRAJECTORY 49
during the 1980s and 1990s (Sivasubramonian, 2004, Table 1.1. While a part of this rise in the output per worker may have meant an increase in the wages of sections of the already employed, it would principally mean an increase in income inequality resulting from an increase in managerial salaries and profits. For a majority of those available for and seeking work, the result has been a tendency to fall back on the forms of work that do not offer a decent wage and involve poor working conditions.
Note1. Yet, all told, around half of the workforce in India currently does not work for a direct employer.
This is true not only in agriculture, but increasingly in a wide range of non-agricultural activities.
ReferencesLabour Bureau (2009)—January, May, July, and November; and (2010)—February, May, October and
November), Report on Effect of Economic Slowdown on Employment in India, Labour Bureau, Ministry of Labour and Employment, Government of India, Chandigarh.
National Sample Survey Organisation (NSSO) (1992), Employment and Unemployment in India, 1987-88, Department of Statistics, Government of India, New Delhi.
—— (1997), Employment and Unemployment in India, 1993-94, Department of Statistics Government of India, New Delhi.
—— (2001), Employment and Unemployment Situation in India, 1999-2000, Fifth Quinquennial Survey, Parts I and II, NSSO, Ministry of Statistics and Programme Implementation, Government of India, New Delhi.
—— (2006), Employment and Unemployment Situation in India 2004-05, Parts I and II, National Sample Survey Office, Ministry of Statistics and Programme Implementation, Government of India, New Delhi.
—— (2010), Employment and Unemployment Situation in India, 2007-08, National Sample Survey Office, Ministry of Statistics and Programme Implementation, Government of India, New Delhi.
National Statistical Organisation, Central Statistics Office (2010), Value Addition and Employment Generation in the ICT Sector in India, Ministry of Statistics and Programme Implementation, Government of India, New Delhi.
Patnaik, P. (2006), Technology and Employment in an Open Underdeveloped Economy, Sumitra Chisti Memorial Lecture, New Delhi, (mimeo).
Reserve Bank of India (2009), “Invisibles in India’s Balance of Payments: An Analysis of Trade in Services, Remittances and Income”, Reserve Bank of India Bulletin, Government of India, New Delhi, March.
Shirsat, B. (2006), “Still a Long Way to Go”, Business Standard, New Delhi, July 14.
Sivasubramonian, S. (2004), The Sources of Economic Growth in India, 1950-51 to 1999-2000, Oxford University Press, New Delhi.

JOURNAL OF INDIAN ASSOCIATION OF SOCIAL SCIENCE INSTITUTIONS (IASSI)
IASSI QUARTERLY: Contributions to Indian Social Science
Vol. 29 April-June 2010 No. 2
ARTICLES
Rural Non-Farm Sector in India: Role and Prospects to a Globalising Economy T.S.Papola
Development of Non-Farming Activities, Globalisation and Employment Guarantee Scheme S.C.Jain
Microenterprise Development in India: Experiences and Possibilities Nisha Bharti
Globalisation,Gujarat State and Welfare for Poor Ghanshyam Shah and Kiran Desai
State and Cities in Rajasthan: Pali between the 17th and 19th centuriesSunita Zaidi
Indian in Trinidad: A Study of Sandwich Culture Surendra K. Gupta
BOOK REVIEWS
Satish Chandra: Social Change and Development in Medieval Indian History, Har-Anand publications, New Delhi, 2008, pp. 204, Rs. 395/- Inayat Zaidi
S.R.Mehta (ed.): Socio-cultural Diversities and Globalization: Issues and Perspectives Indian Institute of Advanced Study, Shimla Surendra K. Gupta
SUBSCRIPTION RATES
For India and SAARC Countries, including postage Rs.400/- for one year, Single Copy Rs 100/- For other countries: US$ 75 per year or equivalent, including postage by surface mail.Enquiries and Correspondence should be addressed to Editor, IASSI Quarterly, Room No.76, IIPA.Hostel, Indian Institute of Public Administration, Indraprastha Estate, New Delhi-110 002. Tel: 23324581/2331 5284/23356834, Fax No. 011-23315284, Website: www.iassiorg/www. iassi ssis.org. E-mail: [email protected]/[email protected].