indianapolis public transporation corporation, state of - indygo
TRANSCRIPT

1501 West Washington StreetIndianapolis, IN 46222(317) 635-2100www.IndyGo.net
Indianapolis Public TransporationCorporation, State of Indiana.Comprehensive AnnualFinancial Report for theyear ending December 31,2007. A component unitof the consolidated Cityof Indianapolis-MarionCounty GovernmentReporting Entity.
IndyGo2007 Comprehensive Annual Financial Report
CarmelRt. 200
08 IndyGo Annual Report Final.qxd:IndyGo Annual Report Cover.qxd 5/20/08 2:59 PM Page 1

TABLE OF CONTENTS
SECTION ONE - INTRODUCTORYLetter of Transmittal ......................................................................................................................IIGFOA Certificate of Achievement ............................................................................................... VIOrganizational Chart ...................................................................................................................VIIPrincipal Officials and Management ..........................................................................................VIIIService Area and Routes .............................................................................................................. IXTaxing Districts ..............................................................................................................................X
SECTION TWO - FINANCIALReport of Independent Auditors ......................................................................................................1Management’s Discussion and Analysis .........................................................................................3Financial Statements Statements of Net Assets .....................................................................................................10 Statements of Revenue, Expense and Changes in Net Assets .............................................12 Statements of Cash Flows ....................................................................................................13 Notes to Financial Statements .............................................................................................15
SECTION THREE - STATISTICAL (Unaudited)Financial Trends Net Assets by Component ....................................................................................................38 Operating Expenses by Type ...............................................................................................39 Changes in Net Assets .........................................................................................................40 Revenue Capacity Operating Revenue by Source .............................................................................................41 Nonoperating Revenues and Expenses ................................................................................42 Assessed Value and Estimated Actual Value of Taxable Property .......................................43 Debt Capacity Property Tax Levies and Collections ...................................................................................44 Ratios of General Bonded Debt Outstanding ......................................................................45 Direct and Overlapping Tax Rates .......................................................................................46 Direct and Overlapping Bonded Debt and Bonding Limit ..................................................47
Demographic and Economic Information Demographic and Economic Statistics ................................................................................48 Principal Employers ............................................................................................................49 Principal Property Tax Payers .............................................................................................50
Operating Information Operating Information .........................................................................................................51 Schedule of Insurance in Force ...........................................................................................52 Transit Vehicles....................................................................................................................53

COMPREHENSIVE ANNUAL 2007 FINANCIAL REPORT
Indianapolis Public Transportation CorporationA Component Unit of the ConsolidatedCity of Indianapolis – Marion County
Reporting Entity
Gilbert L. Holmes, President & CEOWayne Oteham, VP/C.F.O./Controller
COMPREHENSIVEANNUAL
FINANCIAL REPORTINDIANAPOLIS, INDIANA
FOR THE YEAR ENDING DECEMBER 31, 2007

SECTION ONE – INTRODUCTORY
Letter of Transmittal ................................................................................................................. IIGFOA Certificate of Achievement ...............................................................................................VIOrganizational Chart .............................................................................................................. VIIPrincipal Officials and Management ...................................................................................VIIIService Area and Routes ..........................................................................................................IXTaxing Districts ........................................................................................................................... X
IndyGo staff celebrates Indianapolis Bike to Work Day. Pictured are (l-r): IndyGo President and CEO Gilbert Holmes, Samantha Cross, Amy Wilmer and West Hardy
Indianapolis Bike to Work Day

II
June 26, 2008
The Board of DirectorsIndianapolis Public Transportation Corporation Indianapolis, Indiana
We submit to you the Comprehensive Annual Financial Report (CAFR) of the Indianapolis Public Transportation Corporation (IndyGo) for the year ended December 31, 2007. IndyGo is a component unit of the Consolidated City of Indianapolis – Marion County Reporting Entity. The IndyGo Controller, management team and staff prepared this report. Responsibility for both the accuracy of the data presented and the completeness and fairness of the presentation, including all disclosures, rests with the Controller and Management team of IndyGo. The data, as presented, is accurate in all material respects. It is presented in a manner designed to set forth the financial position and results of operations of IndyGo. Disclosures necessary to enable the reader to gain the maximum understanding of IndyGo’s financial affairs are included.
OrganizationThe Indianapolis Public Transportation Corporation (IndyGo) is a Municipal Corporation as defined by the “Urban Mass Transportation Act of 1965,” adopted in 1965 by the Indiana General Assembly. In 1973, the company was chartered by city ordinance to provide public transportation for the City of Indianapolis, Marion County, the Town of Speedway and the City of Beech Grove.
A seven member Board of Directors establishes operating policy for IndyGo. The Mayor of the City of Indianapolis and the City-County Council of the City of Indianapolis and Marion County, Indiana appoint the Board, which is bipartisan. The Mayor appoints three members, with the Council appointing four.
The Board of Directors develops policies regarding operations, contracts, safety, financing, organization and structure of the Corporation. To affect these policies, members of the Corporation Board meet regularly in public session. These meetings include presentations by the management staff regarding the operational and financial status of the Corporation.
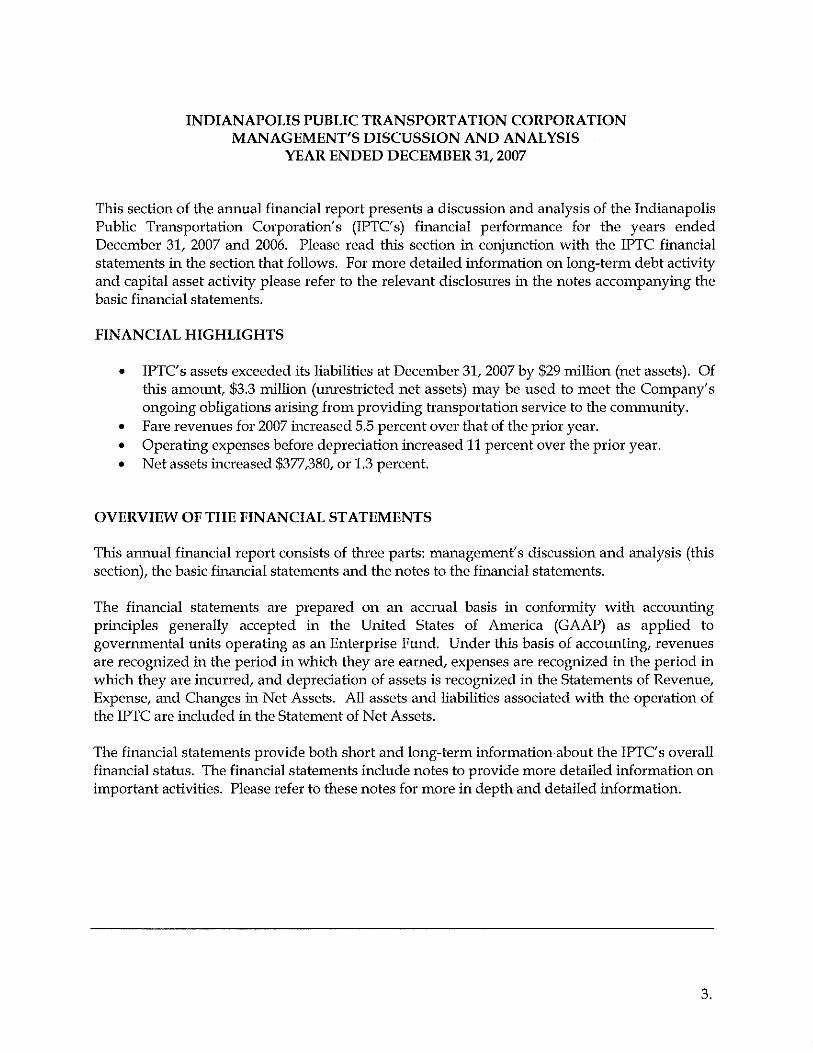
Significant Accomplishments in 2007: Every day, more than 28,200 people depend upon IndyGo. Getting customers to and from their destinations quickly and efficiently remains a top priority. With rising gas prices, ridership system wide quickly garnered record-breaking numbers. Throughout the year, IndyGo continued to build upon momentum and promote the value of investing and supporting public transportation services.
Service Enhancements and Capital Investments:
Implemented two demonstration routes using Congestion Mitigation and Air Quality Funds (CMAQ)IndyGo Commuter Express • Park & Ride routes from regional locations. Using our Comprehensive Operational Analysis as a blueprint, the first IndyGo Commuter Express route was launched in October, giving residents in outlying areas access to public transportation services. The Fishers Express Route operates Monday through Friday, and originates from the Town of Fishers, IN.With plans for two additional ICE routes in 2008, IndyGo stresses the value of reverse commute •options for customers traveling from downtown Indianapolis to the regional locations.Airport to downtown express route. • Getting residents and visitors to and from the Indianapolis International Airport is now easier with the new Green Line Airport/Downtown Express route. This express route offers convenient service seven days per week for only $7 per trip, a plus for travelers seeking cost effective transportation. The Green Line is funded by a CMAQ demonstration grant.

III
Working with Indiana University Purdue University at Indianapolis, IndyGo launched its S pass, providing unlimited rides to all students who pay a mandatory base transportation fee
Designed to help link students to affordable transportation, the S Pass offers unlimited access to all of •IndyGo’s fixed routes including the popular Red Line Circulator.Additionally, students will reduce their transportation and parking costs while contributing to a cleaner •environment.
Implemented an Adopt-A-Shelter programEncourages community groups, individuals and businesses to assist IndyGo with keeping their •neighborhoods attractive, clean and safe. Each adopter agrees to monitor the shelter and work with IndyGo staff to implement improvements •such as planting flowers or removing excessive litter. Additionally, IndyGo will place the adopter’s name on the front of the shelter to acknowledge their contribution.
Unveiled a new comprehensive customer service system, Hastus, to better coordinate customer comments and staff follow up
Replaced older buses to improve fuel efficiency and reduce maintenance costs
Converted to Ultra-low Sulfur Diesel fuel with 10% bio-blend (Indiana Soy Ester)
Installed particulate filters on 1/3 of bus fleet, reducing particulate emissions by 90%
Installed new efficient furnace at IndyGo administrative offices which burns used bus oil saving heating fuel and recycling costs
Utilized new fuel additives and lubricants to increase mileage and lengthen time between oil changes, saving labor and oil
Installed new bus cleaning system reducing labor and utility costs (recycles water)
Utilized new route scheduling software, Hastus, saving thousands of hours in labor costs annually
Upgraded security and fire systems eliminating contracted labor cost
Enhanced the bus preventive maintenance program
Goals for 2008 and Beyond:Implement two additional IndyGo Commuter Express Routes
Launch trip-planning software for web site alongside other web enhancements
Expand community partnerships, i.e., Project Safe Place
Install new Accounting/Management software to monitor and control costs (formerly DOS based system)
Begin implementation of the Computer Assisted Dispatch and Automatic Vehicle Locator (CAD/AVL)
Continue to promote public transportation and secure funding to meet the rising demand for services
IPTC management is responsible for establishing and maintaining internal controls designed to ensure assets are protected from loss, theft, or misuse and to ensure adequate accounting data are compiled to allow for the

IV
preparation of financial statements in conformity with accounting principles generally accepted in the United States of America. Internal controls are designed to provide reasonable, but not absolute assurance that these objectives are met. The concept of reasonable assurance recognizes: (1) the cost of a control should not exceed the benefits likely to be derived; and (2) the valuation of costs and benefits requires estimates and judgments by management.
Budgetary ControlThe Board of Directors adopts a budget in August of each year for the next calendar year. Budgetary control is maintained for certain funds, at the object level of expenditures by the encumbrance of purchase orders against available appropriations. That budget becomes the day-to-day control document of expenditures at the department level. Changes within major account classifications require board approval, while departments are allowed authority to transfer between minor line items within the major accounts.
Cash ManagementAt all times, minimum cash balances are maintained. Investments of temporary idle funds are in demand deposits, money market deposits, repurchase agreements, U.S. treasury bills or similar government issues until funds are needed for expenditures. All deposits are fully insured by the FDIC or the Indianapolis Public Deposits Insurance Fund, a multiple financial institution collateral pool. As of December 31, 2007, excess funds were invested in demand deposit accounts with Indiana financial institutions.
Risk ManagementRisk management activities at IndyGo are an ongoing program of loss prevention, safety inspections, claims processing and payment, and placement of risk insurance coverage combined with self-insurance retention, all designed to maximize the protection of assets of IndyGo. A schedule of risk coverage is included in the Statistical Section, Schedule 15 of this report, and additional information is contained in the Financial Section, notes to financial statement.
In December 1986, the IndyGo Board of Directors approved the establishment of an Excess Liability Reserve, for the purpose of paying personal injury and property damage claims in excess of $100,000. An actuarial study conducted in April 1987, recommended funding levels of between $590,000 and $1,550,000, depending on the confidence level selected. As of December 31, 2007, the Excess Liability Reserve was $1,658,862.
Significant additional self-insured retentions in effect are as follows: Workers Compensation $300,000 per occurrence; property damage to autos and buses – entirely self-insured. The tort claim liability was capped at $500,000 per occurrence during 2007. This liability increased to $700,000 per occurrence beginning January 1, 2008.
Independent AuditThe Indiana Urban Mass Transportation Act of 1965 requires the Controller to annually submit the records for audit by Independent Certified Public Accountants designated by the Board of Directors. As a recipient of federal financial assistance, IndyGo is also required to undergo an annual single audit in conformity with the provisions of the Single Audit Act of 1996 and U. S. Office of Management and Budget Circular A- 133, Audits of State Local Governments and Non- Profits Organizations. The public accounting firm of Crowe Chizek and Company, LLC performed the annual audit, and in addition performed the audit required by the federal Single Audit Act of 1996 and related OMB Circular A- 133. Generally accepted auditing standards set forth in the General Accounting Office’s Government Auditing Standards were used by the auditors in conducting their engagement. The auditors’ report on the financial statements with accompanying notes is included in Section Two of this report. Information related to the single audit report, including a schedule of expenditures of federal awards, the independent auditors’ report on internal controls and compliance with applicable laws and regulations, and a schedule of findings and questioned costs are included in a separately issued single audit report.

V
OTHER INFORMATION
Audit CommitteeBased on recommendations from the Federal Transit Administration, it was suggested that the IndyGo Board of Directors develop an Audit Committee. Gary F. Hentschel was reappointed to serve as Chairman of the IndyGo audit committee for a term of one year. Mr. Hentschel appointed Dennis E. Faulkenberg to serve on the audit committee.
Certificate of AchievementThe Government Finance Officer’s Association of the United States and Canada (GFOA) awarded a Certificate of Achievement for Excellence in Financial Reporting to Indianapolis Public Transportation Corporation (IndyGo) for its Comprehensive Annual Financial Report for the year ended December 31, 2006. In order to be awarded a Certificate of Achievement, a governmental unit must publish an easily readable and efficiently organized comprehensive annual financial report, whose contents conform to program standards. Such reports must satisfy both accounting principals generally accepted in the United States of American and applicable legal requirements.
A Certificate of Achievement is valid for a period of one year. We believe our current report continues to conform to the Certificate of Achievement for Excellence Reporting Program requirements, and we are submitting this report to the GFOA to determine its eligibility for another certificate.
AcknowledgementThe report presented herein could not have been prepared without the assistance of many persons. We appreciate the assistance received from our independent auditors, Crowe Chizek and Company LLC, in the preparation of this report. Appreciation is also expressed to the City of Indianapolis Controllers Office, the Marion County Auditor’s Office, the Indianapolis Economic Development Corporation for their assistance in the Annual Report graphics and demographics and the management and staff of IndyGo.
Respectfully submitted,
Wayne Oteham Gilbert L. HolmesVP/CFO/Controller President/CEO

VI

VII

VIII

IX
System Map
Map Key
(1) (2)

Indianapolis Public Transportation CorporationTaxing Districts
MAP 1 MAP 2
MAP 3 MAP 4
MARION COUNTYAND INCLUDED TOWNS
CONSOLIDATEDCITY OF INDIANAPOLIS
TOWNSHIP(ASSESSED VALUATIONS)
IPTC TAXING DISTRICT
True Value Assessed ValuationMarion County 44,748,394,581 Included towns (9) 706,326,059
Assessed ValuationCity of Indianapolis 41,630,051,327Exluded Cities and Towns 3,118,343,254
IPTC 42,188,083,452 Exluded Cities and Towns 2,560,311,129
[1] The assessed value figures are those certified by State Department of Local Government Finance as of January 1, 2007[2] Map 4 represents the taxing district of IPTC, not including excluded cities and towns.
WILLIAMS CREEK124,865,594
MERIDIAN HILLS282,873,762
ROCKY RIPPLE24,944,250
SPRING HILLS15,950,920
WYNNDALE17,030,210
CLERMONT65,851,488
WARREN PARK58,072,360
CUMBERLAND88,906,370
HOMECROFT27,831,105
SOUTHPORT61,663,754
SPEEDWAY727,114,016
BEECH GROVE558,032,125
LAWRENCE1,771,533,359
REDEVELOPMENT TAX ALLOCATION AREA
PIKE TWP5,813,876,436
WASHINGTON TWP9,504,939,506
LAWRENCE TWP6,565,626,985
WAYNE TWP5,420,422,469
CENTER TWP5,408,300,163
WARREN TWP4,144,872,453
DECATUR TWP1,122,038,192
PERRY TWP4,355,893,211
FRANKLIN TWP2,412,425,166
REDEVELOPMENT TAX ALLOCATION AREA
SOUTHPORT61,663,754
SPEEDWAY727,114,016
LAWRENCE1,771,533,359
X

SECTION TWO – FINANCIAL
Report of Independent Auditors .......................................................................................................1Management’s Discussion and Analysis ..........................................................................................3Financial Statements Statements of Net Assets .......................................................................................................10Statements of Revenue, Expense and Changes in Net Assets .......................................................12Statements of Cash Flows ..............................................................................................................13Notes to Financial Statements. .......................................................................................................15
IndyGo is painting the town Green. Ride the all-new Green Line Airport/Downtown Express.


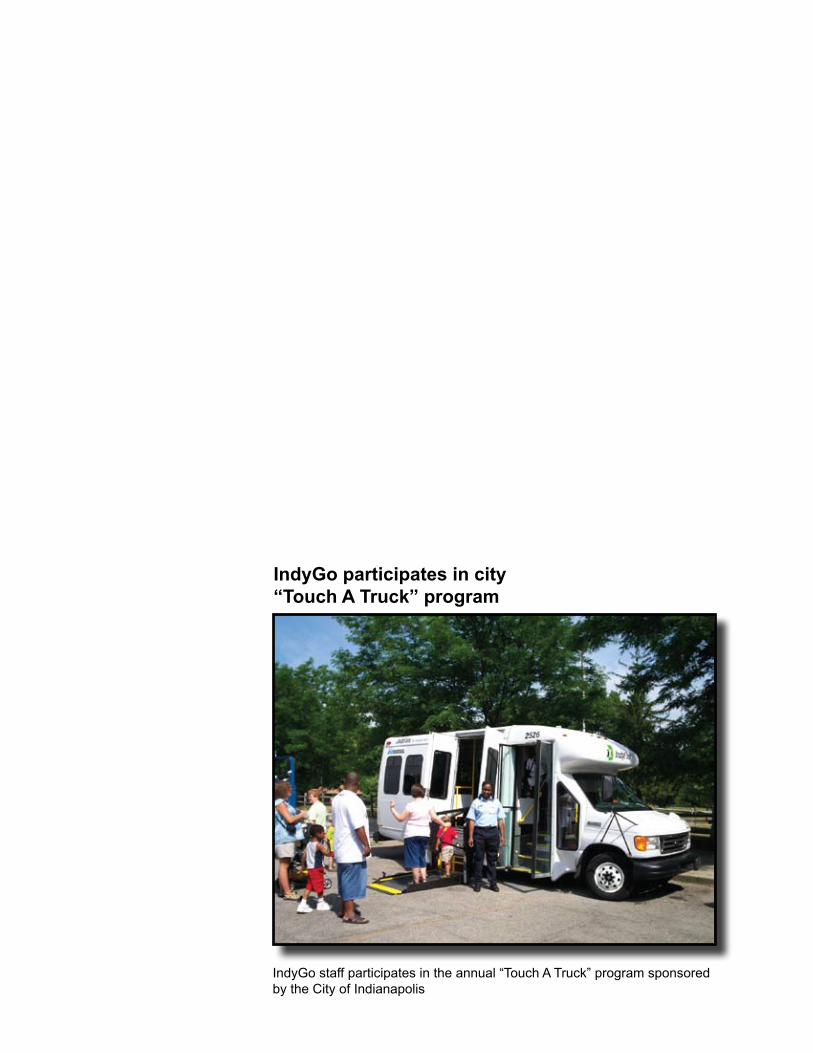
IndyGo staff participates in the annual “Touch A Truck” program sponsored by the City of Indianapolis
IndyGo participates in city “Touch A Truck” program

37
SECTION THREE – STATISTICAL (Unaudited)
This part of the Company’s comprehensive annual financial report presents detailed information as a context for understanding what the information in the financial statements, note disclosures, and required supplementary information says about the Company’s overall financial health.
Schedule Page Financial Trends These schedules contain trend information to assess how the Company’s financial performance and well-being have changed over time. 1 Net Assets by Component ...................................................................................... 38 2 Operating Expenses by Type ................................................................................. 39 3 Changes in Net Assets ........................................................................................... 40
Revenue Capacity These schedules contain information on the Company’s revenue sources and their fluctuation over time 4 Operating Revenue by Source ............................................................................... 41 5 Nonoperating Revenues and Expenses .................................................................. 42 6 Assessed Value and Estimated Actual Value of Taxable Property ......................... 43
Debt Capacity These schedules contain information about the Company’s debt activity and remaining ability to borrow 7 Property Tax Levies and Collections ..................................................................... 44 8 Ratios of General Bonded Debt Outstanding ........................................................ 45 9 Direct and Overlapping Tax Rates ......................................................................... 46 10 Direct and Overlapping Bonded Debt and Bonding Limit .................................... 47
Demographic and Economic Information These schedules offer demographic and economic indicators regarding the environment within the Company’s financial activities take place. 11 Demographic and Economic Statistics .................................................................. 48 12 Principal Employers .............................................................................................. 48 13 Principal Property Tax Payers ............................................................................... 50
Operating Information These schedules contain information about services the Company provides and the activities it performs 14 Operating Information ........................................................................................... 51 15 Schedule of Insurance in Force ............................................................................. 52 16 Transit Vehicles...................................................................................................... 53

38

39

40

41

42

43

44

45

46

47

48

49

50

51

52

53

IndyGo staffers congratulate Ann Thomas. Pictured are (l-r): Kim Harrell, Craig Woodall, Ann Thomas, Gilbert Holmes (IndyGo President and CEO) and Tommie L. Jones (IPTC board vice chair)
For many people, a visit to IndyGo’s Customer Service Center often turns
into a life changing moment. When people walk through the door, Ann
Thomas displays her trademark “eager to help” smile. Alongside navigating
the IndyGo system and planning bus trips, Ann listens intently to people
whether they are IndyGo customers or not. Upon noticing torn clothing or
being told about a person going days without food, Ann eagerly steps in and
offers food, clothing, housing and other necessities. With almost 30 years of
quality customer service, Ann Thomas has shaped the lives of Indianapolis
visitors and residents alike. Photo courtesy of the Indianapolis Convention
and Visitors Association.
2007 Recognition of Service Excellence (ROSE) Award Lifetime Achievement Winner
Ann Thomas
54

1501 West Washington StreetIndianapolis, IN 46222(317) 635-2100www.IndyGo.net
Indianapolis Public TransporationCorporation, State of Indiana.Comprehensive AnnualFinancial Report for theyear ending December 31,2007. A component unitof the consolidated Cityof Indianapolis-MarionCounty GovernmentReporting Entity.
IndyGo2007 Comprehensive Annual Financial Report
CarmelRt. 200
08 IndyGo Annual Report Final.qxd:IndyGo Annual Report Cover.qxd 5/20/08 2:59 PM Page 1