indiana new tech high school research report
TRANSCRIPT


Indiana New Tech High School Research Report
Table of Contents
Introduction ........................................................................................................................................................... 2
Research Design .................................................................................................................................................... 3
Methods .................................................................................................................................................................... 3 Qualitative Data Analysis .................................................................................................................... 5 Quantitative Data Analysis ................................................................................................................. 5 Site Profile ..............................................................................................................................................10 Participant Profile ...............................................................................................................................12
Findings .................................................................................................................................................................15 Curriculum & Instruction .................................................................................................................15 Technology .............................................................................................................................................23 School Culture & Autonomy ............................................................................................................25 Professional Culture ...........................................................................................................................34 Partnership Development ................................................................................................................41 Academic Success & Learning Outcomes ...................................................................................45
Limitations ............................................................................................................................................................65 Recommendations .............................................................................................................................................67
2
Introduction This report documents the fourth year of research on the implementation of the New Tech (NT) model in Indiana schools. Developed and supported by the New Tech Network (NTN), the New Tech model merges project-based learning with integrated technology use and an empowering school culture. In Indiana, the Center of Excellence in Leadership of Learning (CELL) at the University of Indianapolis facilitates a statewide network of New Tech high schools, providing support and collaborative opportunities to schools engaged in the implementation process and schools interested in the New Tech model.
Schools that have adopted the New Tech model have done so in one of three ways: 1) small learning community, which is a small school program in a shared facility for a whole school corporation; 2) whole school implementation, which is a comprehensive high school that has chosen to implement the New Tech model across the whole school for every student, usually transitioning by adding one grade each year so that all students will eventually be New Tech students; or 3) autonomous school, which is a magnet-type program existing on an independent campus and drawing students from nearby district high schools. For this study, schools that began implementation in 2007 are identified as Tier 1 schools, schools that implemented in 2008 are identified as Tier 2 schools, schools that implemented in 2009 are identified as Tier 3 schools, and schools that implemented in 2010 are identified as Tier 4 schools.
All sixteen New Tech high schools operating in Indiana during the 2010-11 school year participated in this research study. CELL created a research plan similar to the plan that was executed during the 2007-08, 2008-09 and 2009-10 academic years, which included collecting data from all schools and analyzing that data as summarized within this report. An additional research partner was the Center for Urban and Multicultural Education (CUME) at Indiana University-Purdue University Indianapolis (IUPUI).
CELL conducted the qualitative data collection and analysis, and the student engagement data collection and analysis for Tier 1, 2 and 3 schools while CUME conducted the qualitative data collection and analysis, and student engagement data collection and analysis for Tier 4 schools. CELL conducted all student-level data collection and analysis for the study. To provide feedback to schools to inform the implementation of the model at specific sites, CELL and CUME provided mid-year feedback and year-end cumulative reports for each school. These reports included a summary of findings and provided recommendations to inform teaching and learning. The qualitative individual school reports are not included in this report to maintain the confidentiality of the schools, their students, and their staff and faculty.
3
Research Design
This study followed the concurrent triangulation mixed methods design (Creswell, 2008)1; quantitative and qualitative data were collected simultaneously over the course of one academic year. The purpose of the study was to examine the successes and challenges of the implementation process, and to provide feedback to schools with the intent of addressing obstacles with progressive solutions. Researchers collected data to illustrate the growth and development around the six primary components outlined in the New Tech Network School Success Rubric: curriculum and instruction, technology, school culture and autonomy, professional culture, partnership development, and academic success. The research questions for the study were:
Who are the students participating in a NTHS based on gender, grade, ethnicity, or
socioeconomic status? How do NTHS students compare to other students in regard to academic
performance, attendance rates, and behavior? How are schools implementing with fidelity to the model according to the School
Success Rubric (SSR)?
Methods
Researchers employed multiple data collection methods, including school/classroom observations, student surveys, teacher surveys, interviews with facilitators and other primary stakeholders, a review of pertinent documents, and an examination of student data. General classroom observations. Classroom observations focused on the project-based learning (PBL) instructional strategy, exposure to and use of 21st Century Skills, and student/facilitator engagement. Observations were conducted from October to April and were focused on new courses, as well as any content areas that have experienced challenges in implementing PBL. Researchers followed a nonintrusive hands-off, eyes-on approach and generally did not participate in classroom activities. Notes were taken while observing, which generated an extensive series of field notes and represented an exact description of what was observed, as well as a parallel interpretive summary of participant experiences within each component. Each observation was an average of 60 minutes. Interviews. Formal interviews were conducted with New Tech teachers and school administrators (directors). All directors but one were interviewed. Teachers were recruited for interviews through snowball sampling (Creswell, 2008) whereby directors were asked to provide the names of two to three teachers they would like interviewed. Those teachers were invited to participate in an interview, and then asked to provide the names of additional teachers who were then invited to participate in an interview. A total
1 Creswell, J.W. (2008). Educational research: Planning, conducting, and evaluating quantitative and qualitative research. 3rd edition. Upper Saddle River, NJ: Merrill Prentice Hall.

4
of two to three teachers were interviewed at each school. Interviews were conducted over the phone or at the school and lasted approximately 30-45 minutes. Each interview followed a semi-structured protocol and enabled researchers to compare similarities and differences between stakeholder expectations of the New Tech model and their experiences in it. Sample interview questions included, “How did starting school this year compare to last year?”, “How have you helped the new students become accustomed to the New Tech environment?”, “In what ways have you been collaborating with your colleagues here in the school and in the New Tech network?”, and “What professional development do you think is necessary for you?” In addition to formal interviews, researchers visited with facilitators regularly to discuss their thoughts and to gauge their feelings on the reform process. The interviews were audio recorded and transcribed verbatim. Document review. The document review consisted of a thorough analysis of school-based and New Tech documents, such as school wide improvement plans, New Tech evaluation rubrics, and student work products (i.e., lesson/unit plans and sample reports and projects). Student engagement observations. In addition to general classroom observations, classrooms were observed using the Student Engagement Protocol. The protocol is a three-minute interval time series instrument that is used to measure the engagement of two students in 21-minute intervals. At the three-minute mark, observers record the pedagogical approach of the facilitator (i.e., facilitator led, project work, or independent practice) and each student’s behavior (i.e., reading, listening, observing, discussing, answering/asking, writing, performing, or distracted), then make a determination of whether or not the student is “engaged” or “not engaged.” Student data. Individual student-level data was collected from each school, including demographic indicators (i.e., gender, race/ethnicity, special education status, free and reduced-price meals/milk status, and grade level), attendance rates, behavior statistics, grades in core content areas, and state assessment results. The data was cleaned and combined into an overall longitudinal New Tech data set using Excel, then imported into the statistical software program, PASWStatistics, version 18. This data provides an enrollment profile of the Indiana New Tech schools and helps document student progress in the New Tech model. The data presented in the following tables was collected from schools and the Indiana Department of Education website. Student data for Tier 1, 2, and 3 New Tech schools was cleaned, coded and merged to produce one overall data set. Only students enrolled 80% of the school year or more were included in the sample. The rationale for this value is that it is the logical midpoint between federal and state accountability enrollment guidelines, with the state guideline being 70% enrollment and the federal guideline being 90% enrollment.2 Furthermore, the sample size needed to remain large enough to be representative of the entire population of New Tech students while remaining exclusive enough to omit students who would distort the statistical analysis because they were not enrolled for a specific amount of time. When frequencies and t-tests were calculated, no statistically significant differences existed between 80% and 2 See http://www.doe.in.gov/super/2010/07-July/070210/documents/memo_faq_accountabilty.pdf

5
85% enrollment. Therefore, it was determined that 80% enrollment was the best cut-off point since it met the previous criteria and included slightly more students than an 85% enrollment cut-off, thus resulting in a larger sample size that allows for stronger and more accurate statistical findings. Student Survey. An online survey was administered to all students attending Indiana New Tech high schools to gather information about their perceptions of the New Tech model. The instrument was organized with questions probing four specific areas of the New Tech School Success Rubric: Curriculum and Instruction, Learning Outcomes, Partnership Development and School Culture and Autonomy. The survey also included 14 items from the Project Based Learning (PBL) Index (Ravitz, 2008), which was developed by the Buck Institute for Education and measured how respondents have used PBL. The PBL Index was originally created for teachers, so questions were adapted for a student audience. The survey also asked four open response questions: “What is your favorite thing about the New Tech model? “What would you change about the New Tech model?” What were some of your most memorable and/or favorite projects that you completed this year?” and “How can your overall school experience be improved?” The response rate was 6.7% (226/3.294). Teacher Leadership Inventory. Utilizing Angelle and Dehart’s (2010)3 Teacher Leadership Inventory, the survey instrument was designed to measure teacher leadership at the New Tech schools. Like the student survey, the Teacher Leadership Inventory was administered in a web-based format. ] The response rate was 67.7% (105/155). Qualitative Data Analysis Observation field notes and verbatim transcripts from audio-recorded interviews and focus groups were analyzed for significant theme patterns. Researchers applied codes representing the sentiment of each paragraph or data cluster and/or developed codes identifying patterns within the data. Representative examples from observations and quotations from interviews were selected and contextualized. Chosen exemplars were re-examined and validated with other data sources to confirm unanimity among the specific themes and the validity of the conclusions. Quantitative Data Analysis A series of quantitative analyses were completed to 1) understand who attends Indiana New Tech high schools, 2) gain a more in-depth understanding of how students in New Tech high schools compare academically to other students, and 3) examine whether New Tech participation is associated with positive changes in student outcomes. PASW Statistics, version 18 was used for data analysis.
3 Angelle, P., & DeHart, C. (2010, May). A four factor model of teacher leadership: Constructionand testing of the Teacher Leadership Inventory. Paper presented at the annual meetingof the American Educational Research Association, Denver, CO.

6
The National Center for Education Statistics’ guidelines on effects sizes and statistical significance were utilized (see Seastrom 2002)4. Only statistically significant results that are practically relevant are reported, since statistical significance can be found among variables, but provide no important and applicable evidence toward the research questions. Student engagement observations. For the student engagement data, frequency of facilitators’ use of various pedagogical practices and the relationship between student engagement and pedagogical approaches were examined using Analysis of Variance (ANOVA). Student-level data. Table 1.1 displays the dependent variables used for analysis of student-level data: Algebra I, English 10 and Biology I ECA scores and the likelihood of passing each of these assessments, attendance rates; number of suspensions, and likelihood of graduating. In-school and out-of-school suspensions were combined into one variable of total number of suspensions. Additionally, some school data was not included in the statistical analysis because the data was not verifiable, including data for free and reduced price meals/milk status (n=178) and attendance (n=113). Some of the data, such as graduation rates for Indiana and comparison schools and PSAT, SAT and ACT scores, were not available from the Indiana Department of Education at the time this report was published.
Table 1.1: Descriptive Results for Dependent Variables (N=3,294)
Mean Standard Deviation
Minimum Score on Scale
Maximum Score on Scale
Number Missing
End of Course Assessments
Algebra I ECA: 2010-11 564.48 89.00 200.00 800.00 1,774
Passing Algebra I ECA: 2010-11 0.56 0.50 0.00 1.00 1,774
English 10 ECA: 2010-11 387.35 84.63 100.00 619.00 2,220
Passing English 10 ECA: 2010-11 0.67 0.47 0.00 1.00 2,220
Biology I ECA: 2010-11 476.23 107.57 200.00 772.00 2,046
Passing Biology I ECA: 2010-11 0.40 0.49 0.00 1.00 2,046
Algebra I ECA: 2010-11 565,74 97.87 200.00 800.00 2,722
Passing Algebra I ECA: 2010-11 0.58 0.50 0.00 1.00 2,722
English 10 ECA: 2010-11 432.11 109.27 200.00 639.00 3,022
Passing English 10 ECA: 2010-11 0.68 0.47 0.00 1.00 3,022
Biology I ECA: 2010-11 432.11 109.27 200.00 639.00 3,117
Passing Biology I ECA: 2010-11 0.28 0.45 0.00 1.00 3,117
Attendance and Behavior
Attendance Rate 95.57 5.73 23.89 100.00 113
Total Number of Suspensions 0.39 1.22 0.00 18.00 0
Graduation
Likelihood of Graduating 0.93 0.26 0.00 1.00 3,076
4 Seastrom, M. M. (2002, October 1). NCES Statistical Standards Handbook. National Center for Education Statistics (NCES). Retrieved September 28, 2010, from http://nces.ed.gov/statprog/2002/stdtoc.asp

7
Demographic variables were categorized into binary measures so that regression analyses could be performed (e.g., gender: 0=male, 1=female; special education participation: 0=not a participant, 1=special education participant). For race/ethnicity any student who was another race/ethnicity besides white, non-Hispanics were grouped together. This step was completed to examine any differences in minority groups as an aggregate compared to those who were white, non-Hispanic students. Schools were categorized by locale, which was assigned by the U.S. Census and utilized by the IDOE, and tier (1-4).5 The locales used were: large/mid-size city; urban fringe of large/mid-size city; large/small town; and rural, inside and outside of metropolitan statistical area (or MSA). Schools were further consolidated into the two categories of 1) large/mid-size city and urban fringe and 2) large/small town and rural to keep individual schools’ characteristics confidential when performing statistical analyses. For testing specific differences between two groups in attendance rate, suspensions, likelihood of passing the ECA’s, likelihood of graduating, independent t-tests were utilized. For analyzing differences among three or more groups, one-way ANOVA tests were computed. To better substantiate the results of the t-tests and ANOVA tests, effect sizes (Cohen’s d) also were calculated, which measure the size of the difference between means, divided by the pooled standard deviation. Logistic regression was utilized for binary results (e.g., likelihood of passing Algebra I ECA). Linear regression was used for variables that are continuous (e.g., ECA scores). Analysis of Covariance (ANCOVA) tests were utilized to find any statistically significant interactions between race/ethnicity and free or reduced price meals/milk status when controlling for the tier of the New Tech school. Additionally, ECA scores and attendance rates were also included as independent variables in the analysis to examine any significant impact of these variables.
5 Locale definitions:, as determined by the U.S. Census Bureau: Large City - Central city of a CMSA (Consolidated Metropolitan Statistical Area) or MSA (Metropolitan Statistical Area), with the city having a population greater than or equal to 250,000 / Mid-size City - Central city of a CMSA or MSA with population less than 250,000 Urban Fringe of Large City - Place within a MSA of a Large City and defined as urban by the Census Bureau / Urban Fringe of Mid-size City - Place within a MSA of a Mid-size City and defined as urban by the Census Bureau Large Town - Town not within a CMSA or MSA, with a population greater than or equal to 25,000 / Small Town - Town not within a CMSA or MSA with population less than 25,000 Rural, outside MSA - A place not within an MSA defined as rural by the Census Bureau / Rural, inside MSA - A place within an MSA defined as rural by the Census Bureau Indiana Department of Education. “Report on the Indiana Distance Education Survey 2006” (www.doe.in.gov/olt/docs/distance_education_survey_report.pdf )

8
Student Survey. Using items from the Buck Institute for Education’s PBL Index and New Tech Network’s School Success Rubric, five scales were developed to measure students’ PBL usage and perceptions of their learning at the New Tech Schools. These five scales were used as the dependent variables in the analysis and were: the PBL Index Scale, the Curriculum and Instruction Scale, the Learning Outcomes Scale, the Partnership Development Scale and the School Culture and Autonomy Scale. Items were combined and averaged to form all of the scales, and the mean score for each question was used to replace missing responses. Table 1.2 presents the descriptive results for these variables.
Table 1.2: Descriptive Results for Student Survey Scales (N=226)
Mean Standard Deviation
Minimum Score on Scale
Maximum Score on Scale
PBL Index Scale 2.95 0.74 1.00 5.00
Curriculum and Instruction Scale 3.46 0.71 1.00 5.00
Learning Outcomes Scale 3.19 0.69 1.00 5.00
Partnership Development Scale 2.83 0.88 1.00 5.00
School Culture and Autonomy Scale 2.94 0.83 1.00 5.00
Demographic and academic variables were mostly kept in their original codes. Exceptions include race/ethnicity, where students who reported any other race or ethnicity besides white, non-Hispanics were grouped together. This step was completed to examine any differences in minority groups as an aggregate compared to those who were white, non-Hispanic students. Grades most often earned in New Tech classes were categorized into a new variable so that those who reported earning only A’s and B’s were measured compared to all others. For the question “Which of the following classes do you work on projects,” responses where the student reported integrated classes (e.g. BioHealth) in the “Other (please specify)” response were coded as Science or Health classes. Linear regression was used for finding significant associations between gender, race/ethnicity, special education participation, English Language Learning status, grade level, first-time experience as a New Tech student, average grades, average number of projects completed, and the student survey responses. The PBL Index was also included as an independent variable in the analysis to examine if more PBL use was associated was better scores in the School Success Rubric scales of Curriculum and Instruction, Learning Outcomes, Partnership Development, and School Culture and Autonomy.

9
Teacher Leadership Inventory. To measure various aspects of teacher leadership, Angelle and Dehart’s (2010) designation of four scales of teacher leadership were utilized as dependent variables: Sharing Expertise, Sharing Leadership, Supra-Practitioner and Principal Selection, which were created from Likert scale questions on the survey, ranging from 1 as strongly disagree and 5 as strongly agree. For development of an additional scale called Overall Teacher Leadership, scores from all four scales were combined and averaged. When creating the Overall Teacher Leadership scale, scores from the Principal Selection scale were reversed because low scores corresponded with a more positive rating in teacher leadership, in contrast to the other indicators where a high score was associated with a more positive perspective of teacher leadership. Responses were combined and averaged to form all of the scales, and the mean score for each question was used to replace missing responses. Table 1.3 shows the descriptive results of these scales.
Table 1.3: Descriptive Results for Teacher Leadership Inventory Scales (N=105)
Mean Standard Deviation
Minimum Score on Scale
Maximum Score on Scale
Sharing Expertise Scale 4.13 0.66 1.00 5.00
Sharing Leadership Scale 3.82 0.82 1.00 5.00
Supra-Practitioner Scale 3.87 0.79 1.00 5.00
Principal Selection Scale 2.53 0.65 1.00 5.00
Overall Teacher Leadership Scale 3.82 0.57 1.00 5.00
In addition, demographic variables were collected. These included the school where the respondent taught, which were categorized by first year of implementation of the model (tiers 1-4), implementation status (whole school conversion, autonomous school, and small learning community) and locale, which was assigned by the U.S. Census and utilized by the Indiana Department of Education.6 The locales used were: large/mid-size city; urban fringe of large/mid-size city; large/small town; and rural, inside and outside of metropolitan statistical area (or MSA). Schools were further consolidated into the two categories of 1) large/mid-size city and urban fringe and 2) large/small town and rural to keep individual schools’ characteristics confidential when performing statistical analysis. In order to test for specific group differences between two different groups within each of the five scales independent t-tests were performed. For analyzing differences among three or more groups, one-way ANOVA tests, with post-hoc analyses were performed using Tukey’s HSD (Honestly Significant Difference) to identify specific differences between groups. To better substantiate the results of these tests, effect sizes (Cohen’s d) were calculated, which measure the size of the difference between means, divided by the pooled standard deviation; the correlation effect size (r) was also calculated as a measure of effect size. Liner regression was used to find any significant associations between teacher experience, tier, school implementation and locale and the teacher leadership scale items. Urban Fringe of Large City - Place within a MSA of a Large City and defined as urban by the Census Bureau / Urban Fringe of
Mid-size City - Place within a MSA of a Mid-size City and defined as urban by the Census Bureau.
Large Town - Town not within a CMSA or MSA, with a population greater than or equal to 25,000 /Small Town - Town not
within a CMSA or MSA with population less than 25,000
Rural, outside MSA - A place not within an MSA defined as rural by the Census Bureau / Rural, inside MSA - A place within an
MSA defined as rural by the Census Bureau. Indiana Department of Education. “Report on the Indiana Distance Education Survey 2006” (www.doe.in.gov/olt/docs/distance_education_survey_report.pdf )

10
Site Profile Table 1.4 lists the schools that participated in this study, as well as their type of implementation, initial implementation year, grades served during the 2010-11 academic year, and locale.
Table 1.4: Site Profiles Type of
Implementation
Initial Implementation
Year
Grades Served During 10-11
State Assigned Locale
Tier 1 Schools
New Tech High @ Arsenal Tech SLC 2007 9, 10, 11, 12 Large city
New Technology School of IDEAS SLC 2007 9, 10, 11, 12 Large city
Zebra New Tech High WSC 2007 9, 10, 11, 12 Small town
Tier 2 Schools
Bloomington New Tech High School AS 2008 9, 10, 11 Mid-size City
Columbus Signature Academy – New Tech AS 2008 9, 10, 11 Mid-size City
North Daviess 21st
Century High School WSC 2008 9, 10, 11 Rural
Tier 3 Schools
Tiger New Tech at Triton Central High School WSC 2009 9, 10 Rural
New Tech @ Wayne High School SLC 2009 9, 10 Urban fringe of
mid-size city
Tier 4 Schools
Adams Central Jet Tech WSC 2010 9 Rural
Calumet High School WSC 2010 9,10 Urban fringe of
large city
New Tech Institute AS 2010 9 Mid-size city
Viking New Tech SLC 2010 9 Small town
Lakeland High School’s Leading EDGE WSC 2010 9,10 Rural
Oregon-Davis New Tech WSC 2010 9,10 Rural
Scottsburg New Tech High School SLC 2010 9 Small town
Taylor Titan New Tech High School WSC 2010 9 Rural

11

12
Participant Profile Table 1.5 provides a demographic comparison among students in Tier 1, 2, 3, and 4 Indiana New Tech high schools, students from public secondary schools statewide, and students from comparison high schools. Comparison schools from the same district as the New Tech high school were chosen for small learning communities and autonomous schools. Data for these comparison schools may have included the New Tech students from that district if the New Tech high school did not have its own school code for reporting of data to the state. However, if a small learning community or autonomous school was located in a district with more than one high school, a second or third comparison school in that district was selected, and in these cases, the comparison school data did not include New Tech student data. For whole-school implementation sites, comparison schools with similar demographic profiles were chosen from other districts near the New Tech high school; data for these sites did not include New Tech student data. For the 2010-2011 academic years, enrollment by grade level at New Tech schools was highest for underclassmen (9th grade: 48.0%; 10th grade: 32.1%). Upperclassmen represented a smaller group (11th grade: 13.4%, 12th grade: 6.6%). The majority of New Tech students were male (54.7%), white, not Hispanic (82.2%), not special education participants (86.9%), not eligible for free or reduced price meals/milk (52.6%) and not English language learners (95.6%). New Tech school enrollment mirrored state enrollment numbers for race/ethnicity and special education participation. Tier 1, 2, 3, and 4 New Tech schools had larger proportions of underclassmen than the state, which was expected due to the fact that New Tech implementations typically begin with cohorts of ninth-grade students. Additionally, New Tech schools had higher percentages of males, white students, students receiving free and reduced price meals/milk and English Language Learners than the overall Indiana secondary public school population.

13
Table 1.5: Demographic Profile All Tier 1-4 New Tech High Schools
New Tech Comparison Schools
Indiana Secondary School Population
Overall Enrollment 3,294 29,826 318,914
Enrollment by grade ---- ---- -----
9th
Grade 1,580 (48.0%) 8,024 (26.9%) 84,428 (26.5%)
10th
Grade 1,056 (32.1%) 7.873 (26.4%) 81,838 (25.7%)
11th
Grade 440 (13.4%) 7,081 (23.7%) 77,553 (24.3%)
12th
Grade 218 (6.6%) 6,848 (23.0%) 75,095 (23.5%)
Gender
Male 1,803 (54.7%) 14,820 (49.7%) 162,778 (51.0%)
Female 1,491 (45.3%) 15,006 (50.3%) 156,136 (49.0%)
Total 3,294 29,826 318,914
Race/Ethnicity
American Indian/Alaska Native 12 (0.4%) 144 (0.5%) 1,098 (0.3%)
Black (Not of Hispanic Origin) 265 (8.0%) 4,167 (14.0%) 37,553 (11.8%)
Asian 30 (0.9%) 571 (1.9%) 4,883 (1.5%)
Hispanic Ethnicity 175 (5.3%) 2,076 (6.9%) 21,678 (6.8%)
White (Not of Hispanic Origin) 2,708 (82.2%) 21,651 (72.6%) 242,582 (76.1%)
Multiracial (Two or More Races) 104 (3.2%) 1,202 (4.0%) 10,954 (3.4%)
Native Hawaiian or Other Pacific Islander
0 (0.0%) 15 (0.1%) 166 (0.1%)
Total 3,294 29,826 318,914
Special Education Participation
Special Education 433 (13.1%) 4,234 (14.2%) 44,010 (13.8%)
Not Special Education 2,861 (86.9%) 25,592 (85.8%) 274,904 (86.2%)
Total 3,294 29,826 318,914
Free or Reduced Price Meals*
Free or Reduced Price Meals/Milk
1,478 (47.4%) 13,876 (46.5%) 124,520 (39.2%)
Paid Meals/Milk 1,638 (52.6%) 15,950 (53.5%) 193,246 (60.8%)
Total 3,116 29,826 317,766
Limited English Proficiency
English Language Learner 144 (4.4%) 937 (3.1%) 8,930 (2.8%)
Not English Language Learner 3,150 (95.6%) 28,889 (96.9%) 309,984 (97.2%)
Total 3,294 29,826 318,914
*One New Tech school (n=178) had no meal status recorded. Statewide, 1,148 (0.4%) of students had no meal status recorded

14
Figures 1.1, 1.2, and 1.3 further illustrate New Tech school enrollment by gender, race/ethnicity, and free and reduced price meals/milk status.
54.7%
45.3%
Figure 1.1: New Tech Schools by Gender: 2010-2011 (n=3,294)
Male
Female
8.0%
0.9%
5.3%
82.2%
3.2%
Figure 1.2: New Tech Schools by Race/Ethnicity (n=3,294)
Black (Not of Hispanic Origin)
Asian
Hispanic
White (Not of Hispanic Origin)
Multiracial (Two or More Races)
47.4% 52.6%
Figure 1.3: New Tech Schools by Free or Reduced Price Meals/Milk Status (n=3,116)
Free or Reduced Meals/Milk
Paid Meals/Milk

15
Table 1.6 shows enrollment in New Tech schools by Tier and locale. Tier 4 schools had the highest student enrollment, followed by Tier 1, 2 and 3 schools. This finding was expected since eight Tier 4 schools joined the eight existing schools who were Tiers 1, 2 and 3, doubling the number of New Tech high schools throughout Indiana for the 2010-11 academic year and since New Tech schools increase their student populations each year until they have four grade levels implemented. By locale, slightly more New Tech schools are situated in large/small towns or rural areas than in large/mid-size city and urban fringe settings.
Table 1.6: Enrollment by Tier and Locale All Tier 1-4 New Tech High Schools
Tier
Tier 1 977 (29.7%)
Tier 2 664 (20.2%)
Tier 3 428 (13.0%)
Tier 4 1,225 (37.2%)
Total 3,294
Locale
Large/mid-size city or urban fringe 1,423 (43.2%)
Large/small town or rural 1,871 (56.8%)
Total 3,294
Findings This section presents data from observations of New Tech classes, observations with teachers and directors, as well as data from surveys administered to New Tech students and teachers. The student survey explored how often the PBL instructional approach was used in New Tech classrooms. The survey consisted of five scales, all of which were found to be reliable: Curriculum and Instruction (Cronbach’s alpha=0.915), School Culture and Autonomy (Cronbach’s alpha=0.905), Partnership Development (Cronbach’s alpha=0.889), and Learning Outcomes (Cronbach’s alpha=0.749). Respondents scored their answers on a scale from 1 to 5, with 1 representing infrequent use of PBL and 5 representing significant use of PBL in the classroom. Tables at the end of each section provide the questions from each scale, as well as the means and standard deviations of responses. Curriculum and Instruction
During observations, researchers found that classes in the New Tech high schools were indeed taught using project-based learning (PBL). Data from the survey and PBL Index Scale supported this finding, with students agreeing with the statements, “I usually work in groups in my classes” (mean=4.19), and “We discuss ‘Need to Knows’ in my classes” (mean=4.11) on the survey, while reporting on the PBL Index Scale that they often worked in groups for projects (mean=4.19); frequently collected, organized and analyzed information and data (mean=3.44); and researched topics in detail to be able to clearly explain them to others (mean=3.35). Conversely, students reported spending less time on individual work (mean=2.11), portfolios of student work (mean=2.32), and essay tests

16
(mean=2.40) in their New Tech classes, see Tables 2.1 and 2.2. The PBL Index was found to be highly reliable (Cronbach’s alpha =0.893) and consistent with Ravitz (2008) who reported a 0.860 Cronbach’s alpha reliability.
Table 2.1: Summary of Items within the PBL Index Scale (N=226)
Mean
Standard Deviation
Overall, how often did you use the following in your New Tech Classes?
Essay tests 2.40 0.92
Open-ended problems 2.64 1.09
Portfolios of student work 2.32 1.08
Student peer reviews 2.85 1.12
Group projects 4.19 1.03
Individual projects 2.11 1.15
Hands-on exhibitions, demonstrations or oral presentations 3.12 1.14
Over the last academic year, how often did you perform the following in your classes?
Solved real-world problems 2.84 1.19
Collected, organized and analyzed information and data 3.44 1.21
Presented what I learned 3.32 1.08
Defended my views, ideas or perspectives 2.99 1.26
Orally presented my work to peers, parents, teachers or others 3.16 1.13
Researched topics in detail to be able to clearly explain them to others
3.35 1.27
Participated in community-based projects 2.60 1.28 Note: The mean score of each question was used to replace missing responses.

17
Table 2.2: Summary of Items within the Curriculum and Instruction Scale (N=226)
Mean
Standard Deviation
Adults come in from the community to evaluate our class projects
3.33 1.14
I usually work in groups in my classes 4.19 0.91
We discuss “Need to Knows” in my classes 4.11 0.93
Class projects involve local organizations 3.47 1.05
Most of the projects in my classes relate to “real world” issues 3.65 1.07
Most of my classes are integrated, meaning they combine two or more subjects (for example, BioLit, GeoCAD or Scientific Studies)
4.08 0.97
I learn better by doing projects 3.07 1.25
I have learned how to present in front of my classmates 3.94 1.03
Teachers regularly ask for student feedback about projects and classes
3.40 1.06
As a result of my New Tech classes, I try to see issues from multiple perspectives
3.22 0.99
What I learn in one class can be applied to my other classes 3.19 1.07
I have learned time management as a result of my New Tech classes
3.28 1.09
I have learned organization skills as a result of my New Tech classes
3.30 1.06
Teachers give me adequate time to work on projects 3.07 1.14
Teachers clearly explain their grading rubric(s) for projects 3.17 1.12
My school emphasizes 21st
century skills, such as collaboration and oral communication
3.51 1.07
I prefer the traditional type of learning where the teacher lectures and we work on tests or quizzes individually
a
2.89 1.28
Note: The mean score of each question was used to replace missing responses. a
Scores were reversed in this question; so a 1 would be coded as a 5, a 2 as a 4, etc.
Classes observed at most schools integrated multiple content areas. The student survey data supported this finding, as most students agreed with the question “Most of my classes are integrated, meaning they combine two or more subjects” (mean=4.08). For example, at one school, students in a World Studies class integrated English, history and geography skills to map the setting of a novel they were reading. Similarly, students in an Algebra II/Physics class utilized math and science concepts to predict the trajectory of a pulley car. Students at another school’s English 10/World History class conducted surveys and interviews for a needs assessment, created designs using Google SketchUp™, and presented to loan officers from local banks to plan a neighborhood coffee shop. When individual classes were not integrated, some schools implemented school-wide, cross-curricular projects. For example, one school rolled out a project that required students in several classes to plan a Veteran’s Day program. The English 10/U.S. History class interviewed local veterans and combined excerpts from those interviews with pictures on a slideshow. Meanwhile, the Chemistry I and Food Science class planned a menu and prepared breakfast for the program.

18
Teachers also integrated community partners into their projects, including the Center for Wrongful Convictions at Northwestern University, local chambers of commerce, Cook Medical, the Indiana Black Expo, Indiana University, Peace Learning Center, University of Evansville, University of Southern Indiana, the U.S. Army, and others. An Indiana state representative even participated in a project at one school. Furthermore, a partnership at another school even enabled students to compete for valuable scholarship money:
“We’ve had two representatives come in—one of them flew in from Boston and one from San Diego—to meet with us…We’ve already evaluated the kids and we chose the 12 best…[who] get to present in front of this panel. The panel will pick the best of that group and those kids will receive EF Educational Tours scholarships.”
When authentic community partners were not available, some teachers developed fictional ones, such as “Geology Surveys and Laboratories,” to create entry documents and projects mimicking what a real partner would have developed. Teachers at one school even modeled a project after the television show, The Apprentice, which required students to perform various tasks for local businesses. To further increase the relevancy of schoolwork, teachers often related students’ work to real-world topics. For instance, in one Orientation to Life class, students were asked to use what they had learned about saturated and unsaturated fats, plant structures and protein to develop vegan and vegetarian menus for a restaurant. At other schools, students were asked to participate in projects that entailed building awareness of various social issues or brainstorming solutions to environmental problems like landfill seepage, energy conservation, and recycling. Teachers also brought in presenters to speak about career opportunities in their subject areas to help students further connect with schoolwork. In this rigorous environment, students were required to demonstrate a high level of collaboration and professionalism to succeed. To help students develop those competencies, teachers often integrated 21st Century Skills into their lessons: “Content is not what gets people fired from their job. It’s work ethic,…not being able to collaborate with others, not managing, and not knowing how to effectively communicate your ideas.” Therefore, teachers at some schools already asked sophomore students to create résumés and gather recommendation letters. In fact, some schools even offered full elective classes on citizenship and ethics, community service, and success skills. Teachers also required students to adhere to a certain set of work standards to ensure 21st
Century Skills development. For instance, almost all teachers required students to work in groups, which helped develop their collaboration skills:
“[At] a traditional school, it would have been easy for them to hide in the back and not be noticed and be pushed aside…[but] here they can’t do that because they are working in groups. Their groups force them to do better than what they would have done.”

19
Formal presentations of final work were used to hone students’ professional skills. Additionally, some teacher’s assigned journal prompts to incite students to reflect on their progress in developing 21st Century Skills, as well as the importance of doing so. Various tools were used to ensure these skills were incorporated into students’ grades: “We have rubrics…We meet with kids individually and meet with the teams as they’re working on projects…We give them workshops on ethics.” According to responses from the student survey, students enjoyed the real-world application of classroom material. For instance, when asked about their favorite aspect of New Tech, one student responded, “real life situations day in and day out, and finding solutions to problems in creative and fun ways with the help of my peers.” Responses regarding 21st Century Skills were more varied, however. One student enjoyed the opportunity to “learn how to present in front of people, [because] now we rarely get nervous.” Other students liked collaborating for group work because it made content easier to learn and “takes loads of work off.” Furthermore, they found it more enjoyable than “being lectured the whole class period.” However, other students reported disliking group work because they could not choose their own groups and some members did not do their fair share of work. Teachers made a concerted effort to support students through these rigors using a variety of scaffolding techniques, including rewards for participation; posted state standards, rubrics and completion timelines; group work contracts; student performance data; modeling; practice assignments; and extra work time. Furthermore, at every school, teachers were observed constantly circulating around the classroom to answer questions and check on students’ progress. Some schools even offered support through upperclassmen serving as teaching assistants: “I love using peers any time I can because it is coming from someone that has been there—it’s not just me giving an assignment and having them do it.” Additionally, teachers were observed reviewing homework and assessments during class to ensure content mastery. Other teachers chose to use formal workshops for scaffolding, which were more focused on student-developed “Need to Knows.” Sometimes all students were required to attend workshops. At other times, teachers encouraged students to scaffold each other’s “Need to Knows” by appointing a representative to attend the workshop, and then share the information with the rest of the group. However, one teacher found that due to the structure of the model, students did not always need so much support:
“I can give them a situation, or an assignment, or a problem where I haven’t really instructed them at all and they have very limited information,…[and] they can address the problem and they can think through it and think about what they need to know.”
He shared that his students performed best on test questions, “that I didn’t instruct whatsoever…just presented to them as a class.”

20
On the student survey, some students commented that New Tech classrooms needed to be re-structured to enable teachers to better scaffold student needs. For example, a few students reported that they would like smaller class sizes, stating that sometimes teachers cannot reach students equally and that classrooms often get loud. As one student explained, smaller class sizes would enable them to “get a little bit more hands-on.” Other students disliked the block scheduling of New Tech classes, stating that they sometimes got bored in such long periods. Constructing this type of rigorous classroom environment can be time-consuming, especially for teachers who are new to the model. However, teachers viewed it as a worthwhile “challenge” and looked for creative solutions to help them better manage their time. For instance, some teachers used preformatted projects from the NTN Project Library instead of developing entire units on their own. However, some teachers felt that projects in the Library lacked depth, were irrelevant to their student populations or content areas, were outdated, and/or did not incorporate Indiana state standards well. When speaking about the Library, one teacher said, “We’ve found that to be more frustrating than anything.” Even teachers who utilized the Library stated that it was only “a great place to get ideas,” not full projects that could be implemented without modifications. Rather, most teachers found it more useful to consult other Indiana New Tech teachers for project ideas. Teachers found other NTN resources more helpful. For example, teachers felt Meeting of the Minds, a professional opportunity provided for New Tech teachers across the network, was a unique opportunity to collaborate with other teachers in their content areas, especially for project ideas: “Meeting of the Minds was unbelievable as far as making contacts and sharing ideas and coming back with some really good [ideas].” Another teacher noted the practicality of those ideas: “Lots of times, we have come away with things that we might put in place in our classrooms. I would say that is probably the biggest positive that comes out of those meetings.” Teachers also felt NTN coaches were a valuable resource: “[He] comes in and gives me ideas about how I can make my problem-based [instruction] better…[He] really is a wealth of information that way.” Despite these positive experiences with the New Tech model and PBL, some teachers still admitted to using traditional instructional methods in their classrooms: “[PBL] makes sense to me now when I think about how students learn best, but again, in my classroom design, I still spend time in [direct] instruction,” one teacher admitted. Another teacher reported refraining from putting students into project work groups until he felt that they had received enough instruction and assessment to fully learn the material. There is a perception among some teachers that students have difficulty grasping concepts taught in the PBL format. Therefore, teachers stuck to traditional instruction to scaffold student learning, especially when they were pressed for time, reinforcing lessons, introducing new content, or preparing for high-stakes testing. Other teachers simply felt that PBL did not suit their content areas: “Unfortunately, a lot of it in my area is drill, drill, drill…I don’t think the kids can figure it out on their own…You can’t just research a foreign language.” Similar sentiments toward PBL were particularly evident among math teachers, who reported struggling to find projects that incorporated

21
all the standards they needed to cover for ECA exams. One teacher said, “There are some areas where you need instruction; you need a lot of intensive instruction in math.” Teachers in other content areas also expressed concern with focusing on the PBL process instead of core content; they worried that they were spending more time on projects rather than state standards. Overall, student perceptions of the model were mixed, as exemplified by the survey data. Some students shared positive remarks like, “I feel that doing the PBL process helps us as students relate to the content more.” Furthermore, students agreed less often with the statement, “I prefer the traditional type of learning where the teacher lectures and we work on tests or quizzes individually” (mean=2.89). However, students also agreed less often with the statement “I learn better by doing projects” (mean=3.07), noting that they felt projects could be more compelling and better organized. Students also disagreed with the statement, “Teachers give me adequate time to work on projects” (mean=3.07), explaining that they felt particularly pressed for time when projects were due in multiple classes due to a lack of timeline coordination. Multiple linear regression analysis was utilized to examine which variables most notably impact the PBL Index. The average number of projects completed was the only statistically significant variable influencing the PBL Index (t=2.997, p=0.003), so that a positive linear relationship was found between the average number of projects completed and the PBL Index when controlling for other demographic and academic variables.

22
Figure 2.1 gives a visual representation of this positive linear relationship, showing that as the average number of projects completed per class increased, students reported higher scores in the PBL Index. Figure 2.1: Average Project Completed per Class vs. PBL Index
Multiple linear regression analysis also was utilized to examine which factors notably impacted the Curriculum and Instruction Scale. A positive linear relationship was found between the PBL Index and the Curriculum and Instruction Scale, which was found to be statistically significant (t=11.011, p=0.000). Further, PBL Index exerted the strongest influence on this scale when controlling for the other demographic and academic variables (β=0.606), showing that PBL usage was strongly associated with students’ perceptions of curriculum and instruction. Though statistically significant positive relationships were found between other variables7 and the Curriculum and Instruction Scale, the impacts were not as strong as the PBL Index.
7 Being white, non-Hispanic and receiving A’s and B’s in New Tech classes were all statistically significant predictors of the Curriculum and Instruction Scale as well but not as strong as PBL Index.

23
Figure 2.2 gives a visual representation of this positive linear relationship, showing that as the PBL Index increased, students reported higher levels of agreement in the Curriculum and Instruction Scale. This shows that students who experienced PBL more often (as represented by the PBL Index Scale) were more likely to agree that their school had the type of positive learning environment that was described on the School Success Rubric (as represented by the Curriculum and Instruction Scale). Figure 2.2: PBL Index vs. Curriculum and Instruction Scale
Technology
Students and teachers at all schools had access to computers at a one-to-one ratio. To ensure all students could access the necessary tools to complete their work, some schools even allowed students to take laptop computers home. Most teachers reported using technology in their classrooms and fully incorporating digital tools into their lessons, such as AutoCAD™; Dreamweaver™; FLASH™; Geometer’s Sketchpad™; Photoshop™; Prezi™; Publisher™; Soundbooth™; Survey Monkey™; Apple™ applications, Google™, Microsoft™ applications; YouTube™, and many others. To ensure students were comfortable using these programs, teachers provided one-on-one tutorials or formal group workshops when introducing new technology. If teachers could not

24
scaffold students’ needs in those ways, students who were more familiar with the technology often helped their peers and even teachers learn how to use them. As a result, many teachers felt that they might need more professional development in technology: “I think we all would say that we would really like some time and guidance to work with a lot of the tools that we have on our computers.” More specifically, teachers wanted someone to introduce them to new or unfamiliar technology, and to expand their capabilities with programs they already were using. One support structure that did help teachers was the availability of special technology/presentation rooms at some schools, which allowed for a more formal setting where students could present their final projects to community members. These rooms also enabled students who did not need to view the presentations to continue working on assignments undisturbed in the classroom. On the whole, students were observed effectively using technology to complete coursework and assessments during site visits. When students did misuse technology, their computer privileges were revoked. At some schools, teachers discouraged students from using technology during activities like workshops to prevent misuse and distractions from occurring in the first place. In such cases, it often was difficult for students to complete their work, as computers are an integral part of instruction at New Tech high schools. Some teachers disliked such policies: “I understand that there have to be consequences for these actions, but it can make it more difficult for us as facilitators.” Instead, some schools used computer-monitoring programs to prevent students from misusing technology. Such programs enable teachers to restrict access to certain sites and even, “freeze the computers to talk with students.” Interestingly, one teacher expressed concern about students becoming over reliant on technology and “shortcuts”: “When we resort [to] more traditional ways of teaching…our students really struggle with that…Technology has made some of them lazy and the focus is more on the bells and whistles and less on content.” In terms of use of Echo, the NTN learning management system, responses were mixed regarding how it has been implemented in classrooms. When teachers were able to access the platform, they often used it for posting classroom agendas and lessons, storing project information and grades, responding to students’ questions, and monitoring students’ progress. However, many teachers found the program “not reliable and very tedious,” due to random malfunctions and crashes:
“You put together a lesson…put the prompt on Echo for a journal, or you put the rubric out there for the kids to see and it’s not operating [and] your whole classroom has just been stalled. That is very frustrating.”
Several teachers also reported that Echo lacked important features previously available in PeBL™, so they often resorted to using other programs instead: “We started in Echo, but we had a lot of problems...It wasn’t ready when promised and it wasn’t what it was supposed

25
to be…We have to go with what works, so we jumped into Moodle™.” Other teachers shared that features like commendation reports and grade books also were not available or were not user friendly in Echo. Some students complained about Echo. A student at one school reported preferring to use programs like Google Docs to share information with group members because he could only use Echo “when it works.” Students at another school reported having to redo various parts of one project that were erased when Echo randomly crashed. Since Echo was so unstable, many teachers stored documents on the school’s network drive. However, teachers also reported having random issues with those, and only a few schools had on-site technical support managers to help. Therefore, teachers and students often were observed finding their own “workarounds” to troubleshoot technology issues. In fact, a teacher at one school even volunteered to provide technical support for the entire school since the actual technical support staff member was only available for half of the day. School Culture and Autonomy The “Trust, Respect, Responsibility” ethos was strongly emphasized at all of the schools. When speaking of the New Tech environment, one student went so far as to call it a “family.” In fact, one school hosted “family time or assemblies where all members of the New Tech community gathered to discuss school issues and celebrate accomplishments. A teacher explained how this close-knit environment enabled more positive and relaxed interactions among students and teachers: “In this approach, I can talk to students [about] what they want to be in life, what their goals are and get to know them as people.” Therefore, teachers found that students were less likely to “fall through the cracks.” Students did agree with the statement, “Teachers at my school are supportive of students,” (mean=3.24) on the student survey. Interestingly, however, they disagreed with statements on the student survey like “I feel respected by everyone at my school” (mean=2.55) and “Students are actively involved in making the rules at my school” (mean=2.58), see Table 2.3.
Table 2.3: Summary of Items within the School Culture and Autonomy Scale
Mean
Standard Deviation
I make sure other students do the right thing and act professionally
2.95 1.02
I try to act professionally at school 3.53 1.00
Students are actively involved in making the rules at my school 2.58 1.24
Teachers at this school are supportive of students 3.24 1.13
If people talk badly about my school, I defend it 2.85 1.20
Students are acknowledged for their accomplishments at this school
3.07 1.07
I feel respected by everyone at my school 2.55 1.11
Teachers meet individually with me to discuss my progress and offer support
2.68 1.08
Teachers at my school have high expectations of students 3.39 1.13
I wish I went to a different school a 2.51 1.27
Note: The mean score of each question was used to replace missing responses. a
Scores were reversed in this question; so a 1 would be coded as a 5, a 2 as a 4, etc.

26
However, researchers still observed a strengthening of student relationships during site visits to the schools. For example, during one observation, when a shy girl was too embarrassed to answer questions, other students in her group started cheering her on and even making jokes so that she would feel more comfortable: “Do you not have any brothers at home? Don’t you yell at them?” Teachers also engaged in a “style of interaction [that] floats somewhere between formal interaction and informal [interaction].” For example, teachers were observed joking around with students, reprimanding them without having to be overly stern or authoritative, and inciting them to work when they were disengaged. Furthermore, students were able to call teachers for help without raising their hands, and often used endearing nicknames. This light atmosphere enabled teachers to be more understanding and considerate toward students. For instance, one teacher reported giving students small breaks to compose themselves instead of just reprimanding them when they were upset:
“Yesterday, I had a senior make a comment in class about some frustrations she was having. Rather than react to her in a disciplinary way, I just pulled [her] over to my area [and]…asked her if there was anything I could do to help make it a better situation for her or improve my class.”
During an observation at another school, a teacher exhibited genuine concern about helping a student whose classmates kept saying had appeared sad lately. In this environment, teachers observed that students felt more “safe” and “valued.” Therefore, they were more comfortable talking with teachers and asking for help since they could “open up and be themselves.” To reinforce this positive environment, teachers made it a point to compliment students for good work and/or nice behavior. At one school, the director sent personal e-mails to recognize students’ accomplishments. During “family time” assemblies at another school, students and teachers focused on “‘filling each other’s buckets’ by complimenting and praising each other.” Furthermore, in multiple schools, walls in the main hallway displayed students’ college acceptance letters. At one school, student work was displayed on the school’s website. Other school-level celebrations took the form of special lunches, award ceremonies and honor lists. One school did an exercise where “all the students…line the hallways and the [students] being recognized will do a run through the hallway and we cheer them on and support them as they go.” Classroom-level celebrations of student successes also were observed. At one school, a teacher sent a student a “Habit-gram” (i.e., commendation report) for exhibiting “Responsibility.” At another school, a teacher was observed taking a student’s photograph for an “Employee of the Week” sign. Schools that had not fully incorporated each grade level into the model faced some difficulties celebrating student accomplishments: “If we have a celebration for something that the 21st-century kids do, we have three grade levels…that are sitting vacant; they don’t share with that.”

27
Teachers also tried to empower students by giving them the opportunity to demonstrate their trustworthiness and maturity: “We try to give the students more freedom and, in return, they show the respect and responsibility that they can handle the freedom.” Consequently, teachers were observed allowing students to move freely about the classroom without having to ask permission to leave their seats at some schools. Furthermore, teachers allowed students to use typically prohibited items like cell phones, instant messengers and social media sites to communicate with group members. In fact, many teachers used more advanced behavior management techniques to reinforce 21st Century Skills development. For example, multiple schools used a tiered system of “trust cards” to award academically and behaviorally exceptional students with special privileges. At other schools, students had the opportunity to earn “Personal Responsibility Time,” or free time, as a reward for finishing work early or good behavior. Students appreciated the opportunity to exercise autonomy in their work. For instance, one student responded on the survey, “I love how we are trusted to go on the computers and research what we have to do without any teachers bothering us.” Another student reiterated that sentiment: “[My favorite aspect of New Tech is] the freedom that the students get. We can work on our own without being babied by the teachers.” However, some students still recommended an increase in supervision and a restraint on some freedoms because of minor abuses, such as disrespecting teachers and misusing technology. Perhaps even more empowering was the opportunity for students to serve as student ambassadors, or formal representatives of the school during school tours and panel discussions. According to one director, over 20% of students at his school applied for the positions, demonstrating the high level of student buy-in and ownership of the model. Another director reported that 31% of students had volunteered to speak at student/parent meetings, and that 55% of students had led tours, student panels or lunch groups over the course of the year. Student Councils, Student Advisory Groups, and so-called “Culture Task Forces” also were established at many schools to give students a voice in the school’s transition to New Tech by enabling them to engage administrators and teachers in formal meetings about school culture and behavioral norms:
“Kids will come to me and…[say] ‘do this and this,’ so I tell them to take the lead, get a group of kids,…[explain] why you think it’s going to work, and then we’ll have a meeting and discuss it and talk about our next steps.”
At some schools, members of the Student Advisory Group also participated in staff meetings: “We’re always looking for ideas, so we invite [students] into our meetings...[which is] another way to build culture too, giving them a voice and [letting] them come up with ideas.” At some schools, students were allowed to take a limited role in the interview process for new teachers to ensure candidates understood the type of instructional and cultural standards they were expected to meet. According to the survey data, students also looked forward to the prospect of liaising with members of the local community. Since New Tech was so new to the community, students
28
wanted to inform other students and the community members about the model in order to improve its reputation. “I get really tired of people making fun of New Tech,” one student said. Another student in a SLC implementation felt relations between New Tech and non-New Tech students could be improved by “being able to show the rest of our school what New Tech is all about. The rest of our high school doesn’t know what is involved in making things happen in New Tech and they don’t understand fully about our responsibilities.” To further empower students to take ownership of their learning, teachers also solicited feedback from students about their experiences. Some teachers used the Critical Friends protocol in their classrooms, asking students to express “I Likes,” “I Wonders,” and “Next Steps.” Teachers also made it a point to explain the relevance of classroom lessons to ensure students understood the importance of what they were learning. For example, when a frustrated student exclaimed that he was done with math during one observation, the teacher explained why that was impossible, as he uses math in his everyday life, and proceeded to walk the student through the problems instead of reprimanding him for the outburst. Students’ inclusion in the group formation process also gave them a sense of empowerment. For example, one teacher allowed students to act as true professionals by selecting their group members based on résumés and letters of recommendation. To further support the development of professional behaviors, many schools offered workshops and full elective courses on citizenship and ethics. Consequently, students exhibited 21st Century Skills during site visits. For example, during one observation, a student asked another to stop swearing and making negative comments during class. At another school, a student chastised a disruptive classmate who was talking during a workshop, saying, “Hey, that’s disrespectful!” Some students even corrected themselves when they misbehaved, promptly apologizing to the teacher when they realized they had said or done something inappropriate. The survey data supported this finding, as students agreed with the statements, “I try to act professionally at school” (mean=3.53) and “Teachers at my school have high expectations of students” (mean=3.39). Some students appreciated these increased expectations, noting that their school had “become more professional and high tech” because of the model. However, other students were more resistant to the changes, stating they felt like “the teachers [were] constantly nagging about being professionals. No one is perfect and I’m tired of being poked at and experimented with since I entered high school.” Another student reiterated that sentiment, explaining that, “they expect us to act professional all the time. We’re 15 to about 18, [so] very few of us act professional.” One student even went so far as to say the model was “rushing us into professionalism…[and] robbing us of our chance to be kids.” Observation data revealed that students also had concerns about collaborating with other students for assignments because it negatively impacted their individual grades when group members were unreliable. Overall, teachers at all of the schools were very invested in the model and believed it was the best way to facilitate student success. A teacher at one school even described New Tech as “something that I feel thankful I’m part of.” Another teacher viewed New Tech as, “a

29
place where kids come for resources beyond what you would normally ask for.” Consequently, in each school, it was both reported and observed that teachers stayed after school to tutor students, supervise extracurricular activities, or just do extra work in their classrooms. During one observation, a student told a teacher, “You [sic] always here! Go home! It’s like he lives here!” At another school, teachers were observed volunteering to stay afterschool and help students on the release day before Thanksgiving break. Student buy-in to the model was more difficult to gauge, as exemplified by the survey data. While one student lauded New Tech as, “the best thing this school has come up with,” others reported that they wanted to transition out of the model. However, overall, students did not agree with the statement “I wish I went to a different school” (mean=2.51), Additionally, some students reported that New Tech has enhanced their learning by helping them prepare for the real world. Multiple linear regression analysis was utilized to examine which factors notably impacted the School Culture and Autonomy Scale. A positive linear relationship was found between the PBL Index and School Culture and Autonomy Scale, which was found to be statistically significant (t=7.951, p=0.000). Further, PBL Index exerted the strongest influence on this scale when controlling for the other demographic and academic variables (β=0.493), revealing that PBL usage was strongly associated with students’ responses about their school’s culture and autonomy. Though statistically significant positive relationships were found between other variables8 and the School Culture and Autonomy Scale, the impacts were not as strong as the PBL Index Scale.
8 Being white, non-Hispanic and receiving A’s and B’s in New Tech classes were all statistically significant predictors of the Partnership Development Scale as well but not as strong as PBL Index.

30
Figure 2.3 gives a visual representation of this positive linear relationship, showing that as the PBL Index Scale increased, students reported higher levels of agreement in the School Culture and Autonomy Scale. This shows that students who experienced PBL more often (as represented by the PBL Index Scale) were more likely to agree that their school had a positive culture (as represented by the School Culture and Autonomy Scale). Figure 2.3: PBL Index vs. School Culture and Autonomy Scale
The culture at New Tech high schools is complex, as it is influenced by many external variables. For instance, the method of implementation often influenced how the culture of a school developed. As a director at one school explained, in a small learning community implementation “it’s hard to build the culture that we want when you share it with 1,300 other students that aren’t being trained up in the culture.” Fluctuations in the student population also influenced the culture at New Tech high schools. Teachers and students at two schools reported that their culture seemed to “fall” temporarily at the beginning of each year as a result of incoming freshmen unfamiliar with the New Tech model:
“As the teacher, you remember where your freshmen ended and you expect them to come in at that starting point, and it doesn’t happen. It’s difficult for the teacher having to start all over again and build it up.”

31
To combat this issue, students at one school formed an advisory group of upperclassmen who took the lead in introducing new students to the school’s cultural norms. Some schools also hosted a separate orientation for New Tech freshmen to introduce them to the model’s language and culture through various workshops and team-building activities. One teacher described the orientation:
“We just talked about what New Tech was about, how it worked, and why we were doing it. The kids got to see how a project evolved, what a Critical Friend was. They got to see why we integrated the classes…and how it would affect not just their freshmen year, their sophomore year, their junior year, but how it would affect them all four years of high school.”
If students struggled with maintaining the culture, teachers often used the advisory period as an opportunity to revisit school, classroom and group norms. The professional culture at schools also affected the way students behaved. For instance, when one school had to replace riffed New Tech teachers with teachers from a non-New Tech school, students were quite resistant toward their new instructors. Much like teachers experiencing difficulty with incoming freshmen unfamiliar with the model, students found it difficult to wait for the new instructors to acclimate to the New Tech environment.
Attendance. Attendance data was collected to determine if Indiana New Tech high school students attended school more or less frequently than other high school students in the state. Table 2.4 shows that the overall attendance rate for Tier 1, 2, 3, and 4 New Tech schools was higher than that of the comparison schools, but slightly lower than the overall Indiana public secondary school population.
Table 2.4: Attendance All Tier 1-4 New Tech
High Schools
New Tech Comparison
Schools
Indiana Secondary School Population
Enrollment and Attendance
Enrollment 3,181 29,826 318,914
Attendance Rate 95.6% 94.6% Not available until
Dec. 2011 Note: One New Tech school (n=113) did not submit attendance information

32
Table 2.5 shows attendance rates in New Tech schools from the 2007-08, 2008-09, 2009-10, and 2010-11 academic years, as well as the number of schools submitting data on enrollment. Overall, attendance rates at New Tech high schools were consistently high, ranging from 94.2% to 95.8%. The 2010-11 academic years had an overall attendance rate that was slightly higher than the previous year (95.4% vs. 95.6%).
Table 2.5: Attendance Rates, 2007-2011 2007-2008 2008-2009 2009-2010 2010-2011
Enrollment and Attendance
Number of Schools who Submitted Data 3 6 8 15
Enrollment 371 871 1,508 3,181
Attendance Rate 94.2% 95.8% 95.4% 95.6%
These attendance rates are further illustrated in Figure 2.4.
94.2%
95.8% 95.4% 95.6%
93.0%
93.5%
94.0%
94.5%
95.0%
95.5%
96.0%
2007-2008 (n=317)
2008-2009 (n=871)
2009-2010 (n=1,508)
2010-2011 (n=3,181)
Figure 2.4: Comparison of New Tech School Attendance Rates: 2007-2011

33
Student Behavior. Table 2.6 shows the total number of in-school and out-of-school suspensions, the number of students who received these infractions, as well at the number of expulsions across Tier 1, 2, 3, and 4 New Tech high schools, comparison schools, and secondary public schools statewide. There were only 33 expulsions in all 16 New Tech high schools. The number of suspensions also was low, with only 11.4% of students (377) receiving in-school suspensions and 10.0% (328 students) receiving out-of-school suspensions. For comparison schools, these infractions were slightly higher, with 20.8% (5,134/24,741) students receiving in-school suspensions and 13.2% (3,898/29,428) receiving out-of-school suspensions. For repeat offenses, the number of infractions decreased by more than half for both in- and out-of-school suspensions for New Tech high schools.
Table 2.6: Behavior All Tier 1-4 New
Tech High Schools
New Tech Comparison
Schools
Indiana Secondary School Population
Suspensions (total across school)
In-school Suspensions 710 14,202 d
Not available until
Dec. 2011
Total number of students given in-school suspensions
377 (11.9%) 5,134 (20.8%) d
Not available until Dec. 2011
Number of students with more than 1 in-school suspension
161 (5.1%) 2,740 (11.3%) e
Not available until Dec. 2011
Number of students with more than 2 in-school suspensions
72 (2.3%) 1,722 (7.1%) e
Not available until Dec. 2011
Out-of-school Suspensions 587 7,011 a
Not available until Dec. 2011
Total number of students given out-of-school suspensions
328 (10.3%) 3,898 (13.2%) a
Not available until Dec. 2011
Number of students with more than 1 out-of-school suspension
118 (3.7%) 1,567 (5.4%) b
Not available until Dec. 2011
Number of students with more than 2 out-of-school suspensions
50 (1.6%) 739 (2.6%) b
Not available until Dec. 2011
Total Suspensions (In-school and Out-of-school)
1,297 21,213 Not available until
Dec. 2011
Expulsions (total across school)
Expulsions 33 (1.0%) 337 (1.3%) c
Not available until Dec. 2011
a Data from 1 of the comparison schools was not available (n=29,428)
b Data from 3 of the comparison schools was not available (n=28,753)
c Data from 5 of the comparison schools was not available (n=26,433)
d Data from 6 of the comparison schools was not available (n=24,741)
e Data from 7 of the comparison schools was not available (n=24,274)

34
An Analysis of Variance (ANOVA) was computed to examine any notable differences by tier of the New Tech schools on attendance rate and total number of suspensions. Statistically significant results were found for both variables, so that some tiers had better attendance rates or total number of suspensions than other tiers, see Table 2.7.
Table 2.7: Attendance Rate and Total Number of Suspensions by Tier
Tier 1 Tier 2 Tier 3 Tier 4
F df
n mean n mean n mean n mean
Attendance Rate 977 95.96 664 96.60 428 94.94 1,112 95.73 13.02* 3
Total Number of Suspensions 977 0.38 664 0.39 428 0.16 1,225 0.49 7.65* 3
Note: F= F statistic; df=degrees of freedom *=p< .05, two-tailed
Professional Culture
Most administrators and teachers reported that staff collaboration was strong at their schools. Sometimes collaboration activities were initiated at the “grassroots level” by teachers: “Anything that I design and I think will be helpful for someone, I e-mail to him or her.” At other times, administrators facilitated collaboration among staff members. For example, one teacher shared that his director uses a “distributive leadership style,” which enables teachers to “formally and informally take on roles…[and] take sole ownership of multiple programs.” One director reported telling his staff, “‘I’m going to handle steering the ship here…You’ve got to start to see yourself as a teacher in a leadership role.’” Collaboration activities took on many forms, including integrated classes administered by co-teachers, collaborative common prep and early release times for co-teachers, networking among New Tech teachers across the state, regularly-scheduled staff meetings and professional development workshops, the implementation of the Critical Friends protocol, and shared leadership roles within the schools. In particular, teachers shared positive remarks about co-teaching: “I have had a great experience co-teaching. I think we play off each other’s strengths and we are able to kind of divide up the work based on what our individual strengths are.” Another teacher gave insight into the level of commitment to collaboration at New Tech high schools:
“We have a lot of access to each other. Our [planning] period is with our partner teacher, and then at lunch we are all [together]...Then, Wednesday mornings, our district has a delayed schedule…so we have meetings for 40 minutes that day. Thursday after school we meet anywhere from a half-hour to an hour.”
Staff members at one school implemented “Five Minute Fridays” where the director and teachers met to share positive stories from the week regarding project implementation, individual student growth and personal triumphs.

35
Teachers and directors alike reported that such activities helped enhance administrator and teacher relationships. For instance, one teacher reported feeling that the director at her school “just trusts us.” A teacher at another school shared that sentiment: “Our dean gives us a lot of autonomy…[and] he trusts our judgment.” In terms of how teacher relationships have changed, one teacher observed that since his school implemented the model, teachers “really get along well and work together really well.” Another teacher stated that since his school implemented the New Tech model, teacher collaboration became “really thorough and complete.” One teacher explained how collaboration activities enable teachers to better communicate: “We can share our concerns or make decisions together [and] we have protocols in place that help us to say things that we might feel uncomfortable saying in other settings.” Consequently, teachers reported feeling more comfortable helping one another design and improve classroom curricula. For instance, teachers at many of the schools reported using the Critical Friends protocol during staff meetings to discuss projects before they were implemented in classrooms: “We kind of start here and build the project out of that. And then we have two or three Critical Friends [sessions] before we can really refine it to the point where we’ll have no problems with the project.” One school spent an entire day at the end of each trimester reflecting on the PBL process:
“They bring in substitutes for our class. We get to sit down with our group of teachers and say, ‘OK, what worked and what didn’t work? Where do we need to go fix it?’ It’s nice to have that.”
Most importantly, though, collaboration activities enabled teachers to have a bigger impact on school-wide decision making and outcomes. For example, one teacher explained that as a result of increased collaboration teachers,
“Discuss real issues, and we [can] discuss leadership things. We come up with proposals and we are listened to, and many of the things going on in the school [are] because the teachers…developed it, and it was not directed [from an administrator].”
Another teacher explained how that privilege enabled teachers to move away from the “small picture” and start focusing on how to bolster student achievement:
“We spend a lot of time reassessing the way we do things, reshaping the way we do things, [and] being flexible about the design of our classroom and design of our school. We all feel like we have [truly] made this progress and developed something here with our students.”
One teacher attributed the success at his school entirely to the increased collaboration and trust facilitated through the New Tech model: “One of the things that make[s] [our] New Tech so successful is that…freedom and autonomy.” Collaboration activities did become strained, however, when all teachers did not fully buy into the model. One teacher

36
explained how not involving teachers in the implementation process created issues with buy-in:
“[Adoption of the New Tech model] just happened so quickly and without the total support, or the staff feeling like they were involved in that decision. It created resentment not only with the staff, but with the community, as well…[So] at this time, there is still a division among the staff that isn’t totally immersed in PBL…There was an ‘us and them’ attitude and that hasn’t totally gone away.”
Despite such issues, staff members at the school still were observed collaborating, just on a smaller scale than what was observed at other schools. A teacher at another school explained how relationships among staff members can become “strained because of the politics.” When teachers at the New Tech high school were riffed and replaced by teachers from a recently closed alternative school, both teachers and students doubted the new teachers’ buy-in to the model and had difficulty relating to them. Another teacher explained how issues with time can affect buy-in to the model: “If you have too many other constraints on your time or motivation, then PBL doesn’t have the rigor that it could have in it.” Unfortunately, many teachers reported issues with managing their time due to all the increased responsibilities of the model: “I’ve never worked outside of school hours more than I have this year.” Similarly, another teacher said, “It just seems like there is always something to do.” Teacher Leadership Inventory Results. Table 2.8 details teachers’ responses on the Teacher Leadership Inventory, and shows the questions included in each scale. Overall, teachers felt neutral or agreed with most of the questions. Respondents most readily agreed with the statements, “Teachers discuss ways to improve student learning” (mean=4.28); “Other teachers willingly offer me assistance if I have questions about how to teach a new topic or skills” (mean=4.25), and “Teachers ask one another for assistance when we have a problem with student behavior in the classroom” (mean=4.15). Respondents were less likely to agree with statements such as “Administrators object when teachers take on leadership responsibilities” (mean=1.88); “Most teachers in leadership positions only serve because they have been principal appointed” (mean=2.35), and “The principal consults the same small group of teachers for input on decisions” (mean=3.37).

37
Table 2.8: Survey Responses (N=105)
Strongly Disagree
Disagree Neutral Agree Strongly
Agree Mean (sd)
Sharing Expertise Scale
Teachers ask one another for assistance when we have a problem with student behavior in the classroom. (n=95)
2 4 7 47 35 4.15
(0.89)
Other teachers willingly offer me assistance if I have questions about how to teach a new topic or skills. (n=95)
2 1 7 46 39 4.25
(0.81)
Teachers here share new ideas for teaching with other teachers such as through grade/department meetings, school wide meetings, professional development, etc. (n=95)
2 5 6 47 35 4.14
(0.91)
Teachers discuss ways to improve student learning. (n=95)
2 0 3 54 36 4.28
(0.72)
Teachers stay current on education research in our grade level/subject area/department. (n=94)
3 4 17 50 20 3.85
(0.92)
Sharing Leadership Scale
Teachers are involved in making decisions about activities such as professional development, cross-curricular projects, etc. (n=94)
3 6 15 35 35 3.99
(1.04)
Teachers are actively involved in improving the school as a whole. (n=94)
3 5 17 37 32 3.96
(1.02)
The principal responds to the concerns and ideas of teachers. (n=95)
4 6 14 36 35 3.97
(1.08)
Teachers plan the content of professional learning activities at my school. (n=94)
2 11 20 39 22 3.72
(1.02)
Teachers have opportunities to influence important decisions even if they do not hold an official leadership position. (n=95)
5 12 6 40 32 3.86
(1.17)
Time is provided for teachers to collaborate about matters relevant to teaching and learning. (n=95)
7 18 18 32 20 3.42
(1.23)
Supra-Practitioner Scale
Teachers willingly stay after school to work on school improvement activities. (n=94)
2 9 16 47 20 3.79
(0.96)
Teachers willingly stay after school to help other teachers who need assistance. (n=94)
2 2 18 45 27 3.99
(0.87)
Teachers willingly stay after school to work with administrators, if administrators need assistance. (n=95)
4 5 17 45 24 3.84
(1.00)
Principal Selection Scale
Administrators object when teachers take on leadership responsibilities. (n=95)
39 40 8 4 4 1.88
(1.02)
The principal consults the same small group of teachers for input on decisions. (n=95)
6 21 16 36 16 3.37
(1.19)
Most teachers in leadership positions only serve because they have been principal appointed. (n=95)
20 38 22 14 1 2.35
(1.01)

38
Respondents who expressed the highest levels of agreement in the teacher leadership scales were those who had more years of New Tech teaching experience. A statistically significant difference was found in group means between those with 0-1 years of New Tech teaching experience and those with 2-4 years of New Tech teaching experience9 in the Sharing Leadership scale. Teachers with 2-4 years of New Tech teaching experience reported higher levels of agreement in Sharing Leadership than those with 1-2 years of teaching experience, (t=-2.752, p=0.007). Further, a medium effect size10 was found between those with 2-4 years of New Tech experience and those with 0-1 years of experience for this scale (Cohen’s d=0.570, r=0.274). Surprisingly, no statistically significant differences occurred based on overall teaching experience, see Table 2.9.
Table 2.9: Teacher Leadership Scales by New Tech Teaching Experience (N=105) 0-1 Years 2-4 Years
t df
n mean n mean
Sharing Expertise Scale 63 4.075 41 4.229 -1.164 102
Sharing Leadership Scale 63 3.651 41 4.092 -2.752* 102
Supra-Practitioner Scale 63 3.837 41 3.950 -0.716 102
Principal Selection Scale 63 2.604 41 2.421 1.412 102
Overall Teacher Leadership Scale 63 3.740 41 3.960 -1.973 102 Note: t= t-score statistic; df=degrees of freedom *=p< .05, two-tailed
9 All teachers in the survey reported only 0-1 year or 2-4 years of New Tech Experience, thus an independent sample t-test was
utilized instead of an ANOVA test. 10
Guideline 5-1-4F of the NCES Handbook on Statistical Standards deems Cohen d effect sizes of .2 as small, .5 as medium and
.8 large. For correlations (r), .1 is small, .3 is medium and .5 is large (Seastrom 2002).
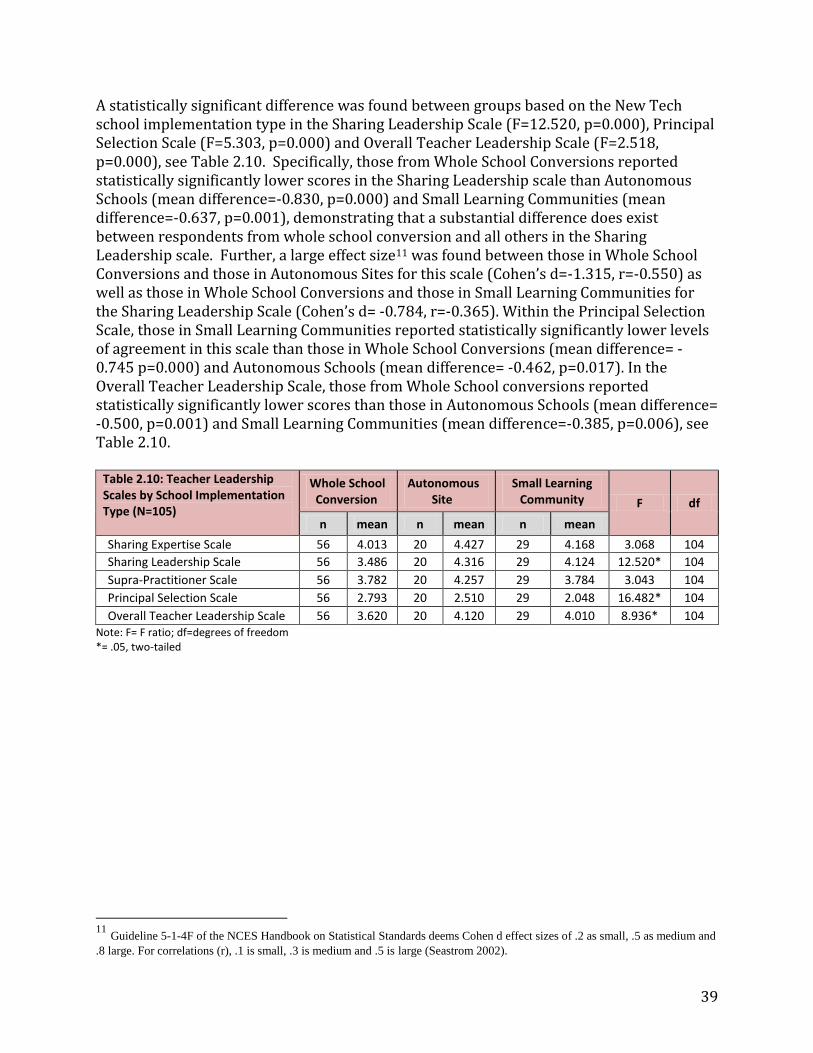
39
A statistically significant difference was found between groups based on the New Tech school implementation type in the Sharing Leadership Scale (F=12.520, p=0.000), Principal Selection Scale (F=5.303, p=0.000) and Overall Teacher Leadership Scale (F=2.518, p=0.000), see Table 2.10. Specifically, those from Whole School Conversions reported statistically significantly lower scores in the Sharing Leadership scale than Autonomous Schools (mean difference=-0.830, p=0.000) and Small Learning Communities (mean difference=-0.637, p=0.001), demonstrating that a substantial difference does exist between respondents from whole school conversion and all others in the Sharing Leadership scale. Further, a large effect size11 was found between those in Whole School Conversions and those in Autonomous Sites for this scale (Cohen’s d=-1.315, r=-0.550) as well as those in Whole School Conversions and those in Small Learning Communities for the Sharing Leadership Scale (Cohen’s d= -0.784, r=-0.365). Within the Principal Selection Scale, those in Small Learning Communities reported statistically significantly lower levels of agreement in this scale than those in Whole School Conversions (mean difference= -0.745 p=0.000) and Autonomous Schools (mean difference= -0.462, p=0.017). In the Overall Teacher Leadership Scale, those from Whole School conversions reported statistically significantly lower scores than those in Autonomous Schools (mean difference= -0.500, p=0.001) and Small Learning Communities (mean difference=-0.385, p=0.006), see Table 2.10.
Table 2.10: Teacher Leadership Scales by School Implementation Type (N=105)
Whole School Conversion
Autonomous Site
Small Learning Community F df
n mean n mean n mean
Sharing Expertise Scale 56 4.013 20 4.427 29 4.168 3.068 104
Sharing Leadership Scale 56 3.486 20 4.316 29 4.124 12.520* 104
Supra-Practitioner Scale 56 3.782 20 4.257 29 3.784 3.043 104
Principal Selection Scale 56 2.793 20 2.510 29 2.048 16.482* 104
Overall Teacher Leadership Scale 56 3.620 20 4.120 29 4.010 8.936* 104 Note: F= F ratio; df=degrees of freedom *= .05, two-tailed
11
Guideline 5-1-4F of the NCES Handbook on Statistical Standards deems Cohen d effect sizes of .2 as small, .5 as medium and
.8 large. For correlations (r), .1 is small, .3 is medium and .5 is large (Seastrom 2002).

40
Further, large effect sizes were found among the three school implementation types in these scales, as shown in Table 2.11.
Table 2.11: Effect Sizes by School Implementation Type
Effect Size
Cohen’s d r
Whole School Conversion and Autonomous Site in the Sharing Leadership Scale
-1.315 -0.550
Whole School Conversion and Small Learning Community in the Sharing Leadership Scale
0.784 -0.365
Whole School Conversion and Small Learning Community in the Principal Selection Scale
1.342 0.557
Autonomous Site and Small Learning Community in the Principal Selection Scale
0.742 0.350
Whole School Conversion and Autonomous Site in the Overall Teacher Leadership Scale
-1.168 -0.504
Whole School Conversion and Small Learning Community in the Overall Teacher Leadership Scale
-0.646 -0.307
Note: Guideline 5-1-4F of the NCES Handbook on Statistical Standards deems Cohen d effect sizes of .2 as small, .5 as medium and .8 large. For correlations (r), .1 is small, .3 is medium and .5 is large (Seastrom 2002).
Statistically significant linear relationships were also found between school implementation type and teacher responses when controlling for all other variables. Being an autonomous site was a statistically significant predictor of more positive responses in the Sharing Leadership scale (t=2.202, p=0.030). Being a small learning community was a statistically significant predictor in more positive responses in the Sharing Leadership scale as well (t=2.135, p=0.035). Being a small learning community was a statistically significant predictor in more negative responses in the Principal Selection Scale (t=-4.158, p=0.000). A statistically significant difference was found among groups based on tier of the New Tech school in all of the scales of Sharing Expertise, Sharing Leadership, Supra Practitioner, Principal Selection and Overall Teacher Leadership. Those from Tier 3 schools reported statistically significantly higher levels of agreement in the Sharing Expertise scale than Tier 4 schools (mean difference=0.602, p=0.007). Significant mean differences were found between Tier 1 and 4 schools (mean difference=0.582, p=0.044), Tier 2 and 3 schools (mean difference=-0.601, p=0.038), and Tier 3 and 4 schools (mean difference=1.019, p=0.000) in the Sharing Leadership Scale. Within the Supra-Practitioner Scale, those from Tier 3 schools rated higher levels of agreement than those in Tier 1 schools (mean difference= 0.781, p=0.015). Those from Tier 3 schools reported statistically significantly lower scores in the Principal Selection than those from both Tier 2 schools (mean difference=-0.663, p=0.002) and Tier 4 schools (mean difference=-0.630, p=0.003). In the Overall Teacher Leadership Scale, those from Tier 3 reported statistically significantly higher levels of agreement overall than those from all the schools, (mean difference from Tier 1= 0.512, p=0.024; mean difference from Tier 2 schools=0.462, p=0.018; mean difference from Tier 4 schools=0.698, p=0.000).

41
By locale, a statistically significant difference was found in group means between those from large/mid-size city and urban fringe schools and those in small/large town or rural schools in all five of the scales. Teachers from large/mid-size city and urban fringe schools reported higher levels of agreement in the scales of Sharing Expertise (t=3.350, p=0.001), Sharing Leadership (t=4.162, p=0.000), Supra-Practitioner (t=2.639, p=0.010) and Overall Teacher Leadership (t= 4.379, p=0.000) than those from small/large town or rural schools, but lower levels of agreement in the Principal Selection scale (t=-3.051, p=0.003), see Table 2.12.
Table 2.12: Teacher Leadership Scales by School Locale (N=105
Large/Mid-size City and Urban
Fringe
Small/Large Town and Rural t df
n mean n mean
Sharing Expertise Scale 47 4.363 58 3.949 3.350* 104
Sharing Leadership Scale 47 4.165 58 3.541 4.162* 104
Supra-Practitioner Scale 47 4.092 58 3.695 2.639* 104
Principal Selection Scale 47 2.328 58 2.700 -3.051* 104
Overall Teacher Leadership Scale 47 4.070 58 3.620 4.379* 104 Note: t= t-score statistic; df=degrees of freedom *= .05, two-tailed
Further, medium-to-large effect sizes were found between those from large/mid-size city and urban fringe schools and small/large town and rural schools for these scales, see Table 2.13.
Table 2.13: Effect Sizes between Large/Mid-size city and Urban Fringe Schools and Small/Large Town and Rural Schools
Effect Size
Cohen’s d r
Sharing Expertise Scale 0.673 0.319
Sharing Leadership Scale 0.822 0.380
Supra-Practitioner Scale 0.521 0.252
Principal Selection Scale -0.597 -0.286
Overall Teacher Leadership Scale 0.864 0.397 Note: Guideline 5-1-4F of the NCES Handbook on Statistical Standards deems Cohen d effect sizes of .2 as small, .5 as medium and .8 large. For correlations (r), .1 is small, .3 is medium and .5 is large (Seastrom 2002).
Statistically significant linear relationships were also found between school locale and teacher responses. Being from a large/mid-size cities and urban fringe locales was a statistically significant predictor of more positive responses in the Sharing Expertise scale (t=2.126, p=0.036) when controlling for all other variables in the model. Partnership Development
Each school has experienced different levels of success in terms of developing partnerships with community members and parents. Only three schools were able to have a full-time staff member totally devoted to developing partnerships in the local community. At most schools, teachers had to bear the extra responsibility of developing partnerships. Some teachers reported that the sheer amount of time it takes to contact partners, as well as all of

42
their additional responsibilities under the model, made it difficult to meet the extra demand of cultivating community partnerships:
“Unfortunately at this point, we don’t do a whole lot as far as outreach and really getting into the community. We have worked so hard on curriculum and other things that that is one piece of the puzzle that we continually mark ourselves down [on].”
Another teacher shared similar sentiments, explaining that teachers were more focused on “just trying to stay afloat.” To combat this issue, teachers at some schools tried to distribute the responsibility of soliciting community partnerships across the entire staff. For instance, at one school, each teacher was responsible for contributing ten contacts to a database of community contacts the staff was creating. Teachers’ efforts also were hindered by partners’ time constraints: “Trying to set up dates with these people that we want to come in that have very busy schedules is tricky.” For example, on the day students at one school were scheduled to pitch their project ideas, the community partner unexpectedly was called out of town: “That concept of letting go of more and more control of your class is so hard for a lot of us teachers, whether it be to technology or whether it be to outside speakers.” Another teacher pointed out that it is “hard to get community partners to commit all day.” When community partners were involved in projects they participated in a range of activities, including introducing questions, creating entry documents, providing expertise as guest speakers, and serving as evaluators of final projects. Teachers at schools located in more isolated, rural areas struggled to form community partnerships—they often found that local organizations were not relevant to the content they needed to teach. In such instances, teachers used their personal network of contacts to bring in authentic community partners. For example, one teacher asked an alumnus and a family member who work in broadcasting to help prepare her students for a project on making commercials. Teachers also served as project evaluators for one another when community partners were not available. There also was wariness toward creating community partnerships at schools in their first year of implementation. Teachers at those schools felt they needed sufficient time to “polish” projects and presentation skills before bringing in community partners to observe their students:
“We don’t want to bring in people while we’re still learning this model and have them be very judgmental of it and go out and say bad things. So, we have been very careful at this point about who we bring in and what they may go out and share.”
At some schools, students were able to help with the partnership development process: “We’ve had some cases where students have really gotten extremely involved with a particular community partner and helped build that partnership.” Teachers saw partnership development activities as a prime opportunity for students in “making that

43
professional first step…to train them [in] how to approach a community partner with a phone call or e-mail.” To continue these activities, several schools are working to develop full internship programs for students. In fact, partnerships at several schools already have resulted in students being recruited for internships and other types of work with local organizations. Partnerships were not just limited to community organizations; teachers also worked to develop positive relationships with parents. At one school, the packet parents received upon enrolling their child in the school included a volunteer form that solicited information about their willingness to volunteer, availability, and skill sets. Furthermore, at all schools, administrators and teachers intermittently host open houses to teach parents more about the New Tech model and to familiarize them with Echo. Some teachers also sent parents newsletters to keep them abreast of what was happening in the school. Consequently, parents have been involved with school panels and tours, chaperoned field trips, helped manage school distribution lists, constructed materials for projects, evaluated projects, and presented as speakers during job fairs and lessons. In the survey, students reported that they particularly enjoyed hearing from guest speakers: “The speakers that visit our class are usually insightful and have the experience to inform us about a subject or career path.” Furthermore, teachers and students worked to collaborate with individuals at other New Tech high schools across the state. For example, teachers often collaborated with other teachers across the state to brainstorm and share project ideas. Furthermore, students at two schools participated in an exchange program that enabled them to switch schools and experience each other’s school culture and norms. Additionally, most of the schools have strong partnerships with CELL and NTN. Data from the student survey provided an overall picture of partnership development activities at the New Tech high schools, see Table 2.14. Respondents most readily agreed with the statements, “I am enrolled or plan to enroll in college-level courses” (mean=3.22), “College-level courses are offered at this school” (mean=3.01), and “My school hosts tours and visits,” (mean=2.87). Respondents were less likely to agree with statements such as “Parents volunteer at this school” (mean=2.58), “Our school is respected by the community (mean=2.67), and “My school requires community service” (mean=2.69).
Table 2.14: Summary of Items within the Partnership Development Scale (N=226)
Mean
Standard Deviation
College-level courses are offered at my school 3.01 1.12
My school requires community service 2.69 1.22
I am enrolled or plan to enroll in college-level courses 3.22 1.13
Parents volunteer at this school 2.58 1.07
My school hosts tours and visits 2.87 1.17
My school offers internships and/or job shadowing 2.76 1.10
Our school is respected by the community 2.67 1.16 Note: The mean score of each question was used to replace missing responses.
Multiple linear regression analysis was utilized to examine which variables affected the Partnership Development Scale. A statistically significant positive linear relationship was

44
found between PBL Index and the Learning Outcomes Scale, (t=10.359, p=0.000). Further, PBL Index exerted the strongest influence on Partnership Development when controlling for the other demographic and academic variables (β=0.584), demonstrating that use of PBL was strongly associated with students’ responses in the Partnership Development Scale. Though statistically significant positive relationships were found between other variables12 and the Partnership Development Scale, the impacts were not as strong as the PBL Index. Figure 2.5 gives a visual representation of this positive linear relationship, showing that as the PBL Index increased, students reported higher levels of agreement in the Partnership Development Scale. This shows that students who experienced PBL more often (as represented by the PBL Index Scale) were more likely to agree that their school exhibited the positive type of community partnership development that was described on the School Success Rubric (as represented by the Partnership Development Scale). Figure 2.5: PBL Index vs. Partnership Development Scale
12 Being white, non-Hispanic and receiving A’s and B’s in New Tech classes were all statistically significant predictors of the School Culture and Autonomy Scale as well but not as strong as PBL Index.

45
Academic Success & Learning Outcomes
Teachers at all of the schools seemed genuinely committed to student success. While many of them believed in the power of the model to bolster student achievement, they made sure to collect data in their classrooms to ensure students were seeing increased success. For example, two co-teachers reported analyzing students’ ECA scores to determine if they needed to do more scaffolding in their classroom. Another teacher reported, “Constantly looking at the data to see who is doing well and who is not doing well…[to] figure out where our problems lie.” Teachers also tried to provide students with a certain measure of autonomy in their work:
“I let [students] sometimes choose the way they want to do a project—they decide what they think would be fun. [And] if they have another idea of technology they think we can handle, we do it.”
The physical layout of classrooms affected engagement. For instance, when desks and tables were situated in a way that prevented teachers from being able to see students’ computer monitors from their desks or the front of the room, students often engaged in off-task behavior like playing on-line games, e-mailing friends at inappropriate times, and chatting with friends on Facebook. However, teachers still tried to be flexible with classroom operations. For instance, when teachers offered workshops, all students were not necessarily required to attend:
“[We] leave some decision making to the students in the classroom…especially as far as instruction goes. We give them the responsibility, a lot of the times, of [deciding] what type of instruction they need. For the most part, they are very responsible about it…they know if they need to go to that workshop.”
If work time was left too unstructured, though, students’ work ethic often suffered as they became distracted by things like cell phones, mp3 players and the Internet. Students appeared most engaged in projects and/or activities that entailed working on specific tasks, participating in small-group workshops, or submitting short-term assignments, while long periods of independent or group work time seemed to lead to more off-task behavior. However, during most observations, students appeared to be engaged in classroom work and activities. Even when students finished their work early, they often worked on other assignments instead of wasting time. Students were so accustomed to this autonomy that teachers sometimes faced pushback if they did not allow them to control how they worked. For example, during an observation at one school, a teacher wanted students to use a four-step method for problem solving, but one student was adamant about not using it because he felt he could find the answer more easily without it. Teachers were able to motivate disengaged students to work by taking time with them to talk one-on-one and guide them through assignments. Sometimes students held each other accountable for work, as they were observed reminding one another to stay on-task during

46
group work time. For example, in one class, a student was observed telling his group, “You guys need to do your work. We are way behind everyone else. We are only on chapter two and everyone else is on chapter four.” During another observation, a student was observed telling a group member who did not want to work, “This is your project, too!” Even when students were working individually, they exhibited concern for each other’s progress. For example, one student was observed asking an off-task classmate if watching a YouTube™ video was more important than homework, saying, “No pressure, but you don’t have a lot of time to get that done. How far are you?” Teachers reinforced group collaboration and responsibility using a variety of strategies. Some teachers used individual contribution roles (i.e., group leader, etc.) to clearly define expectations and better facilitate accountability among students. Furthermore, many teachers encouraged students to use resources like Google Docs™, advisory time and Skype™ to stay in touch with one another. At one school, the director performed “Trust, Respect, Responsibility audits” during which students were asked to explain those concepts based on their experiences in the model. At most schools, students were observed negotiating with group members to complete tasks. Teachers also required students to report to “accountability partners,” or use partner contracts to hold each other accountable for their work at some schools. Furthermore, some teachers used “collaboration rubrics” for teacher-student and student-student evaluations. Students also provided feedback to one another using the Critical Friends protocol. According to one teacher, all of these activities did have a significant impact on students’ academic outcomes; reportedly, most students from the first cohort of seniors at her school had both graduated and entered college:
“[When] we met [some of these students], they weren’t planning on [attending college]. Now, they’ve chosen [to attend] and they realize that they have what it takes and they can do it. Now that they’re at college, they’re succeeding.”
She also reported that those students felt New Tech had better prepared them for college than students who had attended traditional schools, as they were more comfortable with the increased note taking and research their college classes required: “They’re not sweating it; they’re not stressed.” Furthermore, some students already had been exposed to college courses through schools’ partnerships with Indiana University-Purdue University Fort Wayne, Ivy Tech, Trine University, and Vincennes University. While most teachers felt that student performance definitely had improved as a result of the model, they still had some reservations about it. For instance, some teachers felt that despite implementing the model, it was difficult to challenge high-achieving students and keep low-achieving students motivated: “It’s been, again, a push and pull between keeping students in school and keeping them engaged, trying to push them has hard as we want to.”

47
Students offered insight into their level of engagement on the Learning Outcomes portion of the student survey, see table 2.15. Respondents most readily agreed with the statements, “I attend school regularly” (mean=4.35), “I am able to do research on my own without my teacher helping me” (mean=3.82), and “My New Tech classes are important for me to get a good job in the future,” (mean=3.20). Respondents were less likely to agree with statements such as “I am required to keep a portfolio or resume of my work” (mean=2.86), and “I am required to write reflection journals in my classes” (mean=2.89). Before reversing the scores to make the Learning Outcomes Scale, it was found that students agreed with the item, “I get bored easily in my classes,” (mean=3.81).
Table 2.15: Summary of Items within the Learning Outcomes Scale (N=226)
Mean
Standard Deviation
I am required to write reflection journals in my classes 2.89 1.11
I attend school regularly 4.35 0.81
My New Tech classes are important for me to get a good job in the future
3.20 1.24
I am able to do research on my own without my teacher helping me
3.82 1.03
I am interested in my classes 2.99 1.14
I am required to keep a portfolio or resume of my work 2.86 1.22
I get bored easily in my classes a 2.19 1.15
Note: The mean score of each question was used to replace missing responses. a Scores were reversed in this question; so a 1 would be coded as a 5, a 2 as a 4, etc.
Multiple linear regression analysis was utilized to examine which variables influenced the Learning Outcomes Scale. A positive linear relationship was found between the PBL Index and the Learning Outcomes Scale, which was found to be statistically significant (t=9.300, p=0.000). Further, PBL Index exerted the strongest influence on this scale when controlling for other demographic and academic variables (β=0.531), revealing that PBL usage was strongly associated with students’ perceptions of learning outcomes. Though statistically significant positive relationships were found between other variables13 and the Learning Outcomes Scale, the impacts were not as strong as the PBL Index.
13 Being white, non-Hispanic, grade level, receiving A’s and B’s in New Tech classes and average number of projects completed in the academic year were all statistically significant predictors of the Learning Outcomes Scale as well but not as strong as PBL Index.

48
Figure 2.6 gives a visual representation of this positive linear relationship, showing that as the PBL Index increased, students reported higher levels of agreement in the Learning Outcomes Scale. This shows that students who experienced PBL more often (as represented by the PBL Index Scale) were more likely to agree that their school supported student outcomes and academic progress as described by the School Success Rubric (as represented by the Learning Outcomes Scale). Figure 2.6: PBL Index vs. Learning Outcomes Scale

49
Algebra I and II Course-Taking. As shown in Table 2.16, the majority of freshmen New Tech students took Algebra I or Algebra II (60.7%). More specifically, over half of the 10th- grade students (50.7%) and over a quarter of 11th-grade students (27.7%)took Algebra II instead of Algebra I, demonstrating that New Tech students were successful at passing Algebra I.
Academic Performance. Table 2.17 shows that over three-quarters of students at Tier 1, 2, 3, and 4 New Tech schools were passing Algebra I. Further, over 85% of students were passing Algebra II (86.8%), Biology I (80.0%), and English 10 (89.7%).
Table 2.17: Academic Performance by Course Completion All Tier 1-4 New Tech High Schools
Course
Algebra I
Number of Students Enrolled in Course 1,145
Percent of Students Passing Course 77.3%
Algebra II
Number of Students Enrolled in Course 672
Percent of Students Passing Course 86.8%
Biology I
Number of Students Enrolled in Course 1,629
Percent of Students Passing Course 80.0%
English/Language Arts 10
Number of Students Enrolled in Course 1,110
Percent of Students Passing Course 89.7%
Table 2.16: Algebra I and II Course-Taking by Grade All Tier 1-4 New Tech High Schools
Course Number and Percent of Grade
Algebra I
Total Number of Students Enrolled in Course 1,145
9th
Graders 978 (85.4%)
10th
Graders 135 (11.8%)
11th
Graders 28 (2.4%)
12th
Graders 4 (0.4%)
Algebra II
Total Number of Students Enrolled in Course 672
9th
Graders 124 (18.5%)
10th
Graders 341 (50.7%)
11th
Graders 186 (27.7%)
12th
Graders 21 (3.1%)
Algebra I and/or II*
Total Number of Students Enrolled in Course 1,815855
9th
Graders 1,102 (60.7%)
10th
Graders 475 (26.2%)
11th
Graders 213 (11.7%)
12th
Graders 25 (1.4%)
Total New Tech Student Enrollment 3,294 *2 Students were taking both Algebra I and II The results for Algebra I and/or II course taking are unduplicated student counts

50
Figure 2.7 further illustrates how students performed in the four specific courses. Overall, students were passing English/Language Arts 10 at the highest rate, followed by Algebra II, Biology I and Algebra I.
0% 20% 40% 60% 80% 100%
English/Language Arts 10
Biology I
Algebra II
Algebra I
Figure 2.7: Academic Performance by Course Completion
Passing
Not passing or no grade awarded

51
Table 2.18 shows the number of students who attempted and passed ECA exams in the 2010-11 and 2009-10 academic years. This year, New Tech students were passing all three of the ECAs more readily than the comparison schools. However, less New Tech students were passing their ECAs than other schools in the state during the 2010-11 year. In the 2009-10 academic year, New Tech students were passing Algebra I and English 10 ECAs at greater rates than comparison schools and all other schools statewide. Overall, all three categories of students passed the English 10 ECA at the highest rates, followed by Algebra I and Biology I.
Table 2.18: ECA Performance for the 2010-11 and 2009-2010 Academic Years
All Tier 1-4 New Tech High Schools
New Tech Comparison
Schools
Indiana Secondary School Population*
2010-2011 Academic Year
Average Scaled Algebra I ECA Score 564 568 567
Number of Students Taking ECA 1,520 12,143 62,328
Percent of Students Passing (Pass/Pass+)
56.0% 49.5% 64.4%
Average Scaled English 10 ECA Score 387 373 365
Number of Students Taking ECA 1,074 11,008 84,703
Percent of Students Passing (Pass/Pass+)
67.3% 56.2% 71.2%
Average Scaled Biology I ECA Score 476 471 473
Number of Students Taking ECA 1,248 7,682 79,864
Percent of Students Passing (Pass/Pass+)
40.0% 38.5% 46.4%
2009-2010 Academic Year**
Average Scaled Algebra I ECA Score 566 555 526
Number of Students Taking ECA 572 10,320 58,787
Number of Students Passing (Pass/Pass+)
57.5% 44.1% 52.4%
Average Scaled English 10 ECA Score 393 384*** 340
Number of Students Taking ECA 272 7,258*** 80,131
Percent of Students Passing (Pass/Pass+)
67.6% 58.9%*** 64.1%
Average Scaled Biology I ECA Score 432 444 410
Number of Students Taking ECA 177 7,600 78,118
Percent of Students Passing (Pass/Pass+)
27.7% 29.6% 37.5%
Note: Scaled scores are calculated from converting the 2-digit “raw score” of correct responses to a 3-digit, equal-interval “scale score,” which is expressed on a vertical scale by content area. Passing cut scores for the 2009-10 year and beyond, as adopted by IDOE on August 3, 2010: Algebra I: 564; English 10: 360; Biology I: 509. *Statewide numbers in this table include both public and private schools. **Tier 4 ECA scores for the 2009-10 academic year were not included in the calculations because they were not part of the model during that year. ***One comparison school did not have English 10 ECA data available for the 2009-10 school year.

52
Figures 2.8 and 2.9 give a better illustration of students’ performance in their ECAs for the 2010-11 and 2009-10 academic years. In 2010-11, New Tech students out-performed comparison schools, with more students passing these assessments. However, a smaller percent of students were passing their ECAs than all high schools statewide, shown in Figure 1.6. In the 2009-10 academic year, New Tech students out-performed both categories of comparison schools and all high schools statewide in both Algebra I and English 10 ECAs, with greater percentages of students passing these assessments., see Figure 1.7.
Note: Statewide numbers in this table include both public and private schools.
0.0%
10.0%
20.0%
30.0%
40.0%
50.0%
60.0%
70.0%
80.0%
Algebra I English 10 Biology I
Figure 2.8: Percent of Students Passing ECAs (Pass/Pass+): 2010-2011
Tier 1-4 New Tech HS
New Tech Comparison Schools
Indiana Secondary Schools

53
Note: Statewide numbers in this table include both public and private schools. Tier 4 ECA scores for the 2009-10 academic year were not included in the calculations because they were not part of the model during that year. One comparison school did not have English 10 ECA data available for the 2009-10 school year.
Table 2.19 shows New Tech students’ eligibility for graduation. Algebra I and English 10 ECA scores from both the 2009-10 and 2010-11 academic years were combined for schools who submitted information. Almost two-thirds of New Tech students passed the Algebra I ECA (65.6%), and well over two-thirds passed the English 10 ECA (69.8%).
Table 2.19: Eligibility for Graduation, as of the 2010-2011 Academic Year All Tier 1-4 New Tech High Schools
Algebra I ECA
Number of Students Taking ECA 2,198
Percent of Students Passing (Pass/Pass+) 65.6%
English 10 ECA
Number of Students Taking ECA 1,243
Percent of Students Passing (Pass/Pass+) 69.8% Note: ECA scores from the 2009-10 and 2010-11 academic years were included for all tier schools if they submitted information.
0.0%
10.0%
20.0%
30.0%
40.0%
50.0%
60.0%
70.0%
80.0%
Algebra I English 10 Biology I
Figure 2.9: Percent of Students Passing ECAs (Pass/Pass+): 2009-2010
Tier 1-4 New Tech HS
New Tech Comparison Schools
Indiana Secondary Schools

54
An independent two-sample t-test was performed to examine if mean ECA scale scores and pass rates changed significantly from the 2009-10 to 2010-11 for Tier 1-3 schools, who had implemented the New Tech model in both of these years. Table 2.20 shows the means, standard deviations, t-test results and effect sizes. Though 2010-11 ECA scores and pass rates were generally higher than the 2009-10 academic year, the change was only statistically significant for Algebra I ECA scores, Biology I ECA scores, and Biology I ECA pass rates. Biology I ECA scores and pass rates also had moderate effect sizes from 2009-10 to 2010-11(Cohen’s d=0.39 for Bio I scores; Cohen’s d=0.25 for Bio I pass rates).
Table 2.20: Change in Mean ECA Scores and Pass Rates from 2009-10 to 2010-11 for Tier 1-3 New Tech Schools
2010-11 2009-10 t df
Effect Size (Cohen’s d)
n mean n mean
Algebra I ECA Scale Scores 942 575.20 572 565.74 1.99* 1,512 0.10
Algebra I ECA Pass Rates a 942 0.600 572 0.58 0.77 1,512 0.04
English 10 ECA Scale Scores 778 395.01 272 392.68 0.40 1,048 0.03
English 10 ECA Pass Rates a 778 0.720 272 0.68 1.25 1,048 0.09
Biology I ECA Scale Scores 459 474.02 177 432.11 4.47* 634 0.39
Biology I ECA Pass Rates a 459 0.390 177 0.28 2.60* 634 0.25
Note: t= t-score statistic; df=degrees of freedom Guideline 5-1-4F of the NCES Handbook on Statistical Standards deems Cohen d effect sizes of .2 as small, .5 as medium and .8 large. For correlations (r), 0.1 is small, 0.3 is medium and 0.5 is large (Seastrom 2002). a Pass rates were coded as 1=passing and 0=not passing.
*=p< .05, two-tailed

55
An Analysis of Variance (ANOVA) was computed to examine any statistically significant differences by tier of the New Tech schools on ECA scores and pass rates for the 2009-10 and 2010-11 academic years. Significant F rations were found among the tiers for Algebra I scores and pass rates and English 10 scores and pass rates for both 2010-11 and 2009-10. Significant F rations were found among the tiers for Biology I scores and pass rates for 2009-10 only, see Table 2.21.
Table 2.21: ECA Scores and Pass Rates by Tier
2010-2011
Tier 1 Tier 2 Tier 3 Tier 4
F df
n mean n mean n mean n mean
Algebra I ECA Scale Scores 544 599.93 177 533.90 221 547.41 578 547.00 50.35* 3
Algebra I ECA Pass Rates
a 544 0.75 177 0.37 221 0.42 578 0.49 49.65* 3
English 10 ECA Scale Scores 453 395.16 114 403.76 211 389.97 296 367.20 8.55* 3
English 10 ECA Pass Rates
a 453 0.72 114 0.75 211 0.71 296 0.55 9.79* 3
Biology I ECA Scale Scores 186 469.81 78 476.76 195 476.94 789 477.52 0.26 3
Biology I ECA Pass Rates
a 186 0.41 78 0.38 195 0.38 789 0.40 0.12 3
2009-2010 Tier 1 Tier 2 Tier 3 Tier 4 F
df n mean n mean n mean n mean
Algebra I ECA Scale Scores 106 547.41 344 566.09 122 580.66 Not applicable 3.31* 2
Algebra I ECA Pass Rates
a 106 0.39 344 0.60 122 0.66 Not applicable 10.48* 2
English 10 ECA Scale Scores 97 372.05 175 404.11 Not applicable Not applicable 8.87* 1
English 10 ECA Pass Rates
a 97 0.62 175 0.71 Not applicable Not applicable 2.31* 1
Biology I ECA Scale Scores 45 427.89 40 482.25 92 412.37 Not applicable 6.08* 2
Biology I ECA Pass Rates
a 45 0.29 40 0.40 92 0.22 Not applicable 2.37* 2
Note: F= F statistic; df=degrees of freedom a Pass rates were coded as 1=passing and 0=not passing.
*=p< .05, two-tailed

56
Table 2.22 presents the effect sizes between tier 1 and 4 schools and their 2010-11 ECA scores and pass rates. Only tier 1 and 4 schools were compared because these tiers represent those schools with the most experience implementing the New Tech model and those schools with the least experience implementing the New Tech model. A medium effect size existed for Algebra I scores and pass rates between tier 1 and 4 schools, with tier 1 schools having higher Algebra I scores and pass rates. Moderate-to-small effect sizes existed between tier 1 and 4 schools for English 10 scores and pass rates, with tier 1 schools once again having higher scores and pass rates for English 10.
Table 2.22: Effect Sizes Between Tier 1 and Tier 4 Schools’ 2010-11 ECA Scores and Pass Rates
Effect Size (Cohen’s d)
Algebra I ECA Scale Scores 0.59*
Algebra I ECA Pass Rates a 0.56*
English 10 ECA Scale Scores 0.32*
English 10 ECA Pass Rates a 0.36*
Biology I ECA Scale Scores -0.07
Biology I ECA Pass Rates a 0.02
Note: Guideline 5-1-4F of the NCES Handbook on Statistical Standards deems Cohen d effect sizes of .2 as small, .5 as medium and .8 large. For correlations (r), 0.1 is small, 0.3 is medium and 0.5 is large (Seastrom 2002). a Pass rates were coded as 1=passing and 0=not passing.
*=p< .05, two-tailed
Attendance Rate and ECA Performance Multiple linear regression analysis was utilized to examine how attendance rate impacted 2010-11 ECA scores. A positive linear relationship was found between attendance rate and all three of the 2010-11 ECA scale scores, which was found to be statistically significant (Alg. I: t=5.52, p=0.00; Eng. 10: t=5.20, p=0.00; Bio. I: t=5.12, p=0.00). Attendance rate exerted a strong influence on these scores when controlling for the other variables listed (Alg. I: β=0.14; Eng. 10: β=0.15; Bio. I: β=0.14), showing that attendance rate was strongly associated with better ECA scores. Though statistically significant positive relationships were found between other variables14 and ECA scores, the effects were not as consistently strong as attendance rate.
14 As shown in Table B.6., tier, grade level, being female or white, non-Hispanic, eligibility for free or reduced price meals/milk, special education participation and English Language Learner status were all statistically significant predictors in some or all of Algebra I, English 10 and Biology I 2010-11 ECA scores. However, attendance rate was the strongest and most consistent predictor for a positive linear relationship between ECA scores and the variables listed.

57
Figure 2.10 gives a visual representation of this positive linear relationship, showing that as attendance rate increased, ECA scale scores increased as well.
Figure 2.10: Attendance Rate vs. 2010-11 ECA Scale Scores

58
When logistic regression analyses were performed to predict the likelihood of passing Algebra I, English 10 and Biology I ECA’s, attendance rate was found as a statistically significant impact in the likelihood of passing these assessments when all of the other variables were held constant, see Table 2.23. For every one point increase in attendance rate, the odds of a student passing these assessments increased by a factor of 1.08 (or 8%) for Algebra I, 1.05 (or 5%) for English 10 and 1.08 (or 8%) for Biology I, when all other variables listed in Table 2.23 are held constant.
Table 2.23: Odds of Passing 2010-11 ECA’s
Algebra I ECA English 10 ECA Biology I ECA
Odds Ratio Odds Ratio Odds Ratio
Tier 0.69* 0.82* 1.03
Grade Level 1.07 1.05 1.58*
Female a 0.93 1.76* 0.70*
Minority b 0.63* 0.70 0.54*
Eligible for Free or Reduced Price Meals/Milk
c
0.73* 0.48* 0.63*
Special Education Participant d 0.39* 0.18* 0.11*
English Language Learner e 1.34 0.58 0.89
Attendance Rate 1.08* 1.05* 1.08* a Female: 0=male; 1=Female
b Minority: 0=white, non-Hispanic 1=not white, non-Hispanic
c Free or Reduced Price Meals/Milk Status: 0=not reduced or free/reduced price meals; 1= free or reduced price meals/milks
d Special Education Participant: 0=not a special education participant; 1=special education participant
e English Language learner: 0=not an English Language learner; 1=English Language learner
*=p< .05, two-tailed
Suspensions and ECA Performance Multiple linear regression analysis was utilized to examine how the total number of suspensions notably impacted 2010-11 ECA scores. A negative linear relationship was found between the number of suspensions and all three of the 2010-11 ECA scale scores, which was found to be statistically significant (Alg. I: t=-6.13, p=0.00; Eng. 10: t=-5.48, p=0.00; Bio. I: t=-5.70, p=0.00). The total number of suspensions exerted a strong influence on these scores when controlling for the other variables listed (Alg. I: β=-0.15; Eng. 10: β=-0.15; Bio. I: β=-0.13), showing that the total number of suspensions was strongly associated with lower ECA scores. Though statistically significant relationships were found between other variables15 and ECA scores, the effects were not as consistently strong as the total number of suspensions, except for special education participation.
15 Being female or white, non-Hispanic, eligibility for free or reduced price meals/milk, special education participation, and English Language Learner status were all statistically significant predictors in some or all of Algebra I, English 10 and Biology I 2010-11 ECA scores. However, the total number of suspensions was the strongest and most consistent predictor for a negative linear relationship between ECA scores and the variables listed besides special education participation.

59
Figure 2.11 gives a visual representation of this negative linear relationship, showing that as the total number of suspensions increased, ECA scale scores decreased. Figure 2.11: Total Number of Suspensions vs. 2010-11 ECA Scale Scores

60
When logistic regression analyses were performed to predict the likelihood of passing Algebra I, English 10 and Biology I ECA’s, the total number of suspensions was found as a statistically significant impact in the likelihood of passing these assessments when all of the other variables were held constant. In other words, for every one suspension the student receives (both in-school and out-of-school), the odds of a student passing these assessments decreases by a factor of 0.65 for Algebra I, 0.74 for English 10 and 0.71 for Biology I, when all other variables listed in Table 2.24 are held constant.
Table 2.24: Odds of Passing 2010-11 ECA’s
Algebra I ECA English 10 ECA Biology I ECA
Odds Ratio Odds Ratio Odds Ratio
Tier 0.69* 0.81* 1.06
Grade Level 1.01 1.05 1.42*
Female a 0.87 1.69* 0.67*
Minority b 0.66* 0.74 0.57*
Eligible for Free or Reduced Price Meals/Milk
c
0.68* 0.48* 0.61*
Special Education Participant d 0.37* 0.18* 0.13*
English Language Learner e 1.15 0.54* 0.85
Total Number of Suspensions 0.65* 0.74* 0.71* Note: Cox and Snell R
2 :Algebra != 0.13; English 10=0.16 Biology I=0.12 B=slope; Exp(B)=odd ratio
a Female: 0=male; 1=Female
b Minority: 0=white, non-Hispanic 1=not white, non-Hispanic
c Free or Reduced Price Meals/Milk Status: 0=not reduced or free/reduced price meals; 1= free or reduced price meals/milks
d Special Education Participant: 0=not a special education participant; 1=special education participant
e English Language learner: 0=not an English Language learner; 1=English Language learner
*=p< .05, two-tailed
Student Engagement. The Student Engagement Protocol was utilized to study students from Tier 1, 2, 3 and 4 schools. A total of 2,452 observations were collected in three-minute intervals for 394 students, 199 of which were males and 195 of which were females. Students were rated as being engaged over three-quarters of the time (77.9%) and had the highest levels of engagement during Group Work (48.7%) and similar levels of engagement in Direct Instruction (25.9%) and Independent Practice (25.4%), as shown in Table 2.25.
Table 2.25: School Engagement Results by Pedagogical Practice and Gender; Tier 1, 2, 3 and 4 New Tech Schools
Percent of Time Engaged
Instructional Approach
Direct Instruction 25.9%
Group Work 48.7%
Independent Practice 25.4%
Gender
Female 51.1%
Male 48.9%
Total 77.9%

61
Graduation and College Readiness. Table 2.26 shows the graduation rates for the Tier 1, 2, 3, and 4 New Tech schools and scores from three assessments that measure college readiness: the PSAT, SAT and ACT. The number of senior students in New Tech high schools is low (n=218) since Indiana is relatively new to New Tech implementation so the graduation rate will be less stable than that of the statewide graduation rate, which is calculated from over 75,000 seniors. Graduation rates and college readiness information were not available for 2010-11 year at the time this report went to print. Thus, New Tech graduation rates and PSAT, SAT and ACT scores cannot be compared. However, the 92.7% graduation rate is higher than the statewide graduation rate for 2009-10, which was 84.5%.
Table 2.26: Graduation and College Readiness
All Tier 1-4 New Tech High Schools
New Tech Comparison Schools
Indiana Secondary School Population
Graduation
Number of Seniors 218 6,848 75,095
Graduation Rate 92.7% Not available until
Dec. 2011 Not available until
Dec. 2011
College Readiness
PSAT
Average Critical Reading Score 41 Not available Not available until
Dec. 2011 Number of students taking Critical Reading
442 Not available Not available until
Dec. 2011
Average Math Score 43 Not available Not available until
Dec. 2011
Number of students taking Math 442 Not available Not available until
Dec. 2011
Average Writing Skills Score 38 Not available Not available until
Dec. 2011 Number of students taking Writing Skills
440 Not available Not available until
Dec. 2011 SAT
Average Critical Reading Score 446 Not available Not available until
Dec. 2011 Number of students taking Critical Reading
136 Not available Not available until
Dec. 2011
Average Math Score 469 Not available Not available until
Dec. 2011
Number of students taking Math 136 Not available Not available until
Dec. 2011
Average Writing Skills Score 428 Not available Not available until
Dec. 2011 Number of students taking Writing Skills
136 Not available Not available until
Dec. 2011
Average Composite ACT Score 20 Not available Not available until
Dec. 2011
Number of Students taking ACT 53 Not available Not available until
Dec. 2011

62
Table 2.27 shows how many of the graduating seniors were minorities and/or eligible for free or reduced price meals/milk. Overall, a small portion of the seniors were from these underrepresented groups. Only 34 of the 202 graduating seniors (16.8%) were not white, non-Hispanic. Over one-third of graduates (38.6%, 78 out of 202) were eligible for free or reduced price meals. The number of graduating seniors who were both minorities (not white, non-Hispanic) and eligible for free or reduced price meals/milk was small, representing only 11.9% (24 of the 202 ).
Table 2.27: Graduates by Minority Status and Meal Status All Tier 1-4 New Tech High Schools
Number of Seniors Graduating 202
Percent of graduating seniors who are not white, non-Hispanic 16.8%
Percent of graduating seniors who are eligible for free or reduced price meals/milk
38.6%
Percent of seniors who are not white, non-Hispanic and are eligible for free or reduced prices meals/milk
11.9%
Attendance and Behavior Impacting Graduation When logistic regression analyses were performed to predict the likelihood of graduation, attendance rate was found as a statistically significant impact in the likelihood graduating when all of the other variables were held constant, see Table 2.28. For every one point increase in attendance rate, the odds of a senior graduating increased by a factor of 1.35 (or 35%) when all other variables listed in Table 2.28 are held constant.
Table 2.28: Odds of Graduating
Graduation from High School
Odds Ratio
Female a 0.48
Minority b 0.15*
Eligible for Free or Reduced Price Meals/Milk c 1.21
Special Education Participant d 0.25
English Language Learner e 0.00
Attendance Rate 1.35* a Female: 0=male; 1=Female
b Minority: 0=white, non-Hispanic 1=not white, non-Hispanic
c Free or Reduced Price Meals/Milk Status: 0=not reduced or free/reduced price meals; 1= free or reduced price meals/milks
d Special Education Participant: 0=not a special education participant; 1=special education participant

63
When logistic regression analyses were performed to predict the likelihood of graduation, the total number of suspensions was found as a statistically significant impact in the likelihood graduating when all of the other variables were held constant, see Table 2.29. For every one suspension that a senior received, the odds of that senior graduating decreased by a factor of 0.59 when all other variables listed in Table 2.29 are held constant.
Table 2.29: Odds of Graduating
Graduation from High School
Odds Ratio
Female a 0.45
Minority b 0.48
Eligible for Free or Reduced Price Meals/Milk c 0.58
Special Education Participant d 0.23*
English Language Learner e 0.00
Total Number of Suspensions 0.59* a Female: 0=male; 1=Female
b Minority: 0=white, non-Hispanic 1=not white, non-Hispanic
c Free or Reduced Price Meals/Milk Status: 0=not reduced or free/reduced price meals; 1= free or reduced price meals/milks
d Special Education Participant: 0=not a special education participant; 1=special education participant
e English Language learner: 0=not an English Language learner; 1=English Language learner
*=p< .05, two-tailed
Interaction between minority and free and reduced price meals/milk groups An Analysis of Covariance (ANCOVA) was run to test for statistically significant interactions between groups based on minority status (not white, non-Hispanic) and eligibility for free or reduced price meals/milk when controlling for tier. Only two statistically significant interactions were found. For 2009-10 Algebra I scale scores a significant interaction was found between minority status and free or reduced price meals/milk students, so that non minority (those who were white, non-Hispanic) students who were eligible for free or reduced price meals/milk had lower 2009-10 Algebra I ECA scores than their minority students were eligible for free or reduced price meals/milk when controlling for tier of the New Tech school (F=4.02, p=0.05). A similar interaction occurred between these groups in attendance rate, where students who were white, non-Hispanic and eligible for free or reduced price meals/milk lower attendance rates than other groups, when controlling for tier of the New Tech school. (F=13.69, p=0.00). Discussion From all of the student data results, New Tech students were performing better on ECAs than comparison schools. From the statistical analysis examining differences by tier, it seems that New Tech schools are experiencing academic success and improved student attendance and behavior as they progress from one academic year to the next. Tier 1 schools had high ECA scores and pass rates, as well as high attendance rates and low number of suspensions. These results provide evidence that the New Tech model is successful for these schools as they continue with this type of reform. Attendance and behavior were shown as important factors in how the students performed on ECAs and in their likelihood for graduation, thus emphasis should be placed on improving these for better student results.

64
From the Teacher leadership inventory, the many significant findings provide evidence that considerable patterns are emerging in teacher leadership at the New Tech schools. Those with more New Tech teaching experience reported a stronger perception of sharing leadership at their schools than teachers with fewer years of experience. Teachers from Whole School Conversions reported considerably lower levels of agreement in many of the teacher leadership scales than the other two types of New Tech school implementations. The most notable differences were found in the Sharing Leadership Scale and the Overall Teacher Leadership Scale, suggesting that teachers from Whole School Conversions did not perceive a great amount of shared leadership or teacher leadership overall compared to Autonomous Sites or Small Learning Communities. Interestingly, Tier 3 schools reported statistically significantly higher scores in teacher leadership than other New Tech schools in all of the scales. This finding provides evidence for the notion that teachers from these schools might sense a stronger sense of sharing their knowledge, sharing tasks, taking responsibility to improve their school and perceiving a sense of distributed leadership with their peers. Similarly, teachers from large or mid-size city and urban fringe schools reported higher levels of agreement than those in small or large town and rural schools in all of the scales. Like Tier 3 schools, respondents from large or mid-size city or urban fringe schools perceived a greater perception of sharing expertise, distributing tasks, volunteering extra time and effort to improve their school and perceiving a sense of shared leadership with those at their school. Further research is needed to understand specifically why teachers from Whole School Conversions perceive a much lower sense of teacher leadership at their schools compared to the other schools. Additional study is also needed to comprehend why teachers from Tier 3 schools and large or mid-size city and urban fringe schools responded at such high levels of agreement in all of the scales. This knowledge could give insight to how teachers at these schools are creating an environment of positive teacher leadership. From the student survey, New Tech students were reporting a high frequency of aspects related to Project Based Learning, such as using group projects and performing independent research almost daily and working in groups in their classes. Students also worked on projects frequently in some of the core content areas, such as English and Science.
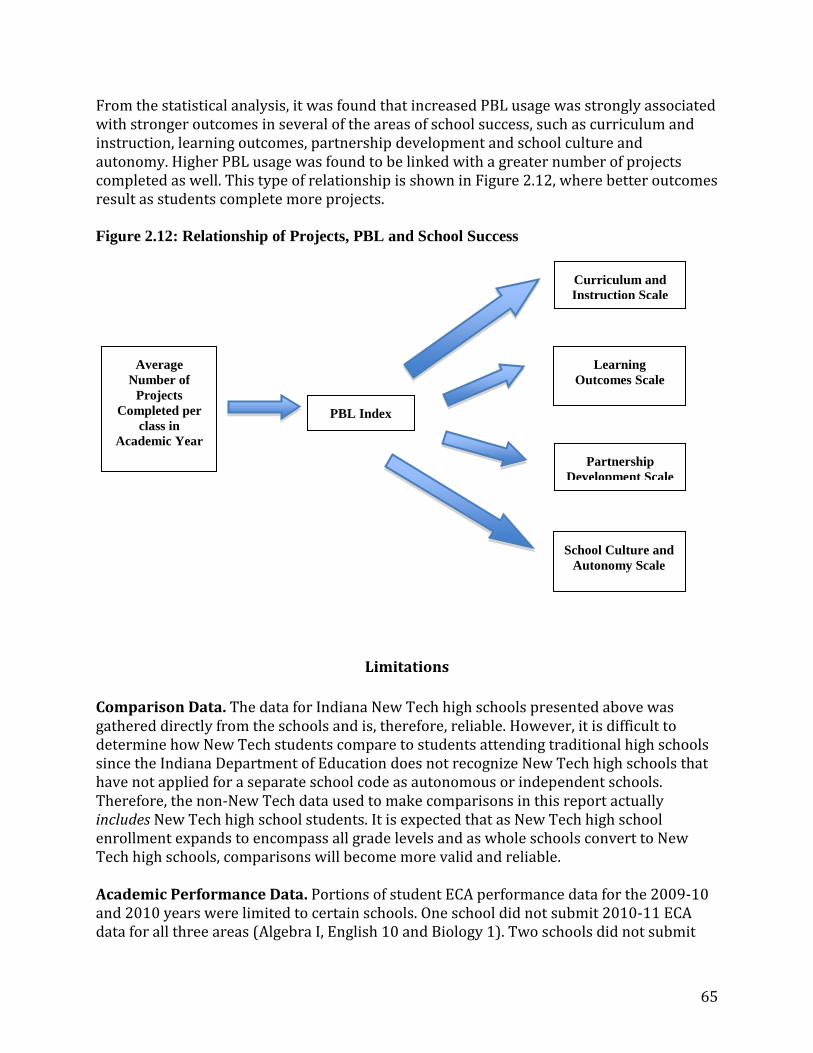
65
From the statistical analysis, it was found that increased PBL usage was strongly associated with stronger outcomes in several of the areas of school success, such as curriculum and instruction, learning outcomes, partnership development and school culture and autonomy. Higher PBL usage was found to be linked with a greater number of projects completed as well. This type of relationship is shown in Figure 2.12, where better outcomes result as students complete more projects. Figure 2.12: Relationship of Projects, PBL and School Success
Limitations
Comparison Data. The data for Indiana New Tech high schools presented above was gathered directly from the schools and is, therefore, reliable. However, it is difficult to determine how New Tech students compare to students attending traditional high schools since the Indiana Department of Education does not recognize New Tech high schools that have not applied for a separate school code as autonomous or independent schools. Therefore, the non-New Tech data used to make comparisons in this report actually includes New Tech high school students. It is expected that as New Tech high school enrollment expands to encompass all grade levels and as whole schools convert to New Tech high schools, comparisons will become more valid and reliable. Academic Performance Data. Portions of student ECA performance data for the 2009-10 and 2010 years were limited to certain schools. One school did not submit 2010-11 ECA data for all three areas (Algebra I, English 10 and Biology 1). Two schools did not submit
Curriculum and
Instruction Scale
Learning
Outcomes Scale
PBL Index
Average
Number of
Projects
Completed per
class in
Academic Year
Partnership
Development Scale
School Culture and
Autonomy Scale

66
2010-11 ECA scores for the Biology 1 assessment. For the 2009-10 school year, one school did not submit ECA data for any of the three tests, one school did not submit data for Algebra I or Biology I assessments and two schools did not submit ECA data for the Biology I assessment. Behavior Measures. Although there are multiple measures of student behavior, the data collected this year was limited to disciplinary actions, which represent only the negative side of student behavior. Many indicators of good behavior were observed during school visits and discussed during interviews and focus groups, such as community service work, peer mentoring, collaboration, engagement, excitement toward authentic projects, and integration of technology. However, these types of behaviors cannot be quantified and measured. Teacher Leadership Inventory: Though the response rate for the survey was satisfactory and all assumptions for the statistical tests regarding homogeneity and normality were met, some limitations are found. One major limitation of the study with the low reliability score of the Principal Selection Scale (Cronbach’s alpha= 0.251) As discussed earlier, the researchers we were keeping consistent with Angelle and Dehart’s (2010) Principal Selection Scale, who reported a lower reliability score as well (Cronbach’s alpha= 0.56) compared to the other teacher leadership scales. Another limitation involves the use of additional open-ended questions in the survey instrument. If these questions were included, the responses might have better explained the patterns found. To address this limitation, the researchers plan to enhance the survey for the following year so that respondents are given the opportunity to better explain teacher leadership at their school. Student Survey: Only students from four of the sixteen New Tech schools completed the
survey.
Implementation Timeframe. Indiana schools only have been implementing the New Tech high school model for four years. Fullan (200116) notes that moderately complex school reform initiatives take between three and five years to fully implement, while complex change takes five to ten years. With this in mind, “evaluations have limited value and can be misleading if they provide information on outcomes only,” (Fullan, p. 52) which is why the New Tech research study has continued to include qualitative data collection. Methods such as classroom observations, school visits, interviews, focus groups, and document review have provided evidence that directors and facilitators are implementing the New Tech model with fidelity and that students are benefitting from this model.
16 Fullan, M. (2001). The new meaning of educational change. (3rd ed.). New York: Teachers College Press.

67
Recommendations Based on the findings of the study, the research team recommends the following improvements to New Tech model implementation in Indiana: Curriculum and Instruction
Create subject- and project-specific rubrics. Continue professional development activities linked to creating rigorous content-
rich projects for all content areas. Offer more professional development in PBL implementation, particularly with
math and foreign language teachers, to ensure that all teachers implement with fidelity and refrain from just using traditional instruction.
Encourage teachers to develop a list of process-related and open-ended questions to promote critical-thinking and problem-solving skills.
Technology
Provide teachers and students with digital space to back up their work to avoid losing data if Echo crashes.
Consider alternative sanctions to revoking computer privileges since computers are necessary for students to complete their work in most classes. If this is impossible, develop a plan to notify teachers ahead of time that a student’s privileges have been revoked so they may plan modifications to the original assignment.
Continue encouraging students to explore and utilize technology, but not to the point that they cannot complete their work without it.
Monitor more closely privileges such as listening to music and using the Internet. Install software that monitors students’ technology use or restricts specific sites so
students refrain from misusing technology. Have students create tutorials on software commonly used in New Tech classrooms
to be shared with incoming students and teachers. Provide additional professional development in emerging software.
School Culture and Autonomy
Provide students with opportunities to demonstrate their trustworthiness to reinforce the “Trust, Respect, Responsibility” ethos.
Address student buy-in to the New Tech model. Some students seemed disillusioned with the “Trust, Respect, Responsibility” ethos.
Develop a mentoring program for new students and teachers. Collect feedback from current students and teachers on how best to integrate new students and teachers into the already established culture.
Professional Culture
Continue utilizing the “distributive” leadership style across New Tech high schools, as this seems to greatly empower and motivate all members of staff.
Offer professional development in time management strategies to help teachers cope with all the increased responsibilities of teaching in the New Tech model.

68
Provide teachers with the resources they need to fully incorporate technology and community partners into their classrooms (i.e., professional development, adequate prep time, etc.).
Provide teachers with opportunities to collaborate and share their voice in the direction of the school.
Ensure that co-teachers have a common planning period. Partnership Development
Further strengthen the relationship with parents by continuing to offer them opportunities to volunteer and participate at the school.
Continue working to develop an internship program for students. Survey community partners to determine their needs and create authentic projects
that meet them. Engage students in partnership development activities.
Academic Success and Learning Outcomes
Continue using student data to guide both school-wide and classroom-level decisions.
Ensure that teachers stress the self-directed learning aspect of the PBL model to balance scaffolding against accountability.
Ensure Advanced Placement (AP) and honors classes are offered in the New Tech community so that students can meet the requirements of the Indiana Academic Honors Diploma.