indiana harbor and canal (ihc) dredging and disposal ... and disposal alternatives analysis...
TRANSCRIPT

October 2004
US Army Corps of Engineers Engineer Research and Development Center Indiana Harbor and Canal (IHC) Dredging and Disposal Alternatives Analysis
Mechanical Dredging Comparative Analysis
by Trudy J. Estes, Paul R. Schroeder, Dave Druzbicki, David C.
Scharre, and Rich Gallas
WES Prepared for US Army Engineer District, Chicago Chicago, IL
ii
Contents Acronyms ........................................................................................................................... v Preface .............................................................................................................................. vi 1 - Project Background ...................................................................................................... 1 2 - Introduction .................................................................................................................. 5 3 - Screening Analysis for Ponded Water .......................................................................... 8
Option 1 – Mechanical Offloading of Mechanically Dredged Sediments.............. 8 Option 2 – Hydraulic Offloading of Mechanically Dredged Sediments without Recycle ................................................................................................. 8 Option 3 – Hydraulic Offloading of Mechanically Dredged Sediments with Recycle....................................................................................................... 9 4 - CDF Designs and Operation and Management Plans for Three Placement Options .................................................................................... 39 5 - Volatilization and Particulate Emission Rates............................................................. 45
Volatile Emissions ................................................................................................ 45 Particulate Emissions ............................................................................................ 54 6 - Comparison of Chicago and East Chicago Climate Data ........................................... 55 7 - Cost Estimates ............................................................................................................ 58
Major Cost Items................................................................................................... 59 Operation and Maintenance Costs ........................................................................ 60 Option 3 Wastewater Treatment Cost Estimate.................................................... 61 Present Worth Analysis......................................................................................... 65 8 - Summary ..................................................................................................................... 67 References ........................................................................................................................ 69

iii
List of Tables Table 1. Material Placement Schedule ....................................................................... 10
Table 2. Cell Areas for 32.5 ft Dike Height ................................................................ 12
Table 3. Annual Dredging and Water Production Volumes ....................................... 16
Table 4. Number of Exchanges of Pond Volume During Recycle, 2.8 ft Ponding Depth ..................................................................................... 18
Table 5. Bulk Sediment and Water Concentrations ................................................... 23
Table 6. Predicted Final Pond Concentrations (Disposal in Multiple Cells) ............. 27
Table 7. Predicted Final Pond Concentrations (Disposal in Single Cell) .................... 31
Table 8. Ponded Water Concentrations ...................................................................... 35
Table 9. Average Dredged Material Storage Requirements ...................................... 42
Table 10. Pump Flow Rates and Pumping Duration ................................................... 42
Table 11. Estimated Dike Lengths for All Placement Options ..................................... 43
Table 12. CDF Configuration Design Assumptions for Options 1, 2 and 3.................. 43
Table 13. Ratios of Total Volatile Losses (Sum of All Locales) as Compared to Placement Option 1 w/o Groundwater Storage ............................................ 47
Table 14. Volatilization of Individual Compounds as a Percent of Total Volatile Organic Losses for the Placement Option ..................................................... 50
Table 15. Relative Magnitude of Volatile Emissions by Major Contributors (All Placement Options) ............................................................................... 53
Table 16. Relative Volatile Losses by Source Component............................................ 53
Table 17. Additional Comparisons of Emissions ......................................................... 53
Table 18. Normal Precipitation Values (Inches) ........................................................... 55
Table 19. General Design Criteria for Flow from CDF to WWTP ............................. 62
Table 20. Cost Estimating Criteria for O&M Costs for the WWTP ............................. 64
Table 21. Present Value Comparison with Contingency............................................... 66

iv
List of Figures Figure 1. Indiana Harbor and Canal ............................................................................... 2 Figure 2. Overall design process..................................................................................... 4 Figure 3. Conceptual schematic of hydraulic offloading and recirculation .................... 6 Figure 4. CDF configuration for Alternative 1 Mechanical Dredging.......................... 11 Figure 5. Water balance during pond formation ........................................................... 13 Figure 6. Water balance after pond formation ............................................................. 14 Figure 7. Single cell disposal during ponding .............................................................. 19 Figure 8. Single cell disposal after ponding ................................................................. 20 Figure 9. Multiple cell disposal, ponding of first cell ................................................... 20 Figure 10. Multiple cell disposal, after ponding in first cell ........................................... 21 Figure 11. Multiple cell disposal, ponding of second cell ............................................ 21 Figure 12. Multiple cell disposal, after ponding of second cell .................................... 22 Figure 13. Approximate CDF configuration for all placement options ......................... 39 Figure 14. Cell 1 surface elevations from consolidation analysis................................... 40 Figure 15. Cell 2 surface elevations from consolidation analysis................................... 40 Figure 16. Cell 3 surface elevations from consolidation analysis................................... 41 Figure 17. TSCA cell surface elevations from consolidation analysis ........................... 41 Figure 18. Average normal precipitation (inches) reported for regional weather stations................................................................................ 56

v
Acronyms AACEI - Association for the Advancement of Cost Engineering International BTEX - Benzene, Toluene, Ethylbenzene, Xylene CDF - Confined Disposal Facility DDAA - Dredging and Disposal Alternatives Analysis DDR - Design Documentation Report FTTER - Final Treatment Technology Evaluation Report HELP - Hydrologic Evaluation of Landfill Performance IHC - Indiana Harbor and Canal MWH - Montgomery Watson Harza O&M - Operation & Maintenance OM&M - Operation, Monitoring & Maintenance TOC - Total Organic Carbon TSCA - Toxic Substances Control Act TSS - Total Suspended Solids WES - Waterways Experiment Station WWTP - Wastewater Treatment Plant

vi
Preface This report describes a follow on study to the alternatives analysis completed previously (Estes et al. 2003), in which three mechanical and hydraulic dredging alternatives for the operation of the Indiana Harbor and Canal Confined Disposal Facility (CDF) were evaluated. The purpose of this study is to further evaluate mechanical dredging offloading alternatives, including: mechanical dredging with mechanical offloading, mechanical dredging with hydraulic offloading, and mechanical dredging with recycle of effluent for hydraulic offloading operations. Issues to be addressed include: 1) contaminant concentrations in effluent and relative volatilization and particulate emission rates between the alternatives, 2) required CDF design and operation modifications for hydraulic offloading, 3) re-evaluation of area climatological data, and 4) relative life cycle cost of the three offloading alternatives for mechanical dredging. The Environmental Laboratory (EL) of the U.S. Army Engineer Research and Development Center (ERDC) at the Waterways Experiment Station (WES) conducted this work. The U.S. Army Corps of Engineers (USACE) Chicago District funded ERDC under Project Order W81G6623056283. The project manager was Ms. Shannon R. Rose of USACE Chicago District. This report was written by Ms. Trudy J. Estes and Dr. Paul R. Schroeder, Environmental Engineering Branch (EEB), Environmental Processes and Engineering Division (EPED), EL, and Mr. Dave Druzbicki, Cost Engineering and Specifications Section, Technical Services Division, Chicago District. The WWTP cost estimates were prepared by Mr. David C. Scharre and Mr. Rich Gallas of Montgomery Watson Harza. Technical reviewers were Dr. Tommy E. Myers, EEB, and Ms. Cynthia L. Price, Environmental Processes Branch, EPED. Technical editing was performed by Ms. Cheryl M. Lloyd, EEB. Internal reviewers for USACE, Chicago District were Mr. John Breslin, Mr. Jay Semmler, Ms. Le Thai, Mr. Jay Tanaka, and Ms. Brigid Briskin. Independent Technical Review (ITR) members were Mr. Thomas Kenna, Mr. Paul Polanski, and Mr. Kevin McAuley, USACE, Buffalo District and Mr. S. Edward Mead, USACE, Omaha District. This study was conducted under the direct supervision of Dr. Richard E. Price, Chief, EPED, and under the general supervision of Dr. Edwin A. Theriot, Director, EL. Dr. James R. Houston was Director, ERDC, and Col. James R. Rowan, EN, was Commander. This report should be cited as follows: Estes, T.J., Schroeder, P.R., Druzbicki, D., Sharre, D.C., and Gallas, R. 2004. "Indiana Harbor and Canal (IHC) Dredging and Disposal Alternatives Analysis: Mechanical Dredging Comparative Analysis," ERDC/EL Special Report-04-xx, U.S. Army Engineer Research and Development Center, Vicksburg, MS.

1
1 - Project Background
Indiana Harbor and Canal (IHC) is an authorized Federal navigation project located in East Chicago, Indiana (Figure 1). Project features include breakwaters at the harbor entrance and a deep-draft navigation channel (USACE, Chicago 1999). Channel depth ranges from 22 to 29 feet. Sediments in the IHC are contaminated and have been determined to be unsuitable for open water disposal, unconfined upland disposal or beneficial use. Dredging of the IHC has been deferred since 1972 while a technically and economically feasible and environmentally acceptable management plan was developed. As a result of studies undertaken by the US Army Corps of Engineers Chicago District to address disposal issues, dredging is to be undertaken throughout the IHC Federal navigation project to authorized project depths and widths. Dredging will also be completed in the appropriate berthing areas outside of the authorized channel limits at non-Federal expense to provide depths commensurate with those in the Federal channel.
The results of environmental studies and technical evaluations conducted in the course of developing a management plan for Indiana Harbor sediments are summarized in the Comprehensive Management Plan (CMP) (USACE, Chicago 1999), the Design Documentation Report (DDR) (USACE, Chicago 2000), the Disposal Alternatives for PCB-Contaminated Sediments from Indiana Harbor, Indiana (Environmental Laboratory 1987a and 1987b), and the Indiana Harbor and Canal (IHC) Dredging and Disposal Alternatives Analysis (DDAA) (Estes et al 2003). Design parameters and assumptions used in the present study were largely obtained from these documents, with modifications to reflect current study objectives.
The CMP is a two-volume report: Volume 1 – Final Feasibility Report and
Environmental Impact Statement and Volume 2 – Technical Appendices. The CMP provides general project background, a description of plan formulation over several phases, the selected plan, and aspects of plan implementation, including discussion of disposal sites that were considered for the project. Three dredging plans were evaluated in the CMP (USACE, Chicago 1999). The first plan consisted of dredging the harbor and canal to authorized depths from the entrance in Lake Michigan to the E.J.E. Railroad Bridge (Reaches 1 through 5), plus the PCB hotspot along the north bank of Reach 6. This plan was identified as Alternative 1 - Partial Federal Channel Dredging. The second plan consisted of dredging the entire Federal navigation project to authorized depths from the entrance to the upstream project limits on the Lake George and Calumet River Branches (Reaches 1 through 13). This plan was identified as Alternative 2 - Complete Federal Channel Dredging. The third plan included the complete Federal channel dredging of Alternative 2, plus additional dredging provided for in a 1993 Consent Decree between the U.S. EPA and the Inland Steel Company. This plan was identified as

2
Figu
re 1
. In
dian
a H
arbo
r and
Can
al

3
Alternative 3 - Cooperative Dredging Program. All three plans include dredging in appropriate non-Federal dock/berthing areas to provide depths commensurate with the adjacent Federal channel depths. The selected plan in the CMP is the Cooperative Dredging Plan. The DDR documents a design prepared for the selected plan from the CMP. The supporting technical analysis for hydrology and hydraulics, environmental engineering, geotechnical, structural, mechanical, and civil design along with a detailed cost estimate are presented in the ten appendices to the DDR. Based on previous examination of dredging technologies conducted during formulation of the CMP, it was determined that dredging would be conducted using a mechanical dredge, specifically a closed-bucket clamshell dredge. In the DDR, a projected dredging rate was established based on documented sediment depths and projected accumulation over a period of 30 years, and a design was developed for the selected disposal site.
The DDAA summarizes subsequent efforts undertaken to re-evaluate the use of hydraulic dredging and disposal for this project, in order to expedite backlog dredging and minimize contaminant releases to the environment. The primary objective of the study was to perform a comparative, planning-level evaluation of a limited number of dredging and placement alternatives for the operation of the Indiana Harbor and Canal Confined Disposal Facility (CDF). Specific objectives of the study included evaluation of the compatibility of hydraulic dredging and placement with the CDF design developed for mechanical dredging and documented in the Design Documentation Report (DDR) (USACE, Chicago 2000), feasibility of expediting backlog dredging using hydraulic dredging rather than mechanical dredging, relative air emissions (volatile and particulate) from the CDF and overall life cycle cost of hydraulic dredging versus mechanical dredging. The overall design process encompassed in previous and present efforts is reproduced in Figure 2.

4
Figure 2. Overall design process

5
2 - Introduction Based on the evaluations presented in the DDAA (Estes et al. 2003) and previous studies, mechanical dredging has been identified as the preferred dredging method for Indiana Harbor. In the alternatives analysis (Estes et al. 2003), mechanical dredging and disposal was found to be the least costly alternative. Wastewater volumes and dike height requirements were less than for the hydraulic dredging alternatives considered. However, hydraulic offloading of mechanically dredged sediments is still being considered because of operational concerns regarding barge access, trafficability of the previously placed dredged material, spreading of dredged material in the confined disposal facility (CDF), truck access, potential for increased loss of fugitive dust and worker safety. In order to minimize wastewater volume, recirculation of effluent and runoff for offloading of sediments may be desirable. Contaminant concentrations in the recirculated effluent and runoff would be expected to be elevated over those resulting from conventional mechanical or hydraulic dredging and disposal, potentially impacting wastewater treatment costs and volatilization rates. A planning level comparative analysis was therefore conducted for three placement options:
• Mechanical dredging with mechanical offloading (Alternative 1, Option 1) • Mechanical dredging with hydraulic offloading (Alternative 1, Option 2) • Mechanical dredging with hydraulic offloading and recirculation
(Alternative 1, Option 3)
A conceptual schematic of hydraulic offloading including recirculation of ponded water is shown in Figure 3.
Elements of the comparative analysis included:
• Effluent volumes and contaminant concentrations • Storage and dike height requirements • Volatilization and particulate emission rates • Cost
The sediment data used for the analysis reported in the DDAA was obtained from a sediment sampling effort conducted in 1986. Pore water and groundwater concentrations used in that analysis were taken from data reported in several independent studies conducted over a period of years. Effluent concentrations predicted from the 1986 sediment data and selected pore water values were also normalized using the results of historical elutriate data. The 1986 sediment data does not contain information regarding BTEX compounds and a number of other organics, which are of particular concern with respect to volatilization. Additionally, groundwater concentrations used in the DDAA

6
Figure 3. Conceptual schematic of hydraulic offloading and recirculation appear to be higher than would be realistically anticipated over the long term, assuming free product under the disposal site is removed during initial drawdown of the groundwater prior to any dredging taking place. Therefore, for the analyses reported in this study, the sediment data was modified to incorporate compounds not included in the 1986 sediment data but for which data is available in EPA records. Additionally, groundwater concentrations from relatively recent Corps sampling efforts were used in these analyses to be more representative of expected conditions. The new groundwater data set is a consolidation of data obtained from sampling efforts conducted in 1990, 1991, 1992, 1995, 1998 and 2003. The data was collected by the Corps or A/E consultants working for the Corps, including ERM, E&E, and MWH. Effluent, runoff, and expelled pore water concentrations (ponded water in the disposal cells and equalization basin) were calculated for all three placement options from the revised data sets, in order to provide an equivalent basis for comparison. Therefore, the reported values for the various discharge streams are somewhat different from values given in the DDAA. Additionally, differences in climatic data from O’Hare airport, used to generate the synthetic data used in the alternatives analysis (Estes et al. 2003), and the proposed

7
disposal site in East Chicago, Indiana, could be important to the design of the pumps, equalization basin and wastewater treatment plant. More recent climate data from O’Hare airport and weather stations closer to the disposal site were compared with the data used in the DDAA, and possible impacts on storm water volumes were assessed.

8
3 - Screening Analysis for Ponded Water Option 1 - Mechanical Offloading of Mechanically Dredged Sediments This option considers the relative flows and contaminant concentrations for mechanical offloading of mechanically dredged sediments and was designated as Alternative 1 in the alternatives analysis (Estes et al. 2003). Based on the cost analysis for this alternative reported in the alternatives analysis, wastewater treatment costs were governed primarily by design flow rate, annual wastewater volume, and effluent TOC and ammonia concentrations. Annualized treatment volumes, flow rates and TOC and ammonia concentrations, which were the basis of the WWTP cost estimate, were given in Table D5 of the alternatives analysis. In order to minimize operating costs, flow rates, TOC and ammonia concentrations have been modified to reflect seasonal operation of the WWTP, with runoff and consolidation flows collected during non-dredging periods to be treated in the four-month period during and/or following dredging each year. Treatment volumes, flow rates and TOC and ammonia concentrations reflecting the seasonal operating assumption are summarized for Option 1 in Table 20 in the costing section of this report. Option 2 - Hydraulic Offloading of Mechanically Dredged Sediments without Recycle This option considers the relative flows and effluent contaminant concentrations for hydraulic offloading of mechanically dredged sediments to an upland confined disposal facility. Water used to offload sediments would be pumped from the water body (Indiana Harbor canal) adjacent to the offloading barge. Effluent from the CDF would be pumped directly to the wastewater treatment plant without recycle. Total effluent and runoff volumes for these waste streams would be the same as those given for Alternative 2 hydraulic dredging and disposal in the alternatives analysis (Estes et al. 2003). However, the duration of dredging, and the flow rates, would be different from Alternative 2, being constrained to correspond to the daily mechanical dredging rate. (In the DDAA, the annual dredging volume for Alternatives 1 and 2 was the same, but the rate of dredging was greater for hydraulic dredging than for mechanical dredging, resulting in a shorter dredging duration each year. Because material cannot be offloaded faster than it is dredged, the rate of hydraulic offloading of mechanically dredged sediments will be controlled by the rate of dredging.) As for Option 1, modifications were made to reflect seasonal WWTP operation. The average flow rate for wastewater

9
treatment was estimated based on the treatment flow rate during the dredging season for Alternative 2 in the DDAA, but adjusted by the ratio of dredge production rates for mechanical dredging and hydraulic dredging. Runoff occurring in the summer non-dredging and winter non-dredging seasons would be stored in the equalization basin and treated each year in the month before dredging is initiated. Treatment volumes, flow rates and TOC and ammonia concentrations reflecting the seasonal operating assumption are summarized for Option 2 in Table 20 in the costing section of this report. Option 3 - Hydraulic Offloading of Mechanically Dredged Sediments with Recycle This option considers the relative flows and effluent contaminant concentrations for hydraulic offloading of mechanically dredged sediments to an upland confined disposal facility, with runoff stored in the CDF throughout the non-dredging seasons used for offloading in place of canal water. Once a pond of a specified depth has been formed in the disposal cell, ponded water will be recycled for offloading in order to minimize wastewater volumes. Some canal water could be used as make-up water if necessary to compensate for losses due to bulking of the material during placement. For purposes of this analysis, it was assumed that sufficient runoff water would be available. This should be a worst-case assumption for water quality and volatile losses, as the runoff will have contacted the sediments once and would be expected to have higher contaminant concentrations than the canal water. The recycled water and any remaining stored runoff would be treated over a four-month interval at the end of the dredging period. The WWTP would then be shut down for the remainder of the year. In order to estimate the volume of water required for resuspending sediment and the number of times it would be recycled, assumptions regarding production rate and CDF configuration are required. Production Rate
The analysis is based on a mechanical dredging production rate of 250 in situ cy/hr
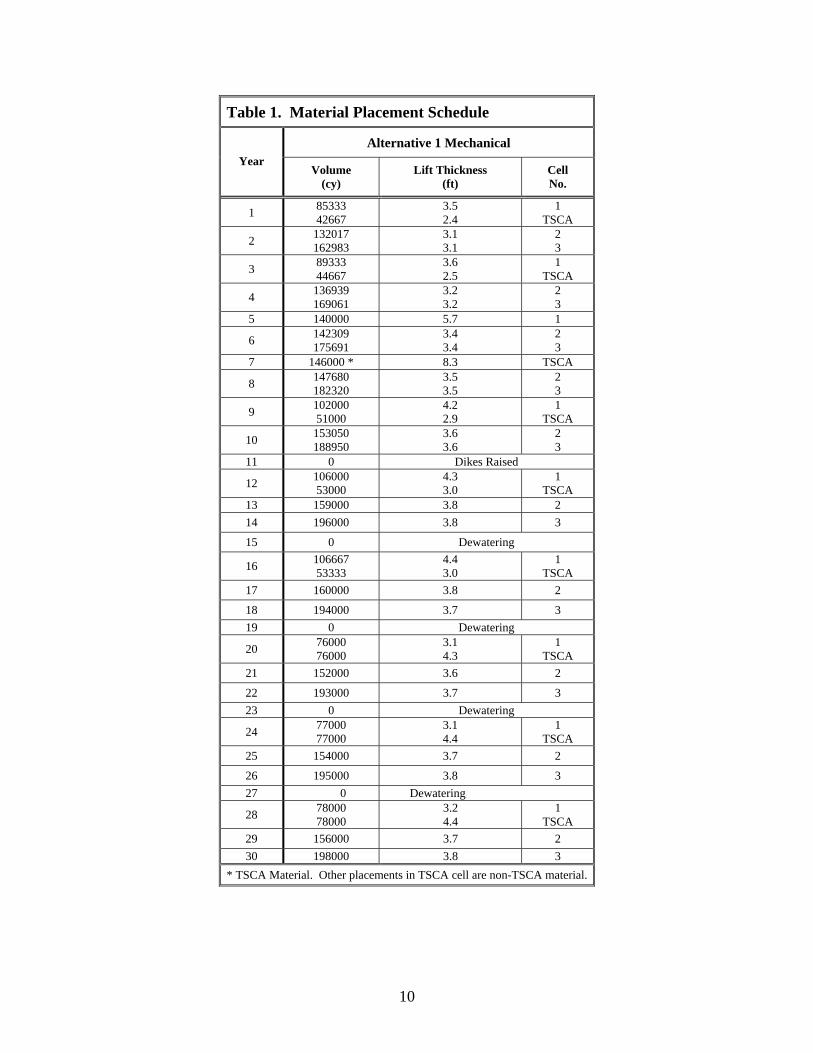
operating 16 hours/day for 6 days/week, as specified in the alternatives analysis (Estes et al. 2003) for Alternative 1 Mechanical Dredging. Annual dredging volumes for this alternative are reproduced here in Table 1.
CDF Configuration
The CDF configuration specified for Alternative 1 Mechanical Dredging in the DDAA was utilized for this option (Figure 4) instead of the configuration for Alternative 2 Hydraulic Dredging because Alternative 1 provided a larger equalization basin. The larger equalization basin was required in order to manage storm flows, given that the WWTP capacity required for the mechanical dredging alternative was much smaller than for the hydraulic dredging alternatives. A large equalization basin will also be necessary for this alternative (hydraulic offloading of mechanically dredged sediments), in order to provide storage capacity for annual runoff flows.
10
Table 1. Material Placement Schedule
Alternative 1 Mechanical Year
Volume (cy)
Lift Thickness (ft)
Cell No.
1 85333 42667
3.5 2.4
1 TSCA
2 132017 162983
3.1 3.1
2 3
3 89333 44667
3.6 2.5
1 TSCA
4 136939 169061
3.2 3.2
2 3
5 140000 5.7 1
6 142309 175691
3.4 3.4
2 3
7 146000 * 8.3 TSCA
8 147680 182320
3.5 3.5
2 3
9 102000 51000
4.2 2.9
1 TSCA
10 153050 188950
3.6 3.6
2 3
11 0 Dikes Raised
12 106000 53000
4.3 3.0
1 TSCA
13 159000 3.8 2 14 196000 3.8 3
15 0 Dewatering
16 106667 53333
4.4 3.0
1 TSCA
17 160000 3.8 2
18 194000 3.7 3 19 0 Dewatering
20 76000 76000
3.1 4.3
1 TSCA
21 152000 3.6 2
22 193000 3.7 3 23 0 Dewatering
24 77000 77000
3.1 4.4
1 TSCA
25 154000 3.7 2
26 195000 3.8 3 27 0 Dewatering
28 78000 78000
3.2 4.4
1 TSCA
29 156000 3.7 2 30 198000 3.8 3
* TSCA Material. Other placements in TSCA cell are non-TSCA material.

11
Figure 4. CDF configuration for Alternative 1 Mechanical Dredging (from DDAA)
The mechanical dredging alternative specified a CDF with 3 primary storage cells, a fourth cell for placement of TSCA material, and an equalization basin with relative areas as summarized in Table 2. Dike heights as specified for Alternative 2 (32.5 ft) were assumed for estimating pond volumes (this was later revised to 34 ft based upon the outcome of the consolidation analysis). A ponding depth of 4 ft was initially assumed, as previously specified in the alternatives analysis, to achieve adequate suspended solids removal prior to treatment of the wastewater. Alternative ponding depths were also evaluated, and a 2.8 ft ponding depth was found to be feasible for the average annual runoff volumes available for offloading. Additional suspended solids removal can be achieved with this ponding depth by allowing a quiescent period in the disposal cell(s) following completion of dredging, prior to pumping the wastewater to the WWTP.
Water Balance for Hydraulic Offloading
There are several terms used in describing the operation of the system that are frequently a source of confusion. They are defined here to facilitate understanding of the water balance and subsequent discussions. For the purposes of the water balance, make- up water is water introduced to the system (defined here as the disposal cell, the

12
Table 2. Cell Areas for 32.5 ft Dike Height (from DDAA) Cell Area (acres) 1 16.1 2 28.6 3 35.1 TSCA 12 Equalization 10
offloading barge and all interconnecting piping between the two) to satisfy volume demand. Make-up water is used to provide the adequate carrier water to slurry the sediment for offloading, providing the water to generate the needed ponded water in the disposal cell and supplementing the recycled water to compensate for storage losses after the pond is established. Depending upon the need, make-up water flows may be large (as at dredging startup, when the make-up water is the principal source being used to slurry the material), or relatively small (as when recycle water is available to slurry the material and make-up water is only required to offset system losses). Make-up water may be obtained from any available sources external to the system, such as the equalization basin or the canal. Recycled water is water obtained from the disposal cell (internal to the system) after a pond has formed. In this case, its sole use would be to slurry the material for offloading. Carrier water is another term used to describe water used to slurry the sediment, without specifying anything about the source of the carrier water (internal or external to the system). Both make-up water and recycled water would be considered carrier water if used for this purpose. The quality of carrier water is important in the evaluation of expected contaminant concentrations in the ponded water because it contributes to the total concentration of contaminants in the slurry. This is discussed further under the section on partitioning analysis.
The hydraulic offloading rate was estimated using the ADDAMS SETTLE program (Hayes and Schroeder 1992) for the same input parameters as the hydraulic dredging alternatives from the alternatives analysis (based on the in situ sediment properties from the 1986 analysis), at a production rate equivalent to the mechanical dredging rate (250 cy in situ/hr). This corresponds to an influent discharge flow rate of 8.85 cfs including solids, at 170 g/L suspended solids concentration. During the initial stages of offloading while a pond is forming over the surface of the disposal cell in the CDF (before recycle begins), the influent water is composed of 1.32 cfs pore water and 6.97 cfs make-up water from the equalization basin (Figure 5). A portion of the influent water is lost to storage due to material bulking during processing. A median bulking factor of 1.50 was estimated using the SETTLE program, giving a water loss rate to storage of approximately 2.23 cfs and an accumulation (pond formation) rate of 6.06 cfs. (Water balance figures reflect only flows produced by the active dredging operation. Flows resulting from precipitation are not reflected, but are considered in the volume of water assumed to be stored in the equalization basin and available for offloading. Annual dredging and water production volumes given in Table 3 reflect long-term operating

13
conditions of the CDF, after initial drawdown of groundwater and placement of the first layers of material in all cells, when infiltration of rainwater or carrier water to the groundwater would be minimal.)
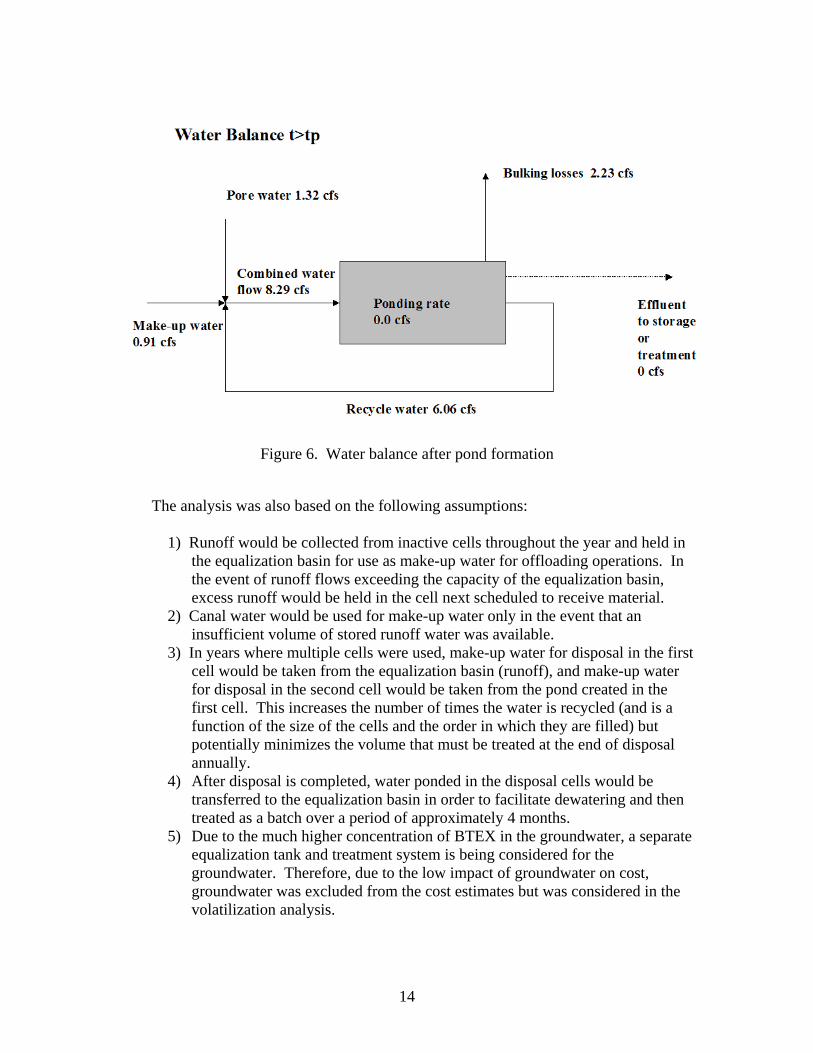
After a pond of the desired depth is formed (t = tp), recycle can begin. From this
point forward (t > tp), a combination of 0.91 cfs make-up water (stored water or canal water) and 6.06 cfs recycle water are required to slurry the material and to maintain the pond at the specified depth. The combined water flow (inflow to the CDF) is fixed by the assumed operating parameters for the dredge (8.29 cfs water discharge rate). The amount of that water contributed from the pore water of the sediment is assumed to be constant (1.32 cfs), as are the losses to bulking (2.23 cfs). (Bulking of newly placed material varies from year to year as a function of the duration of dredging. The mean bulking factor was used to obtain the bulking losses for the conceptual water balance figures. Actual bulking factors were used for the annualized flow calculations given in Table 3.) The combined water flow minus bulking losses gives the available recycle flow rate (6.06 cfs, the same as the pond accumulation rate during pond formation). The make-up water requirement is then determined by difference: 8.29 cfs – 6.06 cfs – 1.32 cfs = 0.91 cfs (Figure 6).
Figure 5. Water balance during pond formation
14
Figure 6. Water balance after pond formation
The analysis was also based on the following assumptions: 1) Runoff would be collected from inactive cells throughout the year and held in
the equalization basin for use as make-up water for offloading operations. In the event of runoff flows exceeding the capacity of the equalization basin, excess runoff would be held in the cell next scheduled to receive material.
2) Canal water would be used for make-up water only in the event that an insufficient volume of stored runoff water was available.
3) In years where multiple cells were used, make-up water for disposal in the first cell would be taken from the equalization basin (runoff), and make-up water for disposal in the second cell would be taken from the pond created in the first cell. This increases the number of times the water is recycled (and is a function of the size of the cells and the order in which they are filled) but potentially minimizes the volume that must be treated at the end of disposal annually.
4) After disposal is completed, water ponded in the disposal cells would be transferred to the equalization basin in order to facilitate dewatering and then treated as a batch over a period of approximately 4 months.
5) Due to the much higher concentration of BTEX in the groundwater, a separate equalization tank and treatment system is being considered for the groundwater. Therefore, due to the low impact of groundwater on cost, groundwater was excluded from the cost estimates but was considered in the volatilization analysis.

15
Based on the water volume reported in Table D5 of the Alternatives Analysis (winter non-dredging period for Alternative 2) and the median projected bulking of the material (to account for losses of water to bulking), the maximum average pond depth that could be formed in a 30-acre cell using stored runoff water is approximately 2.8 feet. This is the depth of ponding that was assumed for this analysis. The annual dredging, pond and make-up water volumes (for t>tp) are summarized in Table 3. Derivation of these volumes is explained below. The number of times the water would be recycled for these relative volumes is summarized by year in Table 4.
Volume pond (Vp) = Average area at ½ ponding depth * ponding depth (acre*ft)
Dredging duration (D) = Vin situ / ”active” dredging rate (days)
Total volume recycle (Vr) = Qr (D - tp) x (gal)
Volume make-up water (Vmu) = Qb (D - tp) x (gal)
Where: Qr = recycle flow rate, cfs Qb = storage loss rate, cfs tp = ponding time, as previously defined, days x = units conversion factor
From these quantities can also be determined:
Total annual system water input requirements (VT = Vp + Vmu)
Number of times water is recycled (N = Vr/Vp)

16
Tab
le 3
. A
nnua
l Dre
dgin
g an
d W
ater
Pro
duct
ion
Vol
umes
Yea
r V
olum
e (c
y)
Cel
l N
o.
Are
a @
1/2
St
orag
e D
epth
(a
cres
)
Pond
ing
Dep
th
(ft)
Pond
V
olum
e (a
cre*
ft)
Tim
e of
po
ndin
g (t
p)
(day
s)
Tot
al
(Act
ive)
D
redg
ing
Dur
atio
n (D
) (d
ays)
Vol
ume
Pond
(V
p)
(gal
)
Tot
al R
ecyc
le
Vol
ume
(Vr)
(g
al)
Tot
al
Vol
ume
Mak
eup
Wat
er
(Vm
u)
(gal
)
Tot
al A
nnua
l Sy
stem
Wat
er
Inpu
t R
equi
rem
ents
(V
T)
(gal
)
8533
3 1
16.1
2.
76
48.9
6.
3 21
.3
15,9
17,8
88
38,1
46,6
94
6,91
1,07
6 22
,828
,964
1
4266
7 TS
CA
12
2.
76
36.4
4.
7 10
.6
11,8
64,2
64
15,1
68,3
43
2,74
8,06
5 14
,612
,329
16
2983
3
34.1
2.
76
103.
5 13
.3
40.6
33
,714
,285
69
,547
,147
12
,599
,929
46
,314
,214
2
1320
17
2 27
.6
2.76
83
.8
10.7
32
.9
27,2
87,8
08
56,3
54,4
39
10,2
09,7
92
37,4
97,6
01
8933
3 1
16.1
2.
76
48.9
6.
3 22
.3
15,9
17,8
88
40,6
80,9
81
7,37
0,21
6 23
,288
,104
3
4466
7 TS
CA
12
2.
76
36.4
4.
7 11
.1
11,8
64,2
64
16,4
35,4
87
2,97
7,63
4 14
,841
,899
16
9061
3
34.1
2.
76
103.
5 13
.3
42.2
33
,714
,285
73
,397
,996
13
,297
,591
47
,011
,876
4
1369
39
2 27
.6
2.76
83
.8
10.7
34
.1
27,2
87,8
08
59,4
72,8
80
10,7
74,7
64
38,0
62,5
71
5 14
0000
1
16.1
2.
76
48.9
6.
3 34
.9
15,9
17,8
88
72,7
82,1
63
13,1
86,0
20
29,1
03,9
08
1756
91
3 34
.1
2.76
10
3.5
13.3
43
.8
33,7
14,2
85
77,5
98,5
77
14,0
58,6
15
47,7
72,9
00
6 14
2309
2
27.6
2.
76
83.8
10
.7
35.5
27
,287
,808
62
,875
,160
11
,391
,158
38
,678
,966
7
1460
00 T
SCA
12
2.
76
36.4
4.
7 36
.4
11,8
64,2
64
80,6
37,2
18
14,6
09,1
29
26,4
73,3
93
1823
20
3 34
.1
2.76
10
3.5
13.3
45
.5
33,7
14,2
85
81,7
98,5
25
14,8
19,5
24
48,5
33,8
09
8 14
7680
2
27.6
2.
76
83.8
10
.7
36.8
27
,287
,808
66
,278
,074
12
,007
,668
39
,295
,476
10
2000
1
16.1
2.
76
48.9
6.
3 25
.4
15,9
17,8
88
48,7
06,4
35
8,82
4,19
5 24
,742
,083
9
5100
0 TS
CA
12
2.
76
36.4
4.
7 12
.7
11,8
64,2
64
20,4
47,8
97
3,70
4,56
7 15
,568
,831
18
8950
3
34.1
2.
76
103.
5 13
.3
47.1
33
,714
,285
85
,999
,106
15
,580
,547
49
,294
,832
10
15
3050
2
27.6
2.
76
83.8
10
.7
38.2
27
,287
,808
69
,680
,355
12
,624
,062
39
,911
,871
11
0
1060
00
1 16
.1
2.76
48
.9
6.3
26.4
15
,917
,888
51
,240
,722
9,
283,
335
25,2
01,2
23
12
5300
0 TS
CA
12
2.
76
36.4
4.
7 13
.2
11,8
64,2
64
21,7
15,0
41
3,93
4,13
6 15
,798
,401
(con
tinue
d)

17
Tab
le 3
. (C
oncl
uded
)
Yea
r V
olum
e (c
y)
Cel
l N
o.
Are
a @
1/2
St
orag
e D
epth
(a
cres
)
Pond
ing
Dep
th
(ft)
Pond
V
olum
e (a
cre*
ft)
Tim
e of
po
ndin
g (t
p)
(day
s)
Tot
al
(Act
ive)
D
redg
ing
Dur
atio
n (D
) (d
ays)
Vol
ume
Pond
(V
p)
(gal
)
Tot
al R
ecyc
le
Vol
ume
(Vr)
(g
al)
Tot
al
Vol
ume
Mak
eup
Wat
er
(Vm
u)
(gal
)
Ann
ual S
yste
m
Wat
er In
put
Req
uire
men
ts
(VT)
(gal
) 13
15
9000
2
27.6
2.
76
83.8
10
.7
39.6
27
,287
,808
73
,450
,107
13
,307
,032
40
,594
,840
14
19
6000
3
34.1
2.
76
103.
5 13
.3
48.9
33
,714
,285
90
,465
,787
16
,389
,781
50
,104
,065
15
0
1066
67
1 16
.1
2.76
48
.9
6.3
26.6
15
,917
,888
51
,663
,315
9,
359,
896
25,2
77,7
85
16
5333
3 TS
CA
12
2.
76
36.4
4.
7 13
.3
11,8
64,2
64
21,9
26,0
20
3,97
2,36
0 15
,836
,624
17
16
0000
2
27.6
2.
76
83.8
10
.7
39.9
27
,287
,808
74
,083
,679
13
,421
,817
40
,709
,625
18
19
4000
3
34.1
2.
76
103.
5 13
.3
48.4
33
,714
,285
89
,198
,643
16
,160
,211
49
,874
,496
19
0
7600
0 1
16.1
2.
76
48.9
6.
3 18
.9
15,9
17,8
88
32,2
33,5
68
5,83
9,78
9 21
,757
,677
20
76
000
TSC
A
12
2.76
36
.4
4.7
18.9
11
,864
,264
36
,287
,192
6,
574,
188
18,4
38,4
53
21
1520
00
2 27
.6
2.76
83
.8
10.7
37
.9
27,2
87,8
08
69,0
15,1
05
12,5
03,5
38
39,7
91,3
46
22
1930
00
3 34
.1
2.76
10
3.5
13.3
48
.1
33,7
14,2
85
88,5
65,0
72
16,0
45,4
26
49,7
59,7
11
23
0
77
000
1 16
.1
2.76
48
.9
6.3
19.2
15
,917
,888
32
,867
,140
5,
954,
574
21,8
72,4
62
24
7700
0 TS
CA
12
2.
76
36.4
4.
7 19
.2
11,8
64,2
64
36,9
20,7
64
6,68
8,97
3 18
,553
,238
25
15
4000
2
27.6
2.
76
83.8
10
.7
38.4
27
,287
,808
70
,282
,248
12
,733
,108
40
,020
,916
26
19
5000
3
34.1
2.
76
103.
5 13
.3
48.6
33
,714
,285
89
,832
,215
16
,274
,996
49
,989
,281
27
7800
0 1
16.1
2.
76
48.9
6.
3 19
.4
15,9
17,8
88
33,5
00,7
12
6,06
9,35
9 21
,987
,247
28
78
000
TSC
A
12
2.76
36
.4
4.7
19.4
11
,864
,264
37
,554
,336
6,
803,
758
18,6
68,0
22
29
1560
00
2 27
.6
2.76
83
.8
10.7
38
.9
27,2
87,8
08
71,5
49,3
92
12,9
62,6
78
40,2
50,4
86
30
1980
00
3 34
.1
2.76
10
3.5
13.3
49
.4
33,7
14,2
85
91,7
32,9
31
16,6
19,3
51
50,3
33,6
35

18
Table 4. Number of Exchanges of Pond Volume During Recycle, 2.8 ft Ponding Depth
Year Volume
(cy) Cell No.
Number of Days to ExchangePond Volume Once
(days)
Number of Full Exchanges
of Pond Volume 1 85333 1 6.3 2.4 42667 TSCA 4.7 1.3
2 162983 3 13.3 2.1 132017 2 10.7 2.1
3 89333 1 6.3 2.6 44667 TSCA 4.7 1.4
4 169061 3 13.3 2.2 136939 2 10.7 2.2
5 140000 1 6.3 4.6 6 175691 3 13.3 2.3 142309 2 10.7 2.3
7 146000 TSCA 4.7 6.8 8 182320 3 13.3 2.4 147680 2 10.7 2.4
9 102000 1 6.3 3.1 51000 TSCA 4.7 1.7
10 188950 3 13.3 2.6 153050 2 10.7 2.6
11 0 12 106000 1 6.3 3.2
53000 TSCA 4.7 1.8 13 159000 2 10.7 2.7 14 196000 3 13.3 2.7 15 0 16 106667 1 6.3 3.2
53333 TSCA 4.7 1.8 17 160000 2 10.7 2.7 18 194000 3 13.3 2.6 19 0 20 76000 1 6.3 2.0
76000 TSCA 4.7 3.1 21 152000 2 10.7 2.5 22 193000 3 13.3 2.6 23 0 24 77000 1 6.3 2.1
77000 TSCA 4.7 3.1 25 154000 2 10.7 2.6 26 195000 3 13.3 2.7 27 28 78000 1 6.3 2.1
78000 TSCA 4.7 3.2 29 156000 2 10.7 2.6 30 198000 3 13.3 2.7

19
For the purposes of this analysis, for single cell disposal it was assumed all make up water would be taken from the equalization basin (stored runoff). For two cell disposal, it was assumed that the first cell would be filled from the equalization basin. Then, all water used for slurrying the material for disposal in the 2nd cell would be drawn from the pond in the 1st cell. (Alternatively, the 2nd cell could be filled using ponded water from the first cell until the pond was depleted, and then additional water drawn from the equalization basin. Canal water would be employed only if stored water volumes were depleted. Given the relative cell areas assumed in Table 1, in all cases sufficient volume should be available in the 1st cell to provide necessary make-up water for the 2nd cell, if the larger cell is filled first. For the purposes of calculating final contaminant concentrations in the ponds, it was assumed that sufficient water was available in the first cell for filling of the 2nd cell.) Conceptually, single cell and two-cell disposal and recycle are illustrated in Figures 7 - 12.
Figure 7. Single cell disposal during ponding

20
Figure 8. Single cell disposal after ponding
Figure 9. Multiple cell disposal, ponding of first cell

21
Figure 10. Multiple cell disposal, after ponding in first cell
Figure 11. Multiple cell disposal, ponding of second cell

22
Figure 12. Multiple cell disposal, after ponding of second cell Partitioning Analysis
When contaminants exist in a sediment-water “system,” they distribute between the solid and aqueous phases proportionally. This distribution occurs as a function of the solubility and hydrophobicity of the contaminant, the characteristics and content of carbon-bearing phases within the sediment, length of time the phases have been in contact with each other, and other characteristics of the system. Partitioning analysis uses the known properties of the contaminants of concern to predict this distribution, and arrive at estimated dissolved concentrations of contaminants in the aqueous phase. Two boundary conditions are assumed: mixing and equilibrium. In this case, the mixing assumption reflects the concentrations obtained by simply diluting the pore water with the carrier water (water used for slurrying), taking into account the respective volumes of each. After a period of time, however, the solids in contact with the combined pore water and carrier water will establish a new equilibrium, partitioning according to the properties of the combined system, as previously explained. The equilibrium assumption usually results in the highest estimates of dissolved contaminant concentrations. Pond concentrations reported in this document reflect the equilibrium assumption. Sediment data used in the partitioning analysis is summarized in Table 5.

23
Table 5. Bulk Sediment and Water Concentrations
Analyte Bulk Sediment Concentration
(mg/kg)
Canal Water Conc. (ug/L)
Selected Groundwater
Conc. (ug/L)
Metals Arsenic 36.8 2.5 4.6 Cadmium 22.2 0.7 10 Chromium (hex) 514 4 52.7 Copper 266 5 53.2 Lead 933 0.5 332 Mercury 0.262 0.0008 0.37 Nickel 120 8 123 Zinc 3780 15 213
Organic Tins Dibutylin 0.115 0 0 Monobutyltin 0.017 0 0 Tributyltin 0.438 0 0
Inorganic/General Chemistry Carbon, Total Organic 48300 4600 53800 Ammonia-N 1100 607 3300 Phosphorus, Total 2760 100 100
PAHs Acenaphthene 110 0 199 Acenaphthylene 22 0 154 Anthracene 64 0 121 Benzo(a)anthracene 110 0 0 Benzo(a)pyrene 165 0 0 Benzo(b)fluoranthene 165 0 0 Benzo(g,h,i)perylene 42 0 0 Benzo(k)fluoranthene 115 0 0 Biphenyl 2.04 0 0 Chrysene 98 0 0 Dibenzo(a,h)anthracene 4.67 0 0 Fluoranthene 175 0 0 Fluorene 83 0 203 Indeno(1,2,3-c,d)pyrene 60 0 0 2-Methylnaphthalene 9.59 0 39500 Naphthalene 2050 0 255 Phenanthrene 210 0 403 Pyrene 145 0 62.9
Semi-Volatile Organic Compounds Benzyl butyl phthalate 16 0 0 Bis(2-ethylhexyl)phthalate 21.9 0 0 2-Chlorophenol 0.570 0 0 Di-N-Octyl Phthalate 7.70 0 0
(continued)

24
Table 5. (Continued)
Analyte Bulk Sediment Concentration
(mg/kg)
Canal Water Conc. (ug/L)
Selected Groundwater
Conc. (ug/L)
Semi-Volatile Organic Compounds (continued)Dibenzofuran 10.2 0 1600 1,2-Dichlorobenzene 2.99 0 0 1,3-Dichlorobenzene 1.28 0 0 1,4-Dichlorobenzene 0.364 0 0 2,4-Dichlorophenol 2.81 0 0 2,4-Dimethylphenol 0 0 102 2,4-Dinitrophenol 1.54 0 0 2,4-Dinitrotoluene 0.01 0 0 Hexachlorobenzene 0.495 0 0 Hexachlorobutadiene 0.33 0 0 Isophorone 0 0 223 4-Methylphenol 1.61 0 0 2-Nitrophenol 4.3 0 0 Pentachlorophenol 2.69 0 0 Phenol 4.02 0 94.8 1,2,4-Trichlorobenzene 0.36 0 0
Volatile Organic Compounds Acetone 4.5 146 Benzene 1.26 0 3060 Chlorobenzene 3.56 0 29.4 Chloroform 0.73 0 0.4 Ethylbenzene 0.986 0 20060 Isopropylbenzene 0 0 42.9 4-Methyl-2-pentanone 0 0 31100 Methylene chloride 3.59 0 50.3 1,1,2,2-Tetrachloroethane 0 0 36.4 Tetrachloroethylene 0.02 0 0 Toluene 0.476 0 8800 1,1,2-Trichloroethane 0 0 32.5 Xylenes, Total 1.41 0 39700
Chlorinated Pesticides Aldrin 2.41 0 0.323 alpha-BHC 0.043 0 0.162 beta-BHC 0.18 0 0.183 delta-BHC 0.017 0 0.246 gamma-BHC (Lindane) 0.011 0 0.253 Chlordane, Techincal 1.89 0 0.7 4,4'-DDD 0.096 0 0.202 o,p'-DDE (2,4) 0.19 0 0 p,p'-DDE (4,4) 0.164 0 0.205 p,p'-DDT (4,4) 0.198 0 0.2
(continued)

25
Table 5. (Continued)
Analyte Bulk Sediment Concentration
(mg/kg)
Canal Water Conc. (ug/L)
Selected Groundwater
Conc. (ug/L)
Chlorinated Pesticides (continued) Dieldrin 0.091 0 0.202 Endosulfan I 0.026 0 0.165 Endosulfan II 0.06 0 0 Endosulfan sulfate 0 0 0.209 Endrin 0.029 0 0.235 Endrin aldehyde 0.052 0 0.181 Endrin ketone 0.325 0 0.364 Heptachlor 0.26 0 0.167 Heptachlor epoxide 0.146 0 0.27 Methoxychlor 0.5 0 0.334 Toxaphene 3.670 0 0
Dioxins and Furans 1,2,3,4,6,7,8-HPCDD 0 0 0 1,2,3,4,6,7,8-HPCDF 0 0 0 1,2,3,4,7,8,9-HPCDF 0 0 0 1,2,3,4,7,8-HXCDD 0 0 0 1,2,3,4,7,8-HXCDF 0.1 0 0 1,2,3,6,7,8-HXCDD 0 0 0 1,2,3,6,7,8-HXCDF 0 0 0 1,2,3,7,8,9-HXCDD 0 0 0 1,2,3,7,8,9-HXCDF 0 0 0 1,2,3,7,8-PECDD 0 0 0 1,2,3,7,8-PECDF 0 0 0 2,3,4,6,7,8-HXCDF 0 0 0 2,3,4,7,8-PECDF 0 0 0 2,3,7,8-TCDD 0 0 0 2,3,7,8-TCDF 0 0 0 OCDD 2.240E-05 0 0 OCDF 7.250E-06 0 0 Total HPCDDS 8.640E-06 0 0 Total HPCDFS 3.860E-06 0 0 Total HXCDDS 2.770E-06 0 0 Total HXCDFS 1.710E-06 0 0 Total PECDDS 4.430E-07 0 0 Total PECDFS 7.500E-07 0 0 Total TCDDS 1.840E-07 0 0 Total TCDFS 0 0 0
(continued)

26
Table 5. (Concluded)
Analyte Bulk Sediment Concentration
(mg/kg)
Canal Water Conc. (ug/L)
Selected Groundwater
Conc. (ug/L)
PCB Aroclors PCB(Aroclor-1016) 9.27 0 0 PCB(Aroclor-1221) 1.11 0 0 PCB(Aroclor-1232) 1.11 0 0 PCB(Aroclor-1242) 10.4 0 0 PCB(Aroclor-1248) 29.4 0 0 PCB(Aroclor-1254) 1.68 0 0.941 PCB(Aroclor-1260) 1.11 0 0 PCB Total* 43 0 3.7
*PCB Total is the sum of 19 PCB Congeners.
Water in the equalization basin is assumed to have the character of runoff. Dissolved
contaminant concentrations for runoff were estimated by partitioning, taking predicted effluent concentrations, which are typically conservative, to be representative. Where recycle is employed, final pond concentrations in the disposal cells will be higher than the predicted effluent concentrations. Because the recycle water will be exposed to the sediment multiple times, a new equilibrium will be established each time the water is recycled. Final contaminant concentrations in the ponds will be dependent upon the number of times the water is recycled, or the number of times the total pond volume is “exchanged.” The effective number of pond exchanges during recycle differs based on the respective pond volumes, annual dredging duration, and order of filling, for years in which multiple cells are utilized. Based on a preliminary evaluation of the pond concentrations obtained for various recycle assumptions, it appears that the highest pond concentrations are obtained for the following scenario:
• Disposal occurs in two cells. • The largest cell is filled first, using water from the equalization basin to slurry
the material. • Material for the second cell is slurried using only water from the pond formed
in the first cell. • Equilibrium concentrations are assumed.
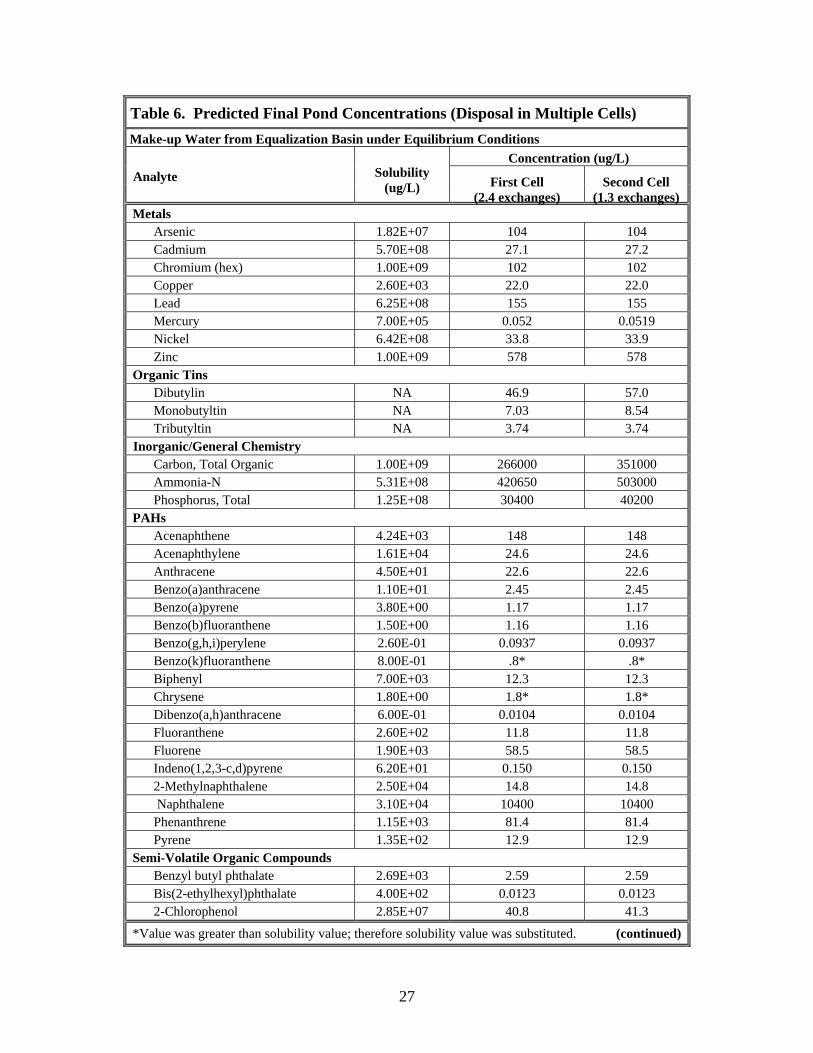
The order of filling resulting in the maximum effective number of recycles was calculated for each year of dredging, and the mean of these values was used to estimate worst-case contaminant concentrations in the disposal cell pond. A full listing of dissolved contaminant concentrations for the recycle option is summarized in Table 6 (for years with disposal in multiple cells) and in Table 7 (for years with disposal in a single cell). Predicted concentrations for benzo(k)fluoranthene and chrysene exceed the solubility for these compounds as shown in Table 6 but their concentrations were limited
27
Table 6. Predicted Final Pond Concentrations (Disposal in Multiple Cells) Make-up Water from Equalization Basin under Equilibrium Conditions
Concentration (ug/L) Analyte
Solubility (ug/L) First Cell
(2.4 exchanges) Second Cell
(1.3 exchanges) Metals
Arsenic 1.82E+07 104 104 Cadmium 5.70E+08 27.1 27.2 Chromium (hex) 1.00E+09 102 102 Copper 2.60E+03 22.0 22.0 Lead 6.25E+08 155 155 Mercury 7.00E+05 0.052 0.0519 Nickel 6.42E+08 33.8 33.9 Zinc 1.00E+09 578 578
Organic Tins Dibutylin NA 46.9 57.0 Monobutyltin NA 7.03 8.54 Tributyltin NA 3.74 3.74
Inorganic/General Chemistry Carbon, Total Organic 1.00E+09 266000 351000 Ammonia-N 5.31E+08 420650 503000 Phosphorus, Total 1.25E+08 30400 40200
PAHs Acenaphthene 4.24E+03 148 148 Acenaphthylene 1.61E+04 24.6 24.6 Anthracene 4.50E+01 22.6 22.6 Benzo(a)anthracene 1.10E+01 2.45 2.45 Benzo(a)pyrene 3.80E+00 1.17 1.17 Benzo(b)fluoranthene 1.50E+00 1.16 1.16 Benzo(g,h,i)perylene 2.60E-01 0.0937 0.0937 Benzo(k)fluoranthene 8.00E-01 .8* .8* Biphenyl 7.00E+03 12.3 12.3 Chrysene 1.80E+00 1.8* 1.8* Dibenzo(a,h)anthracene 6.00E-01 0.0104 0.0104 Fluoranthene 2.60E+02 11.8 11.8 Fluorene 1.90E+03 58.5 58.5 Indeno(1,2,3-c,d)pyrene 6.20E+01 0.150 0.150 2-Methylnaphthalene 2.50E+04 14.8 14.8 Naphthalene 3.10E+04 10400 10400 Phenanthrene 1.15E+03 81.4 81.4 Pyrene 1.35E+02 12.9 12.9
Semi-Volatile Organic Compounds Benzyl butyl phthalate 2.69E+03 2.59 2.59 Bis(2-ethylhexyl)phthalate 4.00E+02 0.0123 0.0123 2-Chlorophenol 2.85E+07 40.8 41.3
*Value was greater than solubility value; therefore solubility value was substituted. (continued)

28
Table 6. (Continued) Make-up Water from Equalization Basin under Equilibrium Conditions
Concentration (ug/L) Analyte
Solubility (ug/L) First Cell
(2.4 exchanges) First Cell
(2.4 exchanges) Semi-Volatile Organic Compounds (continued)
Di-N-Octyl Phthalate 3.00E+03 0.000684 0.000684 Dibenzofuran 4.75E+03 7.19 7.19 1,2-Dichlorobenzene 1.45E+05 13.3 13.3 1,3-Dichlorobenzene 1.33E+05 5.68 5.68 1,4-Dichlorobenzene 8.30E+04 1.54 1.54 2,4-Dichlorophenol 4.50E+06 25.9 25.9 2,4-Dinitrophenol 6.00E+06 340 368 2,4-Dinitrotoluene 2.70E+05 0.975 0.995 Hexachlorobenzene 6.00E+00 0.00713 0.00713 Hexachlorobutadiene 3.23E+03 0.0572 0.0572 4-Methylphenol 2.20E+07 170 174 2-Nitrophenol 2.19E+06 627 654 Pentachlorophenol 1.40E+04 0.256 0.256 Phenol 8.84E+07 1010 1110 1,2,4-Trichlorobenzene 4.00E+04 0.393 0.393
Volatile Organic Compounds Acetone 1.00E+09 2420 3180 Benzene 1.78E+06 96.0 97.3 Chlorobenzene 4.88E+05 56.7 56.7 Chloroform 8.20E+06 85.0 87.4 Ethylbenzene 1.52E+05 7.75 7.75 Methylene chloride 2.00E+07 1150 1330 Tetrachloroethylene 2.00E+05 0.468 0.468 Toluene 5.35E+05 8.49 8.50 Xylenes, Total 1.75E+05 11.9 11.9
Chlorinated Pesticides Aldrin 1.80E+01 0.135 0.135 alpha-BHC 2.00E+03 0.0758 0.0758 beta-BHC 7.00E+02 0.318 0.318 delta-BHC 3.14E+04 0.0134 0.0134 gamma-BHC (Lindane) 7.80E+03 0.0252 0.0252 Chlordane, Technical 5.60E+01 0.351 0.351 4,4'-DDD 1.60E+02 0.00108 0.00108 o,p'-DDE (2,4) 4.00E+01 0.000212 0.000212 p,p'-DDE (4,4) 4.00E+01 0.00665 0.00665 p,p'-DDT (4,4) 2.50E+01 0.00143 0.00143 Dieldrin 1.95E+02 0.00434 0.00434 Endosulfan I 5.30E+02 0.0697 0.0697
(continued)

29
Table 6. (Continued) Make-up Water from Equalization Basin under Equilibrium Conditions
Concentration (ug/L) Analyte
Solubility (ug/L) First Cell
(2.4 exchanges) Second Cell
(1.3 exchanges) Chlorinated Pesticides (continued)
Endosulfan II 4.50E+02 0.0991 0.0991 Endrin 2.50E+02 0.00205 0.00205 Endrin Aldehyde 5.00E+04 0.0583 0.0583 Endrin ketone 8.60E+02 0.0372 0.0372 Heptachlor 1.80E+02 0.0156 0.0156 Heptachlor Epoxide 3.50E+02 0.0163 0.0163 Methoxychlor 4.50E+01 0.0465 0.0465 Toxaphene 7.40E+02 0.130 0.130
Dioxins and Furans 1,2,3,4,6,7,8-HPCDD 4.20E-01 4.9E-10 4.9E-10 1,2,3,4,6,7,8-HPCDF 7.62E-01 1.8E-10 1.8E-10 1,2,3,4,7,8,9-HPCDF NA 3.2E-11 3.2E-11 1,2,3,4,7,8-HXCDD 1.00E+00 2.6E-11 2.6E-11 1,2,3,4,7,8-HXCDF 2.50E-02 3.3E-07 3.3E-07 1,2,3,6,7,8-HXCDD NA 3.3E-11 3.3E-11 1,2,3,6,7,8-HXCDF 1.77E-02 7.1E-12 7.1E-12 1,2,3,7,8,9-HXCDD NA 1.3E-10 1.3E-10 1,2,3,7,8,9-HXCDF NA 8.6E-12 8.6E-12 1,2,3,7,8-PECDD 1.15E+01 1.0E-10 1.0E-10 1,2,3,7,8-PECDF 9.13E+00 4.4E-11 4.4E-11 2,3,4,6,7,8-HXCDF NA 1.3E-12 1.3E-12 2,3,4,7,8-PECDF 6.36E+00 8.7E-11 8.7E-11 2,3,7,8-TCDD 2.00E-01 2.3E-10 2.3E-10 2,3,7,8-TCDF 4.19E-01 1.1E-09 1.1E-09 OCDD 7.40E-05 1.6E-09 1.6E-09 OCDF NA 1.0E-09 1.0E-09 Total HPCDDS 1.90E+00 1.6E-09 1.6E-09 Total HPCDFS NA 2.5E-10 2.5E-10 Total HXCDDS 4.00E-03 1.9E-10 1.9E-10 Total HXCDFS NA 5.0E-10 5.0E-10 Total PECDDS 1.20E-01 1.6E-09 1.6E-09 Total PECDFS NA 9.6E-10 9.6E-10 Total TCDDS 3.50E-01 8.2E-10 8.2E-10 Total TCDFS NA 1.1E-08 1.1E-08
(continued)

30
Table 6. (Concluded) Make-up Water from Equalization Basin under Equilibrium Conditions
Concentration (ug/L) Analyte
Solubility (ug/L) First Cell
(2.4 exchanges) Second Cell
(1.3 exchanges) PCB Aroclors
PCB(Aroclor-1016) 4.20E+02 0.273 0.273 PCB(Aroclor-1221) 4.00E+04 1.03 1.03 PCB(Aroclor-1232) 4.07E+05 7.77 7.77 PCB(Aroclor-1242) 2.30E+02 9.04 9.04 PCB(Aroclor-1248) 5.40E+01 0.571 0.571 PCB(Aroclor-1254) 3.10E+01 0.0172 0.0172 PCB(Aroclor-1260) 2.70E+00 0.000984 0.000984 PCB Total* 7.00E+01 0.439 0.439
*PCB Total is the sum of 19 PCB Congeners.

31
Table 7. Predicted Final Pond Concentrations (Disposal in Single Cell) Make-up Water from Equalization Basin under Equilibrium Conditions
Analyte
Solubility (ug/L)
Concentration (ug/L) First Cell
(2.8 exchanges) Metals
Arsenic 1.82E+07 104 Cadmium 5.70E+08 27.1 Chromium (hex) 1.00E+09 102 Copper 2.60E+03 22.0 Lead 6.25E+08 155 Mercury 7.00E+05 0.052 Nickel 6.42E+08 33.8 Zinc 1.00E+09 578
Organic Tins Dibutylin NA 48.3 Monobutyltin NA 7.24 Tributyltin NA 3.74
Inorganic/General Chemistry Carbon, Total Organic 1.00E+09 277000 Ammonia-N 5.31E+08 432000 Phosphorus, Total 1.25E+08 31700
PAHs Acenaphthene 4.24E+03 148 Acenaphthylene 1.61E+04 24.6 Anthracene 4.50E+01 22.6 Benzo(a)anthracene 1.10E+01 2.45 Benzo(a)pyrene 3.80E+00 1.17 Benzo(b)fluoranthene 1.50E+00 1.16 Benzo(g,h,i)perylene 2.60E-01 0.094 Benzo(k)fluoranthene 8.00E-01 .8* Biphenyl 7.00E+03 12.3 Chrysene 1.80E+00 1.8* Dibenzo(a,h)anthracene 6.00E-01 0.0104 Fluoranthene 2.60E+02 11.8 Fluorene 1.90E+03 58.5 Indeno(1,2,3-c,d)pyrene 6.20E+01 0.150 2-Methylnaphthalene 2.50E+04 14.8 Naphthalene 3.10E+04 10400 Phenanthrene 1.15E+03 81.4 Pyrene 1.35E+02 12.9
*Value was greater than solubility value; therefore solubility value was substituted. (continued)

32
Table 7. (Continued)
Make-up Water from Equalization Basin under Equilibrium Conditions
Analyte
Solubility (ug/l)
Concentration (ug/L) First Cell
(2.8 exchanges) Semi-Volatile Organic Compounds
Benzyl butyl phthalate 2.69E+03 2.59 Bis(2-ethylhexyl)phthalate 4.00E+02 0.0123 2-Chlorophenol 2.85E+07 40.8 Di-N-Octyl Phthalate 3.00E+03 0.000684 Dibenzofuran 4.75E+03 7.19 1,2-Dichlorobenzene 1.45E+05 13.3 1,3-Dichlorobenzene 1.33E+05 5.68 1,4-Dichlorobenzene 8.30E+04 1.54 2,4-Dichlorophenol 4.50E+06 25.9 2,4-Dinitrophenol 6.00E+06 344 2,4-Dinitrotoluene 2.70E+05 0.977 Hexachlorobenzene 6.00E+00 0.00713 Hexachlorobutadiene 3.23E+03 0.0572 4-methylphenol 2.20E+07 170 2-Nitrophenol 2.19E+06 630 Pentachlorophenol 1.40E+04 0.256 Phenol 8.84E+07 1020 1,2,4-Trichlorobenzene 4.00E+04 0.393
Volatile Organic Compounds Acetone 1.00E+09 2530 Benzene 1.78E+06 96.1 Chlorobenzene 4.88E+05 56.7 Chloroform 8.20E+06 85.3 Ethylbenzene 1.52E+05 7.75 Methylene chloride 2.00E+07 1180 Tetrachloroethylene 2.00E+05 0.468 Toluene 5.35E+05 8.49 Xylenes, Total 1.75E+05 11.9
Chlorinated Pesticides Aldrin 1.80E+01 0.135 alpha-BHC 2.00E+03 0.0758 beta-BHC 7.00E+02 0.318 delta-BHC 3.14E+04 0.0134 gamma-BHC (Lindane) 7.80E+03 0.0252 Chlordane, Technical 5.60E+01 0.351 4,4'-DDD 1.60E+02 0.00108 o,p'-DDE (2,4) 4.00E+01 0.000212 p,p'-DDE (4,4) 4.00E+01 0.00665 p,p'-DDT (4,4) 2.50E+01 0.00143
(continued)

33
Table 7. (Continued)
Make-up Water from Equalization Basin under Equilibrium Conditions
Analyte
Solubility (ug/l)
Concentration (ug/L) First Cell
(2.8 exchanges) Chlorinated Pesticides (continued)
Dieldrin 1.95E+02 0.00434 Endosulfan I 5.30E+02 0.0697 Endosulfan II 4.50E+02 0.0991 Endrin 2.50E+02 0.00205 Endrin Aldehyde 5.00E+04 0.0583 Endrin ketone 8.60E+02 0.0372 Heptachlor 1.80E+02 0.0156 Heptachlor Epoxide 3.50E+02 0.0163 Methoxychlor 4.50E+01 0.0465 Toxaphene 7.40E+02 0.130
Dioxins and Furans 1,2,3,4,6,7,8-HPCDD 4.20E-01 4.9E-10 1,2,3,4,6,7,8-HPCDF 7.62E-01 1.8E-10 1,2,3,4,7,8,9-HPCDF NA 3.2E-11 1,2,3,4,7,8-HXCDD 1.00E+00 2.6E-11 1,2,3,4,7,8-HXCDF 2.50E-02 3.3E-07 1,2,3,6,7,8-HXCDD NA 3.3E-11 1,2,3,6,7,8-HXCDF 1.77E-02 7.1E-12 1,2,3,7,8,9-HXCDD NA 1.3E-10 1,2,3,7,8,9-HXCDF NA 8.6E-12 1,2,3,7,8-PECDD 1.15E+01 1.0E-10 1,2,3,7,8-PECDF 9.13E+00 4.4E-11 2,3,4,6,7,8-HXCDF NA 1.3E-12 2,3,4,7,8-PECDF 6.36E+00 8.7E-11 2,3,7,8-TCDD 2.00E-01 2.3E-10 2,3,7,8-TCDF 4.19E-01 1.1E-09 OCDD 7.40E-05 1.6E-09 OCDF NA 1.0E-09 Total HPCDDS 1.90E+00 1.6E-09 Total HPCDFS NA 2.5E-10 Total HXCDDS 4.00E-03 1.9E-10 Total HXCDFS NA 5.0E-10 Total PECDDS 1.20E-01 1.6E-09 Total PECDFS NA 9.6E-10 Total TCDDS 3.50E-01 8.2E-10 Total TCDFS NA 1.1E-08
(continued)

34
Table 7. (Concluded)
Make-up Water from Equalization Basin under Equilibrium Conditions
Analyte
Solubility (ug/l)
Concentration (ug/L) First Cell
(2.8 exchanges) PCB Aroclors
PCB(Aroclor-1016) 4.20E+02 0.273 PCB(Aroclor-1221) 4.00E+04 1.03 PCB(Aroclor-1232) 4.07E+05 7.76 PCB(Aroclor-1242) 2.30E+02 9.04 PCB(Aroclor-1248) 5.40E+01 0.571 PCB(Aroclor-1254) 3.10E+01 0.0171 PCB(Aroclor-1260) 2.70E+00 0.000984 PCB Total* 7.00E+01 0.439
*PCB Total is the sum of 19 PCB Congeners. to their solubility values in the analyses. Comparative pond concentrations for Options 1, 2 and 3 (mechanical offloading, hydraulic offloading, and hydraulic offloading with recycle) are given in Table 8. Assuming the wastewater treatment will be deferred until dredging is completed annually, contaminant concentrations in the (disposal cell) pond at the completion of dredging are assumed to represent the concentrations of the influent to the WWTP. Equalization basin concentrations represent the runoff, consolidation, and groundwater (when assumed to be stored untreated in the equalization basin) flows that are collected in the equalization basin during the post-treatment period. These concentrations were used for calculating volatile losses from the equalization basin. The effects of groundwater storage in the equalization basin were not considered for calculating the disposal cell concentrations with recycling because the groundwater will probably be handled separately or pre-treated before storage in the equalization basin. Groundwater flows are based on expected long-term pumping rates (after initial drawdown and the first layers of dredged material are placed in all disposal cells), rather than initial drawdown rates. Ponded Water Predictions Summary
Final pond concentrations were calculated for Options 1, 2 and 3 from a revised data set that included data for BTEX and other organic compounds obtained from an EPA data set. Concentrations were estimated based on partitioning analysis for all three options, in order to establish a consistent basis of comparison. Pond concentrations for Option 3 assumed all make-up water would be obtained from runoff stored in the equalization basin, and mean recycle requirements for a 2.8 ft ponding depth. Flow volumes and concentrations obtained should be conservative estimates for established operating conditions, when infiltration would be expected to be minimal. Groundwater was not included in pond concentration estimates since separate treatment of the groundwater is being considered.

35
Table 8. Ponded Water Concentrations
Disposal Pond Concentration (ug/L) Equalization Basin Concentration (ug/L)
Option 1 Option 1 Options 2 & 3
Options 2 & 3 Analyte Option 1 Option 2 Option 3
w/o GW w/GW w/o GW w/GW Metals
Arsenic 93.6 97.5 104 26.4 26.2 62.1 61.7 Cadmium 24.2 24.4 27.2 6.6 6.66 14.9 14.8 Chromium(hex) 95.4 100 102 30.6 30.8 74.6 74.4 Copper 20.5 21.2 22.0 5.99 6.52 14.5 14.8 Lead 146 153 155 51.0 54.2 121 123 Mercury 0.237 0.0497 0.0519 0.0138 0.0178 0.0331 0.036 Nickel 31.3 31.8 33.9 8.62 9.91 20.2 21.1 Zinc 531 559 578 160 160 388 387
Organic Tins Dibutylin 59.4 18.2 57.0 15.67 15.49 31.4 31.2 Monobutyltin 8.90 2.73 8.54 2.35 2.32 4.71 4.67 Tributyltin 3.42 3.60 3.74 1.01 1.00 2.46 2.44
Inorganic/General Chemistry Carbon, Total Organic 358000 346000 351000 99100 98600 241000 240000 Ammonia-N 508000 169000 503000 134000 133000 269000 264000 Phosphorus, Total 54500 10030 40200 14400 14200 28700 28300
PAHs Acenaphthene 143 147 148 64.7 66.2 131 131 Acenaphthylene 23.9 24.5 24.6 11.5 13.1 22.2 23.2 Anthracene 22.4 22.6 22.6 15.4 16.6 21.8 22.6 Benzo(a)anthracene 2.45 2.45 2.45 2.37 2.35 2.45 2.43 Benzo(b)fluoranthene 1.16 1.16 1.16 1.15 1.14 1.16 1.15 Benzo(k)fluoranthene 1.16 1.16 1.16 1.15 1.14 1.16 0.800 Benzo(g,h,i)perylene 0.0937 0.0937 0.0937 0.0934 0.0924 0.0937 0.0930 Benzo(a)pyrene 1.17 1.17 1.17 1.16 1.14 1.17 1.16 Biphenyl 11.3 12.0 12.3 3.53 3.49 8.64 8.57 Chrysene 2.19 2.19 2.19 2.12 2.09 2.18 2.16 Dibenzo(a,h)anthracene 0.0104 0.0104 0.0104 0.0104 0.0103 0.0104 0.0103 Fluoranthene 11.8 11.8 11.8 10.7 10.6 11.7 11.6 Fluorene 57. 5 58.5 58.5 32.1 34.0 54.6 55.8 Indeno(1,2,3-c,d)pyrene 0.150 0.150 0.150 0.150 0.148 0.150 0.149 2-Methylnaphthalene 14.3 14.7 14.8 6.17 450 12.9 328 Naphthalene 9690 10200 10400 3100 3070 7570 7510 Phenanthrene 80.5 81.3 81.4 54.0 57.9 78.2 80.8 Pyrene 12.8 12.9 12.9 11.4 12.0 12.8 13.2
(continued)

36
Table 8. (Continued) Disposal Pond Concentration (ug/L) Equalization Basin Concentration (ug/L)
Option 1 Option 1 Options 2 & 3
Options 2 & 3 Analyte Option 1 Option 2 Option 3
w/o GW w/GW w/o GW w/GW Semi-Volatile Organic Compounds
Benzyl butyl phthalate 2.57 2.58 2.59 2.10 2.08 2.54 2.52 Bis(2-ethylhexyl) phthalate 0.0123 0.0123 0.0123 0.0122 0.0121 0.0123 0.0122
2-Chlorophenol 36.1 30.9 41.3 9.64 9.54 20.2 20.1 Di-n-octyl phthalate 0.000683 0.000683 0.000684 0.000684 0.000676 0.000684 0.000678 Dibenzofuran 7.06 7.17 7.19 3.94 21.9 6.71 19.4 1,2-Dichlorobenzene 12.4 13.0 13.3 4.065 4.019 9.87 9.79 1,3-Dichlorobenzene 5.30 5.56 5.68 1.74 1.72 4.23 4.19 1,4-Dichlorobenzene 1.44 1.51 1.54 0.478 0.472 1.16 1.15 2,4-Dichlorophenol 23.6 24.9 25.9 6.95 6.87 16.8 16.6 2,4-Dimethylphenol 0.0 0.0 0.0 0.0 1.14 0.0 0.812 2,4-Dinitrophenol 330 177 368 87.3 86.4 177 175 2,4-Dinitrotoluene 0.870 0.682 0.995 0.231 0.229 0.479 0.475 Hexachlorobenzene 0.00712 0.00713 0.00713 0.00697 0.00689 0.00711 0.00706 Hexachlorobutadiene 0.0569 0.0571 0.0572 0.0458 0.0453 0.0561 0.0557 Isophorone 0.0 0.0 0.0 0.0 2.504 0.0 1.78 4-Methylphenol 152 116 174 40.5 40.0 83.6 82.9 2-Nitrophenol 574 386 654 152 150 311 308 Pentachlorophenol 0.255 0.256 0.256 0.224 0.222 0.254 0.252 Phenol 1010 497 1110 267 265 539 536 1,2,4-Trichlorobenzene 0.383 0.391 0.393 0.185 0.183 0.355 0.352
Volatile Organic Compounds Acetone 4190 809 3180 1100 1090 2210 2190 Benzene 85.1 71.7 97.3 22.7 56.9 47.5 71.6 Chlorobenzene 50.8 52.8 56.8 14.3 14.5 33.2 33.2 Chloroform 76.5 56.4 87.4 20.3 20.1 41.8 41.5 Ethylbenzene 7.09 7.48 7.75 2.13 228 5.17 165 Isopropylbenzene 0.0 0.0 0.0 0.0 0.482 0.0 0.342 4-Methyl-2-pentanone 0.0 0.0 0.0 0.0 350 0.0 248 Methylene chloride 1260 505 1330 333 330 670 665 1,1,2,2-Tetrachloroethane 0.0 0.0 0.0 0.0 0.409 0.0 0.290 Tetrachloroethylene 0.416 0.422 0.468 0.114 0.113 0.258 0.256 Toluene 7.59 7.85 8.50 2.12 101 4.88 75.0 1,1,2-Trichloroethane 0.0 0.0 0.0 0.0 0.366 0.0 0.259 Xylenes, Total 10.8 11.4 11.9 3.22 450 7.82 324
Chlorinated Pesticides Aldrin 0.135 0.135 0.135 0.125 0.127 0.134 0.136 alpha-BHC 0.0729 0.0752 0.0758 0.0302 0.0317 0.0650 0.0658 beta-BHC 0.306 0.316 0.318 0.127 0.127 0.273 0.272 delta-BHC 0.0132 0.0134 0.0134 0.00703 0.00972 0.0124 0.0143 gamma-BHC (Lindane) 0.0241 0.0249 0.0252 0.00932 0.0121 0.0210 0.0228
(continued)

37
Table 8. (Continued) Disposal Pond Concentration (ug/L) Equalization Basin Concentration (ug/L)
Option 1 Option 1 Options 2 & 3
Options 2 & 3 Analyte Option 1 Option 2 Option 3
w/o GW w/GW w/o GW w/GW Chlorinated Pesticides (continued)
Chlordane, Techincal 0.349 0.350 0.350 0.277 0.282 0.344 0.347 4,4'-DDD 0.00108 0.00108 0.00108 0.00106 0.00332 0.00108 0.002687 o,p'-DDE (2,4) 0.000212 0.000212 0.000212 0.000212 0.000209 0.000212 0.000210 p,p'-DDE (4,4) 0.00664 0.00664 0.00665 0.00626 0.00850 0.00662 0.008207 p,p'-DDT (4,4) 0.00143 0.00143 0.00143 0.00141 0.00365 0.00143 0.00301 Dieldrin 0.00434 0.00434 0.00434 0.00405 0.00628 0.00432 0.00590 Endosulfan I 0.0662 0.0689 0.0697 0.0244 0.0260 0.0565 0.0574 Endosulfan II 0.0955 0.0984 0.0991 0.0404 0.0400 0.0857 0.0851 Endosulfan sulfate 0.0 0.0 0.0 0.0 0.00235 0.00000 0.00167 Endrin 0.00205 0.00205 0.00205 0.00185 0.00448 0.00203 0.00389 Endrin aldehyde 0.0568 0.0580 0.0583 0.0272 0.0290 0.0526 0.0536 Endrin ketone 0.0371 0.0372 0.0372 0.0319 0.0356 0.0368 0.0394 Heptachlor 0.0156 0.0156 0.0156 0.0143 0.0161 0.0155 0.0167 Heptachlor epoxide 0.0162 0.0163 0.0163 0.0140 0.0169 0.0161 0.0181 Methoxychlor 0.0464 0.0465 0.0465 0.0409 0.0442 0.0461 0.0484 Toxaphene 0.130 0.130 0.130 0.123 0.122 0.129 0.128
Dioxins and Furans 1,2,3,4,6,7,8-HPCDD 4.93E-10 4.93E-10 4.93E-10 4.93E-10 4.88E-10 4.93E-10 4.89E-10 1,2,3,4,6,7,8-HPCDF 1.82E-10 1.82E-10 1.82E-10 1.82E-10 1.79E-10 1.82E-10 1.80E-10 1,2,3,4,7,8,9-HPCDF 3.20E-11 3.20E-11 3.20E-11 3.20E-11 3.16E-11 3.20E-11 3.17E-11 1,2,3,4,7,8-HXCDD 2.55E-11 2.55E-11 2.55E-11 2.55E-11 2.52E-11 2.55E-11 2.53E-11 1,2,3,4,7,8-HXCDF 3.32E-07 3.32E-07 3.32E-07 3.32E-07 3.28E-07 3.32E-07 3.29E-07 1,2,3,6,7,8-HXCDD 3.30E-11 3.30E-11 3.30E-11 3.30E-11 3.26E-11 3.30E-11 3.27E-11 1,2,3,6,7,8-HXCDF 7.10E-12 7.10E-12 7.10E-12 7.10E-12 7.02E-12 7.10E-12 7.04E-12 1,2,3,7,8,9-HXCDD 1.31E-10 1.31E-10 1.31E-10 1.31E-10 1.30E-10 1.31E-10 1.30E-10 1,2,3,7,8,9-HXCDF 8.62E-12 8.62E-12 8.62E-12 8.62E-12 8.52E-12 8.62E-12 8.55E-12 1,2,3,7,8-PECDD 1.02E-10 1.02E-10 1.02E-10 1.02E-10 1.01E-10 1.02E-10 1.02E-10 1,2,3,7,8-PECDF 4.38E-11 4.38E-11 4.38E-11 4.36E-11 4.31E-11 4.37E-11 4.34E-11 2,3,4,6,7,8-HXCDF 1.34E-12 1.34E-12 1.34E-12 1.34E-12 1.33E-12 1.34E-12 1.33E-12 2,3,4,7,8-PECDF 8.71E-11 8.71E-11 8.71E-11 8.70E-11 8.60E-11 8.71E-11 8.64E-11 2,3,7,8-TCDD 2.30E-10 2.30E-10 2.30E-10 2.30E-10 2.27E-10 2.30E-10 2.29E-10 2,3,7,8-TCDF 1.14E-09 1.14E-09 1.14E-09 1.14E-09 1.12E-09 1.14E-09 1.13E-09 OCDD 1.58E-09 1.58E-09 1.58E-09 1.58E-09 1.56E-09 1.58E-09 1.57E-09 OCDF 1.02E-09 1.02E-09 1.02E-09 1.02E-09 1.01E-09 1.02E-09 1.02E-09 Total HPCDDS 1.60E-09 1.60E-09 1.60E-09 1.60E-09 1.59E-09 1.60E-09 1.59E-09 Total HPCDFS 2.54E-10 2.54E-10 2.54E-10 2.54E-10 2.51E-10 2.54E-10 2.52E-10 Total HXCDDS 1.91E-10 1.91E-10 1.91E-10 1.91E-10 1.89E-10 1.91E-10 1.90E-10 Total HXCDFS 5.03E-10 5.03E-10 5.03E-10 5.03E-10 4.97E-10 5.03E-10 4.99E-10 Total PECDDS 1.57E-09 1.57E-09 1.57E-09 1.56E-09 1.54E-09 1.57E-09 1.55E-09
(continued)

38
Table 8. (Concluded) Disposal Pond Concentration (ug/L) Equalization Basin Concentration (ug/L)
Option 1 Option 1 Options 2 & 3
Options 2 & 3 Analyte Option 1 Option 2 Option 3
w/o GW w/GW w/o GW w/GW Dioxins and Furans (continued)
Total PECDFS 9.63E-10 9.63E-10 9.63E-10 9.61E-10 9.50E-10 9.63E-10 9.55E-10 Total TCDDS 8.19E-10 8.19E-10 8.19E-10 8.14E-10 8.05E-10 8.19E-10 8.12E-10 Total TCDFS 1.14E-08 1.14E-08 1.14E-08 1.13E-08 1.12E-08 1.14E-08 1.13E-08
PCB Aroclors PCB(Aroclor-1016) 0.273 0.273 0.273 0.261 0.258 0.272 0.270 PCB(Aroclor-1221) 1.005 1.025 1.029 0.513 0.507 0.942 0.934 PCB(Aroclor-1232) 7.13 7.52 7.77 2.17 2.15 5.30 5.26 PCB(Aroclor-1242) 8.84 9.00 9.041 4.62 4.56 8.32 8.25 PCB(Aroclor-1248) 0.571 0.571 0.571 0.555 0.549 0.570 0.566 PCB(Aroclor-1254) 0.0171 0.0172 0.0172 0.0169 0.0273 0.0171 0.02450 PCB(Aroclor-1260) 0.000983 0.000983 0.00098 0.00098 0.00097 0.00098 0.00098 PCB Total* 0.439 0.439 0.439 0.432 0.469 0.438 0.464
*PCB Total is the sum of 19 PCB Congeners.

39
4 - CDF Designs and Operation and Management Plans for Three Placement Options Storage area requirements for mechanical dredging with hydraulic offloading were evaluated using the CDF configuration assumed in the DDAA for Alternative 1 mechanical dredging (Figure 13). Approximate cell areas were given in Table 2. Initial lift depths (calculated using the USACE SETTLE model of ADDAMS) and predicted shrinkage from desiccation and consolidation (calculated using USACE PSDDF model of ADDAMS) for hydraulic offloading are illustrated in Figures 14 to 17. Mean maximum surface elevation of dredged material is approximately 29.3 ft. Allowing for 2.8 ft ponding and 2 ft freeboard, a maximum dike height of 34 ft would be required. Cell areas may need to be adjusted slightly from those given in Table 2 to equalize the lift depths. Mean maximum surface elevation at the end of backlog dredging is approximately 16.7 ft; a 21.5 ft dike height will be required for the first stage of construction. Material depths will be the same for hydraulic offloading with or without recirculation. Comparative average material depths for mechanical dredging for mechanical and hydraulic offloading options are summarized in Table 9. Additional data relevant to design and operation of the CDF are given in Tables 10 and 11. Table 10 provides the pumping rates and durations for three placement options, and Table 11 provides the dike lengths for phased construction.
Figure 13. Approximate CDF configuration for all placement options

40
Indiana Harbor Alternative 1 Hydraulic Offloading
0
5
10
15
20
25
30
35
0 5 10 15 20 25 30
Time after First Placement (years)
Surf
ace
Elev
atio
n (ft
)
Figure 14. Cell 1 surface elevations from consolidation analysis
Indiana Harbor Alternative 1 Hydraulic Offloading
0
5
10
15
20
25
30
35
0 5 10 15 20 25 30
Time after First Placement (years)
Surf
ace
Elev
atio
n (ft
)
Figure 15. Cell 2 surface elevations from consolidation analysis

41
Indiana Harbor Alternative 1 Hydraulic Offloading
0
5
10
15
20
25
30
35
0 5 10 15 20 25 30
Time after First Placement (years)
Surf
ace
Elev
atio
n (ft
)
Figure 16. Cell 3 surface elevations from consolidation analysis
Indiana Harbor Alternative 1 Hydraulic Offloading
0
5
10
15
20
25
30
35
0 5 10 15 20 25 30
Time after First Placement (years)
Surf
ace
Elev
atio
n (ft
)
Figure 17. TSCA cell surface elevations from consolidation analysis
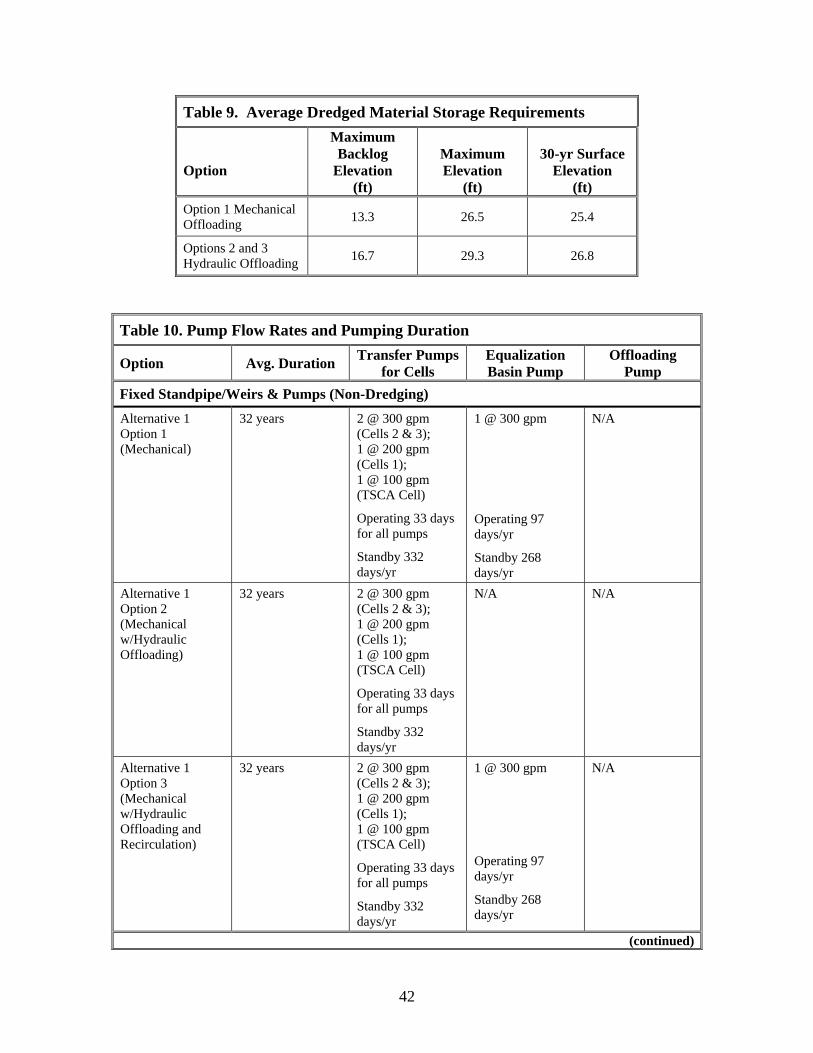
42
Table 9. Average Dredged Material Storage Requirements
Option
Maximum Backlog
Elevation (ft)
Maximum Elevation
(ft)
30-yr Surface Elevation
(ft) Option 1 Mechanical Offloading 13.3 26.5 25.4
Options 2 and 3 Hydraulic Offloading 16.7 29.3 26.8
Table 10. Pump Flow Rates and Pumping Duration
Option Avg. Duration Transfer Pumps for Cells
Equalization Basin Pump
Offloading Pump
Fixed Standpipe/Weirs & Pumps (Non-Dredging) Alternative 1 Option 1 (Mechanical)
32 years 2 @ 300 gpm (Cells 2 & 3); 1 @ 200 gpm (Cells 1); 1 @ 100 gpm (TSCA Cell)
Operating 33 days for all pumps
Standby 332 days/yr
1 @ 300 gpm
Operating 97 days/yr
Standby 268 days/yr
N/A
Alternative 1 Option 2 (Mechanical w/Hydraulic Offloading)
32 years 2 @ 300 gpm (Cells 2 & 3); 1 @ 200 gpm (Cells 1); 1 @ 100 gpm (TSCA Cell)
Operating 33 days for all pumps
Standby 332 days/yr
N/A N/A
Alternative 1 Option 3 (Mechanical w/Hydraulic Offloading and Recirculation)
32 years 2 @ 300 gpm (Cells 2 & 3); 1 @ 200 gpm (Cells 1); 1 @ 100 gpm (TSCA Cell)
Operating 33 days for all pumps
Standby 332 days/yr
1 @ 300 gpm
Operating 97 days/yr
Standby 268 days/yr
N/A
(continued)

43
Table 10. (concluded)
Alternative Avg. Duration Transfer Pumps for Cells
Equalization Basin Pump
Offloading Pump
Floating Weirs & Transfer Pumps (During Dredging) Alternative 1 Option 1 (Mechanical)
N/A N/A N/A N/A
Alternative 1 Option 2 (Mechanical w/Hydraulic Offloading)
25 years @ 56 days/yr
1 @ 2500 gpm
Operating 35 days/yr
Standby 21 days/yr
1 @ 2000 gpm
Operating 64 days/yr
Standby 37 days/yr
1@ 6000 gpm
Operating 32 days/yr
Standby 24 days/hr
Alternative 1 Option 3 (Mechanical w/Hydraulic Offloading and Recirculation)
25 years @ 56 days/yr
1 @ 5000 gpm
Operating 25 days/yr
Standby 15 days/yr
1 @ 5000 gpm
Operating 10 days/yr
Standby 6 days/yr
1@ 6000 gpm
Operating 32 days/yr
Standby 24 days/hr
Table 11. Estimated Dike Lengths for All Placement Options
Year Cell LF Year 1: Cell 1, TSCA subcell & Equalization Basin Interior walls 3790 Perimeter walls 4930 Year 2: Cells 2 & 3 Interior walls 2470 Perimeter walls 3760 Total interior walls 6260 Total perimeter walls 8690
Interior dikes divide the CDF into the respective cells. The dikes are assumed to have a 1 on 1 slope on both sides of the dike. The perimeter walls form the exterior of the CDF and are assumed to have a 3 on 1 slope on the outside face and a 1 on 1 slope on the inside face of the dike. Dikes are inset from the property perimeter for the first stage of construction. When dikes are raised, construction will be outward, with the foot of the perimeter dikes extended toward the property line rather than toward the interior of the CDF. Dike height for Stage 1 construction for Option 1, allowing for two feet of freeboard, is 15.5 ft, as specified in the alternatives analysis. Stage 1 dike height for Options 2 and 3, allowing for two feet of freeboard and a minimum of 2.8 feet of ponding, is 21.5 ft. Final required dike height for Option 1 is 28.5 ft, but dikes will be constructed to a final height of 30 ft in keeping with the DDR (USACE, Chicago 2000). Final required dike height for Options 2 and 3 is 34 ft. Further refinement of cell areas

44
and dike height may be made in the optimization analysis. The required cell areas based on present assumptions for Options 1, 2 and 3 are given in Table 12. Areas are slightly different from those given in Table 2, reflecting efforts to equalize the total lift depths between the cells.
Table 12. CDF Configuration Design Assumptions for Options 1, 2 and 3
Cell Areas for Option 1 (acres)
Areas for Options 2 and 3 (acres)
1 16.7 15.9 2 28.7 27.7 3 35.4 34.4 TSCA 12.0 11.5 Equalization 10.0 10.0
Design and Operation Summary
For the same CDF configuration and dike slopes assumed in the DDAA, a Stage 1 dike height of 15.5 ft is required for Option 1 and 21.5 ft for Options 2 and 3. Final dike heights are 30 ft and 34 ft, respectively, with the final height of the dike for Option 1 being determined by the DDR, rather than maximum lift depth. This configuration will allow for 2 ft of freeboard for all three options, and 2.8 ft of ponding for Options 2 and 3. Cell areas adjusted to equalize the lift depths are: Cell 1--15.9 acres, Cell 2--27.7 acres, Cell 3--34.4 acres, TSCA cell--11.5 acres, and equalization basin--10 acres.

45
5 - Volatilization and Particulate Emission Rates Volatilization was evaluated on a unit concentration basis in the alternatives analysis (Estes et al. 2003). Benzene, toluene, ethylbenzene, xylene (BTEX compounds) and a number of other compounds of lesser importance to the volatilization analysis were not analyzed for the sediments used as the basis for the DDAA (Estes et al. 2003). However, BTEX compounds and other compounds have been found in other IHC sediment samples cataloged by the EPA. EPA reported sediment concentrations for these additional compounds as given in Table 5 were used in this analysis to provide a more complete comparison of the placement options. Since the average contaminant concentrations of the bulk sediment and the partitioning coefficients have not been established specifically for the current Indiana Harbor sediments, comparisons of the volatilization for the three placement options are performed on a relative basis using bulk sediment chemistry data given in Table 5. Volatile Emissions
The relative flux rates for constituents of concern were calculated for representative conditions at the CDF for three placement options for mechanically dredged material, assuming representative concentrations of the organic constituents of concern in the sediments and corresponding predicted concentrations in effluent, runoff and consolidation flows based on equilibrium partitioning. These ponded water concentrations for the various options are given in Table 8. Published, conservative values of partitioning coefficients and mass transfer coefficients commonly used for risk assessment and dredged material contaminant pathway screening analysis were used for the predictions. Actual conditions may differ from those assumed for the purposes of the comparative analysis; therefore, the predictions are not intended to represent the actual magnitude of emissions expected.
Mass transfer rates differ between dry, wet and ponded surfaces. To estimate flux
rates, assumptions must be made regarding surface conditions and areas. Equalization basins were assumed to be ponded at all times. The chemistry of the water in the equalization basin would be expected to be dominated by effluent of disposal during the 4-month wastewater treatment season and by runoff and consolidation flows in the off-season. In addition, runoff from recently placed, unoxidized material would be different in character to runoff from dried, oxidized material. Concentrations in ponded areas and emissions from ponded areas and exposed dredged material surfaces were estimated based on representative steady-state conditions for hydraulic and mechanical placement without initial consideration of depletion of the volatiles in the source. As such, the estimates of emissions are somewhat high, perhaps 30 to 40% higher than would be

46
computed using unsteady, depleting concentrations of volatiles. However, the estimates are suitable for comparisons between placement options because the estimates are consistent between placement options. Corrections were made to insure that emissions in excess of the source availability by locale were restricted to the availability. The totals of the emission estimates for the various placement options ranged from 30 to 35 percent of the total quantity of volatile organics added to the CDF annually.
Table 13 summarizes the relative flux rates of each placement option for all constituents of concern with and without groundwater being stored in the equalization basin between seasonal treatment periods. The flux rates are compared with the flux rates of mechanical placement without storage of groundwater to compute the ratios. The relative flux rates in volatilization among contaminants are shown in Table 14 as percentages of the total flux of the organic contaminants of concern for the placement option. Hydraulic placement increases total volatiles losses by about 11% without recirculation and about 12% with recirculation. The principal constituents (listed in order of decreasing magnitude) contributing to volatilization are naphthalene, methylene chloride, and acenaphthene. Those constituents contributing at least 0.1% of the total organic volatile emissions are listed in order of importance in Table 15. The relative flux rates from the various sources in the disposal facility are given in Table 16. The exposed dredged material conditions are the main contributors to volatilization, comprising 84 to 95% of the emissions. The disposal pond contributes 2% to 9% of the emissions and the equalization basin produces 3% to 7%. Table 17 lists additional comparisons of the placement options. Storing groundwater in the equalization basin during the off-season adds 0.44% to the volatile emissions. Hydraulic placement increases the emissions from the disposal pond by 410%, from the equalization basin by 204%, and by about 11% overall, actually decreasing the losses from the exposed sediment by 0.3%.
If volatilization controls are needed as determined by an air risk analysis or a predicted exceedance of an emission criterion, controls must be placed on the exposed sediment due to its large contribution to the overall emissions because of its large area and exposure time. Control of the emissions from ponded water without also reducing the losses from exposed sediment would not provide significant reductions in emissions. Some volatilization control measures could provide controls for all emission locales.
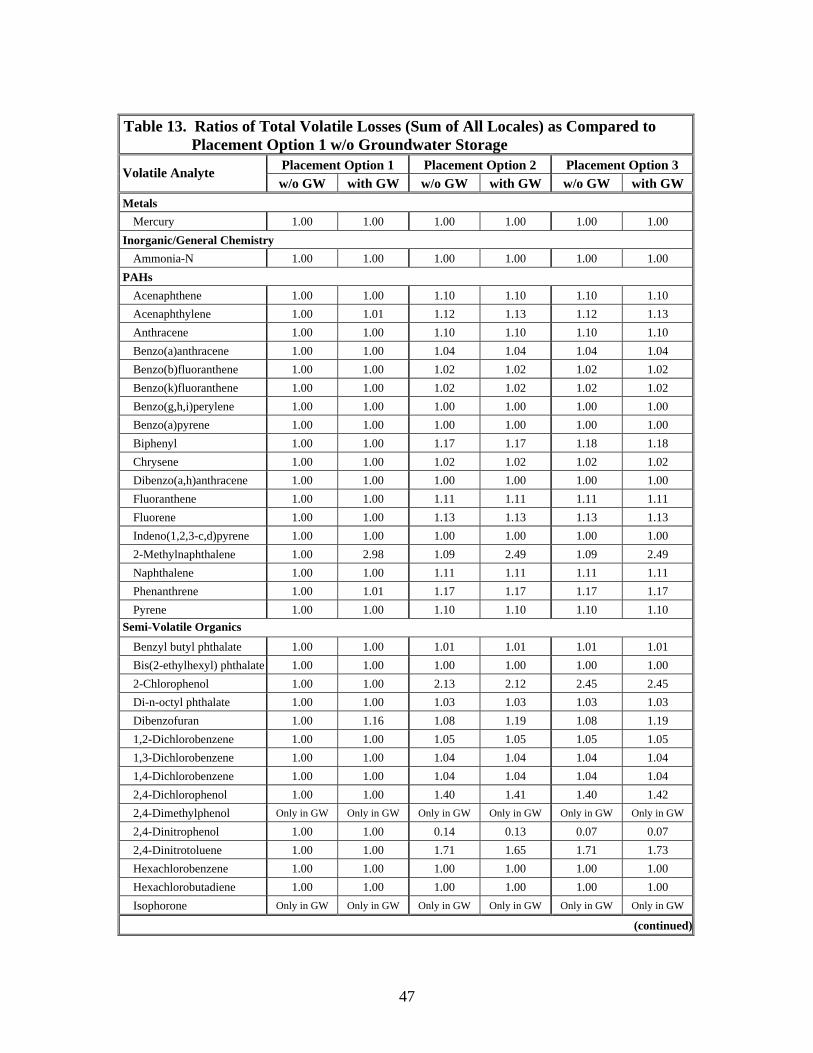
47
Table 13. Ratios of Total Volatile Losses (Sum of All Locales) as Compared to
Placement Option 1 w/o Groundwater Storage Placement Option 1 Placement Option 2 Placement Option 3 Volatile Analyte w/o GW with GW w/o GW with GW w/o GW with GW
Metals Mercury 1.00 1.00 1.00 1.00 1.00 1.00
Inorganic/General Chemistry Ammonia-N 1.00 1.00 1.00 1.00 1.00 1.00
PAHs Acenaphthene 1.00 1.00 1.10 1.10 1.10 1.10 Acenaphthylene 1.00 1.01 1.12 1.13 1.12 1.13 Anthracene 1.00 1.00 1.10 1.10 1.10 1.10 Benzo(a)anthracene 1.00 1.00 1.04 1.04 1.04 1.04 Benzo(b)fluoranthene 1.00 1.00 1.02 1.02 1.02 1.02 Benzo(k)fluoranthene 1.00 1.00 1.02 1.02 1.02 1.02 Benzo(g,h,i)perylene 1.00 1.00 1.00 1.00 1.00 1.00 Benzo(a)pyrene 1.00 1.00 1.00 1.00 1.00 1.00 Biphenyl 1.00 1.00 1.17 1.17 1.18 1.18 Chrysene 1.00 1.00 1.02 1.02 1.02 1.02 Dibenzo(a,h)anthracene 1.00 1.00 1.00 1.00 1.00 1.00 Fluoranthene 1.00 1.00 1.11 1.11 1.11 1.11 Fluorene 1.00 1.00 1.13 1.13 1.13 1.13 Indeno(1,2,3-c,d)pyrene 1.00 1.00 1.00 1.00 1.00 1.00 2-Methylnaphthalene 1.00 2.98 1.09 2.49 1.09 2.49 Naphthalene 1.00 1.00 1.11 1.11 1.11 1.11 Phenanthrene 1.00 1.01 1.17 1.17 1.17 1.17 Pyrene 1.00 1.00 1.10 1.10 1.10 1.10
Semi-Volatile Organics
Benzyl butyl phthalate 1.00 1.00 1.01 1.01 1.01 1.01 Bis(2-ethylhexyl) phthalate 1.00 1.00 1.00 1.00 1.00 1.00 2-Chlorophenol 1.00 1.00 2.13 2.12 2.45 2.45 Di-n-octyl phthalate 1.00 1.00 1.03 1.03 1.03 1.03 Dibenzofuran 1.00 1.16 1.08 1.19 1.08 1.19 1,2-Dichlorobenzene 1.00 1.00 1.05 1.05 1.05 1.05 1,3-Dichlorobenzene 1.00 1.00 1.04 1.04 1.04 1.04 1,4-Dichlorobenzene 1.00 1.00 1.04 1.04 1.04 1.04 2,4-Dichlorophenol 1.00 1.00 1.40 1.41 1.40 1.42 2,4-Dimethylphenol Only in GW Only in GW Only in GW Only in GW Only in GW Only in GW
2,4-Dinitrophenol 1.00 1.00 0.14 0.13 0.07 0.07 2,4-Dinitrotoluene 1.00 1.00 1.71 1.65 1.71 1.73 Hexachlorobenzene 1.00 1.00 1.00 1.00 1.00 1.00 Hexachlorobutadiene 1.00 1.00 1.00 1.00 1.00 1.00 Isophorone Only in GW Only in GW Only in GW Only in GW Only in GW Only in GW
(continued)
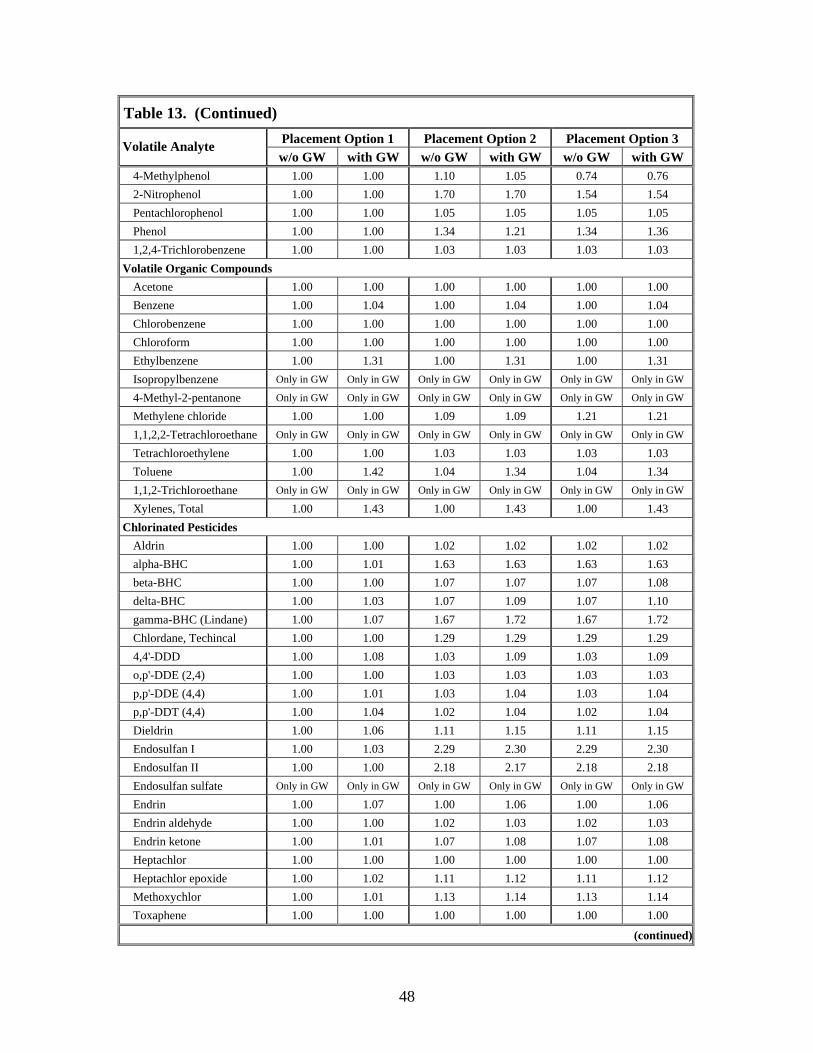
48
Table 13. (Continued) Placement Option 1 Placement Option 2 Placement Option 3 Volatile Analyte w/o GW with GW w/o GW with GW w/o GW with GW
4-Methylphenol 1.00 1.00 1.10 1.05 0.74 0.76 2-Nitrophenol 1.00 1.00 1.70 1.70 1.54 1.54 Pentachlorophenol 1.00 1.00 1.05 1.05 1.05 1.05 Phenol 1.00 1.00 1.34 1.21 1.34 1.36 1,2,4-Trichlorobenzene 1.00 1.00 1.03 1.03 1.03 1.03
Volatile Organic Compounds Acetone 1.00 1.00 1.00 1.00 1.00 1.00 Benzene 1.00 1.04 1.00 1.04 1.00 1.04 Chlorobenzene 1.00 1.00 1.00 1.00 1.00 1.00 Chloroform 1.00 1.00 1.00 1.00 1.00 1.00 Ethylbenzene 1.00 1.31 1.00 1.31 1.00 1.31 Isopropylbenzene Only in GW Only in GW Only in GW Only in GW Only in GW Only in GW
4-Methyl-2-pentanone Only in GW Only in GW Only in GW Only in GW Only in GW Only in GW
Methylene chloride 1.00 1.00 1.09 1.09 1.21 1.21 1,1,2,2-Tetrachloroethane Only in GW Only in GW Only in GW Only in GW Only in GW Only in GW
Tetrachloroethylene 1.00 1.00 1.03 1.03 1.03 1.03 Toluene 1.00 1.42 1.04 1.34 1.04 1.34 1,1,2-Trichloroethane Only in GW Only in GW Only in GW Only in GW Only in GW Only in GW
Xylenes, Total 1.00 1.43 1.00 1.43 1.00 1.43 Chlorinated Pesticides
Aldrin 1.00 1.00 1.02 1.02 1.02 1.02 alpha-BHC 1.00 1.01 1.63 1.63 1.63 1.63 beta-BHC 1.00 1.00 1.07 1.07 1.07 1.08 delta-BHC 1.00 1.03 1.07 1.09 1.07 1.10 gamma-BHC (Lindane) 1.00 1.07 1.67 1.72 1.67 1.72 Chlordane, Techincal 1.00 1.00 1.29 1.29 1.29 1.29 4,4'-DDD 1.00 1.08 1.03 1.09 1.03 1.09 o,p'-DDE (2,4) 1.00 1.00 1.03 1.03 1.03 1.03 p,p'-DDE (4,4) 1.00 1.01 1.03 1.04 1.03 1.04 p,p'-DDT (4,4) 1.00 1.04 1.02 1.04 1.02 1.04 Dieldrin 1.00 1.06 1.11 1.15 1.11 1.15 Endosulfan I 1.00 1.03 2.29 2.30 2.29 2.30 Endosulfan II 1.00 1.00 2.18 2.17 2.18 2.18 Endosulfan sulfate Only in GW Only in GW Only in GW Only in GW Only in GW Only in GW
Endrin 1.00 1.07 1.00 1.06 1.00 1.06 Endrin aldehyde 1.00 1.00 1.02 1.03 1.02 1.03 Endrin ketone 1.00 1.01 1.07 1.08 1.07 1.08 Heptachlor 1.00 1.00 1.00 1.00 1.00 1.00 Heptachlor epoxide 1.00 1.02 1.11 1.12 1.11 1.12 Methoxychlor 1.00 1.01 1.13 1.14 1.13 1.14 Toxaphene 1.00 1.00 1.00 1.00 1.00 1.00
(continued)
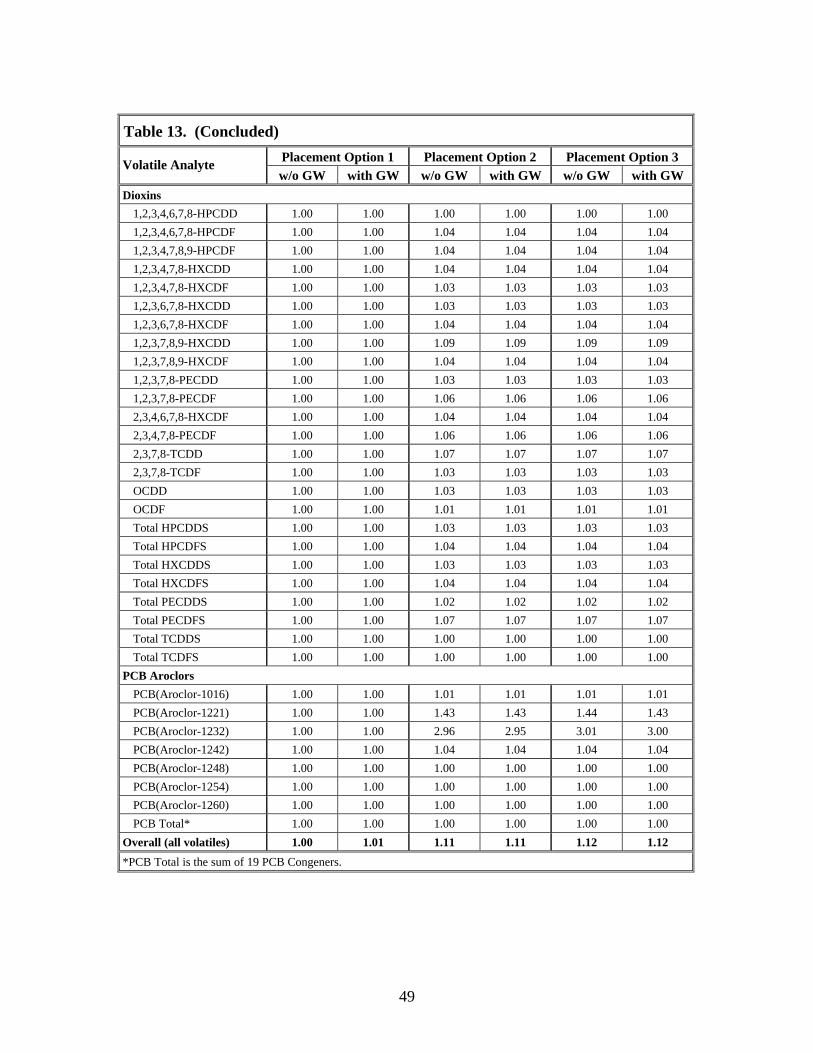
49
Table 13. (Concluded) Placement Option 1 Placement Option 2 Placement Option 3 Volatile Analyte w/o GW with GW w/o GW with GW w/o GW with GW
Dioxins 1,2,3,4,6,7,8-HPCDD 1.00 1.00 1.00 1.00 1.00 1.00 1,2,3,4,6,7,8-HPCDF 1.00 1.00 1.04 1.04 1.04 1.04 1,2,3,4,7,8,9-HPCDF 1.00 1.00 1.04 1.04 1.04 1.04 1,2,3,4,7,8-HXCDD 1.00 1.00 1.04 1.04 1.04 1.04 1,2,3,4,7,8-HXCDF 1.00 1.00 1.03 1.03 1.03 1.03 1,2,3,6,7,8-HXCDD 1.00 1.00 1.03 1.03 1.03 1.03 1,2,3,6,7,8-HXCDF 1.00 1.00 1.04 1.04 1.04 1.04 1,2,3,7,8,9-HXCDD 1.00 1.00 1.09 1.09 1.09 1.09 1,2,3,7,8,9-HXCDF 1.00 1.00 1.04 1.04 1.04 1.04 1,2,3,7,8-PECDD 1.00 1.00 1.03 1.03 1.03 1.03 1,2,3,7,8-PECDF 1.00 1.00 1.06 1.06 1.06 1.06 2,3,4,6,7,8-HXCDF 1.00 1.00 1.04 1.04 1.04 1.04 2,3,4,7,8-PECDF 1.00 1.00 1.06 1.06 1.06 1.06 2,3,7,8-TCDD 1.00 1.00 1.07 1.07 1.07 1.07 2,3,7,8-TCDF 1.00 1.00 1.03 1.03 1.03 1.03 OCDD 1.00 1.00 1.03 1.03 1.03 1.03 OCDF 1.00 1.00 1.01 1.01 1.01 1.01 Total HPCDDS 1.00 1.00 1.03 1.03 1.03 1.03 Total HPCDFS 1.00 1.00 1.04 1.04 1.04 1.04 Total HXCDDS 1.00 1.00 1.03 1.03 1.03 1.03 Total HXCDFS 1.00 1.00 1.04 1.04 1.04 1.04 Total PECDDS 1.00 1.00 1.02 1.02 1.02 1.02 Total PECDFS 1.00 1.00 1.07 1.07 1.07 1.07 Total TCDDS 1.00 1.00 1.00 1.00 1.00 1.00 Total TCDFS 1.00 1.00 1.00 1.00 1.00 1.00
PCB Aroclors PCB(Aroclor-1016) 1.00 1.00 1.01 1.01 1.01 1.01 PCB(Aroclor-1221) 1.00 1.00 1.43 1.43 1.44 1.43 PCB(Aroclor-1232) 1.00 1.00 2.96 2.95 3.01 3.00 PCB(Aroclor-1242) 1.00 1.00 1.04 1.04 1.04 1.04 PCB(Aroclor-1248) 1.00 1.00 1.00 1.00 1.00 1.00 PCB(Aroclor-1254) 1.00 1.00 1.00 1.00 1.00 1.00 PCB(Aroclor-1260) 1.00 1.00 1.00 1.00 1.00 1.00 PCB Total* 1.00 1.00 1.00 1.00 1.00 1.00
Overall (all volatiles) 1.00 1.01 1.11 1.11 1.12 1.12 *PCB Total is the sum of 19 PCB Congeners.

50
Table 14. Volatilization of Individual Compounds as a Percent of Total Volatile Organic Losses for the Placement Option
Placement Option 1 Placement Option 2 Placement Option 3 Volatile Analyte w/o GW with GW w/o GW with GW w/o GW with GW
PAHs Acenaphthene 1.47 1.45 1.44 1.46 1.44 1.43 Acenaphthylene 0.19 0.19 0.19 0.19 0.19 0.19 Anthracene 0.19 0.19 0.19 0.19 0.19 0.19 Benzo(a)anthracene 0.01 0.01 0.01 0.01 0.01 0.01 Benzo(b)fluoranthene 0.03 0.03 0.03 0.03 0.03 0.03 Benzo(k)fluoranthene 0.03 0.03 0.03 0.03 0.03 0.03 Benzo(g,h,i)perylene 0.00 0.00 0.00 0.00 0.00 0.00 Benzo(a)pyrene 0.00 0.00 0.00 0.00 0.00 0.00 Biphenyl 0.07 0.07 0.07 0.07 0.07 0.07 Chrysene 0.07 0.06 0.06 0.07 0.06 0.06 Dibenzo(a,h)anthracene 0.00 0.00 0.00 0.00 0.00 0.00 Fluoranthene 0.08 0.08 0.07 0.07 0.07 0.07 Fluorene 0.43 0.43 0.43 0.43 0.43 0.43 Indeno(1,2,3-c,d)pyrene 0.00 0.00 0.00 0.00 0.00 0.00 2-Methylnaphthalene 0.17 0.16 0.16 0.49 0.37 0.37 Naphthalene 88.41 88.44 88.02 87.88 88.10 87.64 Phenanthrene 0.42 0.44 0.44 0.42 0.44 0.44 Pyrene 0.05 0.05 0.05 0.05 0.05 0.05
Semi-Volatile Organic Compounds Benzyl butyl phthalate 0.00 0.00 0.00 0.00 0.00 0.00 Bis(2-ethylhexyl) phthalate 0.00 0.00 0.00 0.00 0.00 0.00 2-Chlorophenol 0.02 0.05 0.05 0.02 0.05 0.05 Di-n-octyl phthalate 0.00 0.00 0.00 0.00 0.00 0.00 Dibenzofuran 0.08 0.08 0.08 0.10 0.09 0.09 1,2-Dichlorobenzene 0.26 0.25 0.25 0.26 0.25 0.24 1,3-Dichlorobenzene 0.13 0.12 0.12 0.13 0.12 0.12 1,4-Dichlorobenzene 0.03 0.03 0.03 0.03 0.03 0.03 2,4-Dichlorophenol 0.02 0.02 0.02 0.02 0.02 0.02 2,4-Dimethylphenol 0.00 0.00 0.00 0.00 0.00 0.00 2,4-Dinitrophenol 0.00 0.00 0.00 0.00 0.00 0.00 2,4-Dinitrotoluene 0.00 0.00 0.00 0.00 0.00 0.00 Hexachlorobenzene 0.00 0.00 0.00 0.00 0.00 0.00 Hexachlorobutadiene 0.00 0.00 0.00 0.00 0.00 0.00 Isophorone 0.00 0.00 0.00 0.00 0.00 0.00 4-Methylphenol 0.04 0.04 0.03 0.04 0.04 0.03 2-Nitrophenol 0.30 0.46 0.41 0.29 0.45 0.41 Pentachlorophenol 0.00 0.00 0.00 0.00 0.00 0.00 Phenol 0.32 0.39 0.39 0.32 0.35 0.39 1,2,4-Trichlorobenzene 0.01 0.01 0.01 0.01 0.01 0.01
(continued)

51
Table 14. (Continued) Placement Option 1 Placement Option 2 Placement Option 3 Volatile Analyte w/o GW with GW w/o GW with GW w/o GW with GW
Volatile Organic Compounds Acetone 0.53 0.48 0.47 0.53 0.48 0.47 Benzene 0.15 0.13 0.13 0.15 0.14 0.14 Chlorobenzene 0.42 0.38 0.37 0.42 0.38 0.37 Chloroform 0.09 0.08 0.08 0.09 0.08 0.08 Ethylbenzene 0.12 0.10 0.10 0.15 0.14 0.14 Isopropylbenzene 0.00 0.00 0.00 0.00 0.00 0.00 4-Methyl-2-pentanone 0.00 0.00 0.00 0.05 0.05 0.05 Methylene chloride 5.17 5.09 5.60 5.13 5.07 5.58 1,1,2,2-Tetrachloroethane 0.00 0.00 0.00 0.00 0.00 0.00 Tetrachloroethylene 0.01 0.01 0.01 0.01 0.01 0.01 Toluene 0.18 0.16 0.16 0.25 0.21 0.21 1,1,2-Trichloroethane 0.00 0.00 0.00 0.00 0.00 0.00 Xylenes, Total 0.17 0.15 0.15 0.24 0.21 0.21
Chlorinated Pesticides Aldrin 0.01 0.00 0.00 0.01 0.00 0.00 alpha-BHC 0.00 0.00 0.00 0.00 0.00 0.00 beta-BHC 0.00 0.00 0.00 0.00 0.00 0.00 delta-BHC 0.00 0.00 0.00 0.00 0.00 0.00 gamma-BHC (Lindane) 0.00 0.00 0.00 0.00 0.00 0.00 Chlordane, Techincal 0.00 0.00 0.00 0.00 0.00 0.00 4,4'-DDD 0.00 0.00 0.00 0.00 0.00 0.00 o,p'-DDE (2,4) 0.00 0.00 0.00 0.00 0.00 0.00 p,p'-DDE (4,4) 0.00 0.00 0.00 0.00 0.00 0.00 p,p'-DDT (4,4) 0.00 0.00 0.00 0.00 0.00 0.00 Dieldrin 0.00 0.00 0.00 0.00 0.00 0.00 Endosulfan I 0.00 0.00 0.00 0.00 0.00 0.00 Endosulfan II 0.00 0.00 0.00 0.00 0.00 0.00 Endosulfan sulfate 0.00 0.00 0.00 0.00 0.00 0.00 Endrin 0.00 0.00 0.00 0.00 0.00 0.00 Endrin aldehyde 0.00 0.00 0.00 0.00 0.00 0.00 Endrin ketone 0.00 0.00 0.00 0.00 0.00 0.00 Heptachlor 0.00 0.00 0.00 0.00 0.00 0.00 Heptachlor epoxide 0.00 0.00 0.00 0.00 0.00 0.00 Methoxychlor 0.00 0.00 0.00 0.00 0.00 0.00 Toxaphene 0.02 0.02 0.02 0.02 0.02 0.02
(continued)

52
Table 14. (Concluded) Placement Option 1 Placement Option 2 Placement Option 3 Volatile Analyte w/o GW with GW w/o GW with GW w/o GW with GW
Dioxins 1,2,3,4,6,7,8-HPCDD 0.00 0.00 0.00 0.00 0.00 0.00 1,2,3,4,6,7,8-HPCDF 0.00 0.00 0.00 0.00 0.00 0.00 1,2,3,4,7,8,9-HPCDF 0.00 0.00 0.00 0.00 0.00 0.00 1,2,3,4,7,8-HXCDD 0.00 0.00 0.00 0.00 0.00 0.00 1,2,3,4,7,8-HXCDF 0.00 0.00 0.00 0.00 0.00 0.00 1,2,3,6,7,8-HXCDD 0.00 0.00 0.00 0.00 0.00 0.00 1,2,3,6,7,8-HXCDF 0.00 0.00 0.00 0.00 0.00 0.00 1,2,3,7,8,9-HXCDD 0.00 0.00 0.00 0.00 0.00 0.00 1,2,3,7,8,9-HXCDF 0.00 0.00 0.00 0.00 0.00 0.00 1,2,3,7,8-PECDD 0.00 0.00 0.00 0.00 0.00 0.00 1,2,3,7,8-PECDF 0.00 0.00 0.00 0.00 0.00 0.00 2,3,4,6,7,8-HXCDF 0.00 0.00 0.00 0.00 0.00 0.00 2,3,4,7,8-PECDF 0.00 0.00 0.00 0.00 0.00 0.00 2,3,7,8-TCDD 0.00 0.00 0.00 0.00 0.00 0.00 2,3,7,8-TCDF 0.00 0.00 0.00 0.00 0.00 0.00 OCDD 0.00 0.00 0.00 0.00 0.00 0.00 OCDF 0.00 0.00 0.00 0.00 0.00 0.00 Total HPCDDS 0.00 0.00 0.00 0.00 0.00 0.00 Total HPCDFS 0.00 0.00 0.00 0.00 0.00 0.00 Total HXCDDS 0.00 0.00 0.00 0.00 0.00 0.00 Total HXCDFS 0.00 0.00 0.00 0.00 0.00 0.00 Total PECDDS 0.00 0.00 0.00 0.00 0.00 0.00 Total PECDFS 0.00 0.00 0.00 0.00 0.00 0.00 Total TCDDS 0.00 0.00 0.00 0.00 0.00 0.00 Total TCDFS 0.00 0.00 0.00 0.00 0.00 0.00
PCB Aroclors PCB(Aroclor-1016) 0.01 0.01 0.01 0.01 0.01 0.01 PCB(Aroclor-1221) 0.00 0.00 0.00 0.00 0.00 0.00 PCB(Aroclor-1232) 0.00 0.01 0.01 0.00 0.01 0.01 PCB(Aroclor-1242) 0.23 0.21 0.21 0.23 0.21 0.21 PCB(Aroclor-1248) 0.03 0.03 0.03 0.03 0.03 0.03 PCB(Aroclor-1254) 0.00 0.00 0.00 0.00 0.00 0.00 PCB(Aroclor-1260) 0.00 0.00 0.00 0.00 0.00 0.00 PCB Total* 0.02 0.02 0.02 0.02 0.02 0.02
Overall (all volatiles) 100.00 100.00 100.00 100.00 100.00 100.00 *PCB Total is the sum of 19 PCB Congeners.

53
Table 15. Relative Magnitude of Volatile Emissions by Major Contributors (All Placement Options)
Contaminant Without GW, percent With GW, percent Naphthalene 88.3 87.9 Methylene chloride 5.29 5.26 Acenaphthene 1.45 1.44 Acetone 0.49 0.49 2-Methylnaphthalene 0.16 0.41 Fluorene 0.43 0.43 Phenanthrene 0.43 0.43 Chlorobenzene 0.39 0.39 Phenol 0.37 0.36 2-Nitrophenol 0.39 0.38 1,2-Dichlorobenzene 0.25 0.25 Toluene 0.17 0.22 Xylenes, Total 0.15 0.22 PCB(Aroclor-1242) 0.22 0.22 Acenaphthylene 0.19 0.19 Anthracene 0.19 0.19 Benzene 0.14 0.14 Ethylbenzene 0.11 0.14 1,3-Dichlorobenzene 0.12 0.12
Table 16. Relative Volatile Losses by Source Component Percent of Volatile Losses
Placement Option 1
Placement Option 2
Placement Option 3 Component
w/o GW with GW w/o GW with GW w/o GW with GW Disposal Pond 2.0 1.9 8.5 8.5 9.4 9.3 Equalization Basin 3.1 4.0 6.3 6.8 6.0 6.6 Exposed Sediment 94.9 94.1 85.2 84.7 84.6 84.0 Table 17. Additional Comparisons of Emissions
Condition Mechanical Emissions Hydraulic Emissions Percent Change by Hydraulic Off-loading
Disposal Pond 1970 10000 410 Equalization Basin 3560 7210 203 Exposed Sediment 95200 94900 -0.3 Overall 101000 121000 11

54
Particulate Emissions
Particulate emissions (losses of fugitive dust) for the various alternatives will be a function of the quantity of area and period of time that the area is present in an exposed, unvegetated, dried condition. The areas in ponded, wet drained, and dry drained conditions for the three placement alternatives are virtually identical. For the hydraulic placement options, one 30-acre cell will be in a wet drained condition (instead of a dry drained condition conducive to dust formation) about two extra months per year as compared to the mechanical placement option. These two months will reduce conditions conducive to fugitive dust creation by about 6%, 960 acre-months for mechanical placement versus 900 acre-months for hydraulic placement. (An acre-month is a unit of measure reflecting the period of time that a specific number of acres will have a surface moisture content or condition facilitating particulate transport. It is merely the product of the number of acres and the average time in months that the acreages will be in a dry drained condition.) In addition to losses from the exposed surfaces, losses can also occur from the dredged material transfer operations. Mechanical transfer operations and trucking are subject to much greater losses than hydraulic pipeline operations. The losses are specific to the design of the transfer systems. With good management, such as truck washing and appropriate loss controls, particulate emissions from the transfer operations can be minimized, and should be much less than losses from the CDF, where the area is much larger and controls more difficult to implement. Volatilization Summary
Estimates of volatilization were predicted for all three placement options with and without storage of groundwater in the equalization basin between wastewater treatment seasons. The principal constituents (listed in order of decreasing magnitude) contributing to volatilization are naphthalene, methylene chloride, and acenaphthene. The exposed dredged material conditions are the main contributors to volatilization, comprising 84 to 95% of the emissions. The disposal pond contributes 2% to 9% of the emissions and the equalization basin produces 3% to 7%. Table 17 lists additional comparisons of the placement options. Storing groundwater in the equalization basin during the off-season adds 0.44% to the volatile emissions. Hydraulic placement increases volatile losses by about 11 to 12% overall due to increased emissions from the disposal pond and the equalization basin. Losses from the disposal pond increased by 410% and from the equalization basin by 204%. Losses from the exposed sediment decreased by 0.3% with hydraulic placement. If emission controls are needed, control measures that control the losses from the exposed sediment should be selected. Certain control measures could reduce losses from all emission locales.
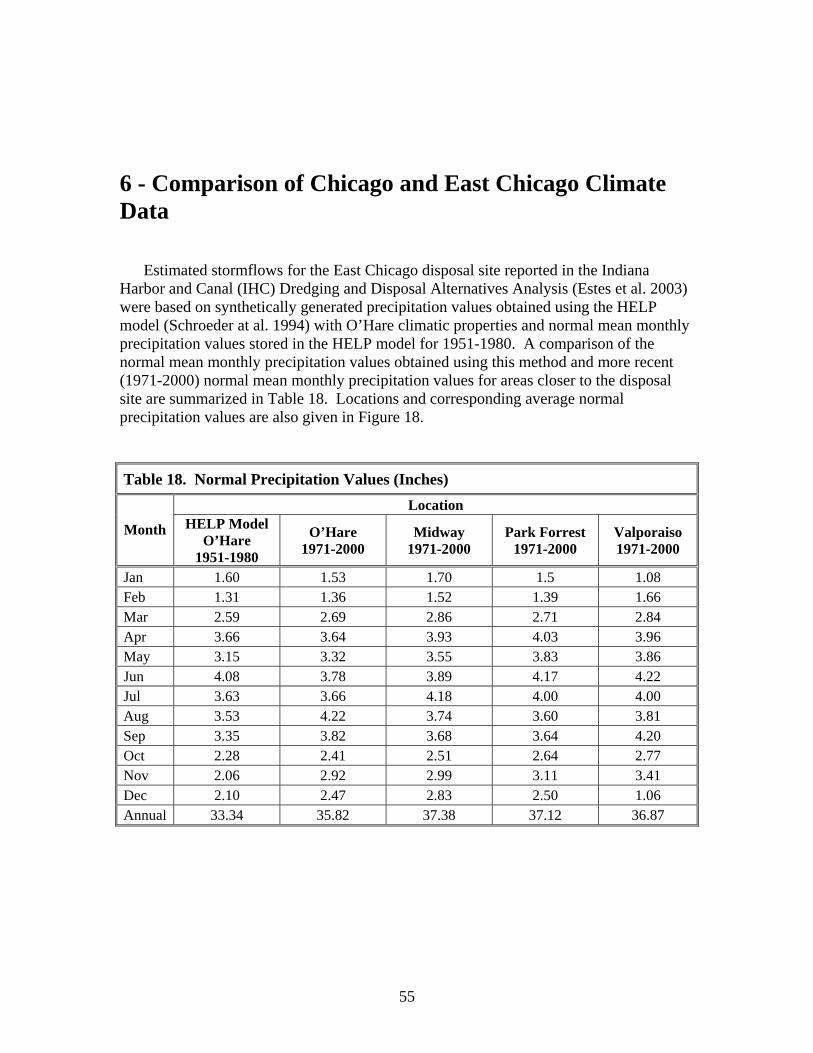
55
6 - Comparison of Chicago and East Chicago Climate Data Estimated stormflows for the East Chicago disposal site reported in the Indiana Harbor and Canal (IHC) Dredging and Disposal Alternatives Analysis (Estes et al. 2003) were based on synthetically generated precipitation values obtained using the HELP model (Schroeder at al. 1994) with O’Hare climatic properties and normal mean monthly precipitation values stored in the HELP model for 1951-1980. A comparison of the normal mean monthly precipitation values obtained using this method and more recent (1971-2000) normal mean monthly precipitation values for areas closer to the disposal site are summarized in Table 18. Locations and corresponding average normal precipitation values are also given in Figure 18. Table 18. Normal Precipitation Values (Inches)
Location
Month HELP Model O’Hare
1951-1980
O’Hare 1971-2000
Midway 1971-2000
Park Forrest 1971-2000
Valporaiso 1971-2000
Jan 1.60 1.53 1.70 1.5 1.08 Feb 1.31 1.36 1.52 1.39 1.66 Mar 2.59 2.69 2.86 2.71 2.84 Apr 3.66 3.64 3.93 4.03 3.96 May 3.15 3.32 3.55 3.83 3.86 Jun 4.08 3.78 3.89 4.17 4.22 Jul 3.63 3.66 4.18 4.00 4.00 Aug 3.53 4.22 3.74 3.60 3.81 Sep 3.35 3.82 3.68 3.64 4.20 Oct 2.28 2.41 2.51 2.64 2.77 Nov 2.06 2.92 2.99 3.11 3.41 Dec 2.10 2.47 2.83 2.50 1.06 Annual 33.34 35.82 37.38 37.12 36.87

56
Figure 18. Average normal precipitation (inches) reported for regional weather stations Of the sites with the highest annual precipitation values (Park Forrest and Midway), Park Forrest is closest to the proposed disposal site. For the same period of record, the difference in normal annual precipitation between O’Hare and Park Forrest is 1.30 inches. The difference between normal annual precipitation between the period of 1951-1980 and the period of 1971-2000 is 2.48 inches. The climate in the Northeast Illinois and Northwest Indiana has been getting wetter over the last 50 years (about 1.9 inches). Considering the difference in location and the period of record, the precipitation at the CDF site is expected to be about 3.5 inches greater annually than predicted using the original HELP model runs. In spring and early summer (April through June) Park Forrest receives about 1.5 inches more precipitation than O’Hare, and in July through August, about 0.5 inches less. In June, evaporation is roughly 1 inch greater at Park Forrest than at O’Hare. Evaporation values for the remainder of the year at the two locations are similar to each other. Evaporation roughly offsets the differences in precipitation for these two locations through the spring and summer months. Mean temperature differences between the HELP model (O’Hare during 1951-1980) and average normal values for O’Hare during 1971-2000, as compared to Park Forrest values during 1971-2000, were +0.125 and –0.05 degrees Fahrenheit, respectively.

57
Using the normal mean monthly precipitation values for Park Forrest (1971-2000), the HELP model was used to synthetically generate 100 years of daily precipitation values. The HELP model was then run to predict the average annual runoff and compared with the previous runoff predictions. The difference in the predicted average annual runoff was 4.075 inches, approximately equal to the 3.78 inches difference in normal annual precipitation between two HELP model runs. The 4.075 inches of runoff from the interior of the diked CDF area are equivalent to an increase of 12.1-12.5M gallons of wastewater to be treated annually over those reported based in the Indiana Harbor and Canal (IHC) Dredging and Disposal Alternatives Analysis report (Estes et al. 2003). Climate Summary
Previous estimates of precipitation appear to underestimate precipitation that would be expected for the disposal site, based on a re-evaluation of precipitation from several nearby weather stations. Actual runoff may be 12.1-12.5M gallons greater than initially estimated. Because flow-dependent predictions and cost estimates for Alternatives 1 and 2 from the DDAA were used for predictions and cost estimates for Options 1 and 2 in this study, the original precipitation estimates and flow rates from the DDAA were used in this study for Option 3 to maintain consistency in the predictions. Adjustments to flows reflecting the increased precipitation should be made in the design phase.

58
7 - Cost Estimates Planning level cost estimates were prepared to provide an economic basis for comparison of the dredging and disposal alternatives. These cost estimates do not represent complete project construction cost estimates; rather, they are a comparison of major cost elements that reflect differences between the alternatives. The cost estimate for Option 1 was based on the cost estimate for Alternative 1 of the DDAA (Estes et al. 2003) and the cost estimate for the 300-gpm wastewater treatment plant of Option 3. The cost estimate for Option 2 was based on a modified wastewater treatment and pumping cost estimate for Alternative 2 of the DDAA and the cost estimate of Option 3 for construction and dredging. The cost estimate for Option 3 was newly developed to account for the differences in the wastewater treatment schedule and the use of a hydraulic offloader with recirculation. As in the DDAA, costs common to all alternatives/options, such as groundwater containment measures, railroad relocation, air, groundwater and surface water sampling and testing, and dike maintenance, among others, were not included. Capital and/or operating costs were estimated for the following items for which significant differences were anticipated between the options under consideration:
Dike, liner and cap construction Dredging and placement Surface water pumping Wastewater treatment
As in the DDAA (Estes et al. 2003), cost estimates for some items were developed
from lump sum and unit prices published in Appendix H of the DDR (USACE, Chicago 2000), which included indirect costs. All DDR cost estimates were adjusted to a March 2004 basis. For the cost estimates developed in 2003, indirect costs have been added to direct costs: 12% for overhead, 10% for profit, and 1% for bond. Next, contingency was applied to every item, ranging from 15 to 50%, with the majority falling within 15 to 25%. The level of design, cost of the individual component, and level of inherent risk associated with each item determine the contingency applied. This is more fully discussed in Appendix D of the DDAA. Costs were then converted to present value, taking into account the year in which expenditures will occur and the federal discount rate of 5.875%. Additional information regarding cost estimating for federal projects can be obtained from the Office of Management and Budget (OMB 2003).

59
Major Cost Items Dike Construction
Dike construction is common to all three options, but differences in storage requirements dictate different dike heights for the three options, resulting in cost differentials between mechanical and hydraulic placement alternatives for a number of cost components. In the detailed cost breakdown, dike construction was separated into initial dike construction, dike raising, clay liner construction, and cap construction. Initial dike construction is phased over 2 years, during which time all dikes will be constructed to a specified initial height. Dikes will be raised to their final height after backlog dredging is completed, before maintenance dredging begins. Although a clay liner is required on the interior face of the exterior dikes for all alternatives, the clay liner construction included in the cost estimate reflects only the additional cost associated with the construction of the liner for the equalization basin. Differences in the liner cost for the dikes are included in the dike construction cost. (The DDR (USACE, Chicago 2000) specifies dike construction using a combination of off-site materials and materials stripped from the site.) As a simplifying assumption for the cost estimate, all clay dike construction was assumed. The validity of this assumption will be verified during the detailed design. Capping of all cells was assumed to occur approximately 2 years after the final year of dredging. Dredging
Costs to dredge the total project volume, including the cost to mobilize/demobilize each year of dredging, were based on the production rate for a commonly available mechanical dredge. The cost of dredging included the cost of unloading the barges and placement of the dredged material in the CDF. Surface Water Pumping
Pumping will be required to maintain the groundwater gradient, transfer effluent and precipitation from primary disposal cells to the equalization basin, and transfer water from the equalization basin to the WWTP and to the barge when recirculation is being employed. Groundwater pumping requirements are assumed to be the same for all options and are not included in this comparative analysis. Surface water pumping rates from the disposal cells will occur at different rates, depending upon the time of year and dredging activity. Pumping requirements will be highest during hydraulic placement and lowest during non-dredging periods. Table D2 in Appendix D summarizes the estimated pump capacity required to handle peak flows, average annual operating periods for these pumps, and capacity and operating periods for pumps required to handle average flows for non-dredging periods. Annual pumping rates and durations are the same as previously given in Table 10 to provide a uniform basis for cost estimating.

60
Separate sets of pumps were assumed to handle effluent produced during dredging and storm flows during non-dredging periods. During hydraulic offloading with recirculation, temporary transfer pumps will be utilized to transfer water from the equalization basin or the disposal cell to the barge. These pumps will be part of the contract of the dredging company and will be removed after dredging is completed each year. No effluent transfer pumps are required for the mechanical placement option. Standpipe/weir pumps will be permanently installed; they will operate during lower flow conditions of the non-dredging season, transferring storm and consolidation flows from the disposal cells to the equalization basin and from the equalization basin to the WWTP. All options will require standpipe/weir pumps; pump capacities will vary for the options due to differences in consolidation flows and WWTP capacity. Wastewater Treatment
The cost estimate for the wastewater treatment plant was developed utilizing the design flows and contaminant concentrations presented in this report. Plant capacity was based on peak flows: 300 gpm for Options 1 and 3, and 2000 gpm for Option 2. Unlike Alternative 2 in the DDAA, Option 2 would employ a plant for 2000 gpm instead of 2700 gpm because the production rate of the mechanical dredge for Option 2 is lower than that the production of the hydraulic dredge of Alternative 2 of the DDAA. O&M costs were based on average seasonal flows. The treatment plant is assumed to be operated seasonally: 23 weeks in the summer and fall for Options 1 and 3, and 16 weeks in the summer and fall for Option 2. Capital costs included pumps, accessory tanks, and chemical feed systems for a complete system. Additional details on the costing are provided in a later section of this report. Operation and Maintenance Costs The operation and maintenance activities associated with pre-closure (through capping of the CDF) were presented in Appendix H of the DDR (USACE, Chicago 2000). As for the capital costs, O&M costs were only developed for activities considered to vary significantly between alternatives. O&M costs were developed for water treatment and standpipe/weir pumps, which replace the CDF surface water collection pumping presented in the DDR. WWTP
Annual O&M costs for the wastewater treatment plant include:
Labor Process chemicals Energy Building and equipment maintenance

61
Chemical costs were developed assuming typical dosages to estimate necessary quantities. Labor costs were assumed to vary seasonally, with less labor required during non-dredging periods in most cases. Additional discussion pertaining to the O&M cost basis for the WWTP is contained in Appendix D of the DDAA (Estes et al. 2003). Pumping The annual cost of operating, inspecting, maintaining and replacing the standpipe/weir pumps was included as an O&M cost. No O&M costs will be incurred for the transfer pumps, which will be part of the dredging contract and removed annually after dredging is completed each year. Option 3 Wastewater Treatment Cost Estimate This Capital and OM&M Cost Estimate presents the estimated capital costs and annual operations, process monitoring, and maintenance (OM&M) costs associated with implementation and operations of the hydraulic placement option with recirculation (Option 3) for the Indiana Harbor and Canal (IHC) Confined Disposal Facility (CDF) Wastewater Treatment Plant (WWTP). Cost estimates presented herein are only intended for comparison with the cost estimates presented in the Final Treatment Technology Evaluation Report (FTTER)1 for mechanical dredging and for hydraulic dredging to assist in alternative selection. These cost estimates are not intended for use in future program planning and budgeting, because USACE’s Waterways Experiment Station (WES) have revised estimates of annual water volumes requiring treatment. Specifically, WES has revised its estimated annual average volume upward from 42 million gallons (used herein and in the FTTER) to 54 million gallons. Furthermore, none of these cost estimates include consideration of initial groundwater drawdown treatment requirements. Therefore, to provide estimates suitable for program planning and budgeting, new cost estimates will be needed for the larger facility that would be required to handle the increased volumes. WWTP Conceptual Design The conceptual design of any treatment system must be developed to a degree that allows for estimation of the quantities on which a cost estimate must be based. The mechanical dredging method using hydraulic placement with recirculation option is considered for the IHC CDF WWTP. Under this option, precipitation water held in an equalization basin would provide the make-up water for the hydraulic placement slurry operation. At the end of each dredge season the precipitation/recycle water, along with the dredge water, would be treated as the influent of the WWTP. The cost estimates were prepared for an annual average volume of 42 million gallons of dredge and precipitation 1 Indiana Harbor and Canal CDF Waste Water Treatment, Final Treatment Technology Evaluation Report, May 2003. MWH, Warrenville, IL.

62
water, with treatment over a four-month period at the end of each dredge season, resulting in a peak flow of 300 gallons per minute (gpm). The influent TOC and NH3 concentrations were based on WES estimated concentrations in the equalization basin make-up water under equilibrium conditions2. The wastewater treatment plant consists of the following unit processes: inlet surge tank, chemical coagulation and precipitation, clarification, biological aeration, upflow biofilter, zeolite filter, granulated activated carbon filter, and effluent holding tank for recycle. The process flow diagram is presented in “IHC CDF Wastewater Treatment Hydraulic Placement Cost Estimate, Process Flow Diagram,” dated April 26, 2004. Process design criteria were selected for the major process units and preliminary sizing calculations were performed using the selected design flow and influent concentrations, as listed in Table 19. The values of the process design criteria were chosen as representative of standard industry practice based on published references and experience with other similar projects. The process option was developed to include necessary pumps, accessory tanks, and chemical feed systems for a complete system. Area requirements for each unit were estimated, and a tentative plant layout was prepared (“IHC CDF Wastewater Treatment, Hydraulic Placement Cost Estimate, General Arrangement Sketch,” dated April 26, 2004).
Table 19. General Design Criteria for Flow from CDF to WWTP
BOD5 /TOC Ratio
BOD5 /NH3 Ratio
Nitrification F/M
CDF Discharge TSS
(mg/L) 1.8 2.7 0.2 80
Capital Costs
Capital cost estimates were prepared using the same approach, assumptions, and factors as were used for the mechanical dredging and hydraulic dredging alternatives in the FTTER. Cost Estimate Basis. In order to develop the IHC CDF WWTP estimate, MWH drew from the most recent archives (within last 2 years) of previous estimates that shared common parameters. (Conceptual cost estimates have been developed by MWH for similar projects. A typical conceptual estimate ranges in accuracy basis, scope, and cost. At the conclusion of each conceptual estimate, the costs are evaluated and archived for use as a basis for future estimates that have like parameters.) 2 Effluent Predictions and Flow for Treatment Design and Costing, Draft for Review, March 2, 2004. WES. The estimated concentrations were based on the assumption that the water would be recycled for two cells disposal. These results were confirmed in an attached document (Average number recycles single cell disposal years.doc) through email communication of MWH and USACE on March 17, 2004.
63
In addition to previous estimating data, MWH maintains a pricing database that is closely aligned with RS Means, Richardson’s, and other industry pricing sources. MWH drew upon these resources to further develop the IHC CDF WWTP estimate. Accuracy Basis. MWH has adopted the AACEI’s accuracy classification system. The AACEI defines the IHC CDF WWTP estimate as a class 4 estimate (defined below).
“Traditionally, Engineering is from 1 to 5% complete, and would comprise at a minimum the following: plant capacity, block schematics, indicated layout, process flow diagrams for main process systems, etc. Typical accuracy ranges for Class 4 estimates are from +/- 15 to 50% (sometimes higher), depending on the technological complexity of the project, appropriate reference information, and the inclusion of an appropriate contingency determination. Class 4 estimates virtually always use stochastic estimating methods such as equipment factors, Lang factors, Hand factors, Chilton factors, Peters-Timmerhaus factors, Guthrie factors, the Miller method, gross unit costs/ratios, and other parametric and modeling techniques. (Source: Cost Engineering Vol. 39/No. 4, April 1997)”
Subcontractors. For this estimate, MWH combined subcontractor’s labor and material into a cohesive estimate. In other words, the subcontractor’s resources to perform the job have been blended into the General Contractors resources and the costs have been presented in that fashion. Most General Contractors will not have the resources to self-perform this work and seek the following subcontractors:
• Electrical & Instrumentation Subcontractor • Mechanical Piping Subcontractor • Building Erector Subcontractor • Asphalt Subcontractor
Depending on market conditions, some General Contractors may seek out other subcontractors such as earthwork and concrete subcontractors to name two. The subcontractor plan would depend on the staffing load, local labor market, and capabilities of the General Contractor. Trade Labor Rates. MWH has prepared this estimate using Lake County, Indiana, prevailing wage rates for the trade labor associated with the project. The rates include the appropriate fringe benefits, taxes, and other applicable burdens for that labor. Overall Pricing Sheet. All costs presented in the detailed portion of the estimate are “raw” costs. Those raw costs are then inserted into a pricing sheet that applies the necessary mark-ups. A further description of each of the mark-ups is included in the Pricing Summary Sheet included with the estimate. The Pricing Summary Sheet is included in a pdf file titled “IHC CDF WWTP Facility Estimates Submittal 42004.pdf.”

64
Operation and Maintenance Costs OM&M cost estimates also were prepared using the same approach, assumptions, and factors as were used for the mechanical dredging and hydraulic dredging alternatives in the FTTER. Average annual treatment volumes, operating duration, flow rate and TOC and ammonia concentrations, which were the basis for the O&M costs for Options 1, 2 and 3, are given in Table 20.
Table 20. Cost Estimating Criteria for O&M Costs for the WWTP
Option/ Period
Average In Situ
Sediment Volume
(cy)
Flow Volume (gallons)
Duration (days)
Flow Rate
(gpm) TOC
(mg/L) Ammonia
(mg/L)
Option 1 (Mechanical Offloading) – 25 years plus 5 off-years; design flow of 300 gpm Summer Dredging Period 190,000 41,949,326 120 243 186 275
Option 2 (Mechanical/Hydraulic Offloading no Recycle)a - 25 years plus 5 off-years; design flow of 2000 gpm Summer Dredging Period 190,000 183,564,873 70 1814 104 172
Option 3 (Mechanical/Hydraulic Offloading with Recycle) - 25 years plus 5 off-years; design flow of 300 gpm Summer Dredging Period 190,000 41,949,326 120 243 184 503 a Design and operation is comparable to Alternative 2 (Hydraulic Dredging) which provides the basis for analysis of this option (Estes et al. 2003)
MWH developed the OM&M costs based on the conceptual treatment plant design discussed above. The estimate was summarized in a table titled “Evaluation of Treatment Alternatives, Operations and Maintenance Estimate with Parametric Capital Cost Estimate, Mechanical Dredging with Hydraulic Placement,” dated April 26, 2004. The detailed calculations of the estimates were contained in an excel file titled “WWTP Operating Cost 42mgd.xls.” The annual OM&M activities for the wastewater treatment plant include:
• Operating the plant • Maintaining the plant • Monitoring the unit processes
Annual OM&M costs were developed by first assuming typical dosages and calculating the projected chemical quantities and costs for process chemicals. The electrical costs for the major pumps and process equipment items were added. The third

65
major cost element, operating labor, was estimated both on a process-by-process basis and by assuming a shift-based staffing program for the entire WWTP as a whole. Costs were added for maintenance parts and labor based on a parametric factoring of the equipment costs for each process. Monitoring costs were added by estimating the frequency and cost of sampling and analytical work for both process control and permit compliance verification. Finally, costs were added for equipment rental, process unit cleaning, and sludge disposal. The annual OM&M costs were developed based on a total period of twenty-three weeks of operation per year, including four weeks of startup, seventeen weeks of treatment and discharge, and two weeks of shutdown. Costs associated with the remainder of the year, while the WWTP is idle, will consist primarily of brief periodic operator visits to check on facility status and heating for freeze protection; these costs are considered negligible. Present Worth Analysis
Estimated costs for individual project components were converted to present value for comparison of the alternatives. The discount rate is established by the Office of Management and Budget for federal projects and is presently at 5 7/8%. The present value formula is:
( ) ( ) ( ) ( )nn
iV
iV
iV
iVPV
+++
++
++
+=
1.....
111 33
22
11
where i = federal discount rate, % n = the period of consideration, years Vi = costs incurred in year i, constant 2004 $
Table 21 summarizes the results of the present worth analysis. Option 3, Mechanical Dredging with Hydraulic Offloading and Recirculation, is the least cost option with a present value of $75,741,000 with contingency. Option 1 is the next least cost option with a present value of $77,451,000, and Option 2 is the highest cost option with a present value of $88,230,000.

66
Table 21. Present Value Comparison with Contingency 1
Parameter
Option 1: Mechanical with
Mechanical Offloading
(000s of dollars)
Option 2: Mechanical with
Hydraulic Offloading
(000s of dollars)
Option 3: Mechanical with
Hydraulic Offloading
and Recirculation (000s of dollars)
Construction and Dredging Activities Year 1, cell construction $6,011 $9,103 $9,103Year 2, cell construction 2 $4,094 $6,215 $6,215Clay liner for equalization basin $904 $904 $904
Standpipes/weirs $220 $220 $220Pumps in standpipes $56 $89 $89Raise dike heights $6,760 $5,717 $5,717Wastewater treatment plant
(WWTP) $4,283 $11,392 $4,283
Dredging (including placement in CDF) $41,890 $29,923 $29,923
Pumps during dredging $5,371 $5,371Cap $2,642 $2,642 $2,642Total Construction and Dredging Activities $66,860 $71,576 $64,466
Operations and Maintenance Activities O&M of WWTP $10,458 $16,380 $10,946O&M for pumps in standpipes $132 $274 $329Total Operations and Maintenance Activities $10,591 $16,654 $11,274
Comparison Total (000s) $77,451 $88,230 $75,741
1 A contingency, ranging from 15 to 50% with the majority within the 15 to 25% range, was applied at each item level. The contingency assignment was based on the level of design detail, inherent risk associated with each item and the anticipated cost growth due to factors not yet identified at this time. 2 Final dike crest width is assumed to be 20 ft for hydraulic offloading options.
Costs Summary
The least costly placement option is hydraulic offloading with recirculation of CDF water from runoff, consolidation and dewatering. This option is about 2% less costly than mechanical dredging and placement and about 15% less costly than hydraulic placement without recirculation.

67
8 – Summary
This report provides a comparison of three placement options for mechanically dredged material based on cost and contaminant losses by volatilization and fugitive dust emissions. An option of storing contaminated groundwater in the equalization basin for treatment was also examined for impacts on volatile losses. Additionally, a review of the climatic data used in the DDAA was conducted to verify its appropriateness for the Indiana Harbor CDF.
The cost estimates from the DDAA were updated in time and operating assumptions
for the cost comparisons presented in this report. Unlike the operating conditions used in the DDAA, treatment is assumed to operate seasonally during and/or immediately following the disposal project for all three placement options, saving about 6% of the cost. The least costly placement option is hydraulic offloading with recirculation of CDF water from runoff, consolidation and dewatering. This option is about 2% less costly than mechanical dredging and placement and about 15% less costly than hydraulic placement without recirculation.
The volatile losses are lowest for the mechanical placement option and greatest for
the hydraulic placement option with recirculation. Hydraulic placement increases total volatiles losses by about 11% without recirculation and about 12% with recirculation. The losses are primarily from losses of naphthalene, methylene chloride, and acenaphthene, which account for about 95% of the volatile emissions. Storing contaminated groundwater in the equalization basin between treatment seasons would increase the volatile losses from the CDF by about 0.44%. If emission controls are needed as determined from an air risk analysis or a predicted exceedance of an emission criterion, control measures that control the losses from the exposed sediment should be selected because emissions from exposed dredged material comprise 84 to 95% of the emissions. Certain control measures could reduce losses from all emission locales.
Particulate emissions (losses of fugitive dust) for the various alternatives will be a
function of the area present in an exposed, unvegetated, dried condition. The areas in ponded, wet drained, and dry drained conditions for the three placement alternatives are virtually identical. For the hydraulic placement options, one 30-acre cell will be in a wet drained condition about two extra months per year as compared to the mechanical placement option. These two months will reduce conditions conducive to fugitive dust creation by about 6%, 960 acre-months for mechanical placement versus 900 acre-months for hydraulic placement.
Estimated runoff for the East Chicago disposal site reported in the Indiana Harbor and
Canal (IHC) Dredging and Disposal Alternatives Analysis (Estes et al. 2003) were based

68
on synthetically generated precipitation values obtained using the HELP model (Schroeder at al. 1994) with O’Hare climatic properties and normal mean monthly precipitation values stored in the HELP model for 1951-1980. These data were compared with more recent (1971-2000) normal mean monthly precipitation values for areas closer to the disposal site. For the same period of record, the difference in normal annual precipitation between O’Hare and Park Forrest is 1.30 inches. The difference between normal annual precipitation between the period of 1951-1980 and the period of 1971-2000 is 2.48 inches. The climate in the Northeast Illinois and Northwest Indiana has been getting wetter over the last 50 years (about 1.9 inches in annual precipitation). Considering the difference in location and the period of record, the precipitation at the CDF site is expected to be about 3.5 inches greater annually than predicted using the original HELP model runs.
The HELP model was run to predict the new average annual runoff for comparison
with the previous runoff predictions. The new predicted average annual runoff was 4.075 inches greater. This increase in runoff from the interior of the diked CDF area is equivalent to an increase of 12.1-12.5M gallons of wastewater to be treated annually over those reported based in the Indiana Harbor and Canal (IHC) Dredging and Disposal Alternatives Analysis report (Estes et al. 2003). This corresponds to a 30% increase in average annual runoff, from 42 million gallons to 54 million gallons.

69
References Estes, T.J., Schroeder, P.R., Loikets, W.R., Taylor, E.R., Agrawal, V., Caine, C., and Gallas, R. 2003. "Indiana Harbor and Canal (IHC) Dredging and Disposal Alternatives Analysis: Evaluation of Relative Disposal Requirements, Emissions and Costs for Mechanical and Hydraulic Dredging Alternatives," ERDC/EL Special Report-03-xx, U.S. Army Engineer Research and Development Center, Vicksburg, MS. Hayes, D. F., and Schroeder, P. R. 1992. "Documentation of the SETTLE Module for ADDAMS: Design of Confined Disposal Facilities for Solids Retention and Initial Storage," Technical Note EEDP-06-18, U.S. Army Engineer Waterways Experiment Station, Vicksburg, MS. Environmental Laboratory. 1987. "Disposal Alternatives for PCB-Contaminated Sediments from Indiana Harbor, Indiana, Volume I: Main Report," Miscellaneous Paper EL-87-9, U.S. Army Engineer Waterways Experiment Station, Vicksburg, MS. OMB. 2003. “Guidelines and Discount Rates for Benefit-Cost Analysis of Federal Programs”, Office of Management and Budget, www.whitehouse.gov/omb/circulars/a094/a094.html#8. Schroeder, P. R., Dozier, T. S., Zappi, P. A., McEnroe, B. M., Sjostrom, J. W., and Peyton, R. L. 1994. "The Hydrologic Evaluation of Landfill Performance (HELP) Model: Engineering Documentation for Version 3," EPA/600/R-94/168b, U.S. Environmental Protection Agency, Cincinnati, OH. USACE, Chicago. 2000. “Design Documentation Report: Indiana Harbor and Canal Maintenance Dredging and Disposal Activities,” U.S. Army Engineer District, Chicago, IL.