indian tourists’ motivation, perception, and satisfaction of
TRANSCRIPT

APPROVED: Lisa Kennon, Major Professor Christy Crutsinger, Minor Professor Bharath Josiam, Committee Member Daniel Spears, Committee Member Lea Dopson, Chair of the Division of
Hospitality Management Judith Forney, Dean of the School of
Merchandising and Hospitality Management
Michael Monticino, Interim Dean of the Robert B. Toulouse School of Graduate Studies
INDIAN TOURISTS’ MOTIVATION, PERCEPTION, AND SATISFACTION
OF BANGKOK, THAILAND
Raktida Siri, B.A.
Thesis Prepared for the Degree of
MASTER OF SCIENCE
UNIVERSITY OF NORTH TEXAS
May 2009

Siri, Raktida. Indian tourists’ motivation, perception, and satisfaction of Bangkok,
Thailand. Master of Science (Hospitality Management), May 2009, 120 pp., 27 tables, 1
figure, references, 112 titles.
The purposes of the study were to: 1) identify Indian tourists’ demographics and
travel patterns; 2) examine Indian tourists’ motivation to take the Bangkok area trip; 3)
examine the level of importance of information sources; 4) identify the level of
satisfaction of Indian tourists on their travel experience on the Bangkok area attributes;
and 5) examine the intention to return and willingness to recommend the Bangkok area
and Thailand. The findings showed that Indian tourists were motivated to visit the
Bangkok area by both push and pull factors. Family and/or friends and the Internet were
considered as important sources in trip decision making. Indian tourists were generally
satisfied with the Bangkok area’s attributes. They also showed the desire to revisit and
recommend Bangkok and Thailand as travel destinations.

ii
Copyright 2009
by
Raktida Siri
iii
ACKNOWLEDGMENTS
This thesis would not be possible without the generous help and consistent
support of my thesis advisor, Dr. Lisa Kennon, and committee members, Drs. Bharath
Josiam, Daniel Spears, and Christy Crutsinger. I would like to express my appreciation
for their valuable insights, encouragement, and thoughtful discussions. I sincerely
believe that this thesis has not only made a contribution to the field of hospitality and
tourism management, but also helped shaping me to become a better analytical thinker
and a researcher. I would like to express my gratitude to Dr. Lea Dopson, the chair of
the Hospitality Management department for giving me an opportunity to work with her. I
am thankful for her support and encouragement throughout my years at UNT.
I would like to also thank all my teachers at Sacred Heart School and Montfort
College as well as my professors at Richland College and Chiang Mai University for
giving me invaluable knowledge. Without them, I would not have completed this thesis.
I would like to thank Flight Lieutenant Chaturongkapol Sodmanee, Deputy
General Manager of the Suvarnabhumi Airport, for allowing me to conduct a three-week
survey. I would like to express my deep gratefulness to all Thai immigration police
officers for assisting me throughout the process at the airport with special thanks to
Officer Siriluk Poonsiri, who is not just an immigration police officer but my dear cousin,
who took good care of me during my stay in Bangkok.
Finally, I would like to thank my parents, Somboon and Boonluen Siri, my
brother, Attapon Siri, and my husband, Santi Phithakkitnukoon for their sacrifice,
perseverance, support, understanding, and unconditional love. They have always been
my source of strength at times of difficulties.

iv
TABLE OF CONTENTS
Page
ACKNOWLEDGMENTS………………………………..………………………………………iii
Chapter
1. INTRODUCTION…………………………………………………………….……….1
Rationale
Purpose of the Study
Research Questions
Pre-purchase Stage
Post-purchase Stage
List of Definitions
Limitation
Research Framework
2. LITERATURE REVIEW…………………………………………………………..10
Pre-purchase Stage
Demographics, Past Experiences, Motivations
Information Sources
Literatures in Destination Image
Purchase Stage
City Tourism
Travel Destination Attributes
Thailand Characteristics

v
Post-purchase Stage
Service Quality
Tourist Satisfaction
Revisitation/Recommendation
3. METHODOLOGY…………………………………………………………………...32
Sample and Data Collection
Research Questions
Pre-purchase Stage
Post-purchase Stage
Instrument Design
Pre-purchase Stage
Post-purchase Stage
Questionnaire Content
Data Analysis
Descriptive Analysis
Analysis of Variance
Factor Analysis
4. RESULTS…………………………………………………………………………....39
Pre-purchase Stage
Post-purchase Stage
5. DISCUSSION AND IMPLICATIONS……………...…………….………………..68
Discussion
Pre-purchase Stage

vi
Post-purchase Stage
Implications
6. LIMITATIONS AND RECOMMENDATIONS FOR FUTURE STUDY………...85
Appendices……………….…………………………………………………………………….88
APPENDIX A: Travel Destination Attributes
APPENDIX B: Survey Instrument
REFERENCES…….………………..………………………………………………………..111
1
CHAPTER 1
INTRODUCTION
Consumer satisfaction is a key to a business’s success. It indicates the positive
emotion and experience of consumers toward businesses. Satisfied consumers also
have a propensity to repurchase and recommend products to their families and friends.
To achieve consumers’ satisfaction, businesses must understand consumers’ needs to
be able to provide their products and services that meet or exceed consumers’
expectations.
One of the fastest growing segments in the tourism industry is city tourism
(Pakaleva-Shapira, 2007). Destination marketers make extensive efforts in marketing
the city and retaining tourists to maintain their position in the marketplace. The success
of destination marketing lies in their ability to compete, brand a city, understand visitor
perceptions and satisfaction, provide value, and manage the total visitor experience
(Tasci, Gartner, & Cavusgil, 2007; WTO, 2005).
The study of destination image reveals tourists’ perception of travel destinations.
Therefore, it is critical to study the destination image in order to address the tourists’
expectations and satisfaction to determine the strengths and weaknesses of the
destination, which later will be used to improve the destination’s attributes, and develop
marketing strategies to compete with other businesses (Pakaleva-Shapira, 2007).
Thailand is a well known international travel destination due to its long history,
rich culture, beautiful natural resources, and the hospitality of Thai people (Meng,
Tepanon, & Uysal, 2006). International tourists around the world visit Thailand all year
round. Among travelers from South Asia, Indian tourists are the most prevalent in

2
Thailand (Tourism Authority of Thailand, 2007). Not only is the Indian outbound traveler
a substantial market (Market Research Division of Government of India, 2007), but
there is also an increasing number of Indian middle class travelers who have more
purchasing power (ITB Berlin, 2007).
This Indian outbound segment is a business opportunity for destination
marketers to increase the market share, since there is a trend of increasing the Indian
market that already has demand to travel and purchasing power to spend for the trips.
To take advantage of increasing business opportunity, hospitality professionals need to
study Indian travelers. However, there is no research reported on the Indian travel
market. This study, therefore, aims to examine Indian tourists regarding their travel
experience within the Bangkok area of Thailand to gain a better understanding of Indian
tourists’ behavior.
Rationale
Satisfied consumers bring success to the businesses. They are likely to
repurchase and recommend products to their families and friends. Therefore,
understanding satisfied consumers’ needs is critical. Among the travel products, city
tourism is one of the fastest growing (Pakaleva-Shapira, 2007). The extensive efforts
have been made in marketing the city and retaining tourists to maintain the position in
the marketplace by the destination marketers. The ability to compete, brand a city,
understand visitor perceptions and satisfaction, provide value, and manage the total
visitor experience reflect the success of destination marketing (Tasci et al., 2007; WTO,
2005).

3
Tourism destination image has been of particular interest to the academic
researcher and industry practitioner. Destination image has been studied since the
1970’s, with greater focus in the 1990’s (Gallarza et al., 2002; Tasci et al., 2007). The
study on destination image reveals tourists’ perceptions of travel destinations. It affects
pre-visit, during-visit, and post-visit behavior of tourists on selection of travel destination
preference, satisfaction, and intention to return (Tasci & Gartner, 2007). Therefore, a
destination image study provides destination marketers with information regarding the
tourists’ expectations and satisfaction to see the strengths and weaknesses of the
destination, which later will be used to improve the destination’s attributes, develop
relevant marketing strategies, and compete with other businesses (Pakaleva-Shapira,
2007).
Thailand is a well known international travel destination. In 1991, the ancient
cities in Thailand, Sukhothai and Ayutthaya, were declared World Heritage sites by the
United Nations Educational, Scientific, and Cultural Organization (UNESCO). Since
then they have become attractive to international and domestic tourists (Peleggi, 1996).
In addition to its well known historical attractions, Thailand also has an excellent
reputation in world-class accommodations, especially the beach resorts in Phuket,
Samui, Krabi, Pattaya, and Hua Hin. Tourists enjoy a wide range of outdoor activities
such as canoeing, snorkeling, scuba diving, yachting, hiking, and golfing. Undoubtedly,
filmmakers have chosen beaches in Thailand as the locations for film shootings such as
The Beach and The Man with the Golden Gun. Bangkok is the capital city of Thailand.
The must-see tourist attractions in Bangkok are the Temple of the Emerald Buddha, the
Temple of Reclining Buddha, and the Temple of Dawn. Thailand also markets itself as a
4
shopping paradise. The Tourism Authority of Thailand launched the Amazing Thailand
Grand Sales campaign in 2005 to create a shopping paradise image of the country
(Meng et al., 2006).
The World Tourism Organization (WTO) (2007) reveals that Thailand has strong
tourism growth potential. The country had a 20% increase of international arrivals and
ranked third in Asia and the Pacific region to receive the high market share (US$ 12,423
million) after China (US$ 33,949 million) and Australia (US$ 17,840 million) in 2006.
Bergheim (2005) reveals the top five Gross Domestic Product (GDP) growth
rates from 2006 to 2020, with India ranked as the highest growth center, followed by
Malaysia, China, Thailand, and Turkey. India is one of the biggest potential outbound
markets (expresshospitality.com, 2001). The statistic from the India Bureau of
Immigration also shows that Indian outbound travelers form a lucrative market. Every
year Indians travel to foreign countries in a large number, which has increased
dramatically, reported at 6.21 million Indian outbound visits in 2004, 7.18 million in
2005, and 8.34 million in 2006 (Market Research Division of Government of India,
2007). Due to the country’s economic growth, there are more middle class Indians who
have more purchasing power than ever before. These Indian middle class consumers
are well educated and knowledgeable in English; therefore traveling to foreign countries
is more feasible (ITB Berlin, 2007).
The Police Department of the Thai Immigration Bureau shows that Indian
international arrivals increased by 15.89% or 443,528 arrivals in 2007, up from 382,702
arrivals in 2006. The majority of arrivals are by air (420,968 out of 443,528). Indian
travelers spend an average of six days during their stay in Thailand. Indian tourists often

5
chose Thailand as one of their preferred travel destinations because of the shopping.
Thai and Indian governments cooperated in adding more flights between the countries
with the goal to increase the number of seats to 10,000 per week within three years,
resulting in more flights to Bangkok from Bangalore in 2006, and from Kolkata, and
Hyderabad in 2007 (Tourism Authority of Thailand, 2007).
This growth is a business opportunity for destination marketers to increase the
market share, since there is a trend of increasing the Indian market that already has
shown demand for travel and increased purchasing power to spend for the trips. Of the
countries making up South Asia, Thailand has the greatest share of Indian travelers. To
capitalize on this business opportunity, hospitality professionals need to study Indian
travelers’ motivations, perceptions, and satisfaction. However, there is no current
research reported on the Indian travel market. This study, therefore, examined Indian
tourists regarding their travel experience with the Bangkok area in Thailand to gain
better understanding of Indian tourists’ behavior.
Purpose of the Study
The purposes of the study were to: 1) identify Indian tourists’ demographics and
travel patterns; 2) examine Indian tourists’ motivation to take the Bangkok area trip; 3)
examine the level of importance of information sources; 4) identify the level of
satisfaction of Indian tourists on their travel experience on the Bangkok area attributes;
and 5) examine the intention to return and willingness to recommend the Bangkok area
and Thailand.
6
Research Questions
Pre-purchase: demographics, past experiences, motivations, and information sources
Demographics and past experiences
1. What are the demographic characteristics and travel patterns of Indian tourists?
Motivations
2. What are the top rankings of Indian tourists’ motivation to take the Bangkok area
trip?
3. What are the dimensions of motivation that influence Indian tourists in making the
decision to visit the Bangkok area?
Information sources
4. What are the rankings of importance of information sources?
Post-purchase: satisfaction, intention to return, and willingness to recommend
Satisfaction
5. What are the rankings of Indian tourists’ satisfaction on the Bangkok area’s
attributes?
6. What are the satisfaction levels of Indian tourists on each component of Bangkok
area’s attributes?
7. What are the dimensions of each component of the Bangkok area’s attributes?
8. What do Indian tourists enjoy, dislike, and suggest about the Bangkok area trip?
9. What are the differences between package-tour Indian tourists (PKIT) and
independent Indian tourists (INIT) concerning: importance level of information
sources and satisfaction level on the Bangkok area attributes?
7
10. What are the differences between first-time Indian tourists (FTIT) and repeat
Indian tourists (RPIT) concerning: importance level of information sources and
satisfaction level on the Bangkok area attributes?
Intention to return and willingness to recommend
11. What are the Indian tourists’ intention to return and willingness to recommend the
Bangkok area and Thailand?
List of Definitions
Travel motivation. Components of the push and pull factor. Push factors are the
psychological needs that motivate tourists to travel. Pull factors are unique attributes of
the travel destination that motivate the tourists to visit (Josiam, Kinley, and Kim, 2005).
All inclusive package tour. As defined by Morrison (1989), “a trip planned and
paid for a single price in advance, which covers commercial transportation and
accommodation, meals and sightseeing, and sometimes with an escort or guide” (Wong
& Kwong, 2004, p. 581).
Image. “The sum of beliefs, ideas, and impressions that people have of a place
or destination” (Baloglu & Brinberg, 1997, p. 11; Tasci at al., 2007).
Destination image formation. A process of forming an image from two sources:
information sources (primary: previous experience and secondary: induced, organic,
autonomous) and personal sources (motivations, socio-demographic characteristics:
gender, age, level of education) (Baloglu & McCleary, 1999).
Image attributes. The cognitive component of the destination, such as the
tangible aspects of the destination (i.e., nature) or intangible of the destination (i.e.,
friendliness of the local people) (Tasci at al., 2007).

8
Bangkok area. The area of study including: Bangkok, Pattaya (the nearest beach
destination to city of Bangkok), and Ayuttaya (the ancient city).
City tourism. Travel type that uses the city as a gateway to the surrounding
region including: business travelers, conference/exhibition delegates, short-break
holiday-makers, day trippers, visitors to friends/relatives, long holiday-makers on a tour
or stopping off for a short visit, cruise travelers, and long holiday-makers (Law, 2002).
Limitation
This study was limited to studying the Indian tourists who departed Thailand only
at the Suvarnabhumi International Airport during July 24 – August 14, 2008.
Research Framework
Figure 1. Research framework.1 1From “Destination image formation,” by Baloglu and McCleary, 1999; “Consumer purchase decision making process,” by Engel, Blackwell, and Miniard, 1995; and “Expectancy Disconfirmation,” by Oliver, 1980, cited from Engel et al., 1995.
Stimulus Factors -Information Sources -Past Experiences
Personal Factors - Demographics - Motivations
Image (Expectation)
Actual Experience
Satisfaction/Dissatisfaction Intention to return Willingness to recommend
Pre-purchase Purchase Post-purchase

9
Research framework was constructed based on three theories: 1) destination
image formation (Baloglu and McCleary, 1999); 2) consumer purchase decision making
process (Engel, Blackwell, and Miniard, 1995); and 3) expectancy disconfirmation
(Engel et al., 1995). During pre-purchase stage, destination image was formed by
personal factors (demographics and motivations) and stimulus factors (information
sources and past experiences). Tourists created the image or had perception of the
travel destination because of these factors. When they were on their trips, they
experienced several attributes of the travel destinations such as hotels, restaurants,
shopping outlets, airports, etc. They then compared their expectations to the destination
with their actual experiences during the purchase stage. If the actual experiences met or
exceeded the expectation, the tourists would be satisfied, or vise versa. Satisfied
tourists were likely to return and willing to recommend the travel destinations in the
post-purchase stage.
This chapter introduces the needs of the study, objectives of the study, research
questions, list of definitions, limitation, and research framework. Chapter 2 reviews the
related works on the tourist’s purchase decision making process. Chapter 3 focuses on
the research methodology. Chapter 4 reports the results of the study. Chapter 5
discusses the findings and implications. Finally, chapter 6 describes the limitations of
the study and the recommendations for future study.

10
CHAPTER 2
LITERATURE REVIEW The review of literature describes the concepts of destination image formation,
city tourism, travel destination attributes, Thailand characteristics, service quality, tourist
satisfaction, and revisit/recommendation. There are three sections in this chapter: pre-
purchase, purchase, and post-purchase stage.
Pre-purchase Stage
This section illustrates the pre-purchase stage of how tourists form the
destination image by several factors. These factors are: demographics, past
experiences, motivations, and information sources. Furthermore, this section reviews
the related works on different destination image approaches and perspectives.
Demographics, Past Experiences, and Motivations
Tourism destination image has been described by both academic researchers
and industry practitioners since the 1970’s, with most in the 1990’s (Gallarza et al.,
2002; Tasci et al., 2007). Destination image studies benefit the area of destination
marketing by helping with decision-making for planning, development, positioning, and
promotion. Image has a strong impact on consumer behavior (Tasci at al., 2007).
Numerous researchers agree that image is formed from two major sources,
which are stimulus factors and personal factors. Stimulus factors consist of external
stimuli (information sources), physical objects, and previous experiences. Personal
factors are social (age, education, marital status, and others) and psychological
characteristics of the perceiver (values, motivations, and personality) (Baloglu &
McCleary, 1999).
11
Hanqin and Lam (1999) studied motivations (push and pull factors) of mainland
Chinese visitors on their Hong Kong visits. The study explored several motivations on
push and pull factors, such as the following: push factors include seeing something
different, increasing knowledge about the foreign destination, being with family, etc.;
and pull factors include international cosmopolitan city, convenience of transport,
shopping paradise, etc.
Social class is one factor impacting consumer behavior that can be determined
by gender, education, race, ethnicity, income, occupation, etc. (Engel at al., 1995;
Hawkins, Best, & Coney, 1995).
Ng, Lee, and Soutar (2007) studied cultural distance and intention to visit travel
destinations of Australian travelers. The study found that the more geographical and
cultural distance from travelers’ home country, the less likely they would visit. Nicolau
and Más (2006) found geographical distance and prices were moderately influenced by
destination preference.
Beerli and Martín (2004) proposed a model of the formation of destination image.
Tourists formed the destination image from information sources and personal factors.
Information sources consisted of primary (previous experience and intensity of visit) and
secondary sources (induced: ads or articles promoted by that destination via mass
media, tour operators, or celebrities; organic: friends, relatives; and autonomous: mass
media, news, or film). Personal factors consisted of motivations, vacation experience,
and socio-demographic characteristics (gender, age, level of education, etc.).
Sönmez and Sirakaya (2002) studied Turkey’s image from American travelers’
perspective. They found several factors that influenced the likelihood of traveling were

12
overall appeal, safe and hospitable environment, general mood and vacation
atmosphere, travel experience, relaxing effect, local attractions and hospitality,
authenticity of experience, social and personal communication channels, comfort/safety,
and tourist facilitation. Americans highly valued social and personal information sources
(friends, colleagues) in developing a trip to Turkey. However, the top information
sources were magazine articles about Turkey, newspaper articles, television and radio
news, and friends and family members. The least used sources used were the Turkish
embassy or consulate and social organizations.
Vogt and Andereck (2003) studied the influences of previous experience and
length of stay on destination image’s formation by visitors. They found that first-time
vacationers formed a destination image based on various information channels during
an information searching stage, whereas the repeat vacationers relied on their past
experiences, and they may or may not have exposed themselves to new information.
The study also found that the level of knowledge of the destination of the first-time
visitors, especially with a length of stay eight or more days, had increased higher than
repeat visitors.
Martín and Rodríguez del Bosque (2008) studied the relationship between
psychological factors and a tourist’s perception of the destinations by using both
qualitative and quantitative approaches to increase quality, accuracy, validity, and
reliability of data. The study segmented tourists by using tourists’ motivations, which
were leisure, knowledge, physical motivations, and social interaction. The study found
destination image was a combination of cognitive (attributes) and affective (feeling)
factors. It also found that motivations had influenced tourists’ preferences about the

13
destination; for example, a leisure tourist (one seeking adventures) perceived a more
positive image of the destination, viewing it as an entertaining and exciting place, than
the tourist who had physical motivations (i.e. escape, relax). The study also mentioned
the cultural difference between domestic and international tourists on the way they
perceived the destination.
Beerli and Martín (2004) studied the relationship between tourists’ characteristics
(motivation, experience, and socio-demographic) and the perceived image of tourist
destinations. They found that motivations had influenced the affective components of
image (pleasant/unpleasant, exciting/boring); for example, first-time tourists who had
relaxation as the motivation found the sun and beach destination attractive, whereas the
repeat tourists went there to increase knowledge of the destination. Repeat visitors
were not satisfied with the sea and sun destination because the island was too small
and it offered fewer attractions. The study suggested the sea and sun destination had to
establish more attractions in order to maintain repeat tourists. The more experiences
with the destination the tourists had, the better destination image they would have
because they were more familiar with the destinations. Among all of the socio-
demographic characteristics (gender, age, level of education, social class, and country
of origin), country of origin had the most significant impact on the perceived image.
Hanqin and Lam (1999) studied push and pull factors of Mainland Chinese on traveling
to Hong Kong. There were several dimensions of the travel motivations such as
prestige, novelty, and service attitude/quality. Chinese repeat tourists perceived that
there would be nothing new for them to explore on their returns, which is consistent with

14
the study of Beerli and Martín (2004). However, the study of Li, Cheng, Kim, and Petrick
(2008) stated that repeat tourists had higher satisfaction levels than first-time tourists.
Chen and Hsu (2000) studied Korean tourists’ perceived images of overseas
destinations by identifying trip planning time frames, budget travel cost, and length of
stay. The study found that the destinations that offered adventurous atmosphere,
scenery, environmental friendliness, availability of tourist information, and architectural
style were attractive to Korean tourists. They used the travel cost, destination lifestyle,
availability of quality restaurants, freedom from language barriers, and availability of
interesting places as the main factors in considering the travel destinations.
Information Sources
Media impacts the imagination of tourists. Watching media is an experience of
the tourists in comparing the visual with the actual travel experience (Crouch, Jackson,
and Thompson, 2005). Kim and Richardson (2003) studied the impact of motion
pictures on destination image, and they found that films had influenced viewers on
intention to visit the destination. Smith and MacKay (2001) found that advertising
pictures was one medium that developed the destination image. Teenagers and adults
had no difference in their memories about travel destinations’ advertising pictures.
However, there was a relationship of travel experience levels and the use of information
search channels and purchase channels. Tourists with no previous experience with the
destination were less likely to use online channels in searching for information on
accommodations and car rentals. Whereas tourists with more travel experience used
online channels for both searching and purchasing travel products, especially for
accommodations, car rentals, and flights (Jun, Vogt, & MacKay, 2007).
15
Autonomous agents or media such as newspapers, television, and television
news were the primary sources in forming a destination image on pre-visit, followed by
the self-experience and experience from others (Govers, Go, & Kumar, 2007).
Television was the most frequently used source of information by tourists, followed by
friends, magazines, Internet, books, pictures, other people, movies, stories, experience,
news, imagination, newspaper, National Geographic Channel, advertisements, articles,
media, and documentaries, respectively (Govers et al., 2007). Pearce and
Schott (2005) found that international tourists used the travel agent the most as an
information source for transportation information, followed by Internet and word of
mouth. To obtain accommodation information, international tourists used
guidebooks/directories, followed by word of mouth and brochures. Guidebooks,
brochures, and word of mouth were respectively the information sources used by
international tourists to obtain the information about the attractions.
Consumers were also influenced by word of mouth in several situations such as
when they purchased complex products, when other sources were perceived as low
credibility, or when there were strong social ties between information transmitters and
receivers (Engel et al., 1995). Word of mouth was a powerful tool. It was the most
successful marketing strategy for bed and breakfast operations (Lee, 1999). Consumers
searched for product information internally and externally. There were five primary
sources of information, which were memory (e.g., past experiences), personal sources
(e.g., family/friends), independent sources (e.g., government), marketing sources (e.g.,
advertising), and experiential sources (e.g., product trial) (Hawkins et al., 1995).

16
Buhalis (1998) discussed from a business point of view on the use of information
technologies in tourism industry that it could be applied for businesses in four aspects:
to gain a competitive advantage, to improve productivity and performance, to facilitate
new ways of managing and organizing, and to develop new businesses. Buhalis’s study
(1998) was consistent with the study of Werthner and Ricci (2004) who found that
tourism is a unique and intangible product. Due to these reasons, travelers could not
see the actual product during pre-purchase process so they relied solely on the
information search. Therefore, information technologies had a significant role at this
stage in marketing, distribution, promotion, and co-ordination the travel products.
Werthner and Ricci (2004) mentioned that consumers used Internet sites for
planning, searching, purchasing, and amending their travel. Internet had increasingly
gained popularity among Americans and Europeans. There were more than 64 million
Americans or 30% of the U.S. adult population used Internet for travel information
search and two thirds of them or 42 million booked travels via Internet.
Louvieris and Oppewal (2004) studied information channels. The study showed
that customers had different preferences for the channel choice in the information
search and purchasing stages. During the information search stage, tourists were more
likely to obtain the information from friends or relatives (traditional channels). However,
the key channels for the booking or purchasing were travel agents, e-mail, and Internet.
Li and Buhalis (2006) indicated that there was a trend that consumers perceive
benefits from eChannels which are expected to increase both in the information search
and purchasing stage in the near future. In addition, the more one frequently uses the
Internet, the more chance of that person will become an online shopper.
17
Literatures in Destination Image
This subsection briefly reviews related works in destination image, which is an
essential element in pre-purchase stage.
Researchers applied various methods in the destination image study. Schneider
and Sönmez (1999) studied the Jordan’s image by interviewing technique. The
destination image was also studied by familiarity index based on the informational and
experiential dimensions. The higher the level of tourists’ familiarity with the destination,
the more positive the image would be in the tourists’ mind (Baloglu, 2001). Lam and
Hsu (2006) tested the theory of planned behavior model and found that past experience
was a good predictor of behavioral intention of choosing a travel destination. Past
behavior, subjective norm, and perceived behavioral control, but not attitude, influenced
behavioral intention. Stepchenkova and Morrison (2008) applied Echtner and Ritchie
(1991) image measurement methodology to study Russia’s image among American
pleasure travelers.
Destination image has been studied from different perspectives. Several studies
had focused on the tourists’ perspectives. Hsu, Wolfe, and Kang (2004) studied Kansas
state’s image from Americans’ view. Lawton (2005) studied the residents’ view of the
destination image of Gold Coast. Mohsin (2005) studied the Malaysian tourist attitudes
toward the Australia Northern Territory destination. Chaudhary (2000) studied India’s
image as a tourist destination. Baloglu and Mangaloglu (2001) studied Mediterranean
destinations’ image from US-based tour operators and travel agents. Hughes and Allen
(2005) studied cultural tourism in Central and Eastern Europe from the view of tourist
board officers or induced agents who generated the promotional campaign. Snepenger
18
D., Snepenger M., Dalbey, and Wessol (2007) studied places at tourism destination
from the locals’ view in terms of definition and applications.
There was also the comparison study and cross-cultural study on the destination
image. Grosspietsch (2006) studied Rwanda’s image and characteristics by comparing
visitor and international tour operator perspectives. MacMay and Fesenmaier (2000)
studied cross-cultural destination image between Taiwanese and American tourists on
promotional images used by destination marketing.
Purchase Stage
This section explains the purchase stage. The section focuses on the concept of
city tourism, travel destination attributes, and Thailand characteristics.
City Tourism
Law (2002) studied urban tourism. There were eight prime visitor markets of
urban tourism, which were business travelers, conference/exhibition delegates, short-
break holiday-makers (1-3 nights), day trippers, visitors to friends/relatives, long holiday-
makers on a tour or stopping off for a short visit, cruise travelers, and long holiday-
makers (4 nights) using the city as a gateway to the surrounding region. Tourists were
attracted to the urban travel destination by the general images and the various ranges
of activities. The success of urban tourism could be inferred from the feeling of the
tourists who wanted to come back as they thought that there were too many things to do
in the city in such a short period of time. In addition, the city needed to promote its
unique qualities in order to differentiate itself from the competitors who offered similar
products.

19
Travel Destination Attributes
There are several studies on destination image. These studies include different
attributes such as hotels, restaurants, shopping outlets, attractions, activities, etc. (See
Appendix A).
Thailand Characteristics
Tapachai and Waryszak (2000) studied the role of beneficial image in tourist
destination selection. The beneficial image included five consumption values: functional,
social, emotional, epistemic, and conditional. The data were collected from respondents
who had never been to Thailand or formed an image from secondary sources of
information. Thailand as a studied destination was perceived from five consumption
values, which were (1) functional: fascinating cheap shopping, exotic food, friendliness,
historical unspoiled countryside, beautiful scenery; (2) social: suitable for all people;
emotional: relation and calm; (3) epistemic: cultural experience, climate experience; and
(4) conditional: proximity, cheap travel, and accessibility to other areas.
Rittichainuwat, Qu, and Mongkhonvanit (2001) determined seven dimensions of
Thailand’s international travel image, which were (1) social and environmental
problems: heavy pollution, crowding in big cities, traffic jams, a large gap between rich
and poor, massage parlors, bars, night clubs, prostitution, risky destination due to AIDS;
(2) safe travel destination: high standards for sanitation and cleanliness, stable political
situation, safe place to travel; (3) adventure activities and scenic natural beauty: variety
of activities (coral watching, diving, canoeing), opportunity for adventure (jungle tours,
rafting), scenic and natural beauty; (4) rich culture: numerous cultural and historical
attractions, beautiful architecture and buildings, interesting customs and culture; (5)

20
good-value cuisine and hotels: variety of cuisines, availability of international-standard
accommodations, value to money spent; (6) easy access: easy immigration procedures,
availability of tourist-information centers, easy access (entry to country); and (7) good
shopping: many fashionable brand-name products in malls and stores, good bargain
shopping.
Rittichainuwat, Qu, and Mongkhonvanit (2006) studied the collective impacts of a
bundle of travel determinants on repeat visitation to Thailand and determined tourist
satisfaction attributes in the categories of shopping, restaurants, hotels, transportation,
attractions, environment, and local residents’ attitudes.
Rittichainuwat, Qu, and Mongkhonvanit (2008) studied understanding the
motivation of international travelers on repeat visits to Thailand. The study found
significant differences in travel motivations between first-time and repeat tourists to
Thailand. The study also showed motivation rankings. The dimensions of the travel
motivation were: special interests; cultural attractions; deal on tour promotion and
currency exchange; good value food, shopping, and things to do; Buddhism; and natural
attractions.
Vieregge, Phetkaew, Beldona, Lumsden, and DeMicco (2007) studied mature
travelers to Thailand on the preferences and attributes of hotels. The study found that
the top factors influencing hotel selection among mature travelers which were
cleanliness, good vale for money, easy access to beach, location, personnel on duty,
price of accommodation, airport transfer, multilingualism, well-lit areas, and luggage
assistance.

21
Sangpikul (2008) studied travel motivations of Japanese senior travelers to
Thailand. Factor analysis produced three push dimensions (novelty and knowledge
seeking, rest and relaxation, and ego-enhancement) and four pull dimensions (cultural
and historical attractions, travel arrangements and facilities, shopping and leisure
activities, and safety and cleanliness).
Post-purchase Stage
This section reviews the studies concerning the final stage of purchase decision
making process, post-purchase. The section includes: service quality, tourist
satisfaction, and revisitation/recommendation.
Service Quality
Kandampully (2007) concluded a concept of service quality that had been
studied by numerous researchers. The best way to evaluate customers’ satisfaction was
to look at the service quality. Service quality was measured by various approaches,
such as the SERVQUAL approach, the Service attribute score, etc.
Tourist Satisfaction
Satisfaction was an outcome experience that at least met or exceeded
expectations (Engel et al., 1995). Meng et al. (2006) concluded that there were nine
theories on customer satisfaction: expectancy disconfirmation, assimilation or cognitive
dissonance, contrast, assimilation contrast, equity, attribution, comparison level,
generalized negativity, and value perception. Among these nine theories, expectation
disconfirmation model was accepted the most. Oliver (1980), cited from Kandampully
(2007) introduced an Expectancy Disconfirmation Model, which was a process of
comparison between an expectation and an experience. Satisfaction would occur if the

22
experience met the expectation. If not, consumers would be dissatisfied (Engel et al.,
1995). Zeithaml, Berry, and Parasuraman (1993, 1996) indicated that expectation
developed from previous experiences, word-of-mouth or various cues surrounding the
service (Kandampully, 2007).
Enright and Newton (2005) studied destination competitiveness by using the
scale importance on the destination attributes in assessing the competitiveness across
the competitor. There were three competitive destinations, including Hong Kong,
Singapore and Bangkok.
Hui, Wan, and Ho (2007) assessed the satisfaction and revisiting Singapore of
different tourist groups from Europe, Asia, Oceania and North America. Tourists were
satisfied with overall convenience and commodities. European and Asian tourists were
satisfied with attractions, while culture was significant to oceanic tourists’ satisfaction.
Accommodation and food were main factors that brought satisfaction to American
tourists. Most of Asian tourists were disappointed with the lack of interesting nightlife,
natural and scenic spots, and attractive urban sightseeing of Singapore.
Pawitra and Tan (2003) also studied satisfaction of Singapore from the
perspective of Indonesian tourists. They found the key strengths and weaknesses of
Singapore. The strengths were uniqueness of local blend of multicultural heritage,
plentiful nightlife, modern local life style and easiness to find world-class brand-name
products and services. The weaknesses were unfriendly local people, expensive
shopping belt, not unique tourist places of interest, not long-lasting holiday experience,
uninteresting city tour package, inconvenient accommodations, uninteresting
23
international art exhibitions and performance, and unavailability of wide range of
products.
Sohail, Roy, Saeed, and Ahmed (2007) studied guests’ satisfaction of the
Malaysian mid-price hotel and found that customers’ overall satisfaction was moderate-
level. Customers were satisfied with cleanliness and value; however, the hotel lacked
staff efficiency and attentiveness to customer needs.
Lau, Akbar, and Yong Gun Fie (2005) studied guests’ satisfaction with Malaysian
luxury hotels. Most of the visitors were from South East Asia and other Asian countries.
The study found that hotel guests’ experiences did not meet their expectations.
Poon and Low (2005) studied Western and Asian customers’ satisfaction with
Malaysian hotels and found that Asian customers had lower satisfaction levels on hotel
attributes than Western customers did. Asian customers were concerned about value of
money while Western customers were concerned about security and safety. Food and
beverage was an attractive factor to hotel guests.
Heung and Cheng (2000) studied satisfaction of tourists towards shopping in
Hong Kong and indicated that staff service quality had the greatest influence on tourists’
level of satisfaction, followed by product value and product reliability. Choi and Chu
(2000) evaluated Hong Kong hotels on staff service quality, room quality, general
amenities, business services, value, security, and International Direct Dialing (IDD)
facilities. The study indicated that Asian travelers’ overall satisfaction was primarily
derived from the perceived value factor, whereas the western travelers were satisfied by
room quality factor.

24
Heung (2000) studied the satisfaction levels of mainland Chinese travelers with
Hong Kong hotel services. The study found that the tourists were satisfied with the
availability of personal care amenities, quietness of the room, availability of food and
beverage variety, and dissatisfied with recreation facilities, availability of frequent
travelers’ program, and the baggage handing service. Eight dimensions of services
were identified. Service quality and value as well as the augmented product quality were
found to be more important than others in influencing their overall satisfaction and the
likelihood to return.
LeHew and Wesley (2007) found that tourist shoppers’ satisfaction level with
shopping centers was lower than that of resident shoppers, suggesting that the tourist
shopper market may not be the most valuable customer group compared to resident
shoppers. Zhang, Qu, and Tang (2004) studied Hong Kong residents’ travel destination
characteristic preferences and found that safety was the main factor for Hong Kong
residents in choosing the travel destination, and they also preferred to buy a package
tour.
Heung and Cheng (2000) studied tourists’ satisfaction with shopping in Hong
Kong. The study found that tourists were most satisfied with the lighting and physical
setting of the shops, followed by window displays and opening hours, and dissatisfied
with product reliability. Staff service quality was found to have the most influence on
tourists’ levels of satisfaction.
Wong and Law (2003) studied tourist satisfaction with shopping in Hong Kong
and found that Asian tourists were less satisfied with shopping in Hong Kong than
Western tourists. The study indicated that some retailers treated Western tourists better

25
than Asian tourists because they perceived that Western tourists had more purchasing
power. Asian tourists were less likely to be satisfied with quality than Western tourists.
Tourists from different countries were not satisfied with the prices of products.
There are different perspectives of satisfaction study. Reisinger and Turner
(2002) studied shopping satisfaction of Japanese tourists at two shopping destinations:
Hawaii and the Gold Coast. Tam (2008) studied the relationships between brand
familiarity, satisfaction, and behavioral intentions in a restaurant setting. Grace and
O’Cass (2004) studied a bank setting and found that service experience was a
combination of core service; employee service; and servicescape, which influenced
feelings, satisfaction, and brand attitudes of customers. Kozak (2001) compared
satisfaction of two tourist nationalities with tourist destinations.
Researchers used different approaches in assessing tourists’ satisfaction. On the
service production system, Grönroos (1990) identified six factors that influenced
consumers’ expectation: personal needs, previous experiences, corporate/local image,
market communication, word-of-mouth, and absence of communication.
Joppe, Martin, and Waalen (2001) studied tourists’ satisfaction with Toronto,
Canada by using a Comparative Importance-Satisfaction approach. Tourists rated the
factors from the most to the least important on these items respectively: personal safety,
accommodation services, food services and cuisine, value for money, cleanliness,
variety of things to see and do, hospitality of local people, and directional signage.
Accommodation services, food services and cuisine, and variety of things to see and do
ranked among the top factors that influenced the tourists’ satisfaction.

26
O’Leary and Deegan (2005) studied Ireland’s image from the French travelers’
perspective by using the Attribute Importance and Performance approach and found
that travelers most likely were satisfied with several attributes. Millán and Esteban
(2004) developed a multiple-item scale for measuring the travel agencies’ services from
tourists’ perspective based on six factors: service encounters (e.g., helpfulness),
empathy (e.g., solving problems), reliability (e.g., comply with agreed promises), service
environment (e.g., decoration and setting of agency), efficiency of advice (e.g.,
knowledge), and additional attributes (e.g., special services of sending tickets and
reservations).
Various dimensions were evaluated in the destination satisfaction study.
Reisinger and Turner (2002) found that cultural factors, which were values, rules of
behavior, perception, and social interaction (with Australian hosts), impacted the
satisfaction of Asian tourists (Indonesian, Japanese, Korean, Mandarin, and Thai). Yu
and Goulden (2005) studied international tourists from four different regions (Europe,
the US, Japan, and Asia/Pacific) and satisfaction in Mongolia in four dimensions, which
were attractions, facilities, services, and prices.
Master and Prideaux (2000) studied Taiwanese tourists’ satisfaction on their trip
to South East Queensland and found that the culture differences (e.g., shopping habits,
cuisine, and language) did not significantly impact satisfaction, but were desirable.
Shopping hours were found to have the greatest impact on satisfaction. Some
respondents indicated their dissatisfaction with the cultural difference, but it did not
impact to the overall holiday experience.

27
Yüksel and Yüksel (2007) studied the relationship between shopping risk
perceptions and tourist satisfaction. The study found that the higher perception of
external and internal risks impacted tourist satisfaction and loyalty in shopping.
George (2003) studied tourist’s perceptions of safety and security and found that
tourists were less likely to engage with the activities if they perceived a fear of crime at
the destination. Tourists who experienced a crime incident during their trip would feel
less safe. Tourists perceived more danger during the night than during the day.
Yu and Goulden (2005) investigated international tourists from Europe, the US,
Japan, and other Asia/Pacific countries in relation to tourist attractions, facilities,
services, and prices in Mongolia. The study found that the international tourists were
satisfied with natural beauty, normadic lifestyle and traditional festivals, accommodation,
hospitality services, local employee attitude, and local food. They were dissatisfied with
facilities, sanitation, transportation, and nightlife.
Revisitation/Recommendation
Oppermann (2000) studied destination loyalty of residents of New Zealand to
Australia as a travel destination. The respondents were asked to identify the frequency
of their visits to Australia in a ten-year period (1985-1995). The findings suggested that
visiting Australia four to five times could be interpreted as loyalty.
There were several studies mentioned about the connection between tourists’
satisfaction and their loyalties to the travel destinations. Yoon and Uysal (2005) studied
the effects of motivation and satisfaction on destination loyalty. The study found a
relationship between satisfaction of travel experience and destination loyalty.
Satisfaction was found to be negatively influenced by the pull travel motivation. Push
28
motivation was not found to be significant to the travel satisfaction, but to the
destination. The dimensions of the push motivations were: exciting,
knowledge/education, relaxation, achievement, family togetherness, escape, safety/fun,
and away from home/seeing. The dimensions of the pull motivations were: modern
atmosphere/activities, wide space/activities, small size/reliable weather, natural
scenery, different culture, cleanness/shopping, night life/local cuisine, interesting
town/village, and water activities.
Kozak and Rimmington (2000) studied tourists’ satisfaction during off-season
holidays to Mallorca, Spain. Three dependent variables, which were overall satisfaction,
likelihood to make subsequent visits to Mallorca, and likelihood to recommend these
holiday experiences to others, were investigated. The study found that these three
variables were influenced the most by these destination attributes: overall value for
money, quality standard of accommodation, level of service at accommodation, feelings
of safety and security, hospitality, cleanliness, hygiene and sanitation, and quality and
variety of food. The study mentioned that it was not necessary that the satisfied tourists
revisit the destination. The travel destination would still benefit from their word-of-mouth.
Bigné, Sánchez and Sánchez (2001) found that destination image was an
antecedent of perceived quality, satisfaction, intention to return, and willingness to
recommend the destination. Quality was found as a factor causing satisfaction and
intention to return, and satisfaction would have impact on willingness to recommend the
destination. Nonetheless, there was no connection between willingness to recommend
and satisfaction on intention to return.

29
Hsu and Kang (2007) studied the relationship of trip characteristics and
perceptions of international visitors on likelihood to revisiting Hong Kong. The study
found that package tours were purchased among the first-time visitors while business
travelers and visitors to friends/relatives were more independent travelers. The first-time
visitors spent the least time (3.5 nights) while visitors who visited friends/family stayed
the longest time in Hong Kong (7 nights). The repeat visitors had the largest amount of
spending on their trips. Visitors on business trips had the most frequent visitations.
These visitors were satisfied with their Hong Kong trips; however, the findings indicated
that satisfaction could not be used to determine the loyalty since some of the visitors
indicated that they were less likely to return to Hong Kong even if they were satisfied.
Torres and Kline (2006) found that customer delight is a better indicator of
customer relationship than customer satisfaction because delighted customers were
more likely to generate word-of-mouth and be loyal to the business. Bennett and
Rundle-Thiele (2004) studied an advertising service setting and found that satisfaction
and loyalty were different constructs. A high level of satisfaction did not imply the high
loyalty of customers.
Weaver, Weber, and McCleary (2007) studied the relationship between the
predictor variables (length of stay, members in travel party, types of travel packages,
number of countries visited, and number of countries visited for pleasure) and the
criterion variables (satisfaction, service quality, value for the money, and likelihood to
return). The study found that the more counties the tourists visited, the higher they
perceived the quality of service in Hong Kong. Independent tourists had more likelihood
to return to Hong Kong than tourists who were on package tours. However, the later

30
group rated service quality higher than the independent tourists did. This might be
because the package tour was prepared by tour operators for tourists, so they were
experiencing good service from tour guides, hotels, and restaurants. Focusing on doing
marketing strategies on tour operators rather than independent tourists or tour
participants was a recommendation. The number of countries visited and the value for
money were less correlated with likelihood to return in this study.
Lau and McKercher (2004) studied motivations and intended activities of first-
time and repeat pleasure tourists to Hong Kong. The study found that first-time tourists
came to Hong Kong to explore the general activities while the repeat tourists came to
consume. The first-time tourists engaged with exploring while the repeat tourists came
to shop, dine, and spend time with family/friends. Bansal and Eiselt (2004) studied how
motivation impacted the destination preference. Four motives were investigated, which
were climate (atmosphere/environment), relaxation, personal (e.g. prestige), and
education.
Kozak (2001) proposed a model of multiple relationships on level of overall
tourist satisfaction and number of previous visits and an intention for repeat visits. The
study found that first-time travelers are more likely to switch to other destinations while
repeaters have more loyalty to the destination. However, the number of previous visits
is not significantly related to the intention to visit.
Hui et al. (2007) found that a likelihood of revisiting Singapore was positively
related to tourists’ overall satisfaction levels. However, Singapore is such a small
country, visitors may visit the whole country within few days. Even though visitors had
31
high satisfaction levels, they are more likely to spread word-of-mouth about their
satisfied trips than make a revisit to Singapore.
Chen and Tsai (2007) studied the effect of destination image and perceived
destination’s values on the behavioral intention. The study found that the more positive
the feelings of tourists on the destination image, the higher they would perceive the trip
quality, and the more positive their behavioral intention would be.
Bramwell (1998) studied satisfaction of sport event visitors and residents of
urban travel destination. Tourists perceived that higher trip quality would yield overall
satisfaction; however, they were uncertain that they would perceive that it was value for
their time, effort or money or would cause the destination’s visitations and
recommendations. The value they received from the trip would be an indicator of their
satisfaction with the destination and the satisfaction would be the factor driving the
behavioral intention. Murphy, Pritchard, and Smith (2000) found the overall environment
(e.g., nature, culture) and constructed infrastructure (e.g., shopping, food, and
accommodation) had an impact on the perceived quality and value of tourists’
experiences and intention to return.
In conclusion, this chapter illustrates the related studies with tourist’s purchase
decision making process as shown from the research framework. The process consists
of three stages: pre-purchase, purchase, and post-purchase.

32
CHAPTER 3
METHODOLOGY
Numerous studies have been conducted to better understanding tourists’
experiences on travel destinations. Different research methods are used to generate
various outcomes. This chapter describes sample and data collection, research
questions, instrument design, questionnaire content, and data analysis.
Sample and Data Collection
The study was reviewed and approved by the Institutional Review Board (IRB)
for the protection of human subjects prior to the field study. The sample was a
convenience sample of 300 Indian tourists who visited the Bangkok area of Thailand
during July 24-August 14, 2008. A self-administered survey was used to collect data at
Suvarnabhumi International Airport in Bangkok. The study was conducted during
different departure flights, days, and times to reduce bias. On average, 13 flights per
day depart Suvarnabhumi International Airport to the following airports in India: Delhi
Indira Gandhi International Airport, Calcutta Airport, Guwahati Airport, Bombay Santa
Cruz International Airport, Hyderabad Airport, Madras International Airport, Bangalore
Airport, and Gaya Airport.
Research Questions
Pre-purchase: demographics, past experiences, motivations, and information sources
Demographics and past experiences
1. What are the demographic characteristics and travel patterns of Indian tourists?
33
Motivations
2. What are the top rankings of Indian tourists’ motivation to take the Bangkok area
trip?
3. What are the dimensions of motivation that influence Indian tourists in making the
decision to visit the Bangkok area?
Information sources
4. What are the rankings of importance of information sources?
Post-purchase: satisfaction, intention to return, and willingness to recommend
Satisfaction
5. What are the rankings of Indian tourists’ satisfaction on the Bangkok area’s
attributes?
6. What are the satisfaction levels of Indian tourists on each component of Bangkok
area’s attributes?
7. What are the dimensions of each component of the Bangkok area’s attributes?
8. What do Indian tourists enjoy, dislike, and suggest about the Bangkok area trip?
9. What are the differences between package-tour Indian tourists (PKIT) and
independent Indian tourists (INIT) concerning: importance level of information
sources and satisfaction level on the Bangkok area attributes?
10. What are the differences between first-time Indian tourists (FTIT) and repeat
Indian tourists (RPIT) concerning: importance level of information sources and
satisfaction level on the Bangkok area attributes?
34
Intention to return and willingness to recommend
11. What are the Indian tourists’ intention to return and willingness to recommend the
Bangkok area and Thailand?
Instrument Design
The questionnaire was developed from the information from the literature review
which consisted of the studies related to three stages of tourist’ purchase decision
making process: pre-purchase, purchase, and post-purchase. It was available in
English, Hindi, and Gujarati. The last two languages are the most widely spoken in
India. The double translation method was used for the translation process by bilingual
experts (English/Hindi, English/Gujarati). The questionnaire consists of the following five
sections:
Pre-purchase: demographics, past experiences, motivations, and information sources
1. Demographics and past experiences
This section included various questions asking about demographic information
such as age and income. The travel patterns of respondents such as length of stay in
Bangkok were also included.
2. Trip motivations
This section measured 20 push and pull factors or motivations of Indian tourists
on their decision to visit the Bangkok area, such as to learn new things and to visit
palaces and temples. This section was adapted from the studies of Crompton (1979)
and Josiam, Kinley, and Kim (2005). The five point Likert Scale ranged from one (1)
indicating “unimportant” and five (5) indicating “extremely important.”
35
3. Level of importance on the information sources
This section measured level of importance on the information sources of Indian
tourists in gathering information about the Bangkok area trip. There were six information
sources included in this section that were gathered from the literature review (Govers et
al., 2007; Kim & Richardson, 2003; Pearce & Schott, 2005; Smith & MacKay, 2001).
The five point Likert Scale ranged from one (1) indicating “unimportant” and five (5)
indicating “extremely important.”
Post-purchase: satisfaction, intention to return, and willingness to recommend
4. Level of satisfaction on Bangkok area attributes
This section measured the level of satisfaction of Indian tourists on Bangkok area
attributes. The attributes were derived from numerous studies (Kozak, 2002; Ngamsom,
2001) and categorized into 11 dimensions, which were hotel/lodging, local
transportation, restaurants/bars/food outside hotel, shopping, local people, local tour
guide, Suvarnabhumi International Airport, activities, attractions, tourist information, and
the overall trip experience. The five point Likert Scale ranged from one (1) indicating
“very dissatisfied” and five (5) indicating “very satisfied.”
5. Open-ended questions
This section consisted of three open-ended questions and two dichotomous
questions. The respondents were asked to give comments about the trip experiences
on enjoyment of the experience, dislike of the experience, and suggestions on the trip
experience. Two dichotomous questions on the intention to return and willingness to
recommend the Bangkok area and Thailand were also included.
36
Questionnaire Content
The questionnaire was validated by researchers who are specialized in the area
of consumer behavior. The questionnaire was then adjusted in content and format
based on the suggestions of researchers and Indian tourists for content validity and
reliability. Adjustment was made to the six-page-questionnaire after the first tryout at
Suvarnabhumi International Airport since its length had impact to the willingness of the
respondents to participate. The questionnaire then was reduced its size to four-page-
survey. The involvement construct as well as the questions about Bangkok’s
characteristics and competitiveness were removed.
Data Analysis
The data was analyzed by Statistical Package for the Social Sciences (SPSS) as
follows:
Descriptive Analysis
Descriptive analysis was used to provide the frequency of demographic
information as well as trip behaviors of the respondents. Descriptive analysis was used
to analyze the following research questions:
What are the demographic characteristics and travel patterns of Indian tourists?
What do Indian tourists enjoy, dislike, and suggest about the Bangkok area trip?
What are the Indian tourists’ intention to return and willingness to recommend the
Bangkok area and Thailand?
Moreover, this analysis was employed to provide the mean scores of an
importance level of motivation and information sources, as well as a level of satisfaction.
Descriptive analysis was used to analyze the following research questions:

37
What are the top rankings of Indian tourists’ motivation to take the Bangkok area
trip?
What are the rankings of importance of information sources?
What are the rankings of Indian tourists’ satisfaction on the Bangkok area’s
attributes?
What are the satisfaction levels of Indian tourists on each component of Bangkok
area’s attributes?
Analysis of Variance
Analysis of variance (ANOVA) was determined the differences between Indian
tourists (package-tour Indian tourists, independent Indian tourists, first-time Indian
tourists, and repeat Indian tourists) by indicating the mean scores on: importance level
of information sources and satisfaction level on Bangkok area attributes. ANOVA was
analyzed the following research questions:
What are the differences between package-tour Indian tourists (PKIT) and
independent Indian tourists (INIT) concerning: importance level of information sources
and satisfaction level on the Bangkok area attributes?
What are the differences between first-time Indian tourists (FTIT) and repeat
Indian tourists (RPIT) concerning: importance level of information sources and
satisfaction level on the Bangkok area attributes?
Factor Analysis
Factor analysis was used to identify the dimensions of motivations that influence
Indian tourists in making their decision to visit the Bangkok area as well as the
38
dimensions of each component of the Bangkok area’s attributes. Factor analysis was
analyzed the following research questions:
What are the dimensions of motivation that influence Indian tourists in making the
decision to visit the Bangkok area?
What are the dimensions of each component of the Bangkok area’s attributes?
In summary, this chapter presents sample and data collection, research
questions, instrument design, questionnaire content, and data analysis.
39
CHAPTER 4
RESULTS
This chapter is divided into two sections pertaining to the research framework.
These two sections are pre-purchase and post-purchase stage. The findings are
illustrated based on the purposes of the study in the following order: 1) to identify Indian
tourists’ demographics and travel patterns; 2) to examine Indian tourists’ motivation to
take the Bangkok area trip; 3) to examine the level of importance of information
sources; 4) to identify the level of satisfaction of Indian tourists on their travel
experience on the Bangkok area attributes; and 5) to examine the intention to return
and willingness to recommend the Bangkok area and Thailand.
Pre-purchase Stage
Pre-purchase: demographics, past experiences, motivations, and information sources
Demographics and past experiences
Objective 1: To identify Indian tourists’ demographics and travel patterns.
RQ 1: What are the demographic characteristics and travel patterns of Indian
tourists?
Sample characteristics were shown in Table 1. The sample size selected was
300. The total of 150 usable responses was obtained. Male respondents were
overrepresented by 75.2% while female respondents were 24.8%. The majority of
respondents were in the age range of 20-45 (65.9%) and married (76.3%). Hindi was a
major mother tongue (59.3%). Approximately half of the respondents were from
Maharashtra state which included 42% from the city of Mumbai and 6.2% from the city
of Pune. About 30% of respondents were from New Delhi. Employment status statistics

40
were almost the same with percentages of self-employed at 36.9% and employed at
35.6%. Almost half of the respondents obtained bachelor’s degree (45.6%), followed by
master’s degree (29.5%). About 30% of them had a household income between 25,000
to 50,000 Indian Rupees (INR), followed by 150,001 Indian Rupees or more (22.1%)
(currency exchange rate in July 2008, US$1 = INR42.80).
Table 1
Demographic Characteristics of Indian Tourists
Demographics N (150) (%)
Gender Male 112 75.2
Female 37 24.8
Marital status Married 106 76.3
Single 33 23.7
Residency (city of India) Mumbai (Maharashtra state) 41 42.3
Banglore (Kanataka state) 4 4.1
Pune (Maharashtra state) 6 6.2
New Delhi (Delhi state) 29 29.9
Punjab state 11 11.3
Rajasthan state 6 6.2
Mother tongue Hindi 83 59.3
Gujarati 10 7.1
Marathi 10 7.1
English 7 5.0
Panjabi 6 4.3
Others 24 17.2
(table continues)

41
Table 1 (continued).
Demographics N (150) (%)
Age 18-19 7 5.2
20-45 89 65.9
46-65 32 23.7
66 and over 7 5.2
Employment status Employed 53 35.6
Self-employed 55 36.9
Retired 11 7.4
Student 19 12.8
Housewife 8 5.4
Other 3 2.0
Education High school 17 11.4
College 68 45.6
Post graduate degree 40 29.5
Doctorate/Professional degree 20 13.4
Household income INR25,000-50,000 43 30.7
INR50,001-75,000 23 16.4
INR75,001-100,000 10 7.1
INR100,001-125,000 17 12.1
INR125,001-150,000 16 11.4
INR150,001 or more 31 22.1
Note. Totals differ due to missing data.
Table 2 shows the travel patterns of Indian tourists. There were slightly more
first-time visitors (53%) than repeat visitors (47%). Nearly 57% of visitors took package
tours to the Bangkok area, and another 43% traveled independently in the Bangkok
area. There were 65.1% leisure travelers and 15.4% business travelers who were

42
sponsored by companies. The majority of Indian tourists traveled alone (41.2%),
followed closely by those traveling with spouses (38.5%). The average length of a stay
was 5.88 days. They spent the most on clothing (INR17,329), followed by electronics
(INR12,069), and handicrafts/souvenirs (INR10,617), respectively (average
spending/trip/household).
Table 2
Travel Patterns of Indian Tourists
Travel patterns N (150) (%)
Travel arrangement Independent travel 65 43.6
Package tour 84 56.4
Type of tourists First-time 79 53.0
Repeat 70 47.0
Purposes Vacation/Leisure 97 65.1
Honeymoon 9 6.0
Won an incentive/bonus 5 3.4
Sponsored by business 23 15.4
Attend convention/meeting 9 6.0
Other business 6 4.0
Travel with Alone 61 41.2
Husband/Wife 57 38.5
Friends 12 8.1
Family 18 12.2
Length of stay 5.88 days (min1,max50) 147 SD 5.842
Spending Electronics 23 INR12,069
Clothing 48 INR17,329
Handicrafts/Souvenirs 34 INR10,617
Note. Totals differ due to missing data.

43
Motivations
Objective 2: To examine Indian tourists’ motivation to take the Bangkok area trip.
RQ 2: What are the top rankings of Indian tourists’ motivation to take the
Bangkok area trip?
Respondents were asked to give a rating on a five point Likert Scale, in which
one (1) indicated “unimportant” and five (5) indicated “extremely important.” Table 3
shows the mean scores of each motivation ordered by the most important to the least
important. Top ten rankings of motivation that Indian tourists reported when deciding to
take the trip to the city of Bangkok were: to have fun (M = 4.04), to enjoy the beautiful
environment, scenery, beaches (M = 3.95), to see and experience a new destination(s)
(M = 3.88), to do something exciting (M = 3.85), to go to Thailand/Bangkok (M = 3.83),
to reduce stress (M = 3.82), to escape from the routine of work or life (M = 3.81), to
learn new things (M = 3.73), to enjoy shows and entertainment (M = 3.73), and to enjoy
international travel experiences (M = 3.70).
Table 3
Mean Scores of Indian Tourists’ Motivation on Taking Bangkok Area Trip
Motivation Mean
To have fun 4.04
To enjoy the beautiful environment, scenery, beaches 3.95
To see and experience a new destination(s) 3.88
To do something exciting 3.85
To go to Thailand/Bangkok 3.83
(table continues)

44
Table 3 (continued).
Motivation Mean
To reduce stress 3.82
To escape from the routine of work or life 3.81
To learn new things 3.73
To enjoy shows and entertainment 3.73
To enjoy international travel experiences 3.70
I have reached a stage where I can afford an international trip 3.62
To visit difference places in one trip 3.60
All inclusive tour 3.57
To talk about the trip after returning home 3.56
To visit historical places, ancient ruins, temples, palaces 3.56
To be together with my family 3.52
To be together with friends 3.38
To go places my friends/relatives have not visited 3.35
To meet new friends (in new destination) 3.26
To take advantage of travel agent/airlines promotion 3.22
RQ 3: What are the dimensions of motivation that influence Indian tourists in
making the decision to visit the Bangkok area?
Factor analysis was employed to identify the underlying dimensions of the 20
motivations. From 20 motivations, four core dimensions that influence Indian tourists in
making the decision to visit the Bangkok area were determined including; Novelty
Seeking, Stress Busting/Fun, Achievement, and Family Oriented/Education (see Table
4). For the purpose of interpretation of factors, a loading cut-off of 0.65 was adopted in
this study. The reliability analysis test was conducted, which gives a value of Cronbachs

45
alpha where the value of “1” suggests perfect reliability and any score above 0.65 is
considered acceptable. Each core dimension was described as following.
Factor 1: Novelty Seeking. Indian tourists visited the Bangkok area to enjoy the
beautiful environment, scenery, and beaches, to learn new things, to see and
experience a new destination(s) and be able to see the new destinations in one trip.
Factor 2: Stress Busting/Fun. Indian tourists wanted to travel to reduce stress, or
do something fun and exciting with friends.
Factor 3: Achievement. This group of people wanted to travel in order to feel a
sense of achievement in their lives such as going to places that their friends/relatives
have not visited, or having trips internationally. They also traveled with package tours.
Factor 4: Family Oriented/Education. This group consisted of Indian tourists who
went to the Bangkok area to spend time with families. Traveling with family may
encourage them in taking advantage of travel agent/airlines promotion. For them,
visiting the historical places, ancient ruins, temples, and palaces was suitable and
provided educational activities for their families, especially their children.
Table 4
Factor Analysis of Indian Tourists’ Motivation on Taking Bangkok Area Trip
Motivation Factor loading
Factor 1: Novelty Seeking Alpha = .889; explained variance = 42.519
To enjoy the beautiful environment, scenery, beaches .776
To see and experience a new destination(s) .748
To go to Thailand/Bangkok .638
To visit difference places in one trip .617
To learn new things .600
(table continues)
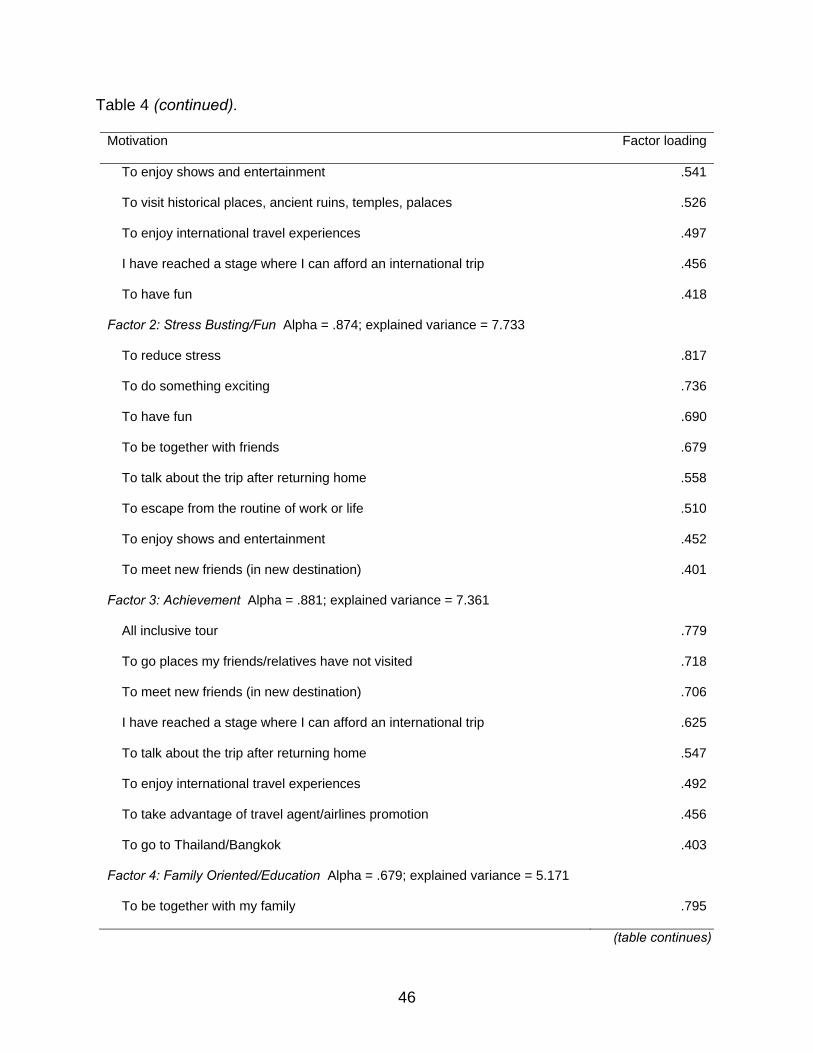
46
Table 4 (continued).
Motivation Factor loading
To enjoy shows and entertainment .541
To visit historical places, ancient ruins, temples, palaces .526
To enjoy international travel experiences .497
I have reached a stage where I can afford an international trip .456
To have fun .418
Factor 2: Stress Busting/Fun Alpha = .874; explained variance = 7.733
To reduce stress .817
To do something exciting .736
To have fun .690
To be together with friends .679
To talk about the trip after returning home .558
To escape from the routine of work or life .510
To enjoy shows and entertainment .452
To meet new friends (in new destination) .401
Factor 3: Achievement Alpha = .881; explained variance = 7.361
All inclusive tour .779
To go places my friends/relatives have not visited .718
To meet new friends (in new destination) .706
I have reached a stage where I can afford an international trip .625
To talk about the trip after returning home .547
To enjoy international travel experiences .492
To take advantage of travel agent/airlines promotion .456
To go to Thailand/Bangkok .403
Factor 4: Family Oriented/Education Alpha = .679; explained variance = 5.171
To be together with my family .795
(table continues)

47
Table 4 (continued).
Motivation Factor loading
To take advantage of travel agent/airlines promotion .594
To visit historical places, ancient ruins, temples, palaces .504
Information sources
Objective 3: To examine the level of importance of information sources.
RQ 4: What are the rankings of importance of information sources?
Respondents were asked to give a rating on a five point Likert Scale, in which
one (1) indicated “unimportant” and five (5) indicated “extremely important.” Table 5
shows the mean scores of each information source ordered by the most important to the
least important. The most important ones were family and/or friend (M = 3.66), followed
by Internet (Email, Website) (M = 3.49). Both information sources were rated on the
importance level between important to very important.
Table 5
Mean Score of the Importance of Information Sources in Decision-making on Bangkok
Area Trip
Information sources Mean
Family and/or friends 3.66
Internet (Email, Website) 3.49
Travel magazine 2.79
Travel agent 2.76
Movie/TV series 2.64
Commercial ads (TV, Radio) 2.53
48
Post-purchase Stage
Post-purchase: satisfaction, intention to return, and willingness to recommend
Satisfaction
Objective 4: To identify the level of satisfaction of Indian tourists on their travel
experience on the Bangkok area attributes.
RQ 5: What are the rankings of Indian tourists’ satisfaction on the Bangkok
area’s attributes?
Respondents were asked to give rating on a five point Likert Scale, in which one
(1) indicated “very dissatisfied” and five (5) indicated “very satisfied.” Calculating mean
scores of 58 attributes from 11 components (hotel/lodging, local transport, local
restaurants/bars/food outside hotel, shopping, local people, local tour guide,
Suvarnabhumi International Airport, activities, attractions, tourist information, and the
overall trip experience) produced the top ten (Table 6) and the least ten (Table 7) in
regards to satisfaction of Indian tourists on their Bangkok area trip experiences.
Top ten rankings of Indian tourists’ satisfaction were: cleanliness of the airport (M
= 4.52), availability of facilities and services of the airport (M = 4.24), historical
architecture/palaces/ancient ruins/temples (M = 4.22), courtesy of custom/immigration
officials at the airport (M = 4.21), overall satisfaction with the Bangkok area trip (M =
4.20), convenience from airport to hotel/city (M = 4.17), speed of check-in and check-out
at the airport (M = 4.17), nature/beaches (M = 4.17), night life/bars/night clubs (M =
4.16), and helpfulness of custom/immigration officials at the airport (M = 4.15).
Interestingly, the mean scores of these attributes were scored very high (>M = 4.0). In
other words, Indian tourists were “satisfied” or “very satisfied” with these attributes.
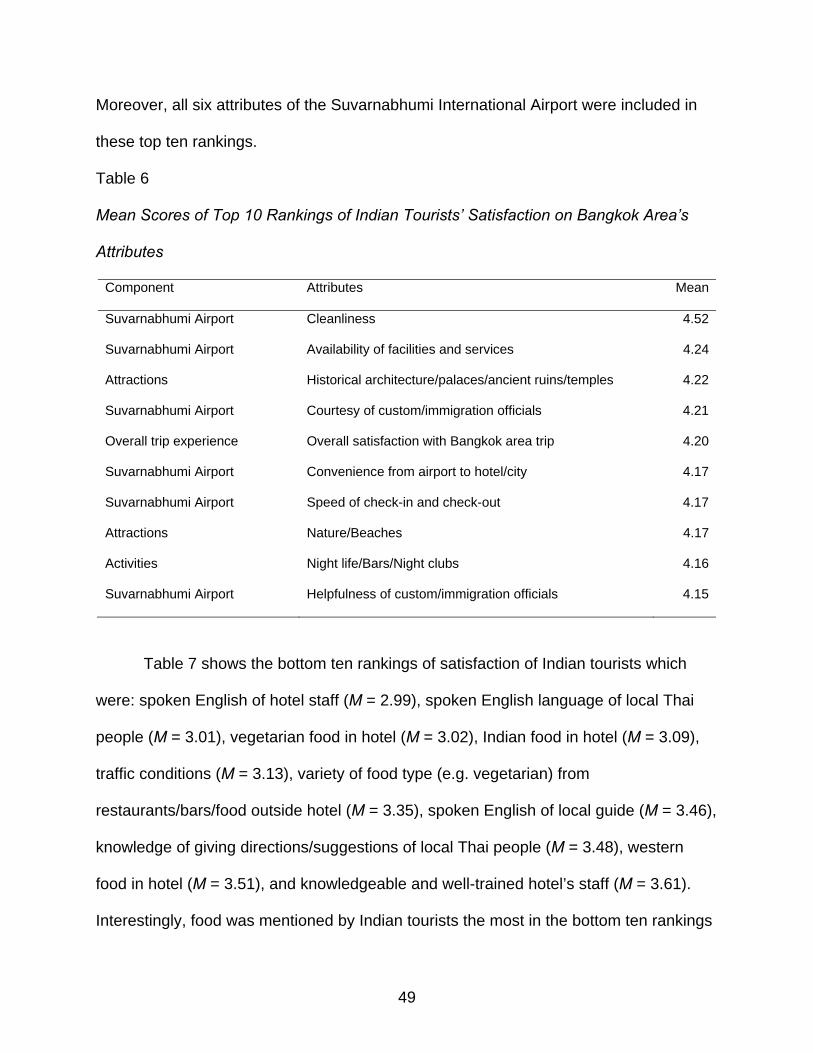
49
Moreover, all six attributes of the Suvarnabhumi International Airport were included in
these top ten rankings.
Table 6
Mean Scores of Top 10 Rankings of Indian Tourists’ Satisfaction on Bangkok Area’s
Attributes
Component Attributes Mean
Suvarnabhumi Airport Cleanliness 4.52
Suvarnabhumi Airport Availability of facilities and services 4.24
Attractions Historical architecture/palaces/ancient ruins/temples 4.22
Suvarnabhumi Airport Courtesy of custom/immigration officials 4.21
Overall trip experience Overall satisfaction with Bangkok area trip 4.20
Suvarnabhumi Airport Convenience from airport to hotel/city 4.17
Suvarnabhumi Airport Speed of check-in and check-out 4.17
Attractions Nature/Beaches 4.17
Activities Night life/Bars/Night clubs 4.16
Suvarnabhumi Airport Helpfulness of custom/immigration officials 4.15
Table 7 shows the bottom ten rankings of satisfaction of Indian tourists which
were: spoken English of hotel staff (M = 2.99), spoken English language of local Thai
people (M = 3.01), vegetarian food in hotel (M = 3.02), Indian food in hotel (M = 3.09),
traffic conditions (M = 3.13), variety of food type (e.g. vegetarian) from
restaurants/bars/food outside hotel (M = 3.35), spoken English of local guide (M = 3.46),
knowledge of giving directions/suggestions of local Thai people (M = 3.48), western
food in hotel (M = 3.51), and knowledgeable and well-trained hotel’s staff (M = 3.61).
Interestingly, food was mentioned by Indian tourists the most in the bottom ten rankings

50
(four out of ten times), followed by speaking English ability (three out of ten times).
Indian tourists had the least satisfaction in regards to the English speaking of hotel staff
(M = 2.99) among all 58 attributes which was rated close to three. In other words, their
satisfaction level was close to neutral.
Table 7
Mean Score of the Bottom Ten Rankings of Indian Tourists’ Satisfaction on Bangkok
Area’s Attributes
Component Attributes Mean
Hotel/Lodging Spoken English of hotel staff 2.99
Overall trip experience Spoken English language of local Thai people 3.01
Hotel/Lodging Vegetarian food 3.02
Hotel/Lodging Indian food in hotel 3.09
Transportation Traffic conditions 3.13
Restaurant/Bars/Food outside hotel Variety of food type (e.g. vegetarian) 3.35
Local guide Spoken English 3.46
Local people Knowledge of giving directions/suggestions 3.48
Hotel/Lodging Western food in hotel 3.51
Hotel/Lodging Knowledgeable and well trained staff 3.61
RQ 6: What are the satisfaction levels of Indian tourists on each component of
Bangkok area’s attributes?
Respondents were asked to give rating on a five point Likert Scale, in which one
(1) indicated “very dissatisfied” and five (5) indicated “very satisfied.” The mean scores
of Indian tourists’ satisfaction on each component of Bangkok area’s attributes were

51
presented from Table 8 to Table 18. The attributes of each component were ranked
from the highest to the lowest satisfaction levels.
Table 8 shows the mean scores of satisfaction levels on hotel/lodging attributes.
The physical attributes of the hotel/lodging such as cleanliness (M = 4.09) or physical
appearance (M = 4.03) were ranked the highest whereas the lowest attribute was the
ability of the hotel’s staff in speaking English (M = 2.99). This indicated that Indian
tourists were more satisfied with the physical attributes of the hotels; however, they
were neither strongly satisfied nor dissatisfied with the staff’s ability to speak English.
Table 8
Mean Scores of Indian Tourists’ Satisfaction on Hotel/Lodging Attributes
Hotel/Lodging attributes Mean
Cleanliness of hotel room and public areas 4.09
Security at hotel 4.04
Physical appearance 4.03
Staff's helpfulness 3.93
Staff's courtesy 3.92
Services from hotel staff 3.81
Value for money 3.77
Staff did right job (no need to complain) 3.75
Quality of food 3.68
Knowledgeable and well trained staff 3.61
Western food in hotel 3.51
Indian food in hotel 3.09
Vegetarian food 3.02
Spoken English of hotel staff 2.99

52
Table 9 shows the mean scores of satisfaction levels of Indian tourists on
transportation attributes. Indian tourists were satisfied with the Bangkok metro (M =
4.03). However, the tourists had lowest satisfaction level on traffic conditions (M = 3.13).
Table 9
Mean Scores of Indian Tourists’ Satisfaction on Transportation Attributes
Local transport attributes Mean
Bangkok metro (bus, BTS) 4.03
Taxis 3.91
Cleanliness of local transportation 3.91
Value for money 3.79
Traffic conditions 3.13
Table 10 shows the satisfaction levels of Indian tourists on restaurants/bars/food
outside hotel. The tourists’ satisfaction levels fell between neutral to satisfied on all of
these attributes. The lowest satisfaction in this category was the variety of food (M =
3.35).
Table 10
Mean Scores of Indian Tourists’ Satisfaction on Restaurants/Bars/Food outside Hotel
Attributes
Restaurants/bars/food outside hotel attributes Mean
Hygiene and cleanliness of food service staff 3.75
Thai food 3.75
Cleanliness and sanitation of restaurants/bars/food 3.70
Value for money 3.68
Variety of food type (e.g. vegetarian) 3.35

53
Table 11 shows the satisfaction levels of Indian tourists on shopping attributes.
Their satisfaction levels were high on this component. Most of these attributes fell in the
range of satisfied and very satisfied such as shopping in the big stores (M = 4.14), night
markets (M = 4.08), or clothing/handicrafts (M = 4.01). High end stores were rated with
the mean score of 3.93 or satisfied. However, when it was compared with other types of
shopping centers, its value was rated the lowest.
Table 11
Mean Scores of Indian Tourists’ Satisfaction on Shopping Attributes
Shopping attributes Mean
Big stores/Malls (e.g., Central World, Siam Paragon) 4.14
Night markets/Bargain shopping/Local shops (e.g., MBK) 4.08
Clothing/Handicrafts 4.01
Value for money 4.00
Security of shopping facilities 3.94
International/High end stores (e.g., Gucci, LaCoste) 3.93
Electronic products 3.83
Table 12 shows the satisfaction levels of Indian tourists on local Thai people
attributes. The tourists were satisfied with the friendliness of local Thai people (M =
3.99), however, the mean score on knowledge of local Thai people in giving
directions/suggestions (M = 3.48) was rated the lowest among others.

54
Table 12
Mean Scores of Indian Tourists’ Satisfaction on Local People Attributes
Local people attributes Mean
Friendliness of local Thai people 3.99
Helpfulness of local Thai people 3.88
Knowledge of local Thai people to give directions/suggestions 3.48
Table 13 shows the satisfaction levels of Indian tourists on local guide attributes.
The mean scores on helpfulness (M = 3.82) and knowledge of local guide (M = 3.80)
were almost equal which were rated on the satisfaction level between neutral to
satisfied.
Table 13
Mean Scores of Indian Tourists’ Satisfaction on Local Guide Attributes
Local guide attributes Mean
Helpfulness 3.82
Knowledge 3.80
Spoken English 3.46
Table 14 shows the satisfaction levels of Indian tourists on attributes of the
Suvarnabhumi International Airport. The tourists had a strong satisfaction level on this
component. Each attribute was rated on the satisfaction level between satisfied and
very satisfied. The cleanliness was rated the highest in this category (M = 4.52) and
also among all 58 attributes of the Bangkok area.

55
Table 14
Mean Scores of Indian Tourists’ Satisfaction on Suvarnabhumi International Airport
Attributes
Suvarnabhumi International Airport attributes Mean
Cleanliness 4.52
Availability of facilities and services 4.24
Courtesy of custom/immigration officials 4.21
Convenience from airport to hotel/city 4.17
Speed of check-in and check-out 4.17
Helpfulness of custom/immigration officials 4.15
Table 15 shows the satisfaction levels of Indian tourists on activities attributes.
The tourists were satisfied with the night life/bars/night clubs (M = 4.16) which was
ranked number one in this component.
Table 15
Mean Scores of Indian Tourists’ Satisfaction on Activity Attributes
Activity attributes Mean
Night life/Bars/Night clubs 4.16
Local tours (e.g., elephant show) 4.07
Adventure sports (e.g., parasailing) 3.96
Activities for children/family 3.96
Table 16 shows the satisfaction levels of Indian tourists on attraction attributes.
They were satisfied with all attributes from this component. Historical

56
architecture/palaces/ancient ruins/temples was ranked the highest (M = 4.22), followed
by nature/beaches (M = 4.17).
Table 16
Mean Scores of Indian Tourists’ Satisfaction on Attraction Attributes
Attraction attributes Mean
Historical architecture/Palaces/Ancient ruins/Temples 4.22
Nature/Beaches 4.17
Cleanliness of overall travel attractions 4.08
Culture/Festival/Events (e.g., Thai dance) 4.06
Modern amenities (e.g., bathroom) at tour destinations 4.04
Table 17 shows the satisfaction levels of Indian tourists on information service
attributes. Both attributes, signage/notices at attractions/facilities (M = 3.77) and
information services (M = 3.75), were rated on the satisfaction levels between neutral
and satisfied.
Table 17
Mean Scores of Indian Tourists’ Satisfaction on Information Service Attributes
Information service attributes Mean
Signage and notices at attractions and facilities 3.77
Info services 3.75
Table 18 shows the satisfaction levels of Indian tourists on their overall trip
experience attributes. The tourists indicated that they were strongly satisfied with the
overall trip experience (M = 4.20) however they were neither unsatisfied nor satisfied
with the spoken English ability of local Thai people (M = 3.01).
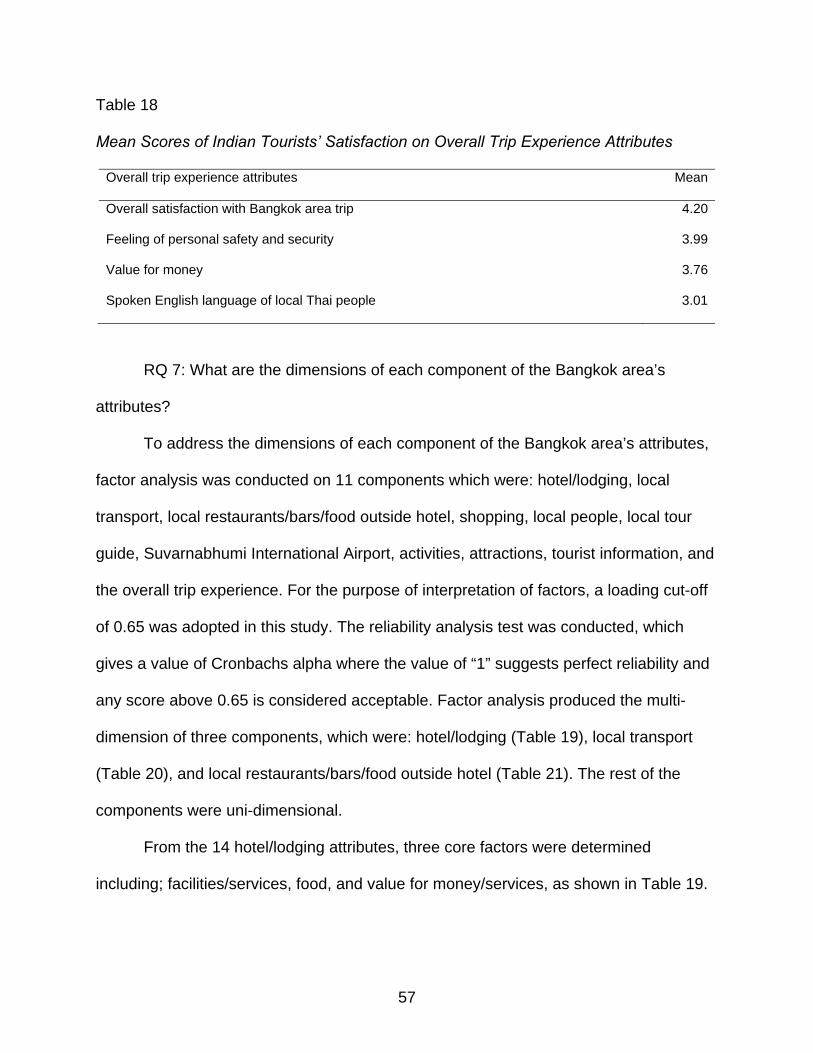
57
Table 18
Mean Scores of Indian Tourists’ Satisfaction on Overall Trip Experience Attributes
Overall trip experience attributes Mean
Overall satisfaction with Bangkok area trip 4.20
Feeling of personal safety and security 3.99
Value for money 3.76
Spoken English language of local Thai people 3.01
RQ 7: What are the dimensions of each component of the Bangkok area’s
attributes?
To address the dimensions of each component of the Bangkok area’s attributes,
factor analysis was conducted on 11 components which were: hotel/lodging, local
transport, local restaurants/bars/food outside hotel, shopping, local people, local tour
guide, Suvarnabhumi International Airport, activities, attractions, tourist information, and
the overall trip experience. For the purpose of interpretation of factors, a loading cut-off
of 0.65 was adopted in this study. The reliability analysis test was conducted, which
gives a value of Cronbachs alpha where the value of “1” suggests perfect reliability and
any score above 0.65 is considered acceptable. Factor analysis produced the multi-
dimension of three components, which were: hotel/lodging (Table 19), local transport
(Table 20), and local restaurants/bars/food outside hotel (Table 21). The rest of the
components were uni-dimensional.
From the 14 hotel/lodging attributes, three core factors were determined
including; facilities/services, food, and value for money/services, as shown in Table 19.
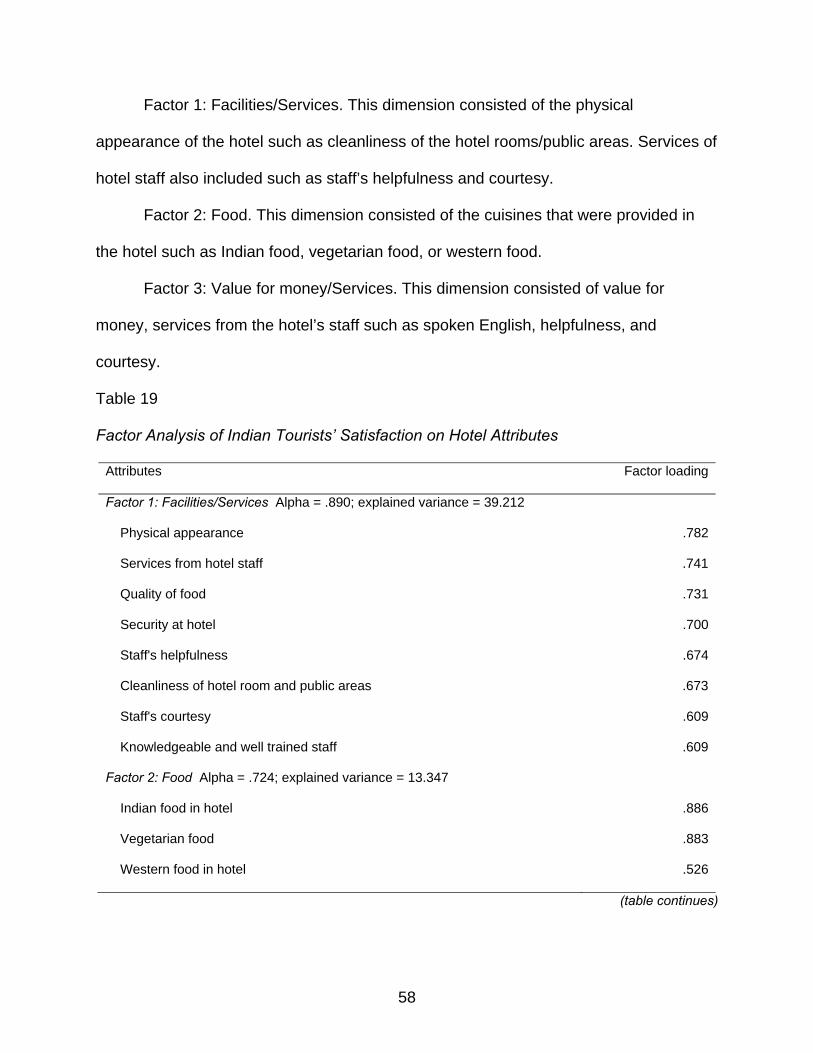
58
Factor 1: Facilities/Services. This dimension consisted of the physical
appearance of the hotel such as cleanliness of the hotel rooms/public areas. Services of
hotel staff also included such as staff’s helpfulness and courtesy.
Factor 2: Food. This dimension consisted of the cuisines that were provided in
the hotel such as Indian food, vegetarian food, or western food.
Factor 3: Value for money/Services. This dimension consisted of value for
money, services from the hotel’s staff such as spoken English, helpfulness, and
courtesy.
Table 19
Factor Analysis of Indian Tourists’ Satisfaction on Hotel Attributes
Attributes Factor loading
Factor 1: Facilities/Services Alpha = .890; explained variance = 39.212
Physical appearance .782
Services from hotel staff .741
Quality of food .731
Security at hotel .700
Staff's helpfulness .674
Cleanliness of hotel room and public areas .673
Staff's courtesy .609
Knowledgeable and well trained staff .609
Factor 2: Food Alpha = .724; explained variance = 13.347
Indian food in hotel .886
Vegetarian food .883
Western food in hotel .526
(table continues)

59
Table 19 (continued).
Attributes Factor loading
Factor 3: Value for money/Services Alpha = .788; explained variance = 7.157
Value for money .749
Staff's helpfulness .583
Staff did right job (no need to complain) .564
Staff's courtesy .520
Spoken English of hotel staff .474
From the five transportation attributes, two core factors were determined
including; the traffic system and public transportation, as shown in Table 20.
Factor 1: Traffic system. This dimension consisted of traffic conditions, the
cleanliness of the local transportation, and value for money.
Factor 2: Public transportation. This dimension consisted of the Bangkok metro
and taxis.
Table 20
Factor Analysis of Indian Tourists’ Satisfaction on Transportation Attributes
Attributes Factor loading
Factor 1: Traffic system Alpha = .672; explained variance = 49.499
Traffic conditions .895
Cleanliness of local transportation .765
Value for money .629
Factor 2: Public transportation Alpha = .711; explained variance = 22.102
Bangkok metro (bus, BTS) .859
Taxis .844
Value for money .481

60
From the five restaurants/bars/food outside hotel attributes, two core factors were
determined including; cleanliness and food product/value for money as shown in Table
21.
Factor 1: Cleanliness. This dimension consisted of the cleanliness and sanitation
of restaurants/bars/food and hygiene and the cleanliness of food service staff.
Factor 2: Food product/Value for money. This dimension consisted of Thai food,
variety of food, and value for money.
Table 21
Factor Analysis of Indian Tourists’ Satisfaction on Restaurants/Bar/Food outside Hotel
Attributes
Attributes Factor loading
Factor 1: Cleanliness Alpha = .767; explained variance = 53.641
Hygiene and cleanliness of food service staff .932
Cleanliness and sanitation of restaurants/bars/food .874
Variety of food type (e.g. vegetarian) .495
Factor 2: Food product/Value for money Alpha = .683;explained variance = 20.475
Thai food .889
Value for money .798
Variety of food type (e.g. vegetarian) .479
RQ 8: What do Indian tourists enjoy, dislike, and suggest about the Bangkok
area trip?
On the last section of the survey, the respondents were asked to give comments
about the trip experiences on enjoyment of the experience, dislike of the experience,
and suggestions on the trip experience. The results were computed from the frequency

61
of the keywords that appeared in the open-ended questions. Table 22 through Table 24
present the findings from open-ended questions.
Table 22 shows the attributes that Indian tourists enjoyed on the trip which were
shopping (30.96%), followed by attraction (29.67%), activities (18.70%), friendliness of
Thai people (14.83%), and food (5.8%), respectively.
Table 22
Enjoyment of Experiences of Indian Tourists on Bangkok Area Trip
Enjoy N (155) (%)
Shopping
Shopping experience
Shopping malls
Local/Bargain shopping
48
25
12
11
30.96
16.12
7.74
7.09
Attraction
Beaches/Islands
Historical attractions
Modern city
Culture
46
26
14
4
2
29.67
16.77
9.03
2.58
1.29
Activities
Entertainment/Shows
Massage/Spas
Safari park
Adventure sports
29
11
7
6
5
18.70
7.09
4.51
3.87
3.22
Friendliness of Thai people 23 14.83
Food 9 5.80
Note. N = the number of times that the item was mentioned.
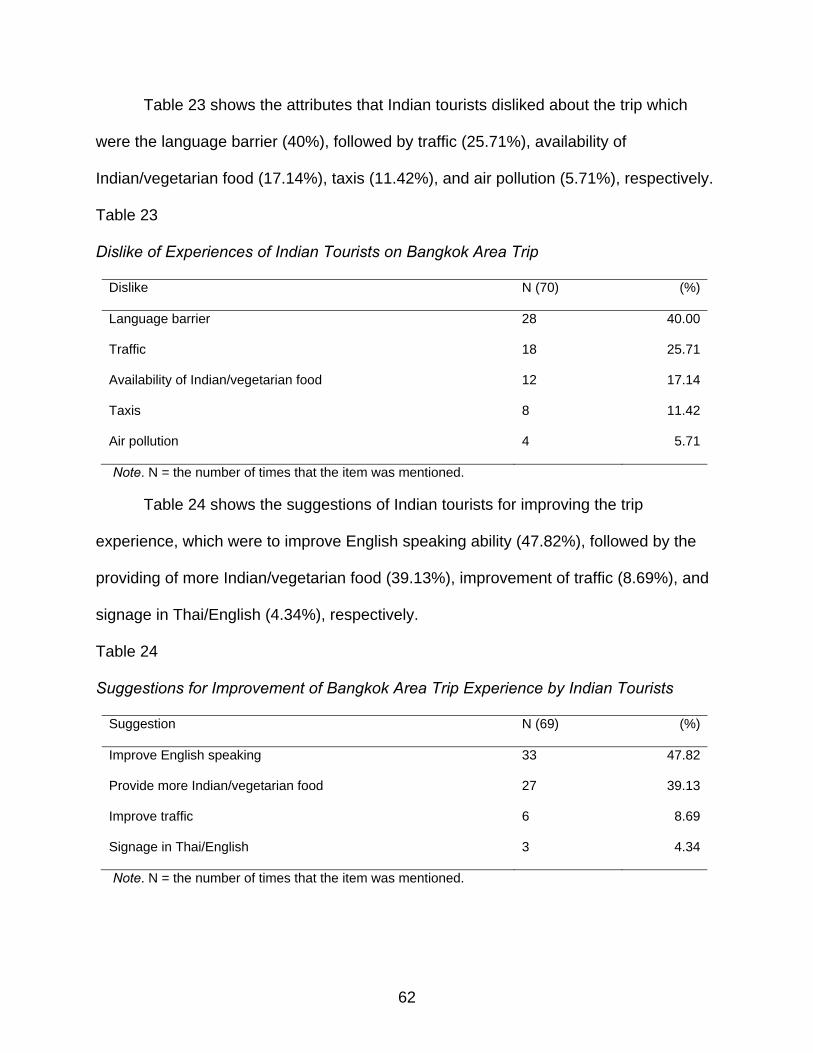
62
Table 23 shows the attributes that Indian tourists disliked about the trip which
were the language barrier (40%), followed by traffic (25.71%), availability of
Indian/vegetarian food (17.14%), taxis (11.42%), and air pollution (5.71%), respectively.
Table 23
Dislike of Experiences of Indian Tourists on Bangkok Area Trip
Dislike N (70) (%)
Language barrier 28 40.00
Traffic 18 25.71
Availability of Indian/vegetarian food 12 17.14
Taxis 8 11.42
Air pollution 4 5.71
Note. N = the number of times that the item was mentioned.
Table 24 shows the suggestions of Indian tourists for improving the trip
experience, which were to improve English speaking ability (47.82%), followed by the
providing of more Indian/vegetarian food (39.13%), improvement of traffic (8.69%), and
signage in Thai/English (4.34%), respectively.
Table 24
Suggestions for Improvement of Bangkok Area Trip Experience by Indian Tourists
Suggestion N (69) (%)
Improve English speaking 33 47.82
Provide more Indian/vegetarian food 27 39.13
Improve traffic 6 8.69
Signage in Thai/English 3 4.34
Note. N = the number of times that the item was mentioned.
63
RQ 9: What are the differences between package-tour Indian tourists (PKIT) and
independent Indian tourists (INIT) concerning: importance level of information sources
and satisfaction level on the Bangkok area attributes?
ANOVA addressed the differences of the two pairs of Indian tourists in two
issues. The first pair consisted of a package-tour Indian tourists (PKIT) and independent
Indian tourists (INIT), as shown in Table 25. The second pair consisted of the first-time
Indian tourists (FTIT) and repeat Indian tourists (RPIT), as shown in Table 26. These
two groups were tested according to the differences in two issues. The first issue was
the importance of information sources in decision-making on the trip, and the second
was the satisfaction level of Bangkok area attributes.
Within these two issues, there are eleven components tested, which included
hotel/lodging, local transport, local restaurants/bars/food outside the hotel, shopping,
local people, local tour guides, Suvarnabhumi International Airport, activities,
attractions, tourist information, and the overall trip experience.
The differences between PKIN/INIT on an importance of information sources in
decision-making on the trip and the satisfaction with Bangkok area attributes are
presented in Table 25. Seven of out 64 items were found to differ: travel agent, travel
magazine, quality of food in hotel, services from hotel staff, Thai food in restaurants
outside hotel, night life, and signage.
Indian tourists who bought package-tours to the Bangkok area indicated that the
travel agent (M = 3.25) and travel magazine (M = 3.04) were the important sources in
their decision to make the trip, whereas the INIT group rated the travel agent with the
mean score of 2.35 and travel magazine as 2.59. There were no differences found
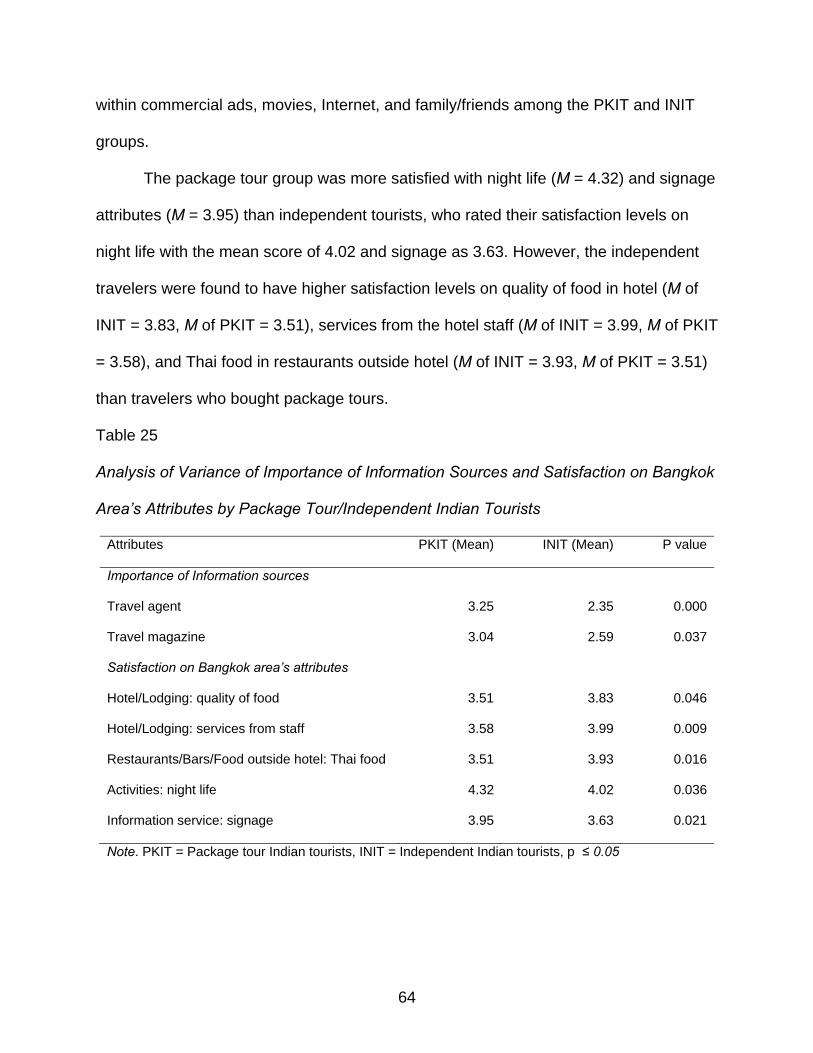
64
within commercial ads, movies, Internet, and family/friends among the PKIT and INIT
groups.
The package tour group was more satisfied with night life (M = 4.32) and signage
attributes (M = 3.95) than independent tourists, who rated their satisfaction levels on
night life with the mean score of 4.02 and signage as 3.63. However, the independent
travelers were found to have higher satisfaction levels on quality of food in hotel (M of
INIT = 3.83, M of PKIT = 3.51), services from the hotel staff (M of INIT = 3.99, M of PKIT
= 3.58), and Thai food in restaurants outside hotel (M of INIT = 3.93, M of PKIT = 3.51)
than travelers who bought package tours.
Table 25
Analysis of Variance of Importance of Information Sources and Satisfaction on Bangkok
Area’s Attributes by Package Tour/Independent Indian Tourists
Attributes PKIT (Mean) INIT (Mean) P value
Importance of Information sources
Travel agent 3.25 2.35 0.000
Travel magazine 3.04 2.59 0.037
Satisfaction on Bangkok area’s attributes
Hotel/Lodging: quality of food 3.51 3.83 0.046
Hotel/Lodging: services from staff 3.58 3.99 0.009
Restaurants/Bars/Food outside hotel: Thai food 3.51 3.93 0.016
Activities: night life 4.32 4.02 0.036
Information service: signage 3.95 3.63 0.021
Note. PKIT = Package tour Indian tourists, INIT = Independent Indian tourists, p ≤ 0.05
65
RQ 10: What are the differences between first-time Indian tourists (FTIT) and
repeat Indian tourists (RPIT) concerning: importance level of information sources and
satisfaction level on the Bangkok area attributes?
The differences between first-time (FTIT) and repeat Indian tourists (RPIT) on an
importance of information sources in decision to make on the trip and the satisfaction
with the Bangkok area attributes were presented in Table 26. Six of out 64 items were
found to differ: movie/TV series, variety of food of restaurants outside hotel, Thai food
outside hotel, big shopping stores, electronic products, and value for money on
shopping.
Repeat tourists indicated that movie/TV series were more important to their
decision-making on the trip than first-time tourists (M of RPIT = 2.92, M of FTIT = 2.41).
There were no findings which indicated the differences on travel agent, travel magazine,
commercial ads, Internet, and family/friends among RPIT and FTIT.
Moreover, RPIT had higher satisfaction levels on variety of food of restaurants
outside hotel (M of RPIT = 3.53, M of FTIT = 3.19), Thai food outside hotel (M of RPIT =
3.98, M of FTIT = 3.47), big shopping stores (M of RPIT = 4.28, M of FTIT = 4.00),
electronic products (M of RPIT = 4.02, M of FTIT = 3.67), and value for money on
shopping (M of RPIT = 4.17, M of FTIT = 3.84) than first-time tourists.

66
Table 26
Analysis of Variance of Importance of Information Sources and Satisfaction on Bangkok
Area’s Attributes by First-time/Repeat Indian Tourists
Attributes FTIT (Mean) RPIT (Mean) P value
Importance of Information sources
Movie/TV series 2.41 2.92 0.028
Satisfaction on Bangkok area’s attributes
Restaurants/Bars/Food outside hotel: variety of food 3.19 3.53 0.040
Restaurants/Bars/Food outside hotel: Thai food 3.47 3.98 0.003
Shopping: big stores 4.00 4.28 0.033
Shopping: electronic products 3.67 4.02 0.014
Shopping: value for money 3.84 4.17 0.018
Note. FTIT = First-time Indian tourists, RPIT = Repeat Indian tourists, p ≤ 0.05
Revisitation/Recommendation
Objective 5: To examine the intention to return and willingness to recommend the
Bangkok area and Thailand.
RQ 11: What are the Indian tourists’ intention to return and willingness to
recommend the Bangkok area and Thailand?
Respondents were asked whether they would like to return or recommend the
Bangkok area and other parts of Thailand. Over 90% of them showed their willingness
to do so.

67
Table 27
Intention to Return and Willingness to Recommend the Bangkok Area and Thailand of
Indian Tourists
Intention and willingness Yes/No N (150) (%)
Intention to return to Bangkok Yes 135 93.1
No 10 6.9
Intention to return to Thailand Yes 137 96.5
No 5 3.5
Willingness to recommend Bangkok Yes 134 92.4
No 11 7.6
Willingness to recommend Thailand Yes 134 94.4
No 8 5.6
Note. Totals differ due to missing data.
This chapter presents the findings of the pre-purchase and the post-purchase
stage. The findings includes Indian tourists’ demographics, past experiences (travel
patterns), motivations to take the Bangkok area trip, level of importance of information
sources, level of satisfaction of Indian tourists on their travel experience on Bangkok
area attributes, and intention to return and willingness to recommend the Bangkok area
and Thailand.

68
CHAPTER 5
DISCUSSION AND IMPLICATIONS
Discussion
Satisfaction encourages a propensity of repurchasing and recommending
products to others including the travel product such as a city. City tourism is one of the
fastest growing segments in the tourism industry. The city of Bangkok, Thailand was
used as a setting of this study, in which it has numerous strong pull factors such as
World Heritage sites, world-class accommodation, etc. Indian people are one of the
biggest potential outbound markets, which has strong purchasing power because of its
economic growth. Thus, this study has a contribution to understand travel motivation,
perception, and satisfaction of Indian tourists on a Bangkok area trip.
The study was designed to identify Indian tourists’ demographics and travel
patterns including the motivation on the Bangkok area trip. Additionally, the study was to
examine the level of satisfaction of Indian tourists on their travel experience on Bangkok
area attributes, as well as the intention to return and willingness to recommend the
Bangkok area and Thailand.
The study was conducted at Suvarnabhumi International Airport in Bangkok. The
sample was a convenience sample of 300 Indian tourists who visited the Bangkok area
of Thailand from July 24-August 14, 2008. A total of 150 useable responses were
obtained. The five-section-survey (i.e., demographics and past experiences,
motivations, information sources, satisfaction, and open-ended questions and
dichotomous questions) was designed to answer 11 research questions. The survey
was available in English, Hindi, and Gujarati. The obtained data was analyzed by
69
descriptive analysis (frequency, percentage, and mean scores), analysis of variance,
and factor analysis.
The following section includes summarized findings and discussion of 11
research questions. This section is divided into two parts based on research framework
which are: pre-purchase and post-purchase stage.
Pre-purchase: demographics, past experiences, motivations, and information sources
Demographics and past experiences
The study found that Indian tourists who visited the Bangkok area were mostly
males on an average age of 38 or in the early adulthood (20-45 years old) (Zgourides,
2000), most of them were married. Most of tourists were from Mumbai and New Delhi
where Hindi language was widely used. Tourists were highly educated with bachelor’s
and master’s degrees. The majority were self-employed and employed by companies.
The household income was evenly distributed among all categories.
These Indian tourists were mostly leisure tourists who either traveled alone or
with spouses. There were almost equal numbers of first-time and repeat visitors. There
were slightly more visitors who took package tours than those who traveled
independently. The average length of their stay was six days. They spent the most
money on clothing (INR17,329), followed by electronics (INR12,069), and
handicrafts/souvenirs, (INR10,617), respectively (average spending/trip/household)
(currency exchange rate in July 2008, US$1 = INR42.80). Tourism Authority of Thailand
(TAT) (2008) reported the 2007-travel spending of Indian tourists that their total
spending was 4,700.76 baht/person/day (currency exchange rate in 2007, US$1 = Thai
Baht 32). They spent on each category as following: shopping, 1,631.43 baht;
70
entertainment, 400.45, sight-seeing, 200.05 baht; accommodation, 1,114.19 baht; food
and beverage, 747.77 baht; local transportation, 417.51 baht; and miscellaneous,
189.36 baht. Thus, shopping was identified as the top spending of Indian tourists.
Motivations
Indian tourists indicated their top rankings of travel motivation when deciding to
take the city of Bangkok area trip. These motivators were both push factors (the
psychological needs that motivate tourists to travel) and pull factors (the unique
attributes of the travel destination that motivate tourists to visit). Push factors were to
have fun, to see and experience a new destination(s), to do something exciting, to
reduce stress, to escape from the routine of work or life, and to learn new things. Pull
factors were to enjoy the beautiful environment, scenery, and beaches, to go to
Thailand/Bangkok, to enjoy shows and entertainment, and to enjoy international travel
experiences.
Referring back to Indian tourists’ demographic profiles, they were mostly leisure
travelers (65%), so it was common to see the push factors such as to have fun (ranked
first on the top ten motivation raking), or to enjoy the beautiful environment, scenery,
and beaches (ranked second on the top ten motivation raking) as the travel motivations.
This finding supported research by Hanqin and Lam (1999) who found both push and
pull factors motivated people to travel. However, the finding was different from the study
of Sangpikul (2008), which indicated that Japanese senior travelers were motivated to
visit Thailand by cultural and historical attractions, whereas, the result of these Indian
tourists suggested that they were more motivated by the beautiful environment,
scenery, and beaches (M = 4.04) than historical attractions (M = 3.56). Perhaps the age

71
difference between Indian tourists and senior Japanese tourists had an impact on their
different travel destination preferences. Moreover, the study of Rittichainuwat et al.
(2008) showed that tourists who visited Thailand were motivated the most by the desire
of seeing people from different cultures, seeing interesting cultural and historical
attractions, and taking a trip to Thailand worth the value for money.
To go to Thailand/Bangkok, the pull factor, was an influential motivator. Ng et al.
(2007) studied cultural distance and intention to visit travel destinations of Australian
travelers. The study found that the more geographical and cultural distance from
travelers’ home country, the less likely they would visit. Therefore, it might infer that
Indian tourists were comfortable enough to visit Thailand where there was less
geographical and cultural distance. Non-stop flights from New Delhi, India to Bangkok,
Thailand were just four hours. Thai culture had also been influenced by Indian culture in
many ways as evidenced from architecture of Thai temples, religions, Thai food, and
traditional therapies like massage. The study was also consistent with the study of
Master and Prideaux (2000) stating that smaller gap of the cultural differences (e.g.,
shopping habits, cuisine, and language) was desirable even though these differences
did not significantly impact satisfaction.
The study found four core dimensions were produced from factor analysis on 20
motivators that influenced Indian tourists in making the decision to visit the Bangkok
area. These dimensions were Novelty Seeking, Stress Busting/Fun, Achievement, and
Family Oriented/Education. The result of factor analysis was generally supported by the
study of Hanqin and Lam (1999), Rittichainuwat et al. (2008), Sangpikul (2008) and
72
Yoon and Uysal (2005). The finding confirmed that Indian tourists’ travel behavior was
driven by internal (push) and external (pull) factors.
Information sources
Family and/or friends and the Internet were perceived by Indian tourists as
important sources in trip decision making. According to Engel et al. (1995), consumers
were influenced by word of mouth in several situations such as when they purchased
complex products, when other sources were perceived as low credibility, or when there
were strong social ties between information transmitters and receivers. Word of mouth
is a successful marketing tool in advertising the products (Lee, 1999); however,
marketers should be aware that unsatisfied customers can spread bad words about
their bad experiences as well.
The Internet also influenced the decision-making of Indian tourists to visit
Bangkok. Buhalis’s study (1998) and Werthner and Ricci (2004) supported that the
Internet increasingly becomes an important source in searching for travel information
since tourism is a unique and intangible product and travelers cannot see the actual
product during the pre-purchase process. Therefore, they rely solely on the online
information search for planning, searching, purchasing, and amending their travel.
Louvieris and Oppewal (2004) indicated that although talking to friends or relatives
(traditional channels) was regarded as more important than the Internet and travel
shops for the preparation of holiday in the information search stage, the Internet was an
important source during the purchasing stage. Li and Buhalis (2006) found that there is
a trend that consumers perceive benefits from eChannels which are expected to
increase both in the information search and purchasing stage in the near future. In

73
addition, the more frequently one uses the Internet, the higher the chance that person
will become an online shopper.
Post-purchase: satisfaction, intention to return, and willingness to recommend
Satisfaction
Indian tourists’ satisfaction was generally positive. They rated their satisfaction
level on the Bangkok area attributes high over a value of neutral. Among 58 Bangkok
area attributes, 22 attributes were rated between the values of four to five, or between
satisfied to very satisfied, 35 attributes were rated between the values of three to four,
or between neutral to satisfied, and one attribute was rated below three or value of
neutral. The attribute labeled cleanliness of Suvarnabhumi International Airport was
rated the highest (M = 4.52) and the speaking of English of hotel’s staff was rated the
lowest (M = 2.99) on the satisfaction level. Indian tourists rated their satisfaction high on
Suvarnabhumi International Airport attributes, attraction attributes, and shopping
attributes whereas the tourists rated their satisfaction low on the English speaking
ability, variety of food, and traffic. The finding was consistent with the study of
Rittichanuwat et al. (2001) that Thailand was perceived with high standards for
sanitation and cleanliness. Recently, Bangkok has been awarded a clean and green
land (Department of Natural Resources and Environment, 2008).
It is interesting to note that when comparing the findings of the satisfaction level
of Bangkok area attributes as shown earlier across other dimensions like factor analysis
or the open-ended questions, the findings still yielded the similar answer. First, factor
analysis was performed to provide the dimensions of each category of Bangkok area
attributes such as hotel/lodging, transportation, etc. There were three dimensions of

74
hotel/lodging (facilities/services, food, and value for money/services), two dimensions of
transportation (traffic system and public transportation), and two dimensions of
restaurants/bars/food outside hotel (cleanliness and food product/value for money). The
dimension labeled facilities/services of the hotel consisted of physical appearance,
cleanliness, staff’s helpfulness, staff’s courtesy, etc. was rated very high on satisfaction
level. The dimension labeled value for money/services, such as the hotel staff’s ability to
speak English, was rated low. Traffic system was rated lower than public transportation.
Food product/value for money of the restaurants/bar/food outside hotels was rated
lower than cleanliness of the restaurants.
The open-ended questions yielded similar results with the satisfaction level on
Bangkok area attributes. The tourists enjoyed shopping the most, followed by
attractions, activities, and friendliness of Thai people. They disliked the language
barrier, traffic, unavailability of Indian/vegetarian food, taxis, and air pollution. They
suggested improving the English speaking ability, traffic, and signage in both Thai and
English. Thailand was perceived by international tourists as friendly with beautiful
scenery (Tapachai & Waryszak, 2000). The findings conform with the study of
Rittichanuwat et al. (2001) indicating that Thailand was perceived as having a variety of
activities, numerous cultural and historical attractions, and a good place for shopping;
however, there were traffic jams in the big cities. Ngamsom (2001) also mentioned that
Thailand, Singapore, and Hong Kong were perceived as the best Southeast Asian
shopping destinations. Thailand became popular for its bargain shopping where
shoppers had less stress in negotiating the prices than in Singapore and Hong Kong.
The friendliness of the Thai people created a nice service ambience to tourists.

75
The study found Indian tourists who a bought package tour (PKIT) to Bangkok
rated travel agents and travel magazines more important as informational sources in
decision-making on the Bangkok area trip than Indian tourists who travel independently
(INIT). The finding was consistent with the study of Pearce and Schott (2005), which
stated that international tourists used the travel agent the most as an information source
for transportation information, and guidebooks/directories were used for obtaining
accommodation and attraction information.
The PKIT were more satisfied with night life and signage than INIT, however,
PKIT had less satisfaction on quality of food in hotel, services from hotel staff, and Thai
food in restaurants outside hotel. Morrison (1989), cited from Wong and Kwong, (2004,
p. 581) defined the all inclusive package tour as, “a trip planned and paid for a single
price in advance, which covers commercial transportation and accommodation, meals
and sightseeing, and sometimes with an escort or guide.” This infers that PKIT perhaps
received sufficient information on night life activities and travel information from tour
guides. However, restricted by choices of arranged programs may impact or lower the
satisfaction of PKIT than INIT in quality of food in hotel, services from hotel staff, and
Thai food in restaurants outside hotel. The finding was in contrast with the study of
Weaver et al. (2007) indicating that the package tours group rated service quality higher
than the independent tourists did due to the fact that the package tour was prepared by
tour operators for tourists, so they were experiencing good service from tour guides,
hotels, and restaurants.
Repeat Indian tourists (RPIT) indicated that movie/TV series was more important
on their decision-making on the Bangkok area trip than first-time tourists (FTIT). Vogt
76
and Andereck (2003) stated that first-time vacationers formed a destination image
based on various information channels during an information searching stage, whereas
the repeat vacationers relied on their past experiences, and they may or may not have
exposed themselves to new information. Based on the study by Kim and Richardson
(2003), films had influenced viewers on intention to visit the destination. It may be
possible to conclude that movie/TV series may remind RPIT about their previous trips to
Thailand so they rated movie/TV as an importance source on their trip decision making.
Moreover, RPIT had higher satisfaction levels with the variety of food in
restaurants outside the hotel, Thai food outside hotel, big shopping stores, electronic
products, and value for money on shopping than FTIT. The finding was consistent with
the study of Li et al. (2008) who stated that repeat tourists had a higher satisfaction level
than first-time tourists. Beerli and Martín (2004) mentioned that the more experiences
with the destination the tourists had, the better destination image they would have
because they were more familiar with the destinations. Thus, it may be concluded that
previous trip experiences of RPIT resulted in higher satisfaction level on these attributes
than FTIT had so they knew where to shop, stay, and eat.
Revisitation/recommendation
A majority of Indian tourists (over 90%) indicated that they would return and
recommend Bangkok and Thailand as travel destinations. They were generally satisfied
with the Bangkok area attributes. This confirms the study on satisfaction for Thailand
trips by international tourists of Ngamsom (2001) stating that the higher satisfaction
travelers had toward their trips, the more likely they would revisit a destination. Several
studies also mentioned that the more positive the feelings of tourists on the destination

77
image, the higher they would perceive the trip quality, and the more positive their
behavioral intention would be (Bramwell, 1998; Chen & Tsai, 2007; Hui et al., 2007).
However, the findings were different from the studies of Bigné et al. (2001), Hsu and
Kang (2007) and Kozak and Rimmington (2000), which stated that it was not necessary
that the satisfied tourists would revisit the destination.
Implications
This section proposes practical solutions to the Thai government, Tourism
Authority of Thailand, and other travel businesses, which will open business
opportunities and increase competitiveness as follows.
Thai government
Thai government should take actions on three main issues: traffic control,
signage, and the language barrier. Traffic congestion is always a problem in big cities.
Bangkok has been dealing with this problem for a long time. The Skytrain (BTS) and
subway systems were built to mitigate this problem, along with other projects (e.g.,
Suvarnabhumi Airport Rail Link (SARL)) which are under construction. Thus, the Thai
government should speed up the process of constructing these mass transportations.
Signage should be in Thai and English, especially the signage at travel destinations.
Thai government may cooperate with Hospitality and Tourism schools to initiate a
student volunteer program which could then provide travel information to tourists in
major travel destinations. It would be a win-win situation in which the government can
partly solve a language barrier between Indian tourists and local Thai people. Thai
students will have an opportunity to practice English and get familiar with the tourism
industry.
78
Moreover, the Thai government should also encourage Thai movies/TV series to
go international so they might promote Thai tourism and remind repeat tourists about
their previous trips to Thailand. Thai movies/TV series are expected to stimulate the
needs of travelers in coming to Thailand. Inviting Indian film and TV producers to shoot
films/TV series in Thailand is also recommended because the Indian film industry is the
largest in the world and Indian movies are shown worldwide. Thailand would gain more
tourists from many countries.
Tourism Authority of Thailand (TAT)
TAT has two offices in India (New Delhi and a representative office in Mumbai).
The offices should launch two campaigns to promote the hidden, or little known values:
family activities and vegetarian food. TAT should also include this information in TAT’s
website.
There are numerous fun things to do in Pattaya and the Bangkok area, such as
taking a safari tour, visiting a crocodile farm, or playing water sports. Some Indian
tourists mentioned participating with these activities but some others had not even been
acquainted with them. They perceived Pattaya as having only a few family activities
which are overshadowed by the night life entertainment. Therefore, TAT should promote
those aspects of the destination that provide variety of activities for families. In the
meantime, the city of Pattaya should improve their zoning regulations. The adult
entertainment area should be clearly separated so as not to overlap with the family-
friendly areas.
There are many Thai people who are vegetarians, as can be seen from the
annual vegetarian festival in September or early October. One of the biggest
79
celebrations of this vegetarian festival takes place in Phuket, the beach destination
located in the south of Thailand. The restaurants that provide vegetarian meals will put
up yellow signs in front of their restaurants to inform customers. However, Indian
tourists suggested that Thailand should provide more Indian or vegetarian food since
they had difficulties in searching out the vegetarian food outlets. Therefore, TAT should
launch a campaign on vegetarian food to reveal this hidden value to Indian tourists. In
1998, TAT launched the Clean Food Good Taste program to promote Thai food to
tourists by providing signs to participating restaurants. Similar to that, TAT may do the
same but with restaurants that provide vegetarian food. The list of the participating
restaurants should be included in TAT’s website.
Rather than treating tourists as being a homogeneous group of Indian tourists,
TAT needs to treat them as distinctive segments (novelty seeking, stress busting/fun,
achievement, and family oriented/education). Advertisement should be launched
specifically for each group by designing ads to be content-based or geared toward a
group’s main motives. For example, visiting beautiful environments and beaches is the
main motive of the novelty seeking group, therefore the ad should emphasize the
natural sceneries, so that the ad can stimulate the needs of the novelty seekers to
travel. Overall, the ads should focus on fun activities like shopping, visiting beautiful
beaches, and the top attractions of Bangkok like palaces, relaxation, and
shows/entertainment, since these aspects are the primary motives of Indian tourists in
making the decision to travel to the Bangkok area. The ads should be presented in both
English and Hindi and advertised through websites which the tourists indicated as an
important travel resource. The ads, however, should not be overstated, because this will
80
create unreasonably high expectations for tourists. Furthermore, TAT should organize
familiarization trips (Fam trips) for officers of local travel magazines and tour companies
in India. Thailand will receive benefits from publicity through these sources which local
Indian people trust.
Both first-time and repeat Indian tourists were satisfied with their Bangkok trips
and indicated that they would revisit Bangkok and Thailand. Nonetheless, when the
Indian market becomes mature, new travel products should be provided such as new
travel destinations like floating markets (two hours from Bangkok) or other beach
attractions.
Hotel/lodging
Hotels should maintain the current standard of physical attributes such as
cleanliness, security, and physical appearance with which Indian tourists were highly
satisfied. However, improving the current hotel staff’s ability to speak English should be
focused on more. Hotels may offer an English training program to their staff. Moreover,
Indian food or vegetarian food should be provided in hotels for Indian tourists as well as
vegetarian tourists from other nations.
Transportation
Indian tourists were satisfied with public transportation in Bangkok like BTS.
However, based on suggestions from open-ended questions, some tourists had
problems with metered taxis. The problem occurred when special services like inclusive
price (without using meter) were arranged between tourists and metered taxi drivers
such as the taxis’ service rental fee for a whole day trip or a hotel-to-airport trip. The
service was perceived as unfair since the tourists were not familiar with the streets in

81
Bangkok. In addition to that, while the drivers tried to use short-cuts to avoid the traffic
jam from the main street, the tourists thought that they were being fooled by the drivers
who were trying to gain more meter mileage from driving off of the route. Therefore, a
standardized pricing system for taxis is needed to solve this problem. Installing a Global
Positioning System (GPS) in the taxis may solve this unfair service, since the tourists
could see the duration and distance it will take them from one destination to another.
Indian tourists also identified an inefficient English speaking ability of the taxi drivers, so
virtual access from cell phone or radio dispatch to a calling center should be provided in
such case to facilitate tourists’ requests, as a communicative medium between the
drivers and the tourists.
Restaurants/bars/food outside hotel
Other than Indian restaurants, local Thai restaurants located where Indian
tourists are highly concentrated, such as the Nana area in Bangkok or the Pattaya area
can capture the Indian tourists market by offering vegetarian meals. There are several
good reasons for why vegetarian plates should be added to the menus. First, Thailand
constantly has Indian tourists’ visits all year round. Second, there are both Indian
tourists who travel independently and with package tours to Thailand. The package
tours do not include all meals, so there is a chance that tourists will explore the city
themselves to have meals outside the hotels. Third, vegetarian meals are easy to
prepare since there are no complicated ingredients that the restaurants need to stock in
the inventory. Thai vegetarian meals can be prepared by basically having vegetable,
soy source, tofu and vegetable soup stock. Thus, adding vegetarian plates to the menus
will attract Indian tourists as an additional market from their regular customers. The

82
restaurants should put signs or stickers indicating a vegetarian food serving in front of
the restaurants where tourists can easily see them.
Shopping outlets
The Indian tourists were generally satisfied with the shopping experience in
Bangkok, Thailand. According to the open-ended questions, some Indian tourists
indicated that shopping centers should be open longer hours. Therefore, the store hours
may be extended for two or three hours during the travel season for tourists. Night
markets may take this comment as a business opportunity since they are open from 7
p.m. until 2 a.m. The night markets simply need to advertise more so that the Indian
tourists know that they are another shopping option after the regular stores’ shopping
hours. Brochures can be made about the night markets and circulated to hotels.
Local Thai people
Indian tourists were impressed with the hospitality of Thai people. However, Thai
people should know some basic English, at least to give directions or tourist information
centers’ numbers so that tourists can obtain further travel information. The useful
number for needed assistance and help would be 1155, which tourists could reach the
Thai tourist police.
Tour companies in India
The study found that Indian tourists were satisfied with attractions and activities
that they had participated on the trips. The analysis of variance, however, indicated that
Indian tourists with package tours were less satisfied than Indian tourists who travel
independently in quality of food in hotel, services from hotel staff, and Thai food in
restaurants outside hotel. Therefore, tour companies in India should cooperate with
83
hotels and tour companies in Thailand to adjust a package tour that provides more
variety of service choices.
Low-price package tours may limit the quality of food in the hotel and the
services from hotel staff. A choice of variety hotels (with different prices and services)
should be provided so that Indian tourists can have a variety of options while staying in
Thailand. The tour companies in India should focus more on providing the information
about food outlets. This information should be presented at the point of purchase to
ensure the tourists of the availability of Indian or vegetarian food. The Indian tour
companies may obtain a list of local Thai restaurants that offer Indian or vegetarian food
at the travel destinations from local Thai tour companies with whom they are partnered.
Local tour companies in Thailand
The major concern of Indian tourists about the services from local tour company
is the language problem of tour guides. Although guides were able to speak English,
they did not quite satisfy Indian tourists. Since English is widely used in India, the
tourists may have high expectations on this matter. Thus, tour companies should
recommend that their tour guides constantly improve their English speaking skills.
Moreover, tour itineraries should be arranged by considering traffic conditions. Since the
traffic jam and pollution can lower the satisfaction level of Indian tourists, avoiding the
arrangement of a tour program that would confront with the rush hours in Bangkok is
recommended.
Suvarnabhumi International Airport
Indian tourists were highly satisfied with Suvarnabhumi International Airport in
areas such as cleanliness, facilities, etc. However, there is still room for improvement in

84
some aspects. Based on the Indian tourists’ suggestions, Suvarnabhumi International
Airport should provide Indian or vegetarian food outlets in the airport. This will bring a
big amount of revenue for the airport since there are a large number of Indian tourists
traveling from Suvarnabhumi International Airport to India each day. Even though the
Suvarnabhumi International Airport has numerous travel information kiosks, Indian
tourists have suggested that the information counters or the information kiosks should
be placed where they could easily be seen, such as in front of the arrival gate exits.
In conclusion, this chapter discusses the research findings and related studies
based on research framework, which presents Indian tourists’ trip decision making: pre-
purchase, purchase, and post-purchase stage. During the pre-purchase stage, Indian
tourists were motivated to visit the Bangkok area by both push and pull factors. They
created the images of Bangkok area from the information that they obtained from their
family and/or friends as well as from the Internet. When they were on their trips or in
purchase stage, they experienced several attributes of the travel destinations such as
hotels, restaurants, shopping outlets, airports, etc. As the result of comparing their
expectations/perceptions to the destination with their actual experiences in Bangkok,
the study found that Indian tourists (during the post-purchase stage) were generally
satisfied with Bangkok area’s attributes. They showed their willingness of returning and
recommending Bangkok and Thailand as travel destinations. In addition, Thai
government, Tourism Authority of Thailand, and other travel businesses were presented
with the practical solutions that would open business opportunities and increase
competitiveness.

85
CHAPTER 6
LIMITATIONS AND RECOMMENDATIONS FOR FUTURE STUDY
This chapter presents limitations and recommendations for further study in the
related topics.
Limitations
The interpretations of the results of this study were limited. There were several
limitations on this study: data collection, generalizability of the study, and scope of
study.
Access to travelers was limited due to airport policies. The researcher was
allowed to collect data in all airport areas except at the departure lounge. Although, the
researcher was well assisted by the officers of Suvarnabhumi International Airport and
the Police Department of the Thai Immigration, the collection of data was challenging.
The researcher had accessibility to the duty-free shopping areas and the check-in
counter, but these areas were not optimal for data collection. Access to the departure
lounge where respondents had time to complete the survey was denied. Moreover, the
sample was drawn from visitors who departed through Suvarnabhumi International
Airport from July 24 – August 14, 2008. This may cause possible non-representation for
year round tourists and tourists using other modes of transportation.
It was difficult to generalize the findings to all Indian tourists since majority of
Indian tourists were from Mumbai and New Delhi. The small sample size also could not
provide sufficient data to be analyzed such as segmenting Indian tourists from mother
tongues or hometowns. In addition, Indian culture respects elders and family leaders.
Males who were the family’s leader were overrepresented in the study since the leaders
86
predominantly filled out the surveys. The study was conducted in the Bangkok area, and
therefore may not be generalizable to other parts of Thailand where geography and
culture are different, or cities of other countries where destination attributes might be
different.
The satisfaction study was constructed from destination image studies which
covered numerous tourism components such as hotels, attractions, activities, etc. Each
component consisted of various attributes like cleanliness, security, value for money,
etc. This study, therefore, could not cover all aspects of each tourism component.
Recommendations
Based on the limitations, the following three recommendations for future studies
are made: survey design, data collection techniques (researcher personal attributes,
permission), and future area of study. Suggestions are provided for researcher as
follows:
The survey should be designed as concise as possible, especially when data will
be collected at the airport. The length of the survey influenced the respondents to
complete the entire survey. A shorter survey is preferable in collecting data in the airport
where the researcher has to deal with time-limited or frustrated travelers. Future studies
should add a section of theory, such as the involvement construct, and discard the
unnecessary attributes to make a solid and short survey. It may concentrate on just one
area of tourism components such as hotels or attractions.
Two data collection techniques are researcher personal attributes and
permission. Other than a professional dress code and an introductory greeting to the
respondents, researcher personal attributes should include an ability to greet and thank

87
in Hindi. This provides from the start shows a good impression and shows respect to
Indian tourists which will assist the researcher in working with Indian tourists.
Researchers need to be aware of airport or airlines’ regulations. In addition to obtaining
the permission from the airport, permission from the airlines is also important.
Permission from airlines which offer flights to India should be obtained in order to collect
data at the departure lounge which is under the airlines’ authorization. The departure
lounge allows tourists to have more time to participate and complete the survey.
Interesting future studies may be conducted on: a correlation between the level
of satisfaction (high, medium, low) and frequency of visitations to indicate the level of
loyalty, a correlation between the level of satisfaction (high, medium, low) and level of
importance of travel motivation. The survey should include the satisfaction levels of
competitive cities such as Singapore, Hong Kong, and Kuala Lumpur, so that Bangkok
can use the findings to develop competitive marketing strategies.
In summary, this chapter illustrates limitations of the study: data collection,
generalizability and the scope of study. Recommendations are then presented to benefit
the future study.
88
APPENDIX A
TRAVEL DESTINATION ATTRIBUTES

89
Attributes 1 2 3 4 5 6 7 8 9 10
11
12
13
14
15
16
17
18
19
20
21
22
23
24
25
26
27
28
29
30
31
32
33
Accommodation services x x x x x x x x x x x x x x x Cleanliness x x x Level of services x x x x x Quality of food x x x x x x x x Speed of check-in/check-out x x x Security of rooms at accomm. x x x x Sign posting to bedrooms/ public places x x x Adequacy of water/electricity supply x x x Booking and reservation x Overall quality x x Value for money x x x International-standard hotel x Local transport services x x x x x x x x x x x x Frequency of local transport services x x x Level of local transport prices x x x Variety of attractions x x x Accessibility of local transport services x x x x

90
Attributes 1 2 3 4 5 6 7 8 9 10
11
12
13
14
15
16
17
18
19
20
21
22
23
24
25
26
27
28
29
30
31
32
33
Comfort of local transport services x x x x Attitude of local drivers X x x Traffic management x x Mobility in destination x Parking x Overall Infra. x x x x Hygiene-sanitation-cleanliness x x x x x x Overall cleanliness of the destination x x x x x x x x x x x X Cleanliness of beaches and sea x x x x x Availability of space on beaches x x x X x x Availability of facilities on beaches x x x Unpolluted environment x Good climate X x x x x x x x x x x Hospitality and customer care x x x x Cleanliness of bars/restaurants x x x Availability x x x x x x x x Food x x x x x x x x Attitude of local shopkeepers x x x Friendliness of people x x x x x x x x x x x x x x x x x x x
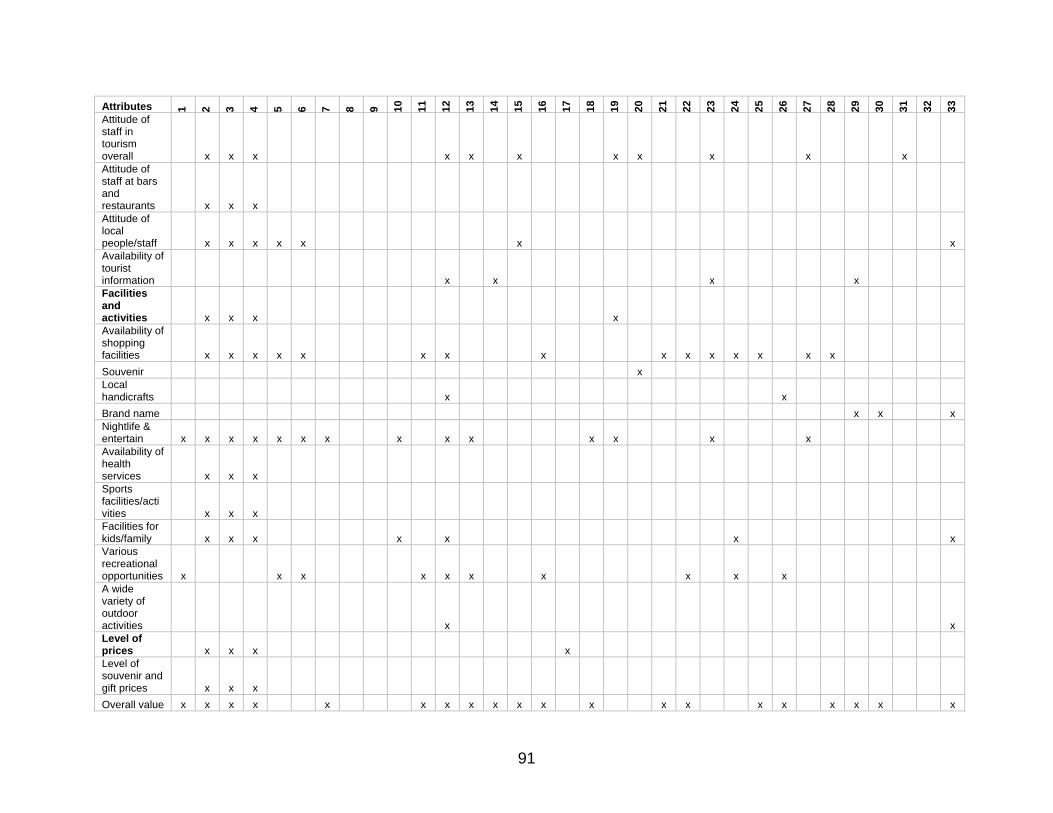
91
Attributes 1 2 3 4 5 6 7 8 9 10
11
12
13
14
15
16
17
18
19
20
21
22
23
24
25
26
27
28
29
30
31
32
33
Attitude of staff in tourism overall x x x x x x x x x x x Attitude of staff at bars and restaurants x x x Attitude of local people/staff x x x x x x x Availability of tourist information x x x x Facilities and activities x x x x Availability of shopping facilities x x x x x x x x x x x x x x x Souvenir x Local handicrafts x x Brand name x x x Nightlife & entertain x x x x x x x x x x x x x x Availability of health services x x x Sports facilities/activities x x x Facilities for kids/family x x x x x x x Various recreational opportunities x x x x x x x x x x A wide variety of outdoor activities x x Level of prices x x x x Level of souvenir and gift prices x x x Overall value x x x x x x x x x x x x x x x x x x x x

92
Attributes 1 2 3 4 5 6 7 8 9 10
11
12
13
14
15
16
17
18
19
20
21
22
23
24
25
26
27
28
29
30
31
32
33
Level of food and beverage prices x x x x x Quality of food at bars/restaurants x x x x Low travel cost x Ability to bargain x x Air ticket x Language communication x x x Access to internet x No language barriers x x x x x x x Signage x x x x x x Destination airport services x x x Distance from airport to destination x x x Facilities and services x x x Speed of check-in and check-out x x x x x x Convenience to come x x x x x x Personal safety/security x x x x x x x x x x x x x x x x x x x x Attractions x x Interesting Cultural Attractions x x x x x x x x x x x x x x x x x Festival/Event x x x x x x x Interesting Historical Attractions x x x x x x x x x x x
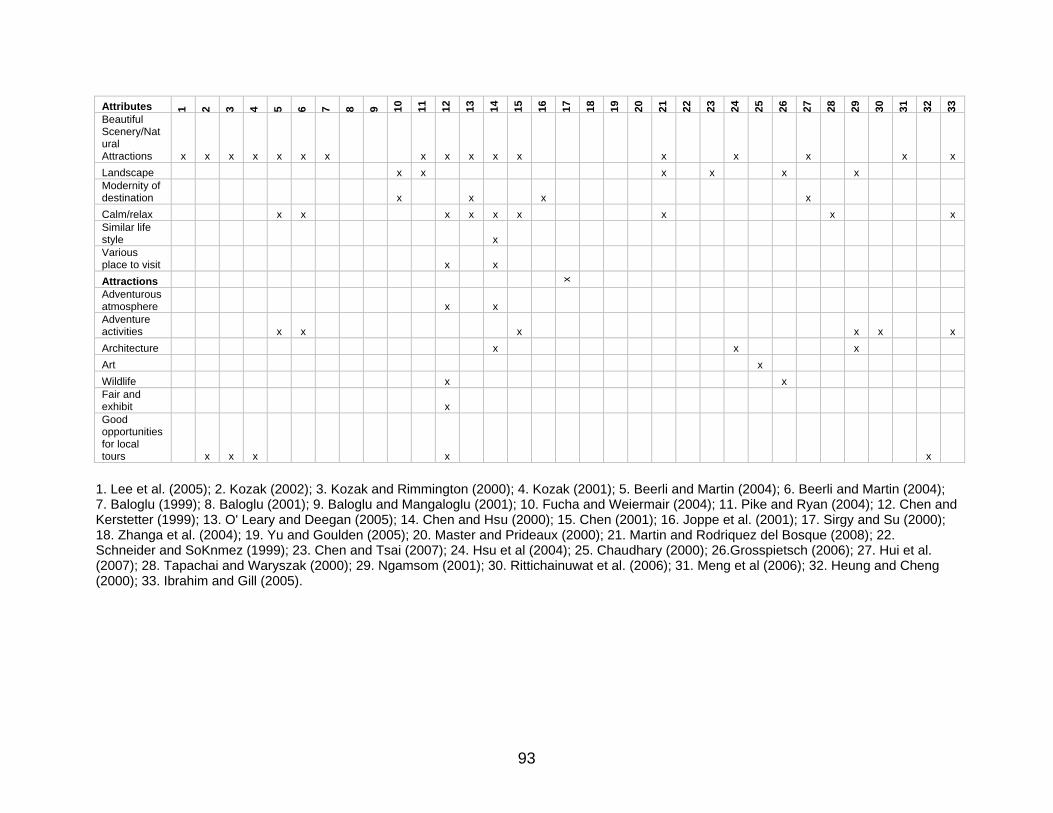
93
Attributes 1 2 3 4 5 6 7 8 9 10
11
12
13
14
15
16
17
18
19
20
21
22
23
24
25
26
27
28
29
30
31
32
33
Beautiful Scenery/Natural Attractions x x x x x x x x x x x x x x x x x Landscape x x x x x x Modernity of destination x x x x Calm/relax x x x x x x x x x Similar life style x Various place to visit x x Attractions x
Adventurous atmosphere x x Adventure activities x x x x x x Architecture x x x Art x Wildlife x x Fair and exhibit x Good opportunities for local tours x x x x x
1. Lee et al. (2005); 2. Kozak (2002); 3. Kozak and Rimmington (2000); 4. Kozak (2001); 5. Beerli and Martin (2004); 6. Beerli and Martin (2004); 7. Baloglu (1999); 8. Baloglu (2001); 9. Baloglu and Mangaloglu (2001); 10. Fucha and Weiermair (2004); 11. Pike and Ryan (2004); 12. Chen and Kerstetter (1999); 13. O' Leary and Deegan (2005); 14. Chen and Hsu (2000); 15. Chen (2001); 16. Joppe et al. (2001); 17. Sirgy and Su (2000); 18. Zhanga et al. (2004); 19. Yu and Goulden (2005); 20. Master and Prideaux (2000); 21. Martin and Rodriquez del Bosque (2008); 22. Schneider and SoKnmez (1999); 23. Chen and Tsai (2007); 24. Hsu et al (2004); 25. Chaudhary (2000); 26.Grosspietsch (2006); 27. Hui et al. (2007); 28. Tapachai and Waryszak (2000); 29. Ngamsom (2001); 30. Rittichainuwat et al. (2006); 31. Meng et al (2006); 32. Heung and Cheng (2000); 33. Ibrahim and Gill (2005).

94
APPENDIX B
SURVEY INSTRUMENT

95
96
Dear Traveler:
You are invited to participate in a study entitled, “Understanding Indian Tourists to Bangkok: Motivation,
Perception, and Satisfaction.” As a student in the School of Merchandising and Hospitality Management
at the University of North Texas I am conducting this research as part of my academic program. Your
participation in this study will help educators and researchers better understand your travel experiences.
You have been randomly chosen to participate in this study and the information that you provide will be
used for research purposes. It will take you approximately 10 to 15 minutes to complete this survey and a
native coin will be provided as compensation. Your participation is voluntary and anonymous. You have
the right to decline to participate or to withdraw during the course of the study. You must be 18 years of
age or older to participate in this study.
You understand that by returning this survey, you are giving your informed consent as a participating
volunteer. You understand the basic nature of this study. You also understand the potential benefits that
might be realized from the successful completion of this study. You are aware that the information is
being sought in a specific manner so that no identifiers are needed and so that confidentiality is
guaranteed.
NOTE: Questions or concerns about participation in research or subsequent complaints should be
addressed first to the researcher, Raktida Siri and Dr. Lisa Kennon, Associate Professor, University of
North Texas, Denton, Texas 76203, phone (940) 565-4257. This research project has been reviewed and
approved by the UNT Institutional Review Board (940)565-3940. Contact the UNT IRB with any questions
regarding your rights as a research subject.
Sincerely,
Raktida Siri Dr. Lisa Kennon
Graduate Student Associate Professor
Hospitality Management Division Hospitality Management Division
University of North Texas University of North Texas

97

98
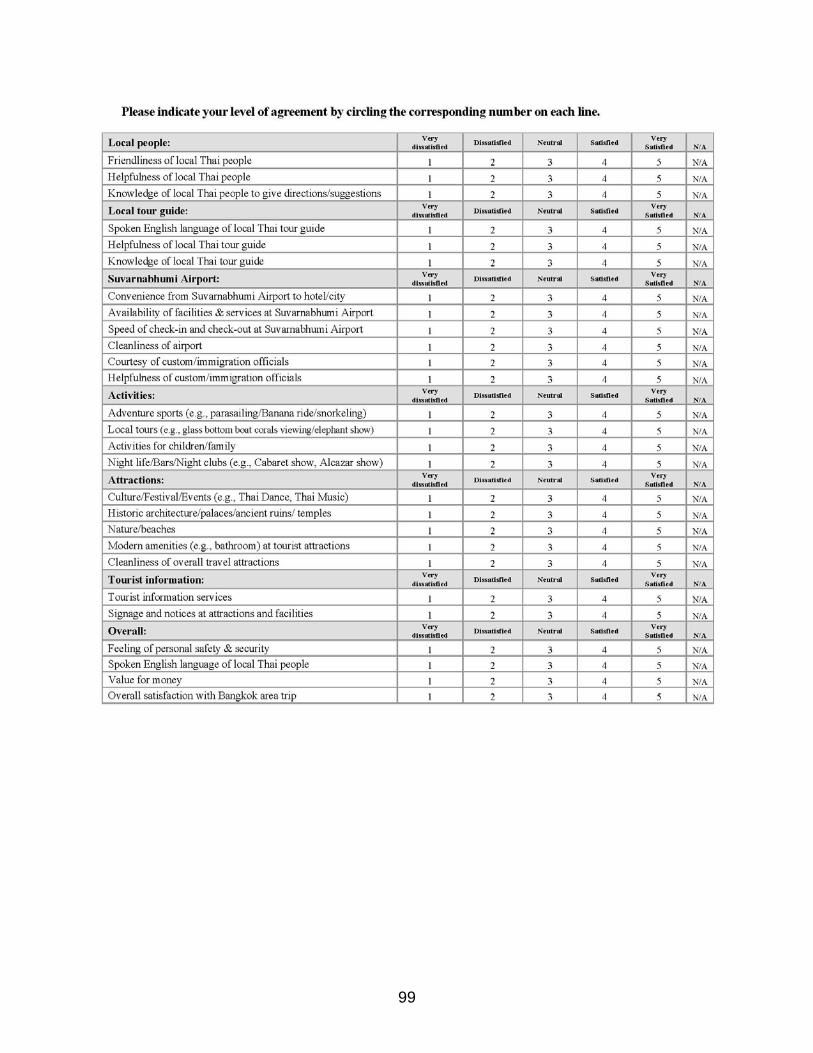
99
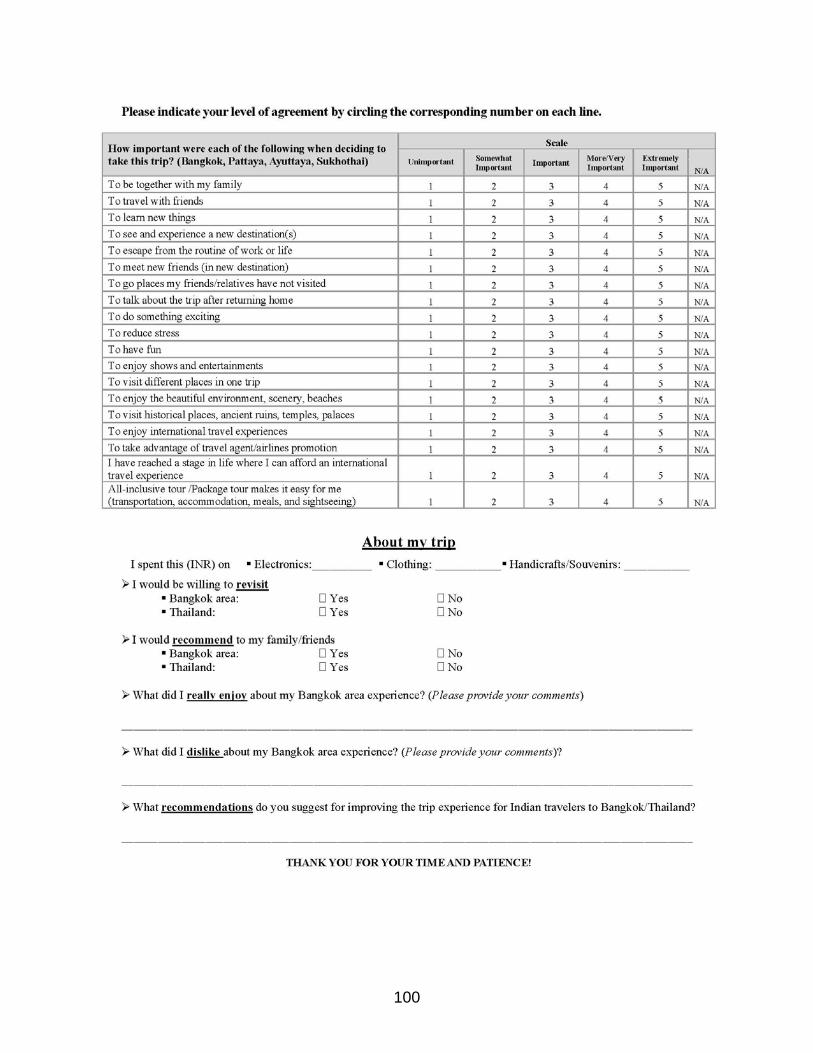
100
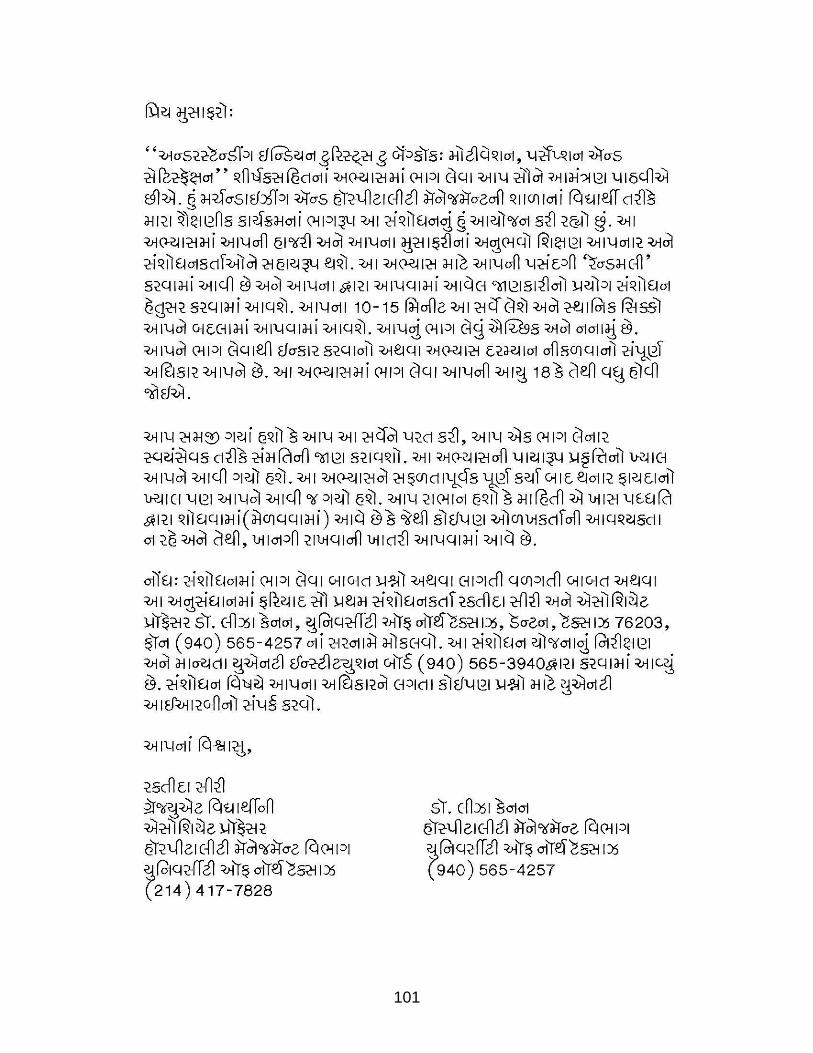
101
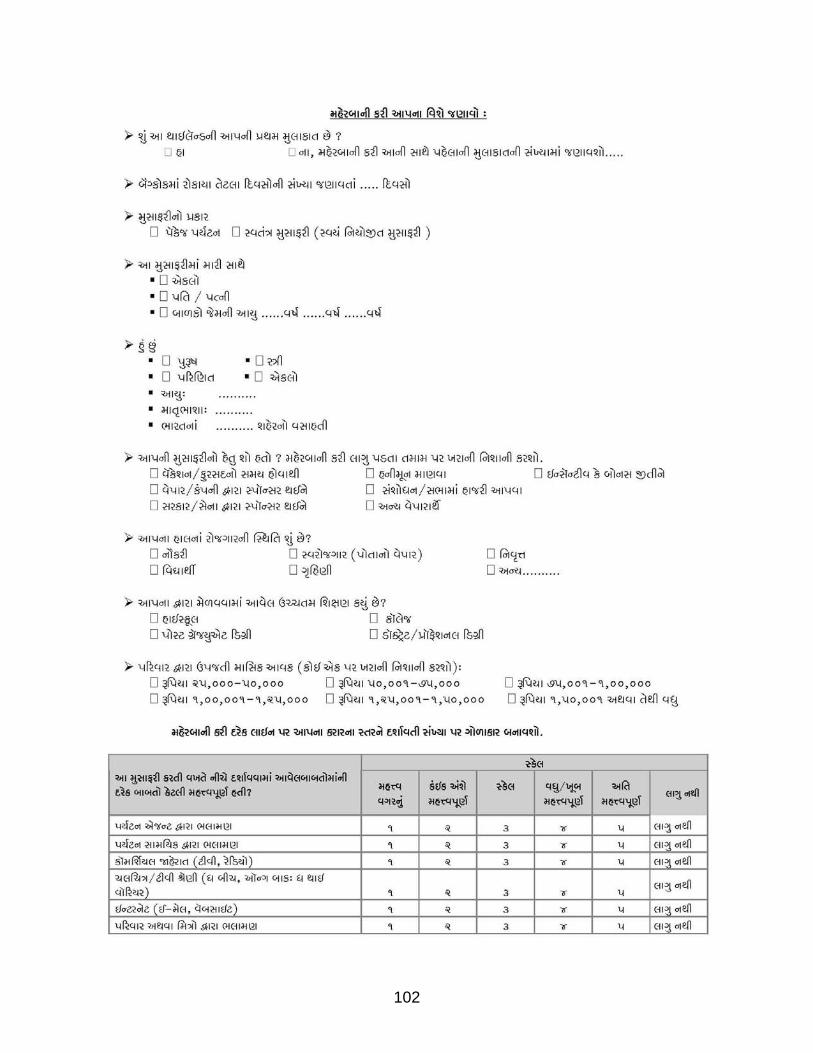
102
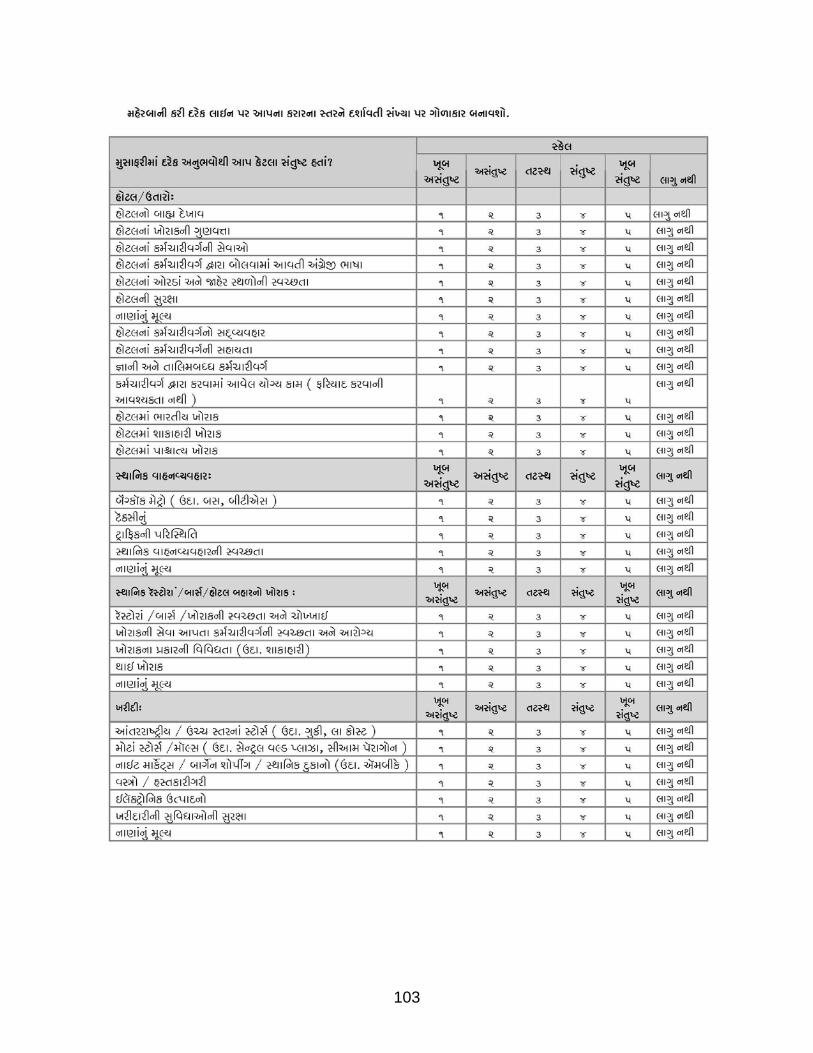
103
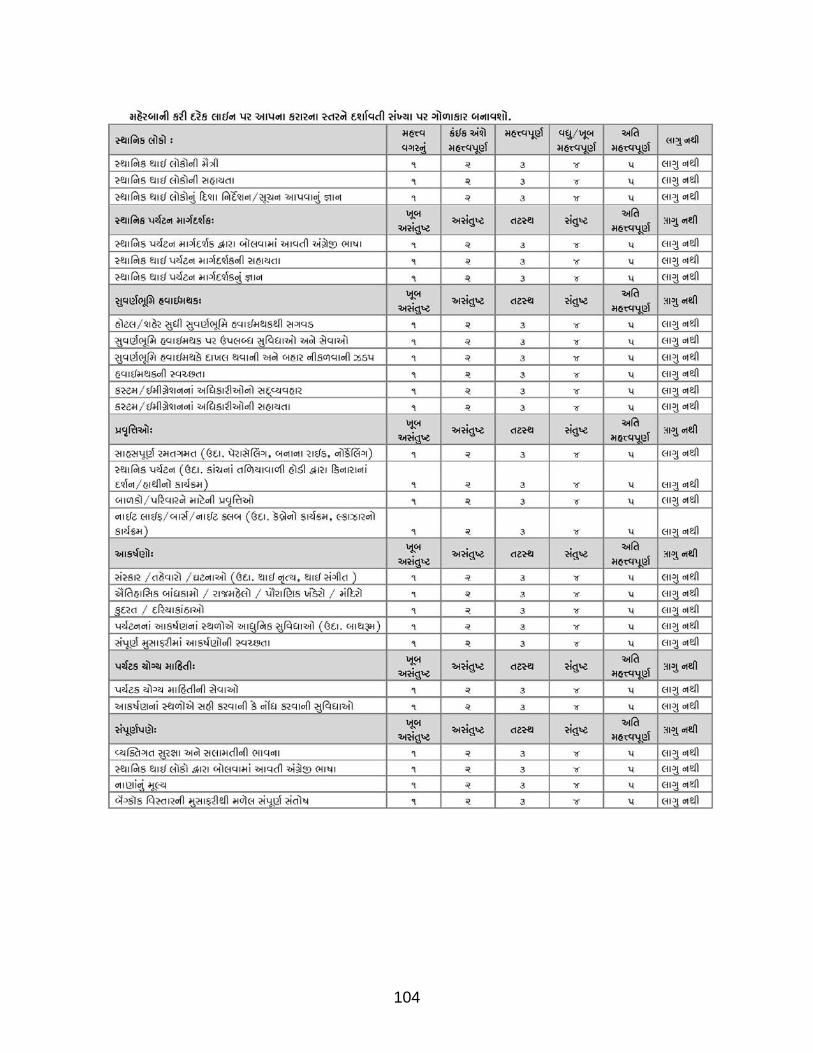
104

105

106

107

108

109

110

111
REFERENCES
Baloglu, S., & Brinberg, D. (1997). Affective images of tourism destinations. Journal of Travel Research, 35(4), 11-15.
Baloglu, S. & Mangaloglu, M. (2001). Tourism destination images of Turkey, Egypt, Greece, and Italy as perceived by US-based tour operators and travel agents. Tourism Management 22(2001), 1-9. Retrieved April 2, 2008, from Emerald database.
Baloglu, S. (2001). Image variations of Turkey by familiarity index: Informational and experiential dimensions. Tourism Management 22(2001), 127-133. Retrieved April 2, 2008, from Emerald database.
Baloglu, S., McCleary, W. K. (1999). A model of destination image formation. Annals of Tourism Research, 26(4), 868-897. Retrieved April 2, 2008, from Emerald database.
Bansal, H. & Eiselt, H. A. (2004). Exploratory research of tourist motivations and planning. Tourism Management, 25(2004), 387-396. Retrieved April 2, 2008, from Emerald database.
Beerli, A., & Martín, D. J. (2004). Factors influencing destination image. Annals of Tourism Research, 31(3), 657-681. Retrieved April 2, 2008, from Emerald database.
Beerli, A., & Martín, D. J. (2004).Tourists’ characteristics and the perceived image of tourist destinations: A quantitative analysis – A case study of Lanzarote, Spain. Tourism Management, 25(5), 623-636. Retrieved April 2, 2008, from Emerald database.
Bennett, R., & Rundle-Thiele, S. (2004). Customer satisfaction should not be the only goal. Journal of Services Marketing, 18(7), 514-523. Retrieved March 22, 2008, from Sage database.
Bergheim, S. (2005). Current issues: Global growth centers. Retrieved April 2, 2008, from http://www.dbresearch.com/PROD/DBR_INTERNET_DE-PROD/PROD0000000000185704.pdf
Bigné, J. E., Sánchez M. I., & Sánchez, J. (2001). Tourism image, evaluation variables and after purchase behaviour: Inter-relationship. Tourism Management, 22(2001), 607-616. Retrieved April 2, 2008, from Emerald database.
Bramwell, B. (1998). User satisfaction and product development in urban tourism. Tourism Management, 19(1), 35-47. Retrieved April 2, 2008, from Emerald database.

112
Buhalis, D. (1998). Strategic use of information technologies in the tourism industry. Tourism Management, 19(5), 409-105. Retrieved March 2, 2008, from Proquest database.
Chaudhary, M. (2000). India's image as a tourist destination - A perspective of foreign tourists. Tourism Management, 21(3), 293-297. Retrieved April 2, 2008, from Emerald database.
Chen, J. & Hsu, H. C. (2000). Measurement of Korean tourists’ perceived images of overseas destinations. Journal of Travel Research, 38(May 2000), 411-416. Retrieved April 2, 2008, from Sage database.
Chen, J. S. (2001). A case study of Korean outbound travelers' destination images by using correspondence analysis. Tourism Management, 22(4), 345-350. Retrieved April 2, 2008, from Emerald database.
Chen, P., & Kerstetter, L. D. (1999). International students’ image of rural Pennsylvania as a travel destination. Journal of Travel Research, 37(February 1999), 256-266. Retrieved April 2, 2008, from Sage database.
Chen, C. F., & Tsai, D. (2007). How destination image and evaluative factors affect behavioral intentions? Tourism Management, 28(4), 1115-1122. Retrieved April 2, 2008, from Emerald database.
Choi, T. Y. & Chu, R. (2000). Levels of satisfaction among Asian and Western travelers. International Journal of Quality & Reliability Management, 17(2), 116-132. Retrieved April 2, 2008, from Emerald database.
Crompton, J. L. (1997). Motivations of pleasure vacation. Annals of Tourism Research, 6(4), 408-424.
Crouch, D., Jackson, R., & Thompson, F. (2005). The media and the tourist imagination (pp. 1-13). New York, NY: Routledge.
Department of Natural Resources and Environment. (2008). Clean and Green Land. Natural resources and environment newspaper. Retrieved February 6, 2008, from, http://www.monre.gov.vn/monreNet/default.aspx?tabid=259&ItemID=52647
Engel, J. F., Blackwell, R. D., & Miniard, P. W. (1995). Consumer behavior. Fort Worth, TX: The Dryden Press.
Enright. M. J, & Newton, J. (2005). Determinants of tourism destination competitiveness in Asia Pacific: Comprehensiveness and universality. Journal of Travel Research, 43(May 2005), 339-350. Retrieved March 22, 2008, from Sage database.
Expresshospitality.com (2001). India and China represent the biggest market potential in inbound and outbound travel. Retrieved April 2, 2008, from www.expresshospitality.com/20051130/market08.shtml
113
Fuchs, M. & Weiermair, K. (2004). Destination benchmarking: An indicator-system’s potential for exploring guest satisfaction. Journal of Travel Research, 42(February 2004), 212-225. Retrieved April 2, 2008, from Sage database.
Gallarza, G. M., Saura, G. I., & Garcia, C. H. (2002). Destination image: Towards a conceptual framework. Annals of Tourism Research, 29(1), 56-78. Retrieved April 2, 2008, from Emerald database.
George, R. (2003). Tourist’s perceptions of safety and security while visiting Cape Town. Tourism Management 24(2003), 575-585. Retrieved April 2, 2008, from Emerald database.
Govers, R., Go, F. M., & Kumar, K. (2007). Promoting tourism destination image. Journal of Travel Research, 46(August 2007), 15-23. Retrieved March 22, 2008, from Sage database.
Grace, D., & O’Cass, A. (2004). Examining service experiences and post-consumption evaluations. Journal of Services Marketing, 18(6), 450-461. Retrieved March 22, 2008, from Sage database.
Grönroos, C. (1990). Service management and marketing. Toronto, Canada: Lexington Books.
Grosspietsch, M. (2006). Perceived and projected images of Rwanda: Visitor and international tour operator perspectives. Tourism Management, 27(2), 225-234. Retrieved April 2, 2008, from Emerald database.
Hanqin, Z. Q. & Lam, T. (1999). An analysis of mainland Chinese visitors' motivations to visit Hong Kong. Tourism Management 20(1999), 587-594. Retrieved April 2, 2008, from Emerald database.
Hawkins, D. I., Best, R. J., & Coney, K. A. (1995). Consumer behavior implications for marketing strategy (6th ed.). Chicago, Illinois: Irwin.
Heung, V. C. S. (2000). Satisfaction levels of mainland Chinese travelers with Hong Kong hotel services. International Journal of Contemporary Hospitality Management, 12(5), 308-315. Retrieved April 2, 2008, from Emerald database.
Heung, V. C. S., & Cheng, E. (2000). Assessing tourists’ satisfaction with shopping in the Hong Kong special administrative region of China. Journal of Travel Research, 38(May 2000), 396-404. Retrieved March 22, 2008, from Sage database.
Hsu, C. H. C., & Kang, S. K. (2007). CHAID-based Segmentation: International visitors' trip characteristics and perceptions. Journal of Travel Research, 46(November 2007), 207-216. Retrieved March 22, 2008, from Sage database.

114
Hsu, C. H. C., Wolfe, K., & Kang, S. K. (2004). Image assessment for a destination with limited comparative advantages. Tourism Management 25(2004), 121-126. Retrieved April 2, 2008, from Emerald database.
Hughes, H., & Allen, D. (2005). Cultural tourism in Central and Eastern Europe: The views of induced image formation agents. Tourism Management, 26(2005), 173-183. Retrieved April 2, 2008, from Emerald database.
Hui, T. K. Wan, D., & Ho, A. (2007). Tourists’ satisfaction, recommendation and revisiting Singapore. Tourism Management, 28(4), 965-975. Retrieved April 2, 2008, from Emerald database.
Ibrahim, E. E. & Gill, J. (2005). A positioning strategy for a tourist destination, based on analysis of customers' perceptions and satisfactions. Marketing Intelligence & Planning, 23(2/3), 172-188. Retrieved March 27, 2008, from ABI/INFORM Global database. (Document ID: 872115231).
IBT Berlin. (2007). A world travel trends report. Messe Berlin. Retrieved February 2, 2008, from http://www.messe-berlin.de
Joppe, M., Martin, W. W., & Waalen, J. (2001).Image variations of Turkey by familiarity index: Informational and experiential dimensions. Journal of Travel Research, 39(February 2001), 252-260. Retrieved April 2, 2008, from Sage database.
Josiam, B. M., Kinley, T. R., & Kim, Y. (2005). Involvement and the tourist shopper: Using the involvement construct to segment the American tourist shopper at the mall. Journal of Vacation Marketing, 11(2), 135-154. Retrieved March 22, 2008, from Sage database.
Jun, S. H., Vogt, C. A. & MacKay, K. J. (2007). Relationships between travel information search and travel product purchase in pre-trip contexts. Journal of Travel Research, 45(February 2007), 266-274. Retrieved March 22, 2008, from Sage database.
Kandampully, J. A. (2007). Services management: The new paradigm in hospitality. Upper Saddle River, NJ: Pearson Prentice Hall.
Kim, H, & Richardson, S. (2003). Motion picture impacts on destination images. Annals of Tourism Research, 30(1), 216-237. Retrieved April 2, 2008, from Emerald database.
Kozak, M & Rimmington, M. (2000). Tourist satisfaction with Mallorca, Spain, as an off-season holiday destination. Journal of Travel Research, 38(February 2000), 260-269. Retrieved April 2, 2008, from Emerald database.
Kozak, M. (2001). Comparative assessment of tourist satisfaction with destinations across two nationalities. Annals of Tourism Research, 22(4), 391-401. Retrieved April 2, 2008, from Emerald database.
115
Kozak, M. (2001). Repeaters’ behavior at two distinct destinations. Annals of Tourism Research, 28(2), 784-807. Retrieved April 2, 2008, from Emerald database.
Kozak, M. (2002). Destination benchmarking. Annals of Tourism Research, 29(2), 497-519. Retrieved April 2, 2008, from Emerald database.
Lam, T., & Hsu, C. H. C. (2006). Predicting behavioral intention of choosing a travel destination. Tourism Management 27(2006), 589-599. Retrieved April 2, 2008, from Emerald database.
Lau, A. L. S., McKercher, B. (2004). Exploration versus acquisition: A comparison of first-time and repeat visitor. Journal of Travel Research, 42(February 2004), 279-285. Retrieved March 22, 2008, from Sage database.
Lau, P., Akbar, A., & Yong Gun Fie, D. (2005, September). Service quality: A study of the luxury hotels in Malaysia. Journal of American Academy of Business, Cambridge, 7(2), 46-55. Retrieved April 3, 2008, from Busiess Source Complete database.
Law, C. M. (2002). Urban tourism (2nd ed.). New York, NY: Continum.
Lawton, L. (2005). Resident perceptions of tourist attractions on the Gold Coast of Australia. Journal of Travel Research, 44(November 2005), 188-200. Retrieved March 22, 2008, from Sage database.
Lee, K. C., Lee, K.Y., & Lee, B. (2005). Korea’s destination image formed by the 2002 world cup. Annals of Tourism Research, 32(4), 839-858. Retrieved April 2, 2008, from Emerald database.
Lee, S. Y. (1999). Marketing strategies for bed and breakfast operations (M.S. dissertation, University of North Texas, United States, 1999).
LeHew, M. L. A. & Wesley, S. C. (2007). Tourist shoppers’ satisfaction with regional shopping mall experiences. International Journal of Culture, Tourism and Hospitality Research, 1(1), 82-96. DOI: 10.1108/17506180710729628
Li L., Buhalis, D. (2006). E-Commerce in China: The case of travel. International Journal of Information Management, 26(2), 153-166. Retrieved March 2, 2008, from ABI/INFORM Global database. (Document ID: 1033601331).
Li, X., Cheng, C., Kim, H., & Petrick, J. (2008). A systematic comparison of first-time and repeat visitors via a two-phase online survey. Tourism Management, 29(2008), 278-293. Retrieved April 2, 2008, from Emerald database.
Louvieris, P. & Oppewal, H. (2004). Channel benefits portfolio management in the eBusiness era. Qualitative Market Research, 7(4), 257-264. Retrieved March 2, 2008, from ABI/INFORM Global database. (Document ID: 702146601).

116
MacKay, K. J., & Fesenmaier, D. R. (2000). An exploration of cross-cultural destination image assessment. Journal of Travel Research, 38(May 2000), 417-423. Retrieved March 22, 2008, from Sage database.
Market Research Division, Ministry of Tourism. (2007). Tourism statistics 2006. government of India. Retrieved April 2, 2008, from www.incredibleindia.org.
Martin, H. S., & Rodriguez del Bosque, I. A. (2008). Exploring the cognitive–affective nature of destination image and the role of psychological factors in its formation. Tourism Management, 29(2008), 263-277. Retrieved April 2, 2008, from Emerald database.
Master, H. & Prideaux, B. (2000). Culture and vacation satisfaction: A study of Taiwanese tourists in South East Queensland. Tourism Management, 21(5), 445-449. Retrieved April 2, 2008, from Emerald database.
Meng, F., Tepanin, Y., & Uysal, M. (2006). Measuring tourist satisfaction by attribute and motivation: The case of a nature-based resort. Journal of Vacation Marketing, 14(1), 41-56. Retrieved March 22, 2008, from Sage database.
Millán, A. & Esteban, A. (2004). Development of a multiple-item scale for measuring customer satisfaction in travel agencies services. Tourism Management 25(2004), 533-546. Retrieved April 2, 2008, from Emerald database.
Mohsin, A. (2005). Tourist attitudes and destination marketing-the case of Australia’s Northern territory and Malaysia. Tourism Management 26(2005), 723-732. Retrieved April 2, 2008, from Emerald database.
Murphy, P., Pritchard, M. P., & Smith, B. (2000). The destination product and its impact on traveller perceptions. Tourism Management, 21(2000), 43-52. Retrieved April 2, 2008, from Emerald database.
Ng, S. I., Lee, J. A. & Soutar, G. N. (2007). Tourists’ intention to visit a country: The impact of cultural distance. Tourism Management, 28(2007), 1497-1506. Retrieved April 2, 2008, from Emerald database.
Ngamsom, B. (2001). The impacts of a bundle of travel determinants on repeat visitation: An exploratory study of tourism in Thailand (Doctoral dissertation, Oklahoma State University, United States, 2001).
Nicolau, J. L. & Más, F. J. (2006). The influence of distance and prices on the choice of tourist destinations: The moderating role of motivations. Tourism Management, 27(2006), 982-996. Retrieved April 2, 2008, from Emerald database.
Tapachai, N. & Waryszak, R. (2000). An examination of the role of beneficial image in tourist destination selection. Journal of Travel Research, 39(1), 37-44. Retrieved March 27, 2008, from ABI/INFORM Global database. (Document ID: 56862493).
117
O’Leary, S. & Deegan, J. (2005).Ireland’s image as a tourism destination in France: Attribute importance and performance. Journal of Travel Research, 43(February 2005), 247-256. Retrieved April 2, 2008, from Sage database.
Oppermann, M. (2000). Tourism destination loyalty. Journal of Travel Research, 39(August 2000), 78-84. Retrieved March 22, 2008, from Sage database.
Paskaleva-Shapira, K. A. (2007). New paradigms in city tourism management: Redefining destination promotion. Journal of Travel Research, 46(August 2007), 108-114. Retrieved April 2, 2008, from Sage database.
Pawitra, T. A. & Tan, K. C. (2003). Tourist satisfaction in Singapore - A perspective from Indonesian tourists. Managing Service Quality, 13(5), 399-411. Retrieved April 2, 2008, from ABI/INFORM Global database. (Document ID: 450433511).
Pearce, D. G. & Schott, C. (2005). Tourism distribution channels: The visitors’ perspective. Journal of Travel Research, 44(August 2005), 50-63. Retrieved March 22, 2008, from Sage database.
Peleggi, M. (1996). National heritage and global tourism in Thailand. Annals of Tourism Research, 23(2), 432-448. Retrieved April 2, 2008, from Emerald database.
Pike, S. & Ryan, C. (2004).Destination positioning analysis through a comparison of cognitive, affective, and perceptions. Journal of Travel Research, 42(May 2004), 333-342. Retrieved April 2, 2008, from Sage database.
Poon, W., & Low, K. (2005). Are travellers satisfied with Malaysian hotels? International Journal of Contemporary Hospitality Management, 17(3), 217-227. Retrieved April 3, 2008, doi:10.1108/09596110510591909.
Reisinger, Y. & Turner, L. W. (2002). Cultural differences between Asian tourist markets and Australian hosts: Part 2. Journal of Travel Research, 40(May 2002), 374-384. Retrieved March 22, 2008, from Sage database.
Rittichainuwat, B. N., Qu, H., & Mongkhonvanit, C. (2006). A study of the impact of travel inhibitors on the likelihood of travelers' revisiting Thailand. Journal of Travel & Tourism Marketing, 21(1), 77. Retrieved March 27, 2008, from ABI/INFORM Global database. (Document ID: 1294347011).
Rittichainuwat, B. N., Qu, H., & Mongkhonvanit, C. (2008). Understanding the motivation of travelers on repeat visits to Thailand. Journal of Vacation Marketing, 14(1), 5-21. Retrieved March 22, 2008, from Sage database.
Rittichainuwat, B. N., Qu, H., & Mongkhonvanit, C. Brown, T. J. (2001). Thailand's international travel image: Mostly favorable. Cornell Hotel and Restaurant Administration Quarterly, 42(2), 82-95. Retrieved March 27, 2008, from ABI/INFORM Global database. (Document ID: 76926731).

118
Sangpikul, A. (2008). Travel motivations of Japanese senior travellers to Thailand. International Journal of Tourism Research, 10, 81-94. Retrieved March 2, 2008, from ABI/INFORM Global database.
Schneider, I., & Sönmez, A. (1999). Exploring the touristic image of Jordan. Tourism Management, 20(1999), 539-542. Retrieved April 2, 2008, from Emerald database.
Sirgy, J. M. & Su, C. (2000). Destination image, self-congruity, and travel behavior: Toward an integrative model. Journal of Travel Research, 38(May 2000), 340-352. Retrieved April 2, 2008, from Sage database.
Smith, M. C., & MacKay, K. J. (2001). The organization of information in memory for pictures of tourist destinations: Are there age-related differences? Journal of Travel Research, 39(February 2001), 261-266. Retrieved March 22, 2008, from Sage database.
Snepenger D., Snepenger M., Dalbey, M., Wessol, A. (2007). Meanings and consumption characteristics of places at a tourism destination. Journal of Travel Research, 45(February 2007), 310-321. Retrieved March 22, 2008, from Sage database.
Sohail, M., Roy, M., Saeed, M., & Ahmed, Z. (2007, October). Determinants of service quality in the hospitality industry: The case of Malaysian hotels. JABM: Journal of Accounting, Business & Management, 14, 64-74. Retrieved April 3, 2008, from Business Source Complete database.
Sönmez, S., & Sirakaya, E. (2002). A distorted destination image? The Case of Turkey. Journal of Travel Research, 41(November 2002), 185-196. Retrieved March 22, 2008, from Sage database.
Stepchenkova, S. & Morrison, A. M. (2008). Russia’s destination image among American pleasure travelers: Revisiting Echtner and Ritchie. Tourism Management 29(2008), 548-560. Retrieved April 2, 2008, from Emerald database.
Tam, J. L. M. (2008). Brand familiarity: Its effects on satisfaction evaluations. Journal of Service Marketing, 22(1), 3-12. Retrieved March 22, 2008, from Sage database.
Tasci, A. D. A. & Gartner, W. C. (2007). Destination image and its functional relationships. Journal of Travel Research, 45(4), 413-425. Retrieved March 22, 2008, from Sage database.
Tasci, A. D. A., Gartner, W., & Cavusgil, T. S. (2007). Conceptualization and operationalization image. Journal of Hospitality & Tourism Research, 31(2), 194-223. Retrieved April 2, 2008, from Emerald database.

119
Torres, E. N. & Kline, S. (2006). From satisfaction to delight: A model for the hotel industry. International Journal of Contemporary Hospitality Management, 18(4), 290-301. Retrieved March 22, 2008, from Sage database.
Tourism Authority of Thailand. (2007). International tourist arrivals to Thailand by nationality and mode of transport. Retrieved February 6, 2008, from the World Wide Web: http://www2.tat.or.th/stat/web/static_download.php?Rpt=nmt
Tourism Authority of Thailand. (2008). Tourism expenditure of 2007. Retrieved February 6, 2008, from http://www2.tat.or.th/stat/web/static_tex.php?Year=2007
Vieregge, M., Phetkaew, P., Beldona, S., Lumsden, S. A., and DeMicco, F. J. (2007) Mature travelers to Thailand: A study of preferences and attributes. Journal of Vacation Marketing, 13,165-179. Retrieved March 22, 2008, from Sage database.
Vogt, C. A., & Andereck, K. L. (2003). Destination perceptions across a vacation. Journal of Travel Research, 41(May 2003), 348-354. Retrieved March 22, 2008, from Sage database.
Weaver, P. A., Weber, K., & McCleary, K. W. (2007). Destination evaluation: The role of previous travel experience and trip characteristics. Journal of Travel Research, 45(February 2007), 333-344. Retrieved March 22, 2008, from Sage database.
Werthner, H. & Ricci, F. (2004). E-commerce and tourism. Association for Computing Machinery. Communications of the ACM, 47(12), 101-105. Retrieved March 2, 2008, from ABI/INFORM Global database. (Document ID: 750390461).
Wong, C. S., & Kwong, W. Y. (2004). Outbound tourists’ selection criteria for choosing all-inclusive package tours. Tourism Management, 25(2004), 581-592. Retrieved April 2, 2008, from ScienceDirect database.
Wong, J. & Law, R. (2003). Difference in shopping satisfaction levels: A study of tourists in Hong Kong. Tourism Management 24(2003), 401-410. Retrieved April 2, 2008, from Emerald database.
World Tourism Organization. (2005). Managing and marketing city tourism - The industry’s fastest growth sector. Retrieved February 6, 2008, from http://www.unwto.org/facts/eng/vision.htm
World Tourism Organization. (2007). Tourism highlights 2007 Edition. Retrieved February 6, 2008, from http://www.unwto.org/facts/eng/highlights.htm
Yoon, Y. & Uysal, M. (2005). An examination of the effects of motivation and satisfaction on destination loyalty: A structural model. Tourism Management 26(2005), 45-56. Retrieved April 2, 2008, from Emerald database.

120
Yu, L. & Goulden, M. (2005). A comparative analysis of international tourists’ satisfaction in Mongolia. Tourism Management, 27(6), 1331-1342. Retrieved April 2, 2008, from ScienceDirect database.
Yüksel, A. & Yüksel, F. (2007). Shopping risk perceptions: Effects on tourists’ emotions, satisfaction and expressed loyalty intentions. Tourism Management 28(2007), 703-713. Retrieved April 2, 2008, from Emerald database.
Zhang, H. Q., Qu, H. & Tang, V. M. Y. (2004). A case study of Hong Kong residents’outbound leisure travel. Tourism Management, 25(2), 267-273. Retrieved April 2, 2008, from Emerald database.
Zgourides, G. D. (2000). Developmental Psychology. Theory of Development Ages (pp.2). California: Cliffsnotes.