indian rupee: historical fluctuations -...
TRANSCRIPT
Indian Rupee:
Historical Fluctuations
Prepared by: Peter Frerichs, MPA
Consultant
Contents
I. Introduction to the Rupee ……………………………………………………………3
II. Fluctuation Factors…………………………………………………………………...4
III. Indian Reform Periods………………………………………………………………..7
IV. Rupee in 21st Century…………………………………………………………………8
V. Reserve Bank of India…………………………………………………………….….11
VI. Projections……………………………………………………………………….…...13
VII. Appendix……………………………………………………………………………..16
VIII. References…………………………………………………………………..……..…18
I. Introduction to the Rupee
______________________________________________________________________________
Defining India’s monetary regime with regard to the rupee’s exchange rate with the dollar can be
a convoluted process. Designations such as de facto or non-traditional have been used to
describe the unique relationship the Reserve Bank of India (RBI) maintains with the U.S.
greenback. Yet, after cutting through mountains of extraneous terminology, unique to India’s
floating exchange rate with the euro or the yen, the RBI has neither a fixed nor a floating policy
with the dollar. Rather, the RBI maintains a managed exchange rate with the dollar, buying and
selling foreign currencies with the ultimate goal of keeping the rupee stable.1
Intervention, according to the RBI, is necessary to manage exchange rate volatility between the
two currencies.2 There is no fixed target rate, and market forces are left to decide the fate of
exchange post intervention. In June 2007 the RBI was quoted as stating that controlling and
suppressing inflation was their primary focus.1 Taming inflation however is a complex issue,
reaching into social and political arenas that consequently end up affecting and moving the
exchange rate just as well. The RBI like any other entity of the state is understandably affected
by the political economy, thus the movement of the rupee is far from determinate on economic
factors alone.
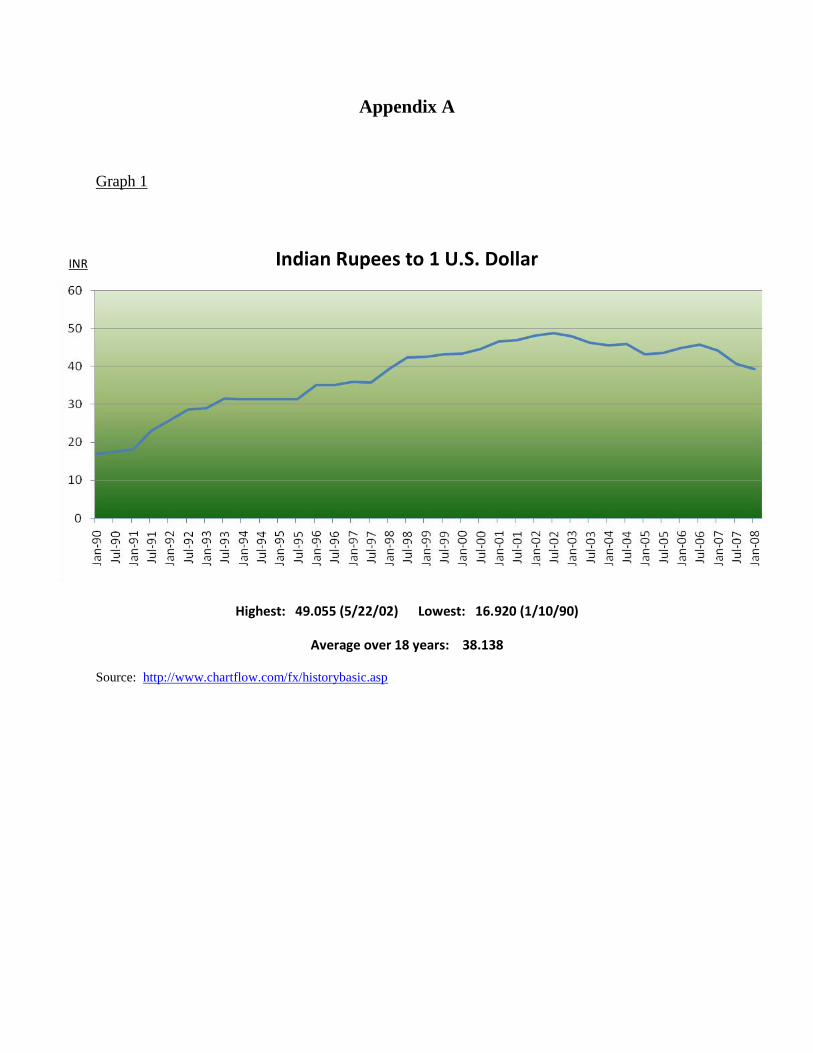
Appendix A, Graph 1 details the rupee’s movement against the dollar from 1990 to the present.
A steady rate of depreciation had been the norm for over a decade with the lowest point over the
eighteen year period being in January 1990, Rs16.9:US$1. In fiscal year (FY) 1993/94 the rupee
maintained an average annual rate of Rs31.37:US$1.3 By FY 2002/03 it had dropped to
1 Robinson, Simon. (2007, July 16). The Message in India’s Rupee Rise. Time Magazine. Retrieved on March 18,
2008 from http://www.time.com/time/world/article/0,8599,1643855,00.html?xid=feed-cnn-topics
2 Ramachandran, M. & Sambandhan, D. (2007, April 14). Resisting Rupee Appreciation? Economic and Political
Weekly. Retrieved on March 18, 2008 from http://www.epw.org.in/epw/uploads/articles/10490.pdf
3 India’s Strong Rupee. (2007, July 27) The Economist. Retrieved on March 19, 2008 from
http://www.economist.com/research/articlesBySubject/displaystory.cfm?subjectid=6899464&story_id=9396854
Rs48.40:US$1, marking an average annual depreciation of close to 5 percent over the nine year
period.3
In between FYs 2003/04 and 2005/06, the rupee reversed course and appreciated by an average
of 3 percent per year.3 The Indian currency had reached its height in May 2002, Rs49:US$1, and
continuous month-on-month appreciation took shape in September 2006 enduring to the present.
During 2007 the rupee strengthened by close to 15 percent against the dollar.4 This was the
biggest increase since 1974.5 India has also witnessed over a 10 percent rupee rise on an
inflation-adjusted, trade-weighted basis since August 2006.5
As of March 31, 2008, the exchange rate stands at Rs40.14:US$1. The rupee has performed
badly since the beginning of the year- the second worst in all of Asia.5 Yet, in the face of huge
capital inflows into the country, to be discussed further on, the RBI has fared fairly well in
containing inflation. The losers in this equation however are select Indian export sectors whose
jobs and livelihoods are at risk due to expected losses resulting from a strong rupee.6 Cheaper
imports on the other hand, especially those required inputs for manufacturing goods to export,
have eased export sector pains. Yet, to grasp the reasons behind the rupee’s rise and what it
means both commercially and economically for India and the U.S., addressing the various factors
involved with currency movements is an appropriate first start.
II. Fluctuation Factors
______________________________________________________________________________
Forecasting currency movements is laborious work. Firms spend countless hours and resources
analyzing and measuring what are thought to be the critical factors needed to accurately address
4 The Uncomfortable Rise of the Rupee. (2007, December 13) The Economist. Retrieved on March 19, 2008 from
http://www.economist.com/research/articlesBySubject/displaystory.cfm?subjectid=6899464&story_id=10286077
5 Varma, Anil. (2008, March 20). Rupee Set to Rebound as India Weathers U.S. Showdown, BOA Says.
www.bloomberg.com Retrieved on March 22, 2008 from
http://www.bloomberg.com/apps/news?pid=20601091&sid=axWlqwE6OOQk&refer=india
6 Chandra, Shobhana & Thomas, Cherian. (2007, September 26) India May Shield Exporters from Rupee, Minister
Says (Update 4). www.bloomberg.com Retrieved on March 22, 2008 from
http://www.bloomberg.com/apps/news?pid=20601080&sid=alS4DteWrtco&refer=asia
the reasons behind fluctuation. Although no clear-cut recipe exists to undertake this task, there
are some common factors that have a direct correlation to the movement of money.
Political and psychological factors as well as the overall strength of the economy cause the most
fluctuation. Essentially, if an economy is growing quickly it will tend to attract foreign currency
which will in turn strengthen its own currency. Some countries such as India over the years have
adopted export-only growth strategies which result in much more foreign currency coming in
than home currency flowing outward. This will also strengthen the home currency. Political
factors such as a change in government or the possibility of war cause speculation resulting in
currency fluctuation. Psychologically, a war or a government deemed to be anti-market signals
trouble. Similar to the stock-market, speculation can lead to massive inflows and outflows of
capital and this can strengthen or weaken a currency overnight.
Exchange rates typically move in a direction to compensate for an economy’s relative inflation
rates. Frequently, if a currency is overvalued, measured by whether it is stronger than is
warranted by the economy’s relative inflation rates, a depreciation of that currency will occur to
correct the position of the currency.7 Generally, high inflation will reduce a country’s
competitiveness and weaken the country’s ability to export and sell its services or goods abroad.
Once this occurs, demand or expected demand for the country’s currency will in turn weaken,
thus making demand for foreign currency more attractive. Aside from exports though, one of the
advantages India maintains from a strong rupee is that it has helped to subdue inflation by
reducing the costs of imports and keeping domestic prices in check.8
Movements in large sums of capital in and out of a country are considered one of the most
influential reasons for changes in the exchange rate. A large net inflow of a foreign currency will
generally strengthen the home currency. This intuitively makes sense because depending on the
amount of inflow, the foreign currency would then end up being in excess of what is considered 7 Kramer, Charles, Oura, Hiroko, Richter-Hume, Andrea, Topalova, Petia, Poirson, Helene, Kohli, Renu, Prasad,
Ananthakrishnan, & Jobst, Andreas. (2008, February) India: Selected Issues. International Monetary Fund.
Retrieved on March 18, 2008 from http://www.imf.org/external/pubs/ft/scr/2008/cr0852.pdf
8 India Rupee at Fresh Dollar High. (2007, October 10) BBC News. Retrieved on March 18, 2008 from
http://news.bbc.co.uk/2/hi/business/7037807.stm
normal market demand. When India first began to liberalize its economy billions of U.S. dollars
came streaming into the country, thus strengthening the currency. In 1996 and 1997 foreign
investors extracted billions of dollars which in turn weakened the rupee.7
A government’s monetary and fiscal policies directly affect supply and demand for a currency
which as a result impacts trade. For example, a policy designed to increase the supply of money
will raise prices and also make imports more attractive from a trading perspective. To attract
money into an economy governments have an array of tools at their disposal. Central banks can
offer high rates on treasury bills for example, and many banks will buy foreign currency when
there’s an excess in supply, or sell it when the demand for the currency exceeds the supply.9
Fiscal surpluses on the other hand tend to result in a decreased demand for imports, but increased
opportunities for exporters. In this scenario, domestically a country’s importers will not be able
to capture a favorable return due to the weak exchange rate, but the same country’s exporters
will have greater opportunities to sell due to the favorable exchange they are providing foreign
partners.
Historically, tariffs and quotas were designed to protect a country’s foreign exchange by
reducing demand from potential domestic consumers. Tariffs and quotas also serve to protect
selected domestic industries for economic or political reasons as well. The ease at which
information can be accessed in today’s world has shed light on the real effects tariffs and quotas
impose. Obviously, if you work or will gain from a sector protected by tariffs and quotas, you
would like to see your government hold these in place. If you are looking to buy an item that
would cost you $1 in a neighboring country, but $5 in your country, you might not be as
forgiving. Tariffs and quotas protect the exchange by reducing demand, but they also close
markets which can in the long-term pose its own significant problems on the currency in
question.
Lastly, exchange controls imposed by the state are used to manage supply and demand of the
home currency. Before liberalization took hold in India in the 1990s, the government maintained
9 Panagariya, Arvind. (2004, January 16) Is a Crisis Around the Corner? International Monetary Fund. Retrieved
on March 18, 2008 from http://www.imf.org/external/np/seminars/eng/2004/fiscal/pdf/panag.pdf
tight exchange control.10 Overall access to foreign currency by the country’s citizens was closely
monitored and released only for pre-determined purposes. The rational at the time was India’s
export sector had yet to experience significant returns to scale and the country still relied on a
large percentage of imports.10 Some countries such as Bangladesh still maintain exchange rates at
artificial levels to guard against economic shocks that could result from massive inflows and
outflows of foreign currency.
III. Indian Reform Periods
______________________________________________________________________________
During the mid to late 1980s Indian policymakers and politicians utilized a variety of tools to
stimulate growth: currency devaluation, trade liberalization, de-licensing of investment.10
Liberalization was quietly executed and pierced almost all areas of industry. Growth during the
1980s was higher than the 70s and 60s, but it was really the average annual growth of 7.6 percent
from 1988 to 1991 that lifted the entire decade as a whole.10 Most of the growth in the 80s was
fueled by financial borrowing, both domestically and internationally.10 In the end this was
ultimately unsustainable and led to the crisis of June 1991.10
Pre-1990 India was relatively isolated commercially and economically from world markets.
External trade was in place, but from a macro perspective the world economy and its effects had
little consequence on the Indian economy. Thankfully, the effects of the crisis of June 1991
served more as a catalyst for further reforms than as an economic step backwards. India still
experienced a loss of international creditworthiness, but ventured forth with a reform package
that was unique to what was implemented during the previous decade.
For the first time the Indian government began awarding priority to entrepreneurs over state-
operated firms to pursue free market oriented activities.10 The government also lifted restrictions
on the rupee and current account transactions including trade, interest payments, and
remittances.9 Exchange controls were lifted as well, and the government devalued the rupee by
10 Panagariya, Arvind. (2004, March) India in the 1980s and 1990s: A Triumph of Reforms. International
Monetary Fund. Retrieved on March 18, 2008 from http://www.imf.org/external/pubs/ft/wp/2004/wp0443.pdf
22 percent against the dollar – Rs21.2 to Rs25.8:US$1.10 By 1992 a dual exchange rate system
was introduced which allowed exporters to sell 60 percent of their foreign exchange in the free
market, and 40 percent to the government at a lower “official” price.10 Importers were also able
to purchase foreign exchange in the open market and within a year of establishing a market
exchange rate, the official exchange rate was integrated with it.10
By February of 1994 widespread current account transactions such as business, education,
medical expenses, and foreign travel were also permitted at the market exchange rate.10 The
government went a step further officially accepting International Monetary Fund (IMF) Article
VIII obligations. Among other things, this transformed the rupee into being officially convertible
on the current account.10 Capital-account convertibility was not established at this time, the
ramifications of which potentially saved massive capital flight during the Asian crisis years.
All in all the economic reforms of the 90s led to increased foreign investment which has lifted
India’s rate of sustainable growth. The exchange rate remained flexible throughout the 90s and it
was allowed to depreciate as needed to preserve international market competitiveness. The 90s
reforms as compared to those of the 80s were more methodical in nature, better planned. India is
still an emerging economy with an uncomfortable amount of citizens living in squalid conditions,
but the reforms of the 80s and 90s set in motion international interest and investment that has
shaped the economy into what it is today.
IV. Rupee in the 21st Century
______________________________________________________________________________
Since 2003/04 the rupee has been appreciating against the dollar. One of the primary factors that
have contributed to the rupee rise is foreign investment. Foreign investment and capital inflows
stream into a country for one reason: the existence of a favorable climate for making money.
Referring to Chart 1, net capital inflows to India in January 2001 amounted to approximately 8
billion dollars. Three years later that number leaped to 20 billion, and last year, January 2007,
India recorded roughly 44 billion dollars in net capital inflows. This is staggering growth and the
quantity of foreign capital flooding into the country has a direct effect on monetary movements
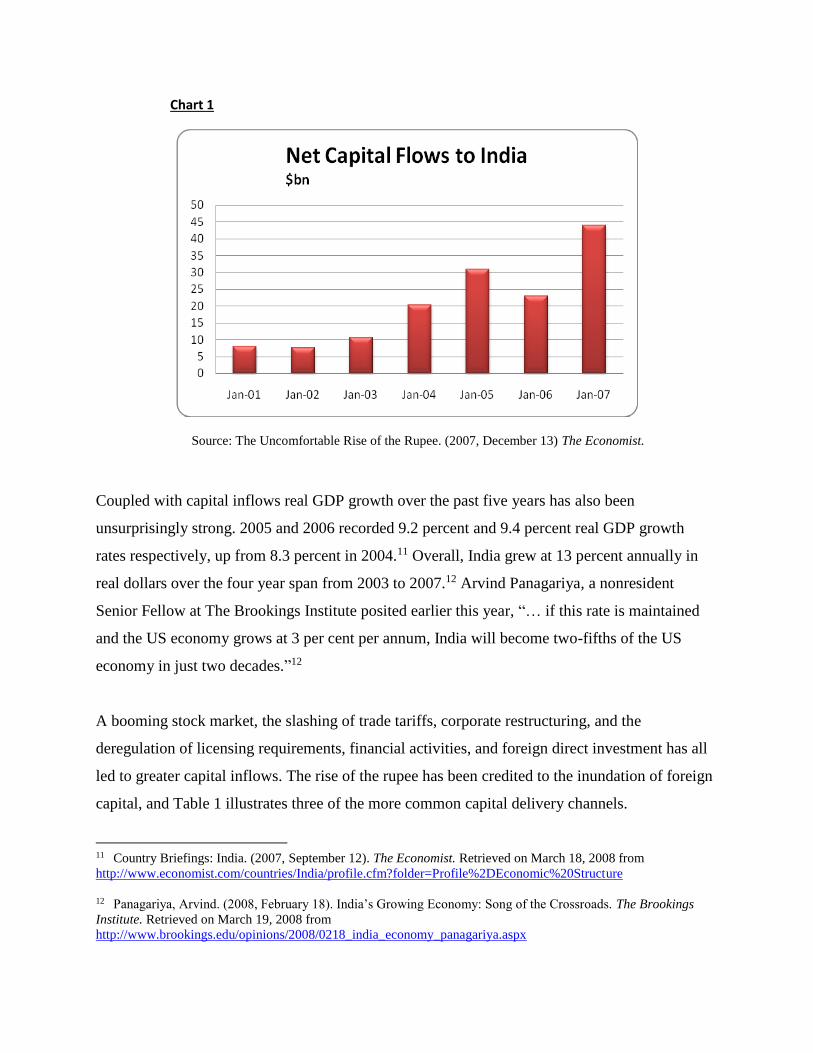
Chart 1
Source: The Uncomfortable Rise of the Rupee. (2007, December 13) The Economist.
Coupled with capital inflows real GDP growth over the past five years has also been
unsurprisingly strong. 2005 and 2006 recorded 9.2 percent and 9.4 percent real GDP growth
rates respectively, up from 8.3 percent in 2004.11 Overall, India grew at 13 percent annually in
real dollars over the four year span from 2003 to 2007.12 Arvind Panagariya, a nonresident
Senior Fellow at The Brookings Institute posited earlier this year, “… if this rate is maintained
and the US economy grows at 3 per cent per annum, India will become two-fifths of the US
economy in just two decades.”12
A booming stock market, the slashing of trade tariffs, corporate restructuring, and the
deregulation of licensing requirements, financial activities, and foreign direct investment has all
led to greater capital inflows. The rise of the rupee has been credited to the inundation of foreign
capital, and Table 1 illustrates three of the more common capital delivery channels.
11 Country Briefings: India. (2007, September 12). The Economist. Retrieved on March 18, 2008 from
http://www.economist.com/countries/India/profile.cfm?folder=Profile%2DEconomic%20Structure
12 Panagariya, Arvind. (2008, February 18). India’s Growing Economy: Song of the Crossroads. The Brookings
Institute. Retrieved on March 19, 2008 from
http://www.brookings.edu/opinions/2008/0218_india_economy_panagariya.aspx
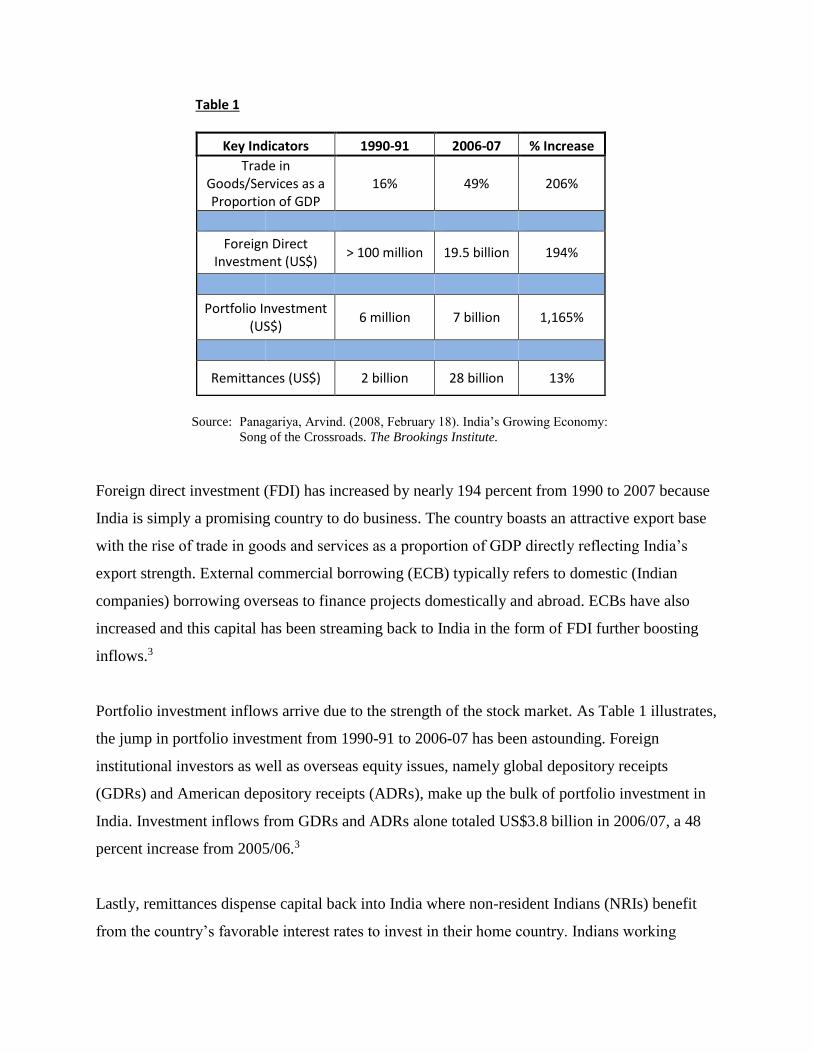
Table 1
Key Indicators 1990-91 2006-07 % Increase
Trade in Goods/Services as a Proportion of GDP
16% 49% 206%
Foreign Direct Investment (US$)
> 100 million 19.5 billion 194%
Portfolio Investment
(US$) 6 million 7 billion 1,165%
Remittances (US$) 2 billion 28 billion 13%
Source: Panagariya, Arvind. (2008, February 18). India’s Growing Economy:
Song of the Crossroads. The Brookings Institute.
Foreign direct investment (FDI) has increased by nearly 194 percent from 1990 to 2007 because
India is simply a promising country to do business. The country boasts an attractive export base
with the rise of trade in goods and services as a proportion of GDP directly reflecting India’s
export strength. External commercial borrowing (ECB) typically refers to domestic (Indian
companies) borrowing overseas to finance projects domestically and abroad. ECBs have also
increased and this capital has been streaming back to India in the form of FDI further boosting
inflows.3
Portfolio investment inflows arrive due to the strength of the stock market. As Table 1 illustrates,
the jump in portfolio investment from 1990-91 to 2006-07 has been astounding. Foreign
institutional investors as well as overseas equity issues, namely global depository receipts
(GDRs) and American depository receipts (ADRs), make up the bulk of portfolio investment in
India. Investment inflows from GDRs and ADRs alone totaled US$3.8 billion in 2006/07, a 48
percent increase from 2005/06.3
Lastly, remittances dispense capital back into India where non-resident Indians (NRIs) benefit
from the country’s favorable interest rates to invest in their home country. Indians working
overseas temporarily contributed alone approximately US$19.6 billion from April to December
2006, a 15 percent year-on-year increase.3 Remittances have become a global phenomenon over
the past decade or so, and India, like many other emerging economies, receives a hefty amount
of foreign capital due to the plethora of citizens working abroad with family connections back
home.
V. Reserve Bank of India
______________________________________________________________________________
The RBI’s policy actions in response to capital inflows have much to do with rupee fluctuation.
Inflows in general complicate monetary and exchange rate policies. They also increase the
supply of money in the economy which elevates inflationary pressures. India’s productivity led
growth boom along with higher interest rates than abroad all but assure the continued inflow of
foreign capital. Due to this the RBI has had to spend substantially more on buying foreign
currencies to keep the rupee stable. At the current moment the RBI is caught between trying to
resist extreme rupee appreciation and control inflation. Politically, if inflation climbs Indian
citizens will suffer via higher prices for basics such as food and housing. The annual inflation
rate rose to 6.1 percent in January 2007, compared with 4.2 percent in 2006.3 The RBI is
restricted in the manner in which they can intervene in the foreign exchange market. Printing
rupees to buy incoming money will keep the rupee cheap, but this will also add to the overall
economy’s money supply thus engendering inflation. To ease appreciation the RBI has made it
difficult for Indian firms to borrow in foreign currency.3 The other option would be to restrict
inflows of capital, but this could be difficult again for political and commercial reasons.
One interesting measure the RBI has utilized in their attempt to control appreciation has been the
selling of “sterilization” bonds to banks. Coupled with this, the government has also raised the
amount of reserves banks must keep in their vaults. The problem however has been the banks’
unwillingness to buy the bonds unless they can receive a decent return on their purchase. In
China for example banks do end up buying Chinese government issued bonds primarily because
they are “force-fed” from the government.4 The RBI and the Indian government for better or
worse are not as aggressive as their competing neighbor, thus leaving “sterilization” bonds
unappetizing, weak policy tools.
Commercially, the RBI’s response to the rupee rise has sparked a debate in the export sector.
History has demonstrated that depending on the sector and relative global demand, a rise in one
country’s exchange rate (India) with another country (U.S.) can adversely affect the export
industry due to goods and services subsequently costing more for the importing country (U.S.).
Yet, this does not hold true for all sectors, and being that all countries import and export, what
would cost more to export in turn will cost less to import. Thus, a stronger rupee has also
resulted in goods and services from abroad to be acquired cheaper.
One of the export sectors adversely hit by a strong rupee has been the apparel sector. One of
India’s major export industries, the apparel sector weakened by 3.5 percent, year-on-year, in
January to April 2007.3 At the same time, China’s apparel exports to the U.S. increased by 57
percent.3 Moreover, prior to early 2007 apparel exports from India to the U.S. had been rising at
an average rate of 21 percent per year since import quotas were eliminated in 2005.3 Conversely,
another large export sector, IT and business-process outsourcing (BPO), has been booming
despite the rupee’s appreciation. Software services exports numbered US$21.8 billion in April to
December 2006, a year-on-year increase of 31 percent.3 History has also demonstrated that a
strong rupee does not necessarily equate to weak export numbers. India’s fastest export growth
since 1974 transpired in 2005 while the rupee had appreciated by over 4 percent in real effective
terms.7
Recently the RBI has invoked the term “Dutch Disease” in their justification for wanting to
check long-term rupee appreciation. The term refers to the negative effect large inflows of
capital into the Netherlands had on the Dutch manufacturing for export sector after the discovery
of natural-gas deposits. In India’s case, their favorable investment climate is the foreign capital
draw, but as demonstrated, not every export sector is adversely affected by a strong home
currency and it would appear targeting inflation by keeping domestic prices down, especially
with regard to precious imports with little elasticity for demand such as oil, might be a more
plausible reason for continued appreciation at least for now.
VI. Projections
______________________________________________________________________________
India’s next general election will take place May 2009. Projections hold for another coalition
government to be elected to power, with previous personality and policy clashes enduring which
should hinder any potential alliances in government.13 Structurally, labor and bankruptcy laws
are still overly rigid, tariff levels are high compared to other East Asian economies, overall
infrastructure (roads and ports) is in dire need of repair, and power cuts still cause significant
work stoppages on a month by month basis.14 Aggregate domestic demand outstrips supply, but
it is posited India will have to accept slower growth if the RBI is serious about keeping inflation
under control.14
Looking at Table 2, The Economist projects real GDP growth to slow over the next four years
before picking up again in 2012. Consumer price inflation projections, based on RBI public
commitments, will drop below 6 percent, and the rupee is estimated to continue to appreciate
presumably to keep inflation in check and in response to a U.S. recession.
13 Country Briefings: India – Forecast (2008, March 7). The Economist. Retrieved on March 18, 2008 from
http://www.economist.com/countries/India/profile.cfm?folder=Profile-Forecast
14 Goldilocks Tests the Vindaloo. (2007, July 7). The Economist. Retrieved on March 20, 2008 from
http://www.economist.com/research/articlesBySubject/displaystory.cfm?subjectid=6899464&story_id=9302709
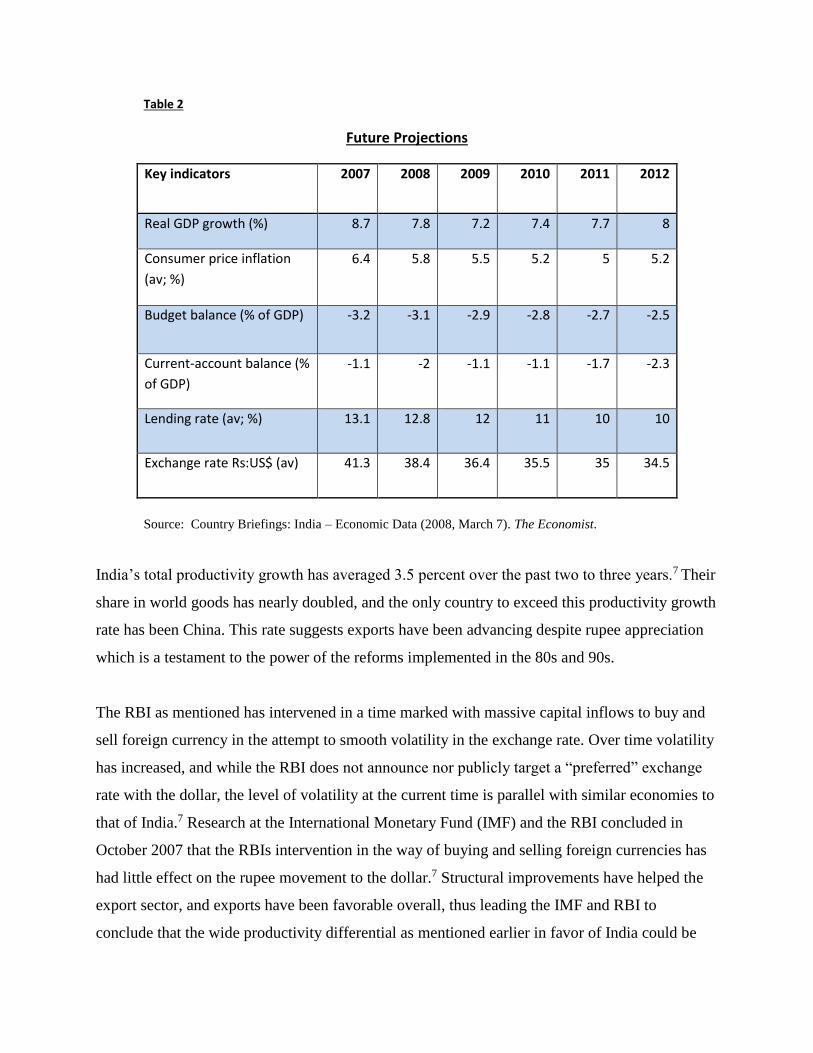
Table 2
Future Projections
Key indicators 2007 2008 2009 2010 2011 2012
Real GDP growth (%) 8.7 7.8 7.2 7.4 7.7 8
Consumer price inflation
(av; %)
6.4 5.8 5.5 5.2 5 5.2
Budget balance (% of GDP) -3.2 -3.1 -2.9 -2.8 -2.7 -2.5
Current-account balance (%
of GDP)
-1.1 -2 -1.1 -1.1 -1.7 -2.3
Lending rate (av; %) 13.1 12.8 12 11 10 10
Exchange rate Rs:US$ (av) 41.3 38.4 36.4 35.5 35 34.5
Source: Country Briefings: India – Economic Data (2008, March 7). The Economist.
India’s total productivity growth has averaged 3.5 percent over the past two to three years.7 Their
share in world goods has nearly doubled, and the only country to exceed this productivity growth
rate has been China. This rate suggests exports have been advancing despite rupee appreciation
which is a testament to the power of the reforms implemented in the 80s and 90s.
The RBI as mentioned has intervened in a time marked with massive capital inflows to buy and
sell foreign currency in the attempt to smooth volatility in the exchange rate. Over time volatility
has increased, and while the RBI does not announce nor publicly target a “preferred” exchange
rate with the dollar, the level of volatility at the current time is parallel with similar economies to
that of India.7 Research at the International Monetary Fund (IMF) and the RBI concluded in
October 2007 that the RBIs intervention in the way of buying and selling foreign currencies has
had little effect on the rupee movement to the dollar.7 Structural improvements have helped the
export sector, and exports have been favorable overall, thus leading the IMF and RBI to
conclude that the wide productivity differential as mentioned earlier in favor of India could be
the factor driving appreciation.7 Further structural improvements are needed of course, but a
higher rate of growth would also, as theorized, stoke inflation once again.
The RBIs measures seem to do more to reduce volatility in the rupee rather than manipulate
changes in the actual currency. It is clear that capital inflows and the resulting boom in
productivity have had an effect on rupee fluctuation. While the RBI might not have a direct role
in manipulating changes in the currency, political populism is certainly alive and well in India.
As long as taming inflation remains a politically viable platform to stump on, “smoothing” rupee
volatility will continue, and this type of monetary policy alongside capital inflows and labor
productivity levels should be considered to have much to do with the fluctuation of the rupee in
the past, present, and future.
Appendix A
Graph 1
Indian Rupees to 1 U.S. Dollar
Highest: 49.055 (5/22/02) Lowest: 16.920 (1/10/90)
Average over 18 years: 38.138
Source: http://www.chartflow.com/fx/historybasic.asp
INR
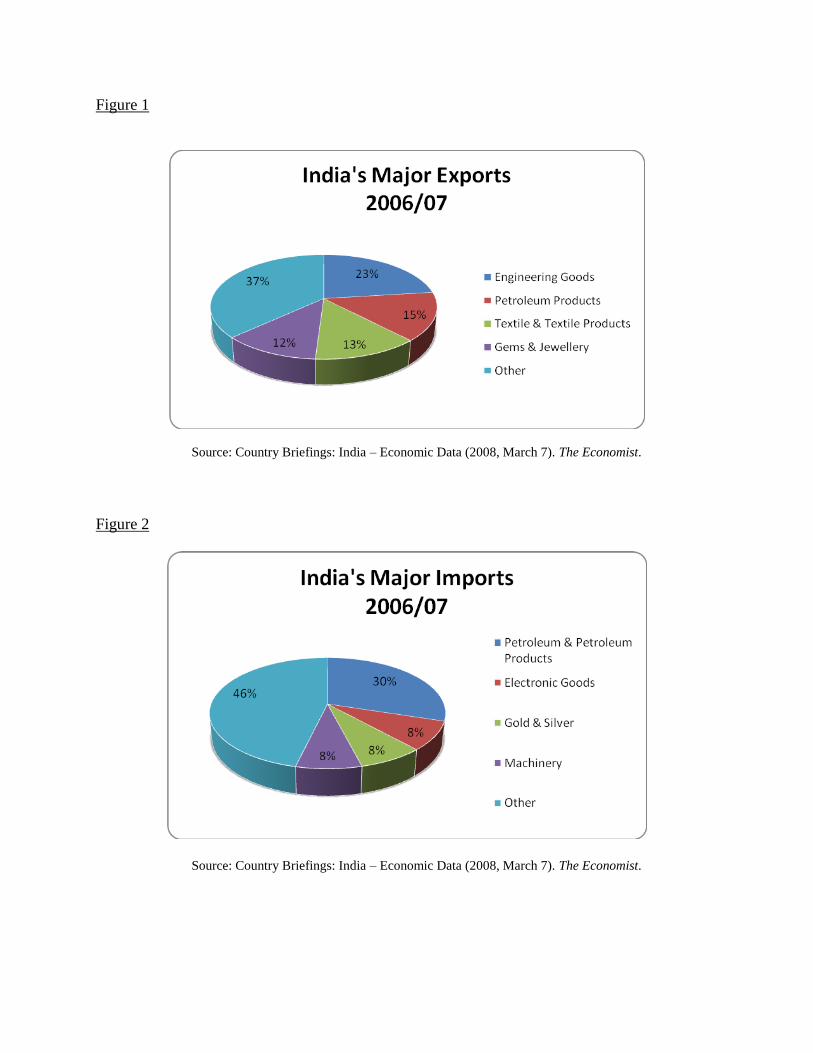
Figure 1
Source: Country Briefings: India – Economic Data (2008, March 7). The Economist.
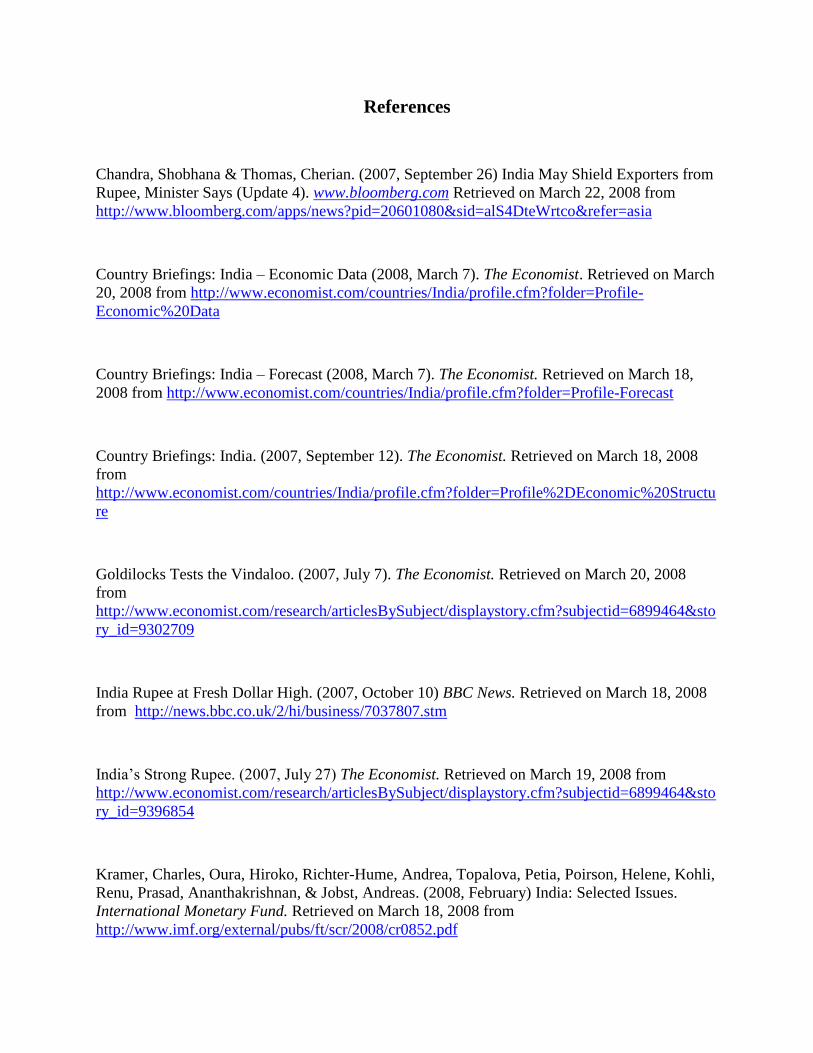
Figure 2
Source: Country Briefings: India – Economic Data (2008, March 7). The Economist.
References
Chandra, Shobhana & Thomas, Cherian. (2007, September 26) India May Shield Exporters from
Rupee, Minister Says (Update 4). www.bloomberg.com Retrieved on March 22, 2008 from
http://www.bloomberg.com/apps/news?pid=20601080&sid=alS4DteWrtco&refer=asia
Country Briefings: India – Economic Data (2008, March 7). The Economist. Retrieved on March
20, 2008 from http://www.economist.com/countries/India/profile.cfm?folder=Profile-
Economic%20Data
Country Briefings: India – Forecast (2008, March 7). The Economist. Retrieved on March 18,
2008 from http://www.economist.com/countries/India/profile.cfm?folder=Profile-Forecast
Country Briefings: India. (2007, September 12). The Economist. Retrieved on March 18, 2008
from
http://www.economist.com/countries/India/profile.cfm?folder=Profile%2DEconomic%20Structu
re
Goldilocks Tests the Vindaloo. (2007, July 7). The Economist. Retrieved on March 20, 2008
from
http://www.economist.com/research/articlesBySubject/displaystory.cfm?subjectid=6899464&sto
ry_id=9302709
India Rupee at Fresh Dollar High. (2007, October 10) BBC News. Retrieved on March 18, 2008
from http://news.bbc.co.uk/2/hi/business/7037807.stm
India’s Strong Rupee. (2007, July 27) The Economist. Retrieved on March 19, 2008 from
http://www.economist.com/research/articlesBySubject/displaystory.cfm?subjectid=6899464&sto
ry_id=9396854
Kramer, Charles, Oura, Hiroko, Richter-Hume, Andrea, Topalova, Petia, Poirson, Helene, Kohli,
Renu, Prasad, Ananthakrishnan, & Jobst, Andreas. (2008, February) India: Selected Issues.
International Monetary Fund. Retrieved on March 18, 2008 from
http://www.imf.org/external/pubs/ft/scr/2008/cr0852.pdf
Panagariya, Arvind. (2008, February 18). India’s Growing Economy: Song of the Crossroads.
The Brookings Institute. Retrieved on March 19, 2008 from
http://www.brookings.edu/opinions/2008/0218_india_economy_panagariya.aspx
Panagariya, Arvind. (2004, March) India in the 1980s and 1990s: A Triumph of Reforms.
International Monetary Fund. Retrieved on March 18, 2008 from
http://www.imf.org/external/pubs/ft/wp/2004/wp0443.pdf
Panagariya, Arvind. (2004, January 16) Is a Crisis Around the Corner? International Monetary
Fund. Retrieved on March 18, 2008 from
http://www.imf.org/external/np/seminars/eng/2004/fiscal/pdf/panag.pdf
Ramachandran, M. & Sambandhan, D. (2007, April 14). Resisting Rupee Appreciation?
Economic and Political Weekly. Retrieved on March 18, 2008 from
http://www.epw.org.in/epw/uploads/articles/10490.pdf
Robinson, Simon. (2007, July 16). The Message in India’s Rupee Rise. Time Magazine.
Retrieved on March 18, 2008 from
http://www.time.com/time/world/article/0,8599,1643855,00.html?xid=feed-cnn-topics
The Uncomfortable Rise of the Rupee. (2007, December 13) The Economist. Retrieved on March
19, 2008 from
http://www.economist.com/research/articlesBySubject/displaystory.cfm?subjectid=6899464&sto
ry_id=10286077
Varma, Anil. (2008, March 20). Rupee Set to Rebound as India Weathers U.S. Showdown, BOA
Says. www.bloomberg.com Retrieved on March 22, 2008 from
http://www.bloomberg.com/apps/news?pid=20601091&sid=axWlqwE6OOQk&refer=india