indian market analysis: consumption vs....
TRANSCRIPT
Indian Market Analysis: Consumption vs. Extraction!!
So much for certainty/earnings visibility: We do understand that Investing being game of odds,market participants would prefer to pay a premium for ‘certainty’ in earnings, growth etc. But the same question also then logically extends to expensive valuations. One has to be mindful of the fact that as much as the behavioral biases of the market might lead us to think otherwise, prospective returns essentially are a function of arithmetic calculations and not any story built around an investing idea/theme. With that thought we set out to capture this ‘certainty’ premium gap in an objective manner. For this we chose two sectors facing diagonally opposite headwinds/tailwinds currently. One is FMCG representing ‘Consumption’ theme and other one is Mines and Minerals representing ‘Extraction’ theme. FMCG businesses in India, riding on strong consumption trends have been associated with steadily growing earnings, higher valuations, rising stock prices and strong technical charts. On the other hand, slowing growth in China and other global macro issues have posed an overall benign environment for Natural Resources (NR)sector and have led to a sharp correction in commodity prices, earnings and technically weak charts etc. Multi-Act, as any other rational investor, mainly prefers to invest its own as well client’s portfolios into High Quality businesses (many of which are constituents of FMCG sector as such), but to ignorethe valuation gap (premium for certainty) might be a critical investing mistake.
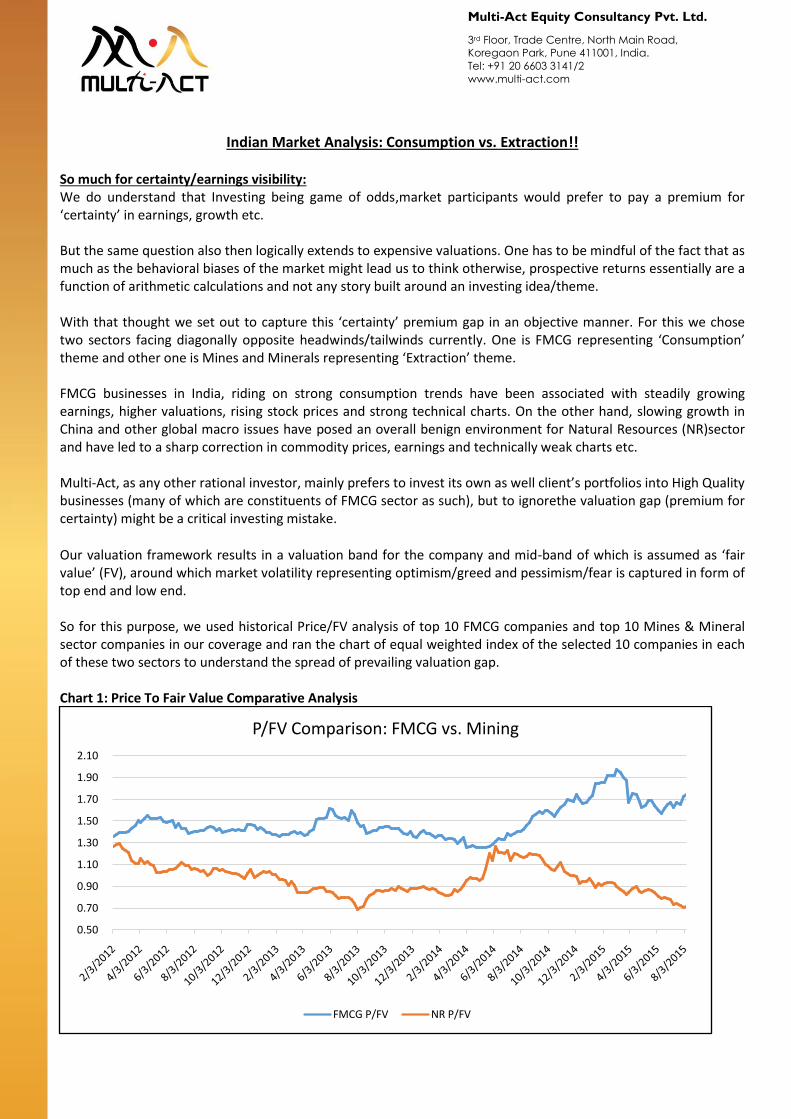
Our valuation framework results in a valuation band for the company and mid-band of which is assumed as ‘fair value’ (FV), around which market volatility representing optimism/greed and pessimism/fear is captured in form of top end and low end. So for this purpose, we used historical Price/FV analysis of top 10 FMCG companies and top 10 Mines & Mineral sector companies in our coverage and ran the chart of equal weighted index of the selected 10 companies in each of these two sectors to understand the spread of prevailing valuation gap. Chart 1: Price To Fair Value Comparative Analysis
0.50
0.70
0.90
1.10
1.30
1.50
1.70
1.90
2.10
P/FV Comparison: FMCG vs. Mining
FMCG P/FV NR P/FV
3rd Floor, Trade Centre, North Main Road,
Koregaon Park, Pune 411001, India.
Tel: +91 20 6603 3141/2
www.multi-act.com
Multi-Act Equity Consultancy Pvt. Ltd.

As can be seen above, the gap between relative P/FV Index of the two selected sectors has been widening significantly. Going forward, how much more will the gap broaden is anybody’s guess but it clearly suggestsa possibility of significant ‘alpha’ opportunity in hitherto discarded sector i.e. mining.
UsingLog adjusted chart of ratio of two indices we can see the stretched level of ‘long FMCG’ trade or Consumption theme: Chart 2: Log Adjusted Chart: FMCG & Mining
Please note that we have had continuous, usable; valuation coverage on these companies (assigned valuation band) for last 4-5 years and thus our analysis is limited to that period only. For the sake of clarification here, generally speaking FMCG companies are valued on income statement approach in Multi-Act framework and NR sector companies are valued on Net Asset Value- NAV approach.
Concurring to above is our HQ P/E Index which is also prevailing above 2 Sigma levels based on last 12-13 years.

Chart 3: High Quality PE Ratio
(Source: Multi-Act PMS team) On the other hand Bloomberg commodity index is back to its 1991 levels. Chart 4: Commodity Index Back to 1991 Levels
For specific commodity chart, please see appendix. Conclusion: It can be deciphered from above the greed and fear of market participants in play. Also, the other important point is that whether from a rational investing perspective, does Mr. Market offer a trade whereby prospective return (in one sector) outweighs the ‘certainty’ premium (in other).
Appendix: Companies selected:
FMCG Extraction
Colgate Coal India
Hindustan Unilever NMDC
Nestle Hindalco
ITC Hindustan Zinc
P&G ONGC
Dabur Oil India Ltd.
Marico Vedanta
Godrej Consumer MOIL
Emami CAIRN
Britannia NALCO
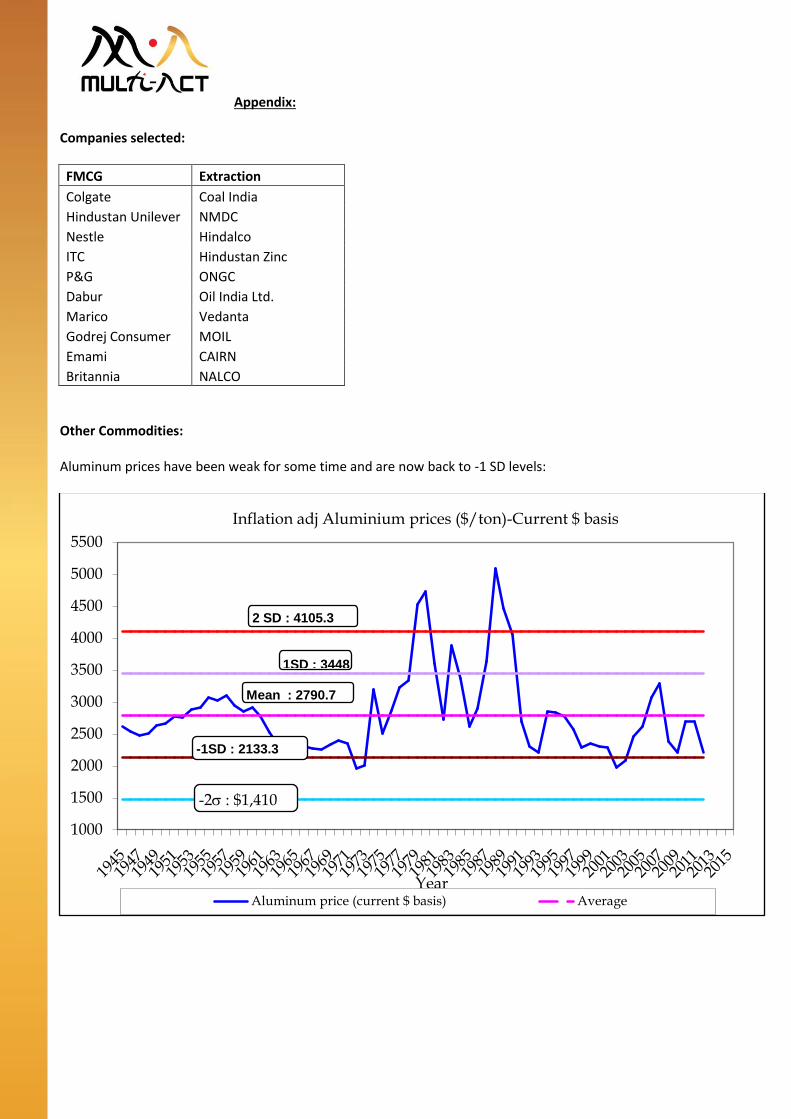
Other Commodities: Aluminum prices have been weak for some time and are now back to -1 SD levels:
1000
1500
2000
2500
3000
3500
4000
4500
5000
5500
Year
Inflation adj Aluminium prices ($/ton)-Current $ basis
Aluminum price (current $ basis) Average
2 SD : 4105.3
1SD : 3448
Mean : 2790.7
-1SD : 2133.3
-2s : $1,410
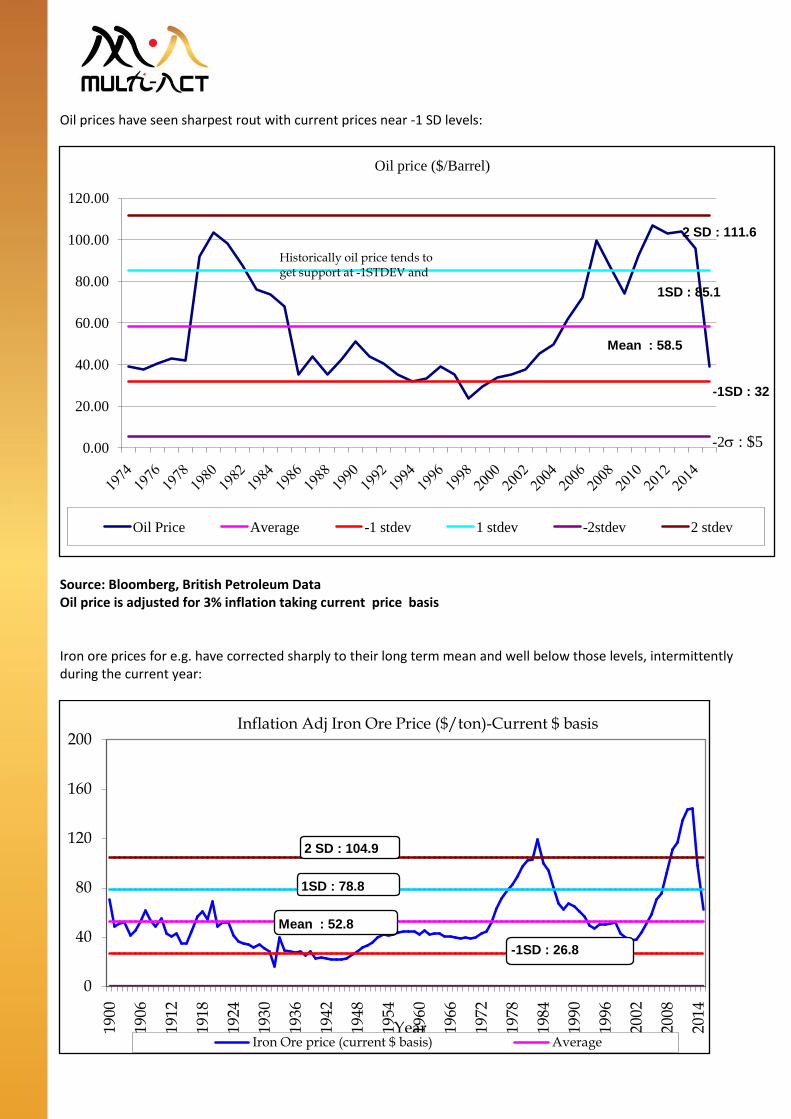
Oil prices have seen sharpest rout with current prices near -1 SD levels:
Source: Bloomberg, British Petroleum Data Oil price is adjusted for 3% inflation taking current price basis Iron ore prices for e.g. have corrected sharply to their long term mean and well below those levels, intermittently during the current year:
0.00
20.00
40.00
60.00
80.00
100.00
120.00
Oil price ($/Barrel)
Oil Price Average -1 stdev 1 stdev -2stdev 2 stdev
-2s : $5
-1SD : 32
Mean : 58.5
1SD : 85.1
2 SD : 111.6
Historically oil price tends to get support at -1STDEV and
0
40
80
120
160
200
1900
1906
1912
1918
1924
1930
1936
1942
1948
1954
1960
1966
1972
1978
1984
1990
1996
2002
2008
2014
Year
Inflation Adj Iron Ore Price ($/ton)-Current $ basis
Iron Ore price (current $ basis) Average
2 SD : 104.9
1SD : 78.8
Mean : 52.8
-1SD : 26.8

Statutory Details: - Multi-Act Equity Consultancy Private Limited (SEBI Registered Portfolio Manager - Registration No. INP000002965)
Disclaimer This is an Internal Document and meant for only limited circulation. This document has been solely prepared for the Clients of Multi-Act Equity Consultancy Private Limited (MAECL) and is not meant for circulation to any third party. The information is prepared on the basis of publicly available information, internally developed data and other sources believed to be reliable. MAECL does not solicit any course of action based on the information provided by it and the investor is advised to exercise independent judgment and act upon the same based on its/his/her sole discretion based on their own investigations and risk-reward preferences. MAECL, its associates or any of their respective directors, employees, affiliates or representatives do not assume any responsibility for, or warrant the accuracy, completeness, adequacy and reliability of such information and consequently are not liable for any direct, indirect, special, incidental, consequential, punitive or exemplary damages, including lost profits arising in any way for decisions taken based on the said information. The Client shall at all times keep such information / data and material provided by MAECL strictly confidential and will not use, share or disclose such information to any third party. It is stated that, as permitted by SEBI Regulations and the Company’s Employee Dealing Policy, MAECL and/or its associates, employees, affiliates and/or individuals, clients of MAECL’s portfolio management services, thereof may have positions in securities referred to in the information provided by it and may make purchases or sale thereof while the information is in circulation. The contents herein – information or views – do not amount to distribution, guidelines, an offer or solicitation of any offer to buy or sell any securities or financial instruments, directly or indirectly, in the United States of America (US), in Canada, in jurisdictions where such distribution or offer is not authorized and in FATF non-compliant jurisdiction and are particularly not for US persons (being persons resident in the US, corporations, partnerships or other entities created or organized in or under the laws of the US or any person falling within the definition of the term “US person” under Regulation S promulgated under the US Securities Act of 1933, as amended) and persons of Canada. Risk factors General risk factors a. Securities investments are subject to market risks and there is no assurance or guarantee that the objective of the investments will be achieved. b. As with any investment in securities, value of the Client’s investments can go up or down depending on the factors and forces affecting the capital market. MAECL is neither responsible nor liable for any losses resulting from such factors. c. The information on investments is subject to external risks such as war, natural calamities, and policy changes of local / international markets which affect stock markets. d. MAECL has renewed its SEBI PMS registration effective October 14, 2014 and has commenced its portfolio management activities with effect from January 2011. However MAECL has more than 10 years of experience in managing its own funds invested in the domestic market.
Regd. Office: 3rd Floor, Trade Centre, North Main Road, Koregaon Park, Pune – 411001, Tel. +91 20 66033141/2, www.multi-act.com