indian consumer survey -arpita_final 100702
TRANSCRIPT

8/3/2019 Indian Consumer Survey -Arpita_final 100702
http://slidepdf.com/reader/full/indian-consumer-survey-arpitafinal-100702 1/32
New Insights into Modern India
Shopper Behavior and Implications
for Global Retailers and Local
Policymakers
Arpita MukherjeeProfessor, Indian Council for Research on International Economic
Relations (ICRIER)New Delhi, India
Murali K. MantralaSam Walton Professor of Marketing
University of Missouri, Columbia
Shaoming ZouRobert J. Trulaske, Sr. Professor of Marketing
University of Missouri, ColumbiaExternal Professor of Marketing, Peking University
Presentation at 2010 China India Consumer Insights Conference, Yale Univ.-Tsinghua Univ., Beijing, July 3, 2010
1
8/3/2019 Indian Consumer Survey -Arpita_final 100702
http://slidepdf.com/reader/full/indian-consumer-survey-arpitafinal-100702 2/32
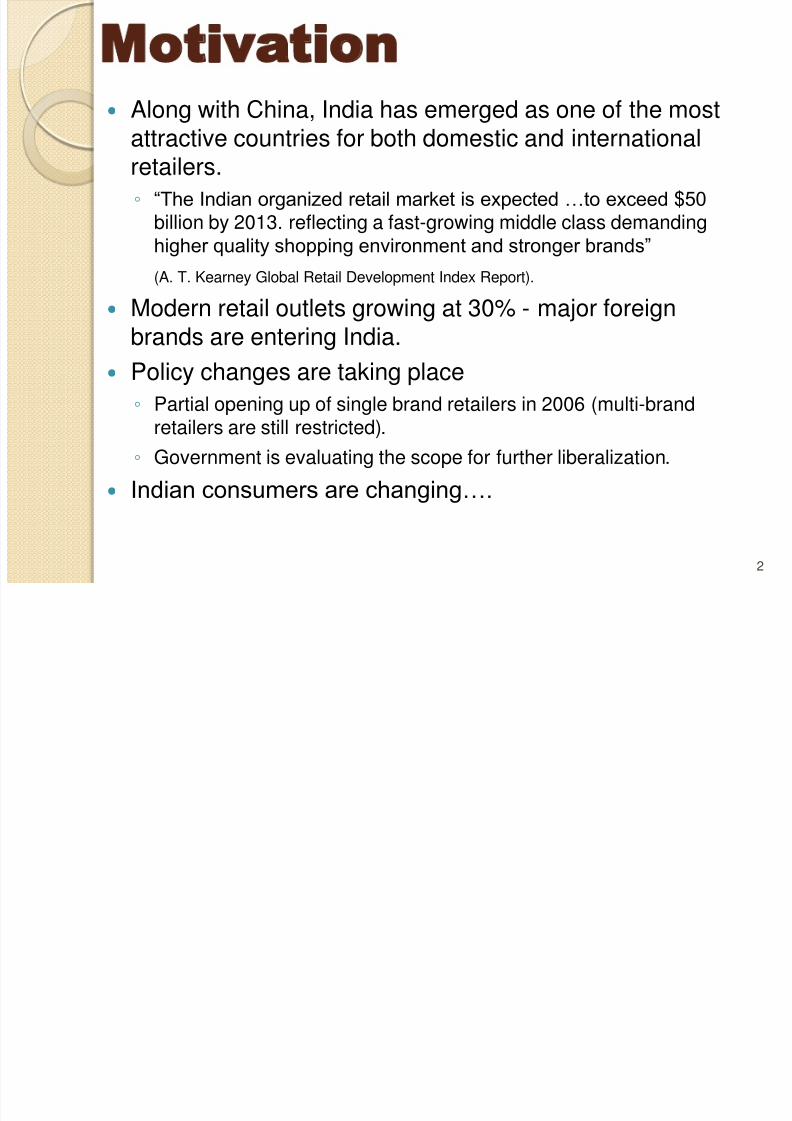
Motivation Along with China, India has emerged as one of the most
attractive countries for both domestic and internationalretailers.
◦ “The Indian organized retail market is expected …to exceed $50billion by 2013. reflecting a fast-growing middle class demandinghigher quality shopping environment and stronger brands”
(A. T. Kearney Global Retail Development Index Report).
Modern retail outlets growing at 30% - major foreignbrands are entering India.
Policy changes are taking place
◦
Partial opening up of single brand retailers in 2006 (multi-brandretailers are still restricted).
◦ Government is evaluating the scope for further liberalization.
Indian consumers are changing….
2
8/3/2019 Indian Consumer Survey -Arpita_final 100702
http://slidepdf.com/reader/full/indian-consumer-survey-arpitafinal-100702 3/32
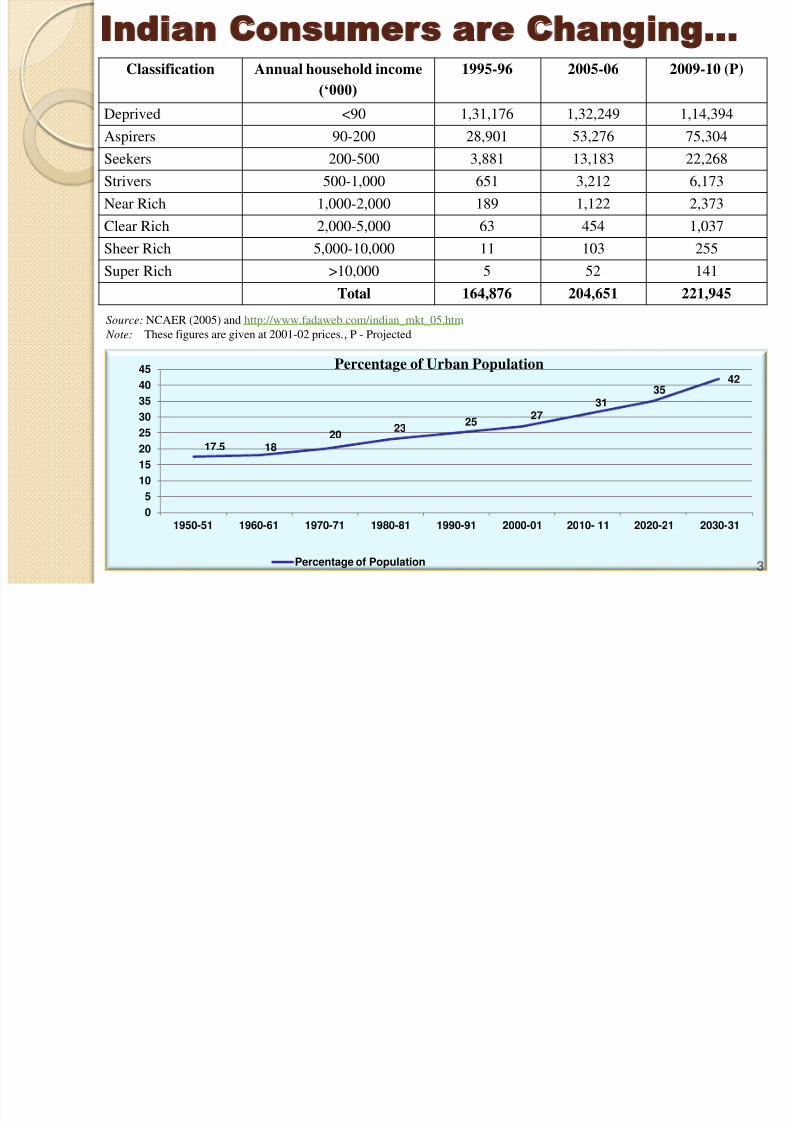
Indian Consumers are Changing…
17.5 1820
2325
2731
3542
0
5
10
15
20
25
30
35
40
45
1950-51 1960-61 1970-71 1980-81 1990-91 2000-01 2010- 11 2020-21 2030-31
Percentage of Population
Percentage of Urban Population
Classification Annual household income
(‘000)
1995-96 2005-06 2009-10 (P)
Deprived <90 1,31,176 1,32,249 1,14,394
Aspirers 90-200 28,901 53,276 75,304Seekers 200-500 3,881 13,183 22,268
Strivers 500-1,000 651 3,212 6,173
Near Rich 1,000-2,000 189 1,122 2,373
Clear Rich 2,000-5,000 63 454 1,037
Sheer Rich 5,000-10,000 11 103 255
Super Rich >10,000 5 52 141Total 164,876 204,651 221,945
Source: NCAER (2005) and http://www.fadaweb.com/indian_mkt_05.htm Note: These figures are given at 2001-02 prices., P - Projected
3

8/3/2019 Indian Consumer Survey -Arpita_final 100702
http://slidepdf.com/reader/full/indian-consumer-survey-arpitafinal-100702 4/32
Our Research Objectives &
Questions
To gain insights into Indian consumers’ shoppingbehaviors
◦ What is their level of brand awareness and brandconsciousness?
◦ What type of products do they purchase? From whatkinds of retail outlets?
◦ What are the factors determining the choice of retailoutlets & frequency of shopping for particular
products? To draw useful implications for retailers and
policymakers
4

8/3/2019 Indian Consumer Survey -Arpita_final 100702
http://slidepdf.com/reader/full/indian-consumer-survey-arpitafinal-100702 5/32
Our Intended Contribution
Our research is based on a primary
survey of 300 high and middle-income,educated consumers’ shopping behavior
across eight product categories
conducted in 2009.
Despite growing size and importance of the Indian Retail sector, existing primary research data on Indian
shoppers are very limited.
5

8/3/2019 Indian Consumer Survey -Arpita_final 100702
http://slidepdf.com/reader/full/indian-consumer-survey-arpitafinal-100702 6/32
Presentation Organization
Description of the primary survey
Sample profile
Summary results of Indian shopperbehavior
Lessons for retailers and policymakers
Next Steps
6

8/3/2019 Indian Consumer Survey -Arpita_final 100702
http://slidepdf.com/reader/full/indian-consumer-survey-arpitafinal-100702 7/32
Survey Procedures
A three-tier survey was conducted through door-to-door
interviews and through interviews with consumers inshopping malls
Focused on the consumers’ level of brand consciousness,where they purchase such brands from, and what factors
determine their purchase decisions.
Cities covered during the Survey
Tier I Mumbai, Chennai, Delhi, Kolkata,Hyderabad, Ahmedabad
Tier II & Tier IIIAllahabad, Bhubaneswar, Kanpur,
Surat, Visakhapatnam
7

8/3/2019 Indian Consumer Survey -Arpita_final 100702
http://slidepdf.com/reader/full/indian-consumer-survey-arpitafinal-100702 8/32
Product Categories
Clothing and Fashion Accessories
Footwear and Leather Goods
Gems and Jewellery
Food and Grocery
Home Furnishing and Home Appliances
Sports Goods
Health and Wellness Products
Gifts and Stationery Items 8

8/3/2019 Indian Consumer Survey -Arpita_final 100702
http://slidepdf.com/reader/full/indian-consumer-survey-arpitafinal-100702 9/32
Sample Profile
61.67%
38.33%
Gender Distribution
Males
Females
13
132
151
40
20
40
60
80
100
120
140
160
19-22 23-30 31-60 >60
Age Distribution
6 11
160
123
0
20
40
60
80
100
120
140
160
180
Schooling Some collegebut not
graduate
Graduate Post Graduate
Education Distribution11
72
94
109
9
3 2
Income-wise Distribution
50 Lakhs - 1 Crore 20 Lakhs - 50 Lakhs 10 Lakhs - 20 Lakhs
5 Lakhs - 10 Lakhs 2 Lakhs - 5 Lakhs 1 Lakh - 2 Lakhs
Up to 1 Lakh
In per cent
9
1 Lakh = $2,220

8/3/2019 Indian Consumer Survey -Arpita_final 100702
http://slidepdf.com/reader/full/indian-consumer-survey-arpitafinal-100702 10/32
Sample Distribution across City-tiers
67%
23%
10%
Percentage Distribution
Tier I
Tier II
Tier III
Location Total
Tier 1 citiesDelhi 51
Mumbai 47
Kolkata 40
Chennai 38
Hyderabad 25
Total 201
Tier II Cities
Surat 13
Ahemdabad 10
Vishakhapatnam 12
Kanpur 16Allahabad 18
Total 69
Tier III Cities
Bhubaneswar 30
Total 30
Grand Total 30010

8/3/2019 Indian Consumer Survey -Arpita_final 100702
http://slidepdf.com/reader/full/indian-consumer-survey-arpitafinal-100702 11/32
Ownership of Autos
11
L uxury car
Small car 2 - Wheeler
176
34 15
12

8/3/2019 Indian Consumer Survey -Arpita_final 100702
http://slidepdf.com/reader/full/indian-consumer-survey-arpitafinal-100702 12/32
Media and Brand Awareness
12.33%
87.67%
Percentage of RespondentsTravelled Internationally
Yes No
• 65% of the respondentswho travel abroadpurchase foreign brandsduring their international
trips
• 79% of those whopurchase duringinternational trips say
that products aredifferent from India
30%
70%
Level of Awareness – Use
of Media
Do not follow updates Follow updates
12

8/3/2019 Indian Consumer Survey -Arpita_final 100702
http://slidepdf.com/reader/full/indian-consumer-survey-arpitafinal-100702 13/32
Summary Findings of
Indian Shopper
Behavior
13

8/3/2019 Indian Consumer Survey -Arpita_final 100702
http://slidepdf.com/reader/full/indian-consumer-survey-arpitafinal-100702 14/32
Regional and City-wise Distribution of
Branded Product Purchases
Products
North
Region
South
Region
East
Region
West
Region
Sample Distribution
(No.)85 75 70 70
In per cent
Fresh Fruits &
Vegetables10.6 2.7 2.9 12.9
Preserved Food &
Agro Products64.7 21.3 51.4 20.0
Apparel 24.7 56.0 48.6 35.7
Handbags 65.9 28.0 61.4 37.1
Footwear 78.8 93.3 92.9 91.4
Jewellery 68.2 57.3 68.6 47.1
Consumer Durables 100.0 89.3 90.0 90.0
Costume Jewellery 32.9 4.0 18.6 27.1
Furniture 51.8 30.7 32.9 27.1
Ceramic
Tiles/Sanitary ware 83.5 65.3 50.0 28.6
Products Delhi Kolkata
Sample Distribution
(No.)51 39
In per cent
Fresh Fruits &
Vegetables5.9 5.0
Preserved Food &
Agro Products56.9 60.0
Apparel 29.4 32.5
Handbags 51.0 62.5
Footwear 94.1 87.5
Watches 100.0 97.5
Jewellery 52.9 62.5
Costume Jewellery 25.5 15.0
Furniture 49.0 35.0
Ceramic
Tiles/Sanitary ware72.5 40.0
Consumer Durables 100.0 95.014

8/3/2019 Indian Consumer Survey -Arpita_final 100702
http://slidepdf.com/reader/full/indian-consumer-survey-arpitafinal-100702 15/32
Knowledge about Foreign Brands
BrandYear ofEntry
Mode of OperationKnow/Not
UseDo Not Know Know/Use
Bata 1931 Wholly owned subsidiary 22 2.67 75.33
Rayban 1990 Wholly owned subsidiary 33.67 3 63.33United Colors ofBenetton
1991 Wholly owned subsidiary 64 11.67 24.33
Nike 1995Exclusive licensingagreement
44.67 4.33 51
ErmenegildoZegna
2000 Franchise agreement 13 86.67 0.33
Louis Vuitton 2003 Distribution Agreement 18 78 4Versace 2006 Franchise agreement 35.33 61.33 3.33
Da Milano 2006 Privately held company 57.67 34.67 7.67
Gucci 2006Exclusive licensingagreement
55.67 14.33 30
SalvatoreFerragamo
2006 Joint Venture 12.67 87 0.33
Mango 2006 Exclusive licensingagreement
33.33 63 3.67
NEXT 2006 Franchise agreement 52.33 41 6.67
Dolce &Gabbana
2007 Joint Venture 35.67 55.67 8.67
Giorgio Armani 2008 Joint Venture 52.67 35.33 12
Bottega Veneta 2008 Exclusive licensingagreement 12.67 87 0.33
(in percent )
15

8/3/2019 Indian Consumer Survey -Arpita_final 100702
http://slidepdf.com/reader/full/indian-consumer-survey-arpitafinal-100702 16/32
Why do Consumers Choose Branded
Products?
149
128
69
0
2040
60
80
100
120
140
160
Better Quality Better Design More Variety
Leather Goods
24
4
0
5
10
15
20
25
30
Better Quality More Variety
Fresh Fruits and Vegetables
116109
92
0
20
40
60
80
100
120
140
Better Design Better Quality More Variety
Apparel
114
14 11
0
20
40
60
80
100
120
Better Packaging Affordibility More Variety
Preserved Food and Agro Products

8/3/2019 Indian Consumer Survey -Arpita_final 100702
http://slidepdf.com/reader/full/indian-consumer-survey-arpitafinal-100702 17/32
Where do Consumers Purchase?
Sectors Small Retailers CorporateRetailers Both
Fresh Fruits andVegetables
274 22 4
FMCG products 258 40 2
Preserved Foodand Agro products
191 41 1
Jewellery 92 182 11
Handbags 82 148 3
Apparel 3 202 95
Footwear 3 269 28
17

8/3/2019 Indian Consumer Survey -Arpita_final 100702
http://slidepdf.com/reader/full/indian-consumer-survey-arpitafinal-100702 18/32
224232
297
240
2 3 3 5
74
65
0
55
0
50
100
150
200
250
300
350
Spending Frequency of Purchase Brand Conciousness Quality Copnciousness
P o p u l a t i o
n
Purchasing Pattern
Increased Decreased Unchanged
Effects of Emergence of Corporate Retail
Outlets/ Malls on Purchasing Pattern
18

8/3/2019 Indian Consumer Survey -Arpita_final 100702
http://slidepdf.com/reader/full/indian-consumer-survey-arpitafinal-100702 19/32
Periods of Purchase for different
Product Categories
3756
253
22
225
30
50
100
150
200
250
300
New Product
Released in
market
Seasonal Sales
& Discounts
Festivals Family
Occasions
Regular
Purchases
Seaonal
Pruchase
Apparel
5
51
108
6
179
20
20406080
100120140160180200
New
Product
Released in
market
Seasonal
Sales &
Discounts
Festivals Family
Occasions
Regular
Purchases
Seaonal
Pruchase
Leather Goods
1
299
0
50
100
150
200
250
300
350
Festivals Regular Purchases
Fresh fruits
19

8/3/2019 Indian Consumer Survey -Arpita_final 100702
http://slidepdf.com/reader/full/indian-consumer-survey-arpitafinal-100702 20/32
Importance of Various Factors in
Consumers’ Choice of Modern Retail Stores
Note: Scale of 1 to 5, higher is better. Percentage calculated on the basis of “high (4)” and “very high (5)” on factor
importance ratings. This is a multiple choice question
55
92
90
76
95
94
60
52
20
63
86
85
76
31
87
41
78
70
40
60
62
0 10 20 30 40 50 60 70 80 90 100
Price
Fresh New Stock/Exclusive Design
Preffered Brand/Variety
Better Packaging
Better Product Quality
Quality Assurance
Fixed Rate
Promotional Offers
Credit Facility Availability
Use of Credit/Debit Card
Better Customer Service
Better Ambience
Convenient Timings
Closer to House
Brand Image/Goodwill
Home Delivery
After Sales Service
Easy in Product Exchange
Customer Loyalty Card
Blend of Shopping and Entertainment
Availability of Foreign Brands
Per cent
20

8/3/2019 Indian Consumer Survey -Arpita_final 100702
http://slidepdf.com/reader/full/indian-consumer-survey-arpitafinal-100702 21/32
Additional Analysis
Results
21
8/3/2019 Indian Consumer Survey -Arpita_final 100702
http://slidepdf.com/reader/full/indian-consumer-survey-arpitafinal-100702 22/32
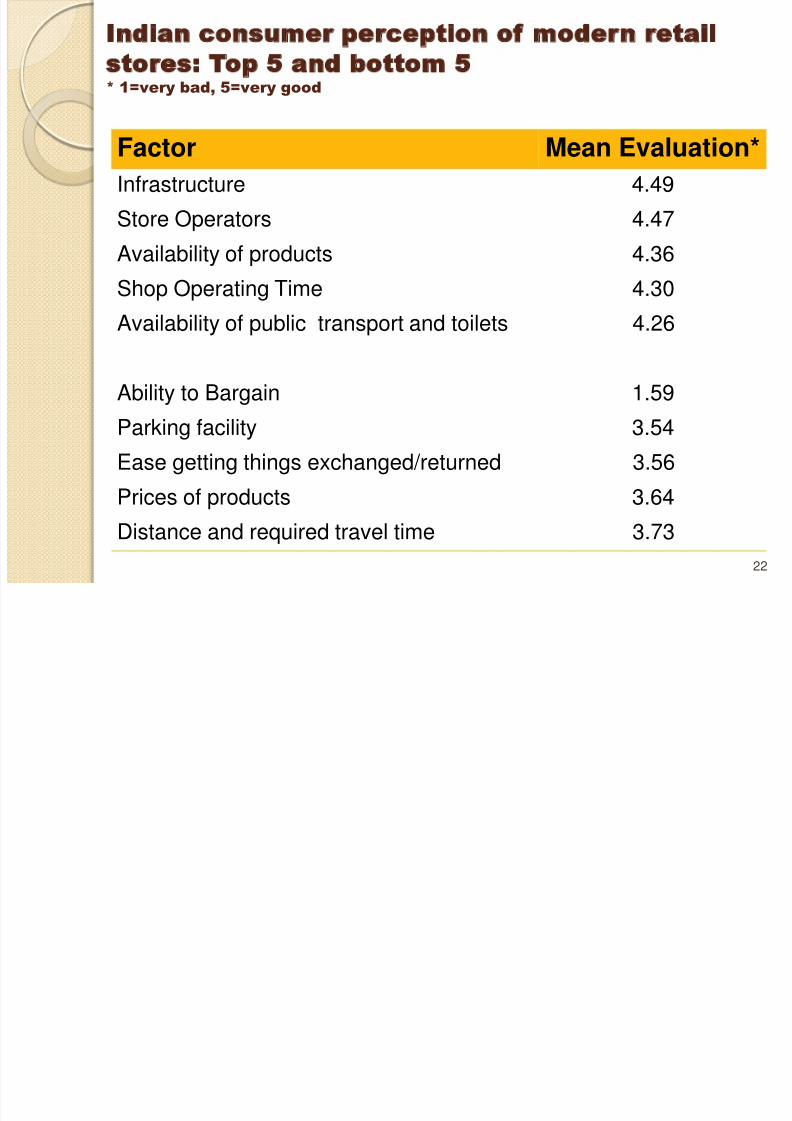
Indian consumer perception of modern retail
stores: Top 5 and bottom 5 * 1=very bad, 5=very good
Factor Mean Evaluation*
Infrastructure 4.49
Store Operators 4.47
Availability of products 4.36
Shop Operating Time 4.30
Availability of public transport and toilets 4.26
Ability to Bargain 1.59
Parking facility 3.54
Ease getting things exchanged/returned 3.56
Prices of products 3.64
Distance and required travel time 3.73
22
8/3/2019 Indian Consumer Survey -Arpita_final 100702
http://slidepdf.com/reader/full/indian-consumer-survey-arpitafinal-100702 23/32
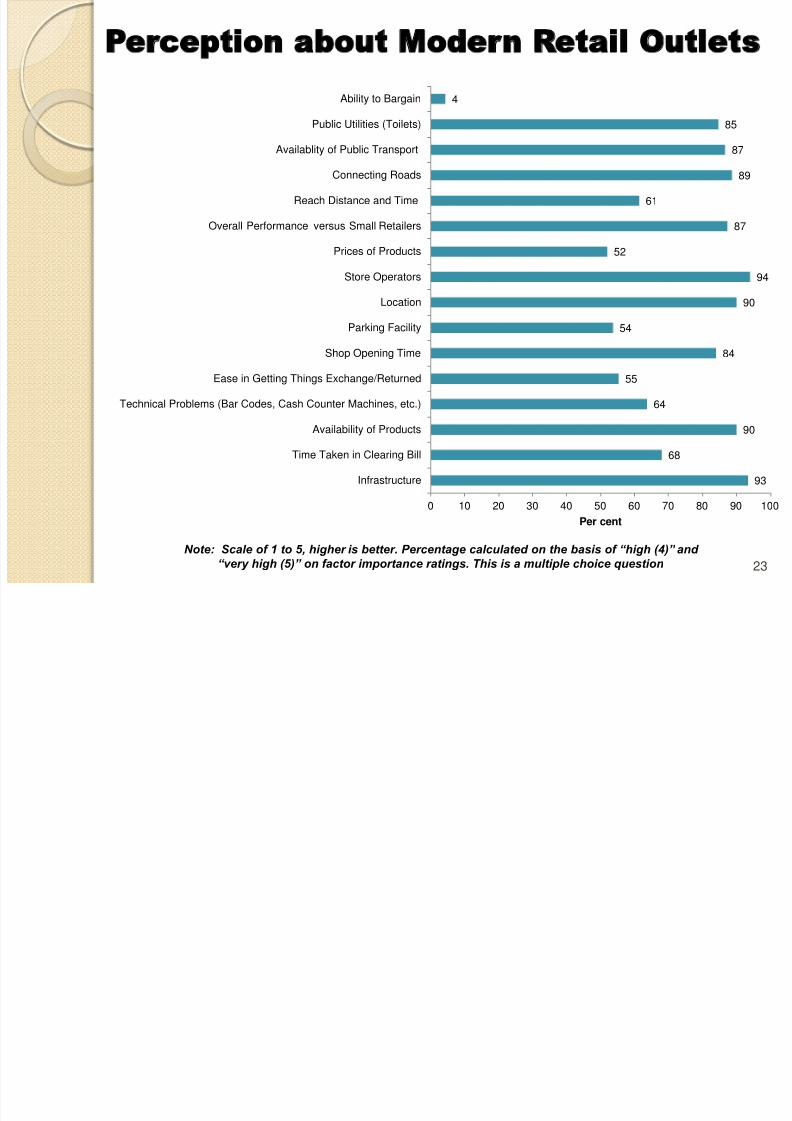
Perception about Modern Retail Outlets
93
68
90
64
55
84
54
90
94
52
87
61
89
87
85
4
0 10 20 30 40 50 60 70 80 90 100
Infrastructure
Time Taken in Clearing Bill
Availability of Products
Technical Problems (Bar Codes, Cash Counter Machines, etc.)
Ease in Getting Things Exchange/Returned
Shop Opening Time
Parking Facility
Location
Store Operators
Prices of Products
Overall Performance versus Small Retailers
Reach Distance and Time
Connecting Roads
Availablity of Public Transport
Public Utilities (Toilets)
Ability to Bargain
Per cent
Note: Scale of 1 to 5, higher is better. Percentage calculated on the basis of “high (4)” and “very high (5)” on factor importance ratings. This is a multiple choice question 23

8/3/2019 Indian Consumer Survey -Arpita_final 100702
http://slidepdf.com/reader/full/indian-consumer-survey-arpitafinal-100702 24/32
Top 5 factors influencing Indian consumers’ shopping
at modern retail stores * 1=very low importance, 5=very high importance
Factor MeanImportance*
Product Quality 4.64
Assortment Selection and Newness 4.47
Customer Service 4.29
Store Ambience and Convenience 4.27
Price 3.71
24

8/3/2019 Indian Consumer Survey -Arpita_final 100702
http://slidepdf.com/reader/full/indian-consumer-survey-arpitafinal-100702 25/32
Demographic effects on Indian consumer annual
spending on branded clothing and footwear(Stepwise Regression)
Significant Variable
Standardized
regression
coefficient t-ValueSignificance
level
Yearly household income .282 5.161 .000
Travelled abroad .188 3.440 .001
Model R2 = .120, F = 20.19, p < .001
25

8/3/2019 Indian Consumer Survey -Arpita_final 100702
http://slidepdf.com/reader/full/indian-consumer-survey-arpitafinal-100702 26/32
Demographic effects on Indian consumer
purchase of branded products (Stepwise
Logistic Regression)
DependentVariable >
Handbags andJewelry
Furniture Fresh Fruits
Independent
VariableExp(B) Wald Sig. Exp(B) Wald Sig. Exp(B) Wald Sig.
Yearly household
income.598 16.13 .000 .509 9.23 .000
Travelled abroad .336 8.14 .004 .268 12.79 .000
Model Statistics:
-2 Log likelihood =
379.75
p < .001
-2 Log likelihood =
381.35
p < .001
-2 Log likelihood =
166.83
p < .005
26
8/3/2019 Indian Consumer Survey -Arpita_final 100702
http://slidepdf.com/reader/full/indian-consumer-survey-arpitafinal-100702 27/32
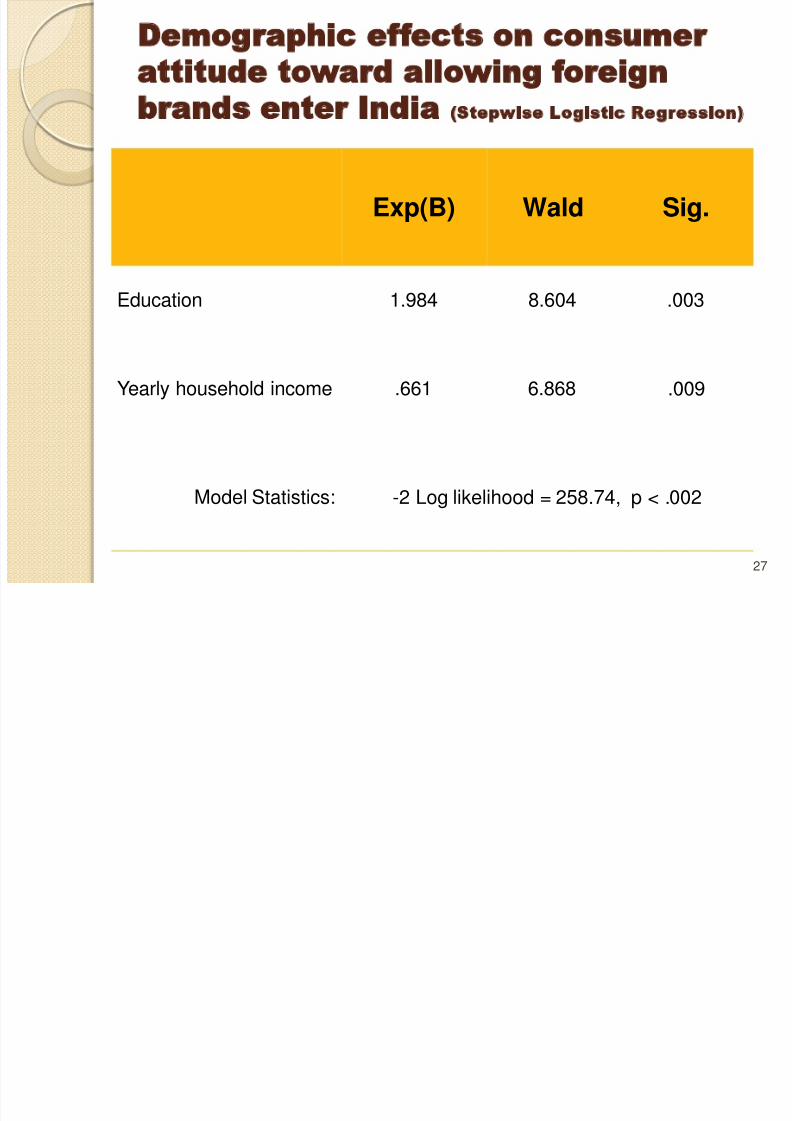
Demographic effects on consumer
attitude toward allowing foreign
brands enter India (Stepwise Logistic Regression)
Exp(B) Wald Sig.
Education 1.984 8.604 .003
Yearly household income .661 6.868 .009
Model Statistics: -2 Log likelihood = 258.74, p < .002
27

8/3/2019 Indian Consumer Survey -Arpita_final 100702
http://slidepdf.com/reader/full/indian-consumer-survey-arpitafinal-100702 28/32
Implications for Global Retailers
• Brand consciousness is increasing but varies across
different product categories• Brands with longer presence are more likely to be knownand used
• Mode of entry is not related to brand knowledge• International travel increases brand awareness• Branded product should be same as in international
markets in terms of price and quality. Additionalrequirement of after-sale services and productcustomisation
• Indian consumers are price sensitive – right product pricing• May explore possibilities of sourcing from Indian market
• Customer brand loyalty is low. It varies across productcategory, gender, etc.
• India is not a homogenous market – vast difference acrossregions
• Modern retailers cater to a small segment of the Indian
population 28
8/3/2019 Indian Consumer Survey -Arpita_final 100702
http://slidepdf.com/reader/full/indian-consumer-survey-arpitafinal-100702 29/32
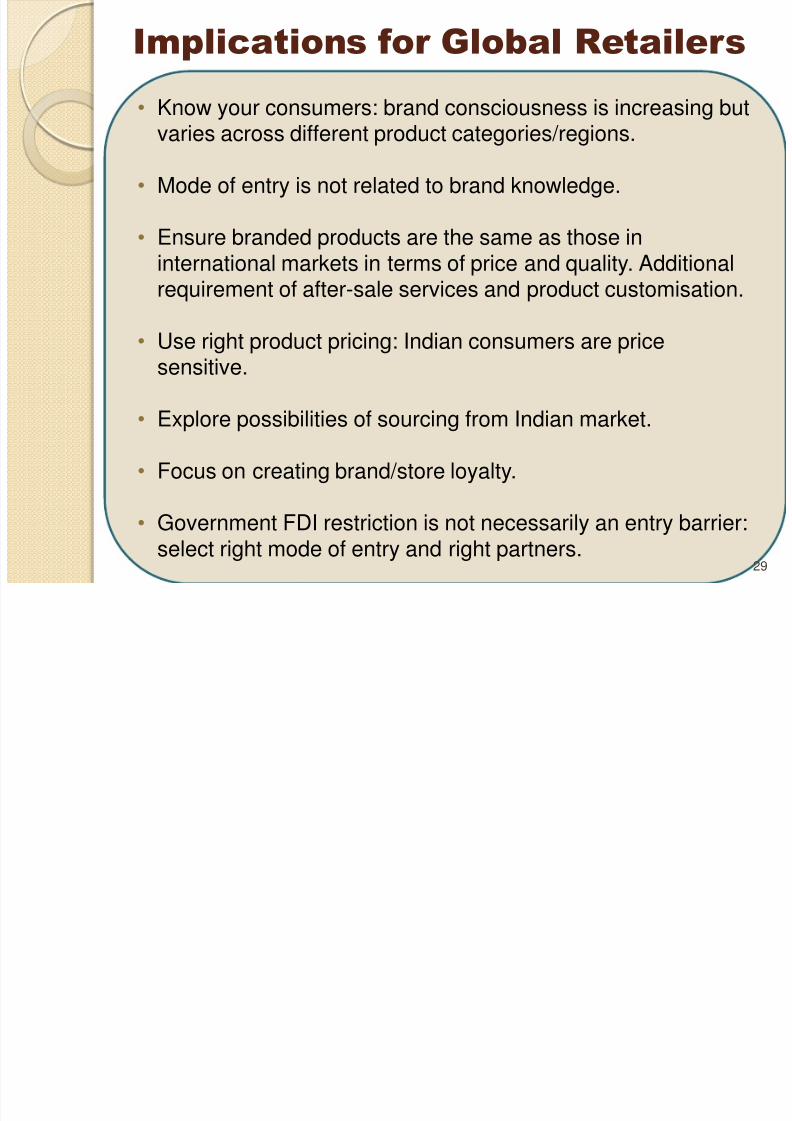
Implications for Global Retailers
• Know your consumers: brand consciousness is increasing but
varies across different product categories/regions.
• Mode of entry is not related to brand knowledge.
• Ensure branded products are the same as those ininternational markets in terms of price and quality. Additionalrequirement of after-sale services and product customisation.
• Use right product pricing: Indian consumers are pricesensitive.
• Explore possibilities of sourcing from Indian market.
• Focus on creating brand/store loyalty.
• Government FDI restriction is not necessarily an entry barrier:
select right mode of entry and right partners. 29
I li ti f P li M k
8/3/2019 Indian Consumer Survey -Arpita_final 100702
http://slidepdf.com/reader/full/indian-consumer-survey-arpitafinal-100702 30/32
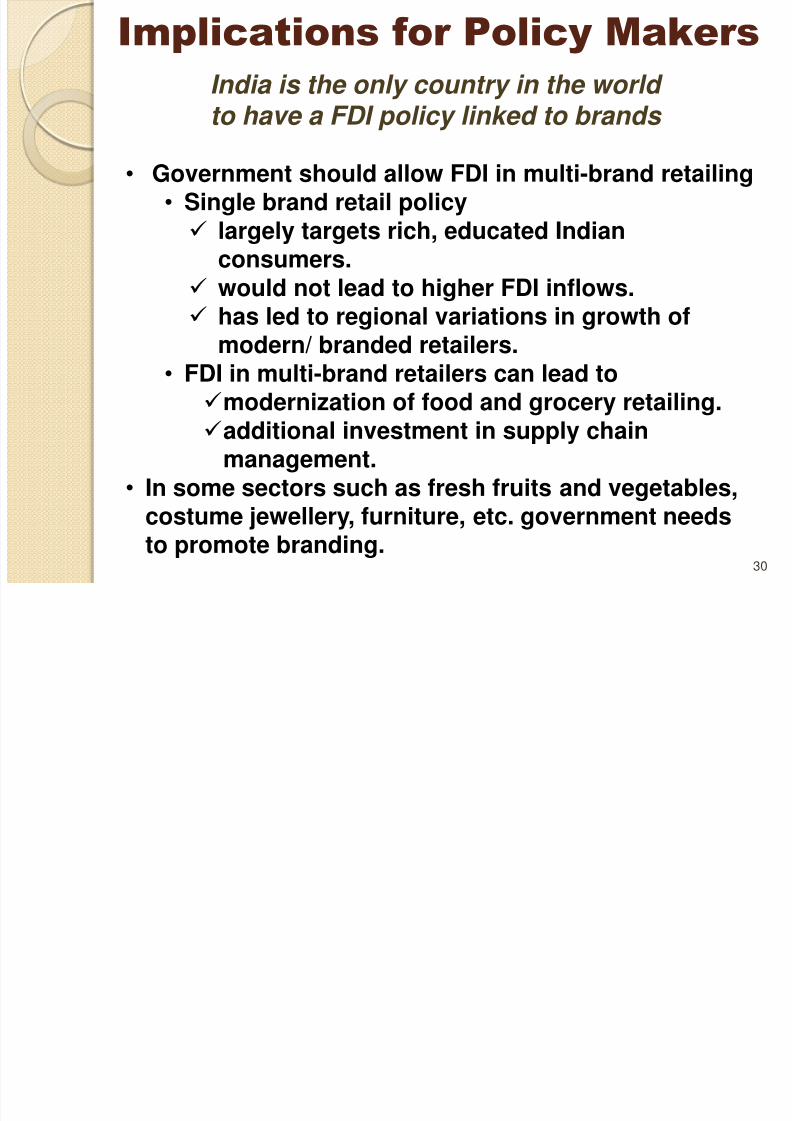
India is the only country in the world to have a FDI policy linked to brands
Implications for Policy Makers
• Government should allow FDI in multi-brand retailing• Single brand retail policy largely targets rich, educated Indian
consumers.
would not lead to higher FDI inflows. has led to regional variations in growth of
modern/ branded retailers.• FDI in multi-brand retailers can lead to
modernization of food and grocery retailing.additional investment in supply chainmanagement.
• In some sectors such as fresh fruits and vegetables,costume jewellery, furniture, etc. government needs
to promote branding. 30

8/3/2019 Indian Consumer Survey -Arpita_final 100702
http://slidepdf.com/reader/full/indian-consumer-survey-arpitafinal-100702 31/32
Next Step
• Larger survey of Indian consumers (sample sizearound 1,000 focusing on heterogeneity acrossregions, cities, products, etc.)
• A survey of Indian large and small retailers to
understand how they cater on Indian shopper’sbehavior
• A survey of retail consumers in four Chinese cities(Sample size 200)
• Comparison of Indian and Chinese consumers – brand consciousness, shopping behavior, etc.through primary survey and stakeholder’sconsultation
31
8/3/2019 Indian Consumer Survey -Arpita_final 100702
http://slidepdf.com/reader/full/indian-consumer-survey-arpitafinal-100702 32/32