indiabulls housing finance limited - wordpress.com housing finance limited ... april 24, 2015. ......
TRANSCRIPT

Indiabulls Housing Finance Limited (CIN: L65922DL2005PLC136029)
Annual Audited Financial Results for Q4 FY 2014-15 and FY 2014-15
April 24, 2015

This document contains certain forward-looking statements based on current expectations of Indiabulls management. Actual results may vary significantly from the forward-looking statements in this document due to various risks and uncertainties. These risks and uncertainties include the effect of economic and political conditions in India, and outside India, volatility in interest rates and in Securities markets, new regulations and government policies that might impact the business of Indiabulls, the general state of the Indian economy and the management’s ability to implement the company’s strategy. Indiabulls doesn’t undertake any obligation to update these forward-looking statements.
This document does not constitute an offer or recommendation to buy or sell any securities of Indiabulls or any of its subsidiaries or associate companies. This document also doesn’t constitute an offer or recommendation to buy or sell any financial products offered by Indiabulls.
Investor Contact Media Contact
Ramnath Shenoy Rahat Ahmed
[email protected] [email protected]
+91 22 6189 1444 +91 22 6189 1155
2
Safe Harbour Statement

3
Pg. No.
1. Business Update 4
2. Operational Update 7
3. Indian Mortgage Market 10
4. Financial and Operational Highlights 17
5. Sustained Financial Performance 32
6. Key Ratios, Valuations and Shareholding 39
7. Detailed Financials 44
Contents

4
Business Update

2000 Started as an NBFC
Our Journey
5 5
FY 2014-15: Long-term credit rating upgraded to AAA
2004-05
2006
2008
IPO and listing
Multi-product lending
Launched secured mortgage and commercial vehicle businesses
Credit rating of AA-
Loan book crosses Rs.10,000 Cr.
Exit from unsecured personal and business loans
2009
Credit rating upgraded to AA+
PAT crosses Rs.1,000 Cr.
Balance sheet crosses Rs. 30,000 Cr., RoE: 22%
2010 - 11
2011-12
2012-13
2013-14
PAT: Rs.1,569 Cr,
Balance Sheet : Rs.44,417 Cr
RoE : 27%
2014-15
Credit Rating upgraded to AAA
Cumulative disbursements
crosses Rs.1,00,000 Cr.
Balance Sheet : Rs. 57,231 Cr.
PAT : Rs. 1,901 Cr.
RoE : 29%
Conversion to HFC
India’s 3rd largest HFC by size
PAT Rs.1,266 Cr., RoE: 26%
Mortgage finance focused growth plan
Home loans to prime salaried segments
In-house sales team ramp up to over 1,000 employees
Credit rating upgraded to AA
Retail mortgage constitutes 70% of loan book
Balance sheet crosses Rs. 20,000 Cr;, RoE : 17%
FY 2014-15: Cumulative disbursements crossed Rs. 1,00,000 Cr.

Business Update
6
FY 14-15 FY 13-14 Growth (%)
Total Revenues (Rs. Cr.) 7,270.4 5,904.8 23.1%
NII (Rs. Cr.) 3,179.5 2,607.5 21.9%
PAT (Rs. Cr.) 1,901.2 1,568.5 21.2%
EPS (Rs.) 55.0 48.0
RoE 29% 27%
CRAR 18.4% 19.1%
Key Financial Highlights: FY 2014-15
Year-on-Year (Y-o-Y) Comparison – Q4 FY14-15 v/s Q4 FY13-14
Q4 FY 14-15 Q4 FY 13-14 Growth (%)
Total Revenues (Rs. Cr.) 2,122.6 1,557.9 36.3%
NII (Rs. Cr.) 912.9 704.8 29.5%
PAT (Rs. Cr.) 551.0 451.5 22.0%
EPS (Rs.) 15.5 13.5
The company had cash, cash equivalents and investments in liquid debt instruments of Rs.9,631 Cr as at 31st March, 2015. The company receives income from its cash, cash equivalents and investments in liquid debt instruments through the quarter, which appears in ‘Other Income’.
Interim dividend of Rs 9/- per share of face value of Rs 2/- has been declared. Company has declared and distributed interim dividend of Rs. 26/- per share in FY 2014-15.

7
Operational Update

Business Summary
• Loans Outstanding : Rs. 52,235 Cr (March 31, 2015) : (US$ 8.43 bn)
• Loan Book CAGR (6 years) : 26% • Cumulative Number of Retail Customers Served : 6.44 Lacs • Cumulative Loans Disbursed till date : Rs. 106,604 Cr (US$ 17.19 bn)
• Cost to Income Ratio (FY 2015) : 16.4%
• Profit After Tax CAGR (6 years) : 18%
8 US $ amounts are converted based on the exchange rate of US $1 = Rs. 62

Credit Ratings
9
Long Term Rating
Short Term Rating
CARE Ratings AAA A1+
Brickwork Ratings AAA
CRISIL (A Standard & Poor’s Company) AA+ A1+
ICRA (An Associate of Moody’s Investor Service) AA+ A1+
India Ratings & Research (A Fitch Group Company)
A1+

10
Indian Mortgage Market

Vast Affordable Housing Opportunity
• Urban Housing requirement: estimated at 45 million units by 20221
- Demand continues to increase due to rapid urbanization, growing trend of nuclear families and rising income
• Affordable Housing: Policy makers’ focus on Home loans up to 50 Lacs (from sub 25 Lacs classified as priority sector lending)
- HFCs are permitted to borrow through ECBs for lending towards affordable housing
- IBHFL has drawn down ECB facilities of $ 200 million in FY 2014-15
• Government policy focus towards affordable housing
- Relaxation of real estate FDI norms and REIT norms
- Rs. 4,000 crores allocated for low-cost housing and Rs. 50,000 crores for urban housing2
- Rs. 8,000 crores allocated to the Rural Housing Fund run by NHB2
• 2 million affordable housing units to be launched in the next 3 years
11 1 – Industry Reports; 2 – RBI Deputy Governor Speech, Aug 2014

09% 17% 20%
26% 29% 41%
81% 88%
India Thailand China Korea Malaysia Hong Kong USA UK
• Lower mortgage penetration compared to advanced and emerging economies implies huge opportunity for growth
• Indian mortgage industry at an inflection point and is expected to grow five-fold in next 10 years
• In this year’s budget, the Government has increased tax exemption limits on home loan repayments, effectively lowering the rate of interest
• Government has underlined support for affordable housing in the budget, which has been followed up by prompt steps by the regulator
12
Headroom for Growth - Low Mortgage Penetration
Indian Mortgage Market
Source: National Housing Bank, 2013

3,695 3,990 4,541 5,448 6,249 7,110 10,958
27% 27% 30%
32% 35%
37% 40%
20%
25%
30%
35%
40%
45%
-
2,000
4,000
6,000
8,000
10,000
12,000
FY 08 FY 09 FY 10 FY 11 FY 12 FY 13 FY 16E
Rs.
Bill
ion
Home Loan Portfolio HFCs' Share
13
Growing HFC Market Share in a Steadily Expanding Home Loans Market
Source: RBI Database, NHB Reports, CRISIL, & ICRA Estimates
(Amounts in Rs. Bn)
Indian Mortgage Market
High demand growth driven by: • Increasing Affordability: Rising disposable incomes coupled with low effective interest rate of
only 3.94 % after tax benefits for a home loan of Rs. 20 Lacs
• Average age of house owner has reduced to 35 years from 43 years in FY20002
• Urbanisation to rise to 40% of population by 2025 from the current 31%1
• Urban Housing Shortage: estimated at 45 million units by 20222
• Favourable Demographics: 60% of the country’s population is below 30 years of age3
1 – NHB Report, 2012; 2 – Industry Reports; 3 – Census 2011

Recent Government Policy Initiatives
• Housing for all by 2022: A major policy goal for the new government
- 60 million new housing units
- Government focus on making organised housing finance available to all
• 100 smart cities plan: Technologically integrated and planned townships
- Large housing opportunity
- Concentrated market and government focus to reduce delivery expenses and improve operating margins
• Jan Dhan Yojana: Access to organised banking for all – present coverage: 99.74%
- Vast increase in organised banking infrastructure and reach
- Ultimate benefit and knock on effect on credit off-take and growth
14

Particular 2015 2010 2000
Loan amt 2,500,000 2,500,000 2,500,000
Nominal Interest Rate(%) 9.90% 9.25% 13.25%
Max deduction for interest allowed* 200,000 150,000 75,000
Deduction for Principal# 150,000 100,000 20,000
Tax Rate applicable 34.61% 30.90% 34.50%
Tenor (Yrs) 15 15 15
Total amount paid per year 394,093 327,878 384,521
Interest component 244,093 227,878 327,893
Principal component 150,000 100,000 56,628
Tax amount saved 121,128 77,250 32,775
Effective interest paid on home loan 122,965 150,628 295,118
Effective interest rate on home loan 5.07% 6.15% 11.94%
Indian Mortgage Market
15
Tax Incentives – Low Effective Interest Rates
Amount in Rs. * Interest Repayment Tax Break: Section 24 of the Income Tax Act # Principal Repayment Tax Break: Section 80C of the Income Tax Act

Buying a Home – Prudent Financial Investment
16
3.1% 3.2% 2.9% 2.5%
4.7%
3.3%
2.4%
3.5% 3.1%
Ahemedabad Bengaluru Chennai Delhi Hyderabad Kolkata Mumbai Pune India
Rent Yield Effective Interest Rate on Home Loan (5.1%)
5.1%
• Difference between rental yield and effective home loan interest rate is only 2%
• For only Rs. 3,500 per month more, a home of Rs. 30 lacs can be purchased instead of renting it – a tremendous incentive to own a home and create real assets
• Tepid property price appreciation combined with wage inflation further pushing affordability
13.3
19.6
30.0
3.5 5.7 10.2
3.8
3.4
2.9
2005 2010 2015
Price of Home* Annual Income Affordability
Rental Yield v/s Home Loan Cost*
Increasing Affordability
Affordability is defined as “Price of Home” divided by the Annual Income” * NHB; Industry reports

17
Financial and Operational Highlights

80%
17%
3%
Balance Sheet Assets
18 * Cash, Cash Equivalents and Investments in Liquid Debt Instruments US $ amounts are converted based on the exchange rate of US $1 = Rs. 62
Total Assets
As at March 31, 2015 Rs. 57,231 Cr. (US$ 9.23 bn)
As at March 31, 2014 Rs. 44,417 Cr. (US$ 7.16 bn)
Loan Book: 80% Cash & Liquid Investments*: 17% Other Assets: 3%

Q4 FY 13-14
Asset Composition
19
• Driven by the growth of the Home loans book, retail mortgage book growth has outpaced the growth of corporate mortgage book growth
• Home loans, which forms the majority of incremental disbursals, are disbursed at an average ticket size of Rs. 24 Lacs; average LTV of 71% (at origination)
Q4 FY 14-15
Mortgage Corporate Mortgage Loans Commercial Vehicle Loans
76%
2%
22%
74%
5%
21%

Loan Book Growth
• Loans sold (outstanding as on 31st Mar, 2015): Rs. 6,195 Cr. – on which spread at 3.4% p.a. is to be earned over the life of the loan
Loans Sold (Rs. Cr.) (in preceding 12 months)
Total Loan Assets (Rs. Cr.)
2,397
4,171
2,546
Mar-13 Mar-14 Mar-15
20
30,782 35,445
46,040
3,643
5,724
6,195
Mar-13 Mar-14 Mar-15 Ownbook Sell down
34,425
41,169
52,235

0.79% 0.83% 0.85%
0.46% 0.47% 0.49%
0.33% 0.36%
0.36%
Mar-13 Mar-14 Mar-15
Gross NPA General & Specific Provisions Net NPA
Asset Quality
21
• NPA’s continue to remain within the target range. With the expected economic recovery, recoveries are expected to accelerate
• Standard Asset Provision and Counter-cyclical Provision pool of Rs. 358.6 Cr is over and above General and Specific Provision pool and is not netted off against Gross NPAs in calculation of Net NPAs
(as % of Total Loan Assets)
As at Mar 31, 2015 (in Rs. Cr.) NPA (90+ dpd): 442.8 Provisions for Contingencies: 615.5 Of which NPAs: 256.9 Other provisioning: 358.6 Regulatory Provisioning: 394.5 Excess Provisioning Over Regulatory Provisioning: 221.0
Provisioning Cover : 139% of GNPA

Home Loan Profile: Focus on Affordable Housing
22
Average Loan Size 24 Lacs
Maximum Loan to Value 80%
Average Loan to Value 71% (at origination)
Average Loan Term 15 years
Primary Security Mortgage of property financed
Repayment Type Monthly amortizing
• RBI defines Affordable housing finance as housing loans to individuals up to Rs. 50 Lacs for houses of value up to Rs. 65 Lacs in the six metros and housing loans up to Rs. 40 Lacs for houses of value up to Rs. 50 Lacs in other towns / cities
• HFCs are permitted to borrow through ECBs for lending towards affordable housing. IBHFL has drawn down facilities of $ 200 million in FY 2014-15

Conservative Loan Against Property Profile
23
Average Loan Size 68 Lacs
Maximum Loan to Value 65%
Average Loan to Value 49% (at origination)
Average Loan Term 7 years
Primary Security Mortgage of property financed
Repayment Type Monthly amortizing

24
Country wide reach
Service Centres
Branches
Master Service
Centres (MSC)
Head office
• Presence of core credit committee
• All decisions for loans above certain predefined limits taken jointly by the committee
• MSC is a regional credit hub and is manned by senior personnel
• Underwriting of high value proposals and proposals that require more detailed credit analysis
• Walk-in branches with credit decisioning for low ticket sizes
• Customer interaction and service delivery
• Customer interaction and service delivery
• Recommendation of proposals but no credit decisioning
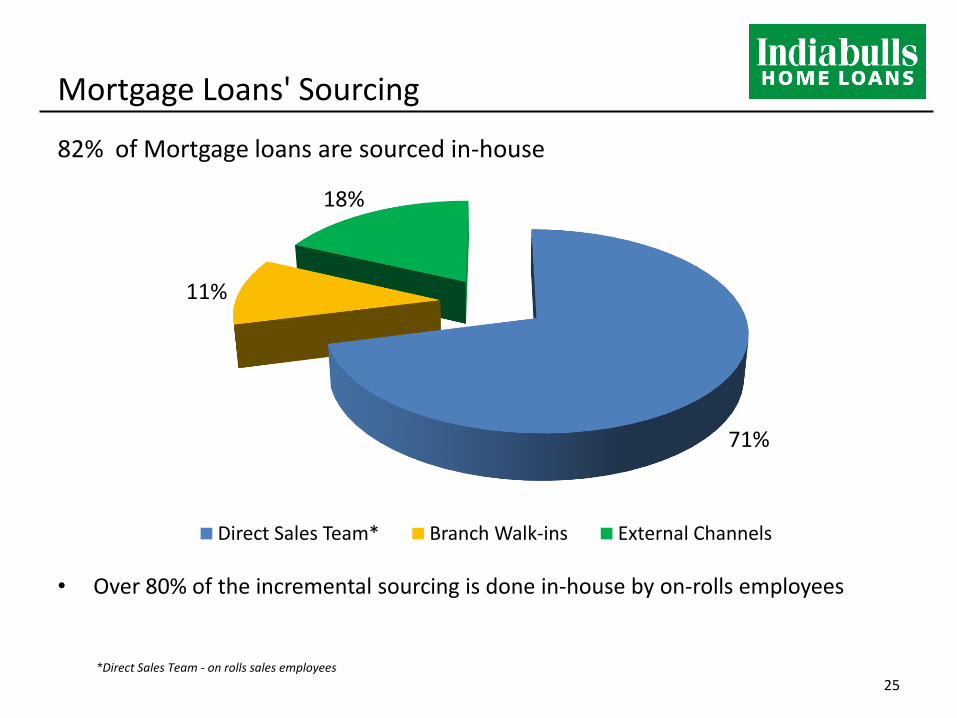
Mortgage Loans' Sourcing
82% of Mortgage loans are sourced in-house
• Over 80% of the incremental sourcing is done in-house by on-rolls employees
25
71%
11%
18%
Direct Sales Team* Branch Walk-ins External Channels
*Direct Sales Team - on rolls sales employees

12%
83%
5%
Liabilities
26
Total Liabilities:
As of March 31, 2015: Rs. 57,231 Cr. (US$ 9.23 bn) As of March 31, 2014: Rs. 44,417 Cr. (US$ 7.16 bn)
Share Holder’s Funds: Rs. 6,634 Cr. (US$ 1.07 bn) Borrowings: Rs. 47,487 Cr. (US$ 7.66 bn) Other Liabilities: Rs. 3,110 Cr. (US$ 0.50 bn)
US $ amounts are converted based on the exchange rate of US $1 = Rs. 62

62% 62% 59%
30% 30% 31%
8% 8% 7%
Mar-13 Mar-14 Mar-15
ECB
Commercial Paper
Bonds
Bank Loans
Diversified Borrowing Programme
27
Total Borrowings:
As of March 31, 2015: Rs. 47,487 Cr. (US$ 7.66 bn) As of March 31, 2014: Rs. 35,540 Cr. (US$ 5.73 bn)
US $ amounts are converted based on the exchange rate of US $1 = Rs. 62
3%

31,286 35,540
47,487
4.7 5.2
5.9
1.5
2.5
3.5
4.5
5.5
6.5
7.5
-
5,000
10,000
15,000
20,000
25,000
30,000
35,000
40,000
45,000
Mar-13 Mar-14 Mar-15
Borrowings
Net Gearing
Diversified Borrowing Programme
• Bond issuances have been healthy, and along with ECBs contributed 45% of the incremental borrowings in the last 12 months
• Amongst its lenders, the company now counts 132 strong relationships: 26 PSU banks, 17 Private and Foreign banks and 89 Mutual Funds, Provident Funds, Pension Funds, Insurance Companies and others
28
Total Borrowings (Rs. Cr.) Contribution in
Incremental Borrowing
Mar-15 Mar-14 Last 12 months
Bank Loans 28,400 22,170 52%
Bonds 14,628 10,525 34% ECB 1,252 - 11% CP 3,207 2,844 3%
Total 47,487 35,540 100%
Borrowings (Rs. Cr.)
Net Gearing: Borrowings Net of ‘Cash & Cash Equivalents’ and ‘Investments in Liquid Debt Instruments’

29
Business Value Proposition
Growing Economy/ Low mortgage penetration, increasing market share
Focus on affordable housing. Nationwide Network with expanding footprint
Focus on profitability in each business segment
Healthy capitalization and balance sheet size
Leading player in Self employed mortgage lending – extensive expertise and underwriting experience
Robust risk management, low NPA levels
Young staff: better connect with increasingly younger home buyer
High operating efficiencies , low cost-to-income levels
Technology leveraged scalable capacity. Thrust on digital presence – exploiting digital opportunity
Scalable and Sustainable Value Creation

Eminent and Experienced Board of Directors
30
• Mr. Sameer Gehlaut : Chairman of the Board
• Mr. Gagan Banga : Vice Chairman and MD
• Dr. K.C. Chakrabarty : Former Deputy Governor of the Reserve Bank of India
• Justice Surinder Singh Nijjar : Retired Justice, Supreme Court of India
• Justice Bisheshwar Prasad Singh : Retired Justice, Supreme Court of India
• Mrs. Manjari Kacker : Former member of CBDT (Central Board of Direct Taxes)
• Brig. Labh Singh Sitara : Honoured with the Dhyan Chand Award by the President of India
• Mr. Samsher Singh Ahlawat : 20 years of banking experience in senior management positions
• Mr. Prem Prakash Mirdha : Business background with expertise in SME sector
• Mr. Ashwini Kumar Hooda : Deputy Managing Director
• Mr. Ajit Kumar Mittal : Ex-Reserve Bank of India
Board of Directors with pre-eminence and experience in diverse fields

Indiabulls Foundation: Corporate Social Responsibility
31
Indiabulls Foundation E-learning
(IBFE)
The Foundation has tied up with MKCL(Maharashtra Knowledge Corporation Ltd.) authorized computer centers in Amravati, Nasik and Raigad districts and has helped several rural youths gain basic IT literacy and obtain employment
Health
The Foundation has a free medical clinic at Lower Parel to provide primary and preventive health care to the underprivileged and the clinic has successfully treated 19,000 patients till date.
The Foundation has 6 medically equipped vans. Each caters to approximately 15 to 16 locations per week and diagnoses 80 to 100 patients per day.
Rural Empowerment
The Foundation has sponsored a water project called ‘Rahat’ at Dadade Tribal Ashram School, Thane district, where there was acute scarcity of water. Over 1,100 children of this tribal school have benefited from this initiative.
Disaster Relief The Foundation provided timely relief to 10,000 flood affected people in Kashmir
by providing them with nutrition supplements and medicines.
Education The Foundation has offered scholarships to over 100 deserving students to
continue their education after the 12th standard .

32
Sustained Financial Performance

Sustained Financial Performance Q
1 F
Y 1
1
Q2
FY
11
Q3
FY1
1
Q4
FY
11
Q1
FY
12
Q2
FY
12
Q3
FY
12
Q4
FY
12
Q1
FY
13
Q2
FY
13
Q3
FY
13
Q4
FY
13
Q1
FY
14
Q2
FY
14
Q3
FY
14
Q4
FY
14
Q1
FY
15
Q2
FY
15
Q3
FY1
5
Q4
FY1
5
Loan Book (Rs. Cr.)
33

Sustained Financial Performance
468 577
681 767
835 911 964
1,118 1,050
1,179 1,215 1,334 1,344
1,474 1,575 1,569 1,592
1,696
1,859
2,123
Q1
FY
11
Q2
FY
11
Q3
FY1
1
Q4
FY
11
Q1
FY
12
Q2
FY
12
Q3
FY
12
Q4
FY
12
Q1
FY
13
Q2
FY
13
Q3
FY
13
Q4
FY
13
Q1
FY
14
Q2
FY
14
Q3
FY
14
Q4
FY
14
Q1
FY
15
Q2
FY
15
Q3
FY1
5
Q4
FY1
5
Total Revenues (Rs. Cr.)
34

Sustained Financial Performance
313
374
432 437 417 439 442
544
459 502
540
628 599
645 659 705 701
737
828
913
Q1
FY
11
Q2
FY
11
Q3
FY1
1
Q4
FY
11
Q1
FY
12
Q2
FY
12
Q3
FY
12
Q4
FY
12
Q1
FY
13
Q2
FY
13
Q3
FY
13
Q4
FY
13
Q1
FY
14
Q2
FY
14
Q3
FY
14
Q4
FY
14
Q1
FY
15
Q2
FY
15
Q3
FY1
5
Q4
FY1
5
Net Interest Income (Rs. Cr.)
35

Sustained Financial Performance
134
174
207 236
222 231 250
303
268
304 327
368 352
370 395
452 424
448 478
551
Q1
FY
11
Q2
FY
11
Q3
FY1
1
Q4
FY
11
Q1
FY
12
Q2
FY
12
Q3
FY
12
Q4
FY
12
Q1
FY
13
Q2
FY
13
Q3
FY
13
Q4
FY
13
Q1
FY
14
Q2
FY
14
Q3
FY
14
Q4
FY
14
Q1
FY
15
Q2
FY
15
Q3
FY1
5
Q4
FY1
5
Profit After Tax (Rs. Cr.)
36

Sustained Financial Performance 1
.74
1.3
8
1.2
0
1.0
3
1.0
0
0.8
6
0.7
8
0.7
9
0.7
9
0.7
6
0.7
6
0.7
9
0.7
8
0.8
5
0.8
8
0.8
3
0.8
4
0.8
5
0.8
6
0.8
5
0.9
0
0.6
3
0.5
3
0.3
7
0.3
7
0.3
2
0.2
8
0.3
3
0.3
3
0.3
1
0.3
3
0.3
3
0.3
4
0.4
4
0.4
8
0.3
6
0.3
5
0.3
4
0.3
4
0.3
6
Q1
FY
11
Q2
FY
11
Q3
FY1
1
Q4
FY
11
Q1
FY
12
Q2
FY
12
Q3
FY
12
Q4
FY
12
Q1
FY
13
Q2
FY
13
Q3
FY
13
Q4
FY
13
Q1
FY
14
Q2
FY
14
Q3
FY
14
Q4
FY
14
Q1
FY
15
Q2
FY
15
Q3
FY1
5
Q4
FY1
5
Asset Quality (%)
Gross NPA (%) Net NPA (%) 37

Sustained Financial Performance
1.8
2.4 2.7
3.1 3.2
3.7 3.7 3.9
4.1 4.3
4.5 4.7
5.1 5.1 5.3 5.2
5.6 5.7
6.1 5.9
Q1
FY
11
Q2
FY
11
Q3
FY1
1
Q4
FY
11
Q1
FY
12
Q2
FY
12
Q3
FY
12
Q4
FY
12
Q1
FY
13
Q2
FY
13
Q3
FY
13
Q4
FY
13
Q1
FY
14
Q2
FY
14
Q3
FY
14
Q4
FY
14
Q1
FY
15
Q2
FY
15
Q3
FY1
5
Q4
FY1
5
Net Gearing
38

39
Key Ratios, Valuations and Shareholding

Rising Productivity Ratios
40
FY 2015 FY 2014 FY 2013 FY 2012
No. Of Employees 4,840 4,099 4,072 4,243
Profit Per employee (Rs. Cr.) 0.39 0.38 0.31 0.24
Asset Per employee (Rs. Cr.) 11.82 10.84 8.09 5.85
Cost Income Ratio 16.4% 17.1% 18.0% 18.7%

Rising Productivity Ratios
41
FY 2015 FY 2014 FY 2013 FY 2012
Pre Tax RoAA (%) 4.9% 4.8% 4.9% 4.9%
Post Tax RoAA (%) 3.7% 3.8% 3.8% 3.7%
RoE (%) 29% 27% 26% 22%
Capital Adequacy (%) 18.36% 19.14% 18.47% 18.86%
- Tier I 15.25% 15.05% 14.96% 18.21%
- Tier II 3.11% 4.09% 3.51% 0.65%

Valuations and Returns
Mar-15 Mar-14 Mar-13 Mar-12
Market Price per share (Rs.) 559.9* 285.6 271.8 207.1
Market Capitalisation (US$ Bn) 3.21 1.59 1.42 1.08
PE Ratio (times) 10.2 6.0 6.8 6.5
Book Value per share (Rs.) 184.5 168.7 165.4 157.7
Price to Book Ratio (times) 3.0 1.7 1.6 1.3
Foreign Shareholding (%) 51.8% 41.1% 45.2% 38.7%
42 US $ amounts are converted based on the exchange rate of US $1 = Rs. 62
* Share price as on 23rd April, 2015

Shareholding Pattern
43 MF: Mutual Funds IFI: Indian Financial Institutions
27.81%
51.78%
3.30%
17.11%
Promoters Foreign Shareholding MFs/Banks/IFI Public

44
Detailed Financials

Consolidated Balance Sheet
45
Rs. 9,631 Cr. of
Cash & Cash
Equivalents and
Investments in
Liquid Debt
Instruments

Consolidated Income Statement
46

Thank you