india warehousing market report 2021
TRANSCRIPT

I N D I A W A R E H O U S I N G M A R K E T R E P O R T 2 0 2 1
INDIA WAREHOUSING MARKET
REPORT 2021
knightfrank.co.in/research

I N D I A W A R E H O U S I N G M A R K E T R E P O R T 2 0 2 1
INDIA WAREHOUSING MARKET
REPORT 2021
knightfrank.co.in/research

I N D I A W A R E H O U S I N G M A R K E T R E P O R T 2 0 2 1
F O R E W O R DThe past five quarters have been nothing short of a roller coaster ride. The prolonged COVID-19 pandemic forced us to navigate tight turns and steep slopes of successive infection waves that adversely impacted human life, and the consequent state-imposed lockdowns constricted economic activity to a bare minimum during its peak. As a human race, our collective response to combat the virus exhibits strong hope. Vaccination progress in a populous and diverse country like ours will bring stability, however, the prognosis of an impending third wave implies that we need to remain ever vigilant and not let our guards down as we resurrect human lives and business.
During this prolonged pandemic period, most commercial real estate asset classes have suffered strong headwinds. In comparison, the Indian warehousing sector was adversely impacted to a lesser magnitude on key business parameters. In fact, the sector shows great promise with recognition of its pivotal role as a critical link between the manufacturer and the end consumer. Efficient logistics and distribution will be a key determinant of a business' success in today's ultra-competitive environment.
In this report, we assess the warehousing market dynamics of key primary and secondary cities in India on parameters of demand, supply, occupancy and price. We also take note of pandemic- influenced transient as well as long-term impact areas that are worthy of attention for business participants. For instance, on the demand side, while we capture a stronger e-commerce occupier trend and rising prominence of secondary cities, the supply side has seen a strong trend of institutional participation and large, high quality warehouse spaces with enhanced automation within the warehouse facility.
The warehousing space per capita in India remains low compared to developed economies. With the critical business objectives that a supply chain serves, we believe that industrial and warehousing spaces have a long runway for growth in this country. This premise also builds a pathway to progress on the maturity curve for the sector and promotes increased institutional participation. We gathered great learnings while making this report and I am especially thankful to our industry stalwarts for contributing to this endeavor. I hope the report adds value to you and opens new business vistas for this promising sector. I look forward to your feedback and wish you and your loved ones a safe and healthy life.
Shishir BaijalChairman and Managing Director
I N D I A W A R E H O U S I N G M A R K E T R E P O R T 2 0 2 1
C O N T E N T S
Page no. 04
0 1 0 2 0 3
0 4 0 5 0 6
Ahmedabad
Ambala-Rajpura
Bengaluru
Bhubaneswar
Chennai
Coimbatore
Guwahati
Hyderabad
Kolkata
Lucknow
Ludhiana
Mumbai
NCR
Pune
Surat
Vapi
Visakhapatnam
Agra
Indore
Jaipur
Nagpur
Kochi
Patna
Siliguri
Vadodara
Page no. 05 Page no. 10
Page no. 15 Page no. 22 Page no. 91
F O R E W O R D
C O V I D - 1 9 I M P A C T O N W A R E H O U S I N G M A R K E T
I N D I A W A R E H O U S I N G M A R K E T O P P O R T U N I T Y
W A R E H O U S I N G M A R K E T A N A LY S I S
W A R E H O U S I N G M A R K E T S
O T H E RW A R E H O U S I N G M A R K E T S
4

I N D I A W A R E H O U S I N G M A R K E T R E P O R T 2 0 2 1
C O V I D - 1 9 I M P A C T
being a storage depot to a virtual pit-stop that facilitates inventory management, secondary packaging, cross-docking and extraction of products in the least possible time.
With the COVID-19 pandemic threatening to push India off its economic growth trajectory, the real estate sector's resilience has been tested to its limit. While demand in other commercial real estate asset classes like hospitality, retail and office have been severely impacted during the previous year, the warehousing market has been relatively less adversely impacted.
Amidst the upheavals in the overall market dynamics which have seen market players react and adjust in the short term to transient events such as labour shortages and increase in construction cost, we believe that the warehousing sector will see some significant trends taking shape over the medium to long term. Hence, taking cognizance of the underlying dynamics of the segment, Knight Frank identifies the following themes as key catalysts for the sector in times to come.
Logistics and warehousing constitute a critical link in the chain that connects the manufacturer to the eventual consumer. It is the efficiency of the logistics and distribution machinery of a business that dictates the reach time of their goods to the market, and cost efficiencies prove to be a big factor in enabling businesses to stay relevant in today's uber competitive environment. This is especially true in the present-day internet age where businesses are forced to not just continually enhance their service but also cut costs to acquire and retain consumers.
Managing cash flow is one of the biggest challenges a business faces while cutting costs, and inventory is the most significant component that locks up cash. Businesses need to ensure that adequate inventory is maintained to prevent a stock-out during a spike in demand. While accurate demand estimation forms the foundation of this endeavour, it is the efficiency of the logistics chain that determines the cost and time saving that can be achieved. This constant need to reduce the inventory cycle is radically transforming the role of the warehouse from simply
I N D I A W A R E H O U S I N G M A R K E T R E P O R T 2 0 2 1
E-commerce sector growth accelerates due to pandemic restrictions
• The e-commerce sector has been driving demand for logistics and warehousing across global markets and has emerged as the most prominent driver of Indian warehousing market volumes along with the 3PL sector. This sector's share in transactions has grown from 18% in FY 2017 to 31% in FY 2021. However, despite the surge in e-commerce adoption over the past few years, the fact that penetration of e-commerce as a share of the total
1retail stood at just 4.7% in India in 22019 compared to 15.9% in China
3and 19.2% in the United Kingdom , depicts the long runway for the growth that this occupier segment has in the country.
1 2 3(Source: EY, business.com, Knight Frank, ONS)
• The pandemic has accelerated the trend of online purchases which had already taken root well before. Even as the pandemic caused the overall transaction volumes to fall in FY 2021, the share of e-commerce grew substantially from 23% in FY 2020 to the current level and eclipsed that of the 3PL sector for the first time. It is to be noted that part of the total 3PL demand is also constituted of the e-commerce segment.
Increase in inventory levels to address stock-outs
• The primary objective of an efficient supply chain is to minimize inventory levels so that capital is not locked in storage or transit and capital productivity is optimized. This approach relies on the seamless operation of the entire supply chain
right from the manufacturer to the end-consumer. Any disruption in a lean supply chain, like the one caused by the pandemic, not only impacts delivery to the consumer but severely impacts the business as well.
• To address this contingency, occupiers have been consciously moving toward increasing inventory levels since the national lockdown was relaxed in June 2020. This practice gained more traction in 2021 especially with the onset of the second wave of the pandemic. The increased need for stocking has led to an increase in storage requirements with occupiers taking up more rack-space in existing facilities. Stocking requirements have gone up 3-4x in preparation for the prolonged pandemic. While the increased stocking requirements will eventually taper off as the pandemic subsides, we believe that they will not revert to the levels prevalent before the pandemic as the threat of similar disruptions in future will need to be factored in to the supply chain.
Consolidation takes a backseat as players re-strategize supply chain
• When the GST law came into being in 2017, companies had started rationalizing their warehousing needs based purely on logistical merit and focused on consolidating their warehousing footprint to improve efficiency and throughput. While consolidation has undeniable benefits, it also increases the dependence of the supply chain on a lesser number of warehouses than existed before. The pandemic exposed this limitation as the logistics operations of several companies were compromised with
LONG-TERM IMPACT AREAS
some of their warehousing locations and cargo transit corridors either being placed under lockdown or facing labour shortage. A more dispersed warehousing network could have enabled them to process orders despite closure of their primary warehouses.
• The trend of consolidating warehouses will sustain in the long term due to the several benefits of scale that can be derived but it is unlikely that companies will want to risk it in the current pandemic scenario. Similarly, it is also unlikely that companies will consolidate warehouses to the same extent that they had planned before the pandemic as they will need to factor similar risks in their consolidation plans going forward.
Benefit to India from decentralization of global manufacturing
• China accounted for 28.7% of global manufacturing output according to the United Nations Statistics Division. Global supply chains were heavily impacted when international travel as well as movement of goods to and from China were severely curtailed by other countries to prevent the spread of the pandemic. This prompted global corporations to scout for other manufacturing destinations so that their businesses are not overly dependent on any single manufacturing destination.
• The Indian government launched a Production Linked Incentive (PLI) scheme to attract large investments in the mobile phone and specified electronic component manufacturing units. In November 2020, the PLI scheme was extended to ten more sectors, including food processing, battery storage,
O N W A R E H O U S I N G M A R K E T
5 6

I N D I A W A R E H O U S I N G M A R K E T R E P O R T 2 0 2 1
automobile components and specialty steel. Several global firms such as Samsung, Foxconn, Hon Hai, Rising Star, Wistron and Pegatron have availed the benefits of these schemes. Notwithstanding the competition from countries like Vietnam, Thailand, Indonesia and Philippines, industrial demand should get a boost as global corporations set up manufacturing operations in India. Industrial demand comprised 15% of the total space transacted in India's top eight cities during FY 2021, a marginal increase from 14% in the preceding year.
Cold chain warehousing gains ground
• Growth in organized food delivery and e-commerce is the key driver for the cold chain sector in India. Food retailing has come of age and the growing penetration of organized food retail in the country has dictated the development of efficient cold chain supply management.
• The pharmaceutical sector is also a big demand driver for temperature-controlled storage and distribution. COVID-19 vaccines and API drug formulations in particular will require significant additions in India's cold chain warehousing capacity.
• Cold storage market remains an unorganized and fragmented play in the country. The need for a variety of temperature-controlled solutions extends from perishable categories like fruits, vegetables, dairy, fish and meat to pharmaceuticals and others. With increasing category focus, cold storage segment will receive greater attention from government and stakeholders alike.
In-city warehousing to ride on accelerated e-commerce demand
• The constant need to reduce delivery timelines had always made the entry
of in-city warehousing in the Indian market just a matter of time. With the pandemic vaulting the e-commerce sector on a higher growth trajectory and the entry of players such as the Tata Group and Reliance Group in this highly competitive space, multi-storey warehouses could become mainstream phenomena much earlier than expected.
• Besides facilitating optimum land utilization in congested cities such as Mumbai, multi-storey warehousing will effectively reduce delivery timelines and transportation costs. Such solutions are already in place in other Asian markets such as Singapore, Hong Kong and Tokyo. 3PL players have been scouting for in-city development opportunities across Mumbai, Delhi and Bengaluru. The high real estate costs in these cities make it a challenging venture and turnkey opportunities such as defunct mills, factory units or shuttered malls are being considered.
Institutionalization of warehousing segment to accelerate
• Uninterrupted warehouse park operations have proved to be a key determinant of the strength of an organization's supply chain during the extreme disruptions faced due to the lockdown. Institutional spaces that are backed by warehousing expertise that most other players are hard pressed to match were better geared to tackle the exigencies posed by the pandemic and ensure business continuity.
• Adherence to compliance and modernization of warehousing properties and services are strong trends that are only strengthening with time as more and more occupiers covet the boost in efficiencies that these practices invariably result in. Warehouse lease
tenures are getting longer ranging from 6-9 years and even more in some cases, making it an attractive commercial real estate play in the Indian market. Warehouse development demands significant investment and expertise that institutions are well suited to deliver. We expect that in the current uncertain environment and shrinking margins, institutional abilities will be valued even more and lead to participation of bigger developers and investors in the country's warehousing segment, especially as they have better access to lower-cost capital.
Need for warehousing automation increases
• A host of factors in the evolving warehousing ecosystem will push occupiers to adopt automation for processes such as storage, retrieval and relocation of goods. Operators have been slow to adopt automation in their warehouses due to the high costs involved, but the disruption in warehouse operations caused by increased throughput requirement of sectors like e-commerce will increase technology adoption going forward.
• The adoption of automation and other technologies such as warehouse management systems is still very low in the Indian market compared to developed markets. E-commerce, as a key occupier segment, has been at the forefront of technology adoption in supply chain operations due to its much higher service delivery requirements. However, we expect other segments too will move in this direction leading to increased capital expenditure on this front from occupiers. Occupiers will consider implementation of technology at the design stage instead of retrofitting as was seen in earlier times. Occupiers looking to
SHARE OF SECONDARY MARKETS
Note: The secondary market basket comprises 13 markets: Lucknow, Bhubaneswar, Coimbatore, Ambala-Rajpura Belt, Guwahati, Indore, Jaipur, Ludhiana, Patna, Siliguri, Vadodara, Surat and Vapi.
FY 2020
FY 2021
Warehousing boxes get bigger with increased cargo complexity and throughput requirements
• The need to manage a large number of SKUs and handle faster movement of cargo has been created and accelerated by the sophisticated e-commerce and 3PL occupier groups. Further, with enhanced standards of compliance as well as increased capex within the warehouse facility towards automation, occupiers are preferring larger boxes. In several instances now, the scale of a single warehouse box has been seen to increase from under 100,000 sq ft to over 500,000 sq ft over the last few years.
Cost of construction sees a sharp rise
The sharp drop in consumer and industrial demand caused by the lockdowns in early FY 2021 caused raw material prices to plummet, and the subsequent recovery in global and domestic demand in the later part of the year caused prices of raw materials such as steel and cement to spike. Steel prices have spiked between 36% to 39% YoY across Mumbai, Delhi, Kolkata and Chennai according to the Center for Monitoring Indian Economy (CMIE) in FY 2021. Moreover, labour costs have also risen substantially during the pandemic. Warehousing being a low margin business, will find it more challenging to cope with the rise in construction cost, especially in a scenario where rents have remained subdued.
Management of labour availability during the second wave gets better
• The first lockdown in 2020 had sparked an exodus of labour from cities to their home-towns as they lost their livelihoods and could no longer afford to stay in the cities in an uncertain environment. Their return to the city as the lockdowns eased and normalcy returned was also much delayed causing development activity to be further impeded.
• As the second wave of infections hit the economy, developers were better prepared and pre-empted another labour exodus by providing them shelter, subsistence wages and other material assurances. Moreover, the lockdown during the second wave was less stringent and construction activity was permitted. Nevertheless, some exodus of labour did take place even during the second wave.
SHORT-TERM IMPACT AREAS
15%
23%
avoid such capex will increasingly prefer the services of 3PL (Third Party Logistics) operators.
Secondary warehousing markets receive further boost in growth
• The share of secondary markets in the total transactions recorded in the country has grown consistently from just 12% in FY 2019 to 23% in FY 2021. The disruption of supply chains in the previous year has only accelerated this trend with consumers being forced to turn to the online marketplace. Secondary markets accounted for 0.9 mn sq m (9.7 mn sq ft) of warehousing transactions during the year
• The fact that transaction volumes in these secondary markets have grown 31% YoY in FY 2021 (albeit on a lower base), while the eight prime markets saw demand fall 23% YoY, underscores the increasing traction of these emerging warehousing markets.
FY 2019
12%
I N D I A W A R E H O U S I N G M A R K E T R E P O R T 2 0 2 17 8

I N D I A W A R E H O U S I N G M A R K E T R E P O R T 2 0 2 1
I N D I A W A R E H O U S I N GM A R K E T O P P O R T U N I T Y
in turn are very highly correlated with the country's GDP growth. We established this relationship by comparing the progression of the sales of our seven major occupier groups and the GDP over the FY 2014 - 2020 period. For this exercise, we used the net sales of 3,754 listed and unlisted companies. India's GDP growth forecasts were used to estimate sales and transaction activity of these major occupier groups in the top eight Indian cities for the FY 2022 - 2026 period.
The availability and subsequent rollout of vaccines will play a key role in market recovery and determine the speed of recovery. A speedy vaccination drive will help improve demand but current supply side constraints such as the increase in construction costs and tight labour conditions are expected to weigh the market down in FY 2022. The market will likely see a more meaningful recovery from FY 2023 onward with the bulk of vaccinations in the country having been completed.
The story of modern Indian warehousing is a little over a decade old when logistics companies such as Future Value chain built the first Grade A warehouses in the country. The entry of institutions, lured by the vast opportunity presented by a growing economy with a consumption base of over 1.3 bn people, made the Indian warehousing market a compelling investment proposition. The introduction of the Goods and Services Tax and the prolific growth seen in the e-commerce and 3PL sectors caused warehousing demand to grow at a CAGR of 44% in the FY 2017 - 2020 period. While the pandemic in FY 2021 has caused demand to drop during the year, the longer-term demand potential for warehousing properties continues to remain strong. However, there is a need to quantify this demand and with this in mind, we have endeavored to estimate the size of the opportunity in the warehousing market over the FY 2022 – 2026 period.
Demand for warehousing properties is an outcome of the business performance of its constituent occupier groups, which
INDIA MARKET SIZING AND PROJECTION FOR 5 YEARS
As India fights the virulent second wave of the pandemic, the warehousing sector is performing a critical role in keeping the logistics sector up and running at this time of crisis. In a vast country like India, which is also one of the world's major consumption markets, it is imperative for the warehousing sector to be active and make sure that supply chains are not disrupted, hence, all IndoSpace parks are operational during the pandemic in the service of the nation.
Due to the advent of the second wave, the growth of the sector is expected to slow down in the short term. However, we remain bullish on the Indian economy due to its enormous consumption potential which also demands the increasing requirement for storage and warehousing facilities in the long term.
As per the recent trends, warehousing companies are opting for a hub-and-spoke model. A big regional center near a key market acts as a hub warehouse for smaller warehouses. This model will see strong growth in the medium to long term.
Due to a greater internet penetration across India, e-commerce companies are also betting big on growth in Tier II and III locations, which are becoming the preferred warehousing hubs and investment destinations. The demand for Grade A compliant, multi-storey warehouses will see a spike soon in these markets. Same-day delivery guarantees by e-commerce companies, easy return policies, shorter supply chains and the rising popularity of daily online orders are some of the factors contributing to this trend.
The warehousing industry has also started integrating sustainability into its standard operating procedures. Companies are adopting designs and practices that reduce their carbon footprints and operating costs and sharing the benefits with customers where possible.
In the recent budget, the government announced production-based incentives of $27 billion over the next five years to scale up domestic manufacturing. This too will create economies of scale and provide a conducive manufacturing ecosystem which in turn, will benefit the warehousing sector in the longer run.
Additionally, we see one of the world's largest vaccination drives as one of the biggest growth drivers for the warehousing industry in India as it will have an ensuing demand for temperature -controlled warehousing facilities for the pharmaceuticals sector.
Once the second wave starts to recede and the speed of the inoculation programs increases, we expect normalcy to be restored by the second quarter of FY 2022. For now, we have to monitor the situation closely and take actions judiciously.
I N D I A W A R E H O U S I N G M A R K E T R E P O R T 2 0 2 1
Rajesh JaggiVice Chairman – Real Estate, Everstone Group
9 1 0
I N D I A W A R E H O U S I N G M A R K E T R E P O R T 2 0 2 1
I N D I A W A R E H O U S I N GM A R K E T O P P O R T U N I T Y
in turn are very highly correlated with the country's GDP growth. We established this relationship by comparing the progression of the sales of our seven major occupier groups and the GDP over the FY 2014 - 2020 period. For this exercise, we used the net sales of 3,754 listed and unlisted companies. India's GDP growth forecasts were used to estimate sales and transaction activity of these major occupier groups in the top eight Indian cities for the FY 2022 - 2026 period.
The availability and subsequent rollout of vaccines will play a key role in market recovery and determine the speed of recovery. A speedy vaccination drive will help improve demand but current supply side constraints such as the increase in construction costs and tight labour conditions are expected to weigh the market down in FY 2022. The market will likely see a more meaningful recovery from FY 2023 onward with the bulk of vaccinations in the country having been completed.
The story of modern Indian warehousing is a little over a decade old when logistics companies such as Future Value chain built the first Grade A warehouses in the country. The entry of institutions, lured by the vast opportunity presented by a growing economy with a consumption base of over 1.3 bn people, made the Indian warehousing market a compelling investment proposition. The introduction of the Goods and Services Tax and the prolific growth seen in the e-commerce and 3PL sectors caused warehousing demand to grow at a CAGR of 44% in the FY 2017 - 2020 period. While the pandemic in FY 2021 has caused demand to drop during the year, the longer-term demand potential for warehousing properties continues to remain strong. However, there is a need to quantify this demand and with this in mind, we have endeavored to estimate the size of the opportunity in the warehousing market over the FY 2022 – 2026 period.
Demand for warehousing properties is an outcome of the business performance of its constituent occupier groups, which
INDIA MARKET SIZING AND PROJECTION FOR 5 YEARS
As India fights the virulent second wave of the pandemic, the warehousing sector is performing a critical role in keeping the logistics sector up and running at this time of crisis. In a vast country like India, which is also one of the world's major consumption markets, it is imperative for the warehousing sector to be active and make sure that supply chains are not disrupted, hence, all IndoSpace parks are operational during the pandemic in the service of the nation.
Due to the advent of the second wave, the growth of the sector is expected to slow down in the short term. However, we remain bullish on the Indian economy due to its enormous consumption potential which also demands the increasing requirement for storage and warehousing facilities in the long term.
As per the recent trends, warehousing companies are opting for a hub-and-spoke model. A big regional center near a key market acts as a hub warehouse for smaller warehouses. This model will see strong growth in the medium to long term.
Due to a greater internet penetration across India, e-commerce companies are also betting big on growth in Tier II and III locations, which are becoming the preferred warehousing hubs and investment destinations. The demand for Grade A compliant, multi-storey warehouses will see a spike soon in these markets. Same-day delivery guarantees by e-commerce companies, easy return policies, shorter supply chains and the rising popularity of daily online orders are some of the factors contributing to this trend.
The warehousing industry has also started integrating sustainability into its standard operating procedures. Companies are adopting designs and practices that reduce their carbon footprints and operating costs and sharing the benefits with customers where possible.
In the recent budget, the government announced production-based incentives of $27 billion over the next five years to scale up domestic manufacturing. This too will create economies of scale and provide a conducive manufacturing ecosystem which in turn, will benefit the warehousing sector in the longer run.
Additionally, we see one of the world's largest vaccination drives as one of the biggest growth drivers for the warehousing industry in India as it will have an ensuing demand for temperature -controlled warehousing facilities for the pharmaceuticals sector.
Once the second wave starts to recede and the speed of the inoculation programs increases, we expect normalcy to be restored by the second quarter of FY 2022. For now, we have to monitor the situation closely and take actions judiciously.
I N D I A W A R E H O U S I N G M A R K E T R E P O R T 2 0 2 1
Rajesh JaggiVice Chairman – Real Estate, Everstone Group
9 1 0

I N D I A W A R E H O U S I N G M A R K E T R E P O R T 2 0 2 1
ESTIMATED GROWTH STATISTICS BY SECTOR
Sector Transactions Transactions Change FY 2017 - 2021 FY 2022 - 2026 mn sq m (mn sq ft) mn sq m (mn sq ft)
Source: Knight Frank Research
Notes:
• Warehousing demand data includes light manufacturing/ assembling.
• Other Sectors include all manufacturing sectors (automobile, electronics, pharmaceutical, etc.) excluding FMCG and FMCD.
• Miscellaneous category includes services such as telecom, real estate, document management, agricultural warehousing and publishing.
E-commerce 3.4 (37) 9.1 (98) 165%
3PL 4.9 (53) 7.7 (83) 56%
Other Sectors 3.4 (37) 4.9 (53) 43%
FMCD 0.7 (8) 0.9 (9) 20%
FMCG 0.8 (8) 0.9 (10) 15%
Retail 1.4 (15) 1.5 (16) 7%
Miscellaneous 0.4 (4) 0.4 (4) 1%
Total 15.1 (162) 25.4 (273) 68%
I N D I A W A R E H O U S I N G M A R K E T R E P O R T 2 0 2 1
As per our projection, annual transactions will grow at a CAGR of 19% to 7.08 mn sq m (76.2 mn sq ft) in FY 2026 from 2.95 mn sq m (31.7 mn sq ft) in FY 2021. The e-commerce sector will drive bulk of the volume, as the accelerated growth trajectory that the pandemic pushed the sector toward is expected to sustain. Most consumers that were forced to shop online will continue to do so and the existing brick-and-mortar stores will also look to leverage online channels to push sales. The 3PL sector will sustain market share as e-commerce and other sectors increasingly outsource their warehousing requirements to specialists in the field.
TOTAL WAREHOUSING TRANSACTIONS ACROSS THE 8 PRIMARY MARKETS
4 year CAGR: 23%
1.29
2.95
7.08
5 year CAGR: 19%
Source: Knight Frank Research
Notes:
• 8 primary markets include NCR, Mumbai, Pune, Bengaluru, Chennai, Hyderabad, Kolkata, Ahmedabad.
• FY 2026P denotes the projected transaction volumes in FY 2026.
FY 2017 FY 2021 FY 2026P
Industrial demand accounted for 15% of the space transacted during FY 2021, the bulk of which is taken up by Other Sectors such as automobile, pharmaceutical, cement and steel. The Indian government's focus on manufacturing with the Make in India initiative and Production Linked Incentive (PLI) scheme among others, and with India being among the possible beneficiaries of global companies looking to disperse manufacturing capacity from China across Asia, should enable warehousing demand from Other Sectors to grow at a CAGR of 16% in the next five years compared to 15% in the preceding period.
EXISTING AND PROJECTED SECTOR SPLIT OF WAREHOUSE DEMAND
Source: Knight Frank Research
Notes:
• Warehousing demand data includes light manufacturing/assembling.
• Other Sectors include all manufacturing sectors (automobile, electronics, pharmaceutical, etc) excluding FMCG and FMCD.
• Miscellaneous category includes services such as telecom, real estate, document management, agricultural warehousing and publishing.
E-commerce Other Sectors3PLFMCDFMCGRetailMiscellaneous
FY 2021 FY 2026P
31%
31%
23%
5%5%4% 1%
30%
37%
20%
6%
3%3%
1%
It is estimated that the e-commerce sector will consume the most space in the next five year block of FY 2022 - 2026 at 9.1 mn sq m (98 mn sq ft), 165% more than the preceding period of FY 2017 - 2021. Similarly, 3PL and Other Sector companies are expected to take up 56% and 43% more space in the next five years compared to the preceding period. These three occupier groups are expected to account for 86% of the total transacted space in the next five years compared to 78% of the transacted space earlier.
1 1 1 2

I N D I A W A R E H O U S I N G M A R K E T R E P O R T 2 0 2 1
MARKET POTENTIAL: COMPARING INDIAN WAREHOUSING MARKET WITH OTHER COUNTRIES
Indian warehousing is still at a very nascent stage and has a long way to go before tapping into its full potential. One of the ways to gauge the scale of the opportunity the Indian warehousing market represents would be to compare the area of industrial and warehousing stock present in developed markets, where the warehousing market is more mature. The growth of a warehousing market is highly correlated with the population and per capita income of a country and is depicted in the adjacent table as well.
India has a per capita warehousing stock of just 0.02 sq m compared to the USA, China and the United Kingdom that have 4.4 sq m, 0.8 sq m and 1.09 sq m respectively. Even in terms of transaction volumes, USA's industrial and warehousing market saw 20.4 mn sq m (220 mn sq ft) transacted during 2020, 7 times that of India in FY 2021.
The e-commerce sector has been the biggest driver of warehousing across developed markets globally. The share of online sales in the UK had in fact spiked from 19.2% in 2019 to a steep 33.4% in May 2020 showing the dominance and scalability of the online marketplace even in a mature market. With only 4.7% penetration in India (2019 est), we believe that the Indian e-commerce market is on the cusp of its next phase of growth with Indian business giants such as the Reliance and Tata groups entering the fray along with global behemoths Amazon and Walmart to capture this massive market. A growing economy like India with the second largest population in the world still holds massive potential for its warehousing market which will fructify over the next few years.
COMPARISON OF WAREHOUSING MARKETS
United States of America (USA)GDP Constant Prices (USD tn) : 18.3Population (mn) : 328GDP Per Capita (USD) : 55,753Warehousing Stock (mn sq m) : 1,446Warehousing Stock Per Capita (sq m) : 4.4
Source: World Bank, China Logistics Research Association, Knight Frank ResearchNotes: Warehousing stock per capita = Warehousing stock/ total populationIndia represents the top eight cities. It includes commercial warehouses but excludes agri-warehouses.
United KingdomGDP Constant Prices (USD tn) : 2.9Population (mn) : 6.7GDP Per Capita (USD) : 43,710Warehousing Stock (mn sq m) : 73Warehousing Stock Per Capita (sq m) : 1.09
ChinaGDP Constant Prices (USD tn) : 11.5Population (mn) : 1,397GDP Per Capita (USD) : 8,242Warehousing Stock (mn sq m) : 1,060Warehousing Stock Per Capita (sq m) : 0.8
IndiaGDP Constant Prices (USD tn) : 2.9Population (mn) : 1,366GDP Per Capita (USD) : 2,152Warehousing Stock (mn sq m) : 30.9Warehousing Stock Per Capita (sq m) : 0.02
The warehousing sector witnessed substantial leasing growth in the past year due to robust demand from leading e-commerce players, followed by FMCG and cold storage companies. However, challenges such as limited availability of debt, increased material cost, lack of availability of labour, inconsistent supply of construction materials slowed down construction progress. The second wave has further decelerated construction activities and delayed leasing closures. The slowdown in construction would lead to an incremental increase in demand for ready buildings at strategic locations from domestic and international companies wanting to set up or expand their operations. ESR has developed a substantial portfolio of ready assets across the country to address this demand.
We foresee an increase in demand from e-commerce companies as they strengthen their positions in Tier 1 markets and boost their in-city distribution network. 3PL enquiries were on the rise towards the end of the first wave, which has slowed down. Demand for industrial spaces is also witnessing a gradual increase and is likely to surge in the long term due to the rise in global interest to invest in India. Tier 2 cities will be crucial for the next phase of e-commerce expansion, and institutional developers are expanding their footprint in key markets to address this demand.
There will be renewed interest in digitisation, automation to conduct contactless business processes, and the shift from Grade B to Grade A spaces will continue. Implementation of construction technology will help increase efficiency and reduce turnaround time for delivery. Currently, the market is in a 'wait & watch' mode, and it will take 6-7 months to see how the sector regains its velocity and bounces back with renewed vigour.
I N D I A W A R E H O U S I N G M A R K E T R E P O R T 2 0 2 1
Abhijit MalkaniCEO at ESR Advisers India
1 3 1 4

I N D I A W A R E H O U S I N G M A R K E T R E P O R T 2 0 2 1
MARKET POTENTIAL: COMPARING INDIAN WAREHOUSING MARKET WITH OTHER COUNTRIES
Indian warehousing is still at a very nascent stage and has a long way to go before tapping into its full potential. One of the ways to gauge the scale of the opportunity the Indian warehousing market represents would be to compare the area of industrial and warehousing stock present in developed markets, where the warehousing market is more mature. The growth of a warehousing market is highly correlated with the population and per capita income of a country and is depicted in the adjacent table as well.
India has a per capita warehousing stock of just 0.02 sq m compared to the USA, China and the United Kingdom that have 4.4 sq m, 0.8 sq m and 1.09 sq m respectively. Even in terms of transaction volumes, USA's industrial and warehousing market saw 20.4 mn sq m (220 mn sq ft) transacted during 2020, 7 times that of India in FY 2021.
The e-commerce sector has been the biggest driver of warehousing across developed markets globally. The share of online sales in the UK had in fact spiked from 19.2% in 2019 to a steep 33.4% in May 2020 showing the dominance and scalability of the online marketplace even in a mature market. With only 4.7% penetration in India (2019 est), we believe that the Indian e-commerce market is on the cusp of its next phase of growth with Indian business giants such as the Reliance and Tata groups entering the fray along with global behemoths Amazon and Walmart to capture this massive market. A growing economy like India with the second largest population in the world still holds massive potential for its warehousing market which will fructify over the next few years.
COMPARISON OF WAREHOUSING MARKETS
United States of America (USA)GDP Constant Prices (USD tn) : 18.3Population (mn) : 328GDP Per Capita (USD) : 55,753Warehousing Stock (mn sq m) : 1,446Warehousing Stock Per Capita (sq m) : 4.4
Source: World Bank, China Logistics Research Association, Knight Frank ResearchNotes: Warehousing stock per capita = Warehousing stock/ total populationIndia represents the top eight cities. It includes commercial warehouses but excludes agri-warehouses.
United KingdomGDP Constant Prices (USD tn) : 2.9Population (mn) : 6.7GDP Per Capita (USD) : 43,710Warehousing Stock (mn sq m) : 73Warehousing Stock Per Capita (sq m) : 1.09
ChinaGDP Constant Prices (USD tn) : 11.5Population (mn) : 1,397GDP Per Capita (USD) : 8,242Warehousing Stock (mn sq m) : 1,060Warehousing Stock Per Capita (sq m) : 0.8
IndiaGDP Constant Prices (USD tn) : 2.9Population (mn) : 1,366GDP Per Capita (USD) : 2,152Warehousing Stock (mn sq m) : 30.9Warehousing Stock Per Capita (sq m) : 0.02
The warehousing sector witnessed substantial leasing growth in the past year due to robust demand from leading e-commerce players, followed by FMCG and cold storage companies. However, challenges such as limited availability of debt, increased material cost, lack of availability of labour, inconsistent supply of construction materials slowed down construction progress. The second wave has further decelerated construction activities and delayed leasing closures. The slowdown in construction would lead to an incremental increase in demand for ready buildings at strategic locations from domestic and international companies wanting to set up or expand their operations. ESR has developed a substantial portfolio of ready assets across the country to address this demand.
We foresee an increase in demand from e-commerce companies as they strengthen their positions in Tier 1 markets and boost their in-city distribution network. 3PL enquiries were on the rise towards the end of the first wave, which has slowed down. Demand for industrial spaces is also witnessing a gradual increase and is likely to surge in the long term due to the rise in global interest to invest in India. Tier 2 cities will be crucial for the next phase of e-commerce expansion, and institutional developers are expanding their footprint in key markets to address this demand.
There will be renewed interest in digitisation, automation to conduct contactless business processes, and the shift from Grade B to Grade A spaces will continue. Implementation of construction technology will help increase efficiency and reduce turnaround time for delivery. Currently, the market is in a 'wait & watch' mode, and it will take 6-7 months to see how the sector regains its velocity and bounces back with renewed vigour.
I N D I A W A R E H O U S I N G M A R K E T R E P O R T 2 0 2 1
Abhijit MalkaniCEO at ESR Advisers India
1 3 1 4

I N D I A W A R E H O U S I N G M A R K E T R E P O R T 2 0 2 1I N D I A W A R E H O U S I N G M A R K E T R E P O R T 2 0 2 10 5 I N D I A W A R E H O U S I N G M A R K E T R E P O R T 2 0 2 1
W A R E H O U S I N GM A R K E T A N A L Y S I S
Supply was similarly impacted due to the near complete stoppage of any development activity as the migrant labour-force had returned to their hometowns. The relatively limited supply of Grade A warehouses in the right locations was also a contributing factor to subdued transaction levels in FY 2021, especially in Mumbai.
The slowdown in market traction, while expected, is markedly less drastic than seen in other real estate segments like office and retail. It is also noteworthy that despite the significant YoY fall in transaction volumes in FY 2021, demand has grown at a CAGR of 23% in the FY 2017-2021 period.
While warehouses remain an attractive investment grade real estate asset class in India, economic sluggishness since FY 2020 and the second wave of the pandemic in FY 2021 have had an adverse impact on occupier demand. The lockdown imposed during Q1 FY 2021 brought economic activity to a near halt during the quarter and impacted consumer sentiments for the remainder of the year. The threat of disruption in sales caused potential occupiers to curtail non-core expenses and defer expansion plans of current capacities, causing transaction activity to drop 23% YoY in FY 2021. This drop in demand also caused rents to decline across most markets.
ANNUAL DEMAND ANALYSIS – MARKET AND SECTOR SPLIT
ANNUAL WAREHOUSING TRANSACTIONS
Source: Knight Frank Research
Warehousing leasing FY 2021 Change CAGRCity in mn sq m (mn sq ft) FY 2021 YoY FY 2017-2021
NCR 0.6 (6.9) -20% 25%
Mumbai 0.5 (5.8) -23% 39%
Bangalore 0.4 (4.3) 0% 35%
Chennai 0.3 (3.5) 4% 17%
Kolkata 0.3 (3.1) -22% 23%
Ahmedabad 0.3 (3) -42% 14%
Pune 0.3 (2.8) -42% 9%
Hyderabad 0.2 (2.4) -30% 18%
Total 2.9 (31.7) -23% 23%
While transaction volumes were subdued in FY 2021, occupiers showed a marked preference for Grade A properties as they are much better geared toward tackling exigencies such as those posed by the pandemic. The inherent operational efficiencies, adherence to safety standards and better contingency planning as a result of greater expertise of personnel due to higher institutional participation are some of the factors that drew occupier interest even during the challenging environment of FY 2021. E-commerce
players have always coveted the value additions that Grade A properties bring in to their supply chain operations and the increase in their share of total transaction volumes also had a significant role to play in the increased take-up seen in Grade A properties. 64% of the area transacted during FY 2021 was located in Grade A properties. With the exception of Bengaluru and Ahmedabad, more than half the area transacted in all the top markets occurred in Grade A properties.
AVERAGE RENTS
Source: Knight Frank Research
FY 2020 FY 2021 Markets INR/sq m/month INR/sq m/month YoY (INR/sq ft/month) (INR/sq ft/month) Change
Mumbai 235 (21.9) 218 (20.2) -7%
Bangalore 212 (19.7) 202 (18.8) -5%
Ahmedabad 171 (15.9) 167 (15.5) -3%
Chennai 235 (21.8) 229 (21.3) -3%
Hyderabad 214 (19.9) 210 (19.5) -2%
Kolkata 223 (20.8) 221 (20.6) -1%
Pune 249 (23.1) 248 (23) -1%
NCR 191 (17.7) 193 (17.9) 1%
Rent growth faced significant headwinds in the challenging market with occupiers negotiating hard for incentives like rent-free periods and delaying contractual escalations to tide over liquidity issues. Resistance to rent growth, coupled with the recent increase in construction cost due to the sharp increase in prices of cement, steel and labour have created significant hurdles for further warehouse development. However, this deadlock could break toward the end of the current year as occupiers eventually submit to higher rents due to the inflationary pressures.
The social distancing norms that were imposed due to the pandemic have impacted every physical marketplace. This caused the already high-growth e-commerce sector to receive a further boost, especially in the essential categories like grocery and pharmaceuticals. This was reflected in the sector's share in annual transactions which increased 8 percentage points from 23% to 31%.
The share of 3PL operators had been growing steadily, fuelled by the increasing need for e-commerce logistics as well as a strengthening trend of most companies outsourcing their logistics requirements to 3PL operators. However, the share of the 3PL industry fell to 31% in FY 2021 from 35% previously as its fortunes are closely linked to those of all other sectors ranging from manufacturing to retail, with e-commerce accounting for approximately 10-20% of its incremental demand. The e-commerce and 3PL sectors continued to dominate the transactions pie, accounting for 63% of the transactions during the year.
15% of the volumes transacted during FY 2021 were purely for industrial use i.e. their end-use involved some form of manufacturing activity from sectors like automobile, FMCG and FMCD. Among the top eight markets in India - Pune, Chennai and Ahmedabad are cities with
1 5 1 6
I N D I A W A R E H O U S I N G M A R K E T R E P O R T 2 0 2 1
Sushil RathiChief Operating Officer – MLL Transportation & Procurement & Chief Executive Officer – Lords Freight Limited
I N D I A W A R E H O U S I N G M A R K E T R E P O R T 2 0 2 1
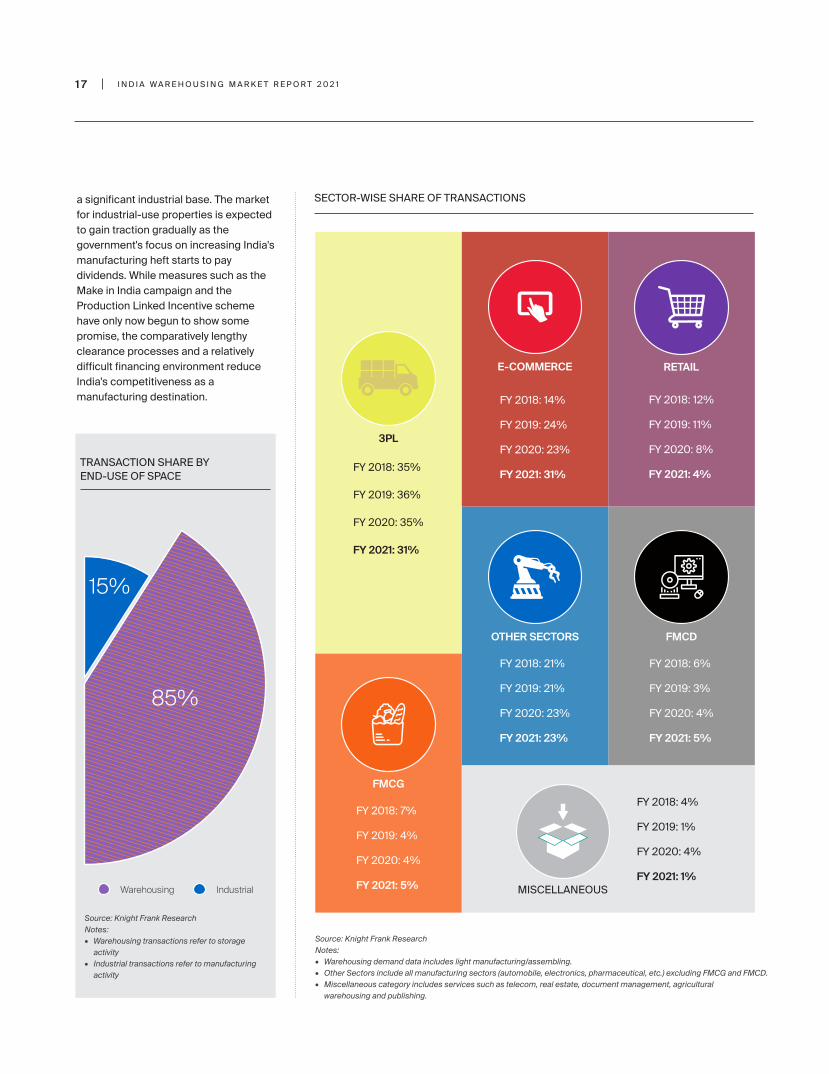
a significant industrial base. The market for industrial-use properties is expected to gain traction gradually as the government's focus on increasing India's manufacturing heft starts to pay dividends. While measures such as the Make in India campaign and the Production Linked Incentive scheme have only now begun to show some promise, the comparatively lengthy clearance processes and a relatively difficult financing environment reduce India's competitiveness as a manufacturing destination.
SECTOR-WISE SHARE OF TRANSACTIONS
TRANSACTION SHARE BY END-USE OF SPACE
Source: Knight Frank ResearchNotes:• Warehousing demand data includes light manufacturing/assembling.• Other Sectors include all manufacturing sectors (automobile, electronics, pharmaceutical, etc.) excluding FMCG and FMCD.• Miscellaneous category includes services such as telecom, real estate, document management, agricultural warehousing and publishing.
Source: Knight Frank ResearchNotes:• Warehousing transactions refer to storage activity• Industrial transactions refer to manufacturing activity
IndustrialWarehousing
85%
15%
The Indian warehousing industry is currently at a crucial point that will not only make it one of the biggest but also one of the smartest across the globe. Post GST, we have seen a whole lot of consolidation exercises taken up by OEMs. Now with the government policies to boost India as an emerging global manufacturing hub, e-commerce boom accelerated by the Covid-19 pandemic and the rise of Tier 2 and 3 cities as consumption centres, we are likely to see major growth for quality warehousing space. Two things stand out for the future, one is compliant warehouses and the other is Grade A specifications.
The warehousing and logistics asset class could be among the fastest to recover from the coronavirus crisis, with an expected increase in domestic demand and the possibility of global firms shifting manufacturing to India to de-risk their global supply chains having an overdependence on China. Going forward, we foresee an increased adoption of large format, multiuser and compliant warehouses. We also anticipate a higher level of automation in warehousing operations.
At Mahindra Logistics, we foresee our current warehousing footprint of 17 million sq ft to double in the next 3 years. We see demand growing not only in Tier 1 cities but spreading to Tier 2 and 3 cities already. Customers are looking to contract 3PL service providers who can offer pan India footprints coupled with distribution capabilities.
1 7 1 8
3PL
FY 2018: 35%
FY 2019: 36%
FY 2020: 35%
FY 2021: 31%
E-COMMERCE
FY 2018: 14%
FY 2019: 24%
FY 2020: 23%
FY 2021: 31%
FMCD
FY 2018: 6%
FY 2019: 3%
FY 2020: 4%
FY 2021: 5%
FMCG
FY 2018: 7%
FY 2019: 4%
FY 2020: 4%
FY 2021: 5%
RETAIL
FY 2018: 12%
FY 2019: 11%
FY 2020: 8%
FY 2021: 4%
OTHER SECTORS
FY 2018: 21%
FY 2019: 21%
FY 2020: 23%
FY 2021: 23%
MISCELLANEOUS
FY 2018: 4%
FY 2019: 1%
FY 2020: 4%
FY 2021: 1%

I N D I A W A R E H O U S I N G M A R K E T R E P O R T 2 0 2 1
Sushil RathiChief Operating Officer – MLL Transportation & Procurement & Chief Executive Officer – Lords Freight Limited
I N D I A W A R E H O U S I N G M A R K E T R E P O R T 2 0 2 1
a significant industrial base. The market for industrial-use properties is expected to gain traction gradually as the government's focus on increasing India's manufacturing heft starts to pay dividends. While measures such as the Make in India campaign and the Production Linked Incentive scheme have only now begun to show some promise, the comparatively lengthy clearance processes and a relatively difficult financing environment reduce India's competitiveness as a manufacturing destination.
SECTOR-WISE SHARE OF TRANSACTIONS
TRANSACTION SHARE BY END-USE OF SPACE
Source: Knight Frank ResearchNotes:• Warehousing demand data includes light manufacturing/assembling.• Other Sectors include all manufacturing sectors (automobile, electronics, pharmaceutical, etc.) excluding FMCG and FMCD.• Miscellaneous category includes services such as telecom, real estate, document management, agricultural warehousing and publishing.
Source: Knight Frank ResearchNotes:• Warehousing transactions refer to storage activity• Industrial transactions refer to manufacturing activity
IndustrialWarehousing
85%
15%
The Indian warehousing industry is currently at a crucial point that will not only make it one of the biggest but also one of the smartest across the globe. Post GST, we have seen a whole lot of consolidation exercises taken up by OEMs. Now with the government policies to boost India as an emerging global manufacturing hub, e-commerce boom accelerated by the Covid-19 pandemic and the rise of Tier 2 and 3 cities as consumption centres, we are likely to see major growth for quality warehousing space. Two things stand out for the future, one is compliant warehouses and the other is Grade A specifications.
The warehousing and logistics asset class could be among the fastest to recover from the coronavirus crisis, with an expected increase in domestic demand and the possibility of global firms shifting manufacturing to India to de-risk their global supply chains having an overdependence on China. Going forward, we foresee an increased adoption of large format, multiuser and compliant warehouses. We also anticipate a higher level of automation in warehousing operations.
At Mahindra Logistics, we foresee our current warehousing footprint of 17 million sq ft to double in the next 3 years. We see demand growing not only in Tier 1 cities but spreading to Tier 2 and 3 cities already. Customers are looking to contract 3PL service providers who can offer pan India footprints coupled with distribution capabilities.
1 7 1 8
3PL
FY 2018: 35%
FY 2019: 36%
FY 2020: 35%
FY 2021: 31%
E-COMMERCE
FY 2018: 14%
FY 2019: 24%
FY 2020: 23%
FY 2021: 31%
FMCD
FY 2018: 6%
FY 2019: 3%
FY 2020: 4%
FY 2021: 5%
FMCG
FY 2018: 7%
FY 2019: 4%
FY 2020: 4%
FY 2021: 5%
RETAIL
FY 2018: 12%
FY 2019: 11%
FY 2020: 8%
FY 2021: 4%
OTHER SECTORS
FY 2018: 21%
FY 2019: 21%
FY 2020: 23%
FY 2021: 23%
MISCELLANEOUS
FY 2018: 4%
FY 2019: 1%
FY 2020: 4%
FY 2021: 1%

I N D I A W A R E H O U S I N G M A R K E T R E P O R T 2 0 2 1
The development of Grade A warehousing facilities has been increasing in recent years, currently constituting 35% of the total stock compared to 34% in FY 2020. The larger warehousing markets of Mumbai and NCR have a significantly lower proportion of Grade A warehouses as they are much older markets and a bulk of their stock had been built before the demand for Grade A warehousing gathered momentum. Pune and Chennai have the highest concentration of Grade A stock due to their primary demand base of auto and auto ancillary occupiers. Notably, Mumbai, NCR, Bengaluru and Ahmedabad have more than a 50% share of Grade B properties. Interestingly, despite having a high proportion (82%) of Grade B stock, the fact that Mumbai still enjoys market level occupancy of close to 87% underscores the strength of the market and need for quality supply.
Vacancy in Grade A properties is significantly less than the total vacancy for the eight primary markets under coverage. In fact, Grade A vacancy has also reduced or stayed the same YoY for all markets except Ahmedabad which saw a significant speculative development during FY 2021.
More than $6.5 bn have been committed by private equity players in the warehousing market since the GST reforms were applied in
2017. However, the relative dearth of supply of high quality warehousing facilities that conforms to contemporary compliance norms, continues to be a challenge. The availability of suitable land is the biggest impediment in creating supply as lands with clear title continue to be scarce and digitisation of land records which can address this issue is still a long way from becoming a reality. Bhiwandi and the Nashik Highway in the Mumbai market are a case in point where there is very strong occupier demand but issues with land titling curtail institutional interest. Additionally, persistently high land prices and the complexity and time taken for acquiring regulatory approvals continue to impact the viability of warehouse projects and are significant impediments in creating warehousing capacity.
Market traction was seen improving toward the end of FY 2021 as vaccine availability improved and occupiers looked to revive expansion plans. However, the second wave of COVID-19 infections in FY 2021 have again slowed the momentum. Occupier activity in FY 2022 will clearly be dictated by the intensity of the pandemic and should regain lost momentum as vaccine deployment improves and restores normalcy to economic activity.
I N D I A W A R E H O U S I N G M A R K E T R E P O R T 2 0 2 1
STOCK AND SUPPLY – DEVELOPMENT POTENTIAL ASSESSMENT
Knight Frank has conducted a ground-up survey of warehousing stock in the top eight markets of India to arrive at an assessment of the supply scenario that exists in the market today.
The eight primary markets of India held an estimated 31 mn sq m (329 mn sq ft) of warehousing stock at the end of FY 2021. The Mumbai market accounts for 42% of this stock and along with NCR accounts for 60% of the total stock. The vacancy levels in the Mumbai and NCR markets are relatively low and their high weightage in the total stock keeps the combined vacancy level of all eight cities at a comparatively healthy 16.6%. However, the vacancy level has moved up by 130 basis points YoY in FY 2021 due to weaker transaction activity during the year.
WAREHOUSING STOCK AND VACANCY
Market Existing Stock Vacancy Vacancy mn sq m (mn sq ft) FY 2020 FY 2021
Mumbai 12.7 (137) 11.6% 13.3%
NCR 5.5 (59) 13.9% 15.8%
Pune 2.4 (26) 21.8% 21.8%
Chennai 2.3 (25) 14.7% 13.1%
Kolkata 2.1 (23) 20.6% 21.5%
Bengaluru 2.1 (23) 26.2% 25.2%
Ahmedabad 2 (21) 13.2% 22.8%
Hyderabad 1.4 (15) 22.4% 18.9%
Total 30.6 (329) 15.3% 16.6%
Source: Knight Frank Research
We estimate that the total land committed to warehousing development amounts to 22,488 acres in the top eight markets and translates to a total buildable potential of almost 49 mn sq m (531 mn sq ft), after factoring in property level FSI dynamics. Given that 31 mn sq m (329 mn sq ft) of warehousing stock already exists on this committed land, this leaves nearly 19 mn sq m (202 mn sq ft) of potential warehousing space that can come up on these warehousing land parcels.
The eight markets can potentially add 61% more to the warehousing stock currently operational there, so they are said to have a total development potential multiple of 1.61. Compared to other property types, warehousing development takes relatively less time. A high-quality PEB warehousing facility can be fully developed from the ground-up within a period of one year, depending on the extent of treatment such as filling and levelling that the land requires.
STOCK SPLIT BY GRADE
Source: Knight Frank Research
Market Grade A Grade B
Pune 71% 29%
Chennai 71% 29%
Hyderabad 56% 44%
Kolkata 56% 44%
Bengaluru 42% 58%
Ahmedabad 30% 70%
NCR 29% 71%
Mumbai 18% 82%
Total 35% 65%
VACANCY SPLIT BY GRADE
Market Grade A Grade B Total
Bengaluru 9.4% 36.9% 25.2%
Chennai 11.2% 17.4% 13.1%
Hyderabad 12.4% 27.1% 18.9%
Kolkata 12.7% 32.6% 21.5%
Mumbai 13.3% 13.3% 13.3%
Pune 14.3% 40.3% 21.8%
NCR 22.5% 13.1% 15.8%
Ahmedabad 32.6% 18.6% 22.8%
Total 15.1% 17.5% 16.6%
1 9 2 0
Source: Knight Frank Research

I N D I A W A R E H O U S I N G M A R K E T R E P O R T 2 0 2 1
The development of Grade A warehousing facilities has been increasing in recent years, currently constituting 35% of the total stock compared to 34% in FY 2020. The larger warehousing markets of Mumbai and NCR have a significantly lower proportion of Grade A warehouses as they are much older markets and a bulk of their stock had been built before the demand for Grade A warehousing gathered momentum. Pune and Chennai have the highest concentration of Grade A stock due to their primary demand base of auto and auto ancillary occupiers. Notably, Mumbai, NCR, Bengaluru and Ahmedabad have more than a 50% share of Grade B properties. Interestingly, despite having a high proportion (82%) of Grade B stock, the fact that Mumbai still enjoys market level occupancy of close to 87% underscores the strength of the market and need for quality supply.
Vacancy in Grade A properties is significantly less than the total vacancy for the eight primary markets under coverage. In fact, Grade A vacancy has also reduced or stayed the same YoY for all markets except Ahmedabad which saw a significant speculative development during FY 2021.
More than $6.5 bn have been committed by private equity players in the warehousing market since the GST reforms were applied in
2017. However, the relative dearth of supply of high quality warehousing facilities that conforms to contemporary compliance norms, continues to be a challenge. The availability of suitable land is the biggest impediment in creating supply as lands with clear title continue to be scarce and digitisation of land records which can address this issue is still a long way from becoming a reality. Bhiwandi and the Nashik Highway in the Mumbai market are a case in point where there is very strong occupier demand but issues with land titling curtail institutional interest. Additionally, persistently high land prices and the complexity and time taken for acquiring regulatory approvals continue to impact the viability of warehouse projects and are significant impediments in creating warehousing capacity.
Market traction was seen improving toward the end of FY 2021 as vaccine availability improved and occupiers looked to revive expansion plans. However, the second wave of COVID-19 infections in FY 2021 have again slowed the momentum. Occupier activity in FY 2022 will clearly be dictated by the intensity of the pandemic and should regain lost momentum as vaccine deployment improves and restores normalcy to economic activity.
I N D I A W A R E H O U S I N G M A R K E T R E P O R T 2 0 2 1
STOCK AND SUPPLY – DEVELOPMENT POTENTIAL ASSESSMENT
Knight Frank has conducted a ground-up survey of warehousing stock in the top eight markets of India to arrive at an assessment of the supply scenario that exists in the market today.
The eight primary markets of India held an estimated 31 mn sq m (329 mn sq ft) of warehousing stock at the end of FY 2021. The Mumbai market accounts for 42% of this stock and along with NCR accounts for 60% of the total stock. The vacancy levels in the Mumbai and NCR markets are relatively low and their high weightage in the total stock keeps the combined vacancy level of all eight cities at a comparatively healthy 16.6%. However, the vacancy level has moved up by 130 basis points YoY in FY 2021 due to weaker transaction activity during the year.
WAREHOUSING STOCK AND VACANCY
Market Existing Stock Vacancy Vacancy mn sq m (mn sq ft) FY 2020 FY 2021
Mumbai 12.7 (137) 11.6% 13.3%
NCR 5.5 (59) 13.9% 15.8%
Pune 2.4 (26) 21.8% 21.8%
Chennai 2.3 (25) 14.7% 13.1%
Kolkata 2.1 (23) 20.6% 21.5%
Bengaluru 2.1 (23) 26.2% 25.2%
Ahmedabad 2 (21) 13.2% 22.8%
Hyderabad 1.4 (15) 22.4% 18.9%
Total 30.6 (329) 15.3% 16.6%
Source: Knight Frank Research
We estimate that the total land committed to warehousing development amounts to 22,488 acres in the top eight markets and translates to a total buildable potential of almost 49 mn sq m (531 mn sq ft), after factoring in property level FSI dynamics. Given that 31 mn sq m (329 mn sq ft) of warehousing stock already exists on this committed land, this leaves nearly 19 mn sq m (202 mn sq ft) of potential warehousing space that can come up on these warehousing land parcels.
The eight markets can potentially add 61% more to the warehousing stock currently operational there, so they are said to have a total development potential multiple of 1.61. Compared to other property types, warehousing development takes relatively less time. A high-quality PEB warehousing facility can be fully developed from the ground-up within a period of one year, depending on the extent of treatment such as filling and levelling that the land requires.
STOCK SPLIT BY GRADE
Source: Knight Frank Research
Market Grade A Grade B
Pune 71% 29%
Chennai 71% 29%
Hyderabad 56% 44%
Kolkata 56% 44%
Bengaluru 42% 58%
Ahmedabad 30% 70%
NCR 29% 71%
Mumbai 18% 82%
Total 35% 65%
VACANCY SPLIT BY GRADE
Market Grade A Grade B Total
Bengaluru 9.4% 36.9% 25.2%
Chennai 11.2% 17.4% 13.1%
Hyderabad 12.4% 27.1% 18.9%
Kolkata 12.7% 32.6% 21.5%
Mumbai 13.3% 13.3% 13.3%
Pune 14.3% 40.3% 21.8%
NCR 22.5% 13.1% 15.8%
Ahmedabad 32.6% 18.6% 22.8%
Total 15.1% 17.5% 16.6%
1 9 2 0
Source: Knight Frank Research

Anshul SinghalManaging DirectorWelspun One Logistics Parks
The COVID-19 pandemic has definitely accelerated the growth prospects of warehousing in India. When the world was struck by a catastrophe, warehousing and logistics played an indispensable role - so much so that it began to get recognised as an 'essential services' sector, forming the lifeline of the country's GDP.
The boom in online buying is noteworthy especially when it comes to Tier II and III cities, and will play an important role in the future of warehousing. This spike in online buying will also lead to a demand for micro-warehousing hubs within cities, to ensure timely delivery and easy return of shipments. Thus, in-city/multi-storey/urban warehousing is fast emerging as the next big trend. Any e-commerce operation needs a strong and robust supply chain network, of which, modern warehousing forms a critical component. Grade-A facilities are high on specifications, allowing for the timelines that present businesses require, and are built to enable high-level automation in the future.
Additionally, as investors are grappling with rebalancing their portfolios to mitigate risk in this post-pandemic world, warehousing presents itself as one of the few bright spots in an otherwise difficult real estate investment scenario, since it is one of the few asset classes which provides both attractive development returns and stable long-term rental yields. Given this backdrop, India's warehousing story looks extremely attractive from a long-term demand-supply perspective.
Within the real estate sector, warehousing has emerged as one of the more resilient asset classes. In 2020, vis-à-vis other real estate asset classes, warehousing rental values remained unchanged, and this can be attributed to sustained demand from occupiers coupled with already low vacancies. This also sets the stage for a likely quick uptick of rent once an overall recovery of the economic cycle sets in.
At present, warehouse developers in India are already looking at consolidating their holdings. In the future, this will lead to large institutional holding of warehousing assets with the possibility of a warehousing REIT on the horizon. There is an expectation for warehousing REITs to develop 2x faster than other asset classes, due to factors such as longer and stickier leases, with typical leases ranging from 7-15 years. These are going to be held by high-quality tenants who invest heavily within the warehouse itself, further adding to the stickiness factor and making these assets more stable in the long run.
For a possible warehousing REIT in the future, the total Grade-A stock will need to rise at a quicker rate leaving tremendous room for growth. From the global REIT experience, 'size' and 'scale' are as important as the location and quality of the sponsor or the asset in REITs. Over the next few years, a high increase in demand is envisioned and it would be safe to say that the market is looking at a minimum of 3-4 years for warehousing REITs to gain eminence in India.
W A R E H O U S I N GM A R K E T S Ahmedabad | Ambala - Rajpura
Bengaluru | Bhubaneswar | ChennaiCoimbatore | Guwahati | HyderabadKolkata | Lucknow | Ludhiana | Mumbai | NCRPune | Surat | Vapi | Visakhapatnam
I N D I A W A R E H O U S I N G M A R K E T R E P O R T 2 0 2 1I N D I A W A R E H O U S I N G M A R K E T R E P O R T 2 0 2 12 1 2 2

• The warehousing demand in Ahmedabad was predominantly driven by the industrial and manufacturing segments followed by the consumption demand.
• There are 4 major warehousing clusters in Ahmedabad: Aslali-Kheda, Changodar-Bagodara, Sanand-Viramgam and Chhatral-Kadi-Vithalapur-Becharaji belt. Aslali-Kheda and Changodar-Bagodara belts are bigger and established clusters.
• The Aslali-Kheda belt, located along the 3x3 lane Mumbai-Ahmedabad highway, is one of the oldest warehousing clusters of the city. The demand from the retail/consumption segment is the major driver of warehousing demand in this belt. High land prices and the expansion of Ahmedabad municipal limits have made it unviable to start a new warehouse in the Aslali-Jetalpur belt. The warehouses in this region are over 15-20 years old and lack modern offerings. Besides, most of the supply is controlled by local landowners. Better quality warehouses can be seen in the Bareja-Kheda belt and the land prices along this route are lower compared to Aslali-Jetalpur.
• The Changodar-Bagodara belt is an industrial region with a large part of the warehousing demand coming from the Other Sectors followed by e-commerce. This belt has good quality 3x3 lane roads with divider separation. Many pharmaceutical companies and several large industr ies have their manufacturing facilities in the Changodar-Bagodara belt, and the region offers a well-developed ecosystem as required by manufacturing companies. Many logistics and warehousing park developers are active in this region and the early movers have already built a fully operational modern warehousing facility here. This belt had the highest share of transactions in FY 2021.
• The Sanand-Viramgam and the Chhatral-Kadi-Vithalapur-Becharaji belts are the automobile hubs in India. Some of the largest automobile companies along with their ancillaries have their manufacturing facilities in these hubs.
A H M E D A B A DW A R E H O U S I N G M A R K E T
• The Ahmedabad warehousing market witnessed leasing volumes of 0.27 mn sq m (3 mn sq ft) in FY 2021, recording a 42% YoY decline. This decline was on account of a pandemic induced slowdown of the economy and also due to the high base of FY 2020. Transactions in FY 2020 were whipped up by the large space take-up from the e-commerce and 3PL segments.
• In FY 2021, the space take up was driven by warehousing demand which garnered 68% share of the transactions. The industrial segments which undertake various kinds of light to heavy manufacturing activities in warehousing parks had 32% share of transactions.
• Despite the lower transaction activity and higher supply, rents in Ahmedabad have corrected in the range of 2-4% in FY 2021.
• The interest from e-commerce for in-city warehousing continues to grow. Large e-commerce companies have taken up smaller spaces to augment their in-city last mile delivery networks. These spaces have been transacted at much higher rents (2x-4x) compared to that for traditional warehousing.
Major warehousing locations in Ahmedabad Warehousing cluster
Warehousing cluster Major warehousing locations
Aslali-Kheda cluster Aslali, Jetalpur, Bareja, Kanera, Gobhalaj, Hariyala, Kheda
Changodar-Bagodara cluster Changodar, Bavla, Bhayala, Bagodara
Sanand-Viramgam cluster Sanand, Sachna, Viramgam
Chhatral-Kadi-Vithalapur-Becharaji cluster Chhatral, Kadi, Vithalapur, Becharaji
Classification of warehousing locations into major clusters
Source: Knight Frank Research
Source: Knight Frank Research | Map is for representation and not to scale
CHHATRAL
BECHARAJI
KHEDA
HARIYALA
BAREJA
GOBHALAJ
KANERA
JETALPUR
AHMEDABAD
BAVLA
BAGODARA
BHAYALA
SANAND
SACHANA
VITHALAPUR
KADI
I N D I A W A R E H O U S I N G M A R K E T R E P O R T 2 0 2 12 3 I N D I A W A R E H O U S I N G M A R K E T R E P O R T 2 0 2 12 4
CHANGODA

Source: Knight Frank Research
Warehousing market transaction volume Cluster-split of transaction volume (FY 2021)
Land rate and rents
Warehouse cluster Location Land rate Grade A Grade B (INR mn/acre) Rent per month in Rent per month in INR/sq m (INR/sq ft) INR/sq m (INR/sq ft)
Aslali-Kheda Aslali 25 – 30 215 – 258 (20 – 24) 161 – 205 (15 – 19) Bareja 15 – 20 183 – 205 (17 – 19) 151 – 183 (14 – 17) Kanera 15 – 20 183 – 205 (17 – 19) 129 – 172 (12 – 16) Gobhlaj 12 – 15 161 – 194 (15 – 18) 129 – 151 (12 – 14) Kheda 10 – 15 151 – 172 (14 – 16) 108 – 140 (10 – 13)Changodar-Bagodara Changodar 25 – 30 194 – 237 (18 – 22) 151 – 172 (14 – 16) Bavla 12 – 16 161 – 194 (15 – 18) 129 – 161 (12 – 15) Bhayala 10 – 13 161 – 194 (15 – 18) 118 – 140 (11 – 13) Bagodara 8 – 9 140 – 161 (13 – 15) 97 – 118 (9 – 11)Sanand-Viramgam Sanand 20 – 25 183 – 215 (17 – 20) 140 – 161 (13 – 15) Sachana 10 – 15 151 – 172 (14 – 16) 118 – 151 (11 – 14)Vithalapur-Becharaji Kadi 12 – 15 172 – 194 (16 – 18) 129 – 151 (12 – 14) Vithalapur 8 – 12 161 – 172 (15 – 16) 129 – 151 (12 – 14) Becharaji 9 – 13 161 – 172 (15 – 16) 118 – 151 (11 – 14)
Source: Knight Frank Research
Mn
sq m
Select warehouse projects
Warehouse project Warehouse cluster
Prime Indraprasth Industrial Aslali-Khedaand Logistics Hub Anmol Laxmi Industrial and Aslali-KhedaLogistics ParkIndospace Changodar-BagodaraGallops Industrial Park Changodar-BagodaraCrystal Indus Industrial and Changodar-BagodaraLogistics ParkAshwika Warehousing Changodar-BagodaraMascot Industrial Park Chhatral-Kadi-Vithalapur- BecharajiKamla Amrut Indi-Tech Park Chhatral-Kadi-Vithalapur- Becharaji
Source: Knight Frank Research
Major infrastructure in Ahmedabad
Name Type
Delhi-Mumbai Industrial ManufacturingCorridor (DMIC) corridorWestern Dedicated Freight Railway Corridor (DFC) National Expressway-1 Road infrastructureAhmedabad-Rajkot National Road InfrastructureHighway (NH-8A) Ahmedabad-Sanand-Viramgam Road InfrastructureState Highway (SH 17) SP Ring Road Road InfrastructureMandar Bechraji Special Industrial hubInvestment Region (SIR) GIFT City Mega townshipDholera Special Investment Region (SIR) Industrial hub
Source: Knight Frank Research | Note: NH stands for National Highway
Select large occupiers
Occupier Occupier industry Warehouse cluster
Johnson Other sectors Chhatral-Kadi-Controls-Hitachi Vitthalapur-BecharajiAir Conditioning Amazon E-commerce Changodar- Bagodara Flipkart E-commerce Aslali-KhedaAmber Group India Other sectors Sanand-ViramgamHaier FMCD Aslali-Kheda ZF India Other sectors Chhatral-Kadi- Vitthalapur-Becharaji
Source: Knight Frank Research
Source: Knight Frank Research
Changodar-Bagodara
Kadi-Vithlapur-Becharaji
Aslali-Kheda
FY 2018 FY 2019 FY 2020
0.1
0.2
0.3
0.4
0.5
FY 2021
0.32
0.48
0.27
0.46
FY 2021
2%
Industry-split of transaction volume (FY 2021)
Source: Knight Frank Research
FMCG
3PL
E-commerce
Other Sectors
FMCD
Notes:
Warehousing transactions data includes light manufacturing/ assembling.
Other Sectors – These include all manufacturing sectors (automobile, electronics, pharmaceutical, etc.) excluding FMCG and FMCD.
Miscellaneous – These include services such as telecom, real estate, document management, agricultural warehousing and publishing.
Transaction share by end-use of space (FY 2021)
Source: Knight Frank Research
Notes:
Warehousing transactions: These refer to storage activity
Industrial transactions: These refer to manufacturing activity
Warehousing
Industrial
33%
32%
19%
15%
Sanand-Viramgam Others
0.6
68%
32%
25%
23%
23%
21%
7%2%
Retail
I N D I A W A R E H O U S I N G M A R K E T R E P O R T 2 0 2 12 5 I N D I A W A R E H O U S I N G M A R K E T R E P O R T 2 0 2 12 6
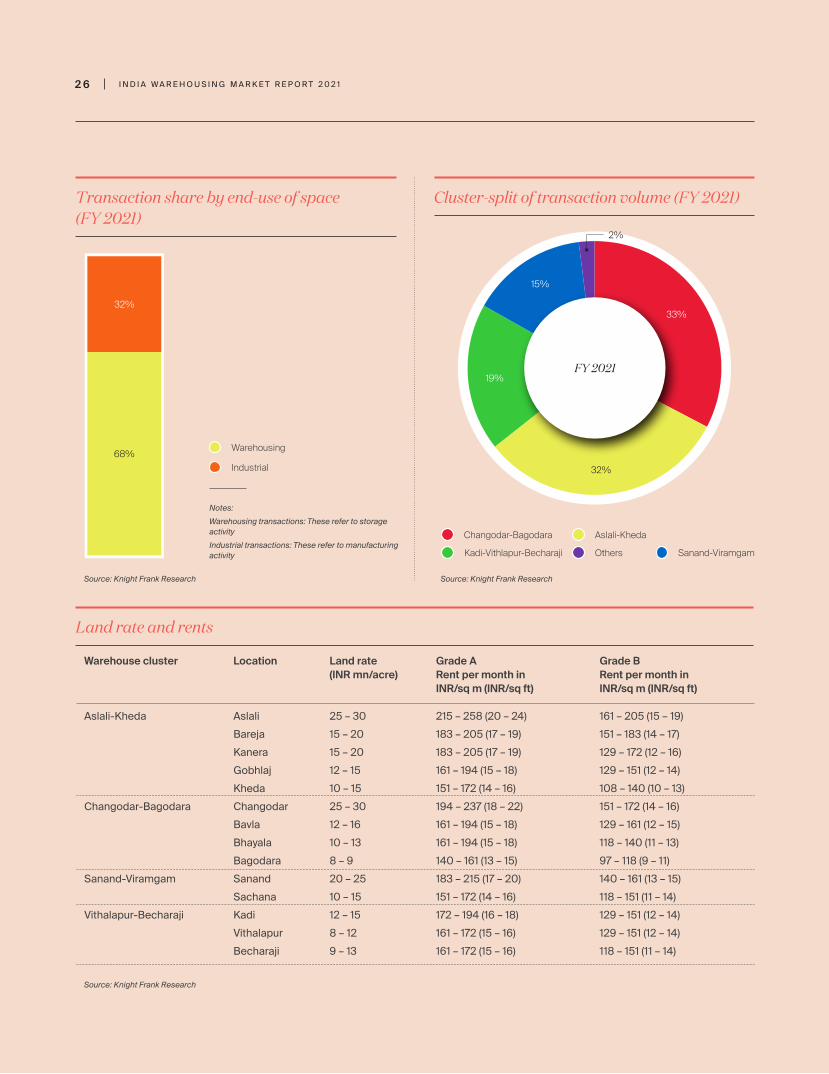
Source: Knight Frank Research
Warehousing market transaction volume Cluster-split of transaction volume (FY 2021)
Land rate and rents
Warehouse cluster Location Land rate Grade A Grade B (INR mn/acre) Rent per month in Rent per month in INR/sq m (INR/sq ft) INR/sq m (INR/sq ft)
Aslali-Kheda Aslali 25 – 30 215 – 258 (20 – 24) 161 – 205 (15 – 19) Bareja 15 – 20 183 – 205 (17 – 19) 151 – 183 (14 – 17) Kanera 15 – 20 183 – 205 (17 – 19) 129 – 172 (12 – 16) Gobhlaj 12 – 15 161 – 194 (15 – 18) 129 – 151 (12 – 14) Kheda 10 – 15 151 – 172 (14 – 16) 108 – 140 (10 – 13)Changodar-Bagodara Changodar 25 – 30 194 – 237 (18 – 22) 151 – 172 (14 – 16) Bavla 12 – 16 161 – 194 (15 – 18) 129 – 161 (12 – 15) Bhayala 10 – 13 161 – 194 (15 – 18) 118 – 140 (11 – 13) Bagodara 8 – 9 140 – 161 (13 – 15) 97 – 118 (9 – 11)Sanand-Viramgam Sanand 20 – 25 183 – 215 (17 – 20) 140 – 161 (13 – 15) Sachana 10 – 15 151 – 172 (14 – 16) 118 – 151 (11 – 14)Vithalapur-Becharaji Kadi 12 – 15 172 – 194 (16 – 18) 129 – 151 (12 – 14) Vithalapur 8 – 12 161 – 172 (15 – 16) 129 – 151 (12 – 14) Becharaji 9 – 13 161 – 172 (15 – 16) 118 – 151 (11 – 14)
Source: Knight Frank Research
Mn
sq m
Select warehouse projects
Warehouse project Warehouse cluster
Prime Indraprasth Industrial Aslali-Khedaand Logistics Hub Anmol Laxmi Industrial and Aslali-KhedaLogistics ParkIndospace Changodar-BagodaraGallops Industrial Park Changodar-BagodaraCrystal Indus Industrial and Changodar-BagodaraLogistics ParkAshwika Warehousing Changodar-BagodaraMascot Industrial Park Chhatral-Kadi-Vithalapur- BecharajiKamla Amrut Indi-Tech Park Chhatral-Kadi-Vithalapur- Becharaji
Source: Knight Frank Research
Major infrastructure in Ahmedabad
Name Type
Delhi-Mumbai Industrial ManufacturingCorridor (DMIC) corridorWestern Dedicated Freight Railway Corridor (DFC) National Expressway-1 Road infrastructureAhmedabad-Rajkot National Road InfrastructureHighway (NH-8A) Ahmedabad-Sanand-Viramgam Road InfrastructureState Highway (SH 17) SP Ring Road Road InfrastructureMandar Bechraji Special Industrial hubInvestment Region (SIR) GIFT City Mega townshipDholera Special Investment Region (SIR) Industrial hub
Source: Knight Frank Research | Note: NH stands for National Highway
Select large occupiers
Occupier Occupier industry Warehouse cluster
Johnson Other sectors Chhatral-Kadi-Controls-Hitachi Vitthalapur-BecharajiAir Conditioning Amazon E-commerce Changodar- Bagodara Flipkart E-commerce Aslali-KhedaAmber Group India Other sectors Sanand-ViramgamHaier FMCD Aslali-Kheda ZF India Other sectors Chhatral-Kadi- Vitthalapur-Becharaji
Source: Knight Frank Research
Source: Knight Frank Research
Changodar-Bagodara
Kadi-Vithlapur-Becharaji
Aslali-Kheda
FY 2018 FY 2019 FY 2020
0.1
0.2
0.3
0.4
0.5
FY 2021
0.32
0.48
0.27
0.46
FY 2021
2%
Industry-split of transaction volume (FY 2021)
Source: Knight Frank Research
FMCG
3PL
E-commerce
Other Sectors
FMCD
Notes:
Warehousing transactions data includes light manufacturing/ assembling.
Other Sectors – These include all manufacturing sectors (automobile, electronics, pharmaceutical, etc.) excluding FMCG and FMCD.
Miscellaneous – These include services such as telecom, real estate, document management, agricultural warehousing and publishing.
Transaction share by end-use of space (FY 2021)
Source: Knight Frank Research
Notes:
Warehousing transactions: These refer to storage activity
Industrial transactions: These refer to manufacturing activity
Warehousing
Industrial
33%
32%
19%
15%
Sanand-Viramgam Others
0.6
68%
32%
25%
23%
23%
21%
7%2%
Retail
I N D I A W A R E H O U S I N G M A R K E T R E P O R T 2 0 2 12 5 I N D I A W A R E H O U S I N G M A R K E T R E P O R T 2 0 2 12 6

• The Ambala-Rajpura warehousing market comprises the Punjab-Haryana border or the Shambhu barrier along with the Grand Trunk Road, Banur-Tepla Road and Zirakpur. Particularly, Shambhu Barrier has been of historical significance in the Patiala district as it has been a key de-consolidation location for part truck load capacity in north India. The Ambala-Rajpura warehousing market is dotted with many unorganized warehousing facilities and encompasses several locations in Punjab and Haryana in a triangle catering to many Tier II cities in northern India. A few regional players have set up Grade A warehouses in this belt as they realize the potential of this warehousing market to serve multiple cities in Punjab, Himachal Pradesh and Jammu & Kashmir.
• The availability of large land parcels compared to some of the neighboring states has also made Rajpura a much sought-after market for establishing warehousing footprint. The fact that many national players are increasingly setting footprint in this zone bears testament to its strategic importance. Rajpura has earned the moniker of 'Gateway to Punjab' as it is situated at the junction of National Highway 44 (NH 44 or old NH 1) which connects New Delhi to Attari in Punjab and NH 7 (Old NH 64) which runs from Chandigarh to Dabwali. Together with Ambala, it provides good road and rail connectivity to cater to at least six to seven cities in North India. While Jammu & Kashmir is accessible within 6-7 hours via road, other cities such as Ludhiana, Jalandhar, Chandigarh, Shimla and Delhi are only 1-4 hours away, making Rajpura a focal point for distribution of goods and services.
• Rajpura has always been an industrial town where a lot of small-scale industries are concentrated. It is also one of the top grain markets in Asia (besides Khanna) for grains from Punjab. Rajpura is situated within 40 kms of Chandigarh, the capital of Punjab and is home to various large-scale industries such as Hindustan Unilever, AMTEK Group, Bunge India Private Limited, Seil Chemicals Limited etc.
• Significant warehousing demand in the Ambala-Rajpura market comes from these industries. Due to its proximity to the tri-city (Chandigarh-Mohali-Panchkula), several industrial real estate and logistics park developers are launching parks in this region to boost their Grade A warehousing portfolio near NH-44 and NH-7, which are well-connected to the industrial clusters of IMT Manesar, Dharuhera and Bhiwadi. A growth of Grade A warehousing infrastructure in this cluster will support modernization of the supply chain and attract occupiers from sectors such as e-commerce in future.
A M B A L A - R A J P U R AW A R E H O U S I N G M A R K E T
• Warehousing activities in this market are largely concentrated in two prominent peripheral belts – Banur-Tepla cluster and NH-44 Rajpura cluster. Both are equally sought after for organized warehousing as the market has largely been dominated by local players providing Grade B facilities. The scope for Grade A warehousing facilities to come up is huge and is crucial to attract significant leasing by occupiers.
• In FY 2021, the Ambala-Rajpura market accounted for nearly 0.11 mn sq m (1.2 mn sq ft) warehousing leasing, a 47% YoY decline over FY 2020. Almost all the warehouse space leased was in the Banur-Tepla cluster. The Banur-Tepla Road is a major thoroughfare in this market providing further connectivity to Zirakpur and other markets via the Ambala Bypass Road, making it a cynosure for the eyes of occupiers.
• Of the total warehouse space leased in FY 2021, 3PL accounted for 69% while the remainder was occupied by fast moving consumer durables (FMCD) sector. The Covid-19 led disruptions are proving to be beneficial for Tier II warehousing clusters as growing urbanization has resulted in customers demanding faster and timely order fulfilments. In populous urban locations, the e-commerce sector penetration is also rapidly increasing which is contributing to a transformation of the delivery model.
• There are also plans by the state government to set up a Global Manufacturing and Knowledge Park / Integrated Manufacturing Cluster (IMC) at Rajpura under the 'Invest Punjab' initiative in an area of 1,000 acres under the Amritsar-Kolkata Industrial Corridor (AKIC). This upcoming mixed-use development is called QuarkCity and will be situated along the Grand Trunk Road. This is likely to add to the Ambala-Rajpura warehousing market's attractiveness across various sectors such as manufacturing, food processing, furniture and warehousing.
• Rents have largely remained stable due to the lower threshold and limited stock availability which also limited decline on quoted rates. However, interested occupiers have been negotiating for better contractual terms post the pandemic outbreak.
Major warehousing locations in Ambala-Rajpura Warehousing cluster
Warehousing cluster Major warehousing locations
Banur-Tepla cluster Banur, Banur-Tepla Road, Shambhu Barrier and all locations along Ambala-Bypass Road
NH 44 Rajpura cluster Locations along the Grand Trunk Road (GT Road) from Mohra to Rajpura and Zirakpur
Classification of warehousing locations into major clusters
Source: Knight Frank Research
Source: Knight Frank Research | Map is for representation and not to scale
7
7
44
205A
BANUR-TEPLA CLUSTER
NH 44 – RAJPURA CLUSTER
BUDHANPUR
152
RAJGARH
RAJPURA
RAMGARH
GOBINDPURA
KALO MAJRA
TEPLA
I N D I A W A R E H O U S I N G M A R K E T R E P O R T 2 0 2 12 7 I N D I A W A R E H O U S I N G M A R K E T R E P O R T 2 0 2 12 8

Cluster-split of transaction volume (FY 2021)
Land rate and rents
Warehouse cluster Land rate Grade A Grade B (INR mn/acre) Rent per month in Rent per month in INR/sq m (INR/sq ft) INR/sq m (INR/sq ft)
Banur-Tepla cluster 7 – 10 151-183 (14–17) 108-129 (10–12)
NH 44-Rajpura cluster 7 - 10 151-183 (14–17) 108-129 (10–12)
Source: Knight Frank Research
Source: Knight Frank Research
Banur-Tepla cluster
Transaction share by end-use of space (FY 2021)
Source: Knight Frank Research
Notes:
Warehousing transactions: These refer to storage activity
Industrial transactions: These refer to manufacturing activity
Warehousing
Industrial
100%
FY 2021
100%
Industry-split of transaction volume (FY 2021)
Source: Knight Frank Research
3PL
FMCD
Notes:
Warehousing transactions' data includes light manufacturing/ assembling.
Other Sectors – These include all manufacturing sectors (automobile, electronics, pharmaceutical, etc.) excluding FMCG and FMCD.
Miscellaneous – These include services such as telecom, real estate, document management, agricultural warehousing and publishing.
Major infrastructure in Rajpura
Name Type
NH 44 (Old NH 1) Road - NH
NH 7 (Old NH 64) Road - NH
Source: Knight Frank Research | Note: NH stands for National Highway
Source: Knight Frank Research
Warehousing market transaction volume
Mn
sq m
FY 2019 FY 2020
0.05
0.10
0.15
0.20
0.25
FY 2021
0.20
0.17
0.11
69%
31%
Select warehouse projects
Warehouse project Warehouse cluster
Indoswift NH 44-Rajpura cluster
Contract Logistics Banur-Tepla cluster
Source: Knight Frank Research
Select large occupiers
Occupier Occupier industry Warehouse cluster
Godrej FMCD Banur-Tepla cluster
DHL 3PL Banur-Tepla cluster
Mahindra 3PL Banur-Tepla clusterLogistics
Havells FMCD Banur-Tepla cluster
Usha FMCD Banur-Tepla cluster
Source: Knight Frank Research
I N D I A W A R E H O U S I N G M A R K E T R E P O R T 2 0 2 12 9 I N D I A W A R E H O U S I N G M A R K E T R E P O R T 2 0 2 13 0

• Bengaluru's warehousing market has remained resilient in the face of challenges thrown at it by the pandemic in FY 2021 due to strong occupier interest on the back of consumption led demand from this vast metropolis. Spurred on by the large-scale supply side augmentation since the Goods and Services Tax (GST) rollout, its key warehousing clusters - Nelamangala-Dabaspete cluster in the city's north-west and the Hoskote-Narsapura cluster in the east - have become a cynosure in the eyes of occupiers in the 3PL and e-commerce sectors. In FY 2021, Bengaluru sustained a warehousing transaction volume of 0.40 mn sq m (4.3 mn sq ft), which is at par with FY 2020. In a challenging year, this is a very robust performance, underscoring the strong fundamentals of the city's organized warehousing landscape.
• A strong consumer base coupled with government measures in the form of GST had already facilitated a steady infusion of Grade A industrial and warehousing parks in the Bengaluru Metropolitan Region (BMR) in the past few years, facilitating occupiers to establish footprint in its peripherals. Its key manufacturing hubs next to the National Highway 4 (NH-4), that provides port connectivity via Mumbai and Chennai, are much sought after warehousing belts in the region today. Additionally, the southern belt of Attibele-Bommasandra is also an emerging warehousing location to cater to the nearby Tier II and III towns.
• In FY 2021, the Attibele-Bommasandra cluster and Hoskote-Narsapura cluster clocked in 29% and 28% share of the overall warehouse space leased, respectively. The share of Nelamangala-Dabaspete cluster was 15% in this period, whereas in FY 2020, it had accounted for 32% of the overall volume. Other locations such as Bidadi, Soukya Road and Malur also witnessed cumulative warehouse space take-up of 28%.
• After the GST implementation, supply chains were being consolidated to reduce logistics costs. The Covid-19 pandemic caused a severe disruption in this process. As a result, many occupiers with surplus warehouse space, who could not undertake the planned expansion of their inventory, are exploring opportunities to sublease unutilized space or renegotiate with their warehouse space providers for better contractual terms.
• In FY 2021, other sectors accounted for 43% of the total warehousing space consumed in Bengaluru as some select occupiers leased large sized facilities. While the Covid-19
B E N G A L U R UW A R E H O U S I N G M A R K E T
pandemic led to a boost in sales of consumer goods via e-commerce platforms, 3PL benefitted from this ongoing scenario as consumption has been on the rise since the first quarter of FY 2021. 3PL accounted for a 27% share of the total space leased. This is largely attributed to a sudden surge in the need for extra storage/warehousing space by many occupiers during the first wave, as closure of state boundaries required additional facility arrangements for last mile deliveries, something which proved advantageous for 3PL companies to expand and cater to this new demand wave. E-commerce accounted for 22% share; however, it is evident that the real pent-up demand from e-commerce giants is yet to translate into new warehousing space take-up once decision making is fast tracked. Retail and FMCG accounted for 5% and 4% of the space consumed respectively.
• In the past few years, developers have been successful in creating large institutional grade warehousing facilities in Bengaluru's prominent clusters. Buoyed by the large-scale demand for Grade A warehouses, many regional players have also intensified efforts to build new and modern facilities.
• Bengaluru's warehousing market was in a state of large-scale consolidation when the Covid-19 pandemic struck. During the pandemic, many online-only brands have emerged which will require warehouse space. The second wave of the pandemic has further strengthened the need for Grade A warehousing from such brands and we expect it to fast track decision making by e-commerce giants. Additional warehouse requirements may also continue to come up from electronics, FMCG and FMCD companies. We expect that the demand for Grade A warehousing will only increase at a healthy rate and may outpace the existing supply.
• In the next 12-18 months, warehouse space demand will continue to be dominated by the 3PL, e-commerce and retail sectors. Land availability for new developments and investor participation will remain key for augmenting the existing supply of new industrial park ventures.
Major warehousing locations in Bengaluru Warehousing cluster
Warehousing cluster Major warehousing locations
Nelamangala-Dabaspete cluster Nelamangala, T Begur, Govenahalli, Dabaspete
Hoskote-Narsapura cluster Hoskote, Nidagatta, Thavarekere, Narsapura
Attibele-Bommasandra cluster Attibele, Bommasandra, Attibele-Anekal Road
Others Soukya Road, Bidadi, Malur
Classification of warehousing locations into major clusters
Source: Knight Frank Research
Source: Knight Frank Research | Map is for representation and not to scale
HOSKOTE-NARSAPURA
NELAMNGALA-DABASPETE
ATTIBELE-BOMMASANDRA
I N D I A W A R E H O U S I N G M A R K E T R E P O R T 2 0 2 13 1 I N D I A W A R E H O U S I N G M A R K E T R E P O R T 2 0 2 13 2

Cluster-split of transaction volume (FY 2021)
Land rate and rents
Warehouse cluster Location Land rate Grade A Grade B (INR mn/acre) Rent per month in Rent per month in INR/sq m (INR/sq ft) INR/sq m (INR/sq ft)
Nelamangala- Nelamangala 18 – 30 194 – 237 (18 – 22) 151 – 183 (14 – 17)Dabaspete cluster
Dabaspete 16 – 22 172 – 215 (16 – 20) 129 – 172 (12 – 16)
Hoskote-Narsapura Hoskote 18 – 30 215 – 258 (20 – 24) 172 – 226 (16 – 21)cluster
Narsapura 13 – 16 204 – 237 (19 – 22) 161 – 205 (15 – 19)
Attibele- Bommasandra-Jigani No Large land 269 – 323 (25 – 30) 226 – 258 (21 – 24)Bommasandra Cluster parcels available
Attibele-Anekal Road 20 – 30 215 – 258 (20 – 24) 183 – 215 (17 – 20)
Others Malur 14 – 18 204 – 237 (19 – 22) 161 – 205 (15 – 19)
Soukya Road 25 – 40 258 – 280 (24 – 26) 205 – 248 (19 – 23)
Bidadi 22 – 35 205 – 258 (19 – 24) 161 – 215 (15 – 20)
Source: Knight Frank Research
Select warehouse projects
Warehouse project Warehouse cluster
IndoSpace Nelamangala-Dabaspete
Bommasandra
Hoskote–Narsapura
Embassy Industrial Parks Shoolagiri-Hosur Road
Source: Knight Frank Research
Major infrastructure in Bengaluru
Name Type
Peripheral Ring Road Road
NH 48/ Mumbai-Bengaluru Highway Road - NH
NH 75 / Bengaluru-Tirupati Highway Road - NH
NH 648 / Nelamangala-Hosur Road Road - NH
NH 44 / Bengaluru-Hosur Road Road - NH
Electronic City Elevated Expressway Tolled Expressway
Nandi Infrastructure Corridor Enterprises Road (NICE Road) or Bengaluru-Mysuru Infrastructure Corridor (BMIC) Tolled Expressway
Chennai-Bengaluru Industrial Corridor Industrial Corridor
Bengaluru-Mumbai Economic Corridor Industrial Corridor
Kochi-Bengaluru Industrial Corridor Industrial Corridor
Source: Knight Frank Research | Note: NH stands for National Highway
Source: Knight Frank Research
Attibele-Bommasandra Cluster
Nelamangala-Dabaspete Cluster
Hoskote-Narsapura Cluster
Industry-split of transaction volume (FY 2021)
Source: Knight Frank Research
Retail
3PL
E-commerce
Other Sectors
FMCG
Notes:
Warehousing transactions' data includes light manufacturing/ assembling
Other Sectors – These include all manufacturing sectors (automobile, electronics, pharmaceutical, etc.) excluding FMCG and FMCD.
Miscellaneous – These include services such as telecom, real estate, document management, agricultural warehousing and publishing.
Transaction share by end-use of space (FY 2021)
Source: Knight Frank Research
Notes:
Warehousing transactions: These refer to storage activity
Industrial transactions: These refer to manufacturing activity
Warehousing
Industrial
75%
Select large occupiers
Occupier Occupier industry Warehouse cluster
Ecom Express 3PL Hoskote-Narsapura cluster
First Cry E-commerce Hoskote-Narsapura cluster
DHL 3PL Attibele-Bommasandra cluster
Rhenus 3PL Nelamangala–Dabaspete Logistics cluster
Flextronics Other Sectors Others
Source: Knight Frank Research
Others
FY 2021
15%
29%
28%
28%25%
4%5%
22%
27%
43%
Source: Knight Frank Research
Warehousing market transaction volume
Mn
sq m
FY 2018 FY 2019 FY 2020
0.10
0.20
0.30
0.40
0.50
0.60
FY 2021
0.23
0.40
0.52
0.40
I N D I A W A R E H O U S I N G M A R K E T R E P O R T 2 0 2 13 3 I N D I A W A R E H O U S I N G M A R K E T R E P O R T 2 0 2 13 4

• Bhubaneswar is the capital of Odisha and a key trading and commercial hub in eastern India. Odisha has a large concentration of steel and aluminum plants due to which a lot of ancillary industries have also come up in different parts of the state. A presence of large industrial hubs and the cargo and container handling activities at Dhamra and Paradip ports augurs well for organised warehousing, making Bhubaneswar an up and coming warehousing market.
• Bhubaneswar is not only a key Tier II city, but also an active Tier II warehousing market due to its connectivity to major national highways. It is well connected to Cuttack and other nearby towns. The erstwhile industrial areas established by the Department of Industries, such as Rasulgarh, Mancheswar, Chandaka and Bhagabanpur, are now witnessing organised warehousing clusters developing in the vicinity. Chandaka and Mancheswar in particular, are becoming popular amongst warehouse occupiers. Nakhara, Rudrapur, Khurda, Pitpali and Pahal are some other locations gaining traction amongst occupiers.
• While warehousing remains a fragmented activity with dominance of local players having Grade B spaces, in recent years, organised warehousing act iv i ty has started mushrooming which will strengthen the warehousing infrastructure in the city and attract occupiers. Warehousing space enquiries in Bhubaneswar is largely driven by sectors such as e-commerce, 3PL, FMCG and FMCD. In the last few years, companies such as Amazon, Delhivery, Godrej and Dabur have leased warehouse space in Bhubaneswar.
• The warehousing clusters in Bhubaneswar include Bhubaneswar-Cuttack Road (NH-16 Cluster), Tangi, Pitapally and Chandaka. Currently, the warehousing market in the city is in a nascent stage and it is largely dominated by local players. Grade A warehouse space supply is very limited and national level players are yet to make a foray in this market, though a couple of big industrial parks, catering to planned storage solutions such as Grade A warehouses, cold storage, open air storage and container yards, have been established in the past which offer built-to-suit facilities. These industrial parks are aimed at improving the logistics processes in the state and also help in reducing warehousing costs which should encourage more institutional participation.
B H U B A N E S W A RW A R E H O U S I N G M A R K E T
• In FY 2021, 0.01 mn sq m (0.1 mn sq ft) of warehousing space was leased in Bhubaneswar. Of the total leased space, 63% was consumed by 3PL, followed by FMCD (29%), other sectors (6%) and E-commerce at 2% share. The total transaction volume in FY 2021 is 73% lower than the volumes witnessed in FY 2020. This decline is largely attributed to the disturbances caused due to the Covid-19 pandemic which led to delayed decision making and new space take-up in this emerging Tier II market.
• More than 50% of warehousing space was leased in the Tangi cluster, while Pitapally accounted for 30%. Bhubaneswar-Cuttack Road (NH-16 Cluster) clocked in 17% of the total volume.
Major warehousing locations in Bhubaneswar Warehousing cluster
Warehousing cluster Major warehousing locations
Bhubaneswar-Cuttack Road (NH 16 Cluster) Rudrapur, Mancheswar, Nakhara, Pahala, Phulnakhara
Tangi Tangi, Mongoli
Pitapally Khurda, Off Khandagari
Chandaka Kantabada, Barang area
Classification of warehousing locations into major clusters
Source: Knight Frank Research
Source: Knight Frank Research | Map is for representation and not to scale
16
16
16
57
316
316
316
TANGI
JANKAI
MOTARI
JATNI
SAKHIGOPAL
BHUBANESWAR
NAGAPUR
NIMAPADA
UTTARA
URALI
BHUSANDAPUR
NIRAKARPUR
TARABOI
DELANG
KHORDHA
SANAGADA
BAGHAMARI
SANKATARAS
PITAPALLY
CHANDAKA
16
BHUBANESWAR-CUTTACK ROAD (NH-16 CLUSTER)
TANGI
I N D I A W A R E H O U S I N G M A R K E T R E P O R T 2 0 2 13 5 I N D I A W A R E H O U S I N G M A R K E T R E P O R T 2 0 2 13 6

• The Chennai warehousing market recorded a marginal 4% year-on-year (YoY) improvement in absorption in FY 2021. A total of 0.3 mn sq m (3.5 mn sq ft) of warehouse leasing activity was recorded during the year. This growth in demand during COVID-induced challenging times is indicative of a strong base of the warehousing market in Chennai.
• Chennai's sea-side location is the reason for its evolution as a flourishing trade centre since the British era. The city is the first major halt on the east coast of India in the Bay of Bengal and has two major ports – Chennai Port (second largest container port of India) and Ennore Port. In recent times, other ports like the new Kattupalli Port are helping expand the trade base of Chennai.
• Proximity to sea has made Chennai a favourable base for heavy industries. The city is the home ground of the automobile industry in India. Textile and manufacturing for heavy industries are other prominent trades carried out here. These three activities have been and continue to be the driver industries for Chennai's industrial and warehousing market. E-commerce and retail players have been a recent addition to this list of warehousing demand drivers in Chennai.
• Warehousing activity in Chennai is largely concentrated in three clusters – one expanding over the south-west and to the west of the city, the second stretching across the northern belt of the city and the third spread across the south of the city. Warehousing locations between the Grand Southern Trunk Road (GST Road / Chennai – Trichi Highway) in the south and the Poonamallee High Road (Mumbai Highway) in the west form the Sriperumbudur – Oragadam cluster. This cluster also includes the Mannur – Thiruvallur Belt covering Mevalurkuppam, Mappedu, Mannur, Pollivakkam and Thiruvallur. Known for manufacturing, this particular cluster is the primary base of auto and auto ancillary industries. Northern locations around the Grand Northern Trunk Road (GNT Road / Chennai – Srikakulam Highway / NH 16 or the old NH 5) constitute the NH 16 / GNT Road – Periyapalayam cluster (North Chennai). This cluster conventionally has served an industrial belt and has recently drawn the interest of e-commerce players, FMCG sector companies and major 3PL players, especially in the NH 16 / GNT Road – Redhills Belt. Warehousing locations in the south-eastern part of Chennai such as Maraimalai Nagar, Sengundram Industrial area and Chengalpattu constitute the GST Road – Maraimalai Nagar cluster. This cluster caters to the spillover demand from the Sriperumbudur – Orgadam cluster as well as to the new industrial demand in the city.
C H E N N A IW A R E H O U S I N G M A R K E T
• On the industry front, 3PL players were the primary driver of warehousing demand in Chennai with a demand share of 33% in the total transactions pie in FY 2021. The Other Sectors (which include all manufacturing companies excluding FMCG and FMCD) stood second with a 32% demand share followed by the FMCD category at 20% and the e-commerce sector at 11%.
• In terms of geography, demand continued to remain concentrated in the Sriperumbudur – Oragadam cluster which accounted for 57% of the total FY 2021 transactions. Besides its manufacturing base, this cluster also witnessed increased demand from e-commerce and 3PL players in FY 2021. The demand share of the GST Road – Maraimalai Nagar cluster jumped from 7% in FY 2020 to 13% in FY 2021 on account of one large transaction of 0.03 mn sq m (0.3 mn sq ft).
• Land rates have appreciated across micro markets while rentals have remained more or less stable. The built-to suit warehouse rentals have witnessed a marginal appreciation during this period.
Source: Knight Frank Research
Warehousing market transaction volume
Mn
sq m
Select warehouse projects
Warehouse project Warehouse cluster
Kingston Logistics Park Others (Choudwar)
TVS Industrial & Logistics Park Chandaka
Source: Knight Frank Research
Major infrastructure in Bhubaneswar
Name Type
NH 16/Bhubaneswar-Cuttack Highway Road - NH
NH 316/Bhubaneswar-Puri Road - NH
Source: Knight Frank Research | Note: NH stands for National Highway
Select large occupiers
Occupier Occupier industry Warehouse cluster
Samsung FMCD Bhubaneswar-Cuttack Road (National Highway 16) cluster
Kubota Other Sectors Tangi
KD Logistics 3PL Bhubaneswar-Cuttack Road (National Highway 16) cluster
Source: Knight Frank Research
FY 2019 FY 2020
0.01
0.02
0.03
0.04
0.05
FY 2021
0.01
0.05
Notes:
Warehousing transactions: These refer to storage activity
Industrial transactions: These refer to manufacturing activity
Warehousing
Industrial
0.05
Source: Knight Frank Research
Notes:
Warehousing transactions' data includes light manufacturing/ assembling.
Other Sectors – These include all manufacturing sectors (automobile, electronics, pharmaceutical, etc.) excluding FMCG and FMCD.
Miscellaneous – These include services such as telecom, real estate, document management, agricultural warehousing and publishing.
Other Sectors
3PL
FMCD
E-commerce
Source: Knight Frank Research
Tangi
Pitapally
Bhubaneswar-Cuttack Road (NH 16) Cluster
FY 2021 53%
17%
30%
Industry-split of transaction volume (FY 2021)
Transaction share by end-use of space (FY 2021)
Cluster-split of transaction volume (FY 2021)
63%
29%
6%2%
Source: Knight Frank Research
100%
I N D I A W A R E H O U S I N G M A R K E T R E P O R T 2 0 2 13 7 I N D I A W A R E H O U S I N G M A R K E T R E P O R T 2 0 2 13 8

Major warehousing locations in Chennai Warehousing cluster
Warehousing cluster Major warehousing locations
Sriperumbudur Oragadam cluster Irrungattukottai, Sriperumbudur, Oragadam and other locations on the in-roads– branching from Sriperumbudur Mannur–Thiruvallur Belt: Includes Mevalurkuppam, Mappedu, Mannur, Pollivakkam and Thiruvallur
NH 16 / GNT Road Periyapalayam cluster Periyapalayam Road, Thatchoor, Gummudipoondi. –(North Chennai) NH 16 / GNT Road–Redhills Belt: Includes Madhavaram, Manali, Red Hills, Puzhal, Karanodai, Alamathi and Poochettipedu
GST Road Maraimalai Nagar cluster Maraimalai Nagar, in and around Mahindra World City, Sengundram Industrial– area, Chengalpattu
Classification of warehousing locations into major clusters
Source: Knight Frank Research
Source: Knight Frank Research | Map is for representation and not to scale
MARAIMALAI NAGAR
GOKULAPURAM
MAHINDRA WORLD CITY
I N D I A W A R E H O U S I N G M A R K E T R E P O R T 2 0 2 13 9 I N D I A W A R E H O U S I N G M A R K E T R E P O R T 2 0 2 14 0
Select warehouse projects
Warehouse project Warehouse cluster
Ascendas–Firstspace NH 16–Periyapalayam
Sriperumbudur–Oragadam
ESR Sriperumbudur–Oragadam
NDR Logistics NH 16–Periyapalayam: NH 16 / GNT Road–Redhills Belt
Sriperumbudur–Oragadam
Indospace NH 16–Periyapalayam
Sriperumbudur–Oragadam: Mannur–Thiruvallur Belt
CCI Sriperumbudur–Oragadam: Mannur–Thiruvallur Belt
LOGOS Sriperumbudur–Oragadam: Mannur–Thiruvallur Belt
Hiranandani Park Sriperumbudur–Oragadam
TVS Sriperumbudur–Oragadam
NH 16–Periyapalayam: NH 16 / GNT Road–Redhills Belt
Major infrastructure in Chennai
Name Type
Chennai Port Port
Ennore Port Port
NH 16 / Grand Northern Trunk Road Road–NH
NH 32 / East Coast Road Road–NH
NH 45 / Grand Southern Trunk Road Road–NH
NH 48 / Poonamallee High Road Road–NH
NH 716 / Chennai–Thiruvallur High Road Road–NH
Chennai–Bengaluru Industrial Corridor Industrial Corridor
Visakhapatnam Chennai Industrial Corridor Industrial Corridor
Tamil Nadu Defence Industrial Corridor Industrial Corridor
Chennai MMLP MMLP
Chennai International Airport Airport
Source: Knight Frank ResearchNote: NH stands for National Highway, MMLP stands for Multi-modal Logistics Park
Industry-split of transaction volume (FY 2021)
Source: Knight Frank Research
Notes:
Warehousing transactions data includes light manufacturing/ assembling.
Other Sectors – These include all manufacturing sectors (automobile, electronics, pharmaceutical, etc) excluding FMCG and FMCD.
Miscellaneous – These include services such as telecom, real estate, document management, agricultural warehousing and publishing.
Source: Knight Frank Research
Source: Knight Frank Research
Warehousing market transaction volume
Mn
sq m
FY 2018 FY 2019 FY 2020
0.05
0.1
0.15
0.2
0.25
0.3
0.35
FY 2021
0.30 0.
32 0.33
0.39
0.4
0.45
33%
32%
20%
11% 2%1%
3PL
FMCD
Other Sectors Miscellaneous
E-commerce
Retail
Select large occupiers
Occupier Occupier industry Warehouse cluster
Foxlink Other Sectors Sriperumbudur– OragadamMagic Woods FMCD Maraimalai NagarAmazon E-commerce NH 16–Periyapalayam: Redhills BeltReliance E-commerce Sriperumbudur–Groceries OragadamMahindra 3PL Sriperumbudur–Logistics OragadamFlipkart E-commerce NH 16–Periyapalayam: Redhills BeltTVS Logistics 3PL Sriperumbudur– OragadamSamsung Warehousing NH 16–PeriyapalayamBig Basket 3PL Sriperumbudur– Oragadam
Source: Knight Frank Research

Cluster-split of transaction volume (FY 2021)
Land rate and rents
Warehouse cluster Location Land rate Grade A Grade B (INR mn/acre) Rent per month in Rent per month in INR/sq m (INR/sq ft) INR/sq m (INR/sq ft)
Sriperumbudur– Sriperumbudur 20 – 25 215 – 258 (20 – 24) 172 – 194 (16 – 18)Oragadam cluster Oragadam 20 – 30 237 – 280 (22 – 26) 215 – 237 (20 – 22) Mappedu 10 – 15 172 – 205 (16 – 19) 161 – 172 (15 – 16) Mannur 17 – 23 194 – 215 (18 – 20) 172 – 183 (16 – 17) Irungattukottai 40 – 45 194 – 247 (18 – 23) 194 – 205 (18 – 19) Pollivakkam 13 – 15 183 – 237 (17 – 20) 172 – 183 (16 – 17)
NH 16 / GNT Road– Cholavaram 11 – 13 161 – 194 (15 – 18) 151 – 172 (14 – 16)Periyapalayam cluster Red Hills 12 – 16 172 – 194 (16 – 18) 151 – 161 (14 – 15)(North Chennai) Karanodai 15 – 22 161 – 183 (15 – 17) 140 – 151 (13 – 14) Madhavaram No large lands available 215 – 258 (20 – 24) 194 – 237 (18 – 22) Puzhal No large lands available 215 – 258 (20 – 24) 194 – 215 (18 – 20) Periyapalayam 10 – 15 172 – 194 (16 – 18) 151 – 172 (14 – 16)
GST Road-Maraimalai In and aroundNagar cluster Mahindra World City 25 – 35 215 – 280 (24 – 26) 215 – 258 (20 – 24) Maraimalai Nagar 40 – 45 237 – 280 (22 – 26) 215 – 237 (20 – 22)
Source: Knight Frank Research
Source: Knight Frank Research
NH 16 / GNT Road–Periyapalayam cluster (North Chennai)
GST Road - Maraimalai Nagar cluster
FY 202157%30%
13%
Transaction share by end-use of space (FY 2021)
Source: Knight Frank Research
Notes:
Warehousing transactions: These refer to storage activity
Industrial transactions: These refer to manufacturing activity
Warehousing
Industrial
77%
23%
I N D I A W A R E H O U S I N G M A R K E T R E P O R T 2 0 2 14 1 I N D I A W A R E H O U S I N G M A R K E T R E P O R T 2 0 2 14 2
Sriperumbudur–Oragadam cluster
• The Coimbatore industrial and warehousing market recorded 0.1 mn sq m (1.2 mn sq ft) of space absorption in FY 2021, a 31% YoY growth. E-commerce sector was the primary driver of this demand.
• Located at the centre of the Southern Peninsula, Coimbatore provides quick access to west and south Tamil Nadu, north Kerala and south Karnataka including Bengaluru. This has incentivised many 3PL companies and e-commerce players to set up warehouses in Coimbatore to cater to a larger base of consumers from a single location.
• The other driver industries for warehousing demand in Coimbatore include the traditional heavy pump manufacturing industries, textile factories and metal casting industries that manufacture spare parts and components.
• Warehousing activity in Coimbatore is concentrated in two main clusters, the Avinashi Road cluster and the Pollachi + Palladam –Cochin Frontier Road cluster. The eastern locations including Neelambur, IOC–L&T Bypass Road and Avinashi have been clubbed into one homogeneous cluster, called the Avinashi Road cluster, and it primarily caters to the industrial needs. Southern locations such as Pollachi, Chettipalayam, Malumichampatty, Palladam and Walayar constitute the Pollachi + Palladam–Cochin Frontier Road warehousing cluster, and it caters to the warehousing requirement of 3PLs, e–commerce players and FMCG / FMCD companies. This cluster gives easy access to the consumption market within Coimbatore city as well as in Kochi from the adjacent state of Kerala.
C O I M B A T O R EW A R E H O U S I N G M A R K E T
• In recent years, with the increase in e-commerce sector activity in the Coimbatore warehousing market, most transaction activity is concentrated in the Pollachi + Palladam – Cochin Frontier Road cluster. In FY 2021, this cluster accounted for 99% of the total transaction activity.
• In terms of the industry orientation of the FY 2021 warehousing demand, 65% of the total transaction activity was accounted for by the e-commerce sector while the demand from 3PLs stood at 10%.
• Driven by the increased warehousing traction, land rates as well as rentals appreciated in select pockets in FY 2021. In the Pollachi + Palladam – Cochin Frontier Road cluster, land rates appreciated across most micro -markets including Coimbatore–Pollachi Road, Malumichampatty, Palladam and Walayar belts. Warehouse rents grew for Grade B warehouses in N e e l a m b u r, I O C – L & T B y p a s s , A v i n a s h i a n d Coimbatore–Pollachi Road belts, whereas Grade A warehouse rentals appreciated mainly in the Coimbatore–Pollachi Road belt.

Major warehousing locations in Coimbatore Warehousing cluster
Warehousing cluster Major warehousing locations
Avinashi Road cluster Neelambur, Aspen SEZ / Karumathampatti, Avinashi, Tiruppur, other locations on Coimbatore–Avinashi Road (NH 544), and Indian Oil Corporation–Larsen & Toubro (IOC–L&T) Bypass Road
Pollachi + Palladam–Cochin Frontier Road cluster Coimbatore–Pollachi Road, Malumichampatty, Chettipalayam, Pappampatti, Palladam, Walayar
Classification of warehousing locations into major clusters
Source: Knight Frank Research
Source: Knight Frank Research | Map is for representation and not to scale
I N D I A W A R E H O U S I N G M A R K E T R E P O R T 2 0 2 14 3 I N D I A W A R E H O U S I N G M A R K E T R E P O R T 2 0 2 14 4
Source: Knight Frank Research.Note: FY 2020 transaction numbers have been revised.
Warehousing market transaction volume
Mn
sq m
Select warehouse projects
Warehouse project Warehouse cluster
TVS Industrial Park – Pollachi + Palladam – Appanaickenpatti Cochin Frontier Road clusterNDR Warehousing – Pollachi + Palladam – Cochin Chettipalayam Frontier Road clusterIndospace Pollachi + Palladam – Cochin Frontier Road clusterNDR Warehousing – Pollachi + Palladam – CochinOthakalmandapam Frontier Road clusterNDR Warehousing – Pollachi + Palladam – CochinEttimadai Frontier Road cluster
Source: Knight Frank Research
Major infrastructure in Coimbatore
Name Type
NH 544 / Salem–Kochi Highway /Avinashi Road Road – NH
NH 948 / Bengaluru Road Road – NH
NH 181 / Mettupalayam Road Road – NH
NH 81 / Trichy Road Road – NH
NH 83 / Pollachi Road Road – NH
Tamil Nadu Defence Industrial Corridor Industrial Corridor
Coimbatore MMLP MMLP
Source: Knight Frank ResearchNote: NH stands for National Highway, MMLP stands for Multi-modal Logistics Park
Select large occupiers
Occupier Occupier industry Warehouse cluster
Amazon E-commerce Pollachi + Palladam – Cochin Frontier Road clusterFlipkart E-commerce Pollachi + Palladam – Cochin Frontier Road clusterStellar Value 3PL Pollachi + Palladam – Chain Cochin Frontier Road clusterBritannia FMCG Pollachi + Palladam – Cochin Frontier Road clusterAlstom Other Sectors Pollachi + Palladam – Cochin Frontier Road cluster
Source: Knight Frank Research
FY 2019 FY 2020
0.02
0.04
0.06
0.08
0.10
0.12
FY 2021
0.08
0.11
0.04
Industry-split of transaction volume (FY 2021)
Source: Knight Frank Research
3PL
FMCG
FMCD
E-commerce
Notes:
Warehousing transactions data includes light manufacturing/ assembling.
Other Sectors – These include all manufacturing sectors (automobile, electronics, pharmaceutical, etc) excluding FMCG and FMCD.
Miscellaneous – These include services such as telecom, real estate, document management, agricultural warehousing and publishing.
1%
65%
Miscellaneous
Other Sectors
13%
10%
8%
3%

• In a short span of time, Guwahati has become one of the most strategic warehousing hubs in north-east India. Being Assam's biggest city and north east India's largest metropolis, it is an important consumption market. With an excellent road infrastructure, Guwahati is well positioned to serve all the eight north-eastern states, which enables it to serve cities like Kolkata, Jalpaiguri, Shillong, Dibrugarh, Imphal and Aizawl.
• Situated on the southern bank of Brahmaputra river, it is one of India's fastest growing cities with the manufacturing sector contributing a substantial share to the local economy. While petroleum manufacturing has been an important economic activity, erstwhile industrial estates in locations such as Bamunimaidam and Kalaphar have small and medium scale enterprises engaged in offset printing, carbon products, furniture, steel fabrication, FMCG and plastics production. From the small industrial estates of the past, organised warehousing has started taking shape as occupiers from diverse sectors sit up and take notice of the city's potential to serve the neighboring Tier II and Tier III consumption markets.
• Guwahati's key warehousing clusters have emerged in the northern city limits, also known as 'North Guwahati'. Locations along the National Highway 27 (NH 27) such as Changsari and Chowki Gate have been on the occupiers' radar for warehouses. Beyond the Saraighat Bridge, many locations have emerged suitable for warehousing activities. This is primarily due to the availability of large land banks for self-use by industrial developers or Build-to-Suit (BTS) construction or land aggregation. Pharmaceutical, FMCG, FMCD and e-commerce occupiers have leased warehouses on this stretch. Parksons Packaging Ltd, Flipkart, FCI Depot, Jerico, ERIS Life Science and Rhino are some of the companies that have warehouse footprint in this cluster.
• A second prominent warehousing cluster has emerged towards the National Highway 17 (NH 17). Palashbari and Azara are two key locations on this stretch which have interested occupiers, although narrow road width and congestion are some of the challenges here. However, proximity to the airport has been instrumental in attracting pharmaceutical companies in this belt. Many pharmaceutical occupiers such as Sun-Pharma Brahmaputra Group and Natco Pharma, have established manufacturing facilities here.
G U W A H A T I W A R E H O U S I N G M A R K E T
• Rampur, too, is an emerging warehousing cluster in Kamrup rural district and the fast track development of industries by the Assam Government and its declaration as an industrial zone is contributing to warehousing space demand pick up too.
• In FY 2021, nearly 0.08 mn sq m (0.9 mn sq ft) of warehousing space was transacted in Guwahati, representing a 14% YoY upswing over FY 2020. Leasing of warehouses has picked up steam in the NH 17 cluster due to easy access to the airport and it accounted for 37% of the total volume. Rampur comprised 35% share while the remaining 28% share was clocked by the NH 27 cluster.
• 3PL sector occupiers dominated the new warehouse leasing with a 44% share followed by FMCG at 31%. Other sectors accounted for 20% share while e-commerce leased 5% of the total warehousing space. Many companies are setting up warehousing presence in regional markets to plan better for Covid-19 like exigencies in future to allow least disruptions for last mile deliveries. Many e-commerce companies who do not have a dedicated fulfilment center in Guwahati are also ensuring market coverage through the support of 3PL players for now.
• Guwahati has always been a pharmaceutical hub and the current Covid-19 pandemic situation provides opportunities for the niche pharmaceutical logistics segment to benefit in this regard. Many new players may emerge in Guwahati to remain nearer to the pharma companies and cater to stockists, retailers, distributors and hospitals in the north-eastern region.
Cluster-split of transaction volume (FY 2021)
Land rate and rents
Warehouse cluster Location Land rate Grade A Grade B (INR mn/acre) Rent per month in Rent per month in INR/sq m (INR/sq ft) INR/sq m (INR/sq ft)
Avinashi Road cluster Neelambur No development of No Grade A 161 – 194 (15 – 18) new warehouses
IOC–L&T Bypass No development of new warehouses No Grade A 151 – 172 (14 – 16)
Aspen SEZ / No development of Karumathampatti new warehouses No Grade A 140 – 161 (13 – 15)
Avinashi No development of new warehouses No Grade A 140 – 172 (13 – 16)
Tiruppur No development of new warehouses No Grade A 140 – 151 (13 – 14)
Pollachi + Palladam Coimbatore–Pollachi Road 12.5 – 15 172 – 215 (16 – 20) 161 – 194 (15 – 18)– Cochin Frontier Malumichampatty 12.5 – 15 172 – 194 (16 – 18) 140 – 161 (13 – 15)Road cluster Palladam 10 – 12.5 172 – 194 (16 – 18) 140 – 151 (13 – 14)
Walayar 10 – 12.5 172 – 194 (16 – 18) 140 – 151 (13 – 14)
Source: Knight Frank Research
Source: Knight Frank Research
Pollachi + Palladam–Cochin Frontier Road cluster
Avinashi Road cluster
FY 2021
99%
1%
Transaction share by end-use of space (FY 2021)
Source: Knight Frank Research
Notes:
Warehousing transactions: These refer to storage activity
Industrial transactions: These refer to manufacturing activity
1%
Warehousing
Industrial
99%
I N D I A W A R E H O U S I N G M A R K E T R E P O R T 2 0 2 14 5 I N D I A W A R E H O U S I N G M A R K E T R E P O R T 2 0 2 14 6

Major warehousing locations in Guwahati Warehousing cluster
Warehousing cluster Major warehousing locations
NH 27 cluster Brahmaputra Industrial Park, Changsari, Madanpur, Kendukona
NH 17 cluster Bongra–Airport, Palashbari, Azara
Rampur cluster Dakshin Rampur, Uttar Rampur, Dakshin Sarubongsor
Classification of warehousing locations into major clusters
Source: Knight Frank Research
Source: Knight Frank Research | Map is for representation and not to scale
NH 27 CLUSTER
NH 17 CLUSTER
RAMPURCLUSTER
I N D I A W A R E H O U S I N G M A R K E T R E P O R T 2 0 2 14 7 I N D I A W A R E H O U S I N G M A R K E T R E P O R T 2 0 2 14 8
Source: Knight Frank Research
Warehousing market transaction volume
Mn
sq m
Major infrastructure in Guwahati
Name Type
NH 27 / Guwahati stretch Road - NH
NH 17 / Guwahati stretch Road - NH
Lokpriya Gopinath Bordoloi International Airport Airport
East West Corridor Road
Source: Knight Frank Research | Note: NH stands for National Highway
Select large occupiers
Occupier Occupier industry Warehouse cluster
Delhivery 3PL Rampur cluster
Mahindra Logistics 3PL NH 17 cluster
Udaan 3PL Rampur cluster
Procter and Gamble FMCG NH 27 cluster
Nykaa E-commerce NH 17 cluster
Innovative Logistics 3PL Rampur cluster
Source: Knight Frank Research
FY 2019 FY 2020
0.01
0.02
0.03
0.04
0.05
0.06
0.07
FY 2021
0.07
0.08
0.05
0.08
0.09
Industry-split of transaction volume (FY 2021)
Source: Knight Frank Research
Notes:
Warehousing transactions data includes light manufacturing/ assembling.
Other Sectors – These include all manufacturing sectors (automobile, electronics, pharmaceutical, etc.) excluding FMCG and FMCD.
Miscellaneous – These include services such as telecom, real estate, document management, agricultural warehousing and publishing.
E-commerce
3PL
FMCG
Other Sectors
44%
31%
20%
5%
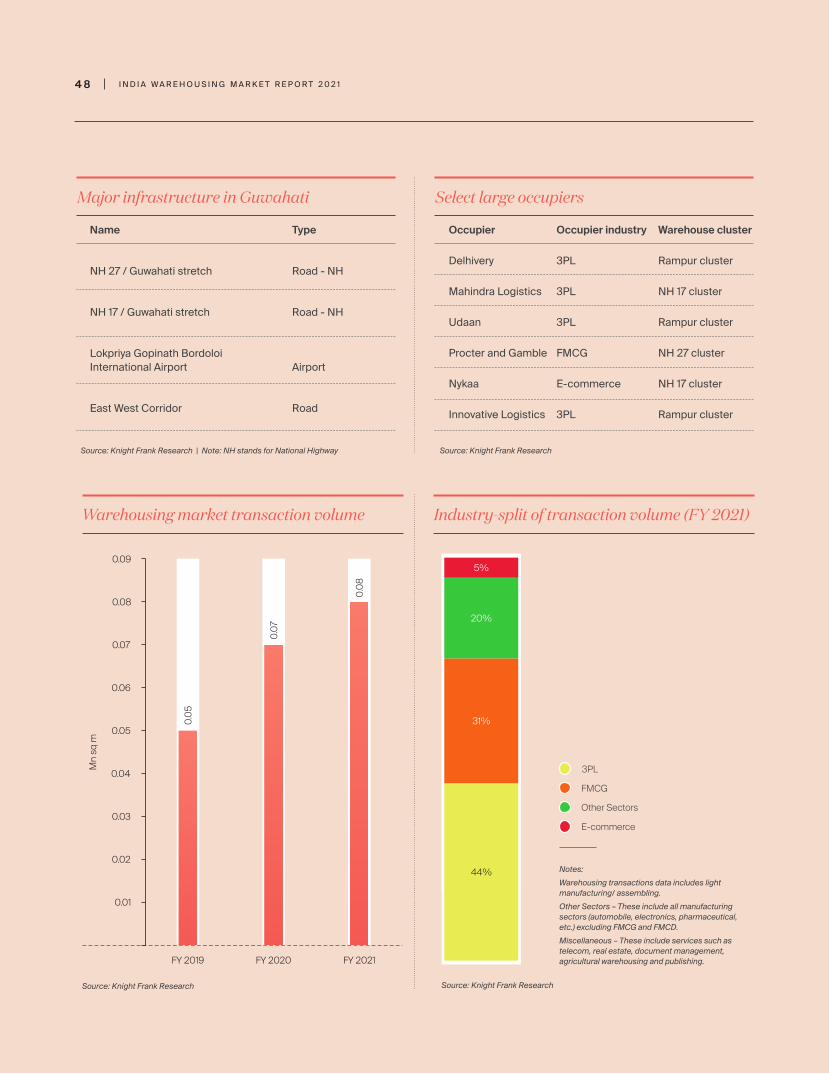

Cluster-split of transaction volume (FY 2021)
Land rate and rents
Warehouse cluster Location Land rate Grade A Grade B (INR mn/acre) Rent per month in Rent per month in INR/sq m (INR/sq ft) INR/sq m (INR/sq ft)
NH 27 cluster Brahmaputra Industrial Park 18 - 30 No Grade A 172 - 194 (16 - 18)
Changsari 15 - 28 194 - 215 (18 - 20) 172 - 194 (16 - 18)
Madanpur 15 - 24 194 - 215 (18 - 20) 172 - 194 (16 - 18)
Kendukona 13 - 15 183 - 205 (17 - 19) 161 - 183 (15 - 17)
NH 17 cluster Bongra-Airport 25 - 30 194 - 215 (18 - 20) 172 - 194 (16 - 18)
Palashbari 18 - 24 194 - 215 (18 - 20) 172 - 194 (16 - 18)
Azara 18 - 22 194 - 215 (18 - 20) 172 - 194 (16 - 18)
Rampur cluster Dakshin Rampur 16 - 20 194 - 215 (18 - 20) 161 - 183 (15 - 17)
Uttar Rampur 16 - 20 194 - 215 (18 - 20) 161 - 183 (15 - 17)
Dakshin Sarubongsor 16 - 19 194 - 215 (18 - 20) 161 - 183 (15 - 17)
Source: Knight Frank Research
Source: Knight Frank Research
NH 17 cluster Rampur cluster NH 27 cluster
FY 2021
37%
Transaction share by end-use of space (FY 2021)
Source: Knight Frank Research
Notes:
Warehousing transactions: These refer to storage activity
Industrial transactions: These refer to manufacturing activity
Warehousing
Industrial
100%
35%
28%
I N D I A W A R E H O U S I N G M A R K E T R E P O R T 2 0 2 14 9 I N D I A W A R E H O U S I N G M A R K E T R E P O R T 2 0 2 15 0
• The Hyderabad industrial and warehousing market transaction activity slowed down in FY 2021 in comparison to its performance last year. The total annual absorption shrank by 30% YoY, from 0.3 mn sq m (3.4 mn sq ft) in FY 2020 to 0.2 mn sq m (2.4 mn sq ft) in FY 2021. Pandemic exigencies and the resulting economic challenges caused this slump in warehousing absorption during the last year.
• The major drivers of the warehousing sector in Hyderabad are end-user consumption-based categories as industrial presence in the city is limited. Warehousing demand is therefore dominated by e-commerce, retail and the FMCG / FMCD industries. With most retail and e-commerce companies preferring to outsource their logistics and warehousing operations to 3PL players in recent years, warehousing demand of 3PLs has grown in Hyderabad.
• In FY 2021, the spurt in e-commerce growth resulting from the COVID-induced rise in online shopping caused a spike in the warehousing demand share of e-commerce and FMCG sectors. The e-commerce sector demand jumped from 28% in FY 2020 to 54% in FY 2021, while the FMCG warehousing demand grew from 11% in FY 2020 to 20% in FY 2021.
• Warehousing activity in Hyderabad is largely concentrated in three major clusters. These are the Medchal cluster in the north located along the Hyderabad – Nagpur highway, the Patancheru cluster in the west on the Mumbai – Hyderabad highway, and the Shamshabad cluster in the south located along the Bengaluru – Hyderabad highway.
H Y D E R A B A DW A R E H O U S I N G M A R K E T
• With a 51% share in the FY 2021 total transactions pie, the Shamshabad cluster has seen a significant spike in activity compared to its 5% share last year. Two transactions by Amazon totalling 0.1 mn sq m (1.1 mn sq ft) i.e. 46% of the total FY 2021 transaction activity are the reason for this huge jump in this cluster's demand share.
• The more popular Medchal cluster accounted for 48% of the FY 2021 warehousing demand, a fall from its share of 87% last year. The fall is a result of the skew caused by the two Amazon transactions in the Shamshabad cluster.
• During FY 2021, land rates grew marginally in the Patancheru and Shamshabad clusters, while rentals remained largely steady across locations in the three warehousing clusters.
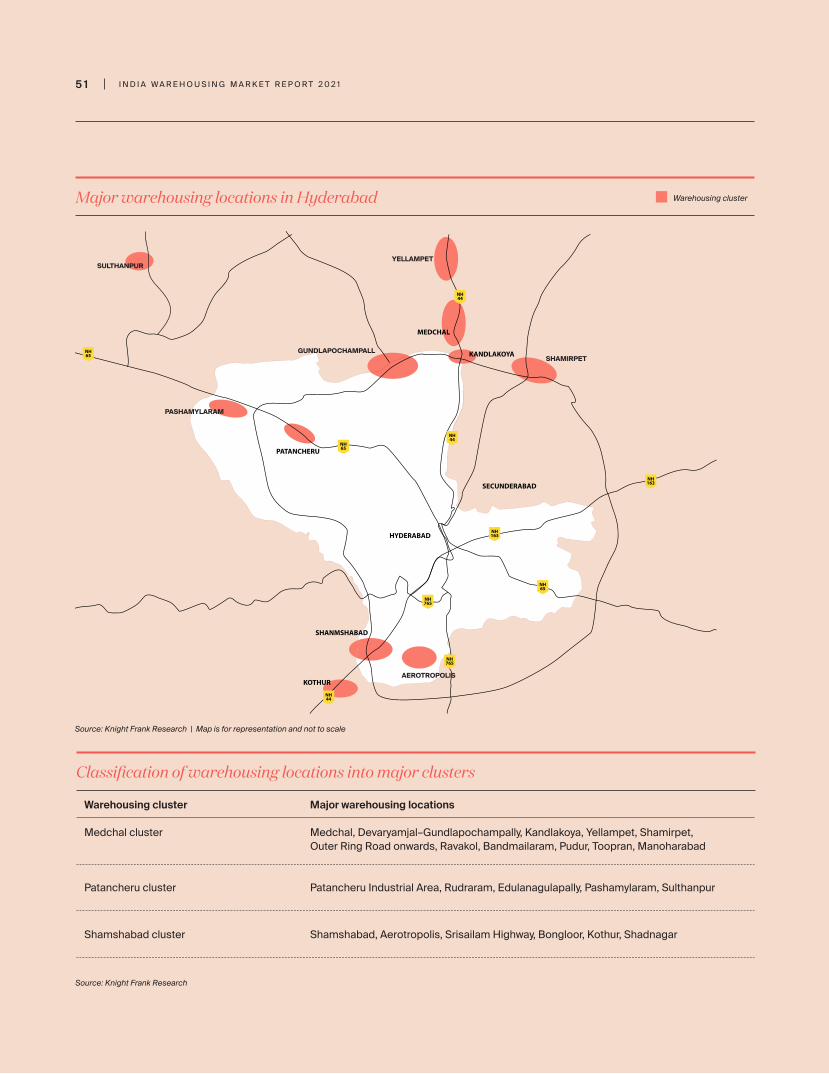
Major warehousing locations in Hyderabad Warehousing cluster
Warehousing cluster Major warehousing locations
Medchal cluster Medchal, Devaryamjal–Gundlapochampally, Kandlakoya, Yellampet, Shamirpet, Outer Ring Road onwards, Ravakol, Bandmailaram, Pudur, Toopran, Manoharabad
Patancheru cluster Patancheru Industrial Area, Rudraram, Edulanagulapally, Pashamylaram, Sulthanpur
Shamshabad cluster Shamshabad, Aerotropolis, Srisailam Highway, Bongloor, Kothur, Shadnagar
Classification of warehousing locations into major clusters
Source: Knight Frank Research
Source: Knight Frank Research | Map is for representation and not to scale
YELLAMPET
SHAMIRPET
PASHAMYLARAM
SULTHANPUR
AEROTROPOLIS
GUNDLAPOCHAMPALL
I N D I A W A R E H O U S I N G M A R K E T R E P O R T 2 0 2 15 1 I N D I A W A R E H O U S I N G M A R K E T R E P O R T 2 0 2 15 2
Source: Knight Frank Research
Warehousing market transaction volume
Mn
sq m
Select warehouse projects
Warehouse project Warehouse cluster
GMR-ESR Shamshabad
Zero Mile Warehousing Medchal
Allcargo Logistics & Industrial Parks Patancheru
K Raheja Corp–Industrial Park Shamshabad
Musaddilal Projects Medchal
Source: Knight Frank Research
Major infrastructure in Hyderabad
Name Type
Outer Ring Road Road
Inner Ring Road Road
Bengaluru-Hyderabad Highway / NH 44 Road
Mumbai-Hyderabad Highway / NH 65 Road
Nagpur-Hyderabad Expressway Road
Rajiv Gandhi International Airport Airport
Source: Knight Frank Research | Note: NH stands for National Highway
Select large occupiers
Occupier Occupier industry Warehouse cluster
Amazon E-commerce Shamshabad & Medchal
Mahindra 3PL MedchalLogistics
ITC FMCG Medchal
HUL FMCG Medchal
Flipkart E-commerce Shamshabad
Source: Knight Frank Research
FY 2018 FY 2019 FY 2020
0.05
0.10
0.15
0.20
0.25
0.30
0.40
FY 2021
0.21
0.32
0.22
0.37
Industry-split of transaction volume (FY 2021)
Source: Knight Frank Research
3PL
Other Sectors
FMCG
E-commerce
Notes:
Warehousing transactions data includes light manufacturing/ assembling.
Other Sectors – These include all manufacturing sectors (automobile, electronics, pharmaceutical, etc) excluding FMCG and FMCD.
Miscellaneous – These include services such as telecom, real estate, document management, agricultural warehousing and publishing.
2%
0.35
54%
24%
20%
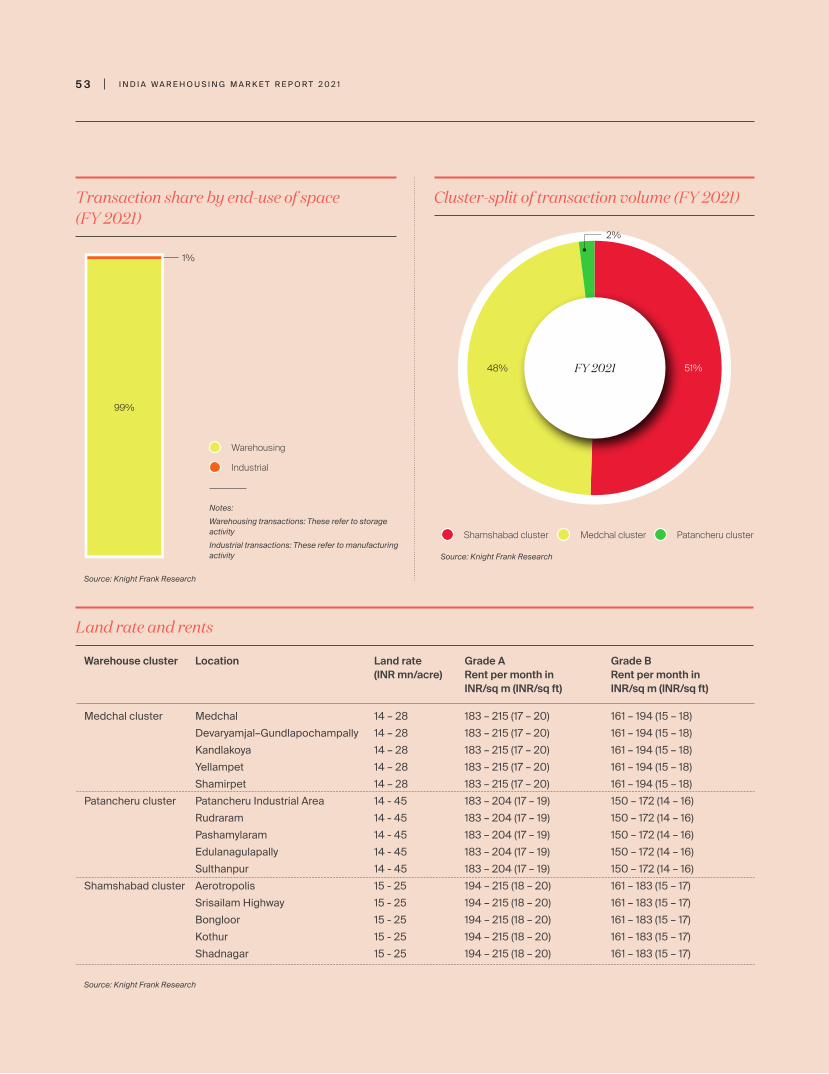
• Kolkata is east India's foremost warehousing and logistics gateway serving the primary consumption requirements of the entire eastern and north eastern belt. Kolkata's well -developed transport corridors enable it to serve the needs of the nearby catchment areas, both in West Bengal and the neighbouring states. The government's thrust on setting up industrial corridors and the rollout of Goods and Services Tax (GST) has been a key demand enabler for warehousing space leasing in the peripheral warehousing clusters of Kolkata.
• Kolkata's major warehousing clusters in Dankuni and its suburbs, and the National Highway-16 (Old NH-6) are well-connected to the city being only 25-30 kms away. They also provide access to the nearby districts of Howrah and Hooghly and are a strategic choice for investors and developers for growth opportunities in the warehousing domain.
• National Highway-16 (Old NH-6) is a six-lane highway populated with numerous industries. This is a much sought-after warehousing cluster where large scale consolidation of smaller units into high specification Grade A warehousing facilities has taken place in the past two years. Many private players have expanded their warehousing footprint in this belt which has excellent connectivity to Bangan, Jangalpur, Alampur, Kharagpur and finally to Mumbai. Sankrail on this node is an established warehousing hub for consumer goods and is located just outside the city limits with transit hubs in the nearby Bardhaman-Durgapur belt. However, contiguous land availability for new facilities is becoming a challenge which has resulted in an upward revision of land prices in this cluster. Connectivity to the Haldia Port has also made it a much sought-after location for 3PL players, as many huge vessels carrying freight from other countries dock at Haldia Dock Complex instead of the Kolkata Port Trust, which is a partner to this port.
• Another major warehousing cluster in Kolkata is Dankuni and its suburbs, comprising the key locations of Durgapur Expressway and the Old Delhi Road (NH-19 [Old NH-2]). This region, dotted with age old industrial units across industries such as steel, coal and cement is slowly transforming itself with modern warehousing facilities. Ease of access to labour and raw materials, and seamless access through both national highways has made it a popular location for transportation and logistics. Many e-commerce players have established footprint in this warehousing belt to create supply chain efficiencies for catering to the consumption demand in north-east India. The Eastern Dedicated Freight Corridor (EDFC) under construction
K O L K A T AW A R E H O U S I N G M A R K E T
is a freight exclusive project for rail transport between Ludhiana and Dankuni which has created a strong enabling environment for intermodal logistics and warehousing.
• From FY 2018 to FY 2021, the cumulative warehousing space transaction volume in Kolkata was 1.23 mn sq m (13.2 mn sq ft), one of the strongest across the country. In a short period of time, Kolkata has established itself as a top performing warehousing market in India with developers continually scouting for new land parcels to develop organized warehousing. However, in FY 2021, Kolkata's warehousing transaction volume remained at 0.28 mn sq m (3.1 mn sq ft). This represents a 22% YoY degrowth over FY 2020 which is largely due to delayed decision making with respect to expansion of warehousing footprint during the first wave of the Covid-19 pandemic in India, as interested occupiers found themselves on the backfoot with the sudden unfolding of a crisis. As a result, many shifted their focus to fulfilling last mile deliveries, while expansion was put on the backburner in the short-term. The lack of Grade A warehousing supply in locations of occupier interest created a challenge for some players to lease spaces, which also contributed to reduced transaction volume.
• Of the total warehouse space leased in FY 2021, National Highway-16 (Old NH-6) accounted for 55% share, while Dankuni and its suburbs accounted for 44%. The remainder was leased in the Taratala-Maheshtala belt.
• Unlike past trends, 3PL emerged as the top sector with a 47% share in the overall warehousing space leased in FY 2021, trumping e-commerce which now accounted for a 28% share. The onset of the pandemic and the enforced lockdowns facilitated an environment for big logistics enterprises to expand wherever e-commerce occupiers have taken exposure, as an increased requirement for transportation and logistics by these giants came to the fore in view of the growth in online sales and the need for in-city distribution. Occupiers from other sectors (8%), FMCD (7%), retail (5%), FMCG (3%) and miscellaneous (2%) constituted the remaining demand.
• Going forward, e-commerce and 3PL sectors will continue to remain the largest demand drivers for warehousing facilities in Kolkata as they remain focused on managing supply chain disturbances for such events in future. Rents for Grade A warehousing facilities have largely remained stable during the pandemic period.
Cluster-split of transaction volume (FY 2021)
Land rate and rents
Warehouse cluster Location Land rate Grade A Grade B (INR mn/acre) Rent per month in Rent per month in INR/sq m (INR/sq ft) INR/sq m (INR/sq ft)
Medchal cluster Medchal 14 – 28 183 – 215 (17 – 20) 161 – 194 (15 – 18) Devaryamjal–Gundlapochampally 14 – 28 183 – 215 (17 – 20) 161 – 194 (15 – 18) Kandlakoya 14 – 28 183 – 215 (17 – 20) 161 – 194 (15 – 18) Yellampet 14 – 28 183 – 215 (17 – 20) 161 – 194 (15 – 18) Shamirpet 14 – 28 183 – 215 (17 – 20) 161 – 194 (15 – 18)Patancheru cluster Patancheru Industrial Area 14 - 45 183 – 204 (17 – 19) 150 – 172 (14 – 16) Rudraram 14 - 45 183 – 204 (17 – 19) 150 – 172 (14 – 16) Pashamylaram 14 - 45 183 – 204 (17 – 19) 150 – 172 (14 – 16) Edulanagulapally 14 - 45 183 – 204 (17 – 19) 150 – 172 (14 – 16) Sulthanpur 14 - 45 183 – 204 (17 – 19) 150 – 172 (14 – 16)Shamshabad cluster Aerotropolis 15 - 25 194 – 215 (18 – 20) 161 – 183 (15 – 17) Srisailam Highway 15 - 25 194 – 215 (18 – 20) 161 – 183 (15 – 17) Bongloor 15 - 25 194 – 215 (18 – 20) 161 – 183 (15 – 17) Kothur 15 - 25 194 – 215 (18 – 20) 161 – 183 (15 – 17) Shadnagar 15 - 25 194 – 215 (18 – 20) 161 – 183 (15 – 17)
Source: Knight Frank Research
Source: Knight Frank Research
Shamshabad cluster Medchal cluster Patancheru cluster
FY 2021 51%48%
2%
Transaction share by end-use of space (FY 2021)
Source: Knight Frank Research
Notes:
Warehousing transactions: These refer to storage activity
Industrial transactions: These refer to manufacturing activity
1%
Warehousing
Industrial
99%
I N D I A W A R E H O U S I N G M A R K E T R E P O R T 2 0 2 15 3 I N D I A W A R E H O U S I N G M A R K E T R E P O R T 2 0 2 15 4

Major warehousing locations in Kolkata Warehousing cluster
Warehousing cluster Major warehousing locations
Dankuni and suburbs Durgapur Expressway and Old Delhi Road (NH 19 [Old NH 2])
National Highway 16 (Old NH 6) Chamrail, Dhulagarh, Sankrail, Uluberia
Taratala–Maheshtala Hide Road, Taratala Road, Garden Reach Road
Madhyamgram–Barasat Madhyamgram, Barasat, Agarpara, Ganganagar
Classification of warehousing locations into major clusters
Source: Knight Frank Research
Source: Knight Frank Research | Map is for representation and not to scale
I N D I A W A R E H O U S I N G M A R K E T R E P O R T 2 0 2 15 5 I N D I A W A R E H O U S I N G M A R K E T R E P O R T 2 0 2 15 6
Select warehouse projects
Warehouse project Warehouse cluster
Aarjavv Industrial and Dankuni and suburbsLogistics Park
Srijan Industrial Logistics National Highway 16Park (Old NH 6)
ESR Uluberia Industrial and National Highway 16Logistics Park (Old NH 6)
Diamond Industrial Park Dankuni and suburbs
Sankrail Industrial Park National Highway 16 (Old NH 6)
Source: Knight Frank Research
Major infrastructure in Kolkata
Name Type
Haldia Port* Port
Kolkata Port Port
Kulpi Port Project** Port
Tajpur Port Project** Port
Eastern Dedicated Freight Corridor Freight Corridor
Amritsar-Delhi-Kolkata Industrial Corridor Industrial Corridor
NH 19 Road NH
NH 16 Road NH
Source: Knight Frank Research | Note: NH stands for National Highway*Haldia Port is not in Kolkata but is a major dock complex that attracts a large volume of cargo movement from Kolkata due to its throughput handling capacity and infrastructure to accommodate large vessels** Upcoming ports in the pipeline which will impact cargo movement from Kolkata
Industry-split of transaction volume (FY 2021)
Source: Knight Frank Research
E-commerce
FMCG
3PL
FMCD
Other Sectors
Retail
Notes:
Warehousing transactions' data includes light manufacturing/ assembling.
Other Sectors – These include all manufacturing sectors (automobile, electronics, pharmaceutical, etc.) excluding FMCG and FMCD.
Miscellaneous – These include services such as telecom, real estate, document management, agricultural warehousing and publishing.
Select large occupiers
Occupier Occupier industry Warehouse cluster
Flipkart E-commerce Dankuni and suburbs
First Cry Retail Dankuni and suburbs
Safexpress 3PL Dankuni and suburbs
Shadowfax 3PL National Highway 16 (Old NH 6)
Mahindra 3PL Dankuni and suburbsLogistics
Hiveloop 3PL National Highway 16Logistics (Old NH 6)
Source: Knight Frank Research
Source: Knight Frank Research
Warehousing market transaction volume
Mn
sq m
FY 2018 FY 2019 FY 2020
0.05
0.10
0.15
0.20
0.25
0.50
FY 2021
0.15
0.37
0.43
0.280.30
0.35
0.40
0.45
47%
2%
28%
8%
7%
5%3%
Miscellaneous
DUMDUM
NATIONAL HIGHWAY 16(OLD NH 6)

Cluster-split of transaction volume (FY 2021)
Land rate and rents
Warehouse cluster Location Land rate Grade A Grade B (INR mn/acre) Rent per month in Rent per month in INR/sq m (INR/sq ft) INR/sq m (INR/sq ft)Dankuni and suburbs Dankuni – before toll 20 - 25 237 - 269 (22 - 25) 205 - 226 (19 - 21) Dankuni – after toll 13 - 18 205 - 215 (19 - 20) 172 - 205 (16 - 19) Old Delhi Road – before 20 - 25 205 - 237 (19 - 22) 194 - 215 (18 - 20) proposed toll Old Delhi Road – after 13 - 18 194 - 215 (18 - 20) 172 - 194 (16 - 18) proposed toll National Highway 16 Jangalpur 25 - 36 226 - 269 (21 - 25) 194 - 215 (18 - 20)(Old NH 6) Sankrail 30 - 48 237 - 258 (22 - 24) 194 - 215 (18 - 20) Uluberia 15 - 18 194 - 226 (18 - 21) 172 - 194 (16 - 18) Bagnan 13 - 17 183 - 194 (17 - 18) 161 - 183 (15 - 17) Amta - Ranihati Road 15 - 19 183 - 205 (17 - 19) 172 - 194 (16 - 18)Taratala–Maheshtala Hide Road No large land No Grade A No Grade B parcels available Budge Budge Trunk Road No large land No Grade A No Grade B parcels available Madhyamgram–Barasat Badu Road No large land 215 - 237 (20 - 22) 183 - 205 (17 - 19) parcels available Airport area No large land 237 - 258 (22 - 24) 194 - 226 (18 - 21) parcels available Kalyani Express 14-18 215 - 269 (20 - 25) 172 - 205 (16 - 19)
Source: Knight Frank Research
Source: Knight Frank Research
National Highway-16 (Old NH-6)
Taratala–Maheshtala
Dankuni and suburbs
Transaction share by end-use of space (FY 2021)
Source: Knight Frank Research
Notes:
Warehousing transactions: These refer to storage activity
Industrial transactions: These refer to manufacturing activity
Warehousing
Industrial
100%
FY 2021 55%44%
1%
I N D I A W A R E H O U S I N G M A R K E T R E P O R T 2 0 2 15 7
• Uttar Pradesh (UP) is the most populous state in India and has a large demand base for consumer goods. Private warehousing in Uttar Pradesh mainly caters to this demand. Lucknow is one of the most important consumption markets in UP and is strategically located at the center of the state. By virtue of being the state capital, it has become an ideal location for development of warehouses with warehousing stock getting concentrated along the southern periphery of the city. A bulk of the development has taken place along the Lucknow-Kanpur Road till Unnao, since large land parcels are still available for greenfield development. Besides its resident population, the Lucknow warehousing market primarily serves the cities of Kanpur, Agra, Jhansi, Rae Bareli, Varanasi, Faisabad and Prayagraj.
• Broadly characterised by Grade B warehousing structures, Lucknow is a largely unorganised warehousing market with quality facilities coming into operation only in the last decade. A majority of the warehousing facilities are either positioned close to the airport or are on the Lucknow–Kanpur national highway. Growing demand for warehousing facilities has kept rental levels buoyant in and around Lucknow through the pandemic impacted FY 2021. For instance, while rental levels for Grade B quality warehouses in locations of Transport Nagar, Bijnor and Nadarganj industrial area are in the range of INR 172-215/sq m/month (INR 16-20/sq ft/month), rents for Grade A type warehouses in the newer locations of the Lucknow–Kanpur national highway near Nawabganj, such as Asha-Kheda, Kusheri and Sohramao, range between INR 183-226/sq m/month (INR 17-21/sq ft/month), and for Grade B type warehouse facilities between INR 161-194/sq m/month (INR 15-18/sq ft/month).
• The pharmaceutical industry has a significant presence in Lucknow with over 450 companies operating in the south of the city, and is a significant driver of the city's warehousing market. Largely concentrated in locations just east of the Lucknow-Kanpur Road, their demand for Grade A warehouses has been growing. This need to adhere to strict compliance requirements is also shared by the 3PL and e-commerce companies, whose presence has increased dramatically in recent years. Demand for Grade A warehousing has been on the rise as occupiers look to comply with existing regulation and maximise efficiency of operations. An increasing number of enquiries have been observed even during a year that was heavily impacted by the
L U C K N O W W A R E H O U S I N G M A R K E T
COVID-19 pandemic. Currently, a few developers such as Plus Nine One Warehouse Parks and Escape Warehousing dominate the Grade A warehousing landscape in the Lucknow warehousing market.
• Close to 0.10 mn sq m (1.05 mn sq ft) was transacted during FY 2021, a steep 157% increase YoY that can be attributed to the spike in transaction activity from the e-commerce sector. E-commerce transactions accounted for 75% of the total transactions during the period compared to 37% in the preceding period. Amazon and Flipkart alone took up 0.07 mn sq m (mn sq ft) during the year. It was an increase in supply of better-quality warehouses and the need for increasing market penetration, especially in the background of the pandemic, that caused this spike in e-commerce activity. The 3PL sector which took up 37% of the space during FY 2020 accounted for only 8% in the current analysis period.
• The Lucknow-Kanpur highway cluster continues to attract most of the development and occupier interest in the market and its standing is expected to sustain. Factors such as the availability of reasonably priced, large land parcels, good road connectivity and the benefits of the industrial land use classification under Lucknow Industrial Development Authority (LIDA) will continue to support market traction in this cluster.
• The Lucknow market has an estimated development pipeline of approximately 0.2 mn sq m (2 mn sq ft) of Grade A built-to-suit space, primarily on the Lucknow-Kanpur highway cluster, which is scheduled for completion in the next 12 months. However, due to the uncertain environment in 2020, construction activity has not progressed much but is expected to pick up pace as the tension in the market reduces in course of the year.
I N D I A W A R E H O U S I N G M A R K E T R E P O R T 2 0 2 15 8
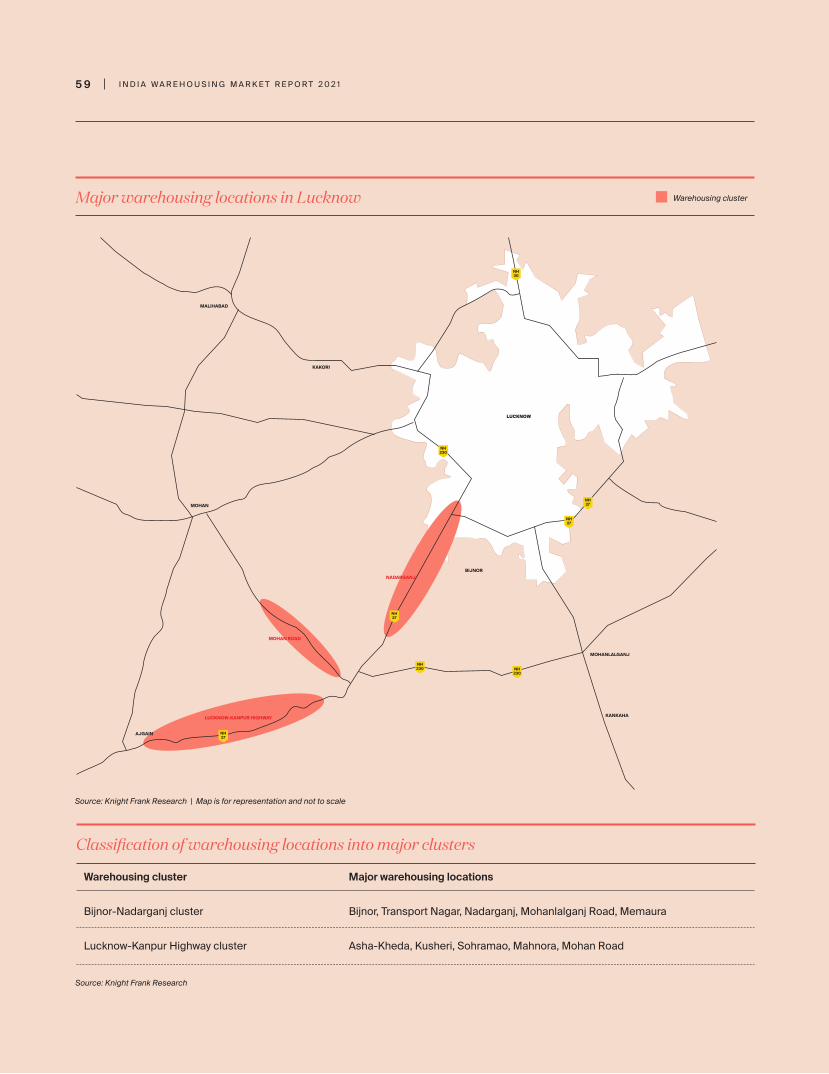
Major warehousing locations in Lucknow Warehousing cluster
Warehousing cluster Major warehousing locations
Bijnor-Nadarganj cluster Bijnor, Transport Nagar, Nadarganj, Mohanlalganj Road, Memaura
Lucknow-Kanpur Highway cluster Asha-Kheda, Kusheri, Sohramao, Mahnora, Mohan Road
Classification of warehousing locations into major clusters
Source: Knight Frank Research
Source: Knight Frank Research | Map is for representation and not to scale
LUCKNOW
KAKORI
MALIHABAD
MOHAN
AJGAIN
LUCKNOW-KANPUR HIGHWAY
MOHANLALGANJ
KANKAHA
NH27
NH27
NH27
NH27
NH30
NH230
NH230 NH
230
MOHAN ROAD
NADARGANJBIJNOR
Source: Knight Frank Research.Note: FY 2020 transaction numbers have been revised.
Warehousing market transaction volume
Mn
sq m
Select warehouse projects
Warehouse project Warehouse cluster
Escape Logistics Lucknow-Kanpur Highway
Plus Nine One Logistics Lucknow-Kanpur Highway
Bhandari Warehousing Bijnor-Nadarganj cluster
Source: Knight Frank Research
Major infrastructure in Lucknow
Name Type
Outer Ring Road (Phase I) Road
Lucknow-Kanpur Highway (NH 27) Road – NH
Source: Knight Frank ResearchNote: NH stands for National Highway
FY 2019 FY 2020
0.02
0.04
0.06
0.08
0.10
0.12
FY 2021
0.10
0.03
Industry-split of transaction volume (FY 2021)
Source: Knight Frank Research
E-commerce
Notes:
Warehousing transactions data includes light manufacturing/ assembling.
Other Sectors – These include all manufacturing sectors (automobile, electronics, pharmaceutical, etc.) excluding FMCG and FMCD.
Miscellaneous – These include services such as telecom, real estate, document management, agricultural warehousing and publishing.
FMCD
Select large occupiers
Occupier Occupier industry Warehouse cluster
Future Supply 3PL Bijnor-Nadarganj Chain cluster
Flipkart E-commerce Lucknow-Kanpur Highway
United Spirits FMCG Bijnor-Nadarganj cluster
Amazon E-commerce Lucknow-Kanpur Highway
Delhivery 3PL Bijnor-Nadarganj cluster
Source: Knight Frank Research
0.04
75%
11%
8%
3%2%
3PL
FMCG
Other Sectors
I N D I A W A R E H O U S I N G M A R K E T R E P O R T 2 0 2 15 9 I N D I A W A R E H O U S I N G M A R K E T R E P O R T 2 0 2 16 0

• Ludhiana is Punjab's largest city and has been North India's dominant industrial hub historically. Located in Ludhiana district, it is also on the Government of India's radar to be developed into a Smart City. Being a prime industrial center, it lies on the strategic Dedicated Freight Corridor (DFC). Upon completion, the DFC will give a massive infrastructure push for the establishment of industrial corridors and logistics parks along its alignment. This corridor is expected to have an upgraded transportation technology which will reduce unit transportation cost for occupiers across sectors. This 447 km freight corridor will pass through the districts of Sahnewal, Doraha, Ludhiana, Sirhind, Rajpura, Ambala, Yamunanagar, Saharanpur, Muzaffarnagar, Meerut, Hapur, etc. all of which will reap the benefits of this alignment.
• Three mega logistics parks have been planned in Ludhiana with both private and state warehousing corporation participation and are expected to come up in Kila Raipur village district to cater to the logistics requirements of the entire industrial belt of Ludhiana and its nearby regions in Punjab such as Amritsar, Bhatinda, Jalandhar, Patiala and Hoshiarpur. These logistics park should give a boost to modern warehousing in this region.
• Being a hub of small-scale industrial goods, Ludhiana has been a prominent industrial hub of the state. Production of auto components, household appliances, hosiery, bicycle, hand tools and industrial equipment has made the city a key sourcing partner for companies in the FMCD, auto and manufacturing sectors. Ludhiana's prime warehousing clusters are concentrated on two peripheral stretches in the city's south east, and largely host unorganized warehousing facilities. The Chandigarh Road cluster has locations along the Ludhiana - Chandigarh State Highway (or parts of National Highway 5), Focal Point all the way up to Kohara. The second cluster is the NH 44 cluster (Old NH 1) which includes erstwhile old industrial clusters in Jalandhar Bypass, Transport Nagar Industrial Area, Sahnewal and Doraha.
• Though most of the warehousing stock is currently unorganized, connectivity to other cities in Punjab as well as neighbouring states via the National Highway NH 5, NH 44 and State Highway 11 (SH 11) has made Ludhiana a key Tier II city of
L U D H I A N A W A R E H O U S I N G M A R K E T
investor and developer focus for organised warehousing opportunities. The upcoming Ludhiana-Chandigarh National Highway project is a planned 76 kms highway which will improve connectivity between these cities and ease access to Mohali and Fatehgarh Sahib.
• In FY 2021, Ludhiana clocked nearly 0.04 mn sq m (0.5 mn sq ft) warehousing leasing, a healthy 31% YoY upswing over FY 2020. Of the total warehouse leasing transaction volume, 68% was concentrated in the NH 44 cluster (Old NH 1), while 32% was in the Chandigarh Road cluster.
• In terms of sectors that have leased warehouse spaces, e-commerce stood out with a 73% share while 21% was occupied by the fast-moving consumer durables (FMCD) sector. Other manufacturing companies took up the remaining 6% share. A large e-commerce player recently announced the expansion of its warehousing facilities in Ludhiana with the addition of a specialized fulfillment center (FC) in Doraha. Currently, warehousing operations are undergoing a seismic transformation as customer expectations in Tier II cities in terms of fast delivery and availability have changed post the pandemic outbreak. Occupiers are capitalizing on the potential of the key consumption market of Ludhiana where they foresee future growth.
• Increasing consumption demand bodes well for organised warehousing in Tier II cities such as Ludhiana. Coupled with infrastructure upgrades and with new logistics parks on the anvil, it will attract large scale warehousing developers leading them to concentrate on developing built-to-suit and plug and play facilities in Ludhiana.
• Despite good upswing in warehousing demand, rents remained at par with the previous period. This is largely due to landlords' willingness to offer better rental terms to tenants in the wake of the Covid-19 outbreak to ensure continued traction.
I N D I A W A R E H O U S I N G M A R K E T R E P O R T 2 0 2 16 2
Cluster-split of transaction volume (FY 2021)
Land rate and rents
Warehouse cluster Location Land rate Grade A Grade B (INR mn/acre) Rent per month in Rent per month in INR/sq m (INR/sq ft) INR/sq m (INR/sq ft)
Bijnor- Nadarganj cluster Bijnor 20 – 30 Not available 172 – 215 (16 – 20)
Nadarganj 20 – 30 Not available 172 – 215 (16 – 20)
Mohanlalganj Road 15 – 20 Not available 172 – 215 (16 – 20)
Transport Nagar 25 – 30 Not available 172 – 215 (16 – 20)
Lucknow-Kanpur Highway Asha-Kheda 10 – 13 183 – 226 (17 – 21) 161 – 194 (15 – 18)
Kusheri 10 – 13 183 – 226 (17 – 21) 161 – 194 (15 – 18)
Sohramao 10 – 15 183 – 226 (17 – 21) 161 – 194 (15 – 18)
Mahnora 10 – 14 183 – 226 (17 – 21) 161 – 194 (15 – 18)
Mohan Road 13 – 17 183 – 226 (17 – 21) 172 – 194 (16 – 18)
Source: Knight Frank Research
Source: Knight Frank Research
Lucknow-Kanpur Highway Bijnor-Nadarganj cluster
FY 2021
33%
Transaction share by end-use of space (FY 2021)
Source: Knight Frank Research
Notes:
Warehousing transactions: These refer to storage activity
Industrial transactions: These refer to manufacturing activity
Warehousing
100%67%
I N D I A W A R E H O U S I N G M A R K E T R E P O R T 2 0 2 16 1

I N D I A W A R E H O U S I N G M A R K E T R E P O R T 2 0 2 16 4
Source: Knight Frank Research
Warehousing market transaction volume
Mn
sq m
Major infrastructure in Ludhiana
Name Type
NH 44 Ludhiana stretch Road - NH
NH 5 / Ludhiana stretch Road - NH
SH 11 Road - SH
Sahnewal Airport Airport
Source: Knight Frank ResearchNote: NH stands for National Highway | SH stands for State Highway
Select large occupiers
Occupier Occupier industry Warehouse cluster
Amazon E-commerce NH 44 cluster (Old NH 1)
Flipkart E-commerce Chandigarh Road cluster
Big Basket E-commerce Chandigarh Road cluster
Source: Knight Frank Research
FY 2019 FY 2020
0.01
0.02
0.03
0.04
0.05
FY 2021
0.03
0.04
Industry-split of transaction volume (FY 2021)
Source: Knight Frank Research
Notes:
Warehousing transactions data includes light manufacturing/ assembling.
Other Sectors – These include all manufacturing sectors (automobile, electronics, pharmaceutical, etc.) excluding FMCG and FMCD.
Miscellaneous – These include services such as telecom, real estate, document management, agricultural warehousing and publishing.
E-commerce
FMCD
Other Sectors
0.04
73%
21%
6%
Major warehousing locations in Ludhiana Warehousing cluster
Warehousing cluster Major warehousing locations
Chandigarh Road cluster Locations along Ludhiana-Chandigarh State Highway (or parts of National Highway 5), Focal Point, Kohara
NH 44 cluster (Old NH 1) Jalandhar Bypass, Transport Nagar Industrial Area, Sahnewal, Doraha, Grand Trunk Road
Classification of warehousing locations into major clusters
Source: Knight Frank Research
Source: Knight Frank Research | Map is for representation and not to scale
44
5
5
LUDHIANA
DUGGRI
SHIMLAPURIDHANDARI
KALAN
FOCAL POINT
SAHNEWAL
KOHARA
HARNAMPURA
KOTLA
KHANPUR
CHANDIGARH ROAD CLUSTER
NH-44 CLUSTER (Old NH-1)
I N D I A W A R E H O U S I N G M A R K E T R E P O R T 2 0 2 16 3

I N D I A W A R E H O U S I N G M A R K E T R E P O R T 2 0 2 16 6
• The Mumbai Metropolitan Region (MMR) is one the most important and biggest consumption markets of India. The region is spread over 6,640 sq km and consists of 9 Municipal Corporations.
• There are 3 drivers of the warehousing demand in MMR – consumption (includes demand from e-commerce and retail), export-import (EXIM) and manufacturing.
• The Bhiwandi warehousing cluster is located strategically at the junction of Mumbai, Navi Mumbai and Thane, and this makes it an ideal location to serve the consumption demand. However, a majority of warehouses in Bhiwandi are old and lack modern offerings. The roads are narrow and congested, often clogged with traffic. Moreover, Bhiwandi is slowly transforming into an affordable housing destination, and the upcoming Metro Line 5, Thane-Bhiwandi-Kalyan, will accentuate the transformation of Bhiwandi. This transformation will make it challenging to carry out warehousing activities around the Bhiwandi city area.
• The warehouses moving out of Bhiwandi are shifting along the Mumbai-Nashik highway NH 3 which has a good quality 2x2 lane road with divider. This road runs parallel to the Thane-Bhiwandi Road and provides quicker access to MMR. This highway is being widened to cater to the increased traffic requirements. Better quality warehouses can be seen coming up along NH 3 and on the Kalyan-Sape Road which connects NH 3 to Kalyan. The other emerging locations are Lonad, Usroli, Vashere, Vadape, Amane, Sawad and locations before the Padgha toll booth.
• The Panvel warehousing cluster, due to its proximity to JNPT - the largest port of India, caters predominantly to the EXIM demand. Despite having better quality infrastructure than Bhiwandi, the Panvel warehousing cluster could not take away
M U M B A IW A R E H O U S I N G M A R K E T
consumption demand from Bhiwandi. This is because Bhiwandi offers an established ecosystem required for carrying out warehousing activities in terms of ancillary services, which is not very prevalent in the Panvel cluster. Further, many markets within the Panvel warehousing cluster have bonded warehouses and operate on the pallet system which is more suitable for occupiers serving EXIM demand.
• A trend of short-term leases in warehousing, which had become common during the first lockdown of 2020, subsided as the year progressed. As the lockdown restrictions were lifted, occupiers started taking up desired spaces on longer leases.
• In FY 2021, Mumbai's warehousing market witnessed leasing of 0.54 mn sq m (5.8 mn sq ft), a 22.6% YoY decline over 0.69 mn sq m (7.5 mn sq ft) transacted during FY 2020. This decline can largely be attributed to the economic impact of the pandemic. Companies have slowed down their expansion plans citing lower demand. 3PL and e-commerce were the largest occupier segments garnering 83% share of transactions.
• With the second wave of infections in Maharashtra, a number of build-to-suit (BTS) transactions are going slow. With the migrant and construction laborers returning to their villages, both developers and occupiers are not confident about the warehouse delivery timelines.
• Rents have corrected in the range of 4-8% during FY 2021 in the Bhiwandi warehousing cluster as occupiers pushed for better contractual terms citing business impact and landlords relented in order to keep the warehouse occupied. The rents were stable in the Panvel warehousing cluster as the supply was low on account of developers going slow on new construction.
Cluster-split of transaction volume (FY 2021)
Land rate and rents
Warehouse cluster Land rate Grade A Grade B (INR mn/acre) Rent per month in Rent per month in INR/sq m (INR/sq ft) INR/sq m (INR/sq ft)
Chandigarh Road cluster 10 – 13 151 – 183 (14 – 17) 108 – 129 (10 – 12)
NH 44 cluster (Old NH 1) 10 – 14 151 – 183 (14 – 17) 108 – 129 (10 – 12)
Source: Knight Frank Research
Source: Knight Frank Research
NH 44 cluster (Old NH 1) Chandigarh Road cluster
Transaction share by end-use of space (FY 2021)
Source: Knight Frank Research
Notes:
Warehousing transactions: These refer to storage activity
Industrial transactions: These refer to manufacturing activity
Warehousing
Industrial
100%
FY 2021
68%
32%
I N D I A W A R E H O U S I N G M A R K E T R E P O R T 2 0 2 16 5

I N D I A W A R E H O U S I N G M A R K E T R E P O R T 2 0 2 16 8
Source: Knight Frank Research
Warehousing market transaction volume
Mn
sq m
Select warehouse projects
Warehouse project Warehouse cluster
KSquare Bhiwandi
BGR Bhiwandi
Renaissance Bhiwandi
ESR Bhiwandi
NDR JNPT
New Era Warehousing Panvel, Patalganga
Source: Knight Frank Research
Major infrastructure in MMR
Name Type
Delhi-Mumbai Industrial Corridor (DMIC) Industrial corridor
Navi Mumbai Airport Influence Airport and alliedArea (NAINA) activities
Mumbai Trans Harbour Link Sea link
Virar-Alibaug Multi-modal Corridor Multi-modal transport
Delhi-Mumbai Expressway Express highway
Mumbai-Nagpur Expressway Express highway
Source: Knight Frank Research
Select large occupiers
Occupier Occupier industry Warehouse cluster
Amazon E-commerce Bhiwandi warehousing cluster
Flipkart E-commerce Bhiwandi warehousing cluster
DHL 3PL Bhiwandi warehousing cluster
Nilkamal India Retail Bhiwandi warehousing cluster
DB Schenker 3PL Bhiwandi warehousing cluster
CMS Infosystems Miscellaneous Panvel warehousing cluster
Source: Knight Frank Research
FY 2018 FY 2019 FY 2020
0.1
0.2
FY 2021
0.51
0.69
0.54
0.64
Industry-split of transaction volume (FY 2021)
Source: Knight Frank Research
Other sectors
E-commerce
Retail
3PL
Miscellaneous
Notes:
Warehousing transactions data includes light manufacturing/ assembling.
Other Sectors – These include all manufacturing sectors (automobile, electronics, pharmaceutical, etc.) excluding FMCG and FMCD.
Miscellaneous – These include services such as telecom, real estate, document management, agricultural warehousing and publishing.
0.3
0.4
53%
30%
11%
4%3%
0.5
0.6
0.7
0.8
Major warehousing locations in Mumbai Warehousing cluster
Warehousing cluster Major warehousing locations
Bhiwandi Mankoli, Kalher, Kashele, Dapode, Padgha, Vashere, Vadpe, Sape, Lonad, Bhavale, Sawad Naka, Dohole, Sonale, Anjurphatta
Panvel Palaspe, Uran Road, Taloja, Patalganga
Classification of warehousing locations into major clusters
Source: Knight Frank Research
Source: Knight Frank Research | Map is for representation and not to scale
I N D I A W A R E H O U S I N G M A R K E T R E P O R T 2 0 2 16 7

• The National Capital Region (NCR) is a massive metropolitan belt in the country. The national capital of Delhi is bordered by Haryana and Uttar Pradesh and accessible from 5 national highways. With a good arterial road network passing through Delhi, the warehousing clusters that emerged along major industrial hubs provide easy access to multiple consumption centers in Punjab, Haryana, Uttar Pradesh and Rajasthan. Connectivity to different states, large-scale manufacturing units and industrialization have facilitated in NCR emerging as one of the most preferred warehousing destinations in India, with an enormous potential for incremental warehousing stock to be added by institutional and local developers.
• Post demonetisation and GST, warehousing operations have undergone an organic consolidation and many organized players such as IndoSpace and Embassy Industrial Parks have set up large industrial and warehousing parks in NCR's peripheral belts. Supported by a robust road network, the transportation of goods is creating supply chain efficiencies for e-commerce, manufacturing, auto and auto ancillary, food processing and heavy engineering and retail sector occupiers. The increased consumer demand via online commerce during the pandemic has fueled and sustained the demand for warehouses by e-commerce companies for the entire NH-48 belt to cater to Delhi, Gurgaon, Noida, Greater Noida, Faridabad, Ghaziabad and other Tier II and Tier III consumption centers.
• In FY 2021, NCR's total warehousing transaction volume declined by 20% over FY 2020 to 6.9 mn sq ft (0.64 mn sq m). This is largely due to delayed decision making by some occupiers across sectors in the wake of the Covid-19 outbreak, which led to deferment of new leasing decisions during the pandemic's first wave in 2020, despite strong market fundamentals and intent to expand footprint in this region.
• E-commerce remained the biggest demand driver with a 61% share in warehousing transaction volume, followed by 3PL at 26%. The significant shift to online shopping in one of India's most tech savvy regions, has led many e-commerce companies and 3PL giants to expand footprint in the pandemic year to drive volumes and last mile deliveries. 3PL players, catering mainly to the e-commerce sector, are expanding Grade A warehousing space take-up to maintain a seamless last-mile delivery mechanism so as to serve NCR's multiple consumption markets.
N C RW A R E H O U S I N G M A R K E T
• The NH-48/ Kundli Manesar Palwal Expressway (KMP) accounted for 73% of the total warehousing transaction volume. This 135 kms stretch, also known as Western Peripheral Expressway has given a facelift to organized warehousing in NCR, since its inauguration less than 3 years back. With a dedicated corridor for movement of heavy vehicles around Delhi, this expressway encircles half its periphery and provides accessibility to all the big and small consumption markets in NCR. Along the alignment of the KMP, several urban centres and industrial townships are planned as part of NCR's rapid industrialization, making it an investment hotspot for participation by institutional players.
• While most big players already had existing warehousing facilities on the KMP, some locations which are accessible from NH-48, such as Farrukhnagar, Bilaspur-Tauru- Sohna Road and Pataudi – Luhari Road have assumed strategic importance in the past few months due to greenfield development opportunities and competitive rents. As vacant Grade A warehousing stock remains limited near the NH 48 road, the new warehousing developments are now coming along these locations. A leading developer of industrial and logistics park, which already has a large footprint in NCR recently acquired another land parcel of 55 acres at Farrukhnagar to develop a warehousing facility.
• Other locations such as Greater Noida, Okhla, Faridabad, Ballabhgarh, Delhi and Sonipat together accounted for 24% of the total transaction volume. Compared to FY 2020, there is a marginal uptick in this cluster in the percentage of total warehouse space leased in FY 2021, which could largely be fueled due to short term requirements for in-city warehouses during the first wave of Covid-19 outbreak, as occupiers tried scouting for solutions to fulfill demand due to border closures in the wake of the lockdown. Ghaziabad cluster's share in the total warehousing spaces leased remained limited to 3% as most of the demand for warehouses shifted to NH-48/KMP Expressway due to availability of better warehousing facilities.
• Rents have largely remained stable during FY 2021. In the aftermath of the second wave of Covid-19, occupiers are likely to push for better contractual terms and other benefits. Short-term leases to avoid inter-state cargo movement, may be back again for the foreseeable future as states go ahead with Covid-19 related curbs and curfews.
I N D I A W A R E H O U S I N G M A R K E T R E P O R T 2 0 2 17 0
Cluster-split of transaction volume (FY 2021)
Land rate and rents
Warehouse cluster Location Land rate Grade A Grade B (INR mn/acre) Rent per month in Rent per month in INR/sq m (INR/sq ft) INR/sq m (INR/sq ft)
Bhiwandi Mankoli Large land parcels 226 – 258 (21 – 24) 161 – 194 (15 – 18) not available Vadpe 23 – 28 236 – 269 (22 – 24) 194 – 215 (18 – 20) Padgha 18 – 25 226 – 269 (21 – 24) 183 – 194 (17 – 18) Vashare/Sape 20 – 25 226 – 248 (21 – 23) 172 – 194 (16 – 18) Lonad 17 – 20 No Grade A supply 172 – 205 (16 – 19) Sonale 25 – 30 248 – 269 (23-25) No Grade B supply Yewai 25 – 30 236 – 258 (22 – 24) No Grade B supply Bhorigaon 15 – 18 205 – 226 (19-21) 172 – 194 (16 – 18) Dhole 15 – 17 194 – 215 (18 – 20) 172 – 194 (16 – 18) Kosambi 15 – 18 215 – 236 (20 – 22) 172 – 194 (16 – 18)Panvel Palaspe-Goa Road 25 – 30 269 – 323 (25 – 30) 194 – 215 (18 – 20) JNPT 16 – 25 258 – 291 (24 – 27) 183 – 205 (17 – 19) Taloja 25 – 40 280 – 323 (26 – 30) 215 – 269 (20 – 25) Patalganga 16 – 25 205 – 237 (19 – 22) 151 – 194 (14 – 18)
Source: Knight Frank Research
Source: Knight Frank Research
Transaction share by end-use of space (FY 2021)
Source: Knight Frank Research
Notes:
Warehousing transactions: These refer to storage activity
Industrial transactions: These refer to manufacturing activity
Warehousing
100%
FY 2021
>99%
<1%
Bhiwandi warehousing cluster
Panvel warehousing
I N D I A W A R E H O U S I N G M A R K E T R E P O R T 2 0 2 16 9

I N D I A W A R E H O U S I N G M A R K E T R E P O R T 2 0 2 17 2
Source: Knight Frank Research
Warehousing market transaction volume
Mn
sq m
Select warehouse projects
Warehouse project Warehouse cluster
IndoSpace NH 48/ KMP (Luhari & Badli)
All Cargo NH 48/ KMP
Embassy Industrial Park NH 48/ KMP
Gokuldas NH 48/ KMP
CCI Logistics/JKF Infra NH 48/ KMP
Source: Knight Frank Research
Major infrastructure in NCR
Name Type
Delhi-Mumbai Industrial Corridor (DMIC) Industrial Corridor
Eastern Peripheral Expressway or Road - NH Kundli-Ghaziabad-Palwal (KGP) Expressway or National Expressway II
Western Peripheral Expressway or Road – NH Kundli-Manesar–Palwal (KMP) Expressway
Dedicated Freight Corridors (DFC) Rail
Source: Knight Frank Research | Note: NH stands for National Highway
Select large occupiers
Occupier Occupier industry Warehouse cluster
Amazon E-commerce NH 48/ KMP
Delhivery 3PL NH 48/ KMP
Rhenus Logistics 3PL NH 48/ KMP
Flipkart E-commerce NH 48/ KMP
DHL 3PL Others
DB Schenker 3PL NH 48/ KMP
Source: Knight Frank Research
FY 2018 FY 2019 FY 2020
0.20
0.40
0.60
0.80
1.00
1.20
1.40
FY 2021
0.60
0.80
0.64
1.17
Industry-split of transaction volume (FY 2021)
Source: Knight Frank Research
E-commerce
Other Sectors
3PL
FMCD
FMCG
Retail
Notes:
Warehousing transactions data includes light manufacturing/ assembling.
Other Sectors – These include all manufacturing sectors (automobile, electronics, pharmaceutical, etc.) excluding FMCG and FMCD.
Miscellaneous – These include services such as telecom, real estate, document management, agricultural warehousing and publishing.
1%1%
61%
26%
7%
4% 1%1%
Major warehousing locations in NCR Warehousing cluster
Warehousing cluster Major warehousing locations
NH 48/ Kundli Manesar Palwal Dharuhera, Pataudi-Luhari Road, Jamalpur-Panchgaon Road, Bilaspur-Tauru- Expressway (KMP) Sohna Road, NH 71-Kulana, Badli, Farrukhnagar and other such areas accessible from NH 48 and Kundli Manesar Palwal Expressway.
Ghaziabad cluster NH 91 (Dadri), NH 24 (Hapur), Dasna, Pilakhuwa and Meerut and other areas accessible from NH 24 and NH 34
Others Palwal, Sohna, Faridabad, Noida-Greater Noida, Alipur, Kundli, Sonipat, Murthal, Barota and Mundka
Classification of warehousing locations into major clusters
Source: Knight Frank Research
Source: Knight Frank Research | Map is for representation and not to scale
MUNDKA
KAPASHERA-BAMNOLI CLUSTER
KHAINTAWAS
NH8
KHERKI DAULA
BILASPUR TAURU RD
BAROTA
GT ROAD
NH 58
NH 24
NH 1 CLUSTER
DHARUHERA
GURGAON-PAUTAUDI ROAD
JAMALPUR-PANCHGAON ROAD
NH 2, PALWAL
OKHALA
NH 91
91
91
I N D I A W A R E H O U S I N G M A R K E T R E P O R T 2 0 2 17 1

• Pune is the second largest city in Maharashtra after Mumbai in terms of population and economic activity. The two primary drivers of warehousing space demand in Pune are – manufacturing and consumption.
• There are 3 major manufacturing clusters in Pune which have been developed by the Maharashtra Industrial Development Corporation (MIDC) at Chakan, Talegaon and Ranjangaon.
• Chakan MIDC has evolved into a mature manufacturing and industrial hub and is also referred to as the 'auto hub' of Maharashtra. As Chakan offers a thriving manufacturing environment and an established support ecosystem, new entrants are keen to move into this cluster despite the high rentals. The warehousing space currently available in Chakan predominantly caters to the in-house, captive demand of manufacturers from Chakan MIDC.
• Due to the high land prices in Chakan, Talegaon has emerged as an attractive location for both warehousing and industrial leasing. Talegaon is 35 km from Pune but has good connectivity to the city via NH 48. The connectivity between Chakan and Talegaon has improved, and they are now merging into a single cluster. Further, Talegaon has evolved into a mature manufacturing cluster on the lines of Chakan and several developers and occupiers consider Chakan and Talegaon on par. Due to the rise in demand for Talegaon, this cluster is now being expanded with a new manufacturing cluster being planned at MIDC Ambi.
• Despite high rentals in Chakan-Talegaon, e-commerce occupiers are also willing to take up space as the Chakan-Talegoan belt offers good quality Grade A space within a mature cluster with the requisite ancillary services.
• Ranjangaon MIDC has several large manufacturing companies. Of the 3 MIDCs in Pune, this cluster has the best infrastructure with main roads having 3x3 lanes with dividers, and internal roads having 2x2 or 1x1 lanes with dividers. There is provision for widening of the roads in future without any need for land acquisition. However, the problems faced in a typical developing industrial cluster in India are also faced in Ranjangaon, although these issues are getting resolved slowly. A few more large-scale manufacturers could help expedite the development of Ranjangaon to bring it at par with Chakan. Ranjangaon is located 58 km from Pune city; it takes over 2 hours to reach Pune and 1.5 hours to reach Chakan. The land
P U N EW A R E H O U S I N G M A R K E T
prices and rentals are lower than Chakan and Talegaon, and the cluster caters predominantly to industrial and manufacturing demand. Due to the longer travel time to the city, the share of consumption demand for warehousing space in this cluster is low.
• In FY 2021, the Pune warehousing market recorded leasing volumes of 0.26 mn sq m (2.8 mn sq ft) down 42% from 0.45 mn sq m (4.9 mn sq ft) recorded during FY 2020. This drop was on account of the COVID-19 induced economic slowdown and cyclicity of demand. The lower demand from consumption segments was partially made up by the rise in demand from the industrial segments.
• Pune is witnessing demand particularly from the industrial occupiers, who carry out various kind of light to heavy manufacturing activities from the industrial parks. The share of industrial segments in annual leasing transactions increased from 44% in FY 2020 to 66% in FY 2021.
• Rentals have corrected in the range of 1-3% YoY in FY 2021 in the Pune warehousing market. The pressure on rentals was higher in markets catering to consumption demand than those catering to industrial demand.
I N D I A W A R E H O U S I N G M A R K E T R E P O R T 2 0 2 174
Cluster-split of transaction volume (FY 2021)
Land rate and rents
Warehouse cluster Location Land rate Grade A Grade B (INR mn/acre) Rent per month in Rent per month in INR/sq m (INR/sq ft) INR/sq m (INR/sq ft)
NH 48 cluster/ NH 48 (Gurugram–Binola) 20 – 30 237 – 280 (22 – 26) 172 – 194 (16 – 18)KMP cluster Pataudi Road/Luhari 12 – 25 172 – 215 (16 – 20) 161 – 172 (15 – 16) Jamalpur-Panchgaon Road 17 – 25 194 – 215 (18 – 20) 172 – 194 (16 – 18) Bilaspur-Tauru -Sohna Road 14 – 25 194 – 226 (18 – 21) 183 – 205 (17 – 19) Dharuhera 15 – 25 215 – 258 (20 – 24) 194 – 215 (18 – 20) NH 71–Kulana 12 – 16 172 – 194 (16 – 18) 161 – 172 (15 – 16) Badli 13 – 15 215 – 226 (20 – 21) 161 – 183 (15 – 17) Farrukhnagar 16 – 22 194 – 215 (18 – 20) 161 – 194 (15 – 18)
Ghaziabad cluster NH 91 (Dadri) & NH 24 (Hapur) 18 – 25 183 – 215 (17 – 20) 172 – 194 (16 – 18) (Dasna-Pilikhua, Meerut)
Other clusters Greater Noida 20 – 30 237 – 323 (22-30) 215 – 258 (20 – 24) Faridabad 18 – 28 194 – 215 (18-20) 161 – 194 (15 – 18) Mundka No large land parcels available 194 – 237 (18-22) 172 – 194 (16 – 18) Sonipat 17 – 25 194 – 215 (18-20) 172 – 194 (16 – 18)
Source: Knight Frank Research
Source: Knight Frank Research
NH-48 / Kundli Manesar Palwal (KMP) Expressway
Others Ghaziabad cluster
FY 2021
73%
24%
3%
Transaction share by end-use of space (FY 2021)
Source: Knight Frank Research
Notes:
Warehousing transactions: These refer to storage activity
Industrial transactions: These refer to manufacturing activity
1%
Warehousing
Industrial
99%
I N D I A W A R E H O U S I N G M A R K E T R E P O R T 2 0 2 17 3
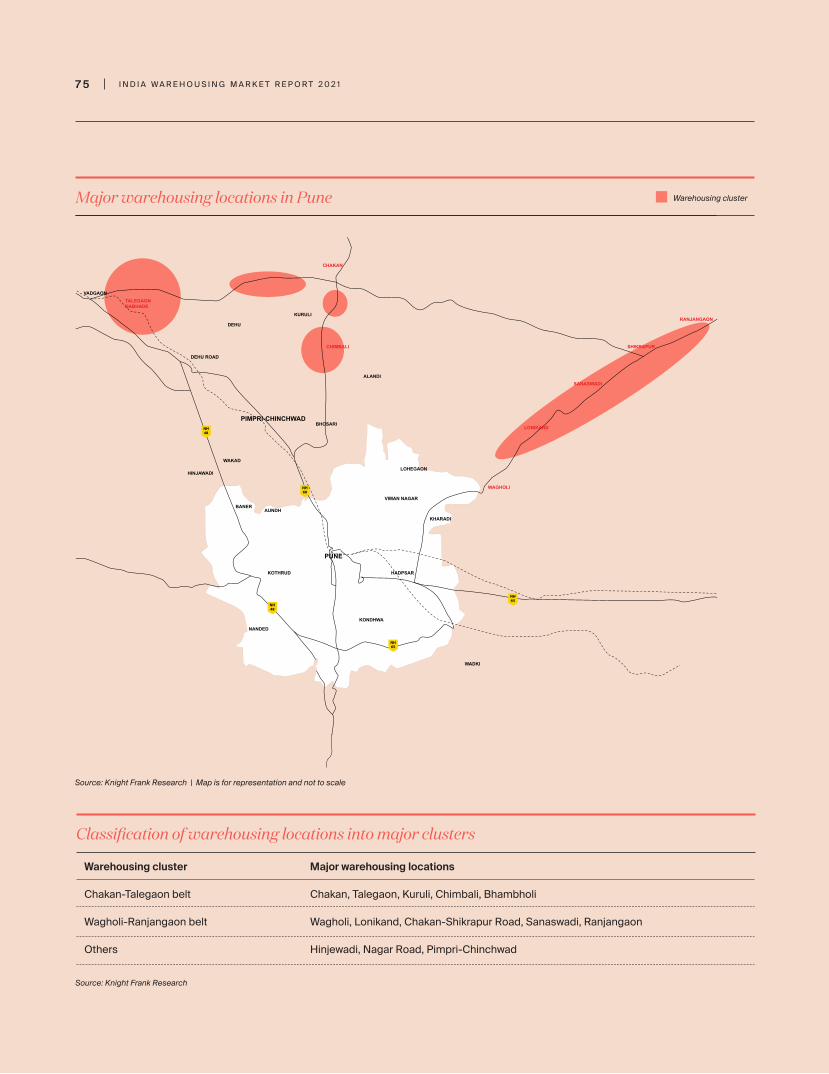
I N D I A W A R E H O U S I N G M A R K E T R E P O R T 2 0 2 17 6
Warehousing market transaction volume
Select warehouse projects
Warehouse project Warehouse cluster
Greenbase Industrial Park Talegaon
Indospace Park Ranjangaon
Embassy Park Chakan
ESR Park Chakan
KSH Group Chakan
Source: Knight Frank Research
Major infrastructure in Pune
Name Type
Ring Road Road infrastructure
MIDC Chakan upcoming phases Industrial zones
Source: Knight Frank Research
Select large occupiers
Occupier Occupier industry Warehouse cluster
IKEA Retail Chakan-Talegaon
Aptiv Components Other sectors Chakan-Talegaon India Pvt Ltd
Amazon E-commerce Chakan-Talegaon
Haier Appliances FMCD Ranjangaon India
Stellar Value 3PL Chakan-TalegaonChain Solutions
Source: Knight Frank Research
Industry-split of transaction volume (FY 2021)
Source: Knight Frank Research
E-commerce
FMCD
Retail
3PL
FMCG
Notes:
Warehousing transactions data includes light manufacturing/ assembling.
Other Sectors – These include all manufacturing sectors (automobile, electronics, pharmaceutical, etc.) excluding FMCG and FMCD.
Miscellaneous – These include services such as telecom, real estate, document management, agricultural warehousing and publishing.
Source: Knight Frank Research
Mn
sq m
FY 2018 FY 2019 FY 2020
0.05
0.1
0.15
0.2
0.25
FY 2021
0.26
0.45
0.32
0.3
0.35
0.4
70%
13%
7%
6%
1%2%
Other sectors
0.45
0.5
0.26
Major warehousing locations in Pune Warehousing cluster
Warehousing cluster Major warehousing locations
Chakan-Talegaon belt Chakan, Talegaon, Kuruli, Chimbali, Bhambholi
Wagholi-Ranjangaon belt Wagholi, Lonikand, Chakan-Shikrapur Road, Sanaswadi, Ranjangaon
Others Hinjewadi, Nagar Road, Pimpri-Chinchwad
Classification of warehousing locations into major clusters
Source: Knight Frank Research
Source: Knight Frank Research | Map is for representation and not to scale
I N D I A W A R E H O U S I N G M A R K E T R E P O R T 2 0 2 17 5
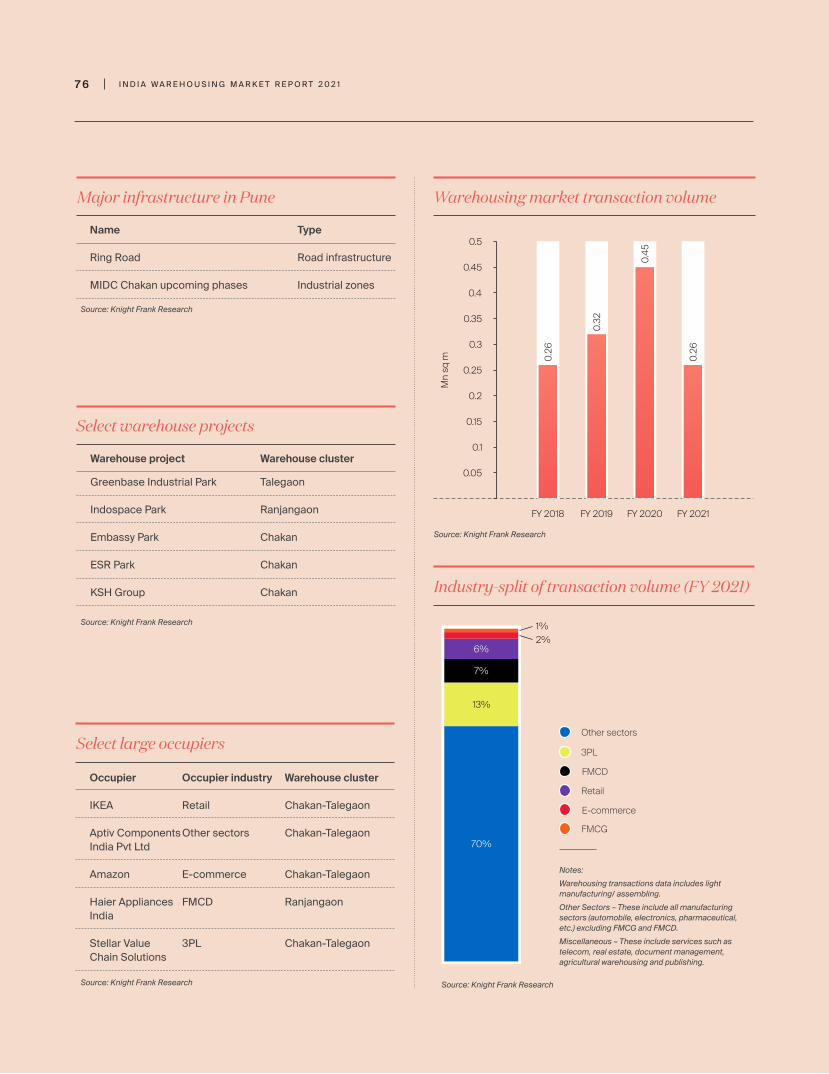

I N D I A W A R E H O U S I N G M A R K E T R E P O R T 2 0 2 17 8
• Surat is the eighth largest city in India by population and second largest in the state of Gujarat. The city boasts of many affluent neighborhoods due to the presence of large diamond and textile industries. The city also has a port located on the north-west of the city at Hazira.
• Surat also prides itself on the presence of large industrial companies like Essar, Shell, L&T, NTPC, ONGC, GAIL, GSEG Power Plant, Gujarat State Petroleum Corporation, UltraTech Cement, and Hazira Manufacturing Division (HMD) of Reliance Industries in the Hazira Belt.
• Over 80% of the world's diamonds are cut and polished in Surat, making it one of the indispensable locations for the diamond trade. The upcoming Surat Diamond Bourse would be a one of its kind diamond trading facility in the world.
• Due to the high affluence and consumption levels, a majority of the warehousing demand is from the B2C segments such as retail and e-commerce.
• There are 3 major warehousing locations in Surat – Kosamba - Palsana belt, Palsana - Sachin belt and Icchapor-Hazira belt.
• The Kosamba-Palsana belt, located along the Mumbai-Ahmedabad National Highway NH 48, is one of the oldest warehousing locations of the city. However, the Surat Urban Development Authority (SUDA) has come out with a Town Planning Notification which reserves land between the Kamrej-Kadodara corridor, and the area falling within 1 km from the periphery of the existing NH 48 on both sides is designated for residential use, prohibiting any kind of new industrial development. Developers who had got their approvals prior to this notification can construct warehouses, but no new warehousing project is permitted. As a result, the supply is getting constricted and land prices have increased (INR 30-50 mn/acre or much higher in some locations), making this belt unsuitable for warehousing.
S U R A TW A R E H O U S I N G M A R K E T
• The warehousing demand has shifted closer to Palsana Circle in the Kosamba-Palsana belt. The land in this zone does not fall under reservation and is suitable for warehousing activity due to good connectivity with the city. Modern warehouses are coming up in this belt located along NH-48. 38% of the transactions in FY 2021 were in the Kosamba-Palsana belt.
• The upcoming warehousing belt in Surat is the Palsana-Sachin belt which is also an industrial location. Due to its close proximity to Surat city, this belt is preferred by e-commerce companies. The belt had 44% share of transactions in FY 2021.
• The Icchapor-Hazira belt is predominantly an industrial location and has one of the major ports of India. Warehousing supply in this belt caters to the industrial demand.
• In FY 2021, the city witnessed warehouse leasing to the tune of 76,855 sq m (827,270 sq ft). The transactions grew 80% YoY driven by demand from 3PL and e-commerce.
• 3PL garnered 50% share of transactions followed by e-commerce at 25%. The rents have largely been stable due to the rise in demand from these segments.
Cluster-split of transaction volume (FY 2021)
Land rate and rents
Warehouse cluster Location Land rate Grade A Grade B (INR mn/acre) Rent per month in Rent per month in INR/sq m (INR/sq ft) INR/sq m (INR/sq ft)
Chakan-Talegaon Chakan 18 – 23 269 – 301 (25 – 28) 194 – 226 (18 – 21) Talegaon 18 – 24 215 – 258 (20 – 24) 172 – 194 (16 – 18) Kuruli Large land parcels not available No Grade A supply 151 – 172 (14 – 16) Chimbali Large land parcels not available No Grade A supply 151 – 172 (14 – 16)Wagholi-Ranjangaon Wagholi Large land parcels not available 215 – 269 (20 – 25) 161 – 183 (15 – 17) Lonikand 15 – 20 172 – 183 (16 – 17) 140 – 161 (13 – 15) Chakan-Shikrapur Road 12 – 16 194 – 215 (18 – 20) 151 – 172 (14 – 16) Sanaswadi 12 – 15 No Grade A supply 140 – 161 (13 – 15) Ranjangaon MIDC 18 – 20 194 – 215 (18 – 20) 151 – 183 (14 – 17)Others Shirwal 10 – 14 172-194 (16 – 18) 151 – 161 (14 – 15)
Source: Knight Frank Research
Source: Knight Frank Research
Transaction share by end-use of space (FY 2021)
Source: Knight Frank Research
Notes:
Warehousing transactions: These refer to storage activity
Industrial transactions: These refer to manufacturing activity
FY 2021
74%
7%
Chakan-Talegaon
Others
19%
Ranjangaon
Warehousing
Industrial
66%
34%
I N D I A W A R E H O U S I N G M A R K E T R E P O R T 2 0 2 17 7
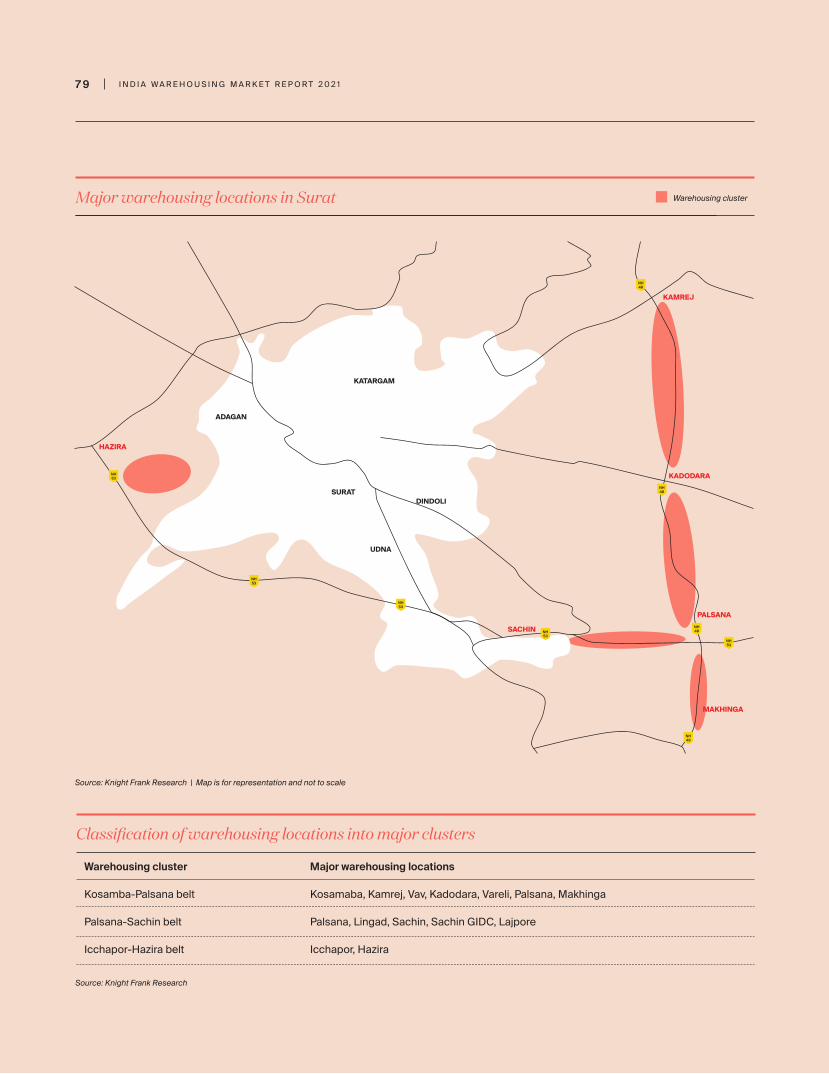
I N D I A W A R E H O U S I N G M A R K E T R E P O R T 2 0 2 18 0
Source: Knight Frank Research
Warehousing market transaction volume
Mn
sq m
Select warehouse projects
Warehouse project Warehouse cluster
Rajhans Transport Nagar Kosamba-Palsana
Ashwika Warehousing Kosamba-Palsana
Footprint Logistics Park Kosamba-Palsana
Vibrant Industrial Park Kosamba-Palsana
Bhagyashree Logistics Palsana-Sachin
Ashwika Warehousing Palsana-Sachin
Source: Knight Frank Research
Major infrastructure in Surat
Name Type
Delhi-Mumbai Industrial Corridor (DMIC) Industrial corridor
Delhi-Mumbai Expressway Express highway
Hazira Port Port
Source: Knight Frank Research
Select large occupiers
Occupier Occupier industry Warehouse cluster
Flipkart E-commerce Kosamba-Palsana and Palsana-Sachin
E-Com Express E-commerce Palsana-Sachin
Dava India Other sectors Icchapor-Hazira
Delhivery 3PL Palsana-Sachin
Shadowfax 3PL Kosamba-Palsana
Myntra E-commerce Kosamba-Palsana
Source: Knight Frank Research
FY 2019 FY 2020
0.01
0.02
0.03
0.04
0.05
FY 2021
0.04
0.08
0.02
Industry-split of transaction volume (FY 2021)
Source: Knight Frank Research
FMCG
E-commerce
Other sectors
3PL
Retail
Notes:
Warehousing transactions data includes light manufacturing/ assembling.
Other Sectors – These include all manufacturing sectors (automobile, electronics, pharmaceutical, etc.) excluding FMCG and FMCD.
Miscellaneous – These include services such as telecom, real estate, document management, agricultural warehousing and publishing.
0.06
0.07
0.08
0.09
50%
25%
18%
4%3%
Major warehousing locations in Surat Warehousing cluster
Warehousing cluster Major warehousing locations
Kosamba-Palsana belt Kosamaba, Kamrej, Vav, Kadodara, Vareli, Palsana, Makhinga
Palsana-Sachin belt Palsana, Lingad, Sachin, Sachin GIDC, Lajpore
Icchapor-Hazira belt Icchapor, Hazira
Classification of warehousing locations into major clusters
Source: Knight Frank Research
Source: Knight Frank Research | Map is for representation and not to scale
SURAT
UDNA
DINDOLI
KATARGAM
ADAGAN
NH53
NH53
NH53
NH53
NH53
NH48
NH48
NH48
NH48
KAMREJ
HAZIRA
KADODARA
SACHIN
MAKHINGA
PALSANA
I N D I A W A R E H O U S I N G M A R K E T R E P O R T 2 0 2 17 9

I N D I A W A R E H O U S I N G M A R K E T R E P O R T 2 0 2 18 2
• Vapi city is located near the banks of the Daman Ganga river and surrounded by the Union Territories of Daman and Diu and Dadra Nagar Haveli. The city is a major chemical manufacturing hub in India.
• Warehousing in Vapi is largely fragmented, small clusters are located in and around the city and the supply is shared between Vapi, Daman and Silvassa. The important warehousing locations around Vapi are Bhilad, Tumb, Naroli and Masat. There is very little speculative stock in Vapi and most of the warehousing is built-to-suit.
• A significant percentage of the warehousing demand caters to industrial requirements. However, with consumption demand picking up, new warehouses are coming up towards the south of the city along NH48, after the Bhilad toll between Bhilad and Tumb. Tumb has the largest privately operated International Cargo Terminal (ICT) in India.
• In FY 2021, the city witnessed leasing volumes grew by 296% to 58,900 sq m (634,000 sq ft). The rentals for Grade A supply in Vapi are over INR 18 per sq ft per month.
• 38% of the leasing demand in FY 2021 was from industrial segments which includes various kinds of light to heavy manufacturing activities and 62% was from warehousing segments which is generally used for storage activities.
• E-commerce companies have not taken up space but serve this region through their 3PL partners.
V A P IW A R E H O U S I N G M A R K E T
Cluster-split of transaction volume (FY 2021)
Land rate and rents
Warehouse cluster Location Land rate Grade A Grade B (INR mn/acre) Rent per month in Rent per month in INR/sq m (INR/sq ft) INR/sq m (INR/sq ft)
Kosamba-Palsana Kosamba 80 – 150 183 – 215 (17 – 20) 140 – 172 (13 – 16)
Kadodara 25 – 50 215 – 269 (20 – 25) 161 – 205 (15 – 19)
Palsana 25 – 40 205 – 237 (19 – 22) 161 – 194 (15 – 18)
Vesma 10 – 15 183 – 215 (17 – 20) 151 – 172 (14 – 16)
Palsana-Sachin Palsana 25 – 40 205 – 237 (19 – 22) 161 – 194 (15 – 18)
Sachin 20 – 40 215 – 269 (20 – 25) 172 – 205 (16 – 19)
Icchapor-Hazira Hazira 10 – 20 215 – 269 (20 – 25) 161 – 194 (15 – 18)
Icchapor 15 – 25 205 – 248 (19 – 23) 161 – 194 (15 – 18)
Source: Knight Frank Research
Source: Knight Frank Research
Transaction share by end-use of space (FY 2021)
Source: Knight Frank Research
Notes:
Warehousing transactions: These refer to storage activity
Industrial transactions: These refer to manufacturing activity
Warehousing
100%
FY 2021
44%
3%
Palsana to Sachin
Icchapor-Hazira
38%
16%
Kosamba to Palsana
Others
I N D I A W A R E H O U S I N G M A R K E T R E P O R T 2 0 2 18 1

I N D I A W A R E H O U S I N G M A R K E T R E P O R T 2 0 2 18 4
Warehousing market transaction volume
Select warehouse projects
Warehouse project Warehouse cluster
Aveny Logistics park Vapi-Silvassa-Daman
Musaddilal Projects Vapi-Silvassa-Daman
Ashwika Warehousing Vapi-Silvassa-Daman
Galaxy Hubco Vapi-Silvassa-Daman
Nandigram Realtors Vapi-Silvassa-Daman
Source: Knight Frank Research
Major infrastructure in Vapi
Name Type
Delhi Mumbai Industrial Corridor (DMIC) Industrial corridor
Delhi-Mumbai expressway Express highway
Source: Knight Frank Research
Select large occupiers
Occupier Occupier industry Warehouse cluster
AYM Syntex Other sectors Vapi-Silvassa-Daman
Precision Rubber Other sectors Vapi-Silvassa-Daman
Aero Pharma Other sectors Vapi-Silvassa-Daman
Delhivery 3PL Vapi-Silvassa-Daman
Hamilton 3PL Vapi-Silvassa-Daman
Source: Knight Frank Research
Industry-split of transaction volume (FY 2021)
Source: Knight Frank Research
3PL
Notes:
Warehousing transactions data includes light manufacturing/ assembling.
Other Sectors – These include all manufacturing sectors (automobile, electronics, pharmaceutical, etc.) excluding FMCG and FMCD.
Miscellaneous – These include services such as telecom, real estate, document management, agricultural warehousing and publishing.
Source: Knight Frank Research
FY 2020
10,000
20,000
30,000
40,000
50,000
FY 2021
60,000
70,000
90% Other sectors
10%
14,8
64
58,9
00
Major warehousing locations in Vapi Warehousing cluster
Warehousing cluster Major warehousing locations
Vapi-Silvassa-Daman Valvada, Borigam, Silvassa, Bhilad, Vankas, Daheli, Bhathi Karambeli, Jamburi, Bhimpore
Classification of warehousing locations into major clusters
Source: Knight Frank Research
Source: Knight Frank Research | Map is for representation and not to scale
BHILAD
NAROLI
BHIMPORE
VAPI
TUMB
SILVASSA
I N D I A W A R E H O U S I N G M A R K E T R E P O R T 2 0 2 18 3

I N D I A W A R E H O U S I N G M A R K E T R E P O R T 2 0 2 18 6
• Visakhapatnam is a port city on the east coast of India. The city's port is one of the 13 major ports and the fifth busiest cargo port in the country. It is also the only natural harbour on the eastern coast of India.
• Owing to its strategic geography, Visakhapatnam has been functioning as a trade centre since colonial times. Modern infrastructure has helped harness the city's trade potential even further. It is slated to be developed as a Smart City under the first phase of Smart Cities Mission.
• The city is an important node on the East Coast Economic Corridor and the work on the Visakhapatnam Chennai Industrial Corridor component is already underway. National Highway 16 (NH 16), popularly known as the Chennai-Kolkata Highway, passes through the city and the intra-city connectivity is enabled by a network of arterial roads including Beach Road, Daba Gardens Road, Waltair Main Road and Dwaraka Nagar Road.
• Heavy industries such as steel fabrication, ship building, thermal energy, oil & petroleum and dredging have a strong presence in Visakhapatnam. Fishing is an important occupation in the city and forms a chief component of the city's exports. These industries have tradit ionally been driving the warehousing demand in Visakhapatnam.
• E-commerce sector and 3PL players catering to retail and FMCG companies are recent additions to the warehousing and logistics demand of the city.
• Prime warehousing clusters in Visakhapatnam are the Gajuwaka-Auto Nagar cluster covering the city centre and adjacent coastal belt and the Madhurwada cluster that covers the northern areas of the city, adjacent to the port. Besides them, small warehousing pockets exist in the industrial areas of Vuda Colony-Mindi, Parawada and the Atchutapuram Special Economic Zone (SEZ).
V I S A K H A P A T N A M W A R E H O U S I N G M A R K E T
• In FY 2021, transactions for the Visakhapatnam warehousing market stood at 0.01 mn sq m (0.1 mn sq ft), an 8% YoY fall. E-commerce and 3PL players were the sole drivers of this warehousing demand with their respective demand shares being 48% and 52%. The Gajuwaka-Auto Nagar cluster accounted for 75% of the FY 2021 warehousing absorption whereas the remaining 25% was concentrated in the Madhurwada cluster.
• The city is dominated by standalone warehouses, primarily of the Grade B category. Rentals for Grade A and B warehouses range between INR 17-27 sq ft/month and have seen marginal appreciation since FY 2020.
Cluster-split of transaction volume (FY 2021)
Land rate and rents
Warehouse cluster Location Land rate Grade A Grade B (INR mn/acre) Rent per month in Rent per month in INR/sq m (INR/sq ft) INR/sq m (INR/sq ft)
Vapi-Silvassa-Daman Vapi 17.5 – 40 205 – 237(19 – 22) 161 – 194 (15 – 18)
Bhilad 15 – 25 183 – 215 (17 – 20) 151 – 172 (14 – 16)
Daman 15 – 25 183 – 215 (17 – 20) 151 – 172 (14 – 16)
Silvassa 15 – 25 183 – 215 (17 – 20) 151 – 172 (14 – 16)
Umargaon 10 – 20 172 – 205 (16 – 19) 140 – 161 (13 – 15)
Sarigam 10 – 20 172 – 205 (16 – 19) 140 – 161 (13 – 15)
Source: Knight Frank Research
Source: Knight Frank Research
Transaction share by end-use of space (FY 2021)
Source: Knight Frank Research
Notes:
Warehousing transactions: These refer to storage activity
Industrial transactions: These refer to manufacturing activity
FY 2021
100%
Vapi-Silvassa-Daman
Warehousing
Industrial62%
38%
I N D I A W A R E H O U S I N G M A R K E T R E P O R T 2 0 2 18 5

I N D I A W A R E H O U S I N G M A R K E T R E P O R T 2 0 2 18 8
Source: Knight Frank Research.
Warehousing market transaction volume
Mn
sq m
Select warehouse projects
Warehouse project Warehouse cluster
A-STAR Logistics Gajuwaka–Auto Nagar Cluster
UTPL Logistics Gajuwaka–Auto Nagar Cluster
Source: Knight Frank Research
Major infrastructure in Visakhapatnam
Name Type
Beach Road Road
Waltair Main Road Road
Dwaraka Nagar Road Road
Chennai Kolkata Highway / NH 16 Road
Visakhapatnam Chennai Industrial Corridor Road
Visakhapatnam Port Sea
Visakhapatnam Airport Airport
Source: Knight Frank ResearchNote: NH stands for National Highway, MMLP stands for Multi-modal Logistics Park
FY 2020
0.009
0.0092
0.0094
0.0096
0.0098
0.01
FY 2021
0.01
0
0.00
9
Industry-split of transaction volume (FY 2021)
Source: Knight Frank Research
3PL
Notes:
Warehousing transactions data includes light manufacturing/ assembling.
Other Sectors – These include all manufacturing sectors (automobile, electronics, pharmaceutical, etc) excluding FMCG and FMCD.
Miscellaneous – These include services such as telecom, real estate, document management, agricultural warehousing and publishing.
E-commerce
52%
48%Select large occupiers
Occupier Occupier industry Warehouse cluster
Coldman 3PL Gajuwaka-Auto Nagar Logistics Cluster
Flipkart E-commerce Gajuwaka-Auto Nagar Cluster
Amazon E-commerce Madhurwada Cluster
Ecom Express E-commerce Madhurwada Cluster
Xpressbees 3PL Gajuwaka-Auto Nagar Cluster
Source: Knight Frank Research
0.0102
0.0104
Major warehousing locations in Visakhapatnam Warehousing cluster
Warehousing cluster Major warehousing locations
Gajuwaka-Auto Nagar cluster Auto Nagar and surrounding areas, Gajuwaka
Madhurwada cluster Madhurwada
Classification of warehousing locations into major clusters
Source: Knight Frank Research
Source: Knight Frank Research | Map is for representation and not to scale
16
16
MADHURWADA
GAJUWAKA-AUTO NAGAR VISAKHAPATNAM
GAJUWAKA PART
PEDAMADAKA
GANGAVARAM
LANKELAPALEM
PEDAMUSIDIVADA
CHEEPURUPALLE
PENDURTHI
ANANDAPURAM
16
I N D I A W A R E H O U S I N G M A R K E T R E P O R T 2 0 2 18 7

I N D I A W A R E H O U S I N G M A R K E T R E P O R T 2 0 2 19 0
Marcus FornellRhenus Contract Logistics India Pvt Limited
Since the beginning of the Covid-19 pandemic, the logistics sector has seen increased pressure due to sudden shifts in supply and demand patterns and the rippling effects of recurring lockdowns.
While most of the industries were severely affected during the lockdowns, the warehousing sector played a crucial role in absorbing increased storage requirements of imported raw materials and intermediaries w a i t i n g t o b e c o n s u m e d o r t h e i n c r e a s e d d e m a n d o f t h e e-commerce sector.
While the warehousing demand in the coming years is expected to grow further, we foresee a continued shift to more modern and larger multi-client facilities with a higher degree of standardization, operational flexibility and quality of infrastructure and service.
As India ranks amongst the highest in terms of logistics cost, we firmly believe that the high cost of logistics is attributable to various factors. Inefficiencies in packing, storage, handling, and transportation are a few of the reasons. Similarly, the lack of real-time visibility, shortcomings in processes and supporting IT system add to the problem of high logistics cost.
Standardization must take place across all the elements of the supply chain and a high degree of standardization will be the key to derive benefits to the industry across multiple sectors. Unitization and palletization will be essential to achieving a seamless flow of goods within the ecosystem, reduction of the human interface and related errors, economies of scale, faster lead times and total cost reduction.
Cluster-split of transaction volume (FY 2021)
Land rate and rents
Warehouse cluster Location Land rate Grade A Grade B (INR mn/acre) Rent per month in Rent per month in INR/sq m (INR/sq ft) INR/sq m (INR/sq ft)
Gajuwaka–Auto Auto Nagar and surroundings 30 - 45 235 – 290 (22 – 27) 180 – 245 (17 – 23)Nagar cluster
Madhurwada cluster Madhurwada 45 - 60 245 – 290 (23 – 27) 180 – 260 (17 – 24)
Source: Knight Frank Research
Source: Knight Frank Research
Gajuwaka – Auto Nagar cluster Madhurwada cluster
FY 2021
25%
Transaction share by end-use of space (FY 2021)
Source: Knight Frank Research
Notes:
Warehousing transactions: These refer to storage activity
Industrial transactions: These refer to manufacturing activity
Warehousing
100%
75%
I N D I A W A R E H O U S I N G M A R K E T R E P O R T 2 0 2 18 9

I N D I A W A R E H O U S I N G M A R K E T R E P O R T 2 0 2 19 2
• Agra is the fourth most populous city in Uttar Pradesh and lies nearly 220 kms away from India's national capital, New Delhi. While most of the local economy is dependent on tourism, Agra developed into a major industrial town after independence. Medium scale industries producing footwear, leather, handicrafts and carpets coupled with iron foundries are the backbone of its local economy.
• In 2020, Agra attained the top slot in a list of 100 cities in India based on the progress or completion rate of the Smart City project. This list of pan-India ranking was released by the Ministry of Housing and Urban Affairs (MoHUA) and will help increase the profile of the city beyond a cultural and tourism hub.
• Warehousing activities are yet to take off in an organised manner and the market is currently at the cusp of an evolution.
Due to small industrial presence compared to other cities in Uttar Pradesh as well as other parts of North India, only a very small transaction volume is recorded in warehousing leasing annually. In FY 2021, the city clocked in 0.01 mn sq m (0.1 mn sq ft) warehouse spaces leased which is relatively low when compared to other Tier II markets such as Lucknow or Ludhiana.
• A few locations such as the Agra-Kolkata belt of National Highway (NH) 19 and Delhi-Agra route of NH 44 have a concentration of small and mid-sized Grade B warehousing facilities, but that too in a fragmented manner. Artoni is an upcoming warehousing location in Agra, and a few old industrial estates in Sikandra and Khandhari also have Grade B warehousing stock. A major e-commerce giant leased space in FY 2021 in the NH 19 belt while 3PL sector occupiers have also started evaluating warehouse opportunities in Agra.
A G R A
• Indore is the largest city in the state of Madhya Pradesh in terms of population and is predominantly an industry driven city. While Bhopal is the political capital of Madhya Pradesh, Indore is the commercial capital. The city is located on NH 3 Mumbai-Agra highway.
• A major industrial cluster is located 35 km south of Indore at Pithampur. The Pithampur manufacturing cluster caters to companies in the automobile, pharmaceutical and textile sectors. A majority of the warehousing demand of Pithampur is fulfilled by in-house facilities of these companies. There are a few standalone warehouses in Pithampur too, but they largely cater to the demand from industries within Pithampur and their ancillaries/vendors.
• Nearly 75% or more of the warehousing supply of Indore is concentrated towards the north of the city along NH 3 between Indore and Dewas. This warehousing cluster caters to the consumption demand of the city and is located around 20 km from the city centre. The cluster has good quality 3x3 lane roads with divider separation. Dewas Naka was the first warehousing cluster of the city. The warehouse structures here are over 10-15 years old and cater to FMCG/FMCD demand. However, as land in this region is getting expensive due to the expansion of city limits, the warehouses are now moving towards Dakachya.
• The demand is driven by major e-commerce and 3PL players. A majority of e-commerce companies have taken up space in
the cluster around Dakachya. Some of the e-commerce companies also operate through their 3PL partners in this cluster.
• Another warehousing cluster is located along the Nemawar Road which is the Indore-Nagpur highway. This cluster majorly caters to the agriculture related demand. A small amount of warehousing supply is also available near the Indore airport which caters to air cargo as well as in-city distribution networks.
• In FY 2021, the city witnessed leasing volumes of 0.11 mn sq m (1.2 mn sq ft). The leasing volumes were up 293% YoY compared to 28,335 sq m (305,000 sq ft) during FY 2020.
• 89% of the annual leasing demand in FY 2021 was from the warehousing (storage) segments and 11% was from the industrial segments. In FY 2020 entire demand was from the warehousing segments.
• The rents hover in the range of INR 118-183/sq m/month (INR 11-17/sq ft/month) in the Indore warehousing market.
• A majority of the warehousing supply is created by home-grown developers with very low presence of large national players. Some of the large local warehousing developers who are creating good quality supply are Empire Logipark, JRG Logistic Park, Lifecare Logistics, Vinayak Warehousing amongst others.
I N D O R E
O T H E RW A R E H O U S I N G M A R K E T S Agra | Indore | Jaipur
Nagpur | Patna | Siliguri Vadodara
I N D I A W A R E H O U S I N G M A R K E T R E P O R T 2 0 2 19 1

I N D I A W A R E H O U S I N G M A R K E T R E P O R T 2 0 2 19 4
• Nagpur, popularly known as the 'Orange City' is the third largest city in Maharashtra in terms of population. The city is located centrally in India and is almost equidistant from major consumption markets such as Mumbai, Delhi, Chennai and Kolkata.
• Infrastructure development within and around the city has been taking place at a rapid pace in the recent years. The city will soon be connected to Mumbai through the Mumbai-Nagpur Expressway, also known as the Samruddhi Highway. This Expressway is expected to bring down the travel time between Mumbai and Nagpur to 8 hours from over 15 hours at present. As per State Government and MSRDC, 100% land acquisition for this project has been completed and 55% of civil progress has been recorded.
• A majority of the warehousing demand in Nagpur has been driven predominantly by the industrial and manufacturing sectors. However, with the rapid growth of e-commerce, 3PL and e-commerce companies have emerged as important drivers of warehousing demand.
• The Maharashtra Industrial Development Corporation (MIDC) has developed two industrial clusters at Butibori and Hingna. Both these clusters account for a majority of the industrial activity. Many logistics and warehousing parks have come up around the clusters at Gumgaon, Waddhamana, Hingna
Road, Hingna MIDC area and Kotewada.
• The warehouses catering to the consumption demand have come up along the Nagpur-Amravati Road and Amravati-Kamleshwar Road at locations such as Lava, Nimji, Fetri Road and Khadgaon Road.
• There are a few large Grade A warehousing parks in Nagpur which are owned by local developers while some are owned by large national players. The rest of the warehousing supply is small and fragmented.
• The annual leasing volume in FY 2020 was 21,832 sq m (235,000 sq ft). In FY 2021, the leasing volume more than doubled to 50,120 sq m (539,500 sq ft). The demand in FY 2021 was driven by e-commerce and 3PL segments.
• The Multi-modal International Cargo Hub and Airport at Nagpur (MIHAN) project, due to its sheer size of economic development, is expected to attract a large amount of investment. The SEZ area in MIHAN will be one of its kind with the largest multi-product SEZ in India spread across 1,472 hectares. Large-scale concentration of industrial activity in this region is bound to give a fillip to quality warehouse development in the vicinity. However, it will take some more years for MIHAN to develop as envisaged, and warehouse developers are willing to wait it out.
N A G P U R
• Patna forms an important link in north-east India's supply chain in addition to warehousing hubs such as Lucknow, Ranchi and Guwahati that together constitute the supply chain in this region. It is also the capital and the largest city in the state of Bihar.
• Situated in the third most populous state in India, Patna also caters to the consumption base in Bihar's other cities such as Darbhanga, Muzaffarpur, Gaya and Bihar Sharif.
• The entry of e-commerce players such as Amazon and Flipkart, besides global multinationals such as Coca Cola, Pepsi and Samsung over the last few years has spurred the development of high quality pre-engineered warehousing facilities. However, it is still a largely unorganized market with the bulk of warehousing development taking place on the Patna-Gaya road to the south, NH 922 to the west and the NH 31 to the east.
• Patna transacted just over 0.02 mn sq m (0.2 mn sq ft) space during FY 2021 with 3PL players being the major drivers.
• Warehousing facilities have come up in and around Patna in an approximate radius of 35 km toward the east, west and south of the city. Rental rates for warehousing facilities range between INR 161-226/sq m/month (INR 15-21/sq ft/month) in prominent warehousing locations like Bihta, Gaurichak, Fatuha, Zero Mile, Deedarganj and Khagaul. Higher grade warehousing facilities such as those taken up by Coca Cola, Flipkart, GSK and Pepsi trade at the higher end of the range, while the converse is true for Grade B warehouses.
• The 3PL and e-commerce sectors have been focusing on strengthening their supply chain across the underserved north-east region in the country. However, transaction activity was muted during the pandemic impacted FY 2021 with volumes dropping by 69% YoY to 0.02 mn sq m (0.2 mn sq ft).
P A T N A
I N D I A W A R E H O U S I N G M A R K E T R E P O R T 2 0 2 19 3
• Among the 10 most populous cities of India, Jaipur is also Rajasthan's largest city and is situated within 300 kms from the national capital Delhi with excellent road connectivity through National Highway 48 (NH 48 (NH 8 as per old numbering)). This highway also connects Jaipur with other cities such as Ahmedabad, Ajmer, Kishangarh and Jodhpur. Jaipur-Kishangarh Expressway on this highway was the first Indian road built under the public-private partnership model and provides seamless connectivity between these two cities. Jaipur is also well-connected to Kota, Bikaner and Agra through other national highways passing through the city.
• The presence of a robust road network that connects Jaipur to northern, north-western and western cities has aided the city's warehousing market. Being a major tourism destination, a lot of godown requirement in the erstwhile years was from the textile manufacturers and FMCG companies, apart from other industries. Several factories and industrial establishments are concentrated across Vishwakarma Industrial Area (VKI), Sitapura, Bais Godam, Sudarshanpura, Mansarovar, Jaitpura and Bagru. Organized warehousing development with Grade A structures and build-to-suit (BTS) facilities have also started coming up across the city.
• In FY 2021, a total of 0.01 mn sq m (1 mn sq ft) of warehousing space was leased in Jaipur, representing a growth of 219% YoY. Of the total space leased, 48% was transacted in Mahindra World City and 19% in Vishwakarma Industrial Area followed by other locations. The spike in annual demand can be explained largely by the increased take-up from e-commerce occupiers who accounted for 32% of the space transacted during the year compared to 6% previously. Demand from other sector companies (such as automobile component manufacturers) has remained steady at 27% in FY 2021, the same as in the previous year while the share of 3PL companies has dropped from 46% to 15% YoY in the current analysis period.
• Demand from the e-commerce occupiers is likely to sustain based on the increasing number of inquiries from the sector at the close of the year. There also seems to be an inclination to take up comparatively smaller warehousing facilities closer to consumption hubs in the city to facilitate more efficient delivery and enable better stocking to deal with disruptive events like the COVID-19 pandemic. Use of modern warehouse technology, omnichannel distribution channels and maintaining a lean supply chain will emerge as key themes. The increasing development of Grade A warehousing facilities in areas such as the Mahindra World City will further enhance Jaipur's standing as an emerging warehousing market.
• Average rents have stayed buoyant, despite an increasing incidence of concessions in rent terms such as higher rent-free period, due to the turmoil caused by the COVID-19 pandemic. The market has a strong demand pipeline of potential occupiers at the end of FY 2021 which should be able to sustain rental levels in the short to medium term.
J A I P U R

I N D I A W A R E H O U S I N G M A R K E T R E P O R T 2 0 2 19 6
• Vadodara is the 18th largest city in India in terms of population and third largest in Gujarat after Ahmedabad and Surat.
• Many pharmaceutical, electrical, heavy engineering and automobile companies have their manufacturing facilities in Vadodara. In addition, the city has an automotive hub at Halol.
• There are 3 major warehousing clusters in Vadodara: Padamala-Ranoli belt on the north, Savli-Halol belt on the east and Makarpura-Por belt on the south.
• Unlike Ahmedabad, a majority of the warehouses in Vadodara are built-to-suit and there is very little stock on build and lease model. On account of low speculative supply, the warehousing rents at Vadodara are generally higher compared to that in Ahmedabad.
• The Savli-Halol belt on the East and Makarpura-Por belt on the south cater majorly to the industrial demand. Both Savli-Halol and Makarpura-Por belts have good quality 3x3 lane roads with divider. The industrial demand is driven by companies in the pharmaceutical, electrical and heavy engineering sectors. The demand from the automobile sector is small but growing, particularly in the Savli-Halol belt.
• The Padamala-Ranoli belt on the north is one of the oldest warehousing clusters of the city. Warehouse structures in this cluster are over 15-20 years old and lack modern offerings. This cluster is preferred by occupiers from the e-commerce, retail and FMCG segments, as it is closer to the intersection
of the national highway and the Ring Road.
• The warehousing demand from retail segments in Vadodara is smaller compared to Ahmedabad and the requirement is serviced by local warehouse owners. E-commerce companies, until a few years back, serviced some part of the demand from Vadodara through their supply chain networks located in Ahmedabad. However, some e-commerce companies have started taking up space within Vadodara to cater to the growing demand and shorter delivery timelines.
• While the demand for warehousing space from e-commerce and FMCG segments is growing, a dearth of ready to lease good quality warehouses is forcing them to occupy fringe facilities through 3PL companies.
• In FY 2021 the warehousing demand in Vadodara grew by 2.5% YoY to 41,899 sq m (451,000 sq ft) compared to 40,877 sq m (440,000 sq ft) in FY 2020. Companies in the 'other sectors' garnered 77% share of transactions in FY 2021 followed by 3PL and e-commerce.
• 80% of leasing demand in FY 2021 was from the warehousing (storage related) activities and 20% was from the industrial segments which involves various types of light or heavy manufacturing related activities.
• The upcoming Vadodara-Mumbai expressway which has recently been subsumed under the ambit of Delhi-Mumbai expressway, will improve access to Mumbai and further aid industrial growth in the region.
V A D O D A R A
I N D I A W A R E H O U S I N G M A R K E T R E P O R T 2 0 2 19 5
• Siliguri is West Bengal's third largest urban agglomeration after Kolkata and Asansol. Over the years, it has developed into a trading and transport hub. Its strategic location connects it with four international borders – China, Nepal, Bhutan and Bangladesh. It also connects the north-eastern region with the Indian mainland and other districts of West Bengal.
• Siliguri has good connectivity via multiple national highways to the neighbouring cities which makes distribution and transportation of goods easier. The National Highway 27 (NH 27), an ast-west national highway, passes through the heart of the city. NH 110, a 76 kms highway links it to Darjeeling, while NH 10 provides direct connectivity to Gangtok - all of which are major consumption markets in the north-eastern region.
• West Bengal's 'Logistics Park Development and Promotion Policy of West Bengal 2018' identifies Siliguri as one of the state's five locations for development of logistics park infrastructure. Due to good connectivity, easy access to industrial belts and land availability, Siliguri has emerged as a key Tier II city and elicited the interest of 3PL, e-commerce and FMCG companies.
• Along with its twin city Jalpaiguri, which is 35 kms away, Siliguri forms the largest metropolis in the North Bengal region. Ghora More, a tri-junction near New Jalpaiguri and a prime warehousing cluster in Siliguri is where most of the warehouse stock is concentrated and this is largely fragmented and unorganised. There are several godown type structures which dominate the market, and there is a huge potential for organised warehousing opportunities.
• Ghora More is connected directly to the 11 kms Eastern Bypass Road which circles Siliguri and provides further access to towns like Kalimpong and Darjeeling. Modern warehouse supply has started coming up and developers have started focusing on modern amenities to attract MNC clients. The new supply is not in the form of large organized industrial park developments, but fragmented and stand-alone structures. In FY 2021, 60% of the warehouses were leased in this cluster. Other locations such as Fulbari and Eastern Bypass are also generating interest in occupiers.
• In addition to being a major consumption market, Siliguri is also a key region for development of the end-to-end logistics parks with multimodal capabilities in the northern part of West Bengal. In FY 2021, nearly 0.04 mn sq m (0.4 mn sq ft) of new warehouse space was leased in Siliguri, representing a healthy 100% annual uptrend. While numerically, this represents a significant transaction increase over FY 2020, this is attributed largely to a handful of large sized transactions (area leased more than 4,645 sq m or 50,000 sq ft) by e-commerce, FMCG and 3PL sector occupiers. The average area leased by occupiers in Siliguri hovers in the range of 2,787-3,716 sq m (30,000-40,000 sq ft).
• In FY 2021, FMCG accounted for 43% of transaction volume followed by 20% each from 3PL and other sectors. E-commerce accounted for a 17% share in the total volume. Siliguri mostly has Grade B warehouses which command INR 140-161 per sq m/month (INR 13-15 per sq ft/month).
S I L I G U R I
3PL companies such as Udaan Logistics and TVS Logistics were active in the market during the year and added to the presence of other 3PL sector companies such as Delhivery and Safexpress who have set up regional facilities in Patna over the past two years.
• While construction activity has been affected during FY 2021, enquiries for built-to-suit facilities have sustained during the period. Patna's strategic importance in North-East India's supply chain, particularly for the FMCG sector is expected to support occupier demand going forward.

Knight Frank Research Reports are available to download atknightfrank.com/research
The statements, information, data and opinions expressed or provided herein are provided on “as is, where is” basis and concerned parties clients are required to carry out their own due diligence as may be required before signing any binding document. Knight Frank (India) Private Limited (KFIPL) makes no warranties, expressed or implied, and hereby disclaims and negates all other warranties, including without limitation, implied warranties or conditions of merchantability, fitness for a particular purpose, or non-infringement of intellectual property or other violation of rights including any third party rights. Further, KFIPL does not warrant or make any representations concerning the accuracy, likely results, or reliability of the use of the statements, information and opinions as specified herein. The statements, information and opinions expressed or provided in this presentation / document by KFIPL are intended to be a guide with respect to the purpose for which they are intended, but in no way shall serve as a guide with regards to validating title, due diligence (technical and financial), or any other areas specifically not included in the presentation. Neither KFIPL nor any of its personnel involved accept any contractual, tortuous or other form of liability for any consequences, loss or damages which may arise as a result of any person acting upon or using the statements, information, data or opinions in the publication, in part or full. The information herein shall be strictly confidential to the addressee, and is not to be the subject of communication or reproduction wholly or in part. The document / presentation is based on our understanding of the requirement, applicable current real estate market conditions and the regulatory environment that currently exists. Please note: Any change in any one of the parameter stated above could impact the information in the document/presentation. In case of any dispute, KFIPL shall have the right to clarify.
years in
INDIAINDUSTRIAL & LOGISTICSBalbirsingh KhalsaNational Director [email protected]
Pinkesh TeckwaniNational Director [email protected]
RESEARCHRajani SinhaChief Economist & National Director [email protected]
I N D I A W A R E H O U S I N G M A R K E T R E P O R T 2 0 2 1
Report Authors
Vivek RathiDirector – [email protected]
Yashwin BangeraVice President – [email protected]
Divya AgarwalAssistant Vice President – [email protected]
Nibodh ShettyConsultant – [email protected]
Pradnya NerkarAssociate Consultant – [email protected]
Key Contacts
Shishir BaijalChairman & Managing Director [email protected]
ADVISORY, RETAIL & HOSPITALITY Gulam ZiaExecutive Director [email protected]
Rajeev VijayExecutive Director - Advisory [email protected]
Saurabh MehrotraNational Director - Advisory [email protected]
CAPITAL MARKETSTushar RaneExecutive Director [email protected]
Sharad AgrawalExecutive Director [email protected]
FACILITIES & ASSET MANAGEMENT SERVICES Sathish RajendrenChief Operating Officer [email protected]
INDUSTRIAL & LOGISTICSBalbirsingh KhalsaNational [email protected]
Pinkesh TeckwaniNational [email protected]
OFFICE AGENCY & LRGViral DesaiNational [email protected]
PROJECT MANAGEMENTDeben MozaExecutive Director [email protected]
RESEARCH Rajani SinhaChief Economist & National Director [email protected]
Vivek RathiDirector [email protected]
AHMEDABADBalbirsingh KhalsaBranch [email protected]
BENGALURU Shantanu MazumderSenior Branch [email protected]
CHENNAISrinivas AnkipattiSenior [email protected]
HYDERABADSamson Arthur Branch [email protected]
KOLKATASwapan DuttaBranch [email protected]
NCRMudassir ZaidiExecutive Director - [email protected]
PUNEParamvir Singh PaulBranch [email protected]