india · pdf file · 2007-07-22country profile 2006 india this country profile is a...
TRANSCRIPT
Country Profile 2006
India This Country Profile is a reference work, analysing the country's history, politics, infrastructure and economy. It is revised and updated annually. The Economist Intelligence Unit's Country Reports analyse current trends and provide a two-year forecast.
The full publishing schedule for Country Profiles is now available on our website at www.eiu.com/schedule The Economist Intelligence Unit 26 Red Lion Square, London WC1R 4HQ United Kingdom
The Economist Intelligence Unit
The Economist Intelligence Unit is a specialist publisher serving companies establishing and managing operations across national borders. For over 50 years it has been a source of information on business developments, economic and political trends, government regulations and corporate practice worldwide.
The Economist Intelligence Unit delivers its information in four ways: through its digital portfolio, where the latest analysis is updated daily; through printed subscription products ranging from newsletters to annual reference works; through research reports; and by organising seminars and presentations. The firm is a member of The Economist Group.
London The Economist Intelligence Unit 26 Red Lion Square London WC1R 4HQ United Kingdom Tel: (44.20) 7576 8000 Fax: (44.20) 7576 8500 E-mail: [email protected]
New York The Economist Intelligence Unit The Economist Building 111 West 57th Street New York NY 10019, US Tel: (1.212) 554 0600 Fax: (1.212) 586 0248 E-mail: [email protected]
Hong Kong The Economist Intelligence Unit 60/F, Central Plaza 18 Harbour Road Wanchai Hong Kong Tel: (852) 2585 3888 Fax: (852) 2802 7638 E-mail: [email protected]
Website: www.eiu.com
Electronic delivery This publication can be viewed by subscribing online at www.store.eiu.com
Reports are also available in various other electronic formats, such as CD-ROM, Lotus Notes, online databases and as direct feeds to corporate intranets. For further information, please contact your nearest Economist Intelligence Unit office
Copyright © 2006 The Economist Intelligence Unit Limited. All rights reserved. Neither this publication nor any part of it may be reproduced, stored in a retrieval system, or transmitted in any form or by any means, electronic, mechanical, photocopying, recording or otherwise, without the prior permission of The Economist Intelligence Unit Limited.
All information in this report is verified to the best of the author's and the publisher's ability. However, the Economist Intelligence Unit does not accept responsibility for any loss arising from reliance on it.
ISSN 1473-9127
Symbols for tables "n/a" means not available; "–" means not applicable
Printed and distributed by Patersons Dartford, Questor Trade Park, 151 Avery Way, Dartford, Kent DA1 1JS, UK.
DarjilingDarjilingDarjiling
PAKISTAN
AFGHANISTAN
CHINA
MYANMAR
SRILANKA
BANGLADESH
TAJIKISTAN
NEPAL
INDIAINDIAINDIA
ANDHRAANDHRAPRADESHPRADESHANDHRAPRADESH
ANDAMANAND NICOBAR
ISLANDSLAKSHADWEEP
KARNATAKAKARNATAKAKARNATAKA
MAHARASHTRAMAHARASHTRAMAHARASHTRA
GUJARATGUJARATGUJARAT
RAJASTHANRAJASTHANRAJASTHAN
PUNJABPUNJABPUNJAB
MADHYA PRADESHMADHYA PRADESHMADHYA PRADESH
CHHATTISGARHCHHATTISGARHCHHATTISGARH
ORISSA
BIHARBIHARBIHAR
JHARKHANDJHARKHANDJHARKHAND
UTTAR PRADESHUTTAR PRADESHUTTAR PRADESH
RALARALAKERALA
GOA
TAMILTAMILNADUNADUTAMILNADU
NEW DELHINEW DELHINEW DELHI
KoKolkatalkata(Ca(Calcutta)lcutta)Kolkata(Calcutta)
Chennai(Madras)BangaloreBangaloreBangalore
HyderabadHyderabadHyderabad
NagpurNagpurNagpur
BhopalBhopalBhopalIndoreIndoreIndore
AhmadabadAhmadabadAhmadabad
JaipurJaipurJaipur
KanpurKanpurKanpur
Mumbai(Bombay)
SuratSuratSurat
NasikNasikNasik AurangabadAurangabadAurangabad
NandedNandedNanded
AkolaAkolaAkola
PunePunePune
HubliHubliHubli
BelgaumBelgaumBelgaum
Gandhidham
BhavnagarBhavnagarBhavnagar
Rann ofKachchh
Cuttack
Port Blair
Puri
CoimbatoreCoimbatoreCoimbatore
Puduchcheri (Pondicherry)
Nagappattinam
Vizagapatam (Vishakhapatnam)
Cocanada (Kakinada)
MachilipatnamKurnoolKurnoolKurnool
NizamabadNizamabadNizamabad
ChandrapurChandrapurChandrapur
Nellore
Vizianagaram
Brahmapur
MysoreMysoreMysore
SalemSalemSalem
Mangalore
hitradurgahitradurgaChitradurga
VijayawadaVijayawadaVijayawada
KhandwaKhandwaKhandwa
RaichurRaichurRaichur
Kochi (Cochin)
Kollam (Quilon)
Kozhikode(Calicut)
Thiruvananthapuram(Trivandrum) Nagercoil
MaMaMadurai
TuticTuticTuticorin
SolapurSolapurSolapurGulbargaGulbargaGulbarga
purpurKolhapur
Madgaon
SambalpurSambalpurSambalpur
KharagpurKharagpurKharagpur
Agartala
GoalparaGoalparaGoalparaShiliguriShiliguriShiliguri
JamshedpurJamshedpurJamshedpur
BilaspurBilaspurBilaspur
RanchiRanchiRanchi
RaipurRaipurRaipur
JhansiJhansiJhansi
JabalpurJabalpurJabalpur
MurwaraMurwaraMurwara
PatnaPatnaPatna
GayaGayaGaya
GorakhpurGorakhpurGorakhpur
BhagalpurBhagalpurBhagalpurVaranasi Varanasi Varanasi AllahabadAllahabadAllahabad
DhanbadDhanbadDhanbad
Baleshwar
BardBarddhamandhamanBarddhaman
BaharampuraharampurBaharampur
Imphal
Aizawl
KargilSrinagSrinagararSrinagar
JammuJammuJammu
AmritsarAmritsarAmritsar
LudLudhianahianaLudhianaJalandharJalandharJalandhar
AgraAgraAgra
BikanerBikanerBikaner
Jodhpur
UdaipurUdaipurUdaipur
Ajmer
Sikar AligarhAligarhAligarh
KotaKotaKota
GwaliorGwaliorGwaliorEtawahEtawahEtawah LucknowLucknowLucknow
ShahjahanpurShahjahanpurShahjahanpur
Leh
UnderChinesecontrol
ChandigarhChandigarhChandigarhDehra DunDehra DunDehra Dun
SaharanpurSaharanpurSaharanpur
MeerutMeerutMeerutMoraMoraMoradabad
ShillongShillongShillong
GuwahatiGuwahatiGuwahati
DibrugarhDibrugarhDibrugarhNorthNorthNorth Lakhimpur
KoKoKohima
RajkotRajkotRajkot VadodaraVadodaraVadodaraPorbandar
Veraval
BhujBhujBhuj
Bay of Bengal
AndamanIslands
NicobarIslands
IN DIA N OC EA N
LaccadiveIslands
Arabian Sea
Line of Control
Gulf of Kachch h
Gulf ofKhambhat
Gulf ofMannar
Palk Strait
Brahmaputra R.
Brahmaputra R.
Yamuna R.
Yamuna R.
Ghaghara R.
Ghaghara R.
Son R.Son R.
Mahanadi R.
Kris hn a R.Kris hn a R.
Godav ari R.
Narmada R.
Narmada R.
Tapi R.Tapi R.
D e c c a nD e c c a n
Ea
ste
rnE
ast
ern
Gh
ats
We
stern
We
s tern
Gh
ats
Gh
ats
Ganga
R. BHUTAN ItItanagaranagarItanagar
0 km 200 400 600 800
0 miles 200 400
© The Economist Intelligence Unit Limited 2006
August 2006
Main railway
Main road
International boundary
Province boundary
Main airport
Capital
Major town
Other town
ARUNACHAL PRADESH1
1
2
1515
2
33
44
ASSAM2
CHANDIGARH3
DADRA AND NAGAR HAVELI4
DAMAN AND DIU5
5
6
HIMACHAL PRADESH7
JAMMU AND KASHMIR8
MANIPUR9
9
MEGHALAYA10
10
MIZORAM11
11
NAGALAND12
12
PONDICHERRY13
13
13
13
SIKKIM14
14
15
TRIPURA15
17
17
HARYANA
6
7
8
UTTARANCHAL
WEST BENGAL
16
16
Country Profile 2006 www.eiu.com © The Economist Intelligence Unit Limited 2006
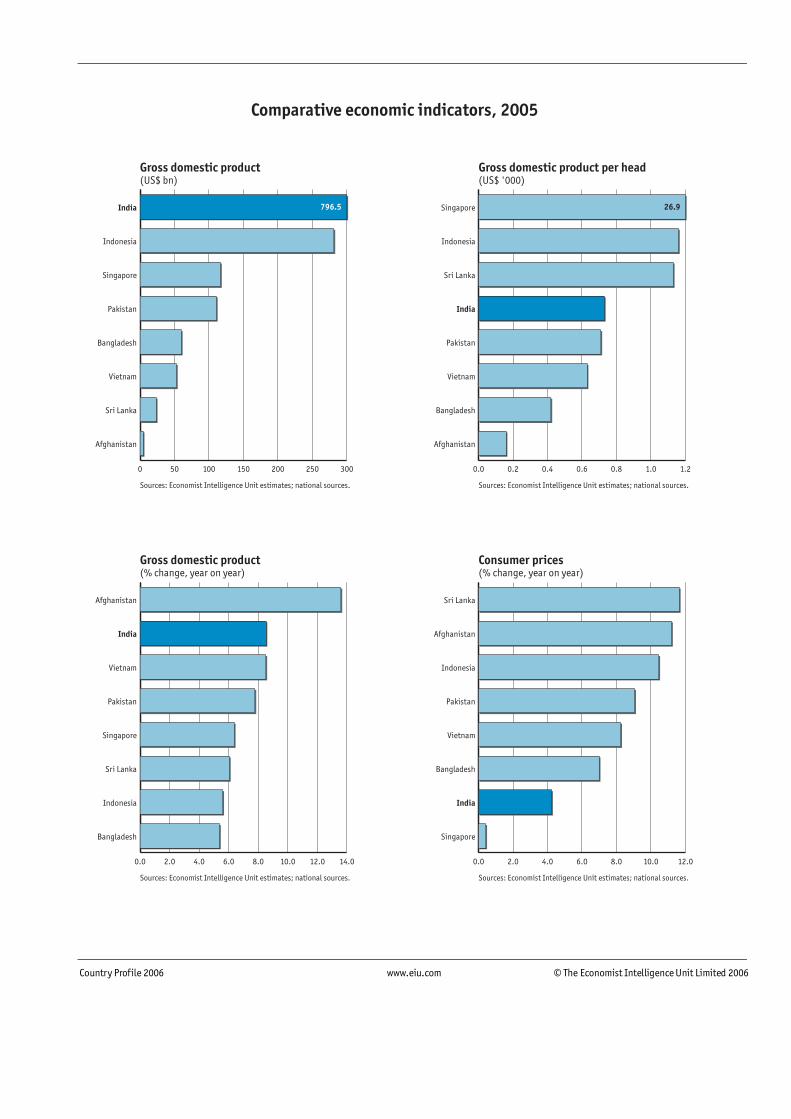
Comparative economic indicators, 2005
Gross domestic product(US$ bn)
Sources: Economist Intelligence Unit estimates; national sources.
0 50 100 150 200 250 300
Afghanistan
Sri Lanka
Vietnam
Bangladesh
Pakistan
Singapore
Indonesia
India
0.0 0.2 0.4 0.6 0.8 1.0 1.2
Afghanistan
Bangladesh
Vietnam
Pakistan
India
Sri Lanka
Indonesia
Singapore
0.0 2.0 4.0 6.0 8.0 10.0 12.0
Singapore
India
Bangladesh
Vietnam
Pakistan
Indonesia
Afghanistan
Sri Lanka
0.0 2.0 4.0 6.0 8.0 10.0 12.0 14.0
Bangladesh
Indonesia
Sri Lanka
Singapore
Pakistan
Vietnam
India
Afghanistan
Gross domestic product(% change, year on year)
Sources: Economist Intelligence Unit estimates; national sources.
Consumer prices(% change, year on year)
Sources: Economist Intelligence Unit estimates; national sources.
Gross domestic product per head(US$ '000)
Sources: Economist Intelligence Unit estimates; national sources.
796.5 26.9
India 1
© The Economist Intelligence Unit Limited 2006 www.eiu.com Country Profile 2006
Contents
India
3 Basic data
4 Politics 4 Political background 5 Recent political developments 9 Constitution, institutions and administration 11 Political forces 15 International relations and defence
22 Resources and infrastructure 22 Population 23 Education 24 Health 25 Natural resources and the environment 26 Transport, communications and the Internet 29 Energy provision
31 The economy 31 Economic structure 33 Economic policy 35 Economic performance 38 Regional trends
38 Economic sectors 38 Agriculture 40 Mining and semi-processing 41 Manufacturing 43 Construction 44 Financial services 45 Other services
46 The external sector 46 Trade in goods 47 Invisibles and the current account 48 Capital flows and foreign debt 49 Foreign reserves and the exchange rate
51 Regional overview 51 Membership of organisations
53 Appendices 53 Sources of information 55 Reference tables 55 Population statistics 55 Transport statistics 55 Energy statistics 56 Government finances
2 India
Country Profile 2006 www.eiu.com © The Economist Intelligence Unit Limited 2006
56 Gross domestic product 57 Nominal gross domestic product by expenditure 57 Real gross domestic product by expenditure 58 Gross domestic product by sector, at constant prices 58 Money supply 58 Interest rates 58 Prices and earnings 59 Agricultural production 59 Mineral production 60 Industrial production 60 Gross domestic savings 60 Stockmarket indicators 61 Main composition of trade 61 Main trading partners 62 Balance of payments, IMF series 63 External debt, World Bank series 63 Foreign reserves 63 Exchange rates
India 3
© The Economist Intelligence Unit Limited 2006 www.eiu.com Country Profile 2006
India Basic data
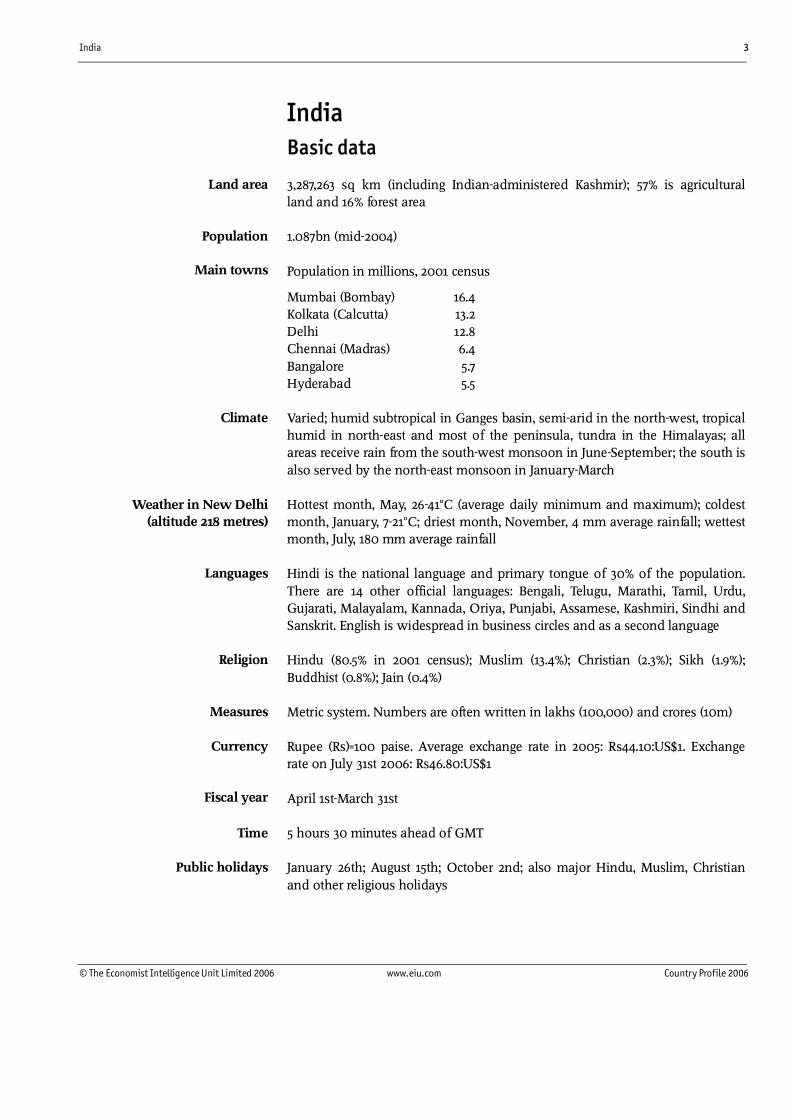
3,287,263 sq km (including Indian-administered Kashmir); 57% is agricultural land and 16% forest area
1.087bn (mid-2004)
Population in millions, 2001 census
Mumbai (Bombay) 16.4 Kolkata (Calcutta) 13.2 Delhi 12.8 Chennai (Madras) 6.4 Bangalore 5.7 Hyderabad 5.5
Varied; humid subtropical in Ganges basin, semi-arid in the north-west, tropical humid in north-east and most of the peninsula, tundra in the Himalayas; all areas receive rain from the south-west monsoon in June-September; the south is also served by the north-east monsoon in January-March
Hottest month, May, 26-41°C (average daily minimum and maximum); coldest month, January, 7-21°C; driest month, November, 4 mm average rainfall; wettest month, July, 180 mm average rainfall
Hindi is the national language and primary tongue of 30% of the population. There are 14 other official languages: Bengali, Telugu, Marathi, Tamil, Urdu, Gujarati, Malayalam, Kannada, Oriya, Punjabi, Assamese, Kashmiri, Sindhi and Sanskrit. English is widespread in business circles and as a second language
Hindu (80.5% in 2001 census); Muslim (13.4%); Christian (2.3%); Sikh (1.9%); Buddhist (0.8%); Jain (0.4%)
Metric system. Numbers are often written in lakhs (100,000) and crores (10m)
Rupee (Rs)=100 paise. Average exchange rate in 2005: Rs44.10:US$1. Exchange rate on July 31st 2006: Rs46.80:US$1
April 1st-March 31st
5 hours 30 minutes ahead of GMT
January 26th; August 15th; October 2nd; also major Hindu, Muslim, Christian and other religious holidays
Land area
Population
Main towns
Climate
Weather in New Delhi (altitude 218 metres)
Languages
Measures
Currency
Fiscal year
Time
Public holidays
Religion
4 India
Country Profile 2006 www.eiu.com © The Economist Intelligence Unit Limited 2006
Politics
India is a parliamentary federal democracy with an indirectly elected president, currently Abdul Kalam. The prime minister, Manmohan Singh, leads the United Progressive Alliance (UPA), a coalition dominated by the Congress party, which fell short of a majority in the May 2004 general election. The minority UPA government is currently being supported by the Left Front, a group of left-wing parties dominated by the Communist Party of India (Marxist).
Political background
The urban Indus civilisation flourished in west and north-west India around 5,000 years ago. India was a major exporter of textiles and spices and traded with Arabia, Egypt, Rome, south-east Asia and China. Migrants and invaders from central and western Asia have entered India many times since, if not before, Alexander the Great did so in the 4th century BC. As a result India, the world's second-largest country by population and sixth-largest in terms of area, exhibits a great diversity of people, religions and culture.
In 1526 a central Asian warrior, Babur, invaded India and established the Mughal empire. After Vasco Da Gama discovered the sea route to India via the Cape of Good Hope in 1498, a series of European chartered companies—Portuguese, British, Dutch, French and Danish—set up trading posts and colonies in India. The British East India Company eventually dominated, and in 1757 the Mughal emperor granted it the right to administer Bengal. By then the Mughal dynasty was in decline and the Marathas from the west had become the dominant power. After the East India Company defeated the Marathas in 1818, it had no military rival. Following a major Indian revolt in 1857, the East India Company deposed the last Mughal emperor, Bahadur Shah. Within months its charter to trade with India was abrogated by the British government, which annexed the Company's Indian territories, and India became a fully-fledged British colony.
British rule in India ended in 1947 after a sustained campaign for independence, led by the Indian National Congress (Congress). British India was partitioned, amid great bloodshed, to create Muslim-majority Pakistan and the secular state of India. India's first prime minister was the Congress leader, Jawaharlal Nehru. Under his government, India established a complex system of socialist economic controls that remained in place until the 1980s. Congress and its successor—Congress (Indira), or Congress (I), named after Nehru's daughter, Indira Gandhi, who became prime minister in 1966—dominated politics in India until the 1990s. Indira Gandhi's administration continued to implement an inward-looking economic policy and adopted increasingly authoritarian measures. In 1975 she declared a state of emergency that lasted for two years. Civil rights were suspended, the press was controlled, many of her critics were imprisoned and her son, Sanjay, began an unpopular mass-sterilisation programme to stem population growth. In the 1977 general election voters rejected Mrs Gandhi. Her party was defeated and she lost her seat.
Early history
Independence and dominance of Congress

India 5
© The Economist Intelligence Unit Limited 2006 www.eiu.com Country Profile 2006
Having returned as prime minister in 1980, Mrs Gandhi tacitly supported a violent movement against the Akali Dal, the ruling Sikh party in Punjab. However, the violence became uncontrollable and she finally ordered the army to storm the Golden Temple, the prime Sikh shrine in Amritsar, and kill the terrorists' leader. In retaliation, in 1984 she was assassinated by her Sikh bodyguards, and her elder son, Rajiv Gandhi, succeeded her as prime minister. In a sympathy vote he won an unprecedented majority in an election later that year, and his administration began to take cautious steps towards economic liberalisation. However, Congress lost its majority in the 1989 general election amid a series of corruption scandals, and Mr Gandhi stepped down. He was assassinated by a Sri Lankan Tamil extremist during the 1991 election campaign.
Following the 1991 general election Congress formed a minority government under Narasimha Rao, which initiated a series of economic reforms that set India on a path of stronger economic growth. The May 1996 election returned another hung parliament. The Hindu-nationalist Bharatiya Janata Party (BJP) formed a government that lasted just 13 days; this was followed by a left-leaning United Front (UF) coalition, which was supported from the backbenches by Congress. The UF government continued to implement the economic reforms begun under Congress, but when Congress withdrew its support in November 1997, the government fell. A general election held in February-March 1998 produced yet another hung parliament. The BJP finally formed a governing coalition, the National Democratic Alliance (NDA), with 22 other parties under the leadership of Atal Behari Vajpayee, a moderate.
In April 1999 the NDA government collapsed after narrowly losing a vote of confidence. It remained as a caretaker administration for six months before re-establishing itself in power following a general election held in September-October 1999. The alliance of more than 20 parties included a number of smaller regional and caste-base parties, which exercised disproportionate influence in government, often holding the administration to ransom to gain concessions in their home states. Coalition governance has become a continuing feature of Indian politics at the federal level, and increasingly also at the state level, since 1996. On both levels it seems that coalition governments have found it hard to push through policies, particularly those requiring legislative action.
Recent political developments
The BJP government in 1998 gave the go-ahead for the testing of nuclear bombs—a reflection of the party's determination to raise India's profile as an aspiring world power—even at the cost of economic sanctions. Economically, the BJP remained pragmatic during its time in government and pursued reformist policies. Politically, the BJP had to abandon some of the party's policy cornerstones, including the building a Hindu temple on the site of the Ayodhya mosque and abolishing India's separate civil code for India's Muslims to get the support of secular parties. Mr Vajpayee's popularity and integrity did much to move the party towards the political mainstream and put pragmatism over ideology. Consistent with this attempt to reinvent the essentially still
The age of coalition politics
The BJP leads a coalition government from 1998 to 2004
6 India
Country Profile 2006 www.eiu.com © The Economist Intelligence Unit Limited 2006
Hindu-nationalist party, the BJP government toned down its hardline Hindu-nationalist rhetoric in a bid to appeal to more mainstream voters as the 2004 general election approached. It presented itself both as a party that delivered economic prosperity and as a steward of a strong India with a presence on the global stage. The BJP promoted its "India is Shining" campaign, which aimed to capitalise on a buoyant economy—partly the result of its economic reforms, but also of good fortune. In contrast, the opposition Congress party presented itself as the defender of India's inclusive, secular heritage. It tried to appeal to voters across castes and religions, as well as to the poor, who had not seen the fruits of economic reform.
Composition of the Lok Sabhaa, Jun 2004 United Progressive Alliance (governing coalition) 222 Indian National Congress 145 Rashtriya Janata Dal 24 Dravida Munnetra Kazhagam 16 Nationalist Congress Party 9 Pattali Makkal Katchi 6 Telangana Rashtra Samithi 5 Jharkhand Mukti Morcha 5 Marumalarchi DMK 4 Lok Jan Shakti Party 4 Others 4
Left Front (supporting the governing coalition) 59 Communist Party (Marxist) 43 Communist Party of India 10 Others 6National Democratic Alliance (opposition) 186 Bharatiya Janata Party (BJP) 138 Shiv Sena 12 Biju Janata Dal 11 Shiromani Akali Dal 8 Janata Dal (United) 8 Telugu Desam Party 5 All India Trinamool Congress 2 Nagaland People's Front 1 Mizo National Front 1
Other parties 76 Samajwadi Party 36 Bahujan Samaj Party 19 Other parties 13 Independents 8Totalb 545
a The lower house of parliament. b Including two representatives of Anglo-Indians appointed by thepresident.
The "India is Shining" campaign backfired, with poor rural voters denied any new-found prosperity, and in a surprise victory a Congress-led coalition, the UPA, was narrowly elected to power in the May 2004 general election—the Congress party (on its own) won only eight seats more than the BJP. However, the UPA fell short of a majority and is being supported in parliament by the Left Front group of communist parties, although these parties have chosen not to join the government and are supporting it "from outside". The minority
Congress returns to power
India 7
© The Economist Intelligence Unit Limited 2006 www.eiu.com Country Profile 2006
government is led by Manmohan Singh, who was sworn in as prime minister following the refusal of the Congress leader, Sonia Gandhi, to take up the post. Mrs Gandhi remains the Congress party president and is the Congress leader in parliament. Mr Singh, who has held many important positions in the economic and civil service hierarchy in India, is a respected economist and a pragmatist and is highly regarded across the political spectrum. In his two first years in government he has managed to hold together an unwieldy coalition and has pursued a gradualist economic reform agenda. On the foreign policy front, Mr Singh, a Sikh born in the Pakistani portion of Punjab province, has continued a policy of rapprochement with Pakistan and has pushed India's bid for a permanent seat on the reformed UN Security Council. A nuclear deal with the US (which has still to be formally approved by the US Congress) has changed US-Indo relations and is likely to make India a vital US military and economic ally in coming years.
The opposition BJP has been plagued by internal tensions and in-fighting since it fell from power and is therefore unlikely to pose a substantial threat to the UPA government. A major Islamic terrorist attack or sectarian violence could, however, galvanise its traditional Hindu constituency. At the end of 2005 Lal Krishna Advani was forced to step down as party president, following ideological differences that upset the Rashtriya Swayamsevak Sangh (RSS), the party's powerful parent organisation. Under a new president, Rajnath Singh, seen by many as an interim leader, the debate over the party's ideology has continued. The outcome of what could be a long-drawn-out leadership struggle will determine whether the BJP will go back to its traditional values of Hindu nationalism, or whether it will evolve into a more moderate force in Indian politics.
The government faces no immediate threat to its survival and looks on course to last a full five-year term until 2009. However, it is severely hobbled in its ability to formulate and implement policy. Politics remains centred more on tensions within the UPA coalition and between the UPA and its notional allies, than on competition from the BJP. The main tension is between the reformist economic liberalism of several leading Congress figures, notably Mr Singh and the finance minister, Palaniappan Chidambaram, and the leftist populism of many government supporters. These include members of Congress and of its coalition partners, and in particular the communist parties, which are not in the UPA, but which lend parliamentary support to the UPA. Curiously, the largest of these, the Communist Party of India (Marxist), or CPI (M), has come to resemble the official opposition. Its strategy appears to be to use the leverage it now enjoys to expand its influence beyond those states where it is a major force—West Bengal, Tripura and Kerala—to the rest of India. To do this, it is relying on its supporters in the trade unions. This means that it has tried to block any reform seen as damaging the interests of the workforce in the "organised" sector—a definition covering workplaces with more than ten employees. There are about 30m such workers out of a total labour force of more than 400m. They have become disproportionately powerful.
The BJP has been in disarray
The Left has come to resemble the official opposition

8 India
Country Profile 2006 www.eiu.com © The Economist Intelligence Unit Limited 2006
Important recent events
April 2003
The prime minister, Atal Behari Vajpayee, initiates moves to defuse tensions with Pakistan, re-establishing communication and diplomatic links.
June 2003
India and China reach de facto agreement over the status of Tibet and also of Sikkim—a state whose accession to India in 1975 China still refuses to recognise officially—in a crossborder trade agreement.
November 2003
India matches Pakistan's offer of a ceasefire along the Line of Control in Kashmir. Pakistan's unilateral offer followed measures announced unexpectedly by the Indian government in October to improve ties with its neighbour.
December 2003
India and Pakistan agree to resume direct air links and to allow overflights. India had suspended air links after the December 2001 attack on the Indian parliament, which it blamed on Pakistani terrorists.
January 2004
A groundbreaking meeting is held between the Indian government and moderate Kashmiri separatists, marking a new chapter in the 14-year stand-off between the Indian government and the separatists.
February 2004
Formal peace talks over the disputed region of Kashmir are held in the Pakistani capital, Islamabad.
May 2004
A general election brings the Congress-led United Progressive Alliance (UPA) to power. Sonia Gandhi, the Congress leader, refuses to become prime minister. The post goes to Manmohan Singh, a former finance minister and reformer.
December 2004
Thousands die in the Asian tsunami; the Andaman and Nicobar Islands are devastated.
April 2005
A bus service between Srinagar, in Indian-controlled Kashmir, and Muzaffarabad, in Pakistani-controlled Kashmir, comes into operation.
July 2005
Islamist militants attack a holy site in Ayodhya—the flash-point of Hindu-Muslim strife in 1992—raising concerns over possible renewed inter-community violence in India and a stalling of improving relations between India and Pakistan.
October 2005
A devastating earthquake, with its epicentre in Pakistani-administered Kashmir, kills more than 1,000 people in Indian-administered Kashmir. Tens of thousands die in neighbouring Pakistan.

India 9
© The Economist Intelligence Unit Limited 2006 www.eiu.com Country Profile 2006
October 2005
Three bombs in a crowded marketplaces in Delhi kill 62 people and injure over 200. A little-known Kashmiri group claims responsibility for the attack.
February 2006
India's larges ever rural jobs scheme is launched with the aim of lifting around 60m families out of poverty.
March 2006
India and the US sign a landmark nuclear deal, which gives India access to civilian nuclear technology, while India agrees to greater scrutiny of its civilian nuclear programme.
May 2006
Congress performs poorly in four important state elections in Assam, Kerala, Tamil Nadu and West Bengal. The communists, on whose support the UPA relies, win convincingly in West Bengal and Kerala.
July 2006
Several bombs target Mumbai's commuter train system, killing over 200 people. Pakistan's president condemns the attack, and the Indo-Pakistani peace process continues.
Constitution, institutions and administration
The Republic of India is a constitutional federal democracy made up of 28 states and seven union territories. The Indian constitution defines the division of most powers between the centre and the states, although the centre takes precedence in relation to residual powers. Representation in parliament has been frozen on the basis of the results of the 1971 census. Given that population growth is much higher in the northern states, the relative value of votes cast in the north in terms of political representation has fallen. The National Population Council has recommended an extension of the "freeze" on representation until 2026. This is likely to become a source of major tension between the country's northern and southern states. India's federal structure often leads to demands for further devolution of powers to the states, as well as demands for new states to be created. In 2000 three new states—Chhattisgarh, Jharkhand and Uttaranchal (all three northern states with strong tribal representations)—were formed from Madhya Pradesh, Bihar and Uttar Pradesh respectively.
The Indian constitution provides for an independent judiciary, with high courts in every state and a Supreme Court in New Delhi. There are two houses of parliament. The lower house, or Lok Sabha (house of the people), is elected every five years by universal adult suffrage. The prime minister is elected by the Lok Sabha. Members of the upper house, or Rajya Sabha (house of the states), are elected by their respective state legislatures, according to state quotas based on population. The president is elected every five years by both houses of parliament and the state legislatures. He is confined to acting on the advice of the Council of Ministers, which is chosen by the prime minister.
Federalism
The judiciary and the legislature
10 India
Country Profile 2006 www.eiu.com © The Economist Intelligence Unit Limited 2006
India is the world's most populous democracy and has held regular and largely free elections since 1947. For members of parliament, the chances of re-election to the Lok Sabha are low (as anti-incumbency is a key trend in Indian politics), tending to increase the incentives for politicians to maximise their personal gains rather than working for the welfare of their electorate. The Election Commission of India (ECI) has wide powers to requisition the government machinery for elections and has ensured fairly orderly elections; in 2003 it won the right to make candidates disclose criminal records. However, there are occasional cases of poll rigging and intimidation; spending limits on candidates are poorly enforced and candidates with criminal records are sometimes elected, particularly to the state assemblies. Generally, a high level of political awareness and the sheer size of the electorate nevertheless ensure that the final results reflect the wishes of the people, and the ousting of incumbent administrations has become increasingly frequent.
Congress, which led the agitation for independence, emerged as the dominant party thereafter and won elections in most states in the 1950s and 1960s, although the communists and Tamil separatists occasionally won state-level elections. The situation changed following the 1975-77 state of emergency. Caste and regional splinters from the opposition alliance that won the 1977 election were increasingly successful in state elections. In the current political landscape, none of the three national parties—Congress, the BJP and the CPI (M)—can hope to win a majority in the central government on its own, and each needs to ally itself with regional or caste-based parties.
India's 28 states vary enormously in size, population and natural resources. The centre's powers to tax income, production and foreign trade give it far greater access to revenue, a large part of which is shared out among the states by the planning commission and by finance commissions that are appointed every five years. The states cannot borrow without the centre's permission. However, as the central government has become increasingly reliant on the support of regional allies, it has found it harder to refuse the states' demands to manage their own finances. The deficits of both the centre and the states are largely financed by banks and financial institutions, which channel public savings to the governments. This pre-emption of bank funds to finance excess consumption by the government—amounting to about 10% of GDP per year—has become a drag on economic growth.
As central controls on industry, finance and foreign trade have been relaxed since the early 1990s, industry has received the freedom to relocate, but has faced greater competition. These competitive pressures have been passed on to the states, which have tried to attract and retain industry. In this competition, the advanced western and southern states have been more successful: as foreign trade has become freer, industry has moved closer to Gujarat, Maharashtra, Karnataka and Tamil Nadu. In an effort to cut costs, producers have also moved closer to suppliers and markets. This has led to a prolonged slump in long-distance road transport, from which it is now slowly emerging.
Democracy and corruption
The centre versus the states

India 11
© The Economist Intelligence Unit Limited 2006 www.eiu.com Country Profile 2006
Political forces
Congress led the campaign for independence and has remained a powerful force in Indian politics, transcending religious, ethnic and caste divisions. However, it is also a party tightly focused on its heritage: members of the Nehru-Gandhi family have led the party throughout most of its history. India's first prime minister, Jawaharlal Nehru, was succeeded by Lal Bahadur Shastri, who died within a year of taking office. The party then turned to Nehru's daughter, Indira Gandhi, who remained leader until her assassination in 1984, after which her son Rajiv took over as party leader. He was assassinated in 1991, and Congress is now led by his widow, Sonia. The decline of Congress began when Indira Gandhi declared a state of emergency. Her opponents combined to form the Janata Party, which won the 1977 election. In 1980 Mrs Gandhi brought down the Janata government and returned to power. Rajiv Ghandi came to power in 1984 with the largest majority ever and the aim of liberalising and modernising government, but he was soon mired in a corruption scandal and lost the 1989 election. He managed to split and finally bring down the Janata Dal government that followed him, but he was killed before the 1991 general election. Although falling just short of a majority, Congress formed a government, and after the election carried out considerable economic liberalisation in an attempt to solve the country's balance-of-payments crisis. That did not, however, save it from defeat in the 1996 election.
As repeated efforts to form a national alternative failed, the electorate turned to regional and caste-based parties. Following Congress's poor performance in the 1998 general election, Rajiv Gandhi's Italian-born widow, Sonia, gave in to repeated requests and took over as party leader. However, her foreign birth has prompted criticism in parts of Congress as well as from the BJP. Following Congress's surprise victory in the 2004 general election, Mrs Gandhi declined to take up the post of prime minister, instead nominating Manmohan Singh. But Mrs Gandhi remained the leader of Congress, and until March 2006 chair of the National Advisory Council—a post she had to relinquish on technical grounds, which also led to her resignation as member of parliament in early 2006. However, in May 2006 she was re-elected with a landslide victory in the Nehru-Gandhi stronghold constituency of Rae Bareilly in Uttar Pradesh. Most commentators believe that the centre of power within the government lies with Mrs Gandhi rather than Mr Singh.
The stability of the current Congress-led minority government depends crucially on how readily the Left Front parties withdraw their support in case of disagreement over policy. They boycotted the co-ordination committee, in which the Left Parties agree policy with the UPA, for four months in 2005 and eventually got their way, scuppering the economic reforms the government sought to implement. The Left Front has an effective veto over any reform that requires a vote in parliament. Following the Communist parties' landslide wins in state elections in West Bengal and Kerala in the first half of 2006, they are likely to become more assertive at the national level. Congress will probably be forced to consult the Left Front more than it has in the past. The Left Front has already stymied several important reforms, notably labour market reform and privatisation. Given that it has three years of its five-year term still to run, the
The Congress party
12 India
Country Profile 2006 www.eiu.com © The Economist Intelligence Unit Limited 2006
government will need to tread a fine line between its reform ambitions and policy compromises with its political allies. While the government will try to distribute the benefits of economic growth more widely, its overriding objective will be to ensure the continuation of India's economic boom.
Equally important, however, are divisions within Congress that could result in government instability. Loyalties in the Council of Ministers are likely to be split between Mr Singh and Mrs Gandhi. Mrs Gandhi will have to reconcile the demands of individual members of the government as well as interest groups within the diverse Congress party to secure a stable government. Congress's success in the 2004 general election is evidence that the dynastic claim still exerts considerable force, particularly in rural areas. Congress profited from the excitement created by the candidacy of Rahul Gandhi, Mrs Gandhi's son, and her charismatic daughter, Priyanka. Rahul Gandhi is widely believed to be a likely future candidate to lead the party.
The Bharatiya Janata Party (BJP) traces its roots back to the Bharatiya Jan Sangh, a party representing traditional Hindu values and the interests of small businesses, traders and the middle class. It is the political wing of a group of interconnected cultural and religious movements—the Sangh Parivar—of which the most politically significant is the Rashtriya Swayamsevak Sangh (RSS), a disciplined cadre organisation that counts the president of the BJP, Rajnath Singh, and the party's senior leaders, Lal Krishna Advani and Atal Behari Vajpayee, among its former members. A member of the RSS assassinated Mahatma Gandhi, and the group is seen by its critics as sinister and anti-Muslim.
The BJP emerged as a significant force in the 1989 general election, winning 88 seats. A central campaign issue was the demand that a Hindu temple be constructed on the site of the Babri mosque in Ayodhya in Uttar Pradesh—which many Hindus believe was built upon the site of a temple marking the birthplace of the Hindu god-king Ram. In the 1991 election the BJP established itself as the main national opposition and won power in four states. In December 1992 Sangh Parivar activists demolished the Babri mosque, triggering communal riots that left thousands dead. In the 1993 state elections the BJP suffered setbacks and won control of just one state, but in the 1996 general election it won 160 seats in the Lok Sabha.
In May 1996 the BJP formed its first national government, led by Mr Vajpayee, which lasted just 13 days. The BJP re-emerged as the power broker in 1998, when it won 182 seats in the general election and cobbled together a coalition of 13 parties under Mr Vajpayee's leadership. The coalition proved unwieldy, collapsing in April 1999. However, Mr Vajpayee proved himself able to rally parties of disparate political persuasions to form a government. Another election in September-October 1999 returned a BJP-led coalition of 20 partners to power. Members of the new coalition, the National Democratic Alliance, campaigned under a common platform and won 302 seats. Despite the increased majority, however, the range of parties involved in government left the alliance vulnerable to the whims of smaller regional parties.
The BJP
India 13
© The Economist Intelligence Unit Limited 2006 www.eiu.com Country Profile 2006
Mr Vajpayee sought to rein in the party's more extreme Hindu-nationalist members, particularly in relation to questions of economic reform. But the party's reformist credentials proved increasingly shaky in the face of conflicting demands from coalition members and resistance from the BJP's nationalist wing. The close relations the party cultivated with leading industrialists also resulted in increased protection for some industries from foreign competition. On the foreign policy front, Mr Vajpayee sought improved relations with neighbouring Pakistan and paved the way for further confidence-building measures implemented by the UPA government, including the partial with-drawal of Indian troops from Kashmir in November 2004 and the establish-ment of a crossborder bus link in April 2005.
Since the electoral defeat in May 2004, the BJP has been in disarray. Following a further electoral defeat in October of that year in the politically important state of Maharashtra, the party appointed Lal Krishna Advani, one of the founders of the BJP and previously Mr Vajpayee's right-hand man, as party president. The BJP's identity crisis worsened in June 2005, when Mr Advani offered to stand down as party president after an official visit to Pakistan, during which he described Pakistan's founder, Mohammed Ali Jinnah, as a "secular" leader. The comments, possibly made by Mr Advani in an attempt to shed his image as a hardliner and to move the party more towards the mainstream, divided the BJP down the middle and outraged Hindu-nationalist organisations close to the BJP—one of the cardinal tenets of modern Indian history is that Mr Jinnah was the non-secular architect of the two-nation theory (an India for Hindus and a Pakistan for Muslims).
Eventually, a considerably weakened Mr Advani was forced to resign at the end of 2005. His successor is the less controversial Rajnath Singh, who is seen as a skilful grass-roots organiser and effective administrator, but his appointment has only temporarily suspended a divisive succession battle. Few of the younger generation of BJP leaders, such as Arun Jaitley, have the mass base enjoyed by Mr Advani or Mr Vajpayee. An exception on the Hindu right is the chief minister of Gujarat, Narendra Modi, who commands grass-roots support in right-wing Gujarat, but few see him as a potential national election-winner (as he remains too far on the right). The outcome of the struggle is likely to determine whether the BJP will go back to its traditional values of Hindu nationalism or evolve into a more moderate force in Indian politics.
The Communist Party of India (CPI) emerged from Congress, splitting from the Indian National Congress during the second world war. The CPI itself later split to form a Marxist group, the Communist Party of India (Marxist) or CPI (M). The CPI (M) is strongest in West Bengal, where it has been in power for 26 years, and it has frequently held power in Kerala and Tripura. Although the "third force" includes several powerful regional parties that are increasingly important in a fractured political scene, these parties have no strong ideological commitment to a common agenda. Instead, they are motivated by state or caste interests that can often be better served through alliances with the BJP or Congress. More recently, the Left Front group of communist parties decided not to join the Congress-led UPA government formally, but to support it from "the outside". The communists strongly oppose the deregulation of the labour
The communist parties
14 India
Country Profile 2006 www.eiu.com © The Economist Intelligence Unit Limited 2006
market and privatisation, but have at times been more pragmatic on other policy issues, such as foreign investment.
Main political figures
Manmohan Singh
Prime minister. Mr Singh has held many important positions in the economic and civil service hierarchy, including governor of the Reserve Bank of India (the central bank) and deputy chairman of the Planning Commission. An Oxford-educated economist, Mr Singh is widely respected across political parties and has a reputation of being a pragmatist. However, his critics argue that he is a weak political figure governing at the request of Sonia Gandhi. Throughout his political life he has been an appointee—he has never won a seat in India's lower house of parliament, the Lok Sabha.
Sonia Gandhi
Indian National Congress party leader in parliament, and Congress party president. Mrs Gandhi is the Italian-born widow of a former prime minister, Rajiv Gandhi. She led Congress to success in the 2004 general election but declined the offered post of prime minister. This move enhanced her moral stature in a culture with a long history of renunciation. In March 2006 Mrs Gandhi resigned as member of parliament and chair of the National Advisory Council, an "office of profit" she was not supposed to hold under Indian law to avoid a conflict of interests. She was re-elected with an overwhelming majority from her constituency Rae Bareilly in Uttar Pradesh in May 2006.
Rahul and Priyanka Gandhi
Mrs Gandhi's children and heirs to the Nehru-Gandhi dynasty. In the 2004 election campaign Rahul and his sister Priyanka emerged as the Congress's star campaigners, galvanising the campaign by their youth and emphasising the fact that the century-old Gandhi-Nehru dynasty remains India's most powerful and charismatic political family. Rahul was elected to the lower house of parliament for the first time and is being groomed as the next leader of the Congress party.
Palaniappan Chidambaram
Finance minister. Mr Chidambaram is a suave, articulate politician from the southern Indian state of Tamil Nadu. He is well-known for his pro-market reforms, particularly tax reform and budgetary discipline, during his tenure as finance minister in 1996-98. A Harvard-educated lawyer and a strong supporter of the World Trade Organisation, Mr Chidambaram is popular in business circles.
Arjun Singh
The minister for human resources and development. His plans in early 2006 to increase the number of reserved places for backward castes in higher education are highly controversial and have put him at loggerheads with the prime minister, whose job he believes should be his.
Shivraj Patil
A respected and experienced politician, he held several ministries under the Congress governments of Indira and Rajiv Gandhi. His appointment as interior minister came as surprise because he had lost his seat in the May 2004 general election.
Pranab Mukherjee
Defence minister. A prominent Gandhi family loyalist, Mr Mukherjee held at least half a dozen important ministries in past Congress governments, including finance and external affairs. He has close links with the left.
Laloo Prasad Yadav
Railway minister. Informally rules the most lawless state of Bihar by proxy. He formed the Rashtriya Janata Dal (RJD) in 1997, after breaking away from the Janata Dal party. His party is a key ally of Congress in the United Progressive Alliance (UPA) government.

India 15
© The Economist Intelligence Unit Limited 2006 www.eiu.com Country Profile 2006
Rajnath Singh
President of the opposition Bharatiya Janata Dal (BJP) since the start of 2006. Mr Singh held various important posts in his political career, including chief minister of Uttar Pradesh and minister of agriculture in the Vajpayee government. He is an effective administrator and grassroots organiser, but has the reputation of being uncharismatic.
Lal Krishna Advani
A senior figure in the Bharatiya Janata Dal (BJP) party. Mr Advani is credited with making the BJP a major political force since 1984, when it held only two parliamentary seats. He resigned as party president in December 2005, but remains the leader of the opposition in the Lok Sabha. Despite his age (77) Mr Advani has not ruled out running for the post of prime minister in 2009.
Atal Behari Vajpayee
Former prime minister and former foreign minister (in a left-right anti-Indira Gandhi coalition in the late 1970s), Mr Vajpayee has had a distinguished parliamentary career. Following the BJP's defeat in the May 2004 general election he became the party's chairman, a newly created and largely symbolic position, and has been acting as an elder statesman guiding the party.
Abdul Kalam
President of India. A former scientist and founding father of India's nuclear-missile programme. A Muslim, Mr Kalam, who is widely respected, was elected president by an overwhelming majority in July 2002.
Somnath Chatterjee
Speaker of the Lok Sabha. A veteran Marxist leader, Mr Chatterjee is the first communist leader to occupy this position. A member of parliament for the tenth time, Mr Chatterjee has established a rapport with politicians across party lines.
Mulayam Singh Yadav
Chief minister of Uttar Pradesh, India's most populous state. Leader of the Uttar Pradesh-based Samajwadi Party and former defence minister in the United Front (UF) coalition. Important among the new breed of "backward caste" politicians.
International relations and defence
India became independent in 1947 at the start of the cold war. Mr Nehru had visited the Soviet Union in the 1930s and felt that it provided the best economic model for India's development. Consequently, India did not join the Western alliance, and instead followed a policy of neutrality between the two blocs. Pakistan, meanwhile, joined the US-led South-East Asian Treaty Organisation. India's defeat by China in a short war in 1962 brought the US and India briefly closer, but as Indian relations with Pakistan deteriorated, US sympathy for India waned. In 1971, when Hindu refugees from East Pakistan flooded into India, India decided to attack Pakistan, and to ward off the US, entered into a treaty with the Soviet Union. The treaty provided India with low-cost security for the next 18 years.
Since the collapse of the Soviet Union India has built closer relations with the US and the West. Its liberal reforms in the early 1990s also made it more receptive to foreign trade and investment and led Western countries to take a greater interest in India. The 1998 nuclear tests caused a glitch in the process, but it has continued nevertheless. Indian-US relations entered a new era in 2005, when the two countries agreed to deepen their co-operation in the area of defence, including joint weapons production, greater technology sharing, and increased trade in arms. In March 2006 the US president, George W Bush,
Independence and its aftermath

16 India
Country Profile 2006 www.eiu.com © The Economist Intelligence Unit Limited 2006
visited India and signed a landmark deal that welcomed India into the club of states that the US permits to possess nuclear weapons. The deal changes the world's nuclear order by amending the Nuclear Non-Proliferation Treaty (NPT), but it will first require the approval of the US Congress. Under the agreement the US offers India "full civil nuclear energy co-operation and trade", thereby ending sanctions in place against India since its refusal to sign the NPT. (Since 1968 it has been a tenet of US foreign policy that only countries that sign the NPT are permitted access to US nuclear technology.) However, Mr Bush side-stepped the issue of backing India's bid for permanent membership on the UN Security Council by arguing that the UN first needed a series of "administrative" reforms. Meanwhile, India has stepped up its military expenditure considerably in the past five years.
Since independence, India has fought three wars with Pakistan and one with China. Disputes with Pakistan have been mainly territorial. In 1947 Pakistani tribesmen invaded the mainly Muslim princely state of Jammu and Kashmir, and Indian forces intervened at the request of the state's Hindu maharaja. The resulting war left about one-third of Kashmir with Pakistan and the remainder with India (in 1963 Pakistan ceded some of the territory it controlled to China). Kashmir remains the subject of bitter dispute between the two countries. A short war was fought in 1965 over a Pakistani incursion into disputed territory in Kutch. Another war was fought over the exodus of Hindu refugees from East Pakistan in 1971; it ended with the separation of East and West Pakistan, and the creation of Bangladesh.
The victory of the BJP-led coalition at the general election in 1998 produced a notable cooling in relations with Pakistan, compounded by both countries' nuclear tests in May that year. Talks between the two sides resumed in October 1998, culminating in the so-called bus diplomacy that saw Mr Vajpayee journey across the border for talks with his Pakistani counterpart, Nawaz Sharif, the following year. However, any thaw was quickly undone when Pakistani-backed insurgents crossed the Line of Control (LoC) dividing Indian and Pakistani positions in Kashmir, capturing several high-altitude Indian border posts in the Kargil sector in May 1999. During two months of intense fighting each side lost hundreds of men, and the conflict threatened to escalate into all-out war. The crisis was resolved in July, when the Pakistani government agreed to withdraw the intruders. Three months later the commander-in-chief of the Pakistani army, General Pervez Musharraf, staged a coup and removed Mr Sharif's elected government.
In November 2000, two years after the failed bus diplomacy, India again took the initiative on Kashmir, announcing, and subsequently extending, a unilateral ceasefire. At the end of May 2001 Mr Vajpayee called off the ceasefire and invited General Musharraf for talks in Agra in July. On the second day of talks General Musharraf said that an agreement on Kashmir must come before other normalising measures. His Indian hosts were embarrassed, and the talks broke up without an understanding being reached.
After the September 11th 2001 terrorist attacks in the US, General Musharraf supported US action against the Taliban in Afghanistan and subsequently
Relations with Pakistan look a little brighter
India 17
© The Economist Intelligence Unit Limited 2006 www.eiu.com Country Profile 2006
banned some terrorist organisations operating from Pakistan. India gave General Musharraf a list of 20 wanted terrorists, but Pakistan refused to hand them over. After the aborted attack on its parliament in December 2001, India identified the attackers and their handler as Pakistanis. India reduced diplomatic representation in Pakistan, suspended bus, train and air services, and stopped Pakistani overflights. The number of terrorist attacks in Jammu and Kashmir increased in the next six months, and in early 2002 both countries moved troops to the border. In October 2002, however, the People's Democratic Party (PDP) was elected to government in Jammu and Kashmir, forming an administration with the support of Congress. The PDP is committed to reconciliation, and at the invitation of the new chief minister, Mufti Mohammad Sayeed, Mr Vajpayee addressed a public meeting in Srinagar in April 2003, when he "extended the hand of friendship" to Pakistan.
In November 2003 India matched Pakistan's unilateral offer of a ceasefire along the LoC in Kashmir. The offer followed measures announced unexpectedly by the Indian government to improve ties with its neighbour a month earlier. In December 2003 India and Pakistan agreed to resume air links and to allow overflights. A ground-breaking meeting was also held between the Indian government and moderate Kashmir separatists in December 2003, marking a new chapter in the 14-year stand-off between the Indian government and Kashmiri separatists. In February 2004 formal peace talks over the disputed region of Kashmir were held in the Pakistani capital, Islamabad.
The rapprochement between the two nuclear neighbours has continued under the new Congress-led government since May 2004. India began a partial troop withdrawal from Kashmir in November 2004. In January 2005 India and Pakistan agreed to the single most important confidence-building measure in the last 50 years—a bus route that links Indian- and Pakistani-controlled Kashmir. Following their meeting in the Indian capital, New Delhi, in April, General Musharraf and the new Indian prime minister, Manmohan Singh, declared the peace process "irreversible".
Since then there has been little progress. General Musharraf has floated new ideas aimed at moving the peace process forward, but India has seemed rather unimpressed with both the style of his diplomacy and the substance of his proposals. In January 2006 he called for the demilitarisation of three cities in Indian-controlled Kashmir and the establishment of "self-governance" in both Indian- and Pakistani-controlled Kashmir. He suggested that self-governance should involve bringing both sides of the disputed Kashmir region under the joint control of India, Pakistan and the Kashmiris themselves. However, India rejected demilitarisation outright, arguing that any reduction in troop levels "within the territorial borders of India" would be its own decision.
India has been reluctant to make any concessions since bombs in the capital, Delhi, killed 66 people in October 2005, in an attack blamed on Pakistani militants. The prime minister, Mr Singh, reiterated in February 2006 that he did not have the mandate to negotiate the transfer of India's sovereign territory, in a reference to Indian-controlled Kashmir. Neither India nor Pakistan will agree to the other country ruling the whole of Kashmir or to full independence for the territory. India rejects the redrawing of the Line of Control, the de facto

18 India
Country Profile 2006 www.eiu.com © The Economist Intelligence Unit Limited 2006
international border. The latest proposal by General Musharraf of "self-governance"—however vague—would work, at least in principle, without violating either country's conditions. But even if India wanted to explore this path, it would also have to be acceptable to the various Kashmiri groups.
In July 2006 over 200 people died in a series of rush-hour bomb blasts on Mumbai's commuter train network. General Musharraf was quick to condemn the blasts and offered to assist in finding the perpetrators. His comments, as well as the restraint shown by the Indian government, ensured that the peace process was not derailed.
India's relations with China have long been delicate. In 1957 India discovered that China had built a road across what it regarded as the north-east corner of Kashmir. (There was no administrative presence in this remote and arid desert tract, so that the road was not immediately noticed.) China rejected India's territorial claims, and a series of violent clashes between border guards took place over the next five years. In 1962, after a particularly bloody clash Nehru ordered the army to throw out the Chinese. The army was poorly equipped and inadequately trained for mountain warfare, however, and whereas the Chinese had built roads to the border, the Indian army had to ascend along mule paths. The Chinese army dealt it a crushing defeat, but then declared a ceasefire. The defeat has made India circumspect.
Despite the fact that China has a military alliance with Pakistan and has given Pakistan considerable military assistance, the Sino-Indian border has been quiet for over 40 years. In the 1980s the two countries began talks to demarcate their frontier, but progress has been very slow. In 2005, when the Chinese prime minister, Wen Jiabao, visited New Delhi, China formally abandoned its claim to Sikkim (whose accession to India in 1975 China had previously refused to recognise officially) and pledged to support a larger role for India in the inter-national arena. In recent years Sino-Indian relations have increasingly been driven by economics. Bilateral trade between India and China has increased more than tenfold since the early 1990s; China is now India's second-largest export market and ranks fifth as a source of Indian imports. In June 2006 India and China agreed to re-open the trade route through the Nathu La that connects Sikkim and Tibet, which had been closed for trade since the 1962 conflict.
The 1971 India-Pakistan war ended with the surrender of Pakistan's entire army in the east and the establishment of Bangladesh as an independent state. Relations between India and Bangladesh are nevertheless close, if not particularly friendly. Various issues between the two countries remain unresolved, including Bangladeshi immigration into India, the sale of natural gas to India, water-sharing of the many common rivers, and Bangladesh's alleged role in harbouring Indian insurgents. India has completed the construction of over two-thirds of an iron fence along the 2,500-mile border with Bangladesh. The Bangladeshi political scene is polarised between the heirs of those who fought for independence from Pakistan on one hand, and the pan-Islamists, to whom the present governing party is close, on the other. India is Bangladesh's closest source of many goods, especially yarn for its export-oriented textile industry.
Relations with Bangladesh are strained
Relations with China have improved

India 19
© The Economist Intelligence Unit Limited 2006 www.eiu.com Country Profile 2006
India conducted its first atomic test in 1974, after which Pakistan embarked on its own nuclear programme. By 1994 it was widely accepted that Pakistan had acquired both the atom bomb and Chinese-supplied ballistic missiles. India has developed its own intermediate-range ballistic missile capability. In 1998 India tested nuclear devices, and Pakistan followed suit. The US president at the time, Bill Clinton, tried to persuade India to sign the NPT and the Comprehensive Test Ban Treaty (CTBT). However, India's political establishment, which regards the two treaties as "nuclear apartheid", refused to sign them as a matter of principle. The US came to accept that it was highly unlikely that India would ever sign the treaties. In 2005, in an effort to upgrade ties with India, the US changed its stance on the entire issue by stating that "as a responsible state with advanced nuclear technology, India should acquire the same benefits and advantages as other such states" and offered India sensitive civil nuclear technology. It thereby accepted India de facto as a nuclear power.
India maintains the second-largest army in the world, with total armed forces of 1.3m active servicemen and a further 1.2m reservists. However, its soldiers are poorly equipped, particularly for the demanding conditions in Kashmir. The army has a strictly non-political role, although it is often called upon to help beleaguered police forces in areas facing secessionist movements, such as Kashmir and the north-east. Defence expenditure stood at US$22bn in fiscal year 2005/06 (April-March), or about 3% of GDP, and given the historically tense relations with Pakistan, it is likely to remain high.
Military forces, 2005/06 India Pakistan ChinaArmy Personnel 1,100,000 550,000 1,600,000a
Main battle tanks 3,978 2,461 7,580
Navy Personnel 55,000 24,000 255,000a
Frigates 17 7 42Submarines 19 11 69Air force Personnel 170,000 45,000 400,000Combat aircraft 852 331 2,643
a Estimate.
Source: International Institute for Strategic Studies, The Military Balance 2005/06.
Security risk in India
Armed conflict
India has fought three wars with Pakistan—two over the disputed territory of Kashmir and one during Bangladesh's war of independence—as well as a major skirmish in Kargil in 1999 between Pakistan-backed militants and the Indian army. Shelling along the Line of Control (LoC), the de facto border that divides Indian and Pakistani Kashmir, is commonplace. India accuses Pakistan of giving military backing to Kashmiri separatists and Islamic militants fighting against India in Kashmir, but
The armed forces are the second-largest in the world
India is accepted as a de facto nuclear power
20 India
Country Profile 2006 www.eiu.com © The Economist Intelligence Unit Limited 2006
Pakistan claims to give only moral support to the insurgents and accuses India of repressing Muslims in Kashmir. Tensions between the two nuclear powers have been high since an attack on India's parliament building in December 2001, which India blamed on Pakistani-based militant groups. Both countries mobilised troops and stood on the brink of war. Hostility between the two countries has remained intractable, owing to the underlying Kashmir dispute: each country faces considerable domestic pressure not to make concessions to the other in relation to Kashmir. However, in April 2003 relations began to improve significantly, largely as a result of a US-backed international initiative to diffuse the crisis. India began a partial troop withdrawal from Kashmir in November 2004. The rapprochement with Pakistan has continued under the new Congress-led government. In April 2005, in the most important peace-building measure between the nuclear neighbours in four decades, a bus service between Srinagar in Indian-controlled Kashmir and Muzaffarabad in Pakistani-controlled Kashmir came into operation—the first bus route across the LoC in over 50 years. In the past, peace talks have floundered over the question of the relative importance of Kashmir. India has argued that the Kashmir dispute is one of several issues that need to be resolved, and has attempted to improve bilateral relations through the establishment of commercial links, for example, in the hope that with better relations the Kashmir dispute will diminish in relative importance. In contrast, Pakistan argues that the Kashmir dispute is the central issue and the reason behind the two countries' poor relations, and that without its resolution other confidence-building measures will be impossible. Pakistan fears that, should militancy in Kashmir end, India will feel little compulsion to offer Pakistan any concessions regarding Kashmir. India fought a war with China in 1962. Relations between the two countries are nevertheless generally neighbourly, although part of their common border in north-east India remains disputed. India's relationship with Bangladesh is also reasonable, despite occasional clashes between border guards.
Terrorism
India suffers from many bomb attacks, which often occur on buses or trains or at bus stations. Such low-level attacks are generally blamed on Pakistan's intelligence agency and Pakistani-backed Kashmiri militants. Numerous sub-nationalist groups operate within India, and although their activities are generally confined to specific areas, Kashmiri militants have conducted attacks in Delhi. The most daring of these occurred in December 2001, when a group of militants entered India's parliament building, killing at least seven people. Kashmiri militants have also taken foreign hostages, notably in 1995, when four foreigners were kidnapped in Kashmir—the four are presumed dead. More recently, in October 2005 several bombs killed 62 people and injured over 200 in market places in Delhi. A little-known Kashmiri group has claimed responsibility for the attack. Bomb blasts in the Hindu pilgrimage city of Varanasi killed 14 people in March 2006.
India 21
© The Economist Intelligence Unit Limited 2006 www.eiu.com Country Profile 2006
Apart from Kashmiri militants, several other groups operate in north-east India, campaigning for state status or independence for their regions. Maoist rebels operate in the tribal-dominated areas of central India and are thought to be linked to the Communist Party of Nepal (Maoist). The Indian government believes there may be 10,000 Maoists in the country. In the worst terrorist incident since 1993, in July 2006 over 200 people were killed in a series of rush-hour commuter train bombings across Mumbai. The police are still gathering evidence, and the government has refrained from making sweeping allegations ahead of a thorough investigation.
Civil unrest
Religious clashes between Hindus and Muslims are not infrequent, and as events in Gujarat showed in 2002, can escalate rapidly. In February 2002 a gang of Muslims attacked a train carrying Hindus from Ayodhya, killing 57 people. Hindus responded by attacking Muslims throughout Gujarat, and up to 1,000 are thought to have died. Communal clashes are often sparked or exacerbated by property or commercial disputes, rather than simply by religious intolerance. Such riots usually take place in poor districts of cities in northern India. In the latest incident of sectarian violence, in May 2006, anti-Muslim riots in Gujarat left six dead in the city of Vadodara, as Muslims protested against the demolition of an ancient Muslim shrine by the municipal authorities. The disturbances coincided with violence in Muslim-dominated Jammu and Kashmir, where militant groups killed at least 35 Hindus.
Crime
Petty crime is common in India. According to the National Crime Records Bureau (NCRB), in 2004 there were over 270,000 incidents of theft and over 90,000 of burglary. Such statistics are likely to understate the prevalence of crime. Many crimes go unreported, owing to a lack of confidence in the police. Bag-snatching and pick-pocketing are fairly common, particularly in crowded tourist areas. According to the NCRB, there were over 33,000 murders in 2004.
Drug smuggling and organised crime
Organised crime is a concern in India, particularly in Mumbai. Protection and extortion rackets have flourished, particularly in the film industry and the media generally, including cable companies. Some gangs are believed to have moved into trade unionism. This problem is likely to have been exacerbated by the number of politicians—particularly in state assemblies—with criminal records. The worst incident connected to India's underworld took place in Mumbai in 1993, when a number of bombs exploded, resulting in 257 deaths. The stock exchange, several hotels and other offices were hit, and hand-grenades were thrown at the international airport. The incidents were blamed on a combination of the underworld and the Pakistani intelligence agency.
22 India
Country Profile 2006 www.eiu.com © The Economist Intelligence Unit Limited 2006
Resources and infrastructure
Population
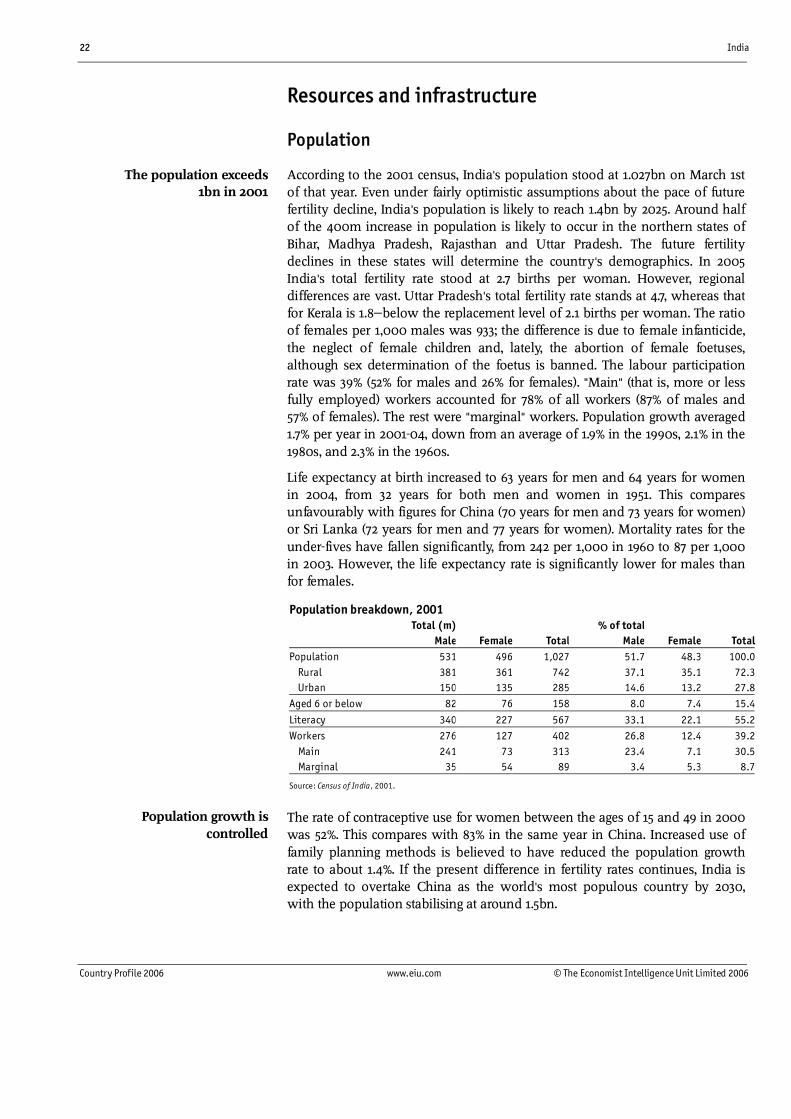
According to the 2001 census, India's population stood at 1.027bn on March 1st of that year. Even under fairly optimistic assumptions about the pace of future fertility decline, India's population is likely to reach 1.4bn by 2025. Around half of the 400m increase in population is likely to occur in the northern states of Bihar, Madhya Pradesh, Rajasthan and Uttar Pradesh. The future fertility declines in these states will determine the country's demographics. In 2005 India's total fertility rate stood at 2.7 births per woman. However, regional differences are vast. Uttar Pradesh's total fertility rate stands at 4.7, whereas that for Kerala is 1.8—below the replacement level of 2.1 births per woman. The ratio of females per 1,000 males was 933; the difference is due to female infanticide, the neglect of female children and, lately, the abortion of female foetuses, although sex determination of the foetus is banned. The labour participation rate was 39% (52% for males and 26% for females). "Main" (that is, more or less fully employed) workers accounted for 78% of all workers (87% of males and 57% of females). The rest were "marginal" workers. Population growth averaged 1.7% per year in 2001-04, down from an average of 1.9% in the 1990s, 2.1% in the 1980s, and 2.3% in the 1960s.
Life expectancy at birth increased to 63 years for men and 64 years for women in 2004, from 32 years for both men and women in 1951. This compares unfavourably with figures for China (70 years for men and 73 years for women) or Sri Lanka (72 years for men and 77 years for women). Mortality rates for the under-fives have fallen significantly, from 242 per 1,000 in 1960 to 87 per 1,000 in 2003. However, the life expectancy rate is significantly lower for males than for females.
Population breakdown, 2001 Total (m) % of total Male Female Total Male Female TotalPopulation 531 496 1,027 51.7 48.3 100.0 Rural 381 361 742 37.1 35.1 72.3 Urban 150 135 285 14.6 13.2 27.8Aged 6 or below 82 76 158 8.0 7.4 15.4
Literacy 340 227 567 33.1 22.1 55.2Workers 276 127 402 26.8 12.4 39.2 Main 241 73 313 23.4 7.1 30.5 Marginal 35 54 89 3.4 5.3 8.7
Source: Census of India, 2001.
The rate of contraceptive use for women between the ages of 15 and 49 in 2000 was 52%. This compares with 83% in the same year in China. Increased use of family planning methods is believed to have reduced the population growth rate to about 1.4%. If the present difference in fertility rates continues, India is expected to overtake China as the world's most populous country by 2030, with the population stabilising at around 1.5bn.
The population exceeds 1bn in 2001
Population growth is controlled

India 23
© The Economist Intelligence Unit Limited 2006 www.eiu.com Country Profile 2006
India has a relatively low level of urbanisation compared with most other developing countries in Asia: almost 60% of Indians live in villages with a population of less than 5,000. However, the rate of migration from rural to urban areas is increasing. The urban population constituted 28% of the total in 2001, up from just over 25% in the mid-1990s, and is likely to reach 36% around 2025. In 2001 there were 35 cities with a population above 1m; the number of such cities is likely to rise to 70 by 2025, when they will contain about one-half of the country's urban inhabitants. The urban population is growing fastest in states such as Bihar and Uttar Pradesh, which have comparatively low levels of urbanisation. More developed states such as Maharashtra and Tamil Nadu, whose populations are growing less rapidly, experience lower urban growth. The largest urban agglomerations are Mumbai (16.4m in 2001), Kolkata (13.2m), Delhi (12.8m), Chennai (6.4m), Bangalore (5.7m) and Hyderabad (5.5m).
India's population is extremely diverse, differentiated by language, religion, caste and class. A significant political divide exists between Hindus (81% of the population) and other religious groups, including Muslims (13%), Sikhs and Christians. However, Hinduism is itself a highly stratified religion, and a large number of Hindus, particularly among the lower castes, do not have a political affinity with Hindu-nationalist movements. Another important distinction exists between the primarily Hindi-speaking north and the south, where a number of vernacular languages are in use, together with English. English is a lingua franca throughout the country, however, and competence in the language is more a function of class than region.
Income and consumption differentials are significant, but not high by develop-ing-country standards: the top one-fifth of India's population accounts for around 46% of income or consumption, whereas the bottom one-fifth accounts for around 8%. About 25% of the population, or 260m people, were below the poverty line in 2000, as measured by an income level of less than one US dollar a day.
Education
Literacy rates among the population aged seven years and over have risen considerably during the 1990s. The 2001 census recorded literacy rates of 65.2%, up from 52.2% in 1991—the highest rise ever in a single decade. The male literacy rate was 75.6% in 2001 (up from 56% in 1981 and 27% in 1951), compared with 54% for women (30% in 1981 and 9% in 1951). The 2001 census indicated a decline in the total number of illiterate people for the first time since independence, with 21.5m fewer illiterate males and 10.5m fewer illiterate females in 2001 than in 1991. In spite of recent progress, India still lags behind in educational standards, both absolutely and compared with other developing countries: it has 17% of the world's population, but some 40% of the world's illiterates. India also possesses a large pool of highly educated and vocationally qualified people, although they make up a small fraction of the population. There are considerable regional variations in literacy rates: Kerala has a rate of 91%, whereas Bihar has a rate of only 49%.
The picture is mixed
Migration is shifting from rural to urban
The population is diverse

24 India
Country Profile 2006 www.eiu.com © The Economist Intelligence Unit Limited 2006
Literacy and school attendance have improved markedly since the early 1990s, as poverty has declined and educational aspirations have surged. In fiscal year 2002/03 (April-March) an estimated 82% of children in the 6-14 age group were enrolled in school. Attendance in primary schools has risen notably, but the rates for girls are significantly lower than for boys. Overall attendance in secondary schools rose from 20% in 1960 to 44% in 1991 (with the female rate rising from 13% to 32%). In higher education (science, math and engineering) the rate was 20% for both males and females in 1998-2003, the highest rate by far for a low-income developing country, and up from single digits in 1960.
India has more than 225 universities, 6,800 affiliated colleges and 1,128 polytechnics. Higher education is very competitive, increasingly so as the economy has opened up and has created more well-paid jobs in the private sector as a result. However, subsidies for higher education and a system of positive discrimination have resulted in a skewed education system. A great number of students are accepted on the basis of caste or religion rather than ability, and cheating is a serious problem. India has also become a major international centre for the recruitment of high-quality information technology (IT) staff. The renowned Indian Institute of Technology (IIT) has distinguished and international alumni including the CEO of the UK's largest firm, Vodafone.
India's constitution provides for quotas in education and government jobs for "scheduled castes"—the dalits, formerly known as untouchables. In 1990 the government approved a long-neglected report by the Mandal commission, recommending the extension of quotas to "other backward classes" (OBCs). The issue of "reservation", as it is called, is one of the most controversial in Indian politics. In mid-June 2006 the government's plans to "reserve" 27% of the places in India's colleges for the OBCs led to widespread demonstrations. Nevertheless, the government is adamant that it will implement these proposals.
Health
Health indicators have improved significantly since independence, but the overall level of healthcare remains poor. Life expectancy has risen from just 29 years at independence to around 64 years, and child mortality rates have come down. India has the largest HIV/AIDS epidemic in the world in absolute numbers—about 5.7m people had acquired the infection by end-2005. While tuberculosis and malaria are the biggest killers in India, it is quite possible that in the absence of a more urgent response AIDS could become the leading cause of death at least in some parts of the country. Some progress has been made on nutrition, but malnutrition is widespread: according to the National Nutrition Monitoring Bureau, fewer than 15% of the population are adequately nourished, although 96% receive adequate calorie intake. The World Bank estimates that malnutrition is associated with about half of all infant deaths in India. The worst-affected areas are in the north: five of India's states and 50% of villages account for about 80% of the malnutrition cases. Although there is one doctor per 1,960 head of population (1990-2003 figures), doctors are concentrated in urban areas, and this is reflected in health indicators.
Universities dominate
Health indicators improve slowly
The education system has quotas for "backward classes"

India 25
© The Economist Intelligence Unit Limited 2006 www.eiu.com Country Profile 2006
Public spending on health in India stands at around 1% of GDP, equivalent to about US$4 per person per year, and is lower than in many countries with a similar level of development. Access to healthcare is a function of wealth. Private expenditure on healthcare accounts for 4% of GDP, or 81.6% of total healthcare spending. India has a rudimentary public healthcare system of hospitals and clinics, but in general healthcare and medicines must be bought. It is estimated that only 10% of Indians have any form of health insurance, and most policies are inadequate. There are huge differences between states in terms of health spending. In Kerala and Tamil Nadu, for example, public health spending per head is double that in Bihar and Madhya Pradesh.
Natural resources and the environment
India is not well endowed with natural resources. The country accounts for 2.4% of the world's surface, but sustains around 17% of the world's population, so the pressure on resources is intense. India's main mineral reserves are coal, iron ore and bauxite. The vast majority of oil and gas are imported. Geo-graphical and climatic differences are large and partly explain the variation in economic performance across India's regions. Unlike in developed countries such as the US, where about 2% of the labour force feeds the whole population, in India around 60% of the labour force is employed in agriculture. Migration is limited, and the vast majority of Indians remain "bound to the land". Around 40% of cultivated land is irrigated, leaving most farmers entirely dependent on the annual monsoon. A large proportion of the population live in tropical, arid, or highland zones. Unlike in China, where 30% of the population live in temperate zones, in India's case this figure is zero. India's position in terms of coastal access is at a comparative disadvantage, with only 38% of the population living within 100 km of the sea or navigable waterways, compared with 45% in China and 90% in western Europe.
Nuclear power is heavily subsidised, with the objective of raising rural electrification. The government intends to raise the share of nuclear energy in total energy production from currently 3% to 10%. The consumption of traditional fuels such as logs, dung and crop residue is rising in absolute terms, although its share of total energy consumption has fallen from over 70% in 1951 to around 35% in the mid-1990s. The burning of traditional fuels remains one of the leading sources of pollution-related mortality in India.
In recent years India has stepped up its efforts to make its energy needs more secure. It imports 70% of its oil, and this dependence is set to rise. Tata Energy Research Institute, a non-profit-making think-tank, estimates that India will need to invest US$766bn in the energy sector to meet the growing demand over the next 25 years. Already the issue is shaping its global diplomacy, with India buying assets in oil and gas in Africa and the Middle East. Its most ambitious plan so far is a US$4bn, 2,600-km pipeline that would carry natural gas from Iran via Pakistan to India. In the quest for energy India is at loggerheads with China. In mid-2006 India decided to liberalise its mining laws in a bid to extract more coal, the country's only abundant natural resource.
Access to healthcare is largely a function of wealth
The pressure on resources is intense
A race to secure energy resources has ensued
26 India
Country Profile 2006 www.eiu.com © The Economist Intelligence Unit Limited 2006
Transport, communications and the Internet
The poor condition of India's infrastructure is a major hindrance to growth. Although recent government pronouncements have increasingly emphasised the need to secure investment in major infrastructure projects, real progress has only been made in the "new economy" telecommunications sector, and more recently also in road construction. The government is mobilising more public resources to tackle the problem, but at US$28bn, or 3.6% of GDP, spending on infrastructure is almost one-third that of China's (9% of GDP, or US$201bn in 2005).
India's railways are in many ways impressive. The country has the world's most extensive rail network, at 63,221 km. Indian Railways employs 1.5m staff and is the world's largest non-military employer, although this is likely to fall to 1.2m by 2010. The railways suffer from chronic underinvestment and underpricing, insufficient progress on regulatory reform, and unsound cross-subsidisation policies. Passenger traffic is heavily subsidised by higher freight charges. Railway safety has also become an issue of considerable concern after frequent accidents, underlining a lack of investment. The railways have become under intense pressure to upgrade their services since the liberalisation of the airline industry has made flying more affordable and the freight sector was liberalised and improved in 2005 and 2006.
India's poor road network has received renewed emphasis in recent years. There are about 3m km of roads, most of which are badly maintained. National highways cover just 57,700 km and carry around 45% of total road transport. Spending on road infrastructure stood at US$5.8bn, or 0.7% of GDP, in 2005/06. China spends more than four times as much on roads as a share of GDP. However, in 2002 the government introduced a seven-phase National Highways Development Programme, aimed at improving some 65,000 km of national highways.
The ambitious project seeks to expand more than 13,000 km of highway to between four and six lanes in two key areas, between India's four metropolitan centres, Delhi, Mumbai, Chennai and Kolkata—the so-called Golden Quadrilateral (GQ) project—and in the north-south and east-west corridors. The Delhi-Mumbai leg was completed in November 2005. In total about 90% of the GQ project had been completed by mid-2006, with the remaining 10% due for completion by the end of the year, two years behind schedule. The road development programme under by the National Highway Authority of India (NHAI) has involved the private sector, and despite repeated delays, caused mainly by problems with land acquisition, has been very successful so far. In June 2006 the government announced an increase in the funds it intends to spend on road infrastructure in the next seven to eight years to US$49bn.
India has 12 major ports, seven on the west coast and five on the east, which are managed by the Port Trust of India. An additional 185 minor ports, managed by state governments, account for 15% of total cargo handled. The major ports, which handle 75% of all cargo, handled 398m tonnes of cargo in 2004/05.
Standards of infrastructure are low
Railways
Ports
Roads

India 27
© The Economist Intelligence Unit Limited 2006 www.eiu.com Country Profile 2006
India's ports are plagued by inefficiency. Although turnaround time at ports improved from 8.5 days in 1996/97 to about 3.4 days in 2005/06, the overall cost-efficiency at Indian ports is relatively low compared with world averages. Poor port governance and inefficient customs clearing translate into high costs. An identical shipment of textiles to the US from India costs on average 20% more than from Thailand, and 35% more than from China.
Government initiatives to increase private-sector participation include auto-matic approval for up to 100% foreign equity in port and harbour construction projects; establishing a Tariff Authority for Major Ports (TAMP) to fix port charges collected by private providers; and setting up a Maritime States Development Council (MSDC) to help frame an integrated port development policy. Gujarat, Maharashtra and Andhra Pradesh have made particularly good progress towards attracting private-sector participation in port development. The government has also drawn up plans to promote joint ventures between major Indian ports and minor foreign ports in a bid to attract new technology and improve management practices.
India's aviation industry is among the fastest-growing in the world, with domestic and international traffic rising by 24% and 18% year on year respectively in 2005. The entry of low-cost carriers (LCCs) has led to a sharp drop in prices, and air travel has become increasingly affordable, especially for the millions of people who make up India's vast middle class. Private operators, notably Jet Airways and Air Sahara, have steadily increased their market share at the expense of the once dominant state-owned Indian Airlines. Private airlines now account for 68.9% of domestic traffic, but pressure on airports and landing and parking slots is limiting the growth of the industry.
In May 2006 the government announced plans to merge Air India, the state-owned international carrier, and Indian (formerly Indian Airlines, the state-owned domestic carrier) in 2006/07. The move seems inevitable if either airline is to survive. They are too small in their respective markets to compete with their bigger, privately owned rivals. Air India carries only 19% of passengers abroad, while Indian has a 23% share of the domestic market. Price competition is fierce in the industry, with many new entrants trying to gain market share by selling cheap tickets. As part of a wider strategy to revive the ailing carriers, the government has ordered 111 aircraft to expand their fleets, but it is not clear whether the merger and the fleet expansion will make the airlines profitable. Both airlines returned a small profit in 2004/05 (Indian: US$15m, Air India: US$22m). Outright privatisation—the alternative to a continuation of political interference in the airlines' operations, ineffective management and other inefficiencies associated with state-ownership—does not seem an option, at least for the time being, as politicians have so far vetoed it. In mid-2006 the government was working on a new regulation for the rapidly growing aviation sector.
In early 2006, following years of political dithering, the government decided to modernise Delhi and Mumbai airports. The construction of two greenfield airports, Hyderabad and Bangalore, has commenced and is likely be completed by mid-2008. The government has also approved plans for in greenfield airport
Airlines

28 India
Country Profile 2006 www.eiu.com © The Economist Intelligence Unit Limited 2006
in Goa. Finally, the Airport Authority of India is considering the development of non-metro airports, including Ahmedabad, Amritsar, Goa, Guwahati, Lucknow, Madurai, Jaipur, Mangalore, Trivandrum and Udaipur.
India's telecommunications sector has registered rapid growth in recent years, spurred by reforms to introduce greater competition to the sector. The number of mobile-phone connections exceeded fixed-line connections at end-2004 to reach 45m, up from a mere 3.2m at end-2000. The total number of telephones rose from 22.8m in 1999 to more 125m (fixed-line and mobile) by end-December 2005. Teledensity has risen from a mere 2.3% in 1999 to 11.3% end-2005, but this still remains low by international standards. The corresponding figure for China was 42% in 2004. Cellular telecoms services have been liberalised since 1994, but only since 2000 has the number of cellular subscribers registered exceptionally strong growth. The peak price for a call between Delhi and Mumbai has come down from Rs30 (68 US cents) per minute in 2000 to less than Rs2.4 (5 US cents) in 2004. International call charges have fallen drastically. For instance, a call from India to the US that cost Rs61 per minute in 2000 cost about Rs7 in mid-2005. At the end of 2005, 5.4m out of a total of 6m villages had a public telephone.
Steps to introduce a powerful Communications Commission to regulate and issue licences in the communications, information and entertainment industries appear to be on hold. It is hoped that the proposed commission will facilitate convergence in telecoms, broadcasting and the Internet by establishing a one-stop shop for licences, replacing the existing Telecoms Regulatory Authority of India (TRAI). The courts have now removed obstacles to the government's decision to allow fixed-service operators to use wireless in local loop (WLL) technology to offer limited mobility services (which cellular phone operators claimed was encroaching on the services for which they had purchased licences). However, the government remains committed to a rapid expansion of teledensity and to the promotion of a conducive telecoms environment. VSNL, the state-owned international call carrier, lost its monopoly and was privatised (sold to the Tata Group) on April 1st 2002. Long-distance services have been open to private competition since January 2000. Internet connectivity remains low at six users per 1,000 people, compared with 85 per 1,000 in China.
India has a network of more than 150,000 post offices, of which around 90% are in rural areas. An emphasis on universal provision has meant that the service operates at a loss, despite an upward revision in postal charges. In an attempt to improve performance, a number of services have been introduced to capture the business market, including steps to computerise sorting offices. However, losses have been rising in recent years. India Post incurred a loss of Rs14.5bn (US$320m) in 2005/06.
India has a free and diverse press, published in Hindi, English and vernacular languages. In 2001 there were 5,638 daily newspapers with a combined circulation of 57.8m copies, and 45,974 periodicals with a total circulation of 56.9m. India has more than 40 domestic news agencies, including the leading agencies, Press Trust of India (PTI) and United News of India (UNI). In June 2005 the government liberalised the print media industry further, allowing
Post
Media services
Telecommunications

India 29
© The Economist Intelligence Unit Limited 2006 www.eiu.com Country Profile 2006
foreign newspapers to publish in the country. Foreign newspapers are already allowed to own stakes in Indian publications. India also produces the largest number of films in the world. There is rapid growth in demand for satellite and cable television. Foreign ownership of terrestrial channels is banned, and foreign participation in satellite channels is currently limited to 49% of equity.
Energy provision
Total power generation by public utilities in fiscal year 2005/06 stood at 621.5bn kwh. However, shortages are substantial and are estimated at around 6% of total demand, rising to over 12% at peak times. Problems in the energy sector are manifold: they include the grossly inefficient State Electricity Boards (SEBs), high levels of power theft, unsound cross-subsidisation policies, and chronic underinvestment. The average cost of power in India exceeds Rs4 per unit. This compares with less than Rs2 in the US and Rs2.5 in both South Korea and Taiwan. Official targets for increased generation capacity have been set below required levels for decades, and even these have not been met. As a result, the period covered by the government's five-year capital expenditure programme, the Tenth Plan (2002-07), started off with a massive 27,000-mw shortfall—a serious constraint on economic growth. In May 2006 total generating capacity stood at 124,272 mw, with coal-based power plants accounting for 54.8%. Around 83% of India's power is generated by thermal stations. India has abundant coal reserves—commercially proven reserves are sufficient to cover current demand for over 100 years at current rates of extraction. Nuclear power accounts for 3% of total electricity supply. Hydroelectric power generation contributed 14.3% to total supply, but hydropower potential is thought to be three to four times the current output.
Many of India's state governments provide electricity at highly subsidised rates or free to some users. This includes energy for use in agriculture and for consumption by backward classes. Other users, such as industry and private consumers, cover the resulting deficit only partially. In many states, huge losses by the SEBs are the main drag on the public finances. To tackle the problems in the sector, in 2003 the Ministry of Power unveiled a plan, "Mission 2012: Power for All", which aims to provide sufficient power to achieve GDP growth of 8% a year, make power cheaper and more reliable, ensure the commercial viability of the power sector, and provide power to all by 2012. In mid-2006 the government announced plans to install additional generating capacity of 67,000 mw during the 11th Plan (2007-12) and 60,000 mw in the 12th Plan (2012-17). It is also raising its target for nuclear power generation from 20,000 mw to 40,000 mw by 2020, and is considering amendments to existing regulations to enable private participation in the nuclear power sector.
Despite these plans and developments, India's power sector urgently requires substantial investment. However, after decades of neglect the public sector lacks the necessary resources, and the private sector is unwilling to fill the gap, deterred by the fact that the main electricity purchasers, the state-owned SEBs, are bankrupt. The fundamental problem is the pricing structure—several classes of consumers pay less than the cost of generation. Despite a great deal of
Energy capacity shortfall is a major constraint on growth
Private investment is urgently needed
30 India
Country Profile 2006 www.eiu.com © The Economist Intelligence Unit Limited 2006
discussion, this skewed pricing structure has remained largely intact, as strong political lobbies have actively undermined any reduction of subsidies despite frequent power outages. Farmers pay little—in some states nothing—for the power they use for irrigation. Only industry is charged a market rate, and over 25% of power generated is lost in transmission and distribution, much of it stolen. The central government has now drawn up an agreement with the state administrations, whereby SEBs charge users market rates for electricity, reserving subsidies for those genuinely in need. In return, the central government covers the US$5.6bn owed by SEBs to power generators, through the issue of long-term bonds.
In an effort to stimulate further investment in the power sector, proposals for 100% foreign direct investment (FDI) in electricity generation, transmission and distribution projects up to around US$300m receive automatic approval. So-called mega-projects (with a capacity of at least 1,500 mw for thermal projects or of over 500 mw for hydroelectric plants) qualify for exemption from customs and countervailing duties. Power transmission has been opened to the private sector, and funding is available for investors keen to tap India's vast potential for generating hydroelectric power. However, as long as the SEBs have a monopoly of distribution and the pricing and subsidy structure remains opaque, investors will be hesitant, particularly given the collapse of the Dabhol power project—India's largest-ever FDI project in the energy sector—and the withdrawal of most foreign companies from power-generating projects.
Coal is India's primary fuel for power generation, but a high ash content makes it a polluting and inefficient source of energy. Low levels of mining productivity—around half a tonne per man-shift in deep mines and 2 tonnes per man-shift overall—are a serious problem. In an attempt to promote greater investment, regulation has been reduced and coal and lignite mining no longer requires licences. Although India has abundant coal (total reserves are estimated at around 200bn tonnes), its supply shortfall from domestic production is set to rise from 21m tonnes in 2005/06 to 31m tonnes in 2006/07. Rapidly rising demand and restrictive mining laws are responsible for this.
With domestic supplies accounting for just 30% of the country's demand, India is a net importer of oil. In 2005/06 imports of crude oil amounted to 99.4m tonnes. Rising industrial activity has driven up demand, and the International Energy Agency (IEA) projects that the country's dependence on imports to meet its demand for oil will exceed 90% by 2020. To minimise the effects of future supply disruptions, India is building strategic oil reserve facilities covering 15 days of its requirement on its southern and eastern coasts.
Distribution controls that were introduced at the time of the oil crisis in the 1970s were finally removed on April 1st 2002, and a number of Indian and foreign companies have received licences to open petrol stations. Most production originates from government refineries; their prices are controlled by the Ministry of Petroleum and Natural Gas. In 2002 a bill was passed providing for the establishment of a Petroleum Regulatory Board to control the supply of petrol. State-owned oil companies still require approval for changing prices
Coal, oil and gas
India 31
© The Economist Intelligence Unit Limited 2006 www.eiu.com Country Profile 2006
from the ministry, which has—for political reasons—has been reluctant to let prices rise in line with global oil prices.
Consumption levels of natural gas have risen more rapidly than those of any other energy source in the past decade. Consumption rose from 600m cu ft per year in 1995 to 960m cu ft in 2003. The US Energy Information Administration estimates that consumption will reach 1.4trn cu ft by 2010 and 1.8trn cu ft by 2015. Significantly, Gujarat State Petroleum Corporation (GSPC) in June 2005 made the country's biggest natural gas discovery off the coast of Andhra Pradesh in the south-east of the country. The find is estimated to hold 20trn cu ft of gas, worth US$50bn, but domestic sources will nevertheless be insufficient to meet the rising demand. The Indian government has been negotiating the construction of a number of pipeline projects, including a pipeline to import gas from Iran via Pakistan.
The economy
Economic structure
Main economic indicators, 2005 (actual unless otherwise indicated)
Real GDP growth (%) 8.5
Consumer price inflation (av; %) 4.2
Current-account balance (US$ m) -12,948.0a
Exchange rate (av; Rs:US$) 44.1
Population (m) 1,095.4a
External debt (year-end; US$ m) 127,803.1a
a Economist Intelligence Unit estimates.
Source: Economist Intelligence Unit, CountryData.
India is a two-tier economy, with a cutting-edge and globally competitive knowledge-driven service sector that employs the brightest of the middle classes, on the one hand, and a sprawling, largely rain-fed agricultural sector that employs the majority of the vast and poorly educated labour force, on the other. India's manufacturing sector has traditionally been poor (with a reputation for low-quality goods) although there are signs that this is beginning to change. The agricultural sector, with fishing and forestry, accounts for around 20% of GDP, services for 54%, and manufacturing for 26%.
Although the economy's dependence on agriculture has declined in recent years, fluctuations in overall GDP growth are still largely a function of the outcome of the annual monsoon. The majority of landholdings are farmed at subsistence level, and many farming families live below the poverty line. India has some of the poorest human development indicators in the world, particularly in rural areas. At the other end of the scale, India also has a large number of highly qualified professionals, as well as several internationally established industrial groups.
Economic development has been spread unevenly across states. Economic growth and progress in human development indicators has been much faster in

32 India
Country Profile 2006 www.eiu.com © The Economist Intelligence Unit Limited 2006
the southern and western states than in the north. Without a rapid and sustained increase in economic growth and higher investment in primary education and healthcare, reducing poverty will remain a considerable challenge for the authorities.
Agricultural production, mainly of foodgrains, is an important determinant of overall economic growth and a huge employer of the rural population. Total foodgrain production in fiscal year 2005/06 (April-March) amounted to 210m tonnes. However, yields remain low by international standards. Other major crops grown include oilseeds, cotton, pulses, sugar, tea, coffee, rubber, jute and potatoes. Some economists argue that for annual GDP growth to sustain rates of 7-8%, the agricultural economy will have to grow much faster than the rates of 2.6% recorded in recent years. However, in spite of normal monsoon rains and efforts to stimulate the sector, agricultural growth has remained low. The sector grew by 0.7% and 3.9% year on year in 2004/05 and 2005/06 respectively.
Comparative economic indicators, 2005 Indiaa Chinab Pakistan a Bangladesha Sri Lankaa
GDP (US$ bn) 797.8b 2,224.9 110.7 b 60.0 23.8
GDP per head (US$) 728 1,702a 708 423 1,149
GDP per head (US$ at PPP) 3,492 6,292a 2,407 1,836 3,659
Consumer price inflation (av; %) 4.2b 1.8 9.1 7.0 11.6
Current-account balance (US$ bn) -12.9 160.8 -1.1 0.0 -0.8
Current-account balance (% of GDP) -1.6 7.2 -1.0 0.1 -3.3
Exports of goods fob (US$ bn) 98.1b 762.5 16.1 9.3 6.2
Imports of goods fob (US$ bn) -149.8b -628.3 -20.4 -12.3 -8.2
External debt (US$ bn) 127.8 252.8a 38.8 20.6 11.0
Debt-service ratio, paid (%) 9.3 5.2a 11.1 7.4 6.7
a Economist Intelligence Unit estimates. b Actual.
Source: Economist Intelligence Unit, CountryData.
The size of India's industrial sector compares unfavourably with other countries in Asia. At about 26% of GDP, the sector is about half as large as China's. India's rigid labour laws are the main obstacle to an increased role for manufacturing, which nevertheless has seen unprecedented growth, as an anti-export bias in economic policy has been reduced and more resources have been moved into labour-intensive industries. Historically, a policy of import substitution in the decades after independence encouraged the development of a broad industrial base, but a lack of competition contributed to poor product quality and inefficiencies in production. Several sectors have now been opened up to foreign participation under India's liberalising reform programme, contributing to a significant expansion in the production of durable consumer goods including cars, scooters, consumer electronics, computer systems and white goods. However, a large proportion of heavy industry is still publicly owned.
The services sector has proved to be the most dynamic in recent years, with telecoms and information technology (IT) registering particularly rapid growth. Services, including airlines, banks, construction and small-scale private traders, as well as the public sector, accounted for 54% of GDP in 2005/06. It is one of
Agriculture
Industry
Services

India 33
© The Economist Intelligence Unit Limited 2006 www.eiu.com Country Profile 2006
the anomalies of India's rapid economic growth since the 1990s that, as in other sectors, growth in the services sector has largely been "jobless". Most of India's 10m people who are entering the labour force every year will nevertheless require jobs. In 2004 aviation was liberalised, and a number of low-cost airlines started services. However, privatisation of the domestic telecoms company, Bharat Sanchar Nigam Limited (BSNL), and of the national and international carriers, Indian (formerly Indian Airlines) and Air India, has stalled. Government plans to open the retail sector to foreign direct investment (FDI) have also stalled. The predominance of inefficient state-owned enterprises, particularly in the banking sector, remains a brake on growth.
Economic policy
Economic growth remains severely constrained by an unsustainably large fiscal deficit. A concerted effort will be required to bring about a substantial reduction in the overall fiscal deficit, which peaked at 9.6% of GDP in 2002/03 (5.9% federal government; 3.7% state governments). Strong economic growth in the past few years pushed the federal deficit down to 4.3% in 2005/06, but the underlying fiscal position remains weak. Including off-budget items such as oil subsidies and losses of the state electricity boards totalling about 1.9% of GDP, the total fiscal deficit is estimated to have reached 7.5% of GDP in 2005/06. While private savings and public investment in India are comparable with those of East Asia, public savings and private investment are markedly lower. Private investment continues to be crowded out by unproductive public consumption, resulting in a reduced rate of GDP growth.
The magnitude of the required fiscal adjustment is huge—a radical departure from current policy is needed to address India's single most important risk to macroeconomic stability. The policies required to reduce the fiscal deficit are easy to list but politically difficult to implement. Reducing subsidies, raising the tax take (only about 2m people pay income tax), cutting government employ-ment and closing or privatising loss-making public-sector enterprises are all measures opposed by powerful interest groups. The Fiscal Responsibility and Budget Management Act, designed to place a statutory limit on government borrowing, became effective in July 2004. The bill gives the central government the mandate to eliminate the revenue deficit (the gap between government current spending and revenue) by March 2009 and to reduce the fiscal deficit incrementally each year to reach 3% of GDP by March 2008. However, critics say that the government will find it difficult to meet the fiscal targets, given that expenditure requirements continue to be high. The government's target for the federal fiscal deficit in 2006/07 is 3.8% of GDP.
The objective of the Reserve Bank of India (RBI, the central bank) is to maintain price stability and ensure an adequate flow of credit to the economy. Important changes to the institutional set-up of the RBI have resulted in improved monetary control. In recent years inflation has fallen to levels of around 4-5%, down from double-digit inflation in the first half of the 1990s. The objective of price stability has gained further importance following the opening up of the economy and far-reaching reform in the financial sector. Furthermore, the
The fiscal position is unsustainable
Monetary control has improved

34 India
Country Profile 2006 www.eiu.com © The Economist Intelligence Unit Limited 2006
authorities are aware that inflation hits the poor hardest since they possess no hedges. The RBI targets broad money, interest rates, credit availability to the productive sectors, and the exchange rate when formulating policy. In recent years large capital inflows have exerted upward pressure on the exchange rate, which the RBI has sought to limit by actively selling rupees/buying US dollars in the foreign-exchange market. The by-product of this policy has been the accumulation of foreign reserves, which stood at around US$155bn in June 2006. The rationale of this policy is apparently to protect Indian export competitiveness, particularly vis-à-vis China.
The imposition of economic sanctions in 1998, in the aftermath of India's nuclear tests, was the latest catalyst for reform, although initial reform proposals were subsequently often diluted. Significant steps have been taken to reduce bureaucratic restrictions on industry and encourage FDI. In particular, the financial and insurance sectors have been opened up to private and foreign participation, as have the telecoms sector and many sectors of manufacturing industry. The government has also removed the remaining quantitative restrictions on imports, in line with its obligations to the World Trade Organisation (WTO), although it has raised agricultural tariffs and imposed many anti-dumping duties to mollify domestic lobbies. However, government plans to extend its privatisation programme and open the economy further to foreign investment took a sharp knock during various state elections in the first half of 2006, which strengthened the position of the Left Front. This will make it very difficult for the Congress-led minority government to push ahead with further economic reforms.
Main economic reforms
Despite the continued slow pace of reform, cumulative reforms since 1991 have been substantial. • Progressively more sectors have been opened to private investment, including
power, steel, oil refining and exploration, road construction, air transport, telecommunications, ports, mining, pharmaceuticals and the financial sector. Sectors such as garments and textiles that were previously reserved for small-scale industries have also been de-licensed.
• Policymakers have sought to encourage foreign direct investment (FDI), except in a few "strategic" sectors, and portfolio investment. Red tape has been reduced significantly.
• Most industries have been de-licensed (previously the government issued licences to companies that permitted them to produce a fixed number of items) to encourage competition.
• Trade policy has been liberalised. Some import quotas have been converted into tariffs, and the tariff system has been simplified to reduce the number of bands and achieve a reduction in overall rates imposed. In April 2001 all remaining quantitative restrictions on imports were removed, although tariffs remain high.
• Some aspects of business decision-making, such as the location of new enterprises and technology transfer, have been taken out of the state's control. (Labour relations and the shutting down of loss-making enterprises, or "exit policy", remain strictly regulated.)
The reform process proves to be difficult
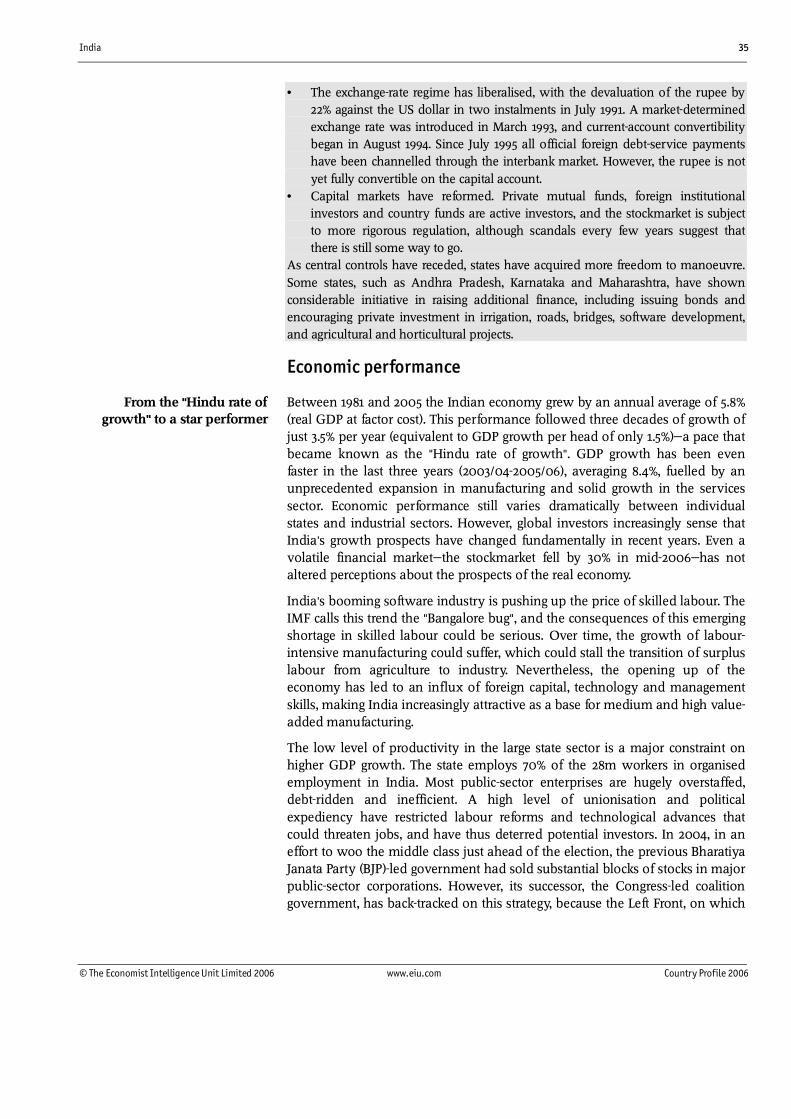
India 35
© The Economist Intelligence Unit Limited 2006 www.eiu.com Country Profile 2006
• The exchange-rate regime has liberalised, with the devaluation of the rupee by 22% against the US dollar in two instalments in July 1991. A market-determined exchange rate was introduced in March 1993, and current-account convertibility began in August 1994. Since July 1995 all official foreign debt-service payments have been channelled through the interbank market. However, the rupee is not yet fully convertible on the capital account.
• Capital markets have reformed. Private mutual funds, foreign institutional investors and country funds are active investors, and the stockmarket is subject to more rigorous regulation, although scandals every few years suggest that there is still some way to go.
As central controls have receded, states have acquired more freedom to manoeuvre. Some states, such as Andhra Pradesh, Karnataka and Maharashtra, have shown considerable initiative in raising additional finance, including issuing bonds and encouraging private investment in irrigation, roads, bridges, software development, and agricultural and horticultural projects.
Economic performance
Between 1981 and 2005 the Indian economy grew by an annual average of 5.8% (real GDP at factor cost). This performance followed three decades of growth of just 3.5% per year (equivalent to GDP growth per head of only 1.5%)—a pace that became known as the "Hindu rate of growth". GDP growth has been even faster in the last three years (2003/04-2005/06), averaging 8.4%, fuelled by an unprecedented expansion in manufacturing and solid growth in the services sector. Economic performance still varies dramatically between individual states and industrial sectors. However, global investors increasingly sense that India's growth prospects have changed fundamentally in recent years. Even a volatile financial market—the stockmarket fell by 30% in mid-2006—has not altered perceptions about the prospects of the real economy.
India's booming software industry is pushing up the price of skilled labour. The IMF calls this trend the "Bangalore bug", and the consequences of this emerging shortage in skilled labour could be serious. Over time, the growth of labour-intensive manufacturing could suffer, which could stall the transition of surplus labour from agriculture to industry. Nevertheless, the opening up of the economy has led to an influx of foreign capital, technology and management skills, making India increasingly attractive as a base for medium and high value-added manufacturing.
The low level of productivity in the large state sector is a major constraint on higher GDP growth. The state employs 70% of the 28m workers in organised employment in India. Most public-sector enterprises are hugely overstaffed, debt-ridden and inefficient. A high level of unionisation and political expediency have restricted labour reforms and technological advances that could threaten jobs, and have thus deterred potential investors. In 2004, in an effort to woo the middle class just ahead of the election, the previous Bharatiya Janata Party (BJP)-led government had sold substantial blocks of stocks in major public-sector corporations. However, its successor, the Congress-led coalition government, has back-tracked on this strategy, because the Left Front, on which
From the "Hindu rate of growth" to a star performer
36 India
Country Profile 2006 www.eiu.com © The Economist Intelligence Unit Limited 2006
it government relies for support in parliament, is opposed to the privatisation of state-owned enterprises.
India's private companies have responded better to the reform process, with mergers in several sectors helping to improve efficiency. Although borrowing costs are still high, the cost of finance has fallen steadily in recent years, with interest rates hitting a 32-year low at the beginning of 2005. As a result, financial constraints on companies' expansion plans have eased, and their overall financial position has improved. However, overall economic growth has been hampered by a weak infrastructure, including poor transport networks and insufficient and erratic power supplies, which have also limited investment. In addition, the central bank has begun a process of tightening monetary policy in 2006, bringing to an end the era of easy money.
India's rigid labour laws are perhaps the biggest hindrance to employment creation and the development of a competitive manufacturing sector. The existing labour legislation prevents the transition of the vast majority of the labour force—90% of workers are employed in the informal economy—from subsistence agriculture or low-productivity informal (without employment contracts) employment to high-productivity employment in the formal sector. Companies with more than 100 employees still require the go-ahead from their respective state government to make workers redundant and permission is almost never granted. Given the political constraints to labour market reforms, the government has tried to use special economic zones (SEZs) to foster competition among states and promote the growth of manufacturing. Apart from creating the conditions for a more competitive manufacturing sector, the SEZs have become an important vehicle for pioneering policy and institutional reforms that are difficult to introduce within the normal parliamentary process.
Between 2001 and 2005 the annual rate of consumer price inflation averaged around 4% per year, largely owing to improved productivity, an appreciating currency and improved monetary management by the central bank. Furthermore, globally lower inflation and low commodity prices (until 2003) contributed to a reduction in the inflation rate. In addition, the government has moderated the annual increases in support prices (thus lowering overall inflation), and has tried to reduce food stocks through public works programmes, poor relief and exports. More recently, rising prices of oil and other commodities have led to an increase in inflation. However, the pass-through into core inflation has remained limited, and the main macroeconomic impact of higher oil prices has been a deterioration in the county's current account. While consumer price inflation has remained contained, asset price inflation has surged. Both house and stock prices have been rising at phenomenal rates, with the SENSEX stockmarket index rising by over 150% between August 2004 and May 2006. Prices for housing and stocks shed more than 30% of their value in the second half of May 2006 after a long bull run, but the housing market has continued to boom.
Inflation is under control, but asset prices are booming
India 37
© The Economist Intelligence Unit Limited 2006 www.eiu.com Country Profile 2006
The latest national accounts data paint a macroeconomic picture that would have been unthinkable until a few years ago: one of India's main economic weaknesses—stubbornly low investment and savings rates—seems to belong to the past. Gross domestic investment shot up to 30% of GDP in 2004/05, from 26% in 1999/2000. The trend is in line with data from companies and business surveys that have long indicated an investment boom. Similarly, gross domestic savings rose from 25% of GDP in 1999/00 to 29% in 2004/05. An even higher savings rate is needed, perhaps 40%, to finance India's rapid growth, but the prospects for this are good. With further rises in GDP per person likely, and with a rapidly expanding labour force, the share of the population with rising discretionary incomes is set to rise over the next two decades.
India's recent economic growth has been impressive, but the same cannot be said of its record of creating employment for its vast and rapidly expanding workforce. The task ahead is daunting, with over 70m people set to enter the labour force in the next five years. Moreover, in order to reach full employment, 150m jobs—more than the combined population of Germany and France—will have to be created over the next five years, according to some estimates. The number of people counted as unemployed rose from 20m in 1993/94 to 27m in 2000/01. In 2005/06 the figure rose to 36m, according to data released by the Planning Commission. During the same period the rate of unemployment rose from 6% to 9.1%. However, this measure excludes underemployed persons, who earn very little and are not very productive. This is why some estimates put the actual number of unemployed closer to 80m people—more than twice the official estimate.
A significant worsening of India's employment situation seems inevitable. The challenge of creating about 10m jobs per year is increasingly having an impact on India's economic and social policies. The role of the state in providing employment is central, and heavy subsidisation of employment by the public sector will continue to be the norm. Out of the 50m new job opportunities that the Tenth Plan (2002-07) envisages, 20m are likely to be created through state-sponsored employment schemes. In 2006 the Congress-led government approved the National Employment Guarantee Scheme, which aims to provide 100 days of employment on rural public works projects at a minimum wage. Future coalition governments are likely to be formed by parties that deliver (or are perceived to deliver) on this front. Given the importance of employment creation for political survival and the resources required to perform the task, fiscal consolidation might suffer as a consequence.
Increasing trade integration with the rest of the world, the dynamism of India's information technology (IT) and other services sectors, and the emergence of India as an important destination for FDI have all contributed to the country's improved external position in the early 2000s. However, high oil prices have brought about a reversal, and in 2004/05 India's current account recorded a deficit equivalent to 0.9% of GDP. In 2005/06 the deficit is estimated to have risen sharply. The fact that it has largely been funded by volatile capital inflows will be a concern for the central bank, but rising domestic interest rates and
Savings and investment rates have risen
Employment generation is huge challenge
India's external position is changing
38 India
Country Profile 2006 www.eiu.com © The Economist Intelligence Unit Limited 2006
high levels of foreign reserves are reducing the threat posed by the deterioration in the external balance, especially to the exchange rate.
While the strong growth in merchandise exports of the predominantly export-oriented economies of South-east Asia has been the main driver behind their current-account surpluses, India has traditionally maintained a deficit on the merchandise trade account. However, buoyant invisible inflows, particularly remittances from non-resident Indians, along with software services exports, have been instrumental in reducing India's current-account deficits.
Regional trends
India's national performance in many aspects masks considerable inter-state variation in terms of economic growth, economic policy, population and human development. Since the start of economic reforms in 1991, Gujarat and Maharashtra have been the fastest-growing states, enjoying growth rates of around 6-8%, comparable with the East Asian economies. High-growth private-sector industries are concentrated around Mumbai in Maharashtra and parts of Gujarat; around Delhi, including Haryana and western Uttar Pradesh; and in the corridor from Bangalore in Karnataka to Chennai in Tamil Nadu. The process of economic policy reform that began in 1991 had important implications for state-level growth. Data suggest that the growth differential between states has intensified. Bihar, the poorest state, grew at a rate nearly ten times lower than that of Gujarat, whereas Assam's economy contracted after 1991. The prosperous states with better-performing administrations appear to have benefited the most from the reforms introduced after 1991.
The post-1991 period has seen faster improvements in human development indicators, especially in literacy rates and life expectancy. Generally, fertility and mortality are lower in southern and western states than in most of the northern states. The fertility decline has been slowest in Bihar and Uttar Pradesh, where the number of births per woman is still between four and five, way above the all-India average of around three. As trade was liberalised and industry freed to locate where it wished, industrial development became concentrated in the south and along the west coast. The northern states have fallen further behind. The software export boom has also been largely concentrated in the southern and western cities of Chennai, Bangalore, Mumbai and Hyderabad.
Economic sectors
Agriculture
India's agricultural sector employs about 60% of the country's workforce and accounts for one-fifth of GDP. Unlike in East Asian countries, the shift of the labour force from agriculture to non-agriculture in India is particularly slow, largely as a result of rigid labour laws in both the agricultural and the industrial sector. The agricultural sector strengthened in the post-reform period from fiscal year 1992/93 (April-March) to 1996/97, with average growth at 4.7%, up from an
Agricultural growth has decelerated

India 39
© The Economist Intelligence Unit Limited 2006 www.eiu.com Country Profile 2006
average of 3.6% in the 1980s. However, growth slowed to around 1% per year between 1997/98 and 2002/03. In 2003/04 the best monsoon rains in a decade generated growth of 10% in the agricultural sector. However, in spite of normal monsoons, in 2004/05 and 2005/06 growth in the farm sector fell back to an average of 2.3%. The main reasons for the deceleration in recent years (excluding 2003/04) are the high level of government intervention and the resulting skewed incentive structure. Worryingly, investment in agriculture as a percentage of GDP fell from 2.2% in the late 1990s to 1.7% in 2004/05, mainly as a result of falling public investment.
Inadequate road links remain a major constraint on the development of efficiently functioning agricultural markets. A continuing fragmentation of land-holdings, poor maintenance of existing irrigation systems and declining soil fertility in some areas are other factors. Production growth and yields in prin-cipal crops, accounting for some 70% of value added in agriculture, declined significantly during the 1990s compared with the 1980s and remain low by developed-country standards. Another reason is that with increasing opportunities in the countryside, traditional agricultural labourers have begun engaging in service sector activities in the informal sector, and are partly neglecting their plots.
The introduction of high-yield crop varieties and new fertilising and irrigation techniques over several decades—the so-called Green Revolution—dramatically increased productivity in some regions. India has been self-sufficient in food since the mid-1970s, maintaining buffer stocks adequate to meet demand despite failed harvests and seasonal fluctuations. However, given agriculture's diminishing yet still huge importance for India's overall growth prospects, the generally poor performance of the sector is a cause for concern and calls for a change in the government's agricultural policy. Some academic research suggests that for India to sustain annual GDP growth of 7% or more, agriculture has to grow at 4% or more.
Food support prices for wheat and rice have given farmers little incentive to diversify and have filled government storage facilities to overflowing, while keeping the market price of foodgrains artificially high. Current agricultural policy, which supports cereal production, is exceedingly expensive and will be unable to deal with the likely scenario of a shift in consumption from cereal food towards non-cereal food. A lack of market infrastructure also hampers the movement of crops, leading to sudden shortages. India has considerable potential as an exporter of rice, cotton, many types of fruit and even flowers, but this has so far not been tapped.
Less than one-third of cropland is irrigated, making agricultural output heavily dependent on the annual monsoon. The main foodgrain crops (the kharif or autumn crop—predominantly rice, harvested in September-October) and some cash crops (oilseeds, cotton, jute and sugar) depend on the south-west monsoon. This brings 80% of India's rain, usually within a three-month period from June to mid-September. A second, north-east monsoon brings lighter rains to the south of the country from mid-October to December. Winter rain in north-western India from October to March waters a crop of wheat and coarse grains (the rabi crop, harvested in April-May).

40 India
Country Profile 2006 www.eiu.com © The Economist Intelligence Unit Limited 2006
Monsoon performance (Jun-Sep)
1998 1999 2000 2001 2002 2003 2004 2005Meteorological subdivisions with normal/excess rainfall (no.) 33 28 28 29 15 31 23 32Meteorological subdivisions with deficient/scanty rainfall (no.) 2 7 7 6 21 5 13 4
Districts with normal/excess rainfall for all-India (%) 83 67 65 68 37 76 57 72Deviation from long-term average rainfall for all-India (%) 5 -4 -8 -9 -19 5 -13 -1Growth in the agricultural sector (%) 5.9 0.6 0.1 5.9 -5.6 9.6 0.7 3.9
Source: India Meteorological Department.
Mining and semi-processing India derives little wealth from its mining sector, which accounts for less than 2% of GDP. Nevertheless, a range of non-hydrocarbon minerals is extracted. India has vast iron ore and bauxite reserves In addition, it produces significant amounts of mica, manganese, dolomite, limestone, chromite, magnesite, apatite and phosphorite. Private-sector participation in the mining sector is on the increase. In mid-2006 the government decided to consider a liberalisation of the Mines and Minerals Act of 1957 to meet rising domestic consumption of various mining products. Existing licensing rules have severely limited production.
India has the fifth-largest reserves of iron ore globally, at around 24bn tonnes, and is one of the world's lowest-cost sources. It is already the world's third-largest iron ore producer. The restrictiveness of the Mines and Minerals Act 1957 has stopped India Steel Authority, India's largest steelmaker, from obtaining a single mining licence in the last 15 years. A housing boom has fuelled domestic demand, and China's demand for iron ore—it bought 68m, or 80%, of India's output in 2005/06—has led to a shortage of steel and a sharp rise in prices. Shortening the application process for licences would attract more investment into sector. A liberalisation of the mining law would benefit investors such as South Korea's POSCO, whose proposed US$12bn investment in the mineral-rich state of Orissa would be the single largest investment in India to date. Mittal Steel also has ambitious investment plans to expand its Indian operations. National Mineral Development, India's largest iron producer, estimates that the country needs to raise its capacity by 71% to 240m tonnes per year by 2020.
India also has large reserves of bauxite, at around 2bn tonnes or 11% of the global total, and is the fifth-largest bauxite producer in the world. Ambitious plans have been drawn up to expand smelting and aluminium production for home consumption and export.
Although India has substantial reserves of copper (estimated at 422m tonnes), it is a net copper importer. Reserves of lead and zinc are estimated at 360m tonnes. A refinery complex in Debari (Udaipur) with a lead-zinc capacity of 70,000 tonnes has cut import demand for both metals.
Foreign investors have shown considerable interest in joint ventures to mine for gold, particularly the state-run mine at Kolar in Karnataka. In addition, more
Iron ore
Non-ferrous metals
Bauxite
Gold and diamonds

India 41
© The Economist Intelligence Unit Limited 2006 www.eiu.com Country Profile 2006
than 20 companies, including two UK-based concerns, De Beers and Cluff, have registered an interest in diamond prospecting in the country.
Manufacturing
Industrial production (fiscal years Apr-Mar; 1993/94=100; % change year on year)
Annual average 2005/06 2001/02-2006/06All sectors (index of industrial
production) 8.1 6.4
Source: Central Statistical Organisation (CSO).
Industrial growth averaged 7.1% per year in the 1980s. It accelerated slightly to 7.6% per year in the first five years following the introduction of the economic policy reform process in 1991, which led to an investment boom. In the second half of the 1990s industrial growth trended lower at around 5% per year. However, since 2002/03 industrial growth has accelerated markedly on the back of strong GDP growth. Rising disposable incomes, easy access to finance, and the changing attitudes of India's rapidly rising middle class (with a traditional focus on savings) have resulted in a consumer lending boom. Industrial growth averaged 8.3% a year in 2004/05 and 2005/06, with consumer durables and non-durables showing exceptionally strong growth. Capital goods production has been growing at double-digit rates since 2002/03, reflecting increased investment in the industrial sector and the economy as a whole.
Although reforms have reduced licensing and regulation, heavy industry is still dominated by public-sector enterprises. State-owned companies account for the bulk of activity in steel, non-ferrous metals (virtually 100% for copper, lead and zinc, and about 50% for aluminium), shipbuilding, engineering, chemicals and paper. The government had pledged to reduce its holdings in non-strategic public-sector undertakings to a maximum of 26%, and to close down non-viable enterprises, but opposition to this measure from the Left Front has, for all practical purposes, shelved this proposal. The previous Bharatiya Janata Party (BJP)-led government had begun to make some progress towards these goals, and had sold off controlling interests or brought in minority managing partners in a number of public enterprises. Onerous labour regulations, as well as a shortage of cheap credit, limit opportunities for restructuring and so continue to restrain rates of GDP growth.
India produced 42m tonnes of crude steel in 2005/06, placing it among the ten largest producers in the world. A variety of grades are produced, and the quality is on a par with producers such as South Korea and the US, which is one of the main reasons behind the acceptance of Indian steel world markets. Increased demand from China as well as strong domestic demand, particularly from manufacturers of consumer durables and the automotive and construction sectors, are the main drivers of production growth. Around 40% of output is produced in integrated steel plants; the remainder comes from mini-plants (electric arc furnaces), of which over 180 exist, almost all in the private sector. Reforms to the sector have lifted controls on prices, distribution and
Industrial growth
Steel

42 India
Country Profile 2006 www.eiu.com © The Economist Intelligence Unit Limited 2006
imports of industrial inputs. However, the government maintains a floor on the price of imports of steel products in order to protect the domestic industry.
Textiles account for around one-fifth of total export earnings. Because the government discriminated for decades against integrated textile mills, with the aim of helping cottage handlooms, most mills closed down. Mills currently produce only 4% of textiles output. Despite government assistance, the share of handlooms in total output is only 18%; the remainder is produced by power looms located in sheds outside the mills, which allow them to escape the restrictions. Production in the textile industry is based on a decentralised system, in which the production of many items continues to be the preserve of small companies. The industry has a natural competitive advantage in terms of a strong and large multi-fibre base, abundant cheap skilled labour and presence across the entire value chain of the industry ranging from spinning and weaving to the final manufacture of garments.
In mid-2006 the government set up a committee with the aim to increase textile exports to US$40bn by 2010, up from US$17bn in 2005/06. The industry has been booming since the removal of global quotas for textiles and clothing exports at the end of 2004. However, as in many other industries, India's labour laws have held back even faster expansion, investment and employment generation. The government has also launched an initiative to build 25 integrated textile parks.
India's information technology (IT) and service industry has grown at an average annual rate of around 50% per year since 1993, to reach a turnover of US$29.6bn in 2005/06, equivalent to around 3% of the country's GDP. The industry is highly export-oriented—the domestic IT market accounts for about 40% of total turnover. Out of an estimated 5,000 IT software and service companies in India, about 60% are domestic players and 40% are multinational corporations. The latter account for about 65% of the industry's revenue.
The most important market is the US, which absorbs about 70% of India's software exports, followed by the UK with 14% and Europe (excluding the UK) with 9%. Indian firms are especially strong in software for banks, finance houses and insurance companies. Software exports grew by more than 30% between 1995/96 and 2005/06. The bursting of the dotcom bubble in the US in the early 2000s had a negative effect on the Indian industry. Although the bigger companies largely held their own, smaller exporters suffered. Nevertheless, the Indian IT industry has withstood the shock well. It has also been forced to increase diversification in non-US markets, such as Europe and Asia, and into such areas as the management for clients of IT-related business processes. At the other end of the market, call services and IT-enabled services, which use cheap labour and do not require a knowledge of software engineering, are growing rapidly. All the major players in the industry have invested heavily to upgrade their operations in India, and in mid-2006 IBM, the world's largest computer services company, announced plans to triple its investment in the country to US$6bn over the next three years.
Textiles
Electronics and software

India 43
© The Economist Intelligence Unit Limited 2006 www.eiu.com Country Profile 2006
The rapid growth of software exports has stimulated demand for computers. Sales of personal computers rose by 30% in 2005/06, to 4.6m units. Import liberalisation and the entry of foreign manufacturers has transformed the industry, which until five years ago was tiny and dominated by a few Indian manufacturers. The ease of importing components has nurtured hundreds of unbranded assemblers, which command more than half of the market. Only three major Indian brands remain, but foreign manufacturers are expanding their production. In 2006 Dell, the world's largest PC seller (it has a 5% market share India), announced plans to set up production facilities in India in a bid to become the market leader. The growth of the IT hardware sector has traditionally lagged behind the software and services segment and hardware exports remain insignificant, with 90% of the industry's revenue sourced from the domestic market.
The automotive industry accounts for around 5% of industrial production. It has been one of the fastest-growing sectors in recent years. Turnover of automotive manufactures stood at Rs836bn (US$19bn) in 2004/05. Rising income levels, continuing poor public transport systems, the wider availability of car finance and the increase in the young population are the main drivers of growth. A cut in customs duties on steel in the 2004/05 budget has reduced production costs for manufacturers. Total production of vehicles rose from 4.2m units in 1998/99 to 8.5m units in 2004/05. In volume terms, vehicle production is dominated by two-wheelers, which accounted for 6.5m units of total production in 2004/05.
The production of passenger cars stood at 961,000 units in 2004/05, followed by three-wheelers (374,000), commercial vehicles (350,000) and multi-purpose vehicles (249,000). Most local production is sold domestically, but rising quality has contributed to a surge in vehicle exports, which grew at an annual average rate of over 50% in the three-year period 2002/03-2004/05. The government's decision to cut excise duty on small cars from 24% to 16% in the 2005/06 budget is likely to underpin growth in the car market.
Construction
Construction accounts for around 5% of GDP, employing an estimated 3.5m people full-time and a further 6.5m seasonally. The construction industry has been the fastest-growing sector in recent years, with annual growth above 12% in 2004/05 and 2005/06. The industry contributes more incremental value added per unit of investment than any other sector and has been a focus of government investment in an effort to kick-start other industries, particularly steel and cement. Construction accounts for around 40% of government capital expenditure via a five-year plan, and more than 1m workers are engaged in public-sector construction projects. Large-scale public-sector projects, the need to develop urban infrastructure, and the rapidly rising demand for residential housing have contributed to a boom in the sector in recent years.
Vehicles
Computer hardware
44 India
Country Profile 2006 www.eiu.com © The Economist Intelligence Unit Limited 2006
India has a serious housing shortage, estimated at 23m units. More than 90% of this shortage is in low-cost housing. The government has pledged to build 2m additional units each year. Around 50m people live in urban areas that are officially designated as slums. Rural housing conditions are also poor.
Financial services
The financial services sector has long been dominated by state-owned institutions. During the second world war the government introduced controls on public issues and used pricing formulas that underpriced share issues. As a result, although India had a large number of stock exchanges, little money was raised through public issues, the floating stock was small, and the markets were speculative and volatile. In the 1950s the government set up long-term financial institutions that supplied the bulk of industry's debt and equity finance, and in 1970 the banks were nationalised.
Government-controlled commercial and development banks, insurance companies and the Unit Trust of India (UTI, a mutual fund) have traditionally been the leading sources of funds for both local and foreign-invested enterprises. The much smaller private financial sector consists of a number of smaller banks, still young insurers and a host of mutual funds. State-owned commercial banks provide both working capital and medium- to long-term finance, but they are predominantly in the business of short-term lending. Public-sector development banks, insurance companies and the UTI specialise in long-term lending and subscribe to corporate shares and debentures. Public-sector insurers, the UTI and other mutual funds are active in the primary and secondary capital markets.
Commercial banking is dominated by the 27 public-sector banks, which control 75.4% of assets in the sector. Private domestic banks hold 18.1% of assets, and foreign banks have the remaining 6.5%, according to the Indian Banks' Association. The public-sector banks have countrywide networks (around 90% of total bank branches), although each bank has its own geographical stronghold. All provide a full range of banking services. Foreign banks play a small but increasingly important and innovative role in India's banking sector. They accounted for 6.5% of commercial bank assets in 2004/05.
Government intervention in the banking system is high, as the authorities try to channel credit to politically important sectors, especially agriculture, which employs about 60% of the workforce. Public-sector banks must devote at least 40% of their loan portfolio to designated priority sectors and 12% to export financing. Since 1993 the Reserve Bank of India (RBI, the central bank) has also given out 12 licences to "new" domestic private banks. These banks—there were eight in December 2005 as a result of mergers and closings—accounted for 12.3% of total commercial banking assets in 2004/05. Foreign institutional and direct investors hold stakes in some of them.
In February 2005 the RBI announced a "road map" for the presence of foreign banks in India, which allows foreign banks unprecedented room to operate, but stops short of introducing the degree of competition required to break the
The housing shortage
State-owned financial institutions dominate
India 45
© The Economist Intelligence Unit Limited 2006 www.eiu.com Country Profile 2006
dominance of state-owned banks. A more competitive banking sector environment is expected only in 2009, when the second phase of the road map will allow foreign banks to compete more freely. However, the RBI has taken a number of steps to strengthen the banking sector. It has tightened capital requirement norms for banks, with a capital-adequacy ratio of 9% (compared with the 8% required by Basel II, the capital-adequacy framework for internationally active banks); norms for non-performing loans were tightened in March 2004; since March 2006 banks have to maintain an investment fluctuation reserve of 5%; and banks are required to comply with Basel II norms by March 2007. The overall asset quality has improved since the late 1990s, with the ratio of non-performing loans (NPL) having fallen from 15.7% in March 1997 to 5.2% in March 2005. In spite of many challenges India's banking sector is widely viewed to be much healthier than China's.
The size and liquidity of the Indian stockmarket has increased notably in recent years, and the Bombay Stock Exchange (BSE) has established itself as one of Asia's largest stock exchanges.The BSE benchmark 30-share index, the SENSEX, closed at an all-time high of more than 12,600 in mid-May 2006, up 127% from two years earlier. Unprecedented portfolio investment of about US$9.3bn in 2004/05 and US$12.5bn in 2005/06 from overseas—still the preferred route of foreign investment—underpinned by the buoyancy of the stockmarket. Then India's stockmarket rally came to abrupt end in mid-May, when the market crashed and lost 30% of its value in a few weeks, as investors sought less risky assets against a background of accelerating global inflation and rising interest rates. However, the fallout was largely confined to the financial sector.
Following the relaxation of guidelines governing the issue of foreign-currency convertible bonds in March 2003, Indian companies have begun to raise capital on overseas markets. In June 2006 the authorities decided to end the separation of financial and real estate markets, when they announced the forthcoming release of policy guidelines for real estate investment trusts (REITS). The decision follows a recommendation, made by the Planning Commission in 2002, "to open the investment floodgate" for India's lucrative real estate sector in a bid to broaden investment opportunities and reduce market volatility.
Other services
With more than 5m retail outlets, India's retail sector is underdeveloped, unorganised and dominated by small, family-owned firms. Modern retail chains, most of which have established themselves in the past five years, account for just 2% of retail sales, compared with 65% in the US, 40% in Thailand and 10% in China. Hence, the potential for growth is enormous. A study 2005 by AT Kearney, a consultancy, rates India as the most attractive country for international retail expansion in the world. However, inflexible labour laws and high supply-chain costs, as well as a preference for known retailers, have held back the sector's development. Probably more important, the entry of foreign retailers is still restricted. Since 2005 there has been much discussion about permitting foreign investment in the retail sector. In early 2006 the government allowed up to 51% FDI in single-brand retailing (such FDI could
The stockmarket

46 India
Country Profile 2006 www.eiu.com © The Economist Intelligence Unit Limited 2006
previously take place only through the franchisee route), but shied away from a comprehensive opening up of the retail sector to foreign competition. The Left Front parties are fiercely opposed to such a move.
Although tourism is only a small part of the Indian economy, it is expanding rapidly. In 2005/06 arrivals of foreign tourists rose by 24% year on year to 36m. The travel business in India is estimated to have accounted for US$14bn in spending in 2005, or 2.1% of GDP, according to the World Travel and Tourism Council (WTTC). However, since travel and tourism have spillover effects on the wider economy, the real impact is greater. Directly and indirectly, the travel and tourism sector is estimated to have contributed around US$44.7bn to the economy, or 5.3% of GDP. In world terms, India's share of the tourism market is small, at around 0.7%. The tourism industry is hampered by a perception of India as a poor and politically unstable country where a visit requires precautions against disease.
The external sector
Trade in goods
The balance-of-payments crisis in 1991 was tackled with a remarkably successful fiscal correction and currency devaluation that began to unlock India's export potential. According to the Reserve Bank of India (RBI, the central bank), the trade deficit had been reduced to US$1bn by fiscal year 1993/94 (April-March). Since then, however, imports have risen more rapidly than exports, as the ensuing investment boom sucked in more imports.
Main trading partners, 2005/06 (US$ bn)
Exports to: US 17.2UAE 8.6China 6.7Singapore 5.6UK 5.1Hong Kong 4.5Germany 3.5Imports from: China 10.7US 7.8Switzerland 6.5Australia 4.9Belgium 4.7South Korea 4.3UAE 3.2
Note. Imports do not include crude petroleum and products.
Source: Centre for Monitoring Indian Economy.
Tourism is a small but increasingly dynamic sector

India 47
© The Economist Intelligence Unit Limited 2006 www.eiu.com Country Profile 2006
The trade deficit widened sharply in 2004/05 and 2005/06, driven mainly by a rapidly rising oil import bill. A steep rise in oil prices pushed up the deficit from US$13.6bn in 2003/04 to US$36.6bn in 2004/05. In balance-of-payments terms, imports surged by 48.5% year on year to US$119bn, reflecting a rising oil import bill and a pick-up in industrial activity and outpacing exports, which rose by 23.9% to US$82bn. The trade deficit deteriorated further in 2005/06 to stand at US$51.6bn.
India's major goods exports have long been textiles and gems re-exported after cutting. Recently, however, the country has developed significant exports of chemicals, principally drugs and dyes, and automotive components. India also exports relatively cheap machinery. Its largest import is mineral oils. Domestic crude oil meets only about 30% of India's needs. Recently, with import liberalisation, electronic goods imports have also grown. The legalisation of gold imports has meant that gold, which used to be smuggled in, has begun to be imported legally and now constitutes a major import item.
Invisibles and the current account
The current account moved into surplus in 2001/02 for the first time in 24 years, in spite of a sizeable trade deficit. This was largely because of a sharp increase in remittances from overseas Indians on the invisibles side of the current account, and strong services exports. As a percentage of GDP, workers' remittances have risen from 0.7% in 1990/91 to 3.3% in 2004/05, making India one of the largest global recipients of such inflows.
India ran a current-account surplus between 2001/02 and 2003/04, but the current account came under pressure in 2004/05 and 2005/06 owing to rapid import growth, fuelled by high oil prices and buoyant industrial growth. While remittances rose further to US$24bn in 2005/06, they could only partly offset the pronounced deterioration in the trade account. The concurrent economic boom, which fuelled very rapid growth in non-oil imports, pushed the current-account balance from a surplus of US$14.1bn in 2003/04 to a deficit of US$10.6bn in 2005/06.
Income from software services exports is the main driver of the services surplus of the current account. After a brief decline in 2000/01 to US$2.5bn (from US$4.1bn in the previous year), as the software boom collapsed in the US, the services surplus bounced back to US$4.6bn in 2001/02. Thereafter it grew at a phenomenal rate and reached US$22.3bn in 2005/06. Rapid future growth in software services is likely to continue to support the current account and increasingly offset the risk of a sudden fall in remittances. India's income balance on the current account has traditionally been in deficit and stood at US$5.6bn in 2005/06.
Textiles and gems have been the key exports
Workers' remittances exceed 3% of GDP

48 India
Country Profile 2006 www.eiu.com © The Economist Intelligence Unit Limited 2006
Capital flows and foreign debt
India's position on the capital account has strengthened considerably in recent years. According to the RBI, in 2005/06 the capital account surplus stood at US$24.7bn. Rising international investor confidence in the Indian economy has been reflected in a surge of portfolio investment and the upward revision of international credit ratings. With the current account in deficit since 2004/05, the rising capital account surplus has become increasingly instrumental in earning foreign exchange. The level of foreign investment flows—comprised largely of portfolio investment by foreign institutional investors—has risen dramatically in recent years. India's increasing thirst for foreign funds has its downside: the country's long-prized immunity to global financial problems is weakening. As a result of closer financial market integration, unlike in 1997 an Asian financial crisis today would probably not bypass India. On the positive side, the Indian government might look for more stable inflows—for example, foreign direct investment (FDI) in sectors such as retailing, banking and infrastructure—to reduce the external vulnerability associated with the country's heavy reliance on portfolio inflows.
Portfolio investment inflows amounted to US$12.5bn in 2005/06, up from US$2bn in 2001/02, the highest in any year since the opening of Indian stock exchanges to foreign capital in 1992/93. FDI inflows stood at US$5.9bn in 2005/06, up from US$4.5bn in the previous year, but still only accounted for around 1% of GDP. The fast-growing services sector was the largest recipient of FDI inflows. A significant development on the capital account in recent years has been the rapid increase in commercial borrowing by Indian corporates on international capital markets—net borrowing rose to US$5.9bn in 2004/05.
India's total external debt has risen steadily from US$83.8bn in 1991 to US$123.3bn at the end of March 2005 (government measure). However, the ratio of debt to GDP has fallen from 28.7% to 17.4% over the same period. Commercial finance is increasingly replacing foreign aid. The ratio of government debt to private, non-government debt has more than reversed from 60:40 in the mid-1990s to 37:63 at the end of December 2005. India is still the World Bank's biggest borrower, but nearly one-half of the funds are lent on near-commercial terms. India has not needed IMF funds since the 1991 financial crisis, when it borrowed US$4.5bn (which have since been repaid). OECD aid to India is co-ordinated by the World Bank-sponsored India Development Forum.
India's current debt stock and foreign payment obligations are manageable. Restrictions on external commercial borrowings have gradually been lifted, with total annual borrowing permitted up to a ceiling of US$8.5bn. Foreign banks can guarantee rupee borrowings by Indian companies, and companies with foreign-exchange earnings can raise up to US$500m through external commercial borrowings. Furthermore, the end-use of external commercial borrowings was enlarged to include overseas direct investment in joint ventures to allow Indian corporates to diversify into international markets.
The foreign debt position is improving
Foreign investment inflows show strong increases
India 49
© The Economist Intelligence Unit Limited 2006 www.eiu.com Country Profile 2006
India has never defaulted on its external debt, and its external risk assessment is now generally positive. Risks to India's debt sustainability are political rather than economic. A derailment of the peace process with Pakistan or outright military conflict—as happened in 1998—would severely restrict India's access to international markets.
Foreign reserves and the exchange rate
India's foreign-exchange reserves have grown significantly since 1991. The reserves, which stood at US$5.8bn in the immediate aftermath of the balance-of-payment crisis in 1991, rose to around US$25bn in 1995. The second half of the 1990s saw a further improvement, with reserves touching a level of US$38bn in 2000. At the end of June 2006 India's foreign-exchange reserves had surged to US$156.7bn, making its stock of reserves the fifth-largest among emerging-market economies and the sixth-largest in the world. The sterilisation of capital inflows by the RBI was the main cause of the rapid accretion of reserves. In fact, the capital account has been the main source of the reserve build-up in the period 1991-2005. It contributed US$149bn to the accretion, far outweighing the drag on reserves exerted by the current account of around US$23bn. Foreign investment dominated as a source of reserve build-up through the capital account at a net US$77.3bn, or 52% of the total, followed by non-resident Indian (NRI) deposits (22%), external commercial borrowing (14%), and external assistance (7%).
During the 1990s and early 2000s the RBI oversaw a managed decline in the value of the rupee against the US dollar, intervening only to prevent a sharp fall in the currency. After a devaluation in July 1993 the rupee remained constant at around Rs31.37:US$1 for two years, before a nominal depreciation in 1995. It then gradually weakened to reach Rs48.92:US$1 in early June 2002. Thereafter, the rupee appreciated against the US dollar, driven by high capital inflows and general US dollar weakness in international currency markets, until the general election in May 2004, when uncertainty about the new Indian government's economic policy led to temporary capital outflows. But the rupee's depreciation was short-lived, capital inflows resumed, and the currency reached Rs43.4:US$1 in the final quarter of 2005. Following the sharp stockmarket correction in mid-2006, the rupee fell to a three-year low of Rs46.2:US$1. However, during the recent period of considerable volatility in international currency markets the rupee:US dollar exchange rate did not exhibit great volatility in nominal terms, confirming that the RBI is targeting the nominal rate against the US dollar (albeit not officially). Meanwhile, the real effective exchange rate depreciated owing to the rupee's depreciation against most free-floating currencies, notably the euro, the yen and sterling.
India has taken a gradualist approach to capital account convertibility and has moved in this direction at a slow pace. Starting from current-account convertibility in 1994, capital account convertibility was introduced for NRIs in early 2002. NRIs may remit up to US$1m per year, but there are conditions attached. The transfer of capital abroad by resident Indians is still subject to controls. Further reforms in the real sector and the financial system are required
Foreign-exchange reserves grow
The rupee has appreciated in recent years
Debate on full capital account convertibility continues
50 India
Country Profile 2006 www.eiu.com © The Economist Intelligence Unit Limited 2006
to minimise the risk of a loss of macroeconomic stability that could result from a full convertibility of the capital account. At present, a weak banking sector and a high fiscal deficit remain the main obstacles to full convertibility. Restrictions on capital outflows stem mainly from concern over the domestic impact of excessive capital flows on interest rates and money supply growth, as well as the fear that an open capital account would expose the rupee to speculative attacks, depleting foreign-exchange reserves.
In early 2006 the debate over whether India should liberalise its capital account once again gained momentum, when the government said it wished to revisit the issue. One of the attractions of liberalising the capital account is that it would create access to cheaper credit for Indian businesses without asking permission of the RBI. Capital costs in India are still high by international standards. The RBI has appointed a committee to present a new road map for full convertibility, but some experts believe that while full convertibility promises no large gains for India at this stage, it increases the risk of "things going badly wrong". They argue that for the next ten years at least many other liberalising reforms—including electricity pricing and improving the legal system—need to take priority over capital account liberalisation.
India 51
© The Economist Intelligence Unit Limited 2006 www.eiu.com Country Profile 2006
Regional overview
Membership of organisations
The South Asian Association for Regional Co-operation (SAARC), which comprises India, Pakistan, Sri Lanka, Bangladesh, Nepal, the Maldives and Bhutan, was established in 1985. SAARC's aims include promoting welfare, accelerating economic growth, eradicating poverty, and improving relations between member states. Summit meetings are meant to be held annually and are complemented by technical committees, meetings of foreign ministers, and a standing committee of the foreign secretaries (senior foreign ministry civil servants) of each country. An under-resourced secretariat based in the Nepalese capital, Kathmandu, co-ordinates SAARC's activities. Afghanistan's request to join the grouping was formally accepted at a SAARC summit in the Bangladeshi capital, Dhaka, in 2005; it is expected to become a member in 2006.
In the early years agreements were made to establish a food security reserve, set up a meteorological centre, combat terrorism and encourage cultural exchanges between member states. Along with micro-level issues, SAARC has launched a South Asian Free-Trade Area (SAFTA). SAFTA, seen as a replacement for the South Asian Preferential Trading Arrangement (which was agreed in 1995 and had by 1996 identified more than 2,000 products as eligible for preferential treatment), was initially to be put in place by the ambitious target date of 2001, but eventually came into existence in January 2006. After the 1997 SAARC conference an eminent persons' group was formed to plot the way forward for the association. The group argued that closer economic ties were the key to the future, and proposed that a free-trade area be put in place by 2008 (2010 for the least developed member states), a customs union by 2015 and an economic union by 2020. Political factors weigh against even this extended timetable.
Tensions between the organisation's two largest members, India and Pakistan, have hampered SAARC's progress on wider issues, although it has been effective in providing a forum for meetings of non-governmental organisations and professional groupings. Indian objections to Pakistan's participation in SAARC summits after its military coup in 1999 led to the cancellation of summits in 1999 and 2000. India has also accused Pakistan of refusing to extend SAFTA benefits to it. The difficulty of making multilateral progress against a background of Indo-Pakistani tensions has led to a growing emphasis on bilateral trade links. India has signed bilateral free-trade agreements (FTAs), in effect by-passing SAARC, with Nepal (in 1996) and Sri Lanka (in 2000), and also has an FTA with Bhutan, while Pakistan and Sri Lanka signed an FTA in 2005. Moreover, much of SAARC's work is likely to be superseded by World Trade Organisation regulations.
SAARC's ability to reposition itself as the preferred conduit for bilateral relationships within South Asia is likely to determine the success or otherwise of the association. Its achievements in promoting civil-society links within South Asia contrast strongly with its failure to boost government-level ties—a reflection of the volatile relationship between India and Pakistan.
The South Asian Association for Regional Co-operation
52 India
Country Profile 2006 www.eiu.com © The Economist Intelligence Unit Limited 2006
The East Asia Community (EAC), which consists of the ten members of the Association of South-East Asian Nations (ASEAN) plus China, Japan, South Korea, India, Australia and New Zealand, was inaugurated at the East Asian Summit in mid-December 2005 in the Malaysian capital, Kuala Lumpur. The EAC has been a controversial idea from the time when it was first proposed, in 1991, by the Malaysian prime minister, Mahathir Mohamad. Initial opposition came from the US, which resented the fact that it was to be excluded from membership. However, the concept was revisited at a meeting in 2004 between ASEAN and China, Japan and South Korea (the so-called ASEAN + 3 grouping), when it received the enthusiastic backing of the Chinese premier, Wen Jiabao. Perhaps wary of Chinese ambitions, the other members of ASEAN + 3 supported a wider membership, and the group now also includes India, Australia and New Zealand. The December 2005 meeting marked a shaky start to the EAC, as it was dominated by the ongoing Sino-Japanese feud, Sino-Indian rivalry and a general wariness regarding China’s growing power. Chinese and Korean leaders refused to hold bilateral talks with their Japanese counterparts (owing to continuing animosity over what they see as Japan's failure to atone sufficiently for atrocities committed in those countries before and during the second world war). China also suggested that EAS members be divided into "core" (ASEAN + 3) and "secondary" (India, New Zealand and Australia) categories.
The EAC did reach agreement that ASEAN + 3 would be the core of the new grouping, but it was also decided that EAC meetings would always be hosted by an ASEAN country (China having previously made a bid to hold the second EAC meeting in 2006). India and Australia objected to their secondary status, and were supported in this by Japan. Given the prevailing discord at the December summit, it appears unlikely that the EAC will prove to be the precursor to an Asian version of the EU, and it is thus unlikely to facilitate mutually beneficial economic co-operation. From a political standpoint, the EAC is also unlikely to cause the US concern about a possible loss of its influence in the Asia region, at least for the foreseeable future.
East Asia Community (EAC)

India 53
© The Economist Intelligence Unit Limited 2006 www.eiu.com Country Profile 2006
Appendices
Sources of information
A great number of detailed statistics are available, of variable but often high quality. Three sources stand out: the annual Economic Survey of the Ministry of Finance is an excellent summary of most key economic data; the Reserve Bank of India produces a steady stream of data in its weekly, monthly and annual publications; and the Mumbai-based Centre for Monitoring the Indian Economy (CMIE) produces monthly and annual data in great detail and variety.
For economic data, the daily Business Line is the most comprehensive newspaper, although Business Standard and The Economic Times can be quicker off the mark.
For primary data, the following sources are the most important
Census of India, 2001
Central Statistical Office (CSO), Annual National Accounts Statistics, New Delhi
CSO, Estimates of National Product, Savings and Capital Formation (annual), New Delhi
CSO, Monthly Abstract of Statistics, New Delhi
Directorate General of Commercial Intelligence and Statistics (DGCIS), Trade Statistics of the DGCIS (monthly and annual), Kolkata. The DGCIS also publishes a shorter summary entitled Foreign Trade Statistics of India (Principal Commodities and Countries), which is reasonably detailed
Ministry of Finance, Budget of the Central Government (annual), New Delhi (although Indian budgetary conventions are arcane and require some interpretation)
NSSO, National Sample Survey Organisation, produces regular socio-economic surveys, including household surveys, the primary source for employment data
Reserve Bank of India (RBI, the central bank), Bulletin (monthly), Mumbai
RBI, Report on Currency and Finance (annual), Mumbai
Bank for International Settlements, International Banking and Financial Market Developments (quarterly)
IMF, International Financial Statistics (monthly)
International Institute for Strategic Studies, The Military Balance (annual)
OECD, Geographical Distribution of Financial Flows to Developing Countries (annual)
UN, Monthly Bulletin of Statistics
UN, World Investment Report (annual)
National statistical sources
International statistical sources

54 India
Country Profile 2006 www.eiu.com © The Economist Intelligence Unit Limited 2006
World Bank, World Development Report (annual)
Business World (weekly), Business India and Business Today (both fortnightly) are the chief business magazines
Economic and Political Weekly is a left-wing academic journal with high-quality analysis
India Today and Outlook are weekly magazines that concentrate on politics
For those wishing to get a general feel for Indian society, the best source is India's novelists. Particularly recommended are R K Narayan (especially the Malgudi novels), Vikram Seth (A Suitable Boy), Amit Chaudhuri (A Strange and Sublime Address), Ruth Prawer Jhabwala, Ved Mehta (Portrait of India, Face to Face), Gita Mehta, Anita Desai, Mulk Raj Anand, Nayantara Sahgal and Sunil Gangopadhyay
Academic analyses of the background to the economic reform programme are in Bimal Jalan (ed), The Indian Economy: Problems and Prospects, New Delhi, Viking/Penguin, 1992, and in Vijay Joshi and Ian Little (eds), Indian Economic Reform, Oxford University Press, 1995. A more up-to-date discussion of India's economic reforms is contained in India in the Era of Economic Reforms, edited by Ashutosh Varshney and Jeffrey Sachs, Oxford University Press, 2000
An integrated account of India's population, development and economy can be found in Tim Dyson et al, Twenty-First Century India, Oxford University Press, 2004
A regional perspective of economic growth in India can be found in M Baddeley, K McNay and R H Cassen, Divergence in India: Economic Growth at the State Level, 1990-07, London School of Economics, 2003
Major historical works are Louis Fischer's Life of Mahatma Gandhi (Granada, 1951); Jawaharlal Nehru's The Discovery of India (Meridian, London, 1945); Patrick French's Liberty or Death (Harper Collins, 1997), and Sunil Khilnani's The Idea of India (Hamish Hamilton, 1997)
Election Commission of India: www.eci.gov.in/
Ministry of Finance: www.nic.in/finmin/
Reserve Bank of India (central bank): www.rbi.in
The best all-encompassing news site is www.samachar.com
Select bibliography and websites
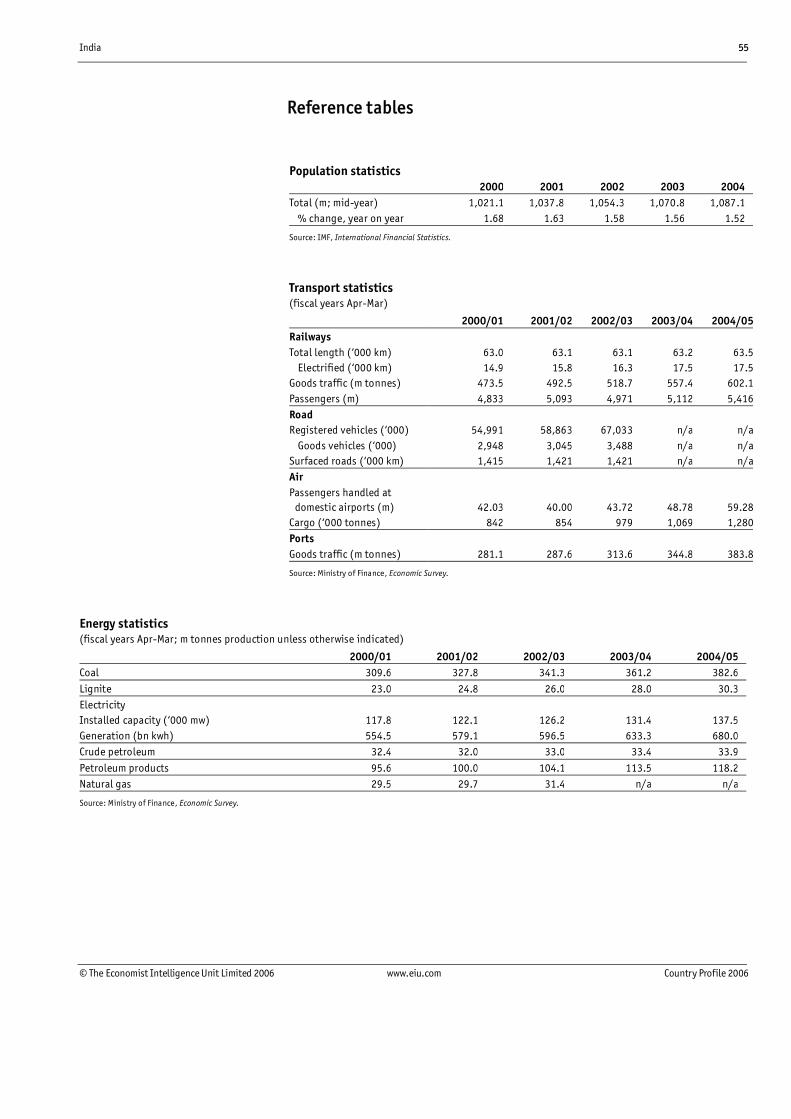
India 55
© The Economist Intelligence Unit Limited 2006 www.eiu.com Country Profile 2006
Reference tables
Population statistics 2000 2001 2002 2003 2004
Total (m; mid-year) 1,021.1 1,037.8 1,054.3 1,070.8 1,087.1
% change, year on year 1.68 1.63 1.58 1.56 1.52
Source: IMF, International Financial Statistics.
Transport statistics (fiscal years Apr-Mar)
2000/01 2001/02 2002/03 2003/04 2004/05Railways Total length (‘000 km) 63.0 63.1 63.1 63.2 63.5 Electrified (‘000 km) 14.9 15.8 16.3 17.5 17.5Goods traffic (m tonnes) 473.5 492.5 518.7 557.4 602.1Passengers (m) 4,833 5,093 4,971 5,112 5,416Road Registered vehicles (‘000) 54,991 58,863 67,033 n/a n/a Goods vehicles (‘000) 2,948 3,045 3,488 n/a n/aSurfaced roads (‘000 km) 1,415 1,421 1,421 n/a n/aAir Passengers handled at
domestic airports (m) 42.03 40.00 43.72 48.78 59.28Cargo (‘000 tonnes) 842 854 979 1,069 1,280Ports Goods traffic (m tonnes) 281.1 287.6 313.6 344.8 383.8
Source: Ministry of Finance, Economic Survey.
Energy statistics (fiscal years Apr-Mar; m tonnes production unless otherwise indicated)
2000/01 2001/02 2002/03 2003/04 2004/05
Coal 309.6 327.8 341.3 361.2 382.6
Lignite 23.0 24.8 26.0 28.0 30.3
Electricity
Installed capacity (‘000 mw) 117.8 122.1 126.2 131.4 137.5
Generation (bn kwh) 554.5 579.1 596.5 633.3 680.0
Crude petroleum 32.4 32.0 33.0 33.4 33.9
Petroleum products 95.6 100.0 104.1 113.5 118.2
Natural gas 29.5 29.7 31.4 n/a n/a
Source: Ministry of Finance, Economic Survey.
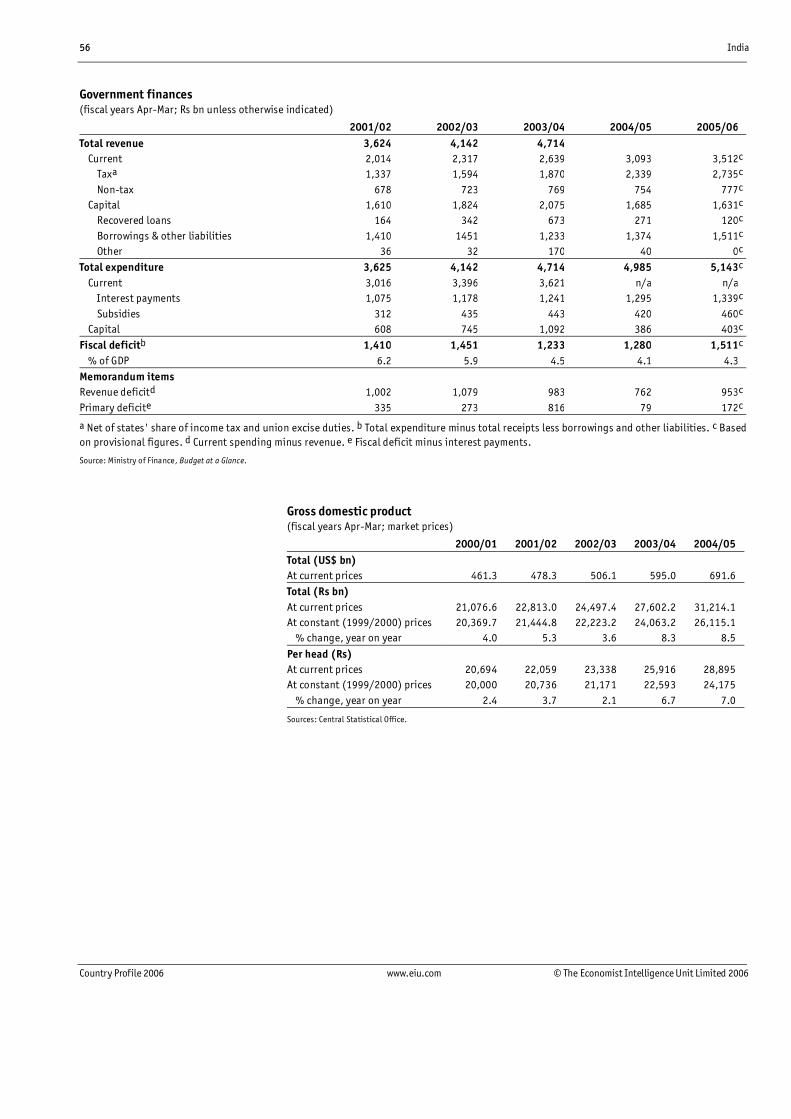
56 India
Country Profile 2006 www.eiu.com © The Economist Intelligence Unit Limited 2006
Government finances (fiscal years Apr-Mar; Rs bn unless otherwise indicated)
2001/02 2002/03 2003/04 2004/05 2005/06
Total revenue 3,624 4,142 4,714
Current 2,014 2,317 2,639 3,093 3,512c
Taxa 1,337 1,594 1,870 2,339 2,735c
Non-tax 678 723 769 754 777c
Capital 1,610 1,824 2,075 1,685 1,631c
Recovered loans 164 342 673 271 120c
Borrowings & other liabilities 1,410 1451 1,233 1,374 1,511c
Other 36 32 170 40 0c
Total expenditure 3,625 4,142 4,714 4,985 5,143c
Current 3,016 3,396 3,621 n/a n/a
Interest payments 1,075 1,178 1,241 1,295 1,339c
Subsidies 312 435 443 420 460c
Capital 608 745 1,092 386 403c
Fiscal deficitb 1,410 1,451 1,233 1,280 1,511c
% of GDP 6.2 5.9 4.5 4.1 4.3
Memorandum items
Revenue deficitd 1,002 1,079 983 762 953c
Primary deficite 335 273 816 79 172c
a Net of states' share of income tax and union excise duties. b Total expenditure minus total receipts less borrowings and other liabilities. c Based on provisional figures. d Current spending minus revenue. e Fiscal deficit minus interest payments.
Source: Ministry of Finance, Budget at a Glance.
Gross domestic product (fiscal years Apr-Mar; market prices)
2000/01 2001/02 2002/03 2003/04 2004/05
Total (US$ bn) At current prices 461.3 478.3 506.1 595.0 691.6
Total (Rs bn) At current prices 21,076.6 22,813.0 24,497.4 27,602.2 31,214.1
At constant (1999/2000) prices 20,369.7 21,444.8 22,223.2 24,063.2 26,115.1
% change, year on year 4.0 5.3 3.6 8.3 8.5
Per head (Rs) At current prices 20,694 22,059 23,338 25,916 28,895
At constant (1999/2000) prices 20,000 20,736 21,171 22,593 24,175
% change, year on year 2.4 3.7 2.1 6.7 7.0
Sources: Central Statistical Office.

India 57
© The Economist Intelligence Unit Limited 2006 www.eiu.com Country Profile 2006
Nominal gross domestic product by expenditure (fiscal years Apr-Mar; Rs bn at current prices where series are indicated; otherwise % of total)
2000/01 2001/02 2002/03 2003/04 2004/05
Private consumption 13,442.1 14,673.2 15,389.3 17,182.3 18,910.9
63.8 64.3 62.8 62.2 60.6
Government consumption 2,644.2 2,803.6 2,888.6 3,078.2 3,515.6
12.5 12.3 11.8 11.2 11.3
Gross fixed investment 4,786.0 5,272.6 5,896.1 6,820.0 8,069.0
22.7 23.1 24.1 24.7 25.9
Stockbuilding 182.7 130.3 154.4 191.5 422.0
0.9 0.6 0.6 0.7 1.4
Exports of goods & services 2,781.3 2,907.6 3,555.6 4,078.0 5,915.6
13.2 12.7 14.5 14.8 19.0
Imports of goods & services 2,975.2 3,110.5 3,799.8 4,434.0 6,550.6
14.1 13.6 15.5 16.1 21.0
GDP 21,076.6 22,813.0 24,497.4 27,602.2 31,214.1
Source: Central Statistical Office.
Real gross domestic product by expenditure (fiscal years Apr-Mar; Rs bn at constant 1999/2000 prices where series are indicated; otherwise % change, year on year)
2000/01 2001/02 2002/03 2003/04 2004/05
Private consumption 12,883.4 13,676.8 13,894.0 14,976.7 15,954.9
2.1 6.2 1.6 7.8 6.5
Government consumption 2,530.0 2,573.3 2,558.5 2,620.2 2,862.0
0.3 1.7 -0.6 2.4 9.2
Gross fixed investment 4,571.0 4,801.1 5,275.9 5,873.7 6,253.6
0.0 5.0 9.9 11.3 6.5
Stockbuilding 174.6 115.4 139.0 118.2 282.8
-1.1a -0.3a 0.1 a -0.1a 0.7a
Exports of goods & services 2,692.4 2,845.0 3,465.5 3,667.3 5,108.5
18.2 5.7 21.8 5.8 39.3
Imports of goods & services 2,749.8 2,843.2 3,137.8 3,364.5 5,198.9
3.5 3.4 10.4 7.2 54.5
GDP 20,369.7 21,444.8 22,223.2 24,063.2 26,115.1
4.0 5.3 3.6 8.3 8.5
a Change as a percentage of GDP in the previous year.
Source: Central Statistical Office.
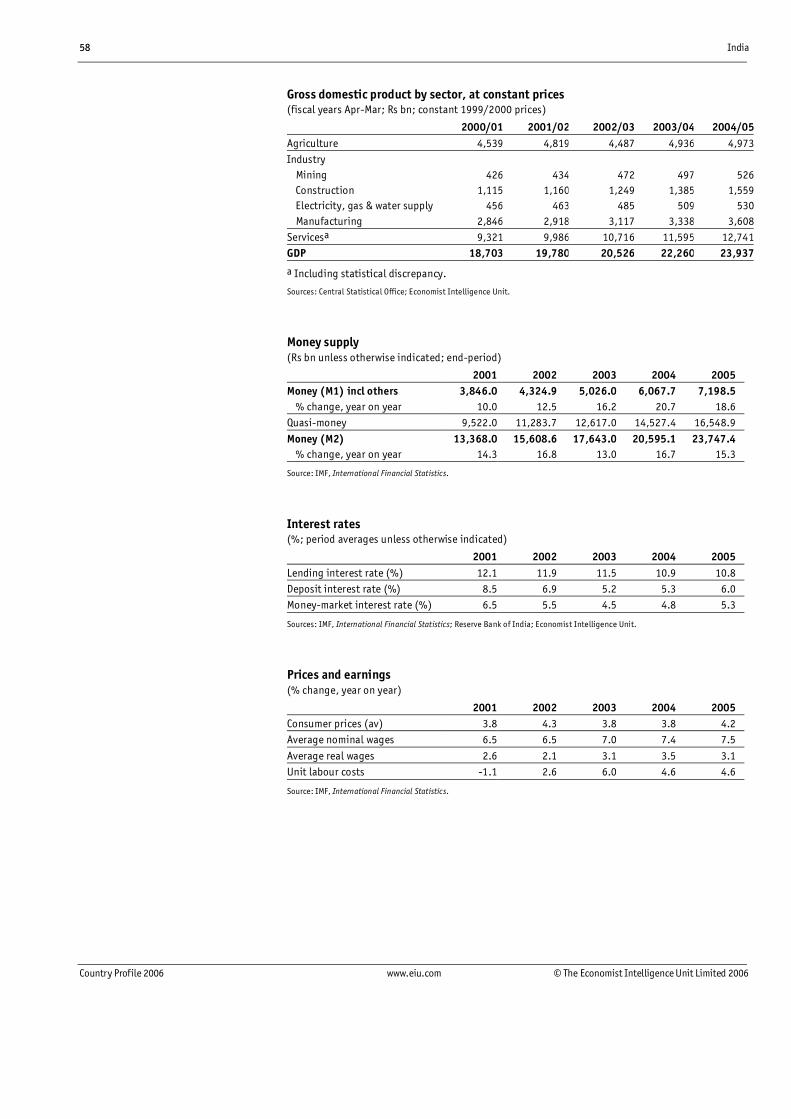
58 India
Country Profile 2006 www.eiu.com © The Economist Intelligence Unit Limited 2006
Gross domestic product by sector, at constant prices (fiscal years Apr-Mar; Rs bn; constant 1999/2000 prices)
2000/01 2001/02 2002/03 2003/04 2004/05Agriculture 4,539 4,819 4,487 4,936 4,973Industry Mining 426 434 472 497 526 Construction 1,115 1,160 1,249 1,385 1,559 Electricity, gas & water supply 456 463 485 509 530 Manufacturing 2,846 2,918 3,117 3,338 3,608Servicesa 9,321 9,986 10,716 11,595 12,741GDP 18,703 19,780 20,526 22,260 23,937
a Including statistical discrepancy.
Sources: Central Statistical Office; Economist Intelligence Unit.
Money supply (Rs bn unless otherwise indicated; end-period)
2001 2002 2003 2004 2005
Money (M1) incl others 3,846.0 4,324.9 5,026.0 6,067.7 7,198.5
% change, year on year 10.0 12.5 16.2 20.7 18.6
Quasi-money 9,522.0 11,283.7 12,617.0 14,527.4 16,548.9
Money (M2) 13,368.0 15,608.6 17,643.0 20,595.1 23,747.4
% change, year on year 14.3 16.8 13.0 16.7 15.3
Source: IMF, International Financial Statistics.
Interest rates (%; period averages unless otherwise indicated)
2001 2002 2003 2004 2005
Lending interest rate (%) 12.1 11.9 11.5 10.9 10.8
Deposit interest rate (%) 8.5 6.9 5.2 5.3 6.0
Money-market interest rate (%) 6.5 5.5 4.5 4.8 5.3
Sources: IMF, International Financial Statistics; Reserve Bank of India; Economist Intelligence Unit.
Prices and earnings (% change, year on year)
2001 2002 2003 2004 2005
Consumer prices (av) 3.8 4.3 3.8 3.8 4.2
Average nominal wages 6.5 6.5 7.0 7.4 7.5
Average real wages 2.6 2.1 3.1 3.5 3.1
Unit labour costs -1.1 2.6 6.0 4.6 4.6
Source: IMF, International Financial Statistics.

India 59
© The Economist Intelligence Unit Limited 2006 www.eiu.com Country Profile 2006
Agricultural productiona (m tonnes unless otherwise indicated)
2000/01 2001/02 2002/03 2003/04 2004/05
Foodgrains & pulses 196.8 212.9 174.8 213.5 204.6
Rice 85.0 93.3 71.8 88.3 85.3
Wheat 69.7 72.8 65.8 72.1 72.0
Coarse grains (millet, sorghum & maize) 31.1 33.4 26.1 38.1 33.9
Pulses 11.1 13.4 11.1 14.9 13.4
Oilseedsb 18.4 20.7 14.8 25.3 26.1
Groundnut 6.4 7.0 4.1 8.2 7.0
Beverages
Teac 848.4 847.4 846.0 850.5 830.7
Coffeed 3.0 3.0 2.8 2.7 2.8
Fibres
Cotton (lint; m 170-kg bales)d 9.5 10.0 8.7 13.8 17.0
Jute & mesta (m 180-kg bales) 10.5 11.7 11.4 11.2 10.5
Other products
Sugarcane 296.0 297.2 287.4 237.3 232.3
Rubber ('000 tonnes)d 630 631 649 711 749
Potatoes 22.5 23.9 23.2 n/a n/a
a Crop years (July-June) unless otherwise indicated. b October-September. c Calendar years; m kg. d Fiscal years (April-March).
Sources: Ministry of Agriculture, Statistics at a Glance; Ministry of Finance, Economic Survey.
Mineral production (fiscal years Apr-Mar; m tonnes)
2000/01 2001/02 2002/03 2003/04 2004/05
Coal & lignite 332.6 352.6 367.2 389.3 413.0
Crude oil
Domestic production 32.4 32.0 33.0 33.4 33.9
Imports 74.1 78.7 82.0 90.4 95.9
Refinery throughput 103.4 107.3 112.6 121.8 127.1
Petroleum productsa
Domestic production 95.6 100.0 104.1 113.5 118.2
Imports (net) 0.9 -3.1 -3.6 -6.7 -9.4
a Some disparity is likely owing to refinery consumption and stock changes.
Source: Ministry of Finance, Economic Survey.

60 India
Country Profile 2006 www.eiu.com © The Economist Intelligence Unit Limited 2006
Industrial production (fiscal years Apr-Mar)
2000/01 2001/02 2002/03 2003/04 2004/05
Finished steel (m tonnes) 30.3 31.1 34.5 36.9 39.3
Aluminium (virgin metal; ‘000 tonnes) 620.4 552.1 467.0 601.2 516.4
Copper (blister; ‘000 tonnes) n/a n/a n/a n/a n/a
Motor vehicles (‘000 units)a 1,001 1,046 1,202 1,604 1,934
Motorcycles & mopeds (‘000 units) 3,759 3,932 5,088 5,625 6,455
Bicycles (‘000 units) 14,974 11,899 11,595 12,341 n/a
Power-driven pumps (‘000 units) 481 472 584 663 648
a All types; includes buses, trucks and tempos, and three- and four-wheelers.
Source: Ministry of Finance, Economic Survey.
Gross domestic savings (fiscal years Apr-Mar; % of GDP)
2000/01 2001/02 2002/03 2003/04 2004/05Household sector 21.2 22.0 23.1 23.5 22.0
Private corporate 4.1 3.6 4.1 4.4 4.8Public sector -1.8 -2.0 -0.7 1.0 2.2
Source: Ministry of Finance, Economic Survey.
Stockmarket indicators (Bombay Stock Exchange; end-period)
2001 2002 2003 2004 2005BSE SENSEXa (1978/79=100) 3,262 3,377 5,838 6,602 9,398Change in value of stockmarket index (%) -16.4 3.5 72.8 13.1 42.3
No. of listed companies 5,795 5,650 5,644 4,730 n/aMarket capitalisation (US$ bn) 110 131 279 388 n/a
a Leading index of the Bombay Stock Exchange.
Sources: Standard & Poor's, Emerging Stock Market Review; Bombay Stock Exchange.

India 61
© The Economist Intelligence Unit Limited 2006 www.eiu.com Country Profile 2006
Main composition of trade (US$ m; fob-cif)
2000/01 2001/02 2002/03 2003/04 2004/05
Exports fob Engineering goods 6,958 9,033 12,405 17,348 21,547
Textiles & clothing 10,206 11,617 12,791 13,555 16,039
Gems & jewellery 7,306 9,029 10,573 13,761 15,546
Petroleum products 2,119 2,576 3,568 6,989 11,514
Agricultural & allied products 5,901 6,710 7,533 8,474 10,199
Total exports incl others 43,827 52,719 63,843 83,535 102,725
Imports cif Petroleum products 14,000 17,640 20,569 29,844 43,963
Electronic goods (incl software) 3,998 6,093 7,889 10,659 14,087
Gold & silver 4,582 4,288 6,856 11,150 11,189
Precious & semi-precious stones 4,623 6,063 7,129 9,423 9,141
Machinery (non-electrical/electronic) 3,998 6,093 7,889 6,818 9,894
Total imports incl others 51,413 61,412 78,149 111,517 142,416
Source: Reserve Bank of India.
Main trading partners (% of total)
2001 2002 2003 2004 2005
Exports fob to: US 21.6 20.8 19.3 17.0 19.2
China 3.6 3.5 4.6 5.5 9.5
UAE 3.9 6.3 7.9 8.7 8.4
UK 5.7 4.9 4.9 4.5 4.9
Imports cif from: China 4.1 4.6 5.2 6.2 7.4
US 8.2 7.3 6.9 6.1 6.6
Belgium 5.9 6.1 5.5 4.5 5.2
Singapore 6.0 2.5 2.7 2.5 4.9
Source: IMF, Direction of Trade Statistics.
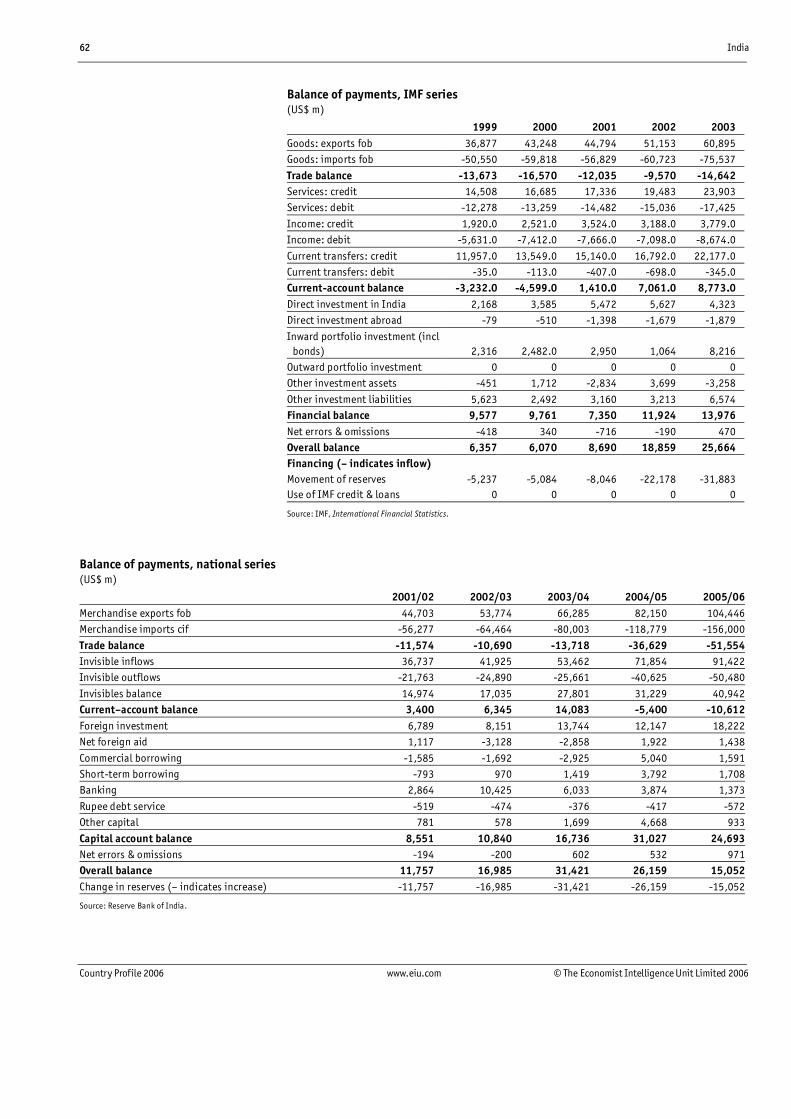
62 India
Country Profile 2006 www.eiu.com © The Economist Intelligence Unit Limited 2006
Balance of payments, IMF series (US$ m)
1999 2000 2001 2002 2003
Goods: exports fob 36,877 43,248 44,794 51,153 60,895
Goods: imports fob -50,550 -59,818 -56,829 -60,723 -75,537
Trade balance -13,673 -16,570 -12,035 -9,570 -14,642
Services: credit 14,508 16,685 17,336 19,483 23,903
Services: debit -12,278 -13,259 -14,482 -15,036 -17,425
Income: credit 1,920.0 2,521.0 3,524.0 3,188.0 3,779.0
Income: debit -5,631.0 -7,412.0 -7,666.0 -7,098.0 -8,674.0
Current transfers: credit 11,957.0 13,549.0 15,140.0 16,792.0 22,177.0
Current transfers: debit -35.0 -113.0 -407.0 -698.0 -345.0
Current-account balance -3,232.0 -4,599.0 1,410.0 7,061.0 8,773.0
Direct investment in India 2,168 3,585 5,472 5,627 4,323
Direct investment abroad -79 -510 -1,398 -1,679 -1,879
Inward portfolio investment (incl bonds) 2,316 2,482.0 2,950 1,064 8,216
Outward portfolio investment 0 0 0 0 0
Other investment assets -451 1,712 -2,834 3,699 -3,258
Other investment liabilities 5,623 2,492 3,160 3,213 6,574
Financial balance 9,577 9,761 7,350 11,924 13,976
Net errors & omissions -418 340 -716 -190 470
Overall balance 6,357 6,070 8,690 18,859 25,664
Financing (– indicates inflow) Movement of reserves -5,237 -5,084 -8,046 -22,178 -31,883
Use of IMF credit & loans 0 0 0 0 0
Source: IMF, International Financial Statistics.
Balance of payments, national series (US$ m)
2001/02 2002/03 2003/04 2004/05 2005/06Merchandise exports fob 44,703 53,774 66,285 82,150 104,446Merchandise imports cif -56,277 -64,464 -80,003 -118,779 -156,000
Trade balance -11,574 -10,690 -13,718 -36,629 -51,554Invisible inflows 36,737 41,925 53,462 71,854 91,422Invisible outflows -21,763 -24,890 -25,661 -40,625 -50,480
Invisibles balance 14,974 17,035 27,801 31,229 40,942Current–account balance 3,400 6,345 14,083 -5,400 -10,612Foreign investment 6,789 8,151 13,744 12,147 18,222Net foreign aid 1,117 -3,128 -2,858 1,922 1,438
Commercial borrowing -1,585 -1,692 -2,925 5,040 1,591Short-term borrowing -793 970 1,419 3,792 1,708Banking 2,864 10,425 6,033 3,874 1,373
Rupee debt service -519 -474 -376 -417 -572Other capital 781 578 1,699 4,668 933
Capital account balance 8,551 10,840 16,736 31,027 24,693Net errors & omissions -194 -200 602 532 971Overall balance 11,757 16,985 31,421 26,159 15,052Change in reserves (– indicates increase) -11,757 -16,985 -31,421 -26,159 -15,052
Source: Reserve Bank of India.
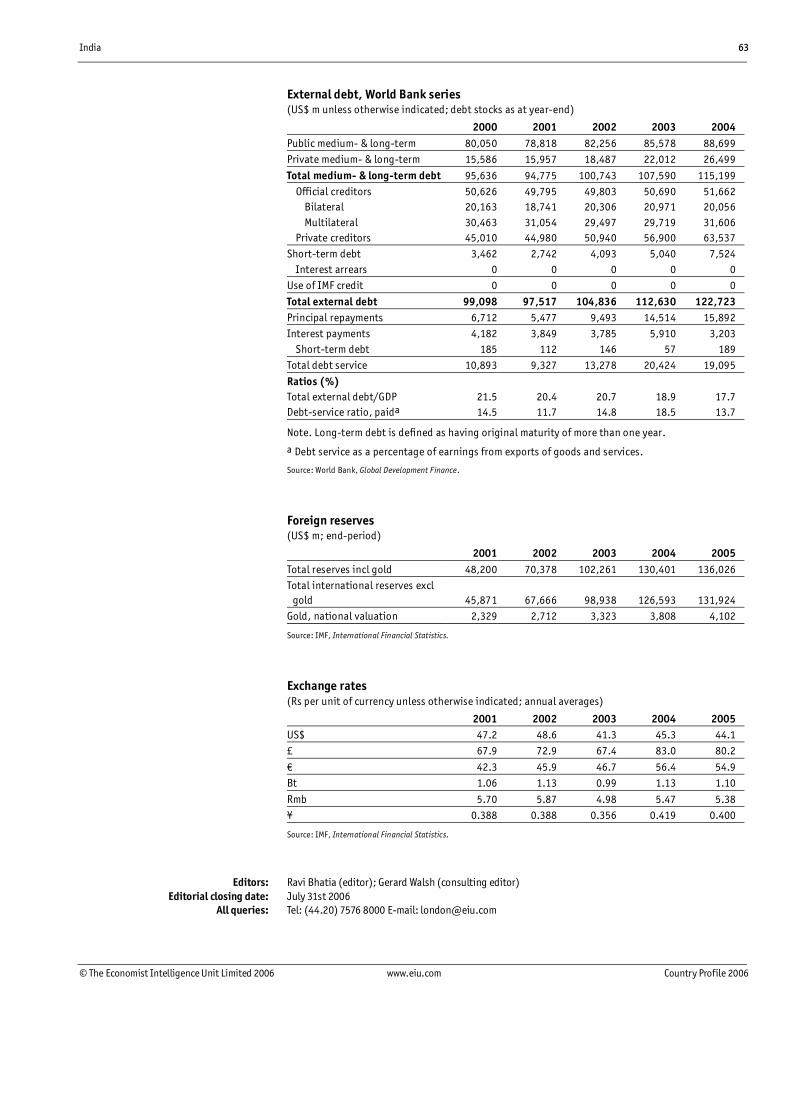
India 63
© The Economist Intelligence Unit Limited 2006 www.eiu.com Country Profile 2006
External debt, World Bank series (US$ m unless otherwise indicated; debt stocks as at year-end)
2000 2001 2002 2003 2004
Public medium- & long-term 80,050 78,818 82,256 85,578 88,699
Private medium- & long-term 15,586 15,957 18,487 22,012 26,499
Total medium- & long-term debt 95,636 94,775 100,743 107,590 115,199
Official creditors 50,626 49,795 49,803 50,690 51,662
Bilateral 20,163 18,741 20,306 20,971 20,056
Multilateral 30,463 31,054 29,497 29,719 31,606
Private creditors 45,010 44,980 50,940 56,900 63,537
Short-term debt 3,462 2,742 4,093 5,040 7,524
Interest arrears 0 0 0 0 0
Use of IMF credit 0 0 0 0 0
Total external debt 99,098 97,517 104,836 112,630 122,723
Principal repayments 6,712 5,477 9,493 14,514 15,892
Interest payments 4,182 3,849 3,785 5,910 3,203
Short-term debt 185 112 146 57 189
Total debt service 10,893 9,327 13,278 20,424 19,095
Ratios (%) Total external debt/GDP 21.5 20.4 20.7 18.9 17.7
Debt-service ratio, paida 14.5 11.7 14.8 18.5 13.7
Note. Long-term debt is defined as having original maturity of more than one year.
a Debt service as a percentage of earnings from exports of goods and services.
Source: World Bank, Global Development Finance.
Foreign reserves (US$ m; end-period)
2001 2002 2003 2004 2005
Total reserves incl gold 48,200 70,378 102,261 130,401 136,026
Total international reserves excl gold 45,871 67,666 98,938 126,593 131,924
Gold, national valuation 2,329 2,712 3,323 3,808 4,102
Source: IMF, International Financial Statistics.
Exchange rates (Rs per unit of currency unless otherwise indicated; annual averages)
2001 2002 2003 2004 2005
US$ 47.2 48.6 41.3 45.3 44.1
£ 67.9 72.9 67.4 83.0 80.2
€ 42.3 45.9 46.7 56.4 54.9
Bt 1.06 1.13 0.99 1.13 1.10
Rmb 5.70 5.87 4.98 5.47 5.38
¥ 0.388 0.388 0.356 0.419 0.400
Source: IMF, International Financial Statistics.
Editors: Ravi Bhatia (editor); Gerard Walsh (consulting editor) Editorial closing date: July 31st 2006 All queries: Tel: (44.20) 7576 8000 E-mail: [email protected]