india microfinance and financial sector ...13cb617c-7b73-4489-8b0f...car capital adequacy ratio...
TRANSCRIPT

INDIA: MICROFINANCE AND FINANCIAL SECTOR
DIAGNOSTIC STUDY
FINAL REPORT
JUNE 2008


INDIA: MICROFINANCE AND FINANCIAL SECTOR
DIAGNOSTIC STUDY
FINAL REPORT
© 2009 International Finance Corporation and KfW Bankengruppe All rights reserved. International Finance Corporation (IFC) 2121 Pennsylvania Avenue, NW Washington, DC 20433 USA (202) 473-1000
KfW Bankengruppe Palmengartenstraße 5-9 60325 Frankfurt am Main Telephone: 49 69 74 31 0 Telefax: 49 69 74 31 29 44 E-mail: [email protected]
The findings, interpretations, and conclusions expressed herein do not necessarily reflect the views of the Executive Directors of KfW Bankengruppe or the Executive Directors of the International Bank for Reconstruction and Development/The World Bank, or the governments that they represent. KfW Bankengruppe and the IFC do not guarantee the accuracy of the data included in this work. The boundaries, colors, denominations, and other information shown on any map in this work do not imply any judgment on the part of KfW Bankengruppe or the IFC concerning the legal status of any territory or the endorsement or acceptance of such boundaries. Rights and Permissions The material in this publication is copyrighted. Copying and/or transmitting portions or all of this work without permission may be a violation of applicable law. Front cover Map on front cover provided by the Frankfurt School of Finance & Management, Germany. Reprinted with permission.
The Microfinance Initiative for Asia is a joint project of KfW Bankengruppe and the International Finance Corporation (The International Bank for Reconstruction and Development /The World Bank).

v
Table of Contents
Acknowledgments ................................................................................................................... vi
Abbreviations .......................................................................................................................... vii
Executive Summary................................................................................................................. ix
Introduction ...............................................................................................................................1
Demand for Financial Services..................................................................................................5
Financial Sector .........................................................................................................................9
Market Structure ...................................................................................................................... 19
Performance.............................................................................................................................23
Financial Infrastructure ...........................................................................................................27
Legal, Regulatory, and Policy Framework..............................................................................32
Donor Activities .......................................................................................................................36
Gap Analysis ............................................................................................................................38
Selected Bibliography ..............................................................................................................40 Tables Table 1. Indian Macroeconomic Indicators, 2003–2007............................................................3 Table 2. Enterprise Classification by Investment .....................................................................5 Table 3. Financial Depth and Outreach of Indian Financial Sector, 2005–2007 .................... 10 Table 4. Financial Institutions in India, 2007 ......................................................................... 11 Table 5. Basic Indicators of Financial Institutions in India, 2007.......................................... 19 Table 6. Microfinance Sector Indicators, 2006–2007...............................................................20 Table 7. Top 10 Microfinance Providers in India, as of 1Q08 ................................................. 21 Table 8. Financial Sector Performance, 2006 ..........................................................................24 Table 9. Performance of Indian Payment Systems, 2003–2006 ...............................................29

vi
Acknowledgments This report, written in June 2008, was commissioned from the Frankfurt School of Finance & Management by the Microfinance Initiative for Asia (MIFA), a joint venture of KfW Bankengruppe and the International Finance Corporation (IFC) of the World Bank Group. The report is one of a series of microfinance diagnostic studies of Asian countries commissioned by MIFA.

vii
Abbreviations
ADB Asian Development Bank AmFA ACCESS Microfinance Alliance BFS Board for Financial Supervision CAR capital adequacy ratio CRISIL Credit Rating Information Services of India Limited CIBIL Credit Information Bureau India Ltd. DFID Department for International Development, United Kingdom DICGC Deposit Insurance and Credit Guarantee Corporation DIF Deposit Insurance Fund FFI foreign financial institution FWWB Friends of Women’s World Banking GDP gross domestic product GTZ Gesellschaft für Technische Zusammenarbeit HLCCFM High-Level Coordination Committee on Financial and Capital Markets ICAI Institute of Chartered Accountants of India IFC International Finance Corporation IFRS International Financial Reporting Standards INC Indian National Congress INR Indian rupees (national currency) IRDA Insurance Regulatory and Development Authority KfW Kreditanstalt für Wiederaufbau MFI microfinance institution MSE micro and small enterprise MSME micro, small, and medium enterprise NABARD National Bank for Agricultural and Rural Development NBFC nonbank finance company NGO nongovernmental organization NPL nonperforming loan NPM Netherlands Platform for Microfinance OECD Organisation for Economic Co-operation and Development PAR portfolio at risk PACS Primary Agricultural Credit Societies PFRDA Pension Fund Regulatory and Development Authority RBI Reserve Bank of India ROA return on assets ROE return on equity RRB regional rural bank RTGS real-time gross settlement system

viii
All dollar amounts in U.S. dollars unless otherwise noted.
SBI State Bank of India SEBI Securities and Exchange Board of India SEWA Self-Employed Women’s Association SFMC SIDBI Foundation for Micro Credit SHG self-help group SME small and medium enterprise SIDBI Small Industries Development Bank of India SIPS systematically important payments system SSI small-scale industry SOCB state-owned commercial bank UNDP United Nations Development Programme UPA United Progressive Alliance

ix
Executive Summary Macro Economy India has undergone a profound shift in economic management since
the mid-1980s. Successive reforms have progressively moved the Indian economy towards a market-based system. State intervention and control over economic activity has been reduced significantly and the role of private sector entrepreneurship has increased. Overall, reform has had a major beneficial impact on the economy. Annual growth in per capita gross domestic product (GDP) has accelerated from just 1.25 percent in the three decades after independence to 7.5 percent in recent years, a rate of growth that will double average income in a decade. Potential growth of the output of the state sector is currently estimated at 8.5 percent annually. Increased economic growth has helped reduce poverty, which has begun to fall in absolute terms. With over 1 billion people, India is home to 17 percent of the global population and set to overtake China as the world’s most populous nation in three decades. India has the 12th-largest economy by GDP in the world; in Asia, its economy is third, behind only China and Japan.
MSE Sector The medium and small enterprise (MSE) sector in India is growing
much faster and more consistently than the overall industrial sector of the country. Between 2000 and 2006, the growth rate for MSEs in manufacturing rose steadily at about 12 percent a year. In 2007, it was estimated that 2 million registered and 10.8 million unregistered micro and small enterprises employed roughly 31.2 million people. Together, these businesses contributed some 39 percent of national manufacturing output and some 45 percent of exports. In addition, another 20 million urban informal enterprises employed approximately 40 million more workers.
In recent years, the government has paid greater attention to micro, small, and medium enterprises (MSMEs) due to their contribution to economic growth and potential for lifting poor people out of poverty. In 1999 a Ministry for Micro, Small, and Medium Enterprises was established. It has since implemented several promotional programs for MSMEs, including a credit guarantee scheme and an MSME cluster program.
Obstacles to MSE Growth A significant number of products in India are exclusively reserved for
what is known in the country as small-scale industry (SSI). Yet the definition of SSIs, based on investment size, works against these small businesses. As a result, the most obvious obstacle to MSE growth in India is that enterprises producing SSI products are not allowed to grow beyond their original capital investment. In

x
particular, urban microenterprises face special problems in accessing finance—a large number work on daily and weekly business cycles. Unlike many other countries, microfinance credit technology in India is often adjusted to longer business cycles, such as those found in rural areas, making it difficult to lend to urban clients. The banking sector in general has several problems with financing small firms and generally lacks experience with MSE-specific lending and monitoring methodologies.
Demand Potential The potential market for microfinance in India appears to be in the
range of 57.9–77.3 million clients, which translates into an annual credit demand of $5.7 billion–$19.1 billion (INR 230–773 billion). Considering economically active low-income occupational segments, such as small and marginal farmers, landless agricultural laborers, and microentrepreneurs, together with microfinance clients, the potential market could reach an estimated 245.7 million customers and an annual loan demand of $51.4 billion (INR 2.1 trillion). Significant market demand also exists among the low-income population for insurance, pension, savings, and remittance products. Existing regulatory restrictions, however, constrain for-profit MFIs from tapping into these markets.
Financial Sector Reforms launched a decade ago have transformed the operating
environment of the Indian financial sector from an administered economy to a competitive, market-based system. The financial sector has to date kept pace with the growing needs of corporate and other borrowers. Yet even though India has one of the largest networks of bank branches in the world, millions of poor people in the country are still largely shut out of the financial sector. The main challenge of the financial sector today is to capture and pool more savings into productive investments.
Banking Sector The Indian banking sector comprises 82 public, private, and foreign
commercial banks; 96 regional rural banks; 31 state-level cooperative banks; 1,815 urban cooperative banks; and 7 development finance institutions. At the nonbank level, there are 13,020 nonbank finance companies the (NBFCs) and about 100,000 village-level cooperative societies. Due to market fragmentation, there is no complete picture of NBFCs that are microfinance providers. Their number is estimated at about 800, but the larger MFIs, which represent 2 percent of all such institutions, reach around 77 percent of all MFI clients.
The Indian banking system has large geographic and functional coverage. While commercial banks cater to short- and medium-term financing requirements, national- and state-level financial institutions serve longer-term requirements. Yet this distinction is becoming

xi
blurred, with commercial banks now providing project finance. In fact, the banking sector appears set to witness the emergence of financial supermarkets in the form of universal banks, which will provide a suite of services, from retail to corporate and industrial lending to investment banking.
Microfinance Sector The microfinance market in India is highly fragmented and
nontransparent. About 800 microfinance institutions (MFIs) are active in the country, but 7 large institutions dominate the market. As of 2006, these 7 MFIs held 81 percent of the total microfinance loan portfolio and served 67 of microfinance borrowers. In terms of institution type, NBFCs dominate the market, followed by (not-for-profit) societies, Section 25 companies, and trusts. Only a few meaningful microfinance associations exist, the most prominent of which are Sa-Dhan and ACESSS Microfinance Alliance. The preferred microfinance methodology in the country is group lending. The Self-help Group-bank linkage model is also very popular. The provision of individual loans to first-time borrowers is uncommon; only 7 percent of all microfinance loans in the country are individual loans. There is a gap in the supply of credit to small enterprises that need higher-than-average group loans, but are not perceived as sufficiently bankable. In 2007–2008, the Indian microfinance sector grew at more than four times the growth rate of the national economy (as measured by outreach growth and GDP, respectively). MFIs grew by 21 percent in 2006, followed by a whopping 72 percent in 2007. With an average staff-to-borrower ratio of roughly 1 to 275, Indian MFIs are among the most efficient in the world. They are also some of the most leveraged in the world due to a government policy that has given them easy access to bank credit in recent years. As of year-end 2007, the outstanding portfolio of the sector was roughly $5 billion and total clients stood at approximately 52 million. Intellecap, an Indian consulting firm, projects that MFI loan portfolios will collectively reach close to $6 billion by 2012. The microfinance market in India is largely rural, but urban lending is picking up. Four out of five microfinance clients in India are women; more than half of all MFI clients live in southern and more than a quarter live in eastern India. Of note, medium-size MFIs have the largest share of the urban market, but these institutions are encountering the greatest difficulties in attracting sufficient financing to strengthen their capital base. Institutional investors are predominantly interested in either the top MFIs or professionally organized start-ups.

xii
To date, the Reserve Bank of India has left the regulation of microfinance largely to the sector itself. The pending microfinance bill, which has already been revised twice, would empower the National Bank for Agricultural and Rural Development (NABARD) as the regulator for the sector. NABARD is already the de facto regulator of state and district cooperative banks, as well as regional rural banks. Unfortunately, as of this writing, the draft bill would not establish a level playing field in the sector because it would exclude NBFCs and Section 25 companies, which together serve more than half of all microfinance customers. It would thus fail to establish uniform operational standards. In addition, the bill does not provide a form of registration uniquely suited to microfinance.
Microfinance Trends In the medium run, development of the microfinance sector requires
the transformation of dynamically growing non-NBFC MFIs (such as nongovernmental organizations, trusts, and societies) into regulated legal institutions, such as NBFCs. This change will trigger a related need for reformed regulatory requirements, together with upgraded governance and management systems. The scarcity of qualified human resources poses a crucial hurdle in this regard. Finally, MFIs are increasingly seeking to diversify their income sources by using their infrastructure for cross-selling (i.e., providing additional services such as insurance, remittances, and supply-chain financing—either directly or as agents for other businesses).
Obstacles to Microfinance As noted above, the regulatory environment is only partially
conducive to the development of the microfinance sector. Restrictive regulations on external commercial borrowing, looming risks of interest rate limitations, and uncertainty regarding the pending microfinance bill further aggravate the growth of the sector.
Investment Opportunities The access of nonresident investors, such as the IFC and KfW, to
investment opportunities in India is constrained by restrictive regulations on external commercial borrowing. Nonresidents are, for example, prohibited from providing loans to any type of institution other than an NGO. Guarantees and credit enhancements, such as those used for securitization purposes, require the approval of the RBI. Due to this constraint, investment opportunities have been restricted to equity investments in financial intermediaries, wholesale structures, and companies that support the microfinance industry (e.g., technical service providers). In order to circumvent the hurdle of external commercial borrowing, this report suggests reviving the idea of a debt fund for the microfinance sector.

1
Introduction Political Environment India is the world’s largest democracy by population. Politics takes place
in a framework of a federal parliamentary system. The multiparty representative democratic republic is modeled after the British Westminster system. For most of its democratic history, the federal Government of India has been led by the Indian National Congress (INC). In the 2004 national elections, the INC won the largest number of parliamentary seats and formed a government with a coalition called the United Progressive Alliance (UPA), which was supported by various left-leaning parties until mid-2008. In the last several years, the country has experienced severe inner conflicts along ethnic lines, as well as minor terrorist attacks. A growing discrepancy between urban wealth and rural poverty is also threatening social stability. Foreign policy has been dominated by stronger economic cooperation with China, regardless of minor border disputes, and a deepening strategic partnership with the United States on military and terrorism affairs.1
Macroeconomic Context India has undergone a profound shift in economic management since the
mid-1980s. Successive reforms have progressively moved the Indian economy towards a market-based system. State intervention and control over economic activity has been reduced significantly and the role of private sector entrepreneurship has increased. To varying degrees, liberalization has touched most aspects of economic policy, including industrial policy, fiscal policy, financial market regulation, and trade and foreign investment.2 Overall, reform has had a major beneficial impact on the economy. Annual growth in per capita gross domestic product (GDP) has accelerated from just 1.25 percent in the three decades after independence to 7.5 percent in recent years, a growth rate that will double average income in a decade. Potential output growth of the state sector is currently estimated at 8.5 percent annually. Increased economic growth has helped reduce poverty, which has begun to fall in absolute terms.3 Areas that have been liberalized have responded well. Output has grown rapidly in service sectors in which government regulation has been significantly eased or is less burdensome (e.g., communications, insurance, asset management, and information technology), with exports of information technology–enabled services going particularly strong. The private sector has proven extremely effective and growth has been
1 World Bank, 2006, “Microfinance in South Asia—Toward Financial Inclusion for the Poor,” World Bank, Washington, DC. 2 OECD, 2007, “Policy Brief—Economic Survey of India,” OECD, Paris. 3 Franklin Allen et al., 2006, “Financing Firms in India,” paper presented at European Finance Association meetings, Zurich, Switzerland.

2
phenomenal in infrastructure sectors opened to competition (e.g., telecommunications and civil aviation). At the state level, economic performance is much better in states that have a more liberal regulatory environment than in those with more restrictive regulatory environments. In the financial sector, external debt indicators have vastly improved, the exchange rate is flexible, and the financial system is free of highly distorting state controls. The country’s trade account is open and India has become much more integrated with the world economy.4 The economy has also become more resilient to shocks, both domestic and external. The Indian financial sector has been stable for the last several years, even when other markets in the Asian region faced a crisis. This stability was ensured through a resilience that has been built into the system over time. Inflation has been contained, although it has again become a concern because of the country’s dynamic growth and rising energy costs. International businesses were allowed to invest in India as of 1991. Prior to that year, following the country’s independence in 1947, the government required all companies operating in the country to be majority owned by Indians. This determined quest for self-sufficiency resulted in many multinationals leaving the country. In the last decade, they have returned en masse. With over 1 billion people, India is home to 17 percent of the global population, and is set to overtake China as the world’s most populous nation in three decades. India is the 12th-largest economy by GDP in the world; in Asia, its economy is third, behind only China and Japan. Consequently, India offers compelling opportunities to the globalizing world with regard to both the market it offers and the cost-benefits of a cheap labor pool—often with access to good education and English-language capabilities. The trend in English-language jobs off-shored to India is substantial and appears set to continue.
4 In the case of food grains, sugar, and fuel, however, domestic prices do not reflect international price movements. Commodity trade policy in India has traditionally ensured that the interests of consumers—not farmers—are protected.

3
Table 1. Indian Macroeconomic Indicators, 2003–2007 2003 2004 2005 2006 2007
GDP ($ billions) 601.8 695.9 808.8 899.6 1,070.6 GDP growth (in market prices) 8.4% 8.3% 9.2% 9.2% 8.4% GDP per capita ($ current) 562.1 640.1 733.0 804.9 946.1 Inflation* 5.4% 6.4% 4.0% 5.7% 4.5% Exchange rate (INR:USD) 46.0 44.9 44.1 45.3 44.3 Foreign direct investment, net inflows (balance of payments, in $ billions) 4.6 5.5 6.6 8.4 na Unemployment rate 8.8% 9.5% 9.2% 8.9% 7.8% Sectoral share of GDP %) Agriculture 21.5% 21.7% 20.2% 19.7% 18.5% Industry 19.9% 19.4% 19.6% 19.4% 19.7% Services 8.8% 9.5% 9.2% 8.9% 7.8%
Sources: CIA, 2008, World Factbook (online version), CIA, Langley, VA, https://www.cia.gov/library/ publications/the-world-factbook/geos/in.html (accessed August 2009); Embassy of India (Washington, DC), n.d., “Economic Indicators,” http://www.indianembassy.org/newsite//Doing_business_In_ India/Economic_Indicators.asp (accessed August 2009); Reserve Bank of India (RBI), 2007, “Annual Report 2007,” RBI, Mumbai, India, and n.d., “Country Macroeconomic Data,” RBI, Mumbai, India, http://rbidocs.rbi.org.in/rdocs/PublicationReport/Pdfs/72262.pdf (accessed August 2009).
Reform Requirements Reform of the financial system continues as part of overall structural
reforms, which aim to improve the productivity and efficiency of the economy. The next round of reforms needs to focus on a number of key areas if the government is to achieve its growth target of 10 percent in 2011. In labor markets, employment growth has been concentrated in firms that operate in sectors to which India’s highly restrictive labor laws do not apply. Where these labor laws do apply, employment has been falling and firms are becoming more capital intensive, despite abundant low-cost labor.
Labor market reform is essential to achieve broader-based development and provide sufficient higher-productivity jobs for the growing labor force. In product markets, inefficient government procedures, particularly in certain states, act as a barrier to entrepreneurship and need to be improved. Public companies are, moreover, generally less productive than private firms and the government’s privatization program needs to be revitalized. A number of barriers to competition exist in financial markets and certain infrastructure sectors, all of which are additional constraints on growth that need to be addressed. Regarding taxes, the indirect tax system needs to be simplified to create a true national market; the taxable base for direct taxes should be broadened and the rates lowered. The effectiveness of social policies designed to reach the poor is questionable. The importance of human capital has so far also not been integrated into an efficient education policy. Current education policy mainly serves certain “unproductive” service sectors, the government, and academia. The vocational training

4
system is also not tailored to the needs of the economy—only 7 percent of Indian firms offer on-the-job training.5 Notably, economic growth in India has not been equitable and income growth has not reached a large segment of population, although it has added to the wealth of the upper and middle classes. “Reforms with a human face” has been a standard phrase over the last few years in the policy establishment. One view holds that reform of labor laws and the agriculture sector might improve the lot of vulnerable people. The introduction of the “National Rural Employment Guarantee Scheme,” as well as other insurance and pension schemes, are attempts to address the concern of “narrow and high growth.” States that have comparatively restrictive regulatory frameworks need to improve these frameworks to achieve more inclusive growth and narrow income gaps across states. The impressive response of the Indian economy to past reforms should give policy makers confidence that further liberalization will deliver additional growth dividends and foster the process of pulling millions of people out of poverty. However, the reform process at the state level is heterogeneous and still at an early stage, thus no clear picture can be given.
Government Priorities India’s eleventh five-year plan covers the period 2007–2012. Its essence
is to change the role and improve the effectiveness of government, better support the private sector, and ensure widespread improvements in well-being. Major reform goals are to:
• reduce the primary deficit and financial sector risk
• improve fiscal management and the composition of public expenditures
• increase the quality of the civil service
• concentrate on health, education, and social safety net programs, as well as strengthen private health care and public spending on water and sanitation
• improve the investment climate by speeding up trade reforms, reducing product market distortions, phasing out remaining foreign direct investment restrictions, and eliminating restrictive or preferential policies for small-scale firms and agro-based products.
National Credit Ratings Moody’s gave India a country credit rating of BAA3 in November 2007;
Standard and Poor’s gave it BBB-/Stable/A-3 rating in January 2007.
5 OCED, 2007, “Policy Brief.”

5
Demand for Financial Services Structure of the MSME Sector The government defines micro, small, and medium enterprises (MSMEs)
by investment cost (i.e., plant, machinery, equipment, land, and buildings), as shown in table 2.
Table 2. Enterprise Classification by Investment
Micro- enterprise
Small enterprise
Medium enterprise
Manufacturing sector, upper limit
$62,500
$62,500 to $1.25 million
$1.25 million to $2.5 million
Service sector, upper limit
$25,000
$25,000 to $0.5 million
$0.5 million to $1.25 million
Source: Adya Prasad Pandey, 2007, “Indian SMEs and their Uniqueness in the Country,” unpublished, MPRA (Munich Personal RePEC Archives), Munich University Library, http://mpra.ub.uni-muenchen.de/6086/1/MPRA_paper_6086.pdf (accessed July 2009).
Based on data collected by various censuses and surveys of small-scale industries, it is estimated that in 2007, micro and small enterprises (MSEs):
• consisted of approximately 2 million registered and 10.8 million unregistered enterprises in manufacturing;
• employed about 31.2 million people;
• produced about INR 4,716 billion ($108 million) worth of goods and services at current prices;
• contributed about 39 percent of national manufacturing output; and
• contributed 45 percent of exports.6 In addition, some 20 million urban informal enterprises employ approximately 40 million workers. Sector-wise, about 45 percent of these enterprises are concentrated in wholesale and retail trade activities, with another 24 percent in manufacturing; 10 percent in transport, storage, and communications; and the remaining 21 percent in all other kinds of services.7 The MSE sector is growing much faster and more consistently than the country’s industrial sector overall. While the growth rate of the industrial sector as a whole in 2000–2006 oscillated from 2.7 to 8.4 percent a year, the growth rate for MSEs in manufacturing steadily rose by about 12 percent over the last two years.8 In recent years, the government has paid more attention to micro, small, and medium enterprises (MSMEs) due to their contribution to economic
6 Government of India, Ministry of Finance, 2008, “Economic Survey,” Ministry of Finance, New Delhi, India. 7 RBI, 2007, “Annual Report 2007.” 8 Ibid.

6
growth and potential to lift poor people out of poverty. A Ministry for Micro, Small, and Medium Enterprises was established in 1999 and has since implemented several promotional programs for MSMEs, including a credit guarantee scheme and an MSE cluster program.
Obstacles to MSE Growth A significant number of products in India are exclusively reserved for
what is known in the country as small-scale industry (SSI). The list of these products includes 114 items as diverse as paper bags, fans, electric irons, and a vast amount of chemical and plastic products.9 Yet the definition of SSIs, based on investment size (see table 2) works against small businesses. The most obvious obstacle to MSE growth in India is that enterprises producing these items are not allowed to grow above their founding capital investment ceiling.10 In the wake of economic liberalization, the government began to loosen the practice of reserving certain products for production by SSI. The impact of this loosening on most SSI sectors was negative. Due to the competition triggered with larger enterprises, the SSI share of GDP dropped to 8 percent in 2001, compared to 11 percent ten years earlier. Many small enterprises went bankrupt, constrained, among other things, by lack of access to credit and lack of infrastructure (e.g., electricity), communications, and technology. Nonetheless, the SSIs that survived expanded their share of the workforce owing to strong growth of the traditionally labor-intensive service industry. SSIs currently account for 66 percent of total employment (i.e., in both formal and informal sectors), compared to 48 percent in 1990–1991. SSIs also maintained their share of total exports at 30 percent.11 The informal sector has been particularly disadvantaged by deregulation and financial liberalization: it has been experiencing a recession since the first half of the 1990s. The value added of this sector shrank at an annual compound rate of 1 percent. Some 10 percent of these businesses closed, and employment in the sector fell by more than 1 percent a year. Investments in the sector, which represented at 50 percent of total investments in the early 1990s, dropped to 20 percent by 2008.12
MSE Access to Finance Urban microenterprises face special, albeit lessening, problems in
accessing finance. A large number of these enterprises work on daily and weekly business cycles. Unlike in many other countries, microfinance credit technology in India is often adjusted to longer business cycles, such as those found in rural areas, which makes it difficult to lend to
9 For the full list, see the Web site of the Ministry of Micro, Small, and Medium Enterprises, New Dellhi, http://www.smallindustryindia.com/publications/reserveditems/resvex.htm (accessed July 2009). 10 Allen et al., 2006, “Financing Firms in India.” 11 Diana Hochraich, 2006, “Indian Reforms in the Financial and Manufacturing Sectors: Winners And Losers,” paper presented at the international conference, “The Indian Economy in the Era of Globalization,” September 28–29, 2006, Paris, France, http://economix.u-paris10.fr/pdf/colloques/2006_India/Hochraich2.pdf (accessed August 2009). 12 Allen et al., 2006 “Financing Firms in India.”

7
urban clients.13 While creditor protection is very good de jure, government corruption and overburdened courts leads to a weak de facto ability to enforce creditors’ rights. In general, firms obtain loans based on personal relationships, not sound credit appraisals.14 The banking sector has several problems with financing small firms, particularly informal enterprises, of which about 75 percent are unregistered15 and only 9 percent maintain accounts. These enterprises are perceived as more vulnerable to external shocks and are not considered sufficiently bankable. Insufficient business skills, the absence of credit histories or transparent credit information, and the poor legal framework for enforcement of creditors’ rights raise the transaction costs and risk of lending to MSEs to a prohibitive level. Banks also lack experience with MSE-specific lending and monitoring methodologies.16
Demand Coverage The MSME sector is defined as one of the priority sectors to which
commercial banks are obliged to commit a minimum share of their annual loan commitments (see “Priority Sector Lending” in the section entitled “Legal, Regulatory, and Policy Framework”). Public apex financing institutions, in particular the National Bank for Agricultural and Rural Development (NABARD) and the Small Industries Development Bank of India (SIDBI), are active in refinancing and on-lending to financial institutions and microfinance institutions (MFIs) that are registered as nonblank finance companies (NBFCs). Commercial banks also play a vital role in providing MSEs working capital and term loans. Loans outstanding to MSEs were estimated at $32 billion as of March 2007, while loans to medium-sized enterprises were estimated at $21 billion. Advanced MSMEs are increasingly accessing alternative sources of finance, particularly venture capital and private equity financing. As of 2007, it was estimated that the MSME sector was receiving noncredit financing of about $3 billion.17
Potential Demand Assuming the entire number of poor households in India as potential
microfinance clients, the market size for microfinance in India appears to be in the range of 58 to 73 million clients. This number of potential customers translates into an annual credit demand of approximately $5.7 billion to $19.1 billion (INR 230–773 billion). Considering economically active low-income occupations, such as small and marginal farmers, landless agricultural laborers, and microentrepreneurs, together with microfinance clients, the potential market could reach an estimated 245.7 million customers and $51.4 billion (INR 2.1 trillion) in annual loan demand.18
13 Microfinance Insights [Intellecap, Mumbai, India] 4 (September/October 2007). 14 Allen et al., 2006, “Financing Firms in India.” 15 The remaining informal enterprises have proforma registrations with responsible authorities, but are not operating within any legal framework, that is, they don’t keep books or make contracts with employees or suppliers. 16 ICICI Bank, 2005, “Industry Review—The Financial Service Sector,” ICICI Bank, Hyderabad, India. 17 Ministry of Micro, Small, and Medium Enterprises, 2007, “Micro, Small, and Medium Enterprises: An Overview,” Ministry of MSME, Delhi, India. 18 Intellecap, 2007, “Inverting the Pyramid: The Changing Face of Microfinance in India,” Intellecap, Mumbai, India. Available on the Web site of MicroSave India, http://india.microsave.org/node/1393 (accessed July 2009).

8
Low-income segments of the population save for emergencies, social events, investments, and future consumption needs. One of the primary needs of this population is access to safe, convenient mechanisms for savings. Savings are therefore an integral part of the microfinance services sought by poor people in India. According to a 2002 study, the mean savings of individual members in the Self-help Group (SHG)-Bank Linkage Program was $48 (INR 2,103).19 Extrapolating this figure and applying it to the total number of households below the poverty line (approximately 58 million), the potential annual savings base of microfinance clients would be around $2.8 billion. Tapping the demand for savings is problematic, however, due to existing regulatory restrictions that constrain “for-profit” MFIs from offering savings services.20 Although the demand for microinsurance is not well documented, it is understood that the incomes of microcredit customers are both low and insecure. These customers need insurance services for assets, including crops, livestock, and shelter. Access to insurance would, moreover, reduce their need to access expensive credit from informal sources in the event of contingencies such as illness and death. Calculating an annual average microinsurance premium of $8.20 (INR 360) for the potential range of microfinance clients (57.9 million to 245.7 million), total annual demand for microinsurance in India could be anywhere between $460 million and $2 billion (between INR 20.2 billion and INR 88.3 billion).21 The National Health Insurance Scheme, funded by the Government of India and state governments, seeks to provide health coverage to vulnerable families. The approximately $750 per annum coverage is offered for a nominal premium of $0.70. Initiated in two states, it is planned to be rolled out across the country. The Life Insurance Corporation, a public sector insurer, has been asked to provide life insurance to members of all self-help groups (SHGs) in the country. While national crop insurance provides coverage in all states of India, it is limited to a few crops and unpopular among farmers. The impact of these state-funded schemes on the microinsurance market has yet to be assessed. Given cultural changes, such as the breakdown of the extended family system, micropensions are assuming increased relevance for Indian microfinance. According to the 2001 census, India's elderly population stood at 76.6 million, a number projected to rise to 97.3 million by 2010. Many elderly individuals rely on working family members in the absence of social security. Several states have pension schemes for old, destitute, infirm, and disabled persons, with monthly payments ranging from $5 to $10. Specific schemes for informal sector workers, weavers, and women also exist. However, the adequacy and efficacy of these schemes need to
19 V. Puhazhendi and K.C. Badatya, 2002, “SHG-Bank Linkage Programme for the Rural Poor: An Impact Assessment,” paper presented at an SHG-Bank Linkage Programme seminar, New Delhi. 20 Intellecap, 2007, “Inverting the Pyramid.” 21 Ibid.

9
be studied. Clearly, there is a need for a sustainable micropension scheme for the current informal sector workforce. Based on conservative assumptions, the annual market for micropensions is close to $520 million (INR 21 billion).22 Remittances are also emerging as a financial service relevant to low- income segments of the population. According to the World Bank, total worker remittances to India in 2006 amounted to $22.7 million (INR 1.0 billion).23 These remittances represented 10 percent of total global remittances and almost 3 percent of India's GDP that year, making it the world's largest recipient country. Assuming that 30 percent of total remittance senders are low-income clients, the potential annual market for small remittances would amount to $7.8 billion (INR 344.3 billion). In addition, migration across and within individual Indian states is on the rise. According to the 2001 census, there were 39.9 million total migrant workers in India, of which 11.3 million (28.5 percent of the total) were marginal workers. These workers represent an additional market segment that requires remittance services. The average amount transferred by a domestic worker is about $77 (INR 3,400). Based on these figures, a broad market estimate for the domestic annual remittance market can be pegged at $870 million (INR 38.4 billion).24
Financial Sector Overview Financial sector reforms launched a decade ago in India have
transformed the operating environment of the sector from an administered regime to a competitive, market-based system. Since that time, the financial sector has kept pace with the growing needs of corporate and other borrowers. Even though India has one of the largest bank branch networks in the world, millions of poor people in the country are largely shut out of the system. Banks were nationalized three decades ago with the hope that their services would reach the poor. But that goal is not even close to being met today. For example, only 17 percent of rural Indian households are estimated to have access to banking services. With its strong branch network of commercial, regional rural, and cooperative banks, the country is teeming with institutions that should be able to meet the credit needs of the general public. Nevertheless, due to prevailing regulatory and operational obstacles, the lower-income segment of the population is largely unserved.
22 This estimate makes the assumption that only one working member of 30 percent of all poor households would sign up for a micropension scheme, with an average annual contribution of $30 (INR 1,200). 23 World Bank, 2008, Migration and Remittances Factbook 2008 (Washington, DC: World Bank). 24 Ibid.

10
Table 3. Financial Depth and Outreach of Indian Financial Sector, 2005–2007
Item 2005 2006 2007 Total loans ($ billion) 307.2 385.2 448.0 Annual loan growth (%) 27.2 25.4 16.3 Loans as % of GDP 36.5 40.2 43.2 Total deposits ($ billion) 456.0 532.1 736.7. Annual deposit growth (%) 26.5 16.7 38.4 Deposits as % of GDP 51.8 53.2 68.8 Loan as % of deposits 67.4 72.4 72.1 # loans per 1,000 people 69.6 76.95 na Number of financial institutions per 100,000 people na 9.2 na Number of bank branches per 100,000 people na 15 na
Sources: IMF, 2008, “India Country Report,” IMF, Washington, DC; RBI, 2007, “Annual Report 2007.” Note: na – not available.
The Indian loan-to-GDP ratio exceeds average levels for emerging market countries, but is partly inflated by bad loans (amounting to $12 billion in March 2007, or 2.7 percent of total loans). This volume of bad loans had, however, fallen from $17 billion, or 17 percent of total outstanding loans, in 2002.25 India’s deposit-to-GDP ratio has also experienced dynamic growth, yet remains low when compared to China (190 percent) and Japan (142 percent). Indian households seemingly prioritize investments in physical goods such as land, houses, cattle, and especially, gold, over bank deposits. This phenomenon holds particularly true in rural areas. Indians are the world's largest consumers of gold. The value of total gold assets held in the country is estimated at $200 billion—equal to nearly half of the country's bank deposits. In 2006, Indian households purchased $10 billion worth of gold, nearly twice the amount of foreign direct investment in the country that year.26 The main challenge of the financial sector is to capture and pool more savings to finance productive investments. The penetration of savings services is low: just 40 percent of households are depositors. The deposits of most households, moreover, are too small for commercial banks to collect. Other deposit-taking institutions, especially licensed nongovernmental organizations (NGOs) and nonbank finance companies (NBFCs), enjoy greater outreach than banks, but operate under stringent regulatory restrictions that limit savings mobilization. The Indian Post, which has more than 155,000 branches, offers savings services. Conversion of the Post Office’s financial services into a Post Bank would add significant capacity to the savings network in India,
25 RBI, 2007, “Annual Report 2007.” 26 Information provided by the Financial Sector of the Ministry of External Affairs, 2002.
11
especially in rural areas. Reforming the market for microfinance savings would also significantly increase the national deposit-to-GDP ratio.
Banking Sector Overview The banking sector is witnessing the emergence of financial supermarkets
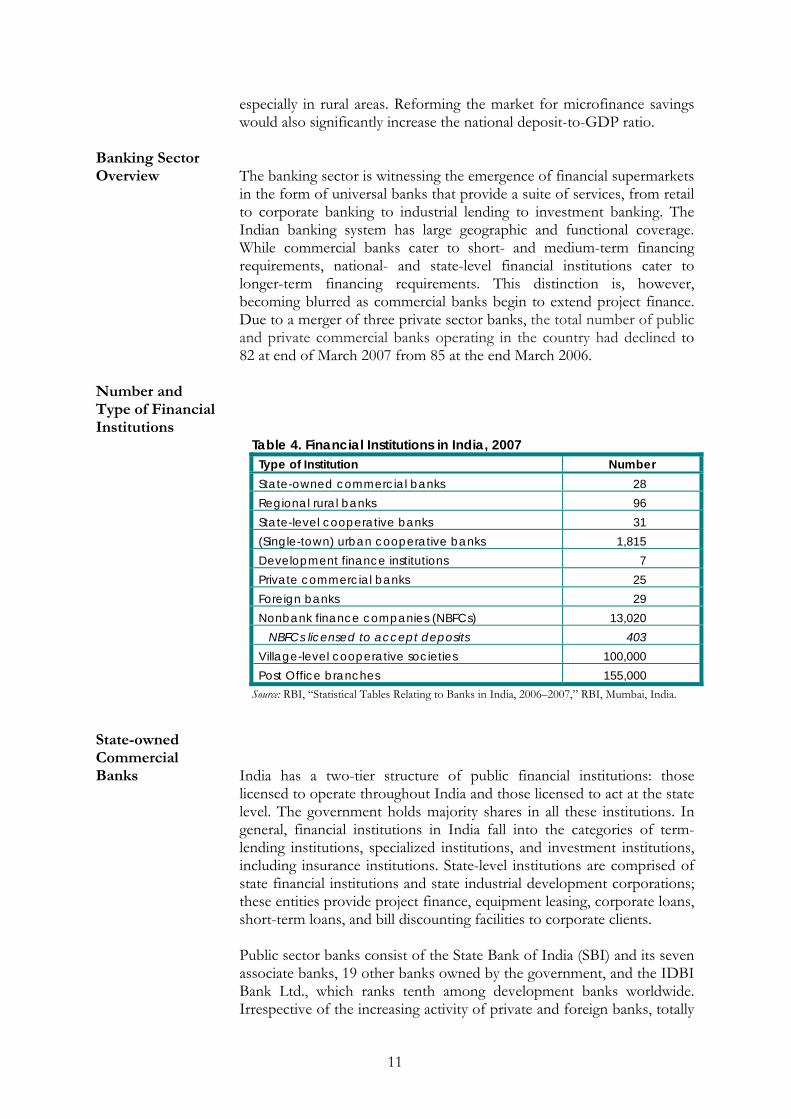
in the form of universal banks that provide a suite of services, from retail to corporate banking to industrial lending to investment banking. The Indian banking system has large geographic and functional coverage. While commercial banks cater to short- and medium-term financing requirements, national- and state-level financial institutions cater to longer-term financing requirements. This distinction is, however, becoming blurred as commercial banks begin to extend project finance. Due to a merger of three private sector banks, the total number of public and private commercial banks operating in the country had declined to 82 at end of March 2007 from 85 at the end March 2006.
Number and Type of Financial Institutions
Table 4. Financial Institutions in India, 2007 Type of Institution Number State-owned commercial banks 28 Regional rural banks 96 State-level cooperative banks 31 (Single-town) urban cooperative banks 1,815 Development finance institutions 7 Private commercial banks 25 Foreign banks 29 Nonbank finance companies (NBFCs) 13,020 NBFCs licensed to accept deposits 403 Village-level cooperative societies 100,000 Post Office branches 155,000
Source: RBI, “Statistical Tables Relating to Banks in India, 2006–2007,” RBI, Mumbai, India.
State-owned Commercial Banks India has a two-tier structure of public financial institutions: those
licensed to operate throughout India and those licensed to act at the state level. The government holds majority shares in all these institutions. In general, financial institutions in India fall into the categories of term-lending institutions, specialized institutions, and investment institutions, including insurance institutions. State-level institutions are comprised of state financial institutions and state industrial development corporations; these entities provide project finance, equipment leasing, corporate loans, short-term loans, and bill discounting facilities to corporate clients. Public sector banks consist of the State Bank of India (SBI) and its seven associate banks, 19 other banks owned by the government, and the IDBI Bank Ltd., which ranks tenth among development banks worldwide. Irrespective of the increasing activity of private and foreign banks, totally

12
or partly state-owned commercial banks still comprise the biggest share of the banking system in terms of total assets, loans, and deposits. Together, these two types of banks account for almost three quarters of the banking sector. The Government of India also has majority shares in public sector banks. Private shareholdings in public sector banks are limited to 49 percent, and nonresident private shareholding is further restricted to 20 percent. The process of diversification of the ownership of these banks continued during 2006–2007. Yet the number of public sector banks with private shareholding of up to 10 percent declined from four at the end of March 2006 to three at end of March 2007. Those with private shareholding of between 10 and 20 percent increased from zero to one. As of 2008, an amendment to the banking law was before the parliament that would facilitate further divestment of government equity in these banks to 33 percent.
Cooperative Banks Cooperative banks in India are registered under the Co-operative
Societies Act and are governed by the Banking Regulations Act of 1949 and the Banking Laws (Co-operative Societies) Act of 1965. They are regulated by the RBI. The history of Cooperative Banks in India started almost 100 years ago. Credit cooperatives are the oldest and most numerous of all cooperative types in India. They can be broadly classified into urban and rural credit cooperatives. The latter are further divided into long- and short-term categories. At the grassroots level, there are around 100,000 primary agricultural credit societies (PACS) that offer predominantly short-term credit. At the urban level, about 2,090 credit cooperatives (popularly known as urban cooperative banks), have about 10 percent of India’s aggregate banking business. The past 10 years, however, have witnessed a sharp decline in credit cooperatives’ share of total agricultural credit, as well as a downturn in their overall financial health. By 2007, the estimated accumulated losses of the short-term cooperatives was INR 100 billion, and of the long-term cooperatives, INR 40 billion. Revival packages have been introduced to restructure cooperatives, transforming them into decentralized autonomous institutions and giving them wider access to financial resources. The National Bank for Agricultural and Rural Development (NABARD) has been designated as the implementing agency for the revival packages in all states. NABARD is being assisted in this task by the Asian Development Bank (ADB), World Bank, and KfW.
Regional Rural Banks Regional rural banks (RRBs) were conceived as institutions that would
combine the local feel and familiarity of cooperatives with the business organizational ability of commercial banks to achieve rural financial inclusion. Together with commercial and cooperative banks, RRBs play a critical role in the multi-institutional approach to the delivery of agricultural and rural credit. Accordingly, RRBs were an important plank of the policies announced by the Indian government in June 2004, which aimed to double the flow of bank credit to the agricultural sector within

13
three years. To improve their scale of operation and profitability, as well as reduce costs, the number of RRBs was accordingly decreased through mergers over the last three years from 196 to 96 institutions. RRBs are co-owned by the Government of India, state governments, and public sector banks. The State Bank of India is the paramount stakeholder in rural banks and has an ownership share in 30 RRBs.
Apex Banks Other financial institutions contribute to the development of rural credit at the apex level, the most important of which are: National Bank for Agriculture and Rural Development (NABARD) NABARD has been responsible for mainstreaming the self-help group (SHG)-bank linkage model27 across the country and getting the banking system involved in microfinance. It supports the banking system through rural credit planning, project lending, and area-based development projects. In addition, it offers a refinancing line to banks for the on-lending of agricultural loans. NABARD also oversees promotional initiatives, which include grants to NGOs and other organizations to form and link SHGs groups to banks; training and capacity building of all stakeholders in the rural financial sector (including bank staff); research; piloting new practices; innovations; and institution building. NABARD has created a “Microfinance Development and Equity Fund” of roughly $50 million, which supports its promotional activities as well as provides equity and quasi-equity funds for MFIs. Equity support for MFIs is a recent initiative, which so far has been positively received by them. In addition to its financing function, NABARD also supervises the RRBs as well as the development and cooperative banks. Following enactment of the currently pending microfinance bill, NABARD will also assume supervisory responsibility for microfinance MFIs that have the legal form of trusts, societies, and NGOs. Small Industries Development Bank of India (SIDBI) SIDBI has been providing refinancing, financing, and promotional support for the development of SMEs in the country. It has traditionally supported MFIs and was responsible for the development of some of the country’s largest MFIs. SIDBI also provides bulk funds to MFIs for lending operations and has invested in their capacity building. In addition, SIDBI provides equity to MFIs and offers a transformation loan to organizations that seek to change from a charitable to a commercial organizational form. Its promotional work has included training, capacity building, institution building, sector-wide studies, and institutional upgrading of MFI networks.
27 A model in which self-help groups of local residents use their savings to access additional credit from a regulated bank. The most common model for such a linkage is when an NGO forms a self-help group and links the group directly to a bank.

14
The microfinance portfolio of SIDBI is handled through the “SIDBI Foundation for Micro Credit” (SFMC), a strategic business unit of the bank. Plans for spinning off SFMC as a separate microfinance apex financing facility have been drawn up with the goal of enabling it to focus exclusively on sector needs. However, these plans had been in existence already for more than four years in 2008, making it doubtful that the plan will be executed. Friends of Women’s World Banking (FWWB) FWWB was established in 1982 as a nonprofit organization to promote direct participation of poor women in the economy through access to financial services. Its objective is to extend and expand informal credit networks within India and link them to a global movement. FWWB currently works in 16 states of India, with 113 partner organizations (including large and small MFIs) and has a total client outreach of 5 million. With deployed funds of approximately $52 million, FWWB is a medium-sized player in the microfinance sector. Its particular niche lies in identifying and supporting grassroots microfinance organizations that support the empowerment of women and have the potential to develop into financially sustainable community development organizations. FWWB selects partner organizations through a screening process that focuses particularly on institutional parameters (e.g., management and business systems) and less on credit history. FWWB accesses funds from several sources, including the Indian development banks NABARD and SIDBI. Apart from loans, the organization also provides capacity-building support and grants to small grassroots MFIs.28 FWWB has a special interest in developing microfinance in the less-developed regions of the country.
Private Commercial Banks Private commercial banks have been operating in India since the
beginning of the banking system in the country. Yet their combined market share is small compared to developed countries. Private banks are divided into two categories: old private banks (of which there are 17) and new-generation private banks (of which there are 8). The first private bank in India to receive a license from the Reserve Bank of India was Housing Development Finance Corporation (HFDC) Ltd. The license, or approval, was part of the RBI's liberalization of the banking industry. HDFC Bank Limited was incorporated in August 1994 with a registered office in Mumbai and commenced operations as a scheduled commercial bank in January 1995. In 2008, it ranked second to ICICI, also a new-generation private sector bank, which has conducted a reverse merger with its subsidiary, ICICI Bank,29 to become India’s largest private commercial bank. ICICI and HDFC are India’s largest
28 FWWB, India, 2008, “Annual Report 2007–2008,” FWWB (India), Ahmedebad, India. 29 ICICI first promoted ICICI Bank as a subsidiary. When ICICI Bank stabilized, ICICI, the parent, amalgamated itself with ICICI Bank, the subsidiary.

15
lenders to MFIs and are also engaged in the securitization of MFI loan portfolios. As part of their increased exposure to the Indian capital market, foreign financial institutions (FFIs) have consolidated holdings in Indian banks. As of the end of first quarter 2007, FFIs had a majority shareholding in six new private sector banks (compared to one in 2006) and two old private sector banks (compared to zero in 2006). Share ownership by FFIs in other banks also increased in 2007, rising to between 10 and 20 percent of 13 public sector banks (compared to 10 in 2006) and up to 10 percent in five public sector banks (compared to two in 2006).30
Foreign Banks Foreign banks, which are defined as banks having their juridical origins outside of India, have been a key driver of a more innovative, retail-oriented banking sector in India. The RBI stipulates that foreign banks may not acquire Indian banks, except for weak banks identified by the RBI and on terms specified by it.
New rules on foreign banks announced by the RBI have fostered hopes of their unfettered growth. These banks are permitted to set up local subsidiaries, but are not able to open branches freely. As a result of the RBI’s recent interest in having foreign banks become active in India, the following international banks are expected to set up business in the country by 2009: the Royal Bank of Scotland, Switzerland's UBS, the U.S.-based GE Capital, Credit Suisse Group, and the Industrial and Commercial Bank of China. Aside from the banking sector, Merrill Lynch is engaged in an investment banking joint venture in the country—DSP Merrill Lynch. Goldman Sachs holds stakes in Kotak Mahindra Arms and GE Capital already has a wide presence in consumer finance through GE Capital India. Although the market share of foreign banks remains comparatively moderate, the impact of FFIs on the Indian banking sector extends to their majority ownership of domestic private banks. As of the end of first quarter 2007, the combined market share of foreign banks and those domestic private banks that were majority owned by FFIs was significant: 17.5 percent of all banking system deposits, 18.7 percent of outstanding loans, and 76.6 percent of off-balance sheet lending (reflecting the particular strength of foreign banks in trade financing). Another dimension of the comparative advantage of foreign banks was their 41 percent share of the foreign exchange market in 2005–2006, a share that had risen to 52 percent by mid-year 2007.31
Microfinance In India, the preferred microfinance methodology is group lending. That said, two principle lending methodologies are used in India: (i) the SHG-bank linkage model, in which SHGs collaborate mostly with public sector banks,32 and (ii) the Grameen and SHG models, in which funding is
30 RBI, 2007, “Report on Trend and Progress in Banking in India, 2006–2007,” RBI, Mumbai, India. 31 RBI, 2007, “Annual Report 2007.” 32 As of March 2007, public sector banks provided 84 percent of the outstanding loans to SHGs, followed by cooperative banks (9 percent) and private sector banks (7 percent). Information from a personal meeting with Sa-Dhan, 2007.

16
predominantly provided by private sector banks.33 Both models conform with the priority sector lending rules that the RBI has stipulated for Indian banks. According to a study by Sa-Dhan (the industry association of community development financial institutions in India), only 7 percent of microfinance loans in India are made to individuals. The provision of individual loans to first-time borrowers is uncommon; many large MFIs only provide individual loans to clients who have a track record and have improved their economic status.
SHG-Bank Linkage Model SHGs are typically self-formed groups of 10 to 20 members who collect six months of savings and disburse loans from that pool of funds to their members. Eventually the groups are linked to a bank, which lends them funds that are used for on-lending to group members. During this time, an intermediary NGO assists the group to set up its administrative processes and carry out weekly meetings for loan disbursement and collection. The linkage model has been established and promoted by NABARD nationwide. MFIs The number of Indian MFIs is assumed to be in the range of 800. However, due to the diversity of registration authorities in the country, there is no reliable estimate of the total number. In line with international trends, the lion's share of growth is generated by the leading institutions. A Mix Market survey of 2006 found that seven large MFIs (out of a sample of 28) dominated the market. These MFIs held 81 percent of the total microfinance sector loan portfolio and served 67 percent of its borrowers. The three largest institutions, which alone served 54 percent of microfinance borrowers, were NBFCs based in south India.34 Most top MFIs apply the Grameen model, allowing them to expand more quickly than those using the SHG linkage model. The latter model tends to develop the client acquisition phase slowly because of its bottom-up-character. On the other hand, 3 of the 10 largest MFIs in terms of clients, as well as 6 MFIs just below the top 10, use the SHG model. The top list is also clearly dominated by NBFCs, which owing to their legal form and commercial business conduct, enjoy the easiest access to India’s formal financial sector. According to the industry association Sa-Dhan, about 50 percent of MFIs and 50 percent of outstanding loans in the microfinance sector pertained to SHG lending in 2008.35 Most MFI operate on the basis of Grameen methodology, in which 4 to 6 members form a group to access a loan. MFIs lend to individuals within the group, subject to the joint guarantee of all group members. The Grameen approach originated in Bangladesh and was configured into a highly standardized loan product
33 Ibid. As of March 2007, private sector banks had provided 62 percent of outstanding loans to MFIs, followed by public sector banks (28 percent) and foreign banks (10 percent). 34 Mix Market, 2006, Performance and Transparency: A Survey of Micro Finance in South Asia, Mix Market, Washington, DC, as cited in CMF/IMFR (Centre for Micro Finance at the Institute for Financial Management and Research), 2006, “Micro Finance in India: Current Trends and Challenges,” Working Paper, IFMR, Chennai, India. 35 Sa-Dhan, 2008, “Quick Review 2007/08” (April 2008 Draft), Sa-Dahn, New Delhi, India.

17
that permits MFIs to cost-efficiently serve poor people with small loan needs. MFIs in India target poor entrepreneurial clients who invest ever-bigger loans in their small-scale businesses, such as petty trade, poultry raising, and milking cows. Indian MFIs can have different legal forms:
• credit cooperatives (see above)
• societies: membership organizations registered mostly for charitable purposes that—unlike trusts—may be dissolved. Societies are governed by the Societies Registration Act of 1860.
• public charitable trusts: a form of not-for-profit entity in India that is typically established for public objectives. The India Trust Act of 1882 defines only broad principles for trusts operating on a national scale, whereas many states have their own, more detailed Public Trust Acts.
• S25 companies: limited liability companies formed for “promoting commerce, art, science, religion, charity, or any other useful object.” These entities may not distribute profits or other income.
• nonbank finance companies (NBFCs): these entities may engage in all financial services that do not require a bank license, such as lending, hire-purchase (installment purchase plans), leasing, and securities dealing. NBFCs are prohibited from providing microinsurance or transferring funds. Deposit mobilization is permitted only subject to an approved rating and only for term deposits of one to five years. Most deposits are allowed only in the province where an NBFC is registered.36
Leasing Specialized Financial Institutions
There are about 400 NBFCs that focus on leasing (and are hence categorized as leasing companies) at the national and state level in India. Apart from apex financial institutions, such as the Industrial Development Bank of India, the Industrial Finance Corporation of India, and the ICICI, several financing agencies are devoted to specific causes, such as the sick industries,37 tourism, agriculture, small industries, housing, shipping, railways, roads, and power.38 Most states also have multiple financing agencies for generic or specific purposes, most of which use leasing along with traditional financing instruments. Significantly, the ICICI was one of the pioneers in Indian leasing.
36 Sa-Dahn and M-CRIL (Micro-Credit Ratings International Limited), 2006, “Existing Legal and Regulatory Framework for the Microfinance Institutions in India: Challenges and Implications,” 2006 edition, Sa-Dahn, New Delhi, India. http://www.sa-dhan.net/Adls/Microfinance/Article/Publications/ExistingLegalRegulatory Framework.pdf (accessed August 2009). 37 “Industrial units proven to be unable to financially sustain themselves are generally called ‘sick units’ in India” (India One Stop Web site, n.d., “Sick Industrial Units in India,” http://www.indiaonestop.com/sickunits.htm [accessed August 2009]). 38 Vinod Kothari, n.d., “Indian Leasing: Major Components,” online article available at http://www.geocities.com/ WallStreet/Exchange/8413/indo2.html (accessed August 2009).
18
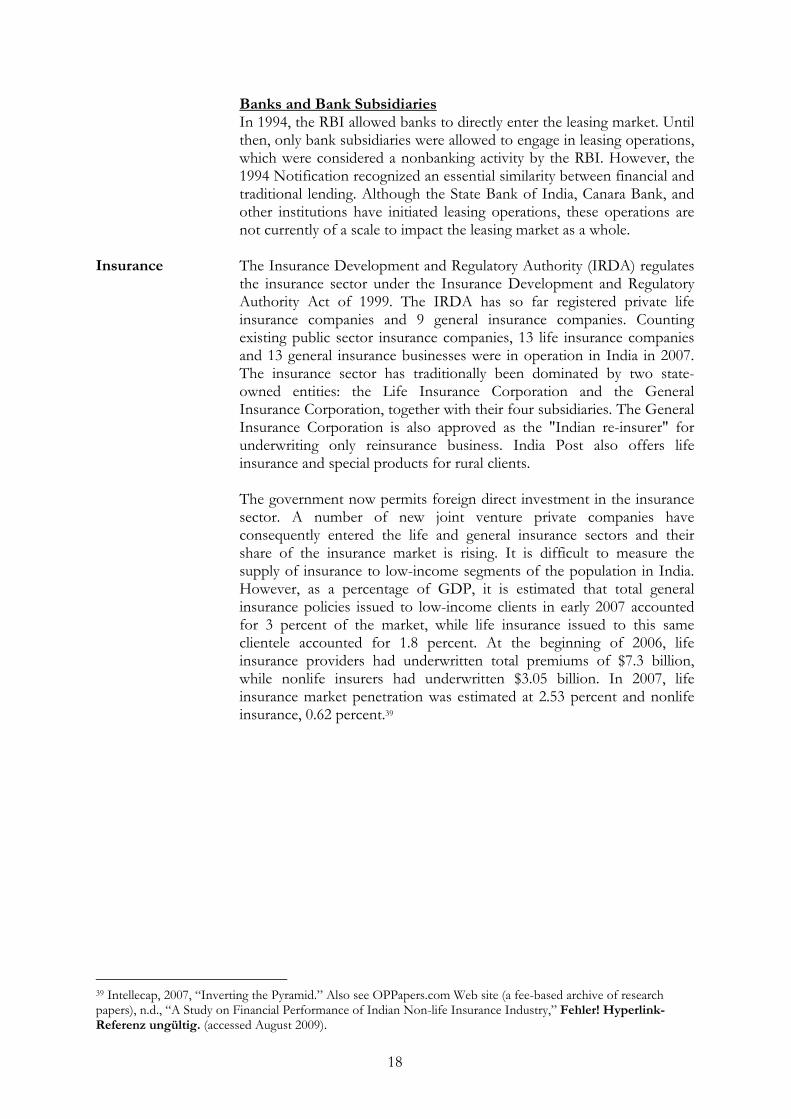
Banks and Bank Subsidiaries In 1994, the RBI allowed banks to directly enter the leasing market. Until then, only bank subsidiaries were allowed to engage in leasing operations, which were considered a nonbanking activity by the RBI. However, the 1994 Notification recognized an essential similarity between financial and traditional lending. Although the State Bank of India, Canara Bank, and other institutions have initiated leasing operations, these operations are not currently of a scale to impact the leasing market as a whole.
Insurance The Insurance Development and Regulatory Authority (IRDA) regulates the insurance sector under the Insurance Development and Regulatory Authority Act of 1999. The IRDA has so far registered private life insurance companies and 9 general insurance companies. Counting existing public sector insurance companies, 13 life insurance companies and 13 general insurance businesses were in operation in India in 2007. The insurance sector has traditionally been dominated by two state-owned entities: the Life Insurance Corporation and the General Insurance Corporation, together with their four subsidiaries. The General Insurance Corporation is also approved as the "Indian re-insurer" for underwriting only reinsurance business. India Post also offers life insurance and special products for rural clients. The government now permits foreign direct investment in the insurance sector. A number of new joint venture private companies have consequently entered the life and general insurance sectors and their share of the insurance market is rising. It is difficult to measure the supply of insurance to low-income segments of the population in India. However, as a percentage of GDP, it is estimated that total general insurance policies issued to low-income clients in early 2007 accounted for 3 percent of the market, while life insurance issued to this same clientele accounted for 1.8 percent. At the beginning of 2006, life insurance providers had underwritten total premiums of $7.3 billion, while nonlife insurers had underwritten $3.05 billion. In 2007, life insurance market penetration was estimated at 2.53 percent and nonlife insurance, 0.62 percent.39
39 Intellecap, 2007, “Inverting the Pyramid.” Also see OPPapers.com Web site (a fee-based archive of research papers), n.d., “A Study on Financial Performance of Indian Non-life Insurance Industry,” Fehler! Hyperlink-Referenz ungültig. (accessed August 2009).

19
Market Structure
Table 5. Basic Indicators of Financial Institutions in India, 2007
Branches Accounts Deposits ($ billion)
Loans ($ billion) ATMs
State-owned banks
State Bank of India 14,030 108,967,000 124.2 89.0 6,441
Nationalized banks 35,636 260,679,000 258.3 184.1 9,888
Regional rural banks 14,739 59,791,000 17.9 9.3 Commercial banks (non-state)
Private banks 7,103 52,331,000 103.3 77.1 9,799
Foreign banks 273 3,331,000 28.2 25.2 960
Total banking system 71,781 485,099,000 531,9 384.7 27,088
Post Office 155,000 172,390.000 83.7 na na Source: RBI, 2007, “Annual Report.” Note: na – not available.
Banking Sector For the third year in succession, loans and advances in the banking sector in 2007 grew by over 30 percent (30.6 percent, as compared with 31.8 percent in 2006 and 33.2 percent in 2005). This growth was underpinned by robust macroeconomic performance. During the year 2006–2007, the pattern of liabilities and assets of public, private, and foreign commercial banks underwent some changes. Reversing the trend of the previous two years, the increase in deposits in absolute terms was significantly higher than the increase in loans and advances, although the rate of growth of deposits was lower. A part of the surplus deposits was invested in government securities, unlike the preceding year, when banks liquidated investments in government securities to meet increased credit demand. Despite incremental investments, the share of government securities in total assets declined significantly (as it did in overall investments), suggesting that the increase in government investments did not keep pace with the increase in overall assets.40 Asset Quality The data on loan asset categories suggest that commercial banks made further improvements in their asset quality during 2006. While the share of standard assets in total outstanding loan portfolios increased to 97.5 percent from 96.7 percent as of the end of first quarter 2006, the share of “sub-standard” loans remained stable at the low level of 1 percent. The share of “doubtful” and “loss” categories, however, declined. In these latter two categories, nonperforming loans (NPLs) also declined in absolute terms. A more or less similar trend was observed across all groups, with the exception of new private sector banks and foreign banks, for which NPLs in all three categories (substandard, doubtful, and
40 RBI, 2007, “Operations and Performance of Commercial Banks,” Part 1 of 3 (November 27), RBI, Mumbai, India, http://www.rbi.org.in/SCRIPTs/PublicationsView.aspx?id=9811 (accessed August 2009).

20
losses) generally increased. Thus the asset quality of new private sector banks, although comfortable, showed some signs of weakening.41
Microfinance Sector Assets In 2007, growth in the Indian microfinance sector was more than
quadruple that of the national economy (as measured by client outreach and GDP, respectively). Both principal microfinance delivery in channels—the SHG linkage model and MFIs—achieved growth through expanded outreach and higher average loans sizes. While the increase in average loans was similar (SHGs increased their average loan size by 24.5 percent to $150, and MFIs, by 23 percent to $96), the increase in client outreach was greater for the SHGs (52 percent, compared to 40 percent for MFIs).
It should be noted that SHGs and MFIs are interlinked, given that SHGs constitute a major client segment of the MFIs. Owing to this linkage, the significant SHG growth has clearly been fueled by the aggressive branching strategy adopted by MFIs. The dynamic growth of MFIs is expected to continue into 2009. Overall, MFIs demonstrate an accelerating growth trend (72 percent in 2007 and 21 percent in 2006), albeit from a still significantly smaller base. Intellecap projects that MFI loan portfolios will collectively reach $5.8 billion (INR 254 billion) by 2012.42
Table 6. Microfinance Sector Indicators, 2006–2007 2006 2007 Increase Outstanding portfolio ($ millions) NABARD – SHGsa 2,327 3,711 + 59% Sa-Dhan (223 MFIs)b 785 1,353 + 72%
Total 3,112 5,064 +63% Client outreach (millions) NABARD – SHGsc 26.3 40.0 +52% Sa-Dhan (223 MFIs) 10.0 14.1 + 40% Totalc 34.8 52.0 + 49%
Sources: Sa-Dhan. 2008, “Quick Report 2007/08”; and Prabhu Ghate, Sai Gunaranjan, and Vijay Majahan, 2008, Microfinance in India: A State of the Sector Report, 2007 (Thousand Oaks, CA: Sage Publications). Notes: a NABARD-SHG figures are estimates. b Of the 223 MFIs survyed by Sa-Dhan, 126 were Sa-Dhan member institutions and 97, nonmembers. Although the sample did not represent the total number of Indian MFIs, they account for almost the entire outstanding loan portfolio and client outreach of all MFIs in the country. Sa-Dahn, 2008, “Quick Report 2007/08.” c Total outreach figures reflect a deduction of 15 percent of the MFI figures, reflecting Sa-Dhan’s estimated overlap of clients who borrow through both channels. Sa-Dhan also estimated that only 59 percent of bank-linked SHGs were currently borrowing. However, NABARD’s annual data series (2006–07) provided the exact number of existing loan accounts to which 98 percent of linked SHGs have existing loans. See NABARD, 2007, “Annual Report, 2006–07,” NABARD, New Delhi, India.
MFI growth was driven by the larger institutions, which accounted for more than 74 percent of total growth in outreach and loans. But the
41 Ibid. 42 Intellecap, 2007, “Inverting the Pyramid.”

21
strongest impulse over the two-year period 2006–2008 was generated by medium-sized MFIs, the collective outstanding loan portfolio of which more than doubled (growth of 126 percent) from 2006 to 2007, followed by 69 percent growth from 2007 to 2008. Table 7 shows the top 10 providers of microfinance in terms of active borrowers and outstanding loan portfolios as of the end of first quarter 2008.
Table 7. Top 10 Microfinance Providers in India, as of 1Q08
Outreach (000s clients) MFI Legal
form Year
created. Lending method
Total Urban
Outstanding loans
($ 000s)
SKS Microfinance Pvt Ltd NBFC 1998 G, IL 1,879 98 195,465 Spandana Sphoorty Financial Ltd. NBFC 1998 G, IL 1,189 535 182,124 Share Microfin Limited NBFC 1993 G, IL 1,289 258 148,824 SKDRDP Trust 1996 SHG 575 86 84,265 Asmitha Microfin Limited NBFC 2002 G, IL 701 0 83,978 Bandhan Konnagar Society 2001 IL 758 265 69,570 BASIX NBFC 1997 SHG, G, IL 305 7 56,353 Cashpor Micro Credit S 25 1997 G 303 11 36,822 Mahila Arthik Vikas Mahamandal (MAVIM)a S 25 1994 SHG 685 21 33,001 SE Investments Limitedb NBFC 2006 IL 83 1 30,251
Source: Sa-Dhan, 2008, “Quick Report 2007/08.” Notes: G – Grameen; IL – individual lending. a MAVIM is a government corporation for women’s economic development in Maharashtra. It does not have clients, but does promotional work. That is, it forms SHGs and links them to banks. The number of clients and loans pertains to bank loans to MAVIM-promoted groups. b SE Investments Ltd. is a listed company (24 percent public owned) engaged in a variety of activities, including windmills, leasing, and microfinance. The data reported above is an overstatement since it most likely includes leasing and “big-ticket” finance—not only microfinance.
Owing to the phenomenal growth of the Indian microfinance industry, table 7 is just a temporary snapshot of the situation that prevailed at the end of March 2008. SKS in particular has had aggressive growth and as of this writing, ranked first (with a claimed portfolio at risk (PAR) of less than 1 percent). In 2006, it had granted $17 million of loans to 221,000 borrowers. By March 2009, however, SKS expected to increase its portfolio to about $1 billion, $250 million of which would be securitized. Other top MFIs have also been growing at a strong pace. In general, the leading Indian MFIs are evolving to become the largest microfinance institutions in existence worldwide. Microfinance Clientele and Types of MFIs Four out of five MFI clients in the country are women. More than half of these clients live in southern and more than a quarter in eastern India. The overwhelming majority—more than 12 million—of microfinance clients are served by 22 "big" MFIs, 7 of which were identified by Forbes

22
magazine as among the 50 biggest MFIs worldwide in late 2007.43 In terms of MFI types, NBFCs dominate the aggregate outstanding loan portfolio with 60 percent of the total, followed by societies (19 percent), Section 25 companies (12 percent) and trusts (7 percent). By number of organizations, most MFIs in India are societies (104), followed by trusts (31), NBFCs (25), and Section 25 companies (22).44 Urban Markets Microfinance in India has traditionally centered on rural and semi-urban settlements, reflecting the perceived “frail” nature of urban clients. Sa-Dhan is now observing the reverse of this reluctance—as of this writing, 25 percent of MFI clients and 33 percent of the microfinance portfolio were urban. Urban outreach and urban portfolios have been growing faster than the sector as a whole, indicating that urban microfinance was a major driver of substantial growth in 2007. Interestingly, the urban share of the microfinance market is biggest among medium-sized MFIs. Roughly 40 percent of the clientele of these institutions are urbanites, compared to 28 and 22 percent of the clientele of small and large MFIs, respectively. The urban trend is expected to continue for several reasons: the majority of Indian microenterprises operate from fixed locations and work throughout the year, making them less risky for microlending. Moreover, asset holdings of urban enterprises are relatively larger than those of their rural counterparts, hence they represent greater banking potential in terms of collateral and loan sizes. On the other hand, microenterprise ownership is predominantly male, which will be a new challenge for microfinance in India.45 Asset Quality Official action taken against MFIs in Andra Pradesh in June 2006 resulted in a significant deterioration of the credit culture in the state.46 The weighted average PAR > 60 days declined from 4.7 percent in 2005 to 6.0 percent in 2007. Leading MFIs in the state were particularly affected, with PAR ratios declining from 1.4 to 4.6 percent in 2007. Aggressive expansion also raises quality concerns across all locations. Internal controls, human resource systems, and organizational processes may not keep pace with the pace of expansion. The implications for the long-term performance of the microfinance sector in India as a whole remain to be seen.47
43 Matthew Swibel, 2007, “The World’s Top 50 Microfinance Institutions,” Forbes.com (online magazine), December 20, 2007, http://www.forbes.com/2007/12/20/top-philanthropy-microfinance-biz-cz_1220land.html (accessed July 2009). 44 Intellecap, 2007, “Inverting the Pyramid.” 45 Amit Gupta and Hema Bansal, 2007, “Urban Micro Enterprises: A Ready Market,” Microfinance Insights [Intellecap, Mumbai, India] 2 (March/April 2007), https://www.microfinanceinsights.com/articles_new.asp?member= &id=247 (accessed July 2009). 46 In March 2006 a major crisis broke out for MFIs operating in the state when authorities closed down about 50 branches of two major MFIs in the Krishna district. The MFIs were respectively accused by certain borrowers of charging allegedly “usurious interest rates” and engaging in “forced loan recovery” practices. 47 CMF/IMFR, 2006, “Micro Finance in India.”

23
Microfinance Sector Liabilities Access to Finance
The strong growth of the Indian microfinance industry over the last three to five years was facilitated by unprecedented access to debt capital from banks that must comply with RBI regulations on priority sector lending. But during 2006, easy access to bank credit became blocked because banks adopted a more selective lending policy for MFIs. In particular ICICI, which provides up to 70 percent of refinancing facilities for MFIs, substantially reduced the number of MFIs to which it lends—from 200 in March 2007 to just 30 in March 2008. At the same time, ICICI was expected to increase the total volume of MFI refinancing facilities from INR 10 billion in March 2007 to INR 17.5 billion by March 2008. The chances of MFIs continuing to grow rapidly in the coming years will depend decidedly on their ability to strengthen their capital base. Leverage The ongoing exposure of banks to MFI lending makes Indian MFIs among the most highly leveraged institutions in the world. In 2007, debt-to-equity ratios reached 11:1 and capital adequacy ratios dropped below 10 percent, compared to the minimum level of 12 percent specified for NBFCs by the RBI. Given the pressure on interest margins, it is unclear for how long such highly leveraged ratios can be sustained. It is also questionable how Indian MFIs can attract further investments with such a thin layer of capital available for loss absorption in case of default. The extent of their leverage also raises doubts about the ability of MFIs to obtain good ratings of their existing portfolios in order to access mainstream financial instruments such as securitization.48 The regulatory capital requirement for NBFCs has been raised by RBI to 15 percent of risk-weighted assets, with compliance scheduled for 2009. Capitalization The imbalance in the debt-to-equity ratio has attracted the attention of both private equity players and social investment funds. Two landmark private equity investments in Indian MFIs took place in 2007: a $11.5 million investment in SKS, led by Sequoia Capital, followed by an investment of $25 million by Legatum Capital in Share. Intellecap estimates that at least 40 funds and corporations offer equity and debt financing to Indian MFIs. Despite the large number, these institutions are focused on a small number of institutions: either the top MFIs (e.g., JM Financials and Lok) or greenfield MFIs created by microfinance professionals (Bellwether). As a result, the missing middle MFIs are finding it difficult to strengthen their capital base.
Performance
Banking Sector As in previous years, corporate services continued to be the largest banking market segment in 2006, but personal financial services proved to be the highest growth segment. The financial performance of commercial banks in 2006 was underpinned by a hardening of interest
48 CMF/IMFR, 2006, “Microfinance in India.”

24
rates, both on the liability and asset sides, due to high credit demand. While interest income increased sharply, both in absolute terms and in relation to total assets, noninterest income declined in relative terms. Banks were able to maintain their profitability, however, by containing operating expenses. Unlike 2005, provisions and contingencies made by banks increased during 2006 in absolute terms, but slightly decreased in relative terms (i.e., as a percentage of assets). While return on assets remained stagnant, banks’ return on equity improved during the year.
Table 8. Financial Sector Performance, 2006
Type of institution Growth of
loan portfolio
Net interest margin
ROA ROE NPLs ($ million)
Coverage ratio CAR
Public sector banks 30.2% 3.2% 0.8% 14% 8,854 56.8% 12.4% Old private banks 12.0% 3.3% 0.6% 11% 674 66.0% 12.1% New private banks 39.9% 3.2% 0.9% 12% 1,429 49.1% 12.0% Foreign banks 29.5% 4.8% 1.6% 14% 514 51,1% 12.4%
Source: RBI, 2007, “Annual Report 2007.”
Capital Adequacy The overall risk-weighted capital adequacy ratio of all commercial banks remained at the 2005 level of 12.3 percent in 2006, suggesting that the increase in capital kept pace with the sharp increase in risk-weighted assets. The increase in the latter was mainly due to the rapid growth of credit, but also in part to the RBI’s increase of risk on certain categories of credit (a prudential measure to protect bank balance sheets during a phase of rapid credit expansion). As of this writing, the present bank risk-weighted capital adequacy ratio was significantly above the stipulated minimum of 9 percent. Commercial banks are thus well poised to meet Basel II requirements, which will become fully operational by the end of March 2009.49
Microfinance Sector Operational Efficiency
The average Indian MFI employs 326 staff members, each of whom serves 230 borrowers. At the top MFIs, staff members serve 275 borrowers on average. This number represents some of the lowest servicing costs for MFIs in the world and is responsible for the fact that Indian MFIs rank among the most efficient MFIs in the world. The average operational cost ratio of the 223 MFIs screened by Sa-Dhan in March 2008 was around 10 percent, comfortably below the 20 percent benchmark set by Sa-Dhan, but higher than the 8 percent that prevailed in 2005. The rise in the operating cost ratio could indicate increasing cost levels or higher MFI budgets for training and/or MIS improvement measures.50 Yet operating costs will be high as long as clients remain underfinanced. There is room for loans per client to increase up to 400 percent, in which case MFI operating costs would drastically decline. But
49 RBI, 2007, “Annual Report.” 50 Sa-Dhan, 2008, “Quick Review 2007/08.”

25
MFIs in India seem to be strategizing for client acquisition rather than seeking to fully meet client needs. Interest Rates Nominal interest rates in India range between 12 and 16 percent a year. The annual effective interest rate paid by the average Indian microfinance borrower is, on average, around 25 percent—not significantly different from the approximately 24 percent usually charged by commercial banks on consumer finance. Strikingly, MFIs charge flat interest rates, whereas SHGs linked to banks are charged on a declining balance basis. Profitability An analysis of 83 MFIs by Sa-Dhan in 2006 documented that the return on their gross loan portfolios (GLP)51 ranged from -2.3 percent to +2.4 percent, depending on an MFI’s organizational form. Cooperative MFIs posted the highest return (+2.4 percent), followed by NBFCs (+0.9 percent) and nonprofit companies (-2.3 percent). MFI cooperatives also achieved the highest return on equity (+6.5 percent), followed by NBFCs (+5 percent) and nonprofit organizations (-18.6 percent).52 India lags well behind Bangladeshi microfinance institutions reporting to the MIX,53 which lead the region in profitability. The financial viability of Indian MFIs is also under pressure, despite yield improvements. Low portfolio yields, combined with poor portfolio quality and rising financial costs, have reduced Indian MFI surpluses even though improvements in collection measures have boosted portfolio yields.54 Most MFIs are still in the growth phase, in which operational costs are high relative to loan volumes. Current investments in expansion will be recovered over time. In the consolidation phase, loan volumes per client are expected to increase, leading to higher revenue per client and improving profitability. But the pricing of microfinance products in India will hit a glass ceiling, given that higher interest rates attract adverse social and political attention. Over the course of 2007, the cost of borrowing increased steadily, but MFIs were unable to pass on this higher cost to clients. Even if the demand and supply matrix would project the highest rate of interest possible, it is practically unfeasible for MFIs to charge such high rates. Their profits must be earned through higher volumes and better staff productivity. Competition among MFIs and between MFIs and banks is another factor that reins in profits through downward pressure on both pricing and client acquisition costs. The emphasis on profitability is relatively recent, as more and more MFIs in India shift from soft funding to commercial funding and look to market-based options for expansion. As the momentum builds in this direction, MFIs are clearly targeting profits through efficiency
51 Return on GLP is calculated as net profit and donations divided by the gross loan portfolio. 52 Sa-Dhan, 2007, “Side by Side: Maturing Microfinance, Emerging Challenges,” Sa-Dahn, New Delhi, India. ROE is a difficult measure for comparisons across different types of MFIs. Barring NBFCs and cooperatives, there is no concept of equity, nor is there a uniform definition of equity. 53 An online information exchange for microfinance institutions: www.themix.org. 54 Ghate, Gunaranjan, and Majahan, 2008, “Urban Micro Enterprises.”

26
improvements, productivity enhancements, and sound financial management. Profits can be sustained over the long term by mature institutions, as noted by an Intellecap analysis.55
Trends in Microfinance Development Transformation
In the medium run, development of the microfinance sector calls for the transformation of dynamically growing non-NBFC MFIs into regulated legal entities, such as NBFCs. This transformation will trigger related requirements for regulatory reform, together with upgraded governance and management systems. The scarcity of qualified human resources in India will, however, impose a crucial hurdle to transformation. According to Sa-Dhan’s conservative projection, Indian MFIs will require about 240,000 additional staff through 2010, among them, at least 6,500 area managers. It will be of strategic importance to provide training and formation capacities for these staff.56 Cross-selling While strengthening the client base is part of expanding outreach, MFIs are increasingly realizing the potential of providing—either directly or as agents—services such as insurance, remittances, and supply-chain financing for agribusiness activities, using the established delivery channels of other businesses. This strategy is similar to the strategy adopted by mainstream banks of adding fee-based income streams to increase institutional profitability by cross-selling products such as insurance. This type of activity will enable MFIs to reduce the transaction costs of new services and eventually, the cost of their primary offering—credit. Many MFIs are also exploring the possibility of housing and leasing financing (the latter for assets such as tractors, farm equipment, and catalytic converters for automobiles).57. Microinsurance Microinsurance is still a young phenomenon in India, but the provision of microinsurance products is increasing. This is largely achieved, as noted above, by MFIs acting as agents for insurance companies. The products offered at the time of writing included micro life, asset, health, and weather insurance. Technical Innovations Innovations such as mobile phone banking, smart cards, biometric IDs, and rural kiosks are expected to help reduce the operating costs of Indian MFIs while improving transaction security.
55 Intellecap, 2007, “Inverting the Pyramid.” 56 Sa-Dhan, 2008, “Quick Review 2007/08.” 57 CMF/IMFR, 2006, “Microfinance in India.”

27
Financial Infrastructure Capital Markets Indian capital markets have witnessed a significant transformation over
the last decade, placing them today among the world’s mature capital markets. Favorable underlying macroeconomic data helped encourage capital inflows of $35 billion between 2003 and 2006. Many new instruments have also been introduced, including index futures, index options, derivatives, options, and futures in select stocks.58 The Securities and Exchange Board of India (SEBI) was established under the Securities and Exchange Board of India Act of 1992 as the regulatory authority for capital markets. India has 23 recognized stock exchanges that operate under government-approved rules, bylaws, and regulations. These exchanges constitute an organized market for securities issued by the central and state governments, public sector companies, and public limited companies. As a result of a process demutualization, the stock exchanges have been converted into companies in which brokers may hold minority shares only.59 The Mumbai Stock Exchange and National Stock Exchange are the premier stock exchanges. About 5,000 companies are listed on the stock market, with an aggregate market capitalization of about 50 percent of GDP, which is comparable to ratio that prevails in the euro zone.
Bond Market Irrespective of improved capital markets, unlike other emerging countries, India does not have a well-developed debt market that contributes to the supply of credit. The corporate bond market is hampered by cumbersome issuance procedures and statutory guidelines that both restrict the holdings of banks and institutional investors and limit foreign investor participation. Owing to lack of sufficient liquidity, investors are reluctant to invest in tradable debt instruments. Total outstanding bond debt in India stood at $239.billion in 2004, equivalent to just 34.8 percent of GDP, compared to a 183 percent debt-to-GDP ratio in Japan. Nevertheless, the Indian debt market is the third largest in Asia after those of Japan and Korea. The debt market consists of two components: a government securities market and a corporate securities market, both of which generally issue debt with maturities of less than 5 years. Government securities account for about 90–95 percent of outstanding issues, debt market capitalization, and trading value. Corporate bonds make up 1 percent of India's stock of financial assets, compared to 10 percent in Thailand, 20 percent in Malaysia, and 30 percent or more in South Korea, the United States, and most of Europe. And India still needs to establish a secondary bond market. The development of a market for corporate bonds is critical for
58 Jennifer Asuncion-Mund, 2007, “Indiens Kapitalmärkte,” July 9, 2007, Deutsche Bank Research, Frankfurt, Germany. 59 Embassy of India (Washington, DC), n.d., “Financial System,” http://www.indianembassy.org/newsite/ Doing_business_In_India/Financial_System_in_India.asp (accessed August 2009).

28
sustaining the fast-growing Indian economy, as well as creating trade and investment opportunities.60 The over-the-counter derivatives market in India is concentrated in a relatively small number of institutions. India’s top 15 banks account for about 82 percent of the banking system’s off-balance sheet derivative exposure, of which two-thirds is held by foreign banks. The concentration of trading in a relatively small number of banks partly reflects the limited risk-management skills and knowledge of this market in the financial sector, aside from participating dealers.61
Foreign Exchange The RBI regulates foreign exchange under the Foreign Exchange
Management Act. In the four years 2004–2008, the INR appreciated against the U.S. dollar largely due to the weakness of the latter. Until May 2007 the INR was also modestly appreciating against the euro, but then depreciated by 20 percent in the following 12 months. Fueled by the prospering Indian economy, the government has liberalized foreign exchange controls. The INR is now freely convertible in current accounts and is almost fully convertible in capital accounts for nonresidents. Profits earned, as well as dividends and proceeds from the sale of investments, are fully reconvertible and retransferable.62
Deposit Insurance In 1962, India was the second country in the world to introduce deposit
insurance; the first was the United States in 1933. The deposit insurance system is operated by the Deposit Insurance and Credit Guarantee Corporation (DICGC). The DICGC insures all commercial banks, including branches of foreign banks operating in India, local area banks, and regional rural banks. In addition, all cooperative banks in most Indian states are covered by the DICGC, although primary cooperative societies are not. Savings deposited with MFIs are also not covered by deposit insurance. The DICGC insures all deposits, such as savings, fixed, current, and recurring accounts, except for: (i) deposits of foreign governments; (ii) deposits of the national and state governments; (iii) interbank deposits; (iv) deposits of state land development banks with the State Cooperative Bank; (v) any amount due on account of deposits received outside of India; (vi) any amount specifically exempted by the Corporation with the previous approval of the Reserve Bank of India. Presently, eligible deposits are insured up to a maximum of INR 100,000 per depositor, which covers both principal and interest on the amount held. The DICGC has meanwhile built up a Deposit Insurance Fund (DIF). The agency continuously reviews the insurance premium with the
60 Government of India, Ministry of Finance, 2004, “Credit Information and the Banking Environment in India,” presentation at “Conference on Credit Bureau Development in South Asia,” May 10–11, 2004. 61 IMF, 2007, “Country Report: India 2006.” 62 Embassy of India (Washington, DC), n.d., “Financial System.”

29
objective of maintaining a strong DIF in proportion to increasing deposit levels.63
Payment System In value terms, the annual turnover of the various payment and settlement systems in the country rose by 44.2 percent in 2005 and 37.5 percent in 2006. As a ratio of GDP, annual turnover in terms of value increased from 6 percent in 2003 to 10.3 percent in 2006. The rise in turnover can be attributed mainly to the increased activity of financial markets which, in turn, reflected measures to widen and deepen the various segments of the financial sector.
The expansion in turnover during 2006 was led by the systemically important payments systems (SIPS), which now constitute more than four-fifths of total turnover. Among the various constituents of the SIPS, a real-time gross settlement (RTGS) system constitutes the largest segment in terms of value (over 50 percent), followed by foreign exchange clearing and high-value clearing. The volume of turnover of the RTGS system continued to expand rapidly, both in terms of volume and value (it grew in value by 60 percent in 2006, on top of an increase of 183 percent in 2005). The growth in RTGS can be attributed largely to the movement of large-value, time-critical payments to this system, as well as to the widening of the RTGS network to cover more bank branches.
Table 9. Performance of Indian Payment Systems, 2003–2006
Source: RBI, 2007, “Annual Report 2007,” table 9.1, 276 (http://rbidocs.rbi.org.in/rdocs/AnnualReport/PDFs/86546.pdf) [accessed August 2009]. Note: A crore (abbreviation “cr”) is equal to 10 million (10,000,000).
63 RBI, 2007, “Annual Report 2007.”
Volume (000s) Value (Rupees Crore) 2003–04 2004–05 2004–06 2006–07 2003–04 2004–05 2005–06 2006–07 1 2 3 4 5 6 7 8 9 Systematically important payment systems (SIPS)
1. Interbank clearing
1,142 808 – – 30,46,666 9,91,436 – –
2. High-value clearing
13,172 13,077 15,924 18,730 30,23,290 46,07,208 49,81,428 50,34,007
3. Government securities clearing 265 185 151 167 25,18,322 26,92,192 25,59,260 35,78,037
4. Forex clearing
331 466 490 606 23,18,531 40,42,435 52,39,674 30,23,078
5. RTGS 0.07 460 1,767 3,876 1,965 40,66,184 1,15,40,836 1,84,81,155 Total SIPS (1–5) 14,910 14,966 18,332 23,379 1,09,08,774
(3.9) 1,63,99,392
(5.2) 2,43,21,198
(6.8) 3,51,16,277
(8.5) Others 6. MICR
clearing 609,786 927,571 1,015,912 1,128,656 31,08,795 37,57,795 44,92,943 54,15,103 7. Non-MICR
clearing 398,700 225,392 254,922 233,177 24,17,209 11,02,643 18,54,763 16,06,990 8. Electronic
clearings 29,016 57,900 83,241 148,997 29,607 77,702 1,06,598 1,86,160 9. Cards 137,936 171,004 201,772 229, 713 22,537 31,047 39,783 49,533 Total others (6–9) 1,175,438 1,381,867 1,555,847 1,730,543 55,78,148
(2.0) 49,69,000
(1.6) 64,94,087
(1.8) 72,57,786
(1.8) . Grand total 1,190,348 1,396,863 1,574,179 1,753,922 1,64,86,922
(6.0) 2,13,68,392
(6.8) 3,08,15,285
(8.6) 4,23,74,063
(10.3)

30
In coming years, the RBI is expected to focus on the consolidation of existing payment systems while promoting electronic means of payment and settlement. Efforts to create an infrastructure for a remittance facility between India and some of its neighboring countries may also be pursued.64
Rating & Credit Information There are several rating agencies in India, including CRISIL, a subsidiary
of Standard & Poor’s. The national government, in cooperation with the RBI, founded the Credit Information Bureau Ltd. (CIBL). CIBIL offers data sharing based on the principle of reciprocity, which means that only members who have submitted all their credit data may access credit information reports from CIBIL. CIBIL has, however, been faced with technical problems with identification and the quality of data imported. Another handicap is the absence of national identity cards in India, which renders it difficult to uniquely identify customers in the microfinance sector.65
Audit & Accounting Standards Audit
The RBI defines the audit function as an important element of corporate governance, asserting that the independence of this function is crucial to good governance. The Audit Committee of the Boards, constituted at the demand of the RBI, oversees concerns about internal controls and makes recommendations for their improvement. To ensure both the professionalism and independence of Audit Committees, bank boards of directors are required to have chartered accountants as mandatory members and the chairman or chief executive officer is not permitted to be a member of the audit committee. The RBI nominates directors to the boards of all public sector banks, as well as boards of some old private sector banks. Further, the central government also nominates directors to the boards of all public sector banks. Of late, the RBI has been withdrawing its nominees from the boards of well-managed old private banks.66 Transparency and Disclosure The formats of balance sheets and profit and loss statements are prescribed by the Banking Regulation Act of 1949 and Indian banks must strictly comply with them. Accounts and balance sheets are required to be duly audited by statutory auditors (including branch auditors) appointed with the approval of the RBI. While international accounting
64 RBI, 2007, “Annual Report 2007.” 65 IFMR, 2005, “Credit Information Systems for Microfinance in India—Developing Solutions to Manage Anticipated Boom in Sector Growth;” and Netherlands Platform for Microfinance (NPM), 2007, “Status Report: Microfinance in India,” NPM, Bunnik, The Netherlands, http://www.microfinance.nl/Documents/ status%20report%20mf%20sector%20india%20incl%20lsijtsma%20final.pdf (accessed August 2009). 66 RBI, 2007, “Annual Report 2007.”

31
standards are broadly followed, specific valuation standards have been prescribed regarding investments and foreign exchange positions.67 Accounting Subject to a decision of the Institute of Chartered Accountants of India, the accounting standards of India listed companies will be fully in line with International Financial Reporting Standards (IFRS) as of April 1, 2011. These standards will be extended to other entities in a phased manner.
Industry Associations Associations
The Indian microfinance industry is complex, comprised of a fragmented multiplicity of legal forms and corporate sizes. Only a few meaningful associations exist, each of which has only a comparatively small number of members compared to the total number of microfinance providers. The most prominent associations are: Sa-Dhan Sa-Dahn was founded in 1999 as the Association of Community Development Finance Institutions by SEWA Bank, BASIX, Dhan Foundation, and other MFIs and banks, including FWWB, MYRADA, RGVN, SHARE and PRADAN. It is registered in Hyderabad, close to its founding members, but effectively operates out of its Delhi office. Sa-Dhan’s mission is to build the field of community development finance in India. It seeks to help its members and associate institutions better serve low-income households, particularly women, in both rural and urban India. As of this writing, Sa-Dhan had 126 members, the majority of which were MFIs, including the largest ones operating in India. The remaining MFIs are small to insignificant in size, and do not significantly impact the Indian microfinance industry. ACCESS Microfinance Alliance ACCESS Microfinance Alliance (AmFA) was formerly launched in October 2007. Its strategy is to provide technical services to NGO-MFIs; develop strategic partnerships with banks to facilitate the flow of loan funds to its partners; and provide a revolving loan fund. The latter is a $3 million fund managed on behalf of CARE; it is intended to build the financial management capabilities of AmFA partners and provide bridge loans until MFIs become linked to mainstream financial institutions. As of this writing, AmFA had 109 MFI partners across 10 Indian states. Microfinance Service Providers Access Development Services, Microsave India, Reach India, EDA Rural Systems, and APMAS are some of the larger service providers in Indian microfinance. These organizations are engaged in capacity building, the incubation of start-ups, performance monitoring, program evaluation, and facilitating resource mobilization.
67 Ibid.

32
Training and Consulting Technology A few banks have undertaken initiatives to set up centers in rural and/or
semi-urban areas to offer financial education and credit counseling services. The objective of these centers is to advise people on how to gain access to the financial system, including banks; create awareness of financial management among the public; counsel people who are struggling to meet repayment obligations; and help rehabilitate borrowers in distress. Some of these credit counseling centers (also known as Knowledge Centers) also train farmers and women’s groups to enable them to start income-generating activities.68
Legal, Regulatory, and Policy Framework
Legal It takes between 5 to 15 years for a case to be decided in an Indian court.
India’s judiciary is hampered by complex procedures, a preponderance of new laws, and particularly long appeals procedures. Another factor behind the slow progress of court cases is the low ratio of judges to the population—as low as 12 to 13 judges per 1 million people, compared to 107 in the United States, 75 in Canada, and 51 in Britain. In its Global Corruption Report 2007, Transparency International concludes that Indian citizens are not fully confident that they will get speedy justice from the judiciary.69 People consequently have a tendency to avoid filing cases and attempt to settle many disputes through mediators of various kinds, if not goons or local politicians. The vast backlog of court cases in India leads to long adjournments and leads to illegal payments to speed up the process. Based on a 2005 countrywide survey on "public perceptions and experiences of corruption in the lower judiciary'' conducted by the Centre for Media Studies, the general perception is that the Indian judiciary is corrupt. The amount paid in bribes to lawyers, court officials, and middlemen in a 12-month period is estimated to be around $580 million.70
Regulation Regulation and supervision are slowly adapting to the needs of the microfinance industry. However, the government (notably at the state level) remains overly focused on controls instead of creating an enabling environment and policies conducive to sector growth. There is also a need for more consistency and transparency because of the current fragmentation of the regulatory framework. The existing framework, for example, is unsuitable for dealing with infant market-oriented sectors like microsavings and microinsurance.71
68 Ibid. 69 Transparency International, 2007, Global Corruption Report 2007 (Berlin: Transparency International), http://www.transparency.org/publications/gcr/gcr_2007#download (accessed August 2009). 70 Centre for Media Studies, 2005, “India Corruption Study 2005: To Improve Governance,” report prepared for Transparency International India, CMS, New Delhi, India, http://www.cmsindia.org/cms/events/corruption.pdf (accessed August 2009); and Praful Bidwai, 2007, “India: Legal System in the Dock,” Inter Press Service (IPS, online news service), May 31, 2007, http://ipsnews.net/news.asp?idnews=37972 (accessed August 2009). 71 Daniel Radcliffe and Rati Tripathi, 2006, “Sharpening the Debate—Assessing the Key Constraints in Indian Micro Credit Regulation,” Working Paper Series, Draft (November 2006), IFMR, Chennai, India.

33
Regulatory Bodies The RBI performs a regulatory and supervisory role for commercial and all cooperative banks (state, district, and urban), NBFCs, and primary dealers through the Board for Financial Supervision (BFS). However, the supervision of rural cooperative banks and regional rural banks is carried out by NABARD, with regulatory powers exercised by the RBI. Insurance companies and mutual funds are regulated by the Insurance Regulatory and Development Authority (IRDA) and the Securities and Exchange Board of India (SEBI), respectively. A coordinated approach to supervision is ensured through a High-Level Coordination Committee on Financial and Capital Markets, the members of which include the Governor of the RBI (as chairman), and the chiefs of SEBI, IRDA, the Pension Fund Regulatory and Development Authority (PFRDA), and the Secretary of Economic Affairs of the Ministry of Finance.72 Interest Rates The RBI uses a laissez-faire approach to the interest rates that commercial banks charge to MFIs or that MFIs charge to their borrowers (including self-help groups). NBFCs are not subject to the regulatory interest rate ceilings stipulated by the RBI. Conversely, some states have specific legislation regarding the interest rates of money-lending institutions. Such is the case of the states of Uttar Pradesh, West Bengal, Kerala, and Karnataka. In general the threat of formal interest rate limitations exists at the state level, as evidenced by the events in Andhra Pradesh in March 2006.73 Priority Sector Lending The RBI stipulates that domestic banks and foreign banks operating in India must direct 40 percent and 32 percent, respectively, of their advances to certain “priority sectors,” including agriculture, small-scale industries, small road and water transporters, small business, microcredit, education software, and housing. The definition of what constitutes a “national priority” is adjusted from time to time. Banks that do not meet the target must invest the gap in government projects targeted at these subsegments at a lower interest yield (currently 5 to 6 percent, compared to the commercial average of around 11 percent). Since 2000, the RBI has allowed commercial banks to lend to MFIs as part of the priority sector rule, which has significantly facilitated the access of Indian MFIs to commercial funding. Furthermore, the RBI allows commercial banks to use MFIs as financial intermediaries, following two different models:
• Under the business facilitator model, MFI intermediaries are allowed to provide the following services: identification of borrowers and activity; collection and preliminary processing of loan applications;
72 RBI, 2007, “Annual Report 2007.” 73 See note 46 for information on the Andhra Pradesh events. Also see Radcliffe and Tripathi, 2006, “Sharpening the Debate.”

34
financial education; submission of applications to banks; promotion and nurturing of joint liability groups; and monitoring and recovery of loans.
• Under the business correspondent model, organizations such as NGO-MFIs and cooperatives are permitted to provide the same services offered under the business facilitator model, but may in addition offer the following services: disbursal of small-value credit; collection of principal and interest; sale of other microfinance services (e.g., insurance); and receipt of small-value remittances and other payments. The correspondent acquires and services clients as an agent of a bank and the bank remains responsible to the client.
However, regulations on these types of arrangements oblige banking correspondents to report changes in the bank-related client base and outstanding portfolio on a daily basis to the associated commercial bank. In addition, regulations cap the permitted lending rate; banks are only allowed to charge up to a maximum of their prime lending rate for loans up to INR 200,000 (approximately $5,000), which generously exceeds the average microloan. Due to the above restrictions, the adoption of the business correspondent model started slowly, but is now being rolled out by an increasing number of banks. The delay seems to be attributable to careful planning and the finalization of cost-effective technology. Many banks (e.g., SBI, Indian, PNB, Corporation, OBC, Karnataka, Andhra, HDFC, ICICI, Union Bank) have chosen smart card–based technologies, supported by mobile phones, portable handheld devices, or point-of-sale terminals. Supervision Due to the already large number of organizations that it regulates, the RBI has largely left MFI regulation to the sector itself. The volume of credit (which is four times the estimated volume of savings in the microfinance sector) is less than 0.5 percent of the total credit flow of commercial banks and is thus not significant from a systemic point of view. The cost of regulation of the sector, with its many small players, would also be disproportionately high compared to the volume of finance that it handles. With respect to state and district cooperative banks and the regional rural banks (RRBs), the RBI is the official regulator, but supervision is vested in NABARD. Cooperative banks have been regulated since 1966 and the RRBs, since their inception in 1975.74
External Commercial Borrowing The consistently substantial annual net inflow of foreign capital has
induced the Government of India to exercise strict control over commercial funds (e.g., bank loans, buyer credit, supplier credit, and securitized instruments) borrowed abroad. External commercial borrowing is governed by the Foreign Exchange Management Act. It is also applicable to foreign currency convertible bonds, that is, foreign bonds issued by an Indian company that are denominated and serviced in
74 NPM, 2007, “Status Report: Microfinance in India.”

35
foreign currency. Sectors qualifying for external commercial borrowing include the industrial sector and infrastructure.75 Conversely, external commercial borrowing for microfinance purposes is prohibited. MFI-NBFCs, which represent the biggest share of the Indian microfinance sector, are not allowed to borrow abroad. Private banks and private apex institutions are equally prohibited from foreign commercial borrowing for microfinance purposes. Only NGO-MFIs registered as Section 25 companies, charitable trusts, or societies are permitted to engage in this kind of borrowing. As of fiscal year 2005, the RBI allowed such NGO-MFIs to borrow up to $5 million a year from external commercial sources through an authorized dealer without explicit RBI approval. In conclusion, restrictive regulations represent a substantial hurdle for off-shore investments in the microfinance sector, reducing them factually to equity investments.
Microfinance Bill Attempts have been ongoing to establish a legal framework for the microfinance industry. An original “Microfinance Bill” was proposed by Sa-Dhan in consultation with its members and key government agencies. It has since been modified twice, but is still pending enactment. If enacted, the bill would be the first legal document that defines “microfinance,” sets exclusive guidelines for the Indian industry, and creates a promotional and regulatory framework for MFIs, especially nonprofit organizations that offer microfinance. Key highlights of the bill include:
• Microfinance would be defined as lending in amounts not to exceed INR 50,000 ($1,234) to an individual and/or enterprise.
• NABARD would be empowered as the regulator of the microfinance sector.
• Any entity that intends to commence offering thrift services to eligible clients would be required to register with NABARD.
• Nonprofit MFIs would be required to register with the Micro Finance Development Council.
• The Government of India may form a Micro Finance Development Council to provide advice on policies, schemes, and other measures required for the growth of the sector.
• NABARD would establish a Micro Finance Development and Equity Fund.76
The bill does not create a level playing field between all parties in the MFI sector. Consequently, there is a genuine criticism of the bill and it is hoped that the government will suitably address its loopholes before it becomes law. One major problem is that the bill excludes MFIs
75 RBI, 2005, “Foreign Exchange Act of India” (August 1), Foreign Exchange Department, RBI, Mumbai, India, http://www.femaonline.com/fema/circular/newapcircular2005-2006/1_august_2005_cirno_5.htm (accessed August 2009). 76 Intellecap, 2007, “Inverting the Pyramid.”

36
registered as NBFCs and Section 25 companies, that is, it excludes nearly all major MFIs and the largest share of total microcredit in the country. The stance of the central government and the RBI is that NBFCs are already regulated by the RBI and any regulatory overlap should be avoided. By excluding NBFCs and Section 25 companies, however, the bill would deprive more than half of all microfinance borrowers of the ombudsman protection envisaged in the bill, and the sector as whole of the benefits of universal operational performance standards. The RBI will need to ensure that standards are uniform, keeping in mind the differences among MFIs with different organizational forms. The bill also does not provide the sector with a form of registration uniquely suited to microfinance. It leaves NGO-MFIs with no alternative between remaining NGOs and having to raise enough capital to become NBFCs. Moreover, the envisaged Microfinance Development Council will be a government-dominated body with a purely advisory role. Given the fact that the microfinance sector, like the information technology sector, has grown so rapidly, one would have thought that sector representation on the Council would be higher and that the Council itself would be given much greater autonomy.77
Donor Activities
Microfinance Programs in India While there are several external agencies active in microfinance in India,
many offer microfinance as a part of livelihood development and poverty eradication efforts. Others have an exclusive financial sector or microfinance focus. Major donor activities in the sector are summarized in the paragraphs that follow. As of this writing, the International Finance Corporation (IFC) held a portfolio of $2.3 billion, making India its third-largest country of operation. The IFC financial sector portfolio comprised investments in commercial banks, financial institutions, and equity funds. It intended to concentrate its focus on private sector involvement in infrastructure financing; restructuring and the modernization of the manufacturing and services sectors so that they may become internationally competitive; and the development of new financial institutions and products. Kreditanstalt für Wiederaufbau (KfW): Financial sector promotion constitutes a key area of KfW’s financial activities in India. KfW supports bilateral financial cooperation programs funded by the German government, as well as projects funded through composite financing. In the Indian financial sector, KfW cofinances microfinance institutions (SEWA Banks), commercial funds (LoK), public apex institutions (SIDBI and NABARD), and cooperative banks (the Revival Program implemented by NABARD).
77 CMF/IMFR, 2006, “Microfinance in India.”

37
Gesellschaft für Technische Zusammenarbeit (GTZ): Since 2000, GTZ has been supporting NABARD to (i) set up and implement the SHG-bank linkage model and (ii) revitalize the cooperative credit structure. GTZ provides international expertise, as well as capacity building, to the microfinance sector. It has contributed to the overall planning of reform measures and the development and test runs of standardized accounting and management information systems. Department for International Development (DFID): The U.K. agency operates mainly through grant-funded projects in the poverty and livelihoods sectors that are run by state governments. Microfinance (typically the SHG model) is a part of these projects. DFID focuses on the states of Andhra Pradesh, Madhya Pradesh, Orissa, and West Bengal. OXFAM Novib: This international NGO provides grants to NGO and MFI partners under the framework of different themes; microfinance is a part of its livelihood security theme. About 20 percent of OXFAM Novib livelihood security projects across India have a microfinance component. Swiss Development Corporation (SDC): The Swiss agency has been active in the past through partnerships with the apex development banks NABARD and SIDBI. It was also instrumental in kick-starting the SHG microfinance model through NABARD. At that time, its funding was in the form of grants. Recently, it has been winding down its activities to prepare for a different method of working with its partners in the country. HIVOS: This development organization works with 14 partners in microfinance across the country. Funding is provided by means of equity, loans, and grants. United Nations Development Programme (UNDP): The UNDP supports microfinance through livelihoods and poverty eradication programs. As of this writing, group-based microfinance activities were supported as part of UNDP projects in the states of Rajasthan, Orissa, and Jharkhand. Susan and Michael Dell Foundation: This foundation co-finances five partner MFIs and has provided about $5 million in grants to date. Bill & Melinda Gates Foundation: This foundation has furnished ACCION with a grant to test new microfinance models in Asia, where India is likely to be a significant target country. Other entities active in supporting microfinance partners in India include Catholic Relief Services (CRS), Canadian International Development Agency (CIDA), Concern Worldwide, CORDAID, Danish International Development Assistance (DANIDA), Foundation for Development Cooperation (FDC), the Netherlands Development Finance Company (Dutch acronym, FMO), Opportunity International,

38
Save the Children, and the U.S. Agency for International Development (USAID).
Gap Analysis Summary of Gaps in the Financial Sector Banking Environment
1. Lack of consistent market information.
2. Approximately only 17 percent of rural households have access to banking services.
3. Substantial low-income client demand gap for insurance, pensions, savings, and remittances.
4. Persistently high demand gap in housing. This demand is mostly from low-income households that are directly affected by unhealthy and unacceptable living standards in India’s urban centers.
5. Corporate governance is still in a nascent stage. Operating decisions appear to be effected more through culture and tradition than through scientific optimization or sound business sense.
6. The newly established credit bureau is not properly meeting its objectives because of technical deficiencies and a lack of national identity cards.
7. The debt market is weak and the secondary bond market is inactive.
8. The corporate bond market is hampered by cumbersome issuance procedures, statutory guidelines that both restrict the holdings of banks and institutional investors and limit the participation of foreign investors.
9. Only a small number of institutions are active in the over-the-counter derivatives market. In addition, the sector has limited risk-management skills or knowledge of this market, aside from existing participating dealers.
Legal and Regulatory Framework 1. Legal recourse is lengthy and unreliable in India; the general public
has no confidence in the judiciary. As a result, people tend to avoid going to court. Corruption continues to be an issue.
2. Relative policy independence at the state level leads to fragmentation and uneven policy implementation by the judiciary.
3. The new microfinance bill under consideration ignores NBFCs and Section 25 companies, which represent the overwhelming majority of both MFIs and the supply of microfinance in the country.
4. Restrictive regulations on external commercial borrowing hinder nonresidents (international finance organizations and donors in particular) from effectively promoting the Indian microfinance industry.

39
5. Although Section 25 companies enjoy statutory privileges, such as the right to borrow abroad, their mandatory not-for-profit nature makes it incompatible with investor interests.
6. Restrictive regulations keep NBFCs from expanding their product line to address the comprehensive needs of low-income clients.
7. The regulatory framework in India is fragmented and hinders consistency and transparency.
Commercial Banks
1. The banking sector continues to be dominated by state-owned banks.
2. The persistently small market share of private banks impedes competition, together with customer-oriented innovations.
3. There is a lack of profit-focused innovation in SME financial products and outreach.
4. There is a lack of commitment to and expertise in developing small enterprise lending. Small businesses face restricted access to loans.
MFIs
1. MFIs are highly fragmented and operate in a nontransparent market.
2. The majority of MFIs are small and have limited outreach.
3. The top 2 percent of MFIs in India reach 77 percent of all microfinance clients. Most banks continue to lend only to these institutions.
4. Less attention is given to a large number of third-tier and some second-tier MFIs that seek to grow and scale up their operations.
5. Indian MFIs rank among the highly leveraged microfinance institutions worldwide. Further growth depends on a continued broadening of their capital adequacy ratios.
6. MFIs have to tackle organizational change as they grow—investing in information technology–based management information systems, restructuring and strengthening their human resource departments, and improving their risk management and governance.
7. Loan products are mostly limited to group lending; there is hardly any individual lending in the microfinance market.
8. MFIs focus primarily on micro subsistence businesses and less on enterprises that generate small jobs.
9. MFI outreach is predominantly rural, although urban lending is picking up.
10. A lack of qualified human resources could limit the future growth of the sector.
11. The regulatory framework—including the delayed enactment of the new microfinance law—is not conducive to sustainable development or a level playing field.

40
Selected Bibliography Allen, Franklin, Rajesh Chakrabarti, Sankar De, Jun Qian, and Meijun Qian. 2006.
“Financing Firms in India.” Paper presented at European Finance Association meetings, Zurich, Switzerland.
Asuncion-Mund, Jennifer. 2007. “Indiens Kapitalmärkte.” July 9, 2007. Deutsche Bank
Research, Frankfurt, Germany. Bidwai, Praful. 2007. “India: Legal System in the Dock.” Inter Press Service (IPS, online
news service). May 31, 2007. http://ipsnews.net/news.asp?idnews=37972. Accessed August 2009.
CIA (Central Intelligence Agency). 2008. World Factbook (online version). CIA, Langley, VA.
https://www.cia.gov/library/publications/the-world-factbook/geos/in.html. Accessed August 2009.
Centre for Media Studies. 2005. “India Corruption Study 2005: To Improve Governance.”
Report prepared for Transparency International India. CMS, New Delhi, India. http://www.cmsindia.org/cms/events/corruption.pdf. Accessed August 2009.
CMF/IFMR (Centre for Micro Finance at the Institute for Financial Management and
Research). 2006. “Micro Finance in India: Current Trends and Challenges.” Working Paper. IFMR, Chennai, India. http://www.ifmr.ac.in/cmf/results.html?cx= 003673657568823877851%3Aczp6zps3r2w&cof=FORID%3A10&ie=UTF-8&q=%22Microfinance+in+India%3A+Current+Trends+and+Challenges%22&sa=Search#161. Accessed July 2009.
FWWB (Friends of Women’s World Banking), India. 2008. “Annual Report 2007–2008.”
FWWB (India), Ahmedebad, India. Ghate, Prabhu, Sai Gunaranjan, and Vijay Majahan. 2008. Microfinance in India: A State of the
Sector Report, 2007. Thousand Oaks, CA: Sage Publications. Government of India. Ministry of Finance. 2008. “Economic Survey.” Ministry of Finance,
New Delhi, India. ———. Ministry of Finance. 2005. “Credit Information and the Banking Environment in
India.” Presentation at “Conference on Credit Bureau Development in South Asia,” May 10–11, 2004.
———. Ministry of Micro, Small, and Medium Enterprises (MSME). 2007. “Micro, Small,
and Medium Enterprises: An Overview.” Ministry of MSME, Delhi, India.
41
Gupta, Amit, and Hema Bansal. 2007. “Urban Micro Enterprises: A Ready Market.” Microfinance Insights [Intellecap, Mumbai, India] 2 (March/April 2007). https://www. microfinanceinsights.com/articles_new.asp?member=&id=247. Accessed July 2009.
Hochraich, Diana. 2006. “Indian Reforms in the Financial and Manufacturing Sectors:
Winners And Losers.” Paper presented at the international conference, “The Indian Economy in the Era of Globalization,” September 28–29, 2006, Paris, France. Available online at http://economix.u-paris10.fr/pdf/colloques/2006_India/ Hochraich2.pdf. Accessed August 2009.
ICICI Bank. 2006. “Innovations: SME Financing by ICICI Bank.” ICICI Bank, Hyderabad,
India. ———. 2005. “Industry Review—The Financial Service Sector.” ICICI Bank, Hyderabad,
India. IMF. 2008. “India Country Report.” IMF, Washington, DC. IFMR (Institute for Financial Management and Research). 2005. “Credit Information
Systems for Microfinance in India—Developing Solutions to Manage Anticipated Boom in Sector Growth.” IMFR, Chennai, India.
Intellecap. 2007. “Inverting the Pyramid: The Changing Face of Microfinance in India.”
Intellecap, Mumbai, India. Available on the Web site of MicroSave India, http://india.microsave.org/node/1393. Accessed July 2009.
Kothari, Vinod. n.d. “Indian Leasing: Major Components.” Online article available at
http://www.geocities.com/WallStreet/Exchange/8413/indo2.html. Accessed August 2009.
Microfinance Insights [Intellecap, Mumbai, India] 4. September/October 2007. Mix Market. 2006. Performance and Transparency: A Survey of Micro Finance in South Asia. Mix
Market, Washington, DC. As cited in CMF/IMFR, 2006, “Micro Finance in India.” NABARD. 2007. “Annual Report, 2006–07.” NABARD, New Delhi, India. NPM (Netherlands Platform for Microfinance). 2007. “Status Report: Microfinance in
India.” NPM, Bunnik, The Netherlands. http://www.microfinance.nl/ Documents/status%20report%20mf%20sector%20india%20incl%20lsijtsma%20final.pdf. Accessed August 2009.
OECD. 2007. “Policy Brief: Survey of India.” OECD, Paris. Pandey, Adya Prasad. 2007. “Indian SMEs and their Uniqueness in the Country.”
Unpublished paper. MPRA (Munich Personal RePEC Archives), Munich University Library. http://mpra.ub.uni-muenchen.de/6086. Accessed July 2009.

42
Puhazhendi, V., and K.C. Badatya. 2002. “SHG-Bank Linkage Programme for the Rural Poor: An Impact Assessment.” Paper presented at an SHG-Bank Linkage Programme seminar, New Delhi.
Radcliffe, Daniel, and Rati Tripathi. 2006. “Sharpening the Debate—Assessing the Key
Constraints in Indian Micro Credit Regulation.” Working Paper Series, Draft (November 2006). IFMR, Chennai, India.
Ramakrishnan, V. 2001. “Features—Guide to Indian Laws.” Chennai, India. Available on
the Web site of LLRX.com, http://www.llrx.com/features/indian.htm. Accessed July 2009.
RBI (Reserve Bank of India). n.d. “Country Macroeconomic Data.” RBI, Mumbai, India.
http://rbidocs.rbi.org.in/rdocs/PublicationReport/Pdfs/72262.pdf. Accessed August 2009.
———. 2007. “Annual Report 2007.” RBI, Mumbai, India. ———. 2007. “Operations and Performance of Commercial Banks.” Part 1 of 3 (November
27). RBI, Mumbai, India. http://www.rbi.org.in/SCRIPTs/PublicationsView. aspx?id=9811. Accessed August 2009.
———. 2007. “Report on Trend and Progress in Banking in India, 2006–2007.” RBI,
Mumbai, India. ———. 2007. “Statistical Tables Relating to Banks in India, 2006–2007.” RBI, Mumbai,
India. ———. 2005. “Foreign Exchange Act of India” (August 1). Foreign Exchange Department,
RBI, Mumbai, India. http://www.femaonline.com/fema/circular/newapcircular 2005-2006/1_august_2005_cirno_5.htm. Accessed August 2009.
Sa-Dhan. 2008. “Quick Review 2007/08” (April 2008 Draft). Sa-Dahn, New Delhi, India. ———. 2007. “Side by Side: Maturing Microfinance, Emerging Challenges.” Sa-Dahn, New
Delhi, India. Sa-Dahn and M-CRIL (Micro-Credit Ratings International Limited). 2006. “Existing Legal
and Regulatory Framework for the Microfinance Institutions in India: Challenges and Implications.” 2006 edition. Sa-Dahn, New Delhi, India. http://www.sa-dhan.net/Adls/Microfinance/Article/Publications/ExistingLegalRegulatoryFramework.pdf. Accessed August 2009.
Swibel, Matthew. 2007. “The World’s Top 50 Microfinance Institutions.” Forbes.com
(online magazine). December 20, 2007. http://www.forbes.com/2007/12/20/ top-philanthropy-microfinance-biz-cz_1220land.html. Accessed July 2009.

43
Transparency International. 2007. Global Corruption Report 2007. Berlin: Transparency International. http://www.transparency.org/publications/gcr/gcr_2007#download. Accessed August 2009.
World Bank. 2008. Migration and Remittances Factbook 2008. Washington, DC: World Bank. ———. 2006. “Microfinance in South Asia—Toward Financial Inclusion for the Poor.”
World Bank, Washington, DC.