india market trading opportunities & considerations market ‐trading opportunities &...
TRANSCRIPT
Slide - 1
This presentation is intended solely for the recipient and should not be replicated in any form or manner electronic or otherwiseThis presentation is intended solely for the recipient and should not be replicated in any form or manner electronic or otherwise
India market ‐ Trading opportunities &
considerations
By:
Manish Jalan
Director, Samssara Capital Technologies LLP (www.samssara.com)

Slide - 2
This presentation is intended solely for the recipient and should not be replicated in any form or manner electronic or otherwise
Introduction - where to focus in Indian equity trading?

Slide - 3
This presentation is intended solely for the recipient and should not be replicated in any form or manner electronic or otherwise
Players are becoming more receptive to computer based trading
Large brokers like Edelweiss, Religare, Motilal Oswal, Quant etc. are investing
heavily in technology infrastructure
SEBI, Exchanges and Government becoming more receptive to automated trading
and DMA/DSA
Co-location and latency of trades are becoming buzz-words
Traditional bread-and-butter strategy like cash-future arbitrage is eaten away by
computer programs
Indian software makers like Falcon, Omnesys, FT etc. are very aggressively
providing trading solutions
The changing structure - receptiveness to quant & algo trading

Slide - 4
This presentation is intended solely for the recipient and should not be replicated in any form or manner electronic or otherwise
The prop trading – catching with developed markets
Manual BSE-NSE Arb
Manual Cash-Future Arb
Index Arb - Pure
Present
Multi-Exchange High Frequency Arb
Multi-Exchange automated cash future
Arb
Risk-based Index Arb
Future
Pair Trading Technicals
Tend Following – Technicals
Fundamentals on Equity Research
Pair Trading on Statistical and Advanced
Algos
Trend Following on Multi-Statistical
Factors
Factor Modelling
Pair Trading on Baskets

Slide - 5
This presentation is intended solely for the recipient and should not be replicated in any form or manner electronic or otherwise
Traded on BSE and NSE
The turnover has stayed constant over last 4 years
Expected to stay constant unless STT cost is abolished or large FII buying kicks in (Bull market)
Most domestic players involved in cash-future arbitrage (Mostly on NSE)
Efficiency of arbitrage improves with co-location
Short-selling in cash allowed only on Intra-day trading (stock borrowing still not wide spread)
Stock borrowing and shorting is restricted for FII
Source: Celent Research
Cash Equity – turnover stays flat

Slide - 6
This presentation is intended solely for the recipient and should not be replicated in any form or manner electronic or otherwise
Total number of listed stocks = 3,756
Focus on Large and Mid-cap stocks for most form of trading strategy
Top 210 names in India for statistical arbitrage
Large cap, mid cap and small cap listed companies in India
Large Cap Mid Cap Small Cap
Market cap filter >= USD 10 billion>= USD 1 billion and
< USD10 billion< USD 1 billion
# of companies 29 126 177
Average daily
turnover (USD
Million)
64 8.6 0.72
Average daily
turnover per stock
(INR billion)
1.86 0.41 0.02
Source: Bloomberg
Large, Mid and Small caps in India – where to focus?

Slide - 7
This presentation is intended solely for the recipient and should not be replicated in any form or manner electronic or otherwise
Most common is ADR to BSE-NSE cash arbitrage
2-way fungibility or conversion of shares are allowed
Carries overnight directional risk and dollar-rupee risk
Most common with FII / I-Banks having desks in US and India
Not dominant with domestic players due to off-shore entity registration, currency risk, dollar
erosion etc
ADR/ GDR/ IDR statistics
ADR GDR IDR
# of companies 15 205 01
# of issues 42 389 01
Total Average daily volume (million) 10.2 1.0 0.55
Average daily volume per stock (million) 0.30 0.02 0.55
Total average daily turnover USD 317.1 million USD 83.0 million INR 65.0 million
Average daily turnover per stock USD 9.3 million USD 1.2 million INR 65.0 million
Source: Bloomberg
ADR/GDR/IDR Statistics – good opportunity for offshore entity

Slide - 8
This presentation is intended solely for the recipient and should not be replicated in any form or manner electronic or otherwise
Newer opportunities in trading in India :
The emerging exchanges and instruments

Slide - 9
This presentation is intended solely for the recipient and should not be replicated in any form or manner electronic or otherwise
New exchanges – opens more window to domestic players
Indian market maturing by opening to commodities, interest rates and currency
futures trading
Immense opportunity in market making and cross exchange arbitrage in all the
new exchanges
Cost of trading extremely low as STT don‟t exist in these instruments
E.g.: Total exchange cost of trading in MCX is 0.3 BP, which gets reduced further
with volumes
High-frequency trading opportunity is more on commodities and currency futures in
India
Heavy market making and high frequency fair price discovery becoming prevalent

Slide - 10
This presentation is intended solely for the recipient and should not be replicated in any form or manner electronic or otherwise
*Annualized based on 8 months data (Apr – Nov)
Source: MCX
2 10
23 31
46
64
91
-
50
100
150
200
250
300
350
-
20
40
60
80
100
2004/05 2005/06 2006/07 2007/08 2008/09 2009/10 2010/11*
INR
bilio
n
INR
tri
llio
n
Turnover (left axis) Average daily turnover (right axis)
MCX – commodities exchange of India
6th largest amongst global commodity futures exchanges by volume
• #1 in Silver
• #2 in Gold Copper and Natural Gas
• #3 in Aluminum, Zinc and Crude Oil
One of the fastest growing commodities exchanges in the world
40 commodities across various segments such as bullion, metals, agriculture and energy products
Tremendous growth in turnover due to heavy arbitrage between CME/LME and MCX
Cross exchange arbitrage between NCDEX and MCX

Slide - 11
This presentation is intended solely for the recipient and should not be replicated in any form or manner electronic or otherwise
2.7
10.911.7
7.8
5.3
9.2
10.9
-
5
10
15
20
25
30
35
40
-
2
4
6
8
10
12
14
2004/05 2005/06 2006/07 2007/08 2008/09 2009/10 2010/11*
INR
bil
ion
INR
tri
llio
n
Turnover (left axis) Average daily turnover (right axis)
*Annualized based on 8 months data (Apr – Nov)
Source: NCDEX
NCDEX – agri commodity exchange
Most active in the agricultural commodity space
Trades totally 59 commodities - comprising 39 agricultural commodities
High expiry and delivery risks exists in agri commodities
Not very popular with arbitrageurs and market makers
Slide - 12
This presentation is intended solely for the recipient and should not be replicated in any form or manner electronic or otherwise
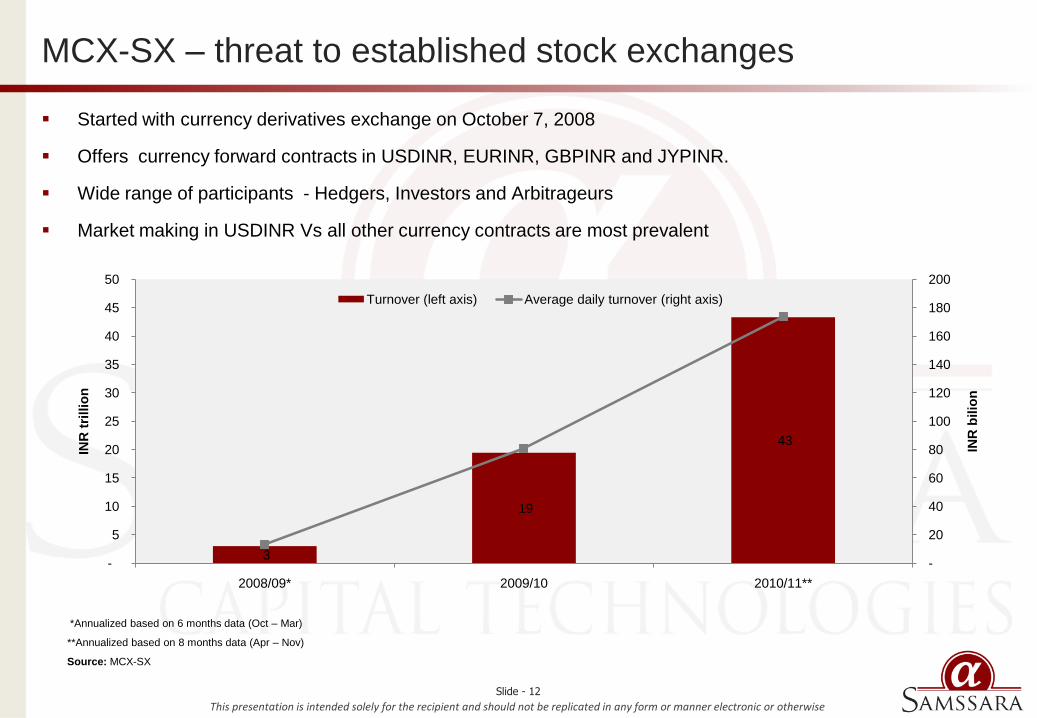
*Annualized based on 6 months data (Oct – Mar)
**Annualized based on 8 months data (Apr – Nov)
Source: MCX-SX
3
19
43
-
20
40
60
80
100
120
140
160
180
200
-
5
10
15
20
25
30
35
40
45
50
2008/09* 2009/10 2010/11**
INR
bilio
n
INR
tri
llio
n
Turnover (left axis) Average daily turnover (right axis)
MCX-SX – threat to established stock exchanges
Started with currency derivatives exchange on October 7, 2008
Offers currency forward contracts in USDINR, EURINR, GBPINR and JYPINR.
Wide range of participants - Hedgers, Investors and Arbitrageurs
Market making in USDINR Vs all other currency contracts are most prevalent

Slide - 13
This presentation is intended solely for the recipient and should not be replicated in any form or manner electronic or otherwise
Source: United Stock Exchange, Secondary Research
USE, 15%
NSE, 37%
MCX-SX, 48%
Market Share- Nov 1st to Nov 11th
455
41 0%
10%
20%
30%
40%
50%
60%
-
100
200
300
400
500
20100901 20101001 20101101
%
INR
bil
lio
n
Turnover (left axis) Market Share (right axis)
United Stock Exchange (USE) – the currency exchange
Trading in currency futures and currency options
12 futures contracts in 4 currency pairs – USDINR, EURINR, GBPINR and JPYINR
USD-INR currency options contract.
Cash settled (no physical delivery) in INR at RBI reference rate.

Slide - 14
This presentation is intended solely for the recipient and should not be replicated in any form or manner electronic or otherwise
*Estimated based on 5 months data
** # of trading days on the basis of Nifty trading days in India
Source: SGX
SGX Nifty
FY 2010 (Jun‟09 – Jun‟10) FY 2011*
Volume 8,748,924 4,659,640
Average daily volume** 35,278 43,548
SGX Nifty – pure arbitrage opportunity
Contract size: USD 2* contract price
Position limit: 25,000 net long or short
Dollar denominated
Contract : 2 nearest months and 4 quarterly contracts
Short term arbitrage opportunity from the short-term price difference between CME Nifty and SGX Nifty
Can be traded to hedge risk from existing exposure to the Indian stock market
No STT cots on SGX Nifty futures and hence preferred by arbitrageurs
Dollar erosion of the domestic player and difficulty to park money offshore – hence arbitrage exists
Average daily turnover: 350 Mn. USD – 500 Mn. USD

Slide - 15
This presentation is intended solely for the recipient and should not be replicated in any form or manner electronic or otherwise
*# of trading days between Jul 19, 1010 to Nov 30, 2010 (and not since beginning of 2010
** Based on average nifty index value for every month
Source: CME
SGX Nifty
E-MINI E-MICRO
Volume 5,757 135,592
Average daily volume* 61 1,442
Turnover (USD million)** 326 1,549
Average daily turnover** 3.5 16.5
CME Nifty Futures – nifty futures goes global
E-mini and E-micro S&P CNX Nifty Futures
Waived CME Globex and CME Clearing fees through Dec 31, 2010 for all market participants
Block trade eligibility for both contracts
Mutual Offset System (MOS) Eligibility for E-micro S&P CNX Nifty Futures with SGX
Dedicated market makers to help generate initial liquidity and two sided markets
Contract size: E-mini (USD 10* Index) and E-micro (USD 2* Index)
Short term arbitrage opportunity from the short-term price difference between CME Nifty and SGX Nifty
Can be traded to hedge risk from existing exposure to the Indian stock market
Significant turnover as compared to other international indices trading at CME

Slide - 16
This presentation is intended solely for the recipient and should not be replicated in any form or manner electronic or otherwise
Electronic Trading in India

Slide - 17
This presentation is intended solely for the recipient and should not be replicated in any form or manner electronic or otherwise
Source: Celent Research
0%
5%
10%
15%
20%
25%
30%
35%
2003 2006 2009 2010 2012
Electronic Trading in Retail Equity Market (%)
0%
5%
10%
15%
20%
25%
30%
35%
40%
2008 2009 2010 2011 2012 2015
Share of DMA in Institutional Equities (%)
Electronic Trading in India - in early adoption phase
DMA rapidly growing among institutional investors
FIIs and DIIs especially large MFs driving change in the DMA acceptance.
E.g.: Goldman Sachs‟ equities electronic trading volume tripled, while for futures grew more than fourfold in 2009
Restrictions on „direct DMA‟
Tier II brokers in process of adopting technology/ Still evaluating cost-benefit analysis
Cost of DMA is at 5-8 BP in India as compared to developed markets at 1-2 BP
Big bottlenecks is absence of data such as market tick data, market depth information (5th level onwards)
Dominant players: Goldman Sachs Merrill Lynch, Oppenheimer, J.P. Morgan, Morgan Stanley, Grindlays, Standard
Chartered, HSBC

Slide - 18
This presentation is intended solely for the recipient and should not be replicated in any form or manner electronic or otherwise
2015-2016: Fully realized HFT at around 30% of volumes similar tointernational markets
2013-2016: Dark Pools and internalization. Difficult due to regulations andcould see delayed implementation
2010-2015: ATS, PTS which are slow to develop due to exchangeconcentration and regulations
2009-2010: DMA and DSA Evolution
2010-2012: Execution Algorithms on VWAP, TWAP as Co-location and DMAare introduced
2009-2010: Connectivity improves with SOR, exchanges offering co-location, brokers adding multiple connections
Source: Celent Research
The growth projection of electronic trading in India

Slide - 19
This presentation is intended solely for the recipient and should not be replicated in any form or manner electronic or otherwise
Market Data – always a bottle-neck
NSE provides bucketed 1 sec. data to members of exchange at USD 1200 for 1 Year
NSE has tick by tick data from 1999 and is available to corporate and members at USD 1200
per year of data
Co-located entities are not allowed to sell the daily stored tick data
Tick by tick data is stored in-house by most domestic brokers and are not easily available
• Other popular sources
• Reuters
• eSignal
• CQG Inc.

Slide - 20
This presentation is intended solely for the recipient and should not be replicated in any form or manner electronic or otherwise
Selected trading strategies in Indian market

Slide - 21
This presentation is intended solely for the recipient and should not be replicated in any form or manner electronic or otherwise
BSE-NSE Arbitrage – selected opportunity still exists
Mostly intra-day as shorted cash cannot be carried to next day
Traded on stocks with absolute rupee value >= 20 Rs. (Minimum gross profit of 25 BP is
targeted at 0.05 Rs. spread)
Positions are individually un winded in both the exchanges
Mostly in mid-caps and small-caps where BSE has more liquidity in cash
Triggered by large value buy in one exchange or limit high/low prices
Calculation of equilibrium prices is also considered
Commonly used software: Falcon and Omnesys
Other common cross-exchange arbitrage in India
• Base and precious metals in MCX and NCDEX
• USDINR in USE, NSE and MCX-SX

Slide - 22
This presentation is intended solely for the recipient and should not be replicated in any form or manner electronic or otherwise
Cash-Future arbitrage – speed becomes the key
Most common is single stock cash to single stock futures
Cash and carry is more favorable trading technique
Reverse cash and carry is not favorable as stocks cannot be shorted and carried
Future at discount to cash: Can be arbitraged intra-day
Huge volatility in the cash market in the last 30 min to expiry
Brokers using co-located servers to take faster advantage of mis-pricing
Advantage now is of speed as all of cash-future is automated
Manual execution in cash-future arbitrage yields less then the cost of funding

Slide - 23
This presentation is intended solely for the recipient and should not be replicated in any form or manner electronic or otherwise
3
12 12
40
60
40
3 3
40
24
84
60 60
12
24
180
12
24
12 12
3 3
0
20
40
60
80
100
120
140
160
180
200
Agriculture
Auto
-2 W
heele
r
Auto
-4 W
heele
r
Private
Banks
Public
Banks
Cem
ent
Housin
g F
inance
Industr
ial F
inance
Pow
er
Machin
ery
Infr
astr
uctu
re
Ste
el
Oil
& G
as
Pharm
aceuticals
Real E
sta
te
Soft
ware
Sugar
Tele
com
FM
CG
Non M
eta
ls
Ship
pin
g
Bro
kers
Num Of Stocks Num Of Single Pairs Num Of Baskets
Single stock pairs and baskets across sectors in India

Slide - 24
This presentation is intended solely for the recipient and should not be replicated in any form or manner electronic or otherwise
0
1
2
3
4
5
6
-0.05%
0.00%
0.05%
0.10%
0.15%
0.20%
0.25%
0.30%
15 min 30 min 60 min
STT Cost (LHS) Gross Return Per Trade (LHS) Net Return Per Trade (LHS) Avg Holding Period (hrs) (RHS)
High frequency stat-arb - comparison of time period
Slide - 25
This presentation is intended solely for the recipient and should not be replicated in any form or manner electronic or otherwise
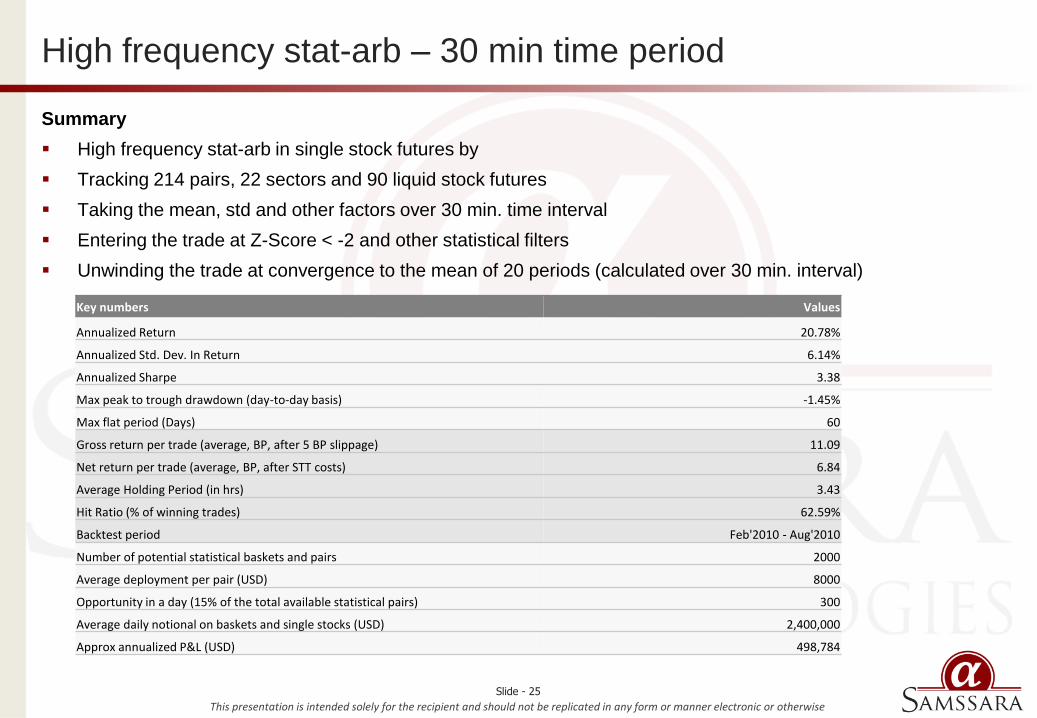
Key numbers Values
Annualized Return 20.78%
Annualized Std. Dev. In Return 6.14%
Annualized Sharpe 3.38
Max peak to trough drawdown (day-to-day basis) -1.45%
Max flat period (Days) 60
Gross return per trade (average, BP, after 5 BP slippage) 11.09
Net return per trade (average, BP, after STT costs) 6.84
Average Holding Period (in hrs) 3.43
Hit Ratio (% of winning trades) 62.59%
Backtest period Feb'2010 - Aug'2010
Number of potential statistical baskets and pairs 2000
Average deployment per pair (USD) 8000
Opportunity in a day (15% of the total available statistical pairs) 300
Average daily notional on baskets and single stocks (USD) 2,400,000
Approx annualized P&L (USD) 498,784
High frequency stat-arb – 30 min time period
Summary
High frequency stat-arb in single stock futures by
Tracking 214 pairs, 22 sectors and 90 liquid stock futures
Taking the mean, std and other factors over 30 min. time interval
Entering the trade at Z-Score < -2 and other statistical filters
Unwinding the trade at convergence to the mean of 20 periods (calculated over 30 min. interval)

Slide - 26
This presentation is intended solely for the recipient and should not be replicated in any form or manner electronic or otherwise
-2%
0%
2%
4%
6%
8%
10%
12%
20100206 20100306 20100406 20100506 20100606 20100706 20100806
Retu
rn in %
Return on gross exposure on 30 Min. basis
Equity curve of high freq stat-arb on 30 min. time period

Slide - 27
This presentation is intended solely for the recipient and should not be replicated in any form or manner electronic or otherwise
Key numbers Values
Annualized Return 11.13%
Annualized Std. Dev. In Return 4.85%
Annualized Sharpe 2.29
Max peak to trough drawdown (day-to-day basis) -2.40%
Max flat period (Days) 65
Gross return per trade (average, BP, after 5 BP slippage) 23.06
Net return per trade (average, BP, after STT costs) 18.81
Average Holding Period (in hrs) 12.37
Hit Ratio (% of winning trades) 69.34%
Backtest period Feb'2010 - Aug'2010
Number of potential statistical baskets and pairs 2000
Average deployment per pair (USD) 8000
Opportunity in a day (10% of the total available statistical pairs) 200
Average daily notional on baskets and single stocks (USD) 6,400,000
Approx annualized P&L (USD) 712,068
High frequency stat-arb – 60 min time period
Summary
High frequency stat-arb in single stock futures by
Tracking 214 pairs, 22 sectors and 90 liquid stock futures
Taking the mean, std and other factors over 60 min. time interval
Entering the trade at Z-Score < -2 and other statistical filters
Unwinding the trade at convergence to the mean of 20 periods (calculated over 60 min. interval)

Slide - 28
This presentation is intended solely for the recipient and should not be replicated in any form or manner electronic or otherwise
-1%
0%
1%
2%
3%
4%
5%
6%
7%
20100215 20100315 20100415 20100515 20100615 20100715 20100815
Retu
rn in %
Return on gross exposure on 60 Min. basis
Equity curve of high freq stat-arb on 60 min. time period

Slide - 29
This presentation is intended solely for the recipient and should not be replicated in any form or manner electronic or otherwise
Key numbers0 Values
Annualized Return 15.26%
Annualized Std. Dev. In Return 7.09%
Annualized Sharpe 2.15
Max peak to trough drawdown (day-to-day basis) -3.50%
Max flat period (Days) 125
Gross return per trade (average, %, after 15 BP slippage) 1.50
Net return per trade (average, %, after STT costs) 1.46
Average Holding Period (in days) 11.45
Hit Ratio (% of winning trades) 74.40%
Backtest period Mar'2007-Mar'2010
Number of potential statistical baskets and pairs 2,000
Average deployment per pair (USD) 20,000
Opportunity in a day (5% of the total available statistical pairs) 100
Average daily notional on baskets and single stocks (USD) 22,000,000
Approx annualized P&L (USD) 3,357,553
Medium frequency stat-arb on daily time period
Summary
Medium frequency stat-arb in baskets of stock futures by
Tracking 684 pairs, 22 sectors and 108 liquid stock futures
Taking the mean, std and other factors over daily time interval
Entering the trade at Z-Score < -2 and other statistical filters
Unwinding the trade at convergence to the mean of 20 periods (calculated over daily interval)

Slide - 30
This presentation is intended solely for the recipient and should not be replicated in any form or manner electronic or otherwise
0.00
0.02
0.04
0.06
0.08
0.10
0.12
15-Nov-10 20-Nov-10 25-Nov-10 30-Nov-10 05-Dec-10 10-Dec-10
Long Basket: JP Associates(50%), Punj Lloyd (50%)Short Basket: GMR Infra (33%), HCC (33%), L&T (33%)
Spread Mean of Spread
Entry
Exit
E.g.: Basket trading in medium frequency
Slide - 31
This presentation is intended solely for the recipient and should not be replicated in any form or manner electronic or otherwise
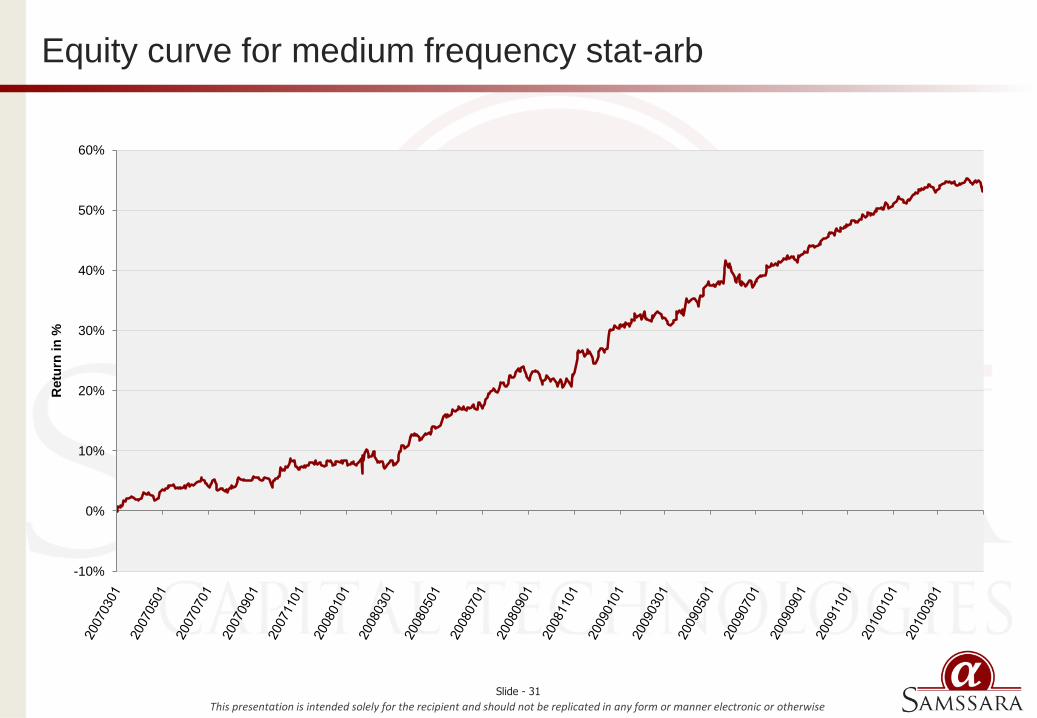
-10%
0%
10%
20%
30%
40%
50%
60%
Retu
rn in
%Equity curve for medium frequency stat-arb

Slide - 32
This presentation is intended solely for the recipient and should not be replicated in any form or manner electronic or otherwise
Key numbers Values
Annualized Return 3.80%
Annualized Std. Dev. In Return 3.87%
Annualized Sharpe 0.98
Max peak to trough drawdown (day-to-day basis) -3.90%
Max flat period (Days) 500
Gross return per trade (average, BP, after 5 BP slippage) 0.34
Net return per trade (average, BP, after STT costs) 0.30
Average Holding Period (in days) 11.64
Hit Ratio (% of winning trades) 72.12%
Backtest period Jan'2007-May'2010
Number of potential statistical baskets and pairs 100
Average deployment per pair (USD) 40000
Opportunity in a day (10% of the total available statistical pairs) 10
Average daily notional on baskets and single stocks (USD) 4,400,000
Approx annualized P&L (USD) 167,365
Synthetic Index-arb on daily time period
Summary
Medium frequency Index-arb on synthetic baskets vs Nifty futures by
Creating synthetic baskets by taking 10 stocks in Nifty50 and their weights as per sector weights in Nifty50
Taking long positions on the cash baskets and shorting Nifty futures
Taking the mean, std and other factors over daily time interval
Entering the trade at Z-Score < -2 and other statistical filters
Unwinding the trade at convergence to the mean of 20 periods (calculated over daily interval)

Slide - 33
This presentation is intended solely for the recipient and should not be replicated in any form or manner electronic or otherwise
-2%
0%
2%
4%
6%
8%
10%
12%
14%
Retu
rn in %
Return on gross exposure on daily basis
Synthetic Index arbitrage equity curve

Slide - 34
This presentation is intended solely for the recipient and should not be replicated in any form or manner electronic or otherwise
Key numbers Values
Annualized Return 40.91%
Annualized Std. Dev. In Return 18.26%
Annualized Sharpe 2.24
Max peak to trough drawdown (day-to-day basis) -24.00%
Max flat period (Days) 180
Gross return per trade (average, %, after 5 BP slippage) 0.19
Net return per trade (average, %, after STT costs) 0.17
Average Holding Period (in days) 1.00
Hit Ratio (% of winning trades) 54.14%
Backtest period Mar'2006-Mar'2010
Number of potential single stocks 10
Average deployment per stock (USD) 40,000
Opportunity in a day (80% of stocks in the universe) 8
Average daily notional on baskets and single stocks (USD) 320,000
Approx annualized P&L (USD) 130,925
BTST-STBT Strategy on Nifty50
Summary
BTST-STBT strategy on Nifty50 traded by
Taking all positions and unwinding in last 30 min. of trading session in Indian markets
Going long the top 10% outperforming and shorting the bottom 10% underperforming stocks
Eliminating low probability trades using statistical filters and hence strategy is not 100% delta natural
Unwinding the trades on next day in the last 30 min of the trading session and re-entering fresh trades

Slide - 35
This presentation is intended solely for the recipient and should not be replicated in any form or manner electronic or otherwise
-10%
10%
30%
50%
70%
90%
110%
130%
150%
170%
190%
Retu
rn in %
Return on gross exposure on daily basis
Equity curve for BTST-STBT on Nifty50

Slide - 36
This presentation is intended solely for the recipient and should not be replicated in any form or manner electronic or otherwise
Key numbers Values
Annualized Return 24.44%
Annualized Std. Dev. In Return 4.65%
Annualized Sharpe 5.26
Max peak to trough drawdown (day-to-day basis) -0.45%
Max flat period (Days) 15
Gross return per trade (average, BP, after 5 BP slippage) 15.39
Net return per trade (average, BP, after STT costs) 11.14
Average Holding Period (in hrs) 3.00
Hit Ratio (% of winning trades) 58.45%
Backtest period Jul'2010 - Aug'2010
Number of potential statistical baskets and pairs 10
Average deployment per pair (USD) 40000
Opportunity in a day (80% of stocks in the universe) 8
Average daily notional on baskets and single stocks (USD) 320,000
Approx annualized P&L (USD) 78,205
Intraday momentum strategy
Summary
Intraday momentum strategy on Nifty50 stocks by
Capturing the one-sided momentum in single stocks in the market post morning session
Taking positions in the stocks between 12:00 PM -1:00 PM and unwinding between 3:00 PM – 3:30 PM
Going long the top 10% outperforming and shorting the bottom 10% underperforming stocks in Nifty50
Eliminating low probability trades using statistical filters and hence strategy is not 100% delta natural

Slide - 37
This presentation is intended solely for the recipient and should not be replicated in any form or manner electronic or otherwise
0.00%
0.50%
1.00%
1.50%
2.00%
2.50%
3.00%
Retu
rn in %
Return on gross exposure on daily basis
Intraday momentum in Nifty50 stocks

Slide - 38
This presentation is intended solely for the recipient and should not be replicated in any form or manner electronic or otherwise
Strategy Risk SharpeReturn
p.a.
Conservative estimate on
annualized profitability (USD)
High freq stat-arb in 30 min.
time period
• Increased competition
• High Intra-day momentum
• Single stock events
3.38 20.78% 498,784
High freq stat-arb in 60 min.
time period
• High daily momentum in the market
• Overnight single stock events2.29
11.13%712,068
Medium frequency stat-arb
on daily time period
• High monthly momentum in the market
• Overnight single stock events
• Sector concentration
2.15 15.25% 3,357,553
Medium frequency synthetic
Index-arb on daily time
period
• Single stock events
• Very competitive
• Risk of too many players holding similar
positions
0.98 4% 167,365
BTST-STBT strategy on
Nifty50
• Net delta overnight risk
• Single stock news during market hours
• Large peak to trough draw-down
2.24 40.91% 130,925
Intraday high-frequency
momentum on Nifty50
• Net delta risk for 2.5 hrs of stock holdings
• Single stock news during market hours
• Market driven by news in opposite direction
5.26 24.44% 78,205
Summary of all strategies – the huge potential

Slide - 39
This presentation is intended solely for the recipient and should not be replicated in any form or manner electronic or otherwise
A note on the strategies – execution methods are the key
Capture “breadth” not “depth”
Signals and noise exists in Indian market for longer period of time
Calculate slippage w.r.t . to the LTP / mid-price before executing market orders
Consider order book depth – as tighter spreads exists in only the most liquid 30 stocks
Execute pure arbitrage strategies with low-latency infrastructure
High frequency trading strategies: Index Options, Commodities, Currency futures
Medium to Low frequency strategies: Equities (Most liquid 215 names)

Slide - 40
This presentation is intended solely for the recipient and should not be replicated in any form or manner electronic or otherwise
Agency execution in Indian market

Slide - 41
This presentation is intended solely for the recipient and should not be replicated in any form or manner electronic or otherwise
0.00%
0.50%
1.00%
1.50%
2.00%
2.50%
3.00%
3.50%
4.00%
4.50%
Time NSE
MktCurve - NSE
VWAP-TWAP strategies – no standard benchmarks domestically
No standard bench marks on VWAP/TWAP slippages published
General norm is an average slippage of 4-5 BP with Std. Dev. of 20 BP
Most VWAP orders are sent for beating last 30 min. VWAP price (MoC price)
Tier 1 brokers domestically focusing on TWAP E.g.: Orion from Edelweiss
Most VWAP strategies restricted to top 30 liquid stocks

Slide - 42
This presentation is intended solely for the recipient and should not be replicated in any form or manner electronic or otherwise
Liquidity and Scalability of strategies

Slide - 43
This presentation is intended solely for the recipient and should not be replicated in any form or manner electronic or otherwise
Source: Celent Research
Scalability in Indian market – no depth huge breadth
Approximate Scales of statistical arbitrage strategies in Indian market
Intraday stock futures statistical arbitrage: Turnover of USD 5 Mn. – USD 10 Mn.
Short term holding of 1 to 2 days: 3 – 5 Mn. USD notional value
Medium term holding of 5 to 10 days: 5 Mn. To 25 Mn. USD
Longer term holding of 10 days to 1 month: 25 Mn. USD to 75 Mn. USD
Monthly re-balance and factor model: 100+ Mn. USD
The Liquidity scale
Strategies have to be modified to have larger value allocation to
Top 30 liquid stock futures (Turnover of > USD 20 Mn. Per Day)
Thereafter, 30 – 100 stock futures (Turnover of USD 5-20 Mn. Per Day)
Lastly, 100-200 stock futures (Turnover of USD 1-5 Mn. Per Day . Can be avoided too)
Huge opportunity in trading intra-day options: Extremely liquid and is driven by large movements in
premiums

Slide - 44
This presentation is intended solely for the recipient and should not be replicated in any form or manner electronic or otherwise
Index Futures
Average daily
volumeContract size Contract Value
Average daily
turnover (million)Currency
Nifty Index
Near 489,350 50 294,848 144,283.6 INR
Next 19,416 50 296,113 5,749.4 INR
Far 1,025 50 297,340 304.9 INR
SGX S&P CNX Nifty
Near 23,042 2 11,798 271.9 USD
Next 27 2 11,830 0.3 USD
Far na 2 12,005 na USD
CNXBANK Index
Near 81,124 25 282,825 22,944.0 INR
Next 1,478 25 284,000 419.9 INR
Far 25 25 283,750 7.2 INR
Liquidity in near, next and far month (1/2)

Slide - 45
This presentation is intended solely for the recipient and should not be replicated in any form or manner electronic or otherwise
Stock Futures
Near Next Far
Average daily # of contracts 723,245 154,415 1,669
Average daily # of contracts per futures 3,243 692 8
Weighted average daily # of contracts per futures 2,544 594 7
Average daily turnover (INR million) 199,770 43,253 462
Average daily turnover per futures (INR million) 896 194 2
Liquidity in near, next and far month (2/2)

Slide - 46
This presentation is intended solely for the recipient and should not be replicated in any form or manner electronic or otherwise
0
10
20
30
40
50
60
70
0 200 400 600 800 1,000 1,200 1,400 1,600 1,800 2,000
Spre
ad in B
P
Average turnover (in INR million)
Average Turnover < INR 2,000 million
Spread <70 BP
Spread in BP in top 200 stocks – lowest in Asia Pac

Slide - 47
This presentation is intended solely for the recipient and should not be replicated in any form or manner electronic or otherwise
Source: NSE
0
5
10
15
20
25
30
35
Apr 05
Jun 05
Aug 05
Oct 05
Dec 05
Feb 06
Apr 06
Jun 06
Aug 06
Oct 06
Dec 06
Feb 07
Apr 07
Jun 07
Aug 07
Oct 07
Dec 07
Feb 08
Apr 08
Jun 08
Aug 08
Oct 08
Dec 08
Feb 09
Apr 09
Jun 09
Aug 09
Oct 09
Dec 09
Feb 10
Apr 10
Jun 10
Aug 10
Oct 10
INR
tri
llio
n
NSE Equity Derivatives: Turnover
Equity Derivatives – the driver to most trading strategies
Traded mainly on NSE; Volume/ Turnover on BSE is very small
Nifty Index Options and Index Futures are among top 10 index derivatives worldwide
Size of derivatives market is 5 times the cash market in India
Popular because derivatives have provisions for leverage and short-selling as opposed to
cash equities

Slide - 48
This presentation is intended solely for the recipient and should not be replicated in any form or manner electronic or otherwise
Source: NSE
0
4
8
12
16
20
Apr 05
Jun 05
Aug 05
Oct 05
Dec 05
Feb 06
Apr 06
Jun 06
Aug 06
Oct 06
Dec 06
Feb 07
Apr 07
Jun 07
Aug 07
Oct 07
Dec 07
Feb 08
Apr 08
Jun 08
Aug 08
Oct 08
Dec 08
Feb 09
Apr 09
Jun 09
Aug 09
Oct 09
Dec 09
Feb 10
Apr 10
Jun 10
Aug 10
Oct 10
INR
tri
llio
n
Companison of Equity Derivatives Turnover on NSE
Index Futures Stock Futures Index Options Stock Options
Derivatives in India – all focus on Index options
Growth in Index options in the last 2 years has out-spaced all other derivatives segment in India
Growth attributed to large funds hedging using options
STT cost in options applicable on the premium value – not on notional (High-frequency
advantage)
Single day large movements of several 100% on the premium due to large intra-day volatility

Slide - 49
This presentation is intended solely for the recipient and should not be replicated in any form or manner electronic or otherwise
Source: Celent Research
Commodity Derivatives – the steadily rising opportunity
Traded mainly on MCX and NCDEX
MCX has 6 contracts in top 20 metal futures and options contracts globally (E.g.: Gold and Silver)
2 contracts in top 20 energy futures and options contracts (Crude and NG)
FII not allowed to trade in Indian commodity markets directly
Focus: CME/LME lead-lag effects (One leg high-frequency arb), Short term trend followings
Pure arbitrage between CME/LME and MCX is illegal in India

Slide - 50
This presentation is intended solely for the recipient and should not be replicated in any form or manner electronic or otherwise
Source: Celent Research
Currency Futures – the steadily rising opportunity
Currency futures were introduced in NSE and MCX-SX in August and October 2008.
Introduced in USE in September 2010.
USDINR futures contract on NSE and MCX-SX are the top 2 forex futures contracts globally
Contracts are cash settled
FII still not allowed to trade the currency futures directly
Most activity in market making between USDEUR, USDJPY, USDGBP Vs USDINR
Market is driven largely by intra-day activity

Slide - 51
This presentation is intended solely for the recipient and should not be replicated in any form or manner electronic or otherwise
Source: Celent Research
Interest Rate Futures – tightly regulated
Interest rate swaps and forward rate agreements introduced in 1999
IRS attracted significant liquidity
Turnover in interest rate futures at very low level
RBI in discussions with market participants to try and revive the market

Slide - 52
This presentation is intended solely for the recipient and should not be replicated in any form or manner electronic or otherwise
The cost of trading

Slide - 53
This presentation is intended solely for the recipient and should not be replicated in any form or manner electronic or otherwise
STT Cost in BP
Equity-Delivery Purchase 12.50 Turnover
Sell 12.50 Turnover
Equity-IntradayPurchase -
Sell 2.50 Turnover
Future Purchase -
Sell 1.70 Turnover
OptionPurchase 12.50 Settlement price, on exercise
Sell 1.70 Premium
Transaction Charges in BP
Equity-Delivery Purchase 0.35 Turnover
Sell 0.35 Turnover
Equity-IntradayPurchase 0.35 Turnover
Sell 0.35 Turnover
Future Purchase 0.20 Turnover
Sell 0.20 Turnover
OptionPurchase 5.00 Premium
Sell 5.00 Premium
The trading costs – not a deterrent

Slide - 54
This presentation is intended solely for the recipient and should not be replicated in any form or manner electronic or otherwise
SEBI Turnover Charges in BP
Equity-Delivery Purchase -
Sell -
Equity-IntradayPurchase -
Sell -
Future Purchase 0.02 Turnover
Sell 0.02 Turnover
OptionPurchase 0.02 Premium
Sell 0.02 Settlement price, on exercise
Overall in BPa
Equity-Delivery Purchase 12.85 Turnover
Sell 12.85 Turnover
Equity-IntradayPurchase 0.35 Turnover
Sell 2.85 Turnover
Future Purchase 0.22 Turnover
Sell 1.92 Turnover
Option 1Purchase 5.02 Premium
Sell 6.70 Premium
Option 2Purchase 12.50 Settlement price, on exercise
Sell 0.02 Settlement price, on exercise
The trading costs – not a deterrent

Slide - 55
This presentation is intended solely for the recipient and should not be replicated in any form or manner electronic or otherwise
The brokerages, borrowing and margin – no real standards
Very high brokerage on retail clients: 25 BP to 75 BP
Brokerages in futures on very high volume usually is 1-2 BP
Short sell borrowing started by some domestic brokers
Very high borrowing cost of 50 BP to 2% (Illiquid stocks)
F&O Margin: SPAN + Exposure ~ 20% to 33% of the notional value
Cost of funding in India: Set by RBI
Bank rate of 6.5%

Slide - 56
This presentation is intended solely for the recipient and should not be replicated in any form or manner electronic or otherwise
Factors Onshore Offshore Comment
Capital Gain Tax 10% NA If trade unwinded within 1 year
Income Tax 30% Contingent on country Income taxes in India is very high
Cost of funding >6.5% Contingent on country Very high cost of funding domestically
Pure equity trading Non-favorable Favorable High tax and cost of funding
Short selling Favorable Non-favorable FII‟s restricted to short-sell in equities
Cross exchange Arb Non-favorable Favorable
Commodity Trading Favorable Non-favorable FII‟s restricted on MCX commodities
Interest rate and currency
trading
Favorable Non-favorable FII‟s restricted on interest rate and
currency trading
Electronic trading Non-favorable Favorable Lots of approvals required
domestically
Skill-sets Favorable Favorable Many Indians globally looking to shift
back
Setting domestic desk for trading – favorable in pockets

Slide - 57
This presentation is intended solely for the recipient and should not be replicated in any form or manner electronic or otherwise
The co-location – in nascent stage
Settlement procedures in India
• Stocks settlement is T+2
• Short deliveries: Buy-in auction on T+3 days and settlement at T+4
• Clearing body: National securities clearing corporation ltd (NSCCL)
Co-location
• Cost of Co-location in NSE: USD 40,000 annually
• Cost of Co-location in BSE: USD 10,0000 annually
• Latency: Trade roundtrip of 5 ms. is promised (In reality 20-100 ms.)
• Black-box algos: Proposal evaluated by NSE in 2 weeks
• About 60 pre-trade risk parameters are tested
• Throttle bottleneck set by NSE at 500 trades per second
Slide - 58
This presentation is intended solely for the recipient and should not be replicated in any form or manner electronic or otherwise
The pricing mechanism

Slide - 59
This presentation is intended solely for the recipient and should not be replicated in any form or manner electronic or otherwise
Open auction mechanism – a good start
Collection Period: From 9:00 AM place bid/ask orders for first 7 min.
Exchange discovers indicative price for stocks and index
Based on indicative prices traders can change bid/ask
Matching Period: At 9:08 AM – 9:12 AM orders are matched
No new order / order modifications allowed in matching period
Opening at 9:15 AM: Opening at price where maximum shares gets traded
Applicable to only Nifty50 and Sensex stocks
Derivatives market open at 9:15

Slide - 60
This presentation is intended solely for the recipient and should not be replicated in any form or manner electronic or otherwise
Settlement prices – nothing much has changed
Futures, Daily settlement: VWAP price of the last 30 min. of trading
Futures, Final settlement: Closing price of the underlying security
Options, Exercise/Final settlement: Closing price of the underlying security

Slide - 61
This presentation is intended solely for the recipient and should not be replicated in any form or manner electronic or otherwise
About Samssara Capital Techologies LLP

Slide - 62
This presentation is intended solely for the recipient and should not be replicated in any form or manner electronic or otherwise
About Samssara Capital Technologies LLP
COMPANY BACKGROUND
Samssara Capital Technologies LLP (“Samssara”) is an
investment solutions firm focused solely on developing
automated algorithmic and quantitative trading and investment
strategies
It was launched in 2010 by a team of IIM Ahmedabad and IIT
Bombay graduates - Rajesh Baheti, Manish Jalan and
Kashyap Bhargava
Samssara caters to its clients' needs of providing an
alternative asset management vehicle, with the focus on 100%
automated and quantitative trading strategies
The team at Samssara works on mathematical models and
statistics that identify repetitive patterns in equity, commodity
and currency markets
The addressable market for Samssara is global - as the firm
can develop and build models which can function in both
developing markets with limited competition and developed
markets with strong competition
Samssara‟s client base includes the leading international and
domestic banks, international and domestic stock brokers,
family offices, corporate treasuries and HNIs
PRODUCTS OFFERED
Samssara’s products vary from pair trading (statistical
arbitrage), factor models, Nifty Index beating products to very
high frequency trading strategies
samCAP, a key product offered by Samssara, is a factor
model, where the model identifies a basket of stocks in Nifty
that tend to outperform the index and takes a long position in
these stocks. Alongside, the product also hedges the
investor’s portfolio using Nifty futures – whenever the market
turns bearish
Other products offered include samTREND - a trend following
strategy in equities, commodities & currencies and samWILLS
– a long-short strategy based on statistical arbitrage
Samssara also develops in-house products which are used by
investors like HNI’s, corporate treasuries, Prop houses of
brokers and investors who wants an alternative vehicle for
investment apart from equities and fixed income.
The products are designed to generate consistent returns and
ride the volatility of the markets with systematic approach
Additionally, Samssara works on providing high end services
and strategy development consultancy to hedge funds and
International Banks globally

Slide - 63
This presentation is intended solely for the recipient and should not be replicated in any form or manner electronic or otherwise
Contact us
Head Office:
208/209, Veena Chambers21 Dalal StreetMumbai – 400 001
Development Office:
207, Business Classic, Behind H P Petrol Pump, Chincholi Bunder Road, Malad (W)Mumbai – 400 064
For more information do visit : www.samssara.com
Manish Jalan
M: +91 98678 32726D: +91 22 6748 7720E: [email protected]
Tarun Soni
M: +91 98692 17190D: +91 22 6748 7720E: [email protected]