india human development survey working paper no. 8 · 2015-07-29 · india human development survey...
TRANSCRIPT

Is Education Associated with a Transition towards Autonomy in Partner Choice? A Case Study of India
Manjistha Banerji
Steven Martin Sonalde Desai
India Human Development Survey
Working Paper No. 8
Is Education Associated with a Transition towards
Autonomy in Partner Choice? A Case Study of India
Manjistha Banerji University of Maryland College Park
Steven Martin University of Maryland College Park
Sonalde Desai University of Maryland College Park
Version: October 2008
India Human Development Survey
Working Paper No. 8
Views presented in this paper are authors’ personal views and do not reflect institutional opinions. The results reported in this paper are based primarily on India Human Development Survey, 2005. This survey was jointly organized by researchers at University of Maryland and the National Council of Applied Economic Research. The data collection was funded by grants R01HD041455 and R01HD046166 from the National Institutes of Health to University of Maryland. Part of the sample represents a resurvey of households initially surveyed by NCAER in 1993-94.

Abstract
This paper examines if self-arranged marriages (or love marriages) have replaced parent-arranged
marriages as the dominant form of marriage in India. In particular, I examine if women of recent
cohorts (born around 1980) are less likely to report arranged marriages than women of older cohorts
(born around 1956). I also examine if educated women are less likely to report arranged marriages
than their less educated counterparts. The linkages between education and self-arranged marriages
operates through three channels- education is a means through which new ideas of individualism is
acquired, it provides greater opportunities for wage employment and thereby, increases the chances of
moving out of parents’ home and finally, educational institutions provide a setting for meeting
potential mates. I use a very unique dataset, India Human Development Survey (2005), to examine my
research questions. I distinguish between four categories of marriage type- parent-arranged marriage
with no consent, parent- arranged marriage with consent, jointly arranged marriage and self-arranged
marriage. Descriptive statistics indicate that parent-arranged marriages with no consent have declined
5 percentage points from the oldest to the youngest cohort. There has been an almost equal 5
percentage point increase in parent-arranged marriages with consent. Share of jointly arranged and
self-arranged marriages have remained somewhat similar across birth cohorts. Contrary to our
hypothesis, the largest difference between educated and their less educated counterparts is not with
respect to parent-arranged and self-arranged marriages rather it is between parent arranged marriages
with no consent (22 percentage points) and parent arranged marriages with consent (36 percentage
points). Results from multinomial regression analysis confirm that the trend towards parent arranged
marriages with the daughter’s consent has been persistent over time. Education is associated with
greater autonomy in partner choice decision but it most strongly associated with parent arranged
marriages with consent. I conclude that in a context where dating culture is not normative, parent
arranged marriages with consent may be the best way whereby notions of individual choice can be
accommodated while at the same time retaining some of the traditional parental control over spouse
choice.
- 2 -

Introduction
Although marriage is a phenomenon of key demographic interest, it has been difficult to
theorize about it, largely because it is far from clear as to who are the decision-makers (Desai and
Andrist, 2008). Some of the most fruitful work in this area has come from studies which see marriage
as a process (Meekers, 1992). This paper adds to this literature by examining the process surrounding
marriage decisions in India. While other aspects of the institution of marriage in India, such as age at
marriage and dowry have received some attention from scholars, the literature on type of marriage is
comparatively sparse. Anthropological literature on kinship patterns examines marriage as cornerstone
of kin and caste relations (Oberoi, 1998) and a few other studies have examined individual attitudes
towards arranged and love marriages and the socio-cultural milieu that explains and perpetuates the
system of arranged marriages in India (Medora, 2003). However, trends in mate selection patterns
have been largely ignored1.
Marital relations are associated with the type of marriage- self-arranged marriages are
considered more egalitarian than parent arranged ones. In the latter, since kin-members play an
important role in the spouse selection process, husband-wife relationship is de-emphasized. Instead as
Fox (1975: 188-189) following Blood (1972) suggests greater emphasis is placed on the “individual’s
vertical linkage with and responsibility to antecedent kinsmen and his progeny”. Self-arranged
marriages, on the other hand, are based on personal qualities and quality of inter-personal
relationships. Therefore, it is likely that such marriages emphasize what is described by Fox (1975) as
a “horizontal bond” between marital partners.
1 A previous study (Kurian, 1961) that explored trends in marriage partners among 125 Syrian Christians in Kerala found that nearly two-thirds of the marriages were parent-arranged with consent of the respondents. Around one-fourth reported self-selecting their spouses with the consent of the parents and 2 percent self-selected their spouses without parental consent. The residual 7 percent reported parent-arranged marriages with no consent from the respondent.
- 3 -

The argument on the relation between type of marriage and marital relations within the
household is particularly relevant in light of evidence on the importance of intra-household gender
relations. Household gender relations are related to fertility levels and intra-household resource
allocation. Egalitarian relations within a household, in contrast to hierarchical gender relations, are
associated with outcomes as lower fertility levels and equal resource allocation (Basu, 1992; Miles-
Doan, R. and L. Bisharat, 1990; Dyson, T and M. Moore 1983). It seems likely that self-arranged
marriages lead to more egalitarian gender relationships by strengthening the bonds between spouses
while de-emphasizing generational hierarchies. Consequently, research on marriage types might
illuminate a key process which mediates the context of intra-household gender relations and household
decisions.
India is an interesting case in the study of marriage arrangements- marriage arrangements are
diverse and have functions other than providing a socially legitimate association of unrelated persons
of the opposite sex. In many parts of the country, marriage arrangements are such that bride givers
enjoy a lower position vis-à-vis the bride takers (Oberoi, 1998; Madan, 1975). Marriage arrangements
have also formed an important aspect of caste relations- it has served as a way of moving up the caste
hierarchy through hypergamy (Milner, 1994). When marriage is a key element of the kinship structure,
it is not surprising that parents have a strong preference for selecting mates for their children.
However, increased levels of modernization and globalization in India may pit this parental control in
spouse selection against increasing individualism and preferences on the part of individuals to choose
their life partners. Increasing education may well bring young men and women in contact with each
other solidifying their preferences to choose their life partners and bringing them in contact with
potential mates. This suggests a possibility that marriage arrangements may have changed across
succeeding cohorts with increasing involvement of the bride and the groom in mate selection.
- 4 -
However, few studies have empirically examined this issue. Moreover, any research on this topic must
grapple with secular period effects and compositional effects associated with increasing education in
succeeding cohorts.
This paper seeks to contribute to this literature by examining trends in marriage type by
looking at birth cohorts 1956-1980 using data from the recently conducted India Human Development
Survey (2005) with a focus on distinguishing between changes associated with period effects and
those of compositional change due higher educational attainment among younger cohorts. The paper
is structured as follows: Section II presents background literature and research hypotheses. Section III
presents data and methods. Section IV presents descriptive statistics and results from multivariate
analysis. Section V discusses these results.
Section II: Background
Previous research from many countries- China (Xia and Zhou, 2003; Xiahoe and Whyte, 1990),
Egypt (Sherif-Trask, 2003), Japan (Murray and Kimura, 2003; Blood, 1967), Turkey (Hortacsu, 2003),
Trinidad and Tobago (Seegobin and Tarquin, 2003)-suggests that self-arranged marriages have
replaced parent-arranged marriages as the most dominant form of marriage type. In China, for
instance, traditionally marriages across all classes of society were arranged. Retrospective data from a
probability sample of 586 ever married women in Chengdu in Sichuan province suggest that over the
period 1933 to 1987 the proportion of arranged marriages was around 70 percent in the pre-1949
period but declined and was negligible by 1966-76 and 1977-87 (Xiahoe and Whyte, 1990). Takyi
(2003) summarizes the mate selection process in contemporary Ghana as follows:
In the most recent years for which data is available, it is apparent that individualistic ties, as opposed to communal ties, are becoming the norm when it comes to mate selection. […] a sizable proportion of men and women who were surveyed in southern Ghana reported selecting their own partners, a finding that is at odds with earlier ethnographic evidence. Among those sampled, 75.9% of the men and 69.0% of the
- 5 -

women reported selecting their current partners themselves. Such a development is consistent with some recent reports to the effect that, in urban areas in particular, it has even become common for couples to be married without informing their respective parents at all […].
The first proposition that I examine in this paper predicts that self-arranged marriages are increasingly
replacing parent arranged marriages as the most dominant form of marriage in India.
Hypothesis I: Women of recent cohorts (born around 1980) are less likely to report their
marriages as arranged than women of older cohorts (born around 1956).
The second proposition in this paper examines the linkages between education and the
likelihood of self-arranged marriages. Research suggests that higher the women’s level of education,
higher is the likelihood of self-arranged marriages. Education is argued to operate through three
distinct channels to increase the chances of self-determined marriages- (1) education is a means
through which a person acquires new ideas leading to greater individuation and reduced familial
control; (2) education has an indirect impact on spouse choice by increasing the likelihood of wage
employment and thereby encouraging a person to live away from parents and (3) educational
institutions at the secondary level or higher stages provides a setting for meeting potential mates
(Malhotra, 1991). Empirical evidence from Turkey (Fox, 1975) confirms the association between
educational attainment and the likelihood of self-arranged marriages- the proportion of love matches
among women with post-primary education was 51 percent compared to 20 percent among women
with primary or lower levels of education. Similarly, evidence from Indonesia (Malhotra, 1991)
suggests that 19 percent of the rural women with no education had love matches. The comparable
proportion for women with secondary education is 47.8 percent. In urban areas, the proportions of love
marriages are 25 percent with no education and 44 percent with secondary education.
- 6 -

Previous research from India suggests that attitude towards marriage type differ by educational
groups. Gore (1968) found that 73 percent of respondents without a formal education approved of the
traditional form of arranged marriages; whereas the approval rate was only 9 percent for those with
graduate education. Other studies that have focused on the attitudes of college students towards
marriages also found that educated respondents favored greater say in choice of spouse (Cormack
1961; Shah, 1961). The second proposition that we examine in this paper, therefore, is:
Hypothesis II: Women who are more educated are less likely to report their marriages as
arranged than less educated women.
Section III: Data and Methods
I use data from the Indian Human Development Survey (2005) to evaluate the above
hypotheses. This is a survey of 41,554 households across 33 states in India (the exception are the
island states of Andaman and Nicobar & Lakshadweep). Of a total of 602 districts in India, 383 were
included in the sample. The number of villages in the sample is 1,504 and the number of urban blocks
is 970. The sampling procedure adopted in the survey aimed to ensure a nationally representative
sample. The districts were selected using stratified random sampling to represent a range of socio-
economic conditions. Villages and urban centers and households were selected using a cluster
sampling technique. The survey asks ever-married women in the age group of 15-49 years
(N=33,478)2 a wide range of questions about education, health, income and consumption patterns, and
gender relations and most importantly for the purposes of this paper, questions on mate selection
process. This is the only nationally representative data to contain information on marriage process and
2 The sample size in this paper is around 21,000. The sample size is smaller than the original survey sample of 33,478 ever-married women because we have restricted the study sample to women in the ages 25-49 and entering first marriages between the ages 15-24. The first restriction excludes 5,550 women (women below 25 and in first marriage) and the second restriction (women entering marriages before age 15) further excludes 5,126 women.
- 7 -

mate selection. Therefore, it offers a unique opportunity to examine change in marriage patterns across
different cohorts.
Dependent Variable: Marriage Type
The outcome variable is marriage type. Ever-married women in the age group of 15-49 years
were asked in the survey “Who chose your husband?” The responses are divided into 4 categories:
arranged by the respondent herself; arranged by the respondent and parents together; parents arranged
marriages; and a miscellaneous category of “other,” which refers to cases where extended family
members or members outside the family have played a role in the choice of spouse. For the purpose of
this analysis, the “others” category is combined with parent-arranged marriages. Women who had
parent-arranged marriages or their marriages were arranged by extended family members (i.e., whose
marriages were categorised as “others”) were further asked “Did you have any say in choosing him?”
to which they responded either “yes” or “no”. Based on answers to these two questions there are four
marriage type categories:
1. Parent-arranged marriages with no consent of the respondent,
2. Parent-arranged marriages with consent from the respondent,
3. Jointly-determined marriages and
4. Self-arranged marriages.
The focus of this paper is on women in their first marriages; women who have married more
than once are excluded from the analysis. A very small number- only 344 out of the 33,478 ever
married women- are excluded based on this criterion. I also focus on first marriages occurring before
age 25. The rationale behind focussing on first marriage before age 25 is that women in the youngest
- 8 -

cohorts were in their mid and early-20s at the time of interview; therefore, they could not have married
prior to age 25. Nearly 95 percent of the Indian women are married by the time they reach 25.
The distribution of marriage types for women between ages 25 to 49 entering first marriage at
ages 15-24 is: parent-arranged with no consent from the respondents (35 percent), parent-arranged
with some consent in the choice of the partner (23 percent), jointly-determined marriages (36 percent)
and self-arranged marriages (5 percent). This suggests that spouse selection is a process rather than a
binary choice ranging from all decisions made by parents to all decisions made by the respondent with
a vast majority falling in between.
Explanatory variables
Birth cohorts and age at marriage
Age at marriage is correlated with marriage type (Fox, 1975). Among women who marry at
younger ages, the likelihood of parent-arranged marriages is higher and conversely, it is lower for
women who marry at older ages. This paper uses retrospective data on marriages from the India
Human Development Survey (2005) in which we can observe only those who have married at younger
ages in recent cohorts. Hence, in order to discern the long term trends towards self-arranged marriages
we restrict the analysis to women who are between the ages 25 to 49 at the time of marriage and also
to women who marry between the ages 15-24. also control for the age at marriage in the regression
analysis. Data from IHDS indicates that there has been a marginal increase in the age at marriage from
the youngest to the oldest cohort. Around a third of women in all ages enter first marriage at ages 15-
16 and majority across all birth cohorts are married by the time they are 20.
- 9 -
Education
The level of education of a woman in the survey is measured as the highest years of education
completed. It is a continuous variable that ranges from 0 years (implying illiteracy) to 15 years
(implying college or higher academic degree). Data from IHDS (2005) shows that there has been
improvement in women’s education level between the oldest and the youngest cohort. The proportion
of illiterate in the oldest birth cohorts (1956-60 and 1961-65) was around 50 percent. In comparison,
the proportion of illiterates in the youngest birth cohort (1976-80) is 35 percent. The proportion of
college graduates have increased from 5 percent in the oldest to around 6 percent in the youngest
cohort. If higher educational level is associated with increased chances of self-arranged marriages and
educational attainment of women has increased over time, it follows then that women born in younger
than older cohorts will have some input or full discretion in choosing their spouse.
Other covariates
Rural or urban residence
Urbanization is a facilitator of individual modernity through the linkages it provides to job
opportunities in the modern economic sector (Fox, 1975). Jobs in the modern economy (such as wage
labor) tend to be located in urban settings and are associated with migration of young adults from
native villages to urban areas and thereby, weakening parental control over them (Goode, 1963).
Parent control on children is a necessary condition if they have to exercise some say over the choice of
spouse of their son/daughter. Exposure to western cultural influences through the mass media is often
greatest in urban environments. Medora (2003) argues that this exposure weakens the traditional
norms of arranged marriages. This suggests that women living in urban areas are less likely to report
arranged marriages than women in rural areas. Empirical evidence from India conforms to a greater
- 10 -
pre-disposition towards love matches among urbanites than rural population (Gore, 1968; Goode,
1963). Around 69 percent of the sample women (25-49 years) entering first marriage at ages 15-24
reside in rural areas and the remaining 31 percent in urban areas.
English speaking ability, an alternative variable for urban or rural residence
The IHDS, however, did not capture the woman’s residence status prior to her marriage. ,
therefore, use an alternate variable- eligible woman’s degree of proficiency in speaking English to
measure the same concept underlying residence in urban areas- an individual’s exposure to modern
ideas. Its advantage over current residence is that it is not solely her post-marriage attribute. English
speaking ability is also a marker of a relatively more elitist education associated with private schooling
(Rana, Santra, Mukherjee, Banerjee and Kundu, 2005). The distribution of English speaking abilities
of women (25-49 years) entering first marriage at ages 15-24 is: not at all fluent (87 percent),
somewhat fluent (11 percent) and fluent (2 percent).
Tribal affiliations
Cultural norms pertaining to marriage are more favorable towards love marriages in tribal
communities than non-tribal communities in India. Tribal women are considered to enjoy higher social
status than their non-tribal counterparts as reflected, for instance, in their participation in agricultural
activities alongside men and decision making bodies and in better sex ratios implying lower levels of
discrimination against daughters. Ethnographic accounts indicate that marriages in tribal societies are
choice based and women have greater freedom in personal spheres as pre-marital sex, divorce and
remarriage (Xaxa, 2004). In contrast Medora (2003: 219) makes following observations about the
cultural context surrounding marriages in non-tribal Indian communities:
- 11 -

The influence of stern movies, stern television shows, and the internet has caused many Indian youth to desire and emulate their stern counterparts. A minority of urban youth belonging to the middle and upper middle social class, who are educated, independent-minded, and sternized, are selecting their own prospective mates and so are involved in “love marriages”. Most Indian parents do not approve of their children having love marriages. It is a great source of anxiety and concern to them.
In this paper we control for tribal affiliations by creating a dummy which takes on a
value 1 if a woman’s husband3 belongs to a tribal community and takes on a value 0 otherwise.
A small proportion of the sample (7.5 percent, N= 1580) belong to tribal communities. The
remaining sample belongs to the majority Hindu community and other minority religious
groups.
Current state of residence
Since educational improvements are disproportionately located in southern India where there is
also evidence of less restrictive gender norms (Dreze and Sen, 2001), the paper also controls for
current state residence.
This paper uses multivariate regression analysis to model the relationship between education
and marriage type. Specifically, we have run three models in this paper. The first model is the reduced
model. It has the main coefficients of interest- birth cohorts. Model 1 would demonstrate if there has
been a shift to increased autonomy in partner choice across the different birth cohorts.
Model 2 adds years of education to Model 1. This model would explain to what extent the
trends of a shift in increased autonomy in partner choice (as shown in Model 1) are explained by years
of education.
3 Note that the tribal/ non-tribal categorization is based on the husband’s and not the woman’s caste background. However, this is unlikely to affect the regression results since only a small proportion of all marriages are outside one’s caste/religious and tribal communities.
- 12 -

Model 3 is the full model. It adds to Model 2 a dummy for urban residence, English speaking
ability and age at marriage. It will demonstrate to what extent greater autonomy in choice of marriage
partner across birth cohorts is explained by years of education, net of additional variables in Model 3.
The regression technique that we employ in this paper is multinomial regression technique.
The base category in these models is parent arranged marriage with no consent of the respondent in
partner choice. have three sets of multinomial coefficients for each of the regression models that give
the log odds of reporting a parent arranged marriage with consent as opposed to parent arranged
marriage with no consent of the respondent, the log odds of reporting a marriage jointly determined by
the respondent and her parents as opposed to a parent arranged marriage with no consent of the
respondent and finally, the log odds of reporting a self-determined marriage as opposed to parent
arranged marriage with no consent of the respondent.
<Table 1 about here>
Other variables not included in this model
I estimated separate models with dichotomous controls for caste and religious affiliations (instead of
tribal versus non-tribal affiliations) and the results remain substantively the same as discussed below.
Results
begin with descriptive statistics of the range of responses women gave when asked how their
marriage partner was chosen. Table 2 shows the weighted distribution of responses first for the
overall sample, then broken down by birth cohorts and selected characteristics of the wives. The most
common responses were that the marriage was jointly arranged, or arranged by the parents with no
consent by the wife, with 36.52 and 35.36 percent of all responses respectively. 23.18 percent of wives
- 13 -

reported that their parents chose the husband with their consent, and only 4.94 percent of wives
reported a fully self-arranged marriage.
<Table 2 about here>
can observe trends in marriage types across birth cohorts from women born between 1956 and
1960 to women born between 1976 and 1980, a span of about two decades. As might be expected, the
proportion of women who report that their parents arranged their marriage without their consent has
declined from 38.39 percent to 33.23 percent, a drop of just over five percentage points. The greatest
increase in marriage type has been for women who report that their parents arranged their marriage
with their consent, an increase of over five percentage points from 19.39 percent to 25 percent. Hence,
the greatest shift in marriage types has been within the category of parent arranged marriages, as more
women report having consented to the husband their parents chose. In contrast, there was little
movement to self-arranged marriages across this time period; an increase from 4.48 percent to 6.25
percent or less than 2 percentage points. Surprisingly, jointly arranged marriages decreased in
prevalence across this time span from 37.74 percent to 35.53 percent.
Comparisons across education groups in Table 2 confirm that the greater a woman’s education,
the more likely she is to report autonomy or consent in her marriage choice. Compared to women of
lower education levels, women of higher education levels are less likely to report parent arranged
marriages without consent and more likely to report all other marriage types. Again, we find the
surprising pattern where the highest education levels are not associated so much with full autonomy in
marriage choice as with having consent after the parents select a potential husband. For example,
college-educated women are 21.73 percentage points more likely to report a parent-arranged marriage
with consent than are women with no education (37.41 percent versus 15.68 percent, respectively).
- 14 -

The corresponding education differences are only 3.35 percentage points for self-arranged marriages
and 11.01 percentage points for jointly arranged marriages.
Table 2 also shows comparisons across other characteristics of women, such as age at
marriage, rural or urban residence, and English fluency. The greatest group differences are always in
parent-arranged marriages without consent. For most but not all groups, the greatest offsetting
differences are in the category of parent arranged marriages with daughters’ consent. There are some
exceptions to this pattern. For differences between tribal and non-tribal affiliations the greatest
offsetting difference is not in parent arranged marriages with daughters but in jointly arranged
marriages. Jointly arranged marriages also differ greatly between women who are fluent in English
and women with no English fluency. Lastly, state level differences show a wide variety of marriage
patterns across all marriage categories, including North-Eastern states that reported more than 44
percent self-arranged marriages.
Respondents outside the main analyses
To maintain comparability across cohorts, the analysis presented here excludes three kinds of
respondents. These are women who first married before age 15, women who first married after age 25
and women who married more than once. These women are a small proportion of the original survey
sample. 6,634 respondents or about 20 percent of the original sample were excluded by these
constraints. The greatest proportion of exclusions is women marrying under age 15 (15%). Since our
focus is on marriage choice, it seemed appropriate to exclude very young brides since their age makes
the issues of “choice” and “consent” somewhat problematic.
In separate analyses, we found that the distribution of marriage types for women entering first
marriage at ages 25+ differs somewhat from the main sample. Around 10 percent of the marriages are
- 15 -

self-arranged, 44 percent jointly determined, 33 percent parent arranged with consent and 13 percent
parent arranged without consent (Table not shown). The distribution of the level of autonomy in
choosing the present spouse for the 370 women who have married more than once indicates that 39
percent of these women had parent arranged marriage without consent, 19 percent parent arranged
marriage with consent, 30 percent jointly arranged marriage and 11 percent self-arranged marriage
(Table not shown). Note that these responses are for the current marriage, not the first marriage.
Results of Multinomial Regression Analyses
The descriptive analyses indicated educational differences and other group differences in
marriage types, along with shifting trends in marriage types. The descriptive analyses also showed an
unexpected pattern for education and other covariates in which the greatest differences were in the
level of consent within parent arranged marriages. In contrast, there were fewer educational
differences and much weaker trends in whether the parents or the daughter arranged the marriage.
examine these findings further using a multinomial regression analysis, with the results shown
in Table 3. In all models, the first column of coefficients (A) compares the predicted log odds of a
parent arranged marriage where the woman consented to the spouse choice versus a parent arranged
marriage where the woman had no such consent. The second column of coefficients (B) compares the
predicted log odds of a jointly arranged marriage versus a parent arranged marriage with not consent,
and the third column (C) compares the predicted log odds of a self arranged marriage versus a parent
arranged marriage with not consent.
<Table 3 about here>
Model 1 is a simple model with estimates for successive birth cohorts and a dichotomous
control for each state. The coefficient of .604 for the 1976-1980 cohort in Model 1A indicates that the
- 16 -
log odds of a parent-arranged marriage with daughter’s consent (as compared to a parent-arranged
marriage without daughter’s consent) are .604 times higher for women born in 1976 – 1980, compared
to women born in 1956 – 1960. Statistically significant and positive coefficients for successive
cohorts in Model 1A show that this trend toward parent-arranged marriages with the daughter’s
consent has been persistent over time. The coefficients for the state controls are not shown to save
space, but are available on request. Briefly, the coefficients suggest that there is a regional pattern to
type of marriage. BIMARU states which share social norms that inhibit women’s autonomy
(Jejeebhoy and Sathar, 2001) are more likely to report parent-arranged marriages without consent.
Coefficients for Model 1B also show an increasing trend in the odds that a marriage will be
jointly arranged over time rather than arranged by the parents without the daughter’s consent. The
coefficient of .254 for the 1976-1980 birth cohort is much smaller than the corresponding coefficient
in Model 1A, reflecting the much smaller shift in jointly arranged marriages than the shift in parent-
arranged marriages with the daughter’s consent. The positive trend coefficients in Model 1B do not
show that jointly arranged marriages are becoming more common, but only that jointly arranged
marriages are declining more slowly than parent-arranged marriages without a daughter’s consent.
For self-arranged marriages, the coefficients for Model 1C show an increasing trend in the
odds that a marriage will be self-arranged as compared to parentally arranged without daughter’s
consent. The coefficient of .719 is slightly larger than the corresponding coefficient in Model 1A
(albeit with a larger standard error), but the results do not show up as clearly in the descriptive
statistics because a proportionate increase in self-arranged marriages has relatively little overall effect
when self-arranged marriages still constitute only a very small percent of all marriages.
The cohort coefficients in Models 1A to 1C confirm a statistically significant shift in marriage
types across about a twenty year span. As a rough standard, a coefficient of .7 in log form reflects a
- 17 -

doubling in the odds of one outcome compared to another, so these results indicate approximately a
doubling in the last twenty years in the odds that a woman will have a parent-arranged marriage with
consent instead of a parent-arranged marriage, as well as a doubling in the odds that a woman will
have a self-arranged marriage instead of a parent-arranged marriage. Because parent-arranged
marriages with daughter’s consent currently outnumber self-arranged marriages by more than five to
one, it is likely that daughter’s consent rather than daughter’s arrangement of the marriage will be the
most important distinguishing criterion for marriage types in the near future.
The three columns for Model 2 add controls for years of education and for tribal affiliation to
the variables in Model 1. Our critical interest is in the coefficients for education, which show a
statistically significant association with each marriage type. A comparison of the education
coefficients across shows that education matters most as a predictor of parent-arranged marriage with
daughter’s consent as compared to parent arranged marriage without daughter’s consent (coefficient of
.127, compared to .078 for jointly arranged marriages vs. parent-arranged without consent, and .107
for self-arranged marriages vs. parent-arranged without consent.)
By comparing the cohort coefficients in Model 2 to those in Model 1, we can estimate the
proportion of the overall cohort shift in marriage types that is explained by increases in levels of
women’s education. The coefficients for the 1976 – 1980 cohort in Models 2A, 2B, and 2C are .391,
.140, and .558, respectively, which are smaller than the corresponding coefficients from Models 1A,
1B, and 1C of .604, .254. and .719. This result suggests that just under half of the trend away from
parent-arranged marriages without consent is explained by increases in women’s years of education.
The estimates for Models 3A, 3B, and 3C include covariates that are interesting but are a
potential problem for causal interpretation. Residence and English fluency are measured at the time of
the interview rather than at the time of the marriage, so the dependent variable (marriage type)
- 18 -

precedes the independent variables for these coefficients and makes causal interpretations problematic.
Similarly, given that marriage choice generally involves both who and when a woman marries, it is not
clear how to interpret the predictors of a marriage type net of the woman’s age at marriage.
With the caveats given above, the results of Model 3 do not change the main story. In Model
3, the coefficients for older age at marriage, urban residence, and English fluency all have the
expected (positive) signs, and the cohort and education coefficients retain their positive signs.
Discussion
Our descriptive results and multinomial analyses confirm our main hypotheses, but also
suggest some new interpretations. had predicted a trend toward greater autonomy in partner choice in
marriages, mediated by rising women’s education. Our results showed exactly that; parent arranged
marriages without daughter’s consent have declined across a twenty-year span of marriages, and just
under half of this trend is explained by our statistical control for years of women’s education.
However, our results also showed a pattern not predicted by standard theories of
modernization, women’s education, and women’s autonomy applied to marriage. found that the
greatest trend, and the greatest difference between college educated women and their less educated
counterparts, was not in the extent to which daughters arranged their own marriages or even shared the
marriage search jointly with their parents. Instead, we found that parents in India are still doing the
major share of arranging marriages (including many families where the daughters have college
degrees), but that daughters’ autonomy is being expressed in their increased power of consent once
their parents have arranged a marriage for them.
Parent arranged marriages with consent of the daughter in partner choice is best suited for a
cultural context that does not have a dating culture of the kind existing in the st. Such a “dating
- 19 -

culture” requires that it be socially acceptable for the young to “romantically link up with each other
without any kind of adult supervision in a setting that is not defined directly as leading to marriage”
and to “try out” different potential mates before deciding on a marriage partner (Xiaohe and Whyte,
1990: 716).
There is indirect evidence that a stern style dating culture is not widely prevalent in the
country. The IHDS did not ask women respondents if they ever had considered marrying another
person besides their current husbands but we have information on how long they had known their
husbands prior to their eventual marriage (see Table 4). If women exercise some or complete
discretion in the choice of her marriage partner, it is likely that they would have known their eventual
husbands prior to their marriage. However, Table 4 indicates even though as expected those with self-
arranged marriages were most likely to have known their husbands for more than a year (25 percent)
and those who had parent arranged marriage with no consent were most likely to meet their husband
on the wedding day (86 percent), a majority of women across all marriage types were likely to meet
their husband on the day of wedding or knew their husbands for less than a month or year. What is
most surprising that even among women who claim to have a self-arranged marriage, a significant
proportion had no real contact with their husbands prior to their marriage and substantial proportion
met husbands only on or around the wedding day. This suggests that the “self-arranged” marriage for
these individuals involves developing an interest in a particular mate but then leaving actual
negotiations and arrangements to family members.
<Table 4 about here>
This evidence suggests the importance of seeing spousal choice as a continuum rather than a
binary choice with focus on the “middle ground” in which the individual partners and their parents
have a role in the marriage arrangement process. This is particularly important in the absence of social
- 20 -

structures and norms supportive of stern type dating environment. Under these circumstances, it seems
most likely that parents carry out the marriage searches while their daughters have full or some
discretion over her partner choice. Medora (2003: 219) confirms
“Researchers have concluded that most young adults in India favor the system of an arranged marriage over a love marriage or a free choice marriage. Researchers found that although young men and women prefer an arranged marriage, most of them want to be consulted and want a final say in whom they marry. If they happen to fall in love and so select their own prospective mates, approval from parents is deemed of paramount importance for a large majority of Indian youth.”
Indeed, Lessinger (2002: 103) notes that parent arranged marriages with consent of the daughter
in spouse choice, appropriately termed as “semi-arranged marriages”, have the advantage of suitably
modifying the traditional system of arranged marriage so that parents can retain some control over the
choice of spouse of their children while accommodating “youthful yearning for romantic love”. Under
this system of marriages, pre-screened young men and women are permitted a brief period of
courtship during which they can decide if they want to get married to each other.
This [sort of dating] is different from American-style dating in that parents and extended family members (e.g. grandparents, uncles, aunts, cousins) are still involved in the initial screening, the courtship is much shorter, little or no premarital sex is involved and there is realistic recognition that the purpose of meeting is marriage (Medora, 2003: 218)
India’s experience is, however, neither unusual nor peculiar. There is evidence from other
countries where parent arranged marriages were but currently are not the most common form of
marriage type that it may be some time before such a “dating culture” in the sternized sense of the
term gets established. In Japan, for instance, the cultural environment in the mid-1950 was “hostile to
dating” (Blood, 1967:10) even though arranged marriages in which parents wielded all the power and
young couples had no role were not the dominant form of mate selection. Xiahoe and Whyte (1990)
similarly note in their study of China that in spite of the higher prevalence of love marriages in the
- 21 -
period of their study (1933-87), very few women have dated a person other than their future husbands
and the decision to marry almost always preceded dating rather than succeeding it. In Turkey, self-
arranged marriages is preceded by a stern style courtship but conservative social norms such as
concern of the parents of young women that dating compromises a woman’s marriage prospects and/or
family honor may cause them to exert considerable pressure on young couples to get married
(Hortacsu, 2003).
In fact, it would be interesting to examine whether India in the coming decades makes the
transition to complete autonomy in marriage types or parent arranged marriages with consent emerges
as the most common marriage type. Such a transition will in turn raise further questions about
structures and norms that facilitate the emergence of a particular marriage type as the most common
type.
Second, further research is needed to explain the difference in marriage type patterns across
states. The variables included in this model do not account for large inter-state differences. It is also
not clear from the above results if jointly arranged marriages are an intermediate marriage type
between parent- arranged marriages with consent and self-arranged marriage or an independent
marriage type by itself. Last, we have examined marriage types only from the perspective of the
woman respondent. Autonomy in marriage types also has to be examined from the perspective of men
as well. For instance, it would be interesting to analyze if men enjoy greater autonomy than women in
marriage decisions. Indeed, a study of marriage types would be complete only if we have perspective
of both the partners as well as their parents.
- 22 -

References
Desai, S. and L. Andrist (2007), Gender Scripts and Age at Marriage in India in India Human Development Survey Working Paper 2007-3. College Park: University of Maryland.
Basu, A.M (1992), Culture, the Status of Women and Demographic Behavior: Illustrated with the case of India, Oxford: Clarendon Press.
Blood, Robert O., Jr. (1967), Love Match and Arranged Marriage: A Tokyo- Detroit Comparison. New York: Free Press.
Cormack, M.L. (1961), She Who Rides a Peacock, New York: Praeger
Dreze, J. and Sen, A. (2002), India: Development and Participation, New Delhi: Oxford University Press.
Dyson, T and M. Moore (1983), On Kinship Structure, Female Autonomy and Demographic Behaviour in India, Population and Development Review, Vol. 9, No.1, pp. 35-60.
Fox, G. L. (1975), “Love Match and Arranged Marriage in a Modernizing Nation: Mate Selection in Ankara, Turkey”, Journal of Marriage and Family, Vol. 37, No. 1, pp. 180-193.
Goode, W.J. (1963), World Revolution and Family Patterns, New York: Free Press.
Gore, M.S. (1968), Urbanization and Family Change, Bombay: Popular Prakashan
Hortacsu, N. (2003), “Marriage in Turkey” in Mate Selection across Cultures edited by R.R. Hamon and B. B. Ingoldsby, Thousand Oaks: Sage Publications.
Kurian, G. (1961), The Indian Family in Transition: A Case Study of Kerala Syrian Christians, The Hauge: Mouton and Company.
Lessinger, J. (2002), “Asian Indian Marriages: Arranged, Semi-Arranged or Based on Love?,” in N.B. Benokraitis, ed., Contemporary Ethnic Families in the Unites States: Characteristics, Variations and Dynamics, Prentice Hall, pp. 101–104. Madan, T.N. (1975), Structural Implications of Marriage in North India: Wife givers and Wife takers among the Pandits of Kashmir, Contributions to Indian Sociology, Vol. 9, pp. 217-243.
Malhotra, A. (1991), Gender and Changing Generational Relations: Spouse Choice in Indonesia, Journal of Marriage and Family, Vol. 28, No. 4, pp. 549-570.
Medora, N. (2003), “Mate Selection in Contemporary India: Love Marriages Versus Arranged Marriages” in Mate Selection across Cultures edited by R.R. Hamon and B. B. Ingoldsby, Thousand Oaks: Sage Publications.
- 23 -

Meekers, D. (1992), The Process of Marriage in African Societies: A Multiple Indicator Approach, Population and Development Review, Vol. 18, No. 1, pp. 61-78.
Miles-Doan, R. and L. Bisharat (1990), Female Autonomy and Child Nutritional Status: The Extended Family Residential Unit in Amman, Jordan, Social Science and Medicine, Vol. 31, pp.783-89.
Milner, M. Jr. (1994), Status and Sacredness: A General Theory of Status Relations and an Analysis of Indian Culture, New York: Oxford University Press.
Murray, C.I. and N. Kimura (2003), “Multiplicity of Paths to Couple Formation in Japan” in Mate Selection across Cultures edited by R.R. Hamon and B. B. Ingoldsby, Thousand Oaks: Sage Publications.
Oberoi, P. (1998), Family Kinship and Marriage in India, Delhi: Oxford India Paperbacks.
Kumar R., S. Santra, A.Mukherjee, T. Banerjee and M. Kundu (2005), Public-Private Interface in Primary Education, Economic and Political ekly, Vol. 40, No. 15, pp.1552-1555.
Shah, B.V. (1961), Gurjarati College Students and Selection of Bride, Sociological Bulletin, Vol. 11 (March-September), pp. 121-140.
Sherif-Trask, B. (2003), “Love, Courtship, and Marriage from a Cross-Cultural Perspective: The Upper Middle Class Egyptian Example” in Mate Selection across Cultures edited by R.R. Hamon and B. B. Ingoldsby, Thousand Oaks: Sage Publications.
Seegobin, W. and K.M. Tarquin (2003), “Mate Selection in Trinidad and Tobago: A Multicultural Perspective” in Mate Selection across Cultures edited by R.R. Hamon and B. B. Ingoldsby, Thousand Oaks: Sage Publications.
Takyi, B.K. (2003), “Tradition and Change in Family and Marital Processes: Selecting a Marital Partner in Modern Ghana” in Mate Selection across Cultures edited by R.R. Hamon and B. B. Ingoldsby, Thousand Oaks: Sage Publications.
Xaxa, V. (2004), Women and Gender in the Study of Tribes in India, Journal of Gender Studies, Vol. 11, No. 3, pp. 345-363
Xia, Y.R. and Z.G. Zhou (2003), “The Transition of Courtship, Mate Selection, and Marriage in China”, in Mate Selection across Cultures edited by R.R. Hamon and B. B. Ingoldsby, Thousand Oaks: Sage Publications.
Xiahoe, X. and M.K. Whyte (1990), Love Matches and Arranged Marriages: A Chinese Replication, Journal of Marriage and Family, Vol. 52, No. 3, pp. 709-722.
- 24 -
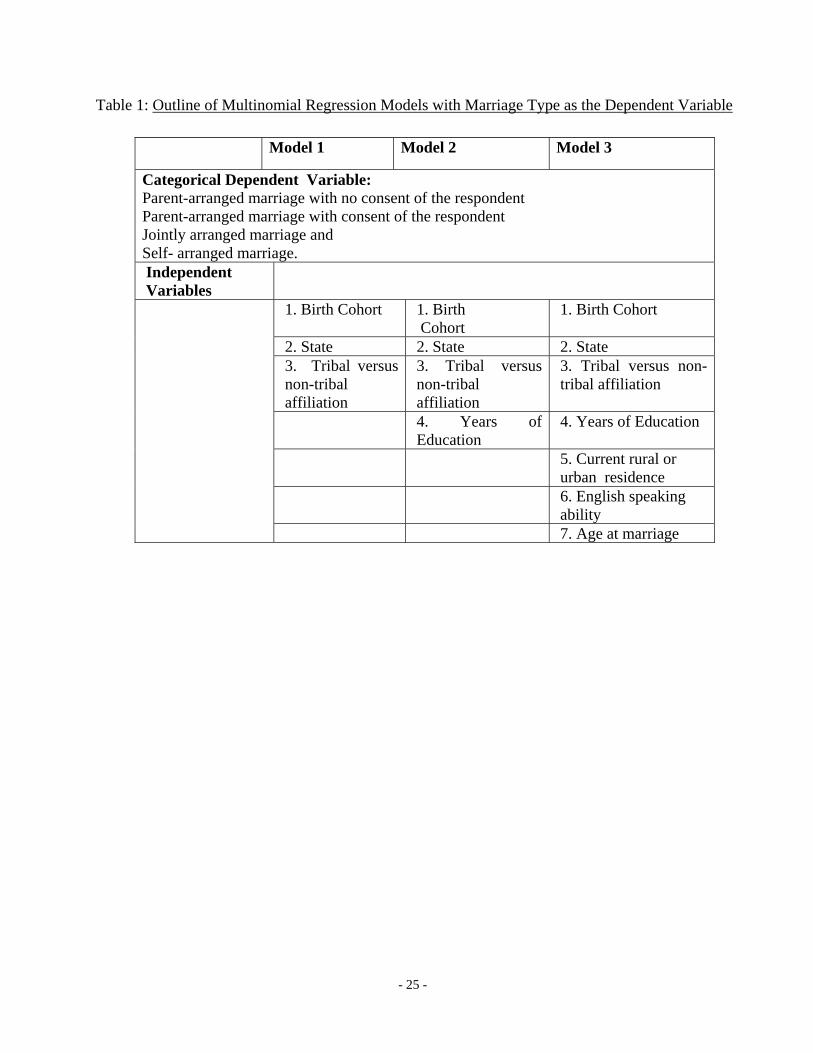
Table 1: Outline of Multinomial Regression Models with Marriage Type as the Dependent Variable
Model 1 Model 2 Model 3
Categorical Dependent Variable: Parent-arranged marriage with no consent of the respondent Parent-arranged marriage with consent of the respondent Jointly arranged marriage and Self- arranged marriage. Independent Variables
1. Birth Cohort 1. Birth Cohort
1. Birth Cohort
2. State 2. State 2. State 3. Tribal versus non-tribal affiliation
3. Tribal versus non-tribal affiliation
3. Tribal versus non-tribal affiliation
4. Years of Education
4. Years of Education
5. Current rural or urban residence
6. English speaking ability
7. Age at marriage
- 25 -
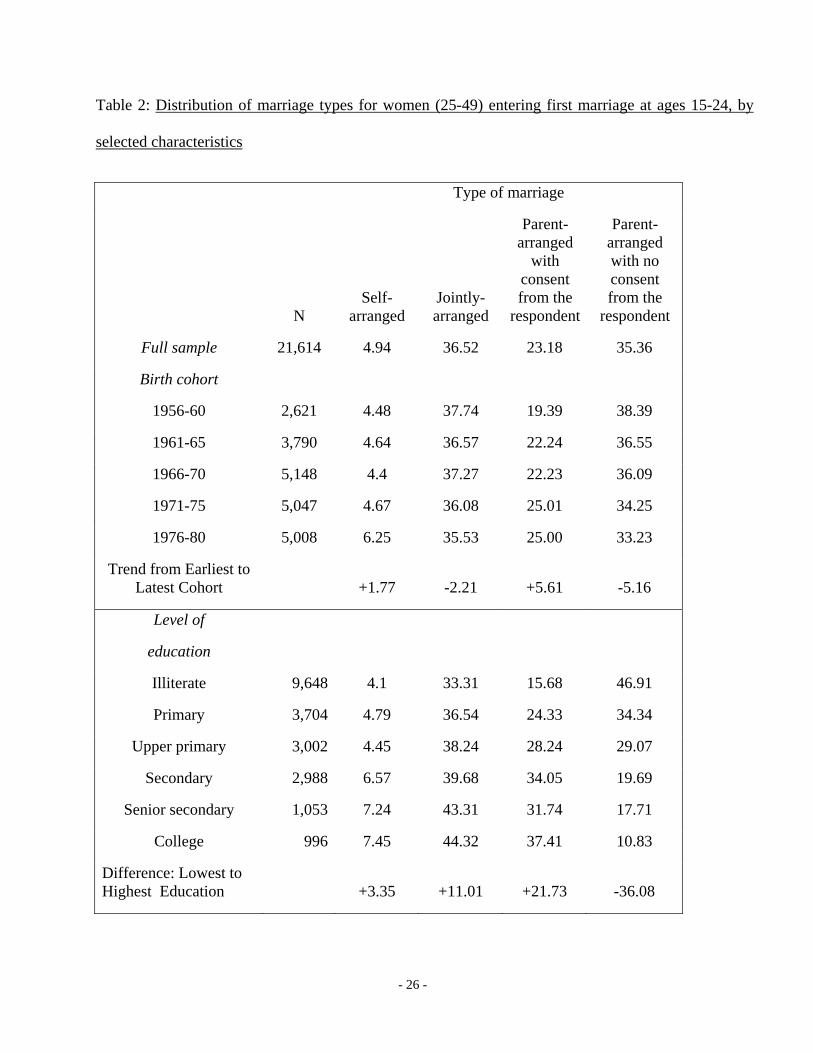
Table 2: Distribution of marriage types for women (25-49) entering first marriage at ages 15-24, by
selected characteristics
Type of marriage
N Self-
arranged Jointly- arranged
Parent- arranged
with consent from the
respondent
Parent- arranged with no consent from the
respondent
Full sample 21,614 4.94 36.52 23.18 35.36
Birth cohort
1956-60 2,621 4.48 37.74 19.39 38.39
1961-65 3,790 4.64 36.57 22.24 36.55
1966-70 5,148 4.4 37.27 22.23 36.09
1971-75 5,047 4.67 36.08 25.01 34.25
1976-80 5,008 6.25 35.53 25.00 33.23
Trend from Earliest to Latest Cohort +1.77 -2.21 +5.61 -5.16
Level of
education
Illiterate 9,648 4.1 33.31 15.68 46.91
Primary 3,704 4.79 36.54 24.33 34.34
Upper primary 3,002 4.45 38.24 28.24 29.07
Secondary 2,988 6.57 39.68 34.05 19.69
Senior secondary 1,053 7.24 43.31 31.74 17.71
College 996 7.45 44.32 37.41 10.83
Difference: Lowest to Highest Education +3.35 +11.01 +21.73 -36.08
- 26 -

Table 2 (continued)
Type of marriage
N Self-
arranged Jointly- arranged
Parent- arranged
with consent from the
respondent
Parent- arranged with no consent from the
respondent
Age at (current) marriage
15-16 years 7207 4.36 29.6 19.64 46.4
17-18 years
7063 4.04 38.61 21.81 35.54
19-20 years
4261 5.7 41.4 25.56 27.34
21-22 years
1955 6.6 39.35 30.46 23.59
23-24 years
1127 8.59 44.36 32.71 14.34
Difference: Youngest to Oldest Marriage Age +4.23 +14.24 +13.07 -32.06
Current residence
Rural 14,815 5.07 34.5 20.34 40.09
Urban 6,799 4.66 40.93 29.36 25.05
Urban – Rural Difference -0.41 +5.43 +9.02 -15.04
English speaking ability
None 18,327 4.62 35.57 21.48 38.33
Little fluent 2,300 6.78 40.28 33.85 19.09
Fluent 447 10.04 50.22 30.18 9.56
Difference: No English to Fluent English +5.32 +14.65 +8.70 -28.77
- 27 -

Table 2 (continued)
Type of marriage
N Self-
arranged Jointly- arranged
Parent- arranged
with consent from the
respondent
Parent- arranged with no consent from the
respondent
Tribal affiliation
Scheduled Tribes 1,505 11.33 37.75 17.22 33.7
Non Scheduled Tribes 20,109 4.46 36.43 23.62 35.48
Scheduled - Non-Scheduled Difference -6.87 -1.32 +5.40 +1.68
States
Jammu and Kashmir 245 3.41 16.41 22.83 57.34
Himachal Pradesh 159 6.43 8.9 49.55 35.12
Uttarakhand 416 1.28 6.47 35.8 56.45
Punjab 632 0.6 36.63 24.52 38.26
Haryana 419 2.19 56.6 6.89 34.32
Delhi 381 1.46 30.12 31.58 36.85
Uttar Pradesh 2402 2.71 21.72 8.44 67.13
Bihar 1117 2.86 15.24 3.64 78.26
Jharkhand 818 6.56 17.91 12.6 62.93
Rajasthan 825 0.21 15.89 7.09 76.82
Chattisgarh 471 1.01 59.71 7.77 31.51
Madhya Pradesh 919 0.69 43.53 8.17 47.61
North-East 243 44.01 19.66 14.09 22.25
Assam 582 7.87 52.25 35.72 4.16
st Bengal 1675 8.21 28.55 41.11 22.12
- 28 -
- 29 -
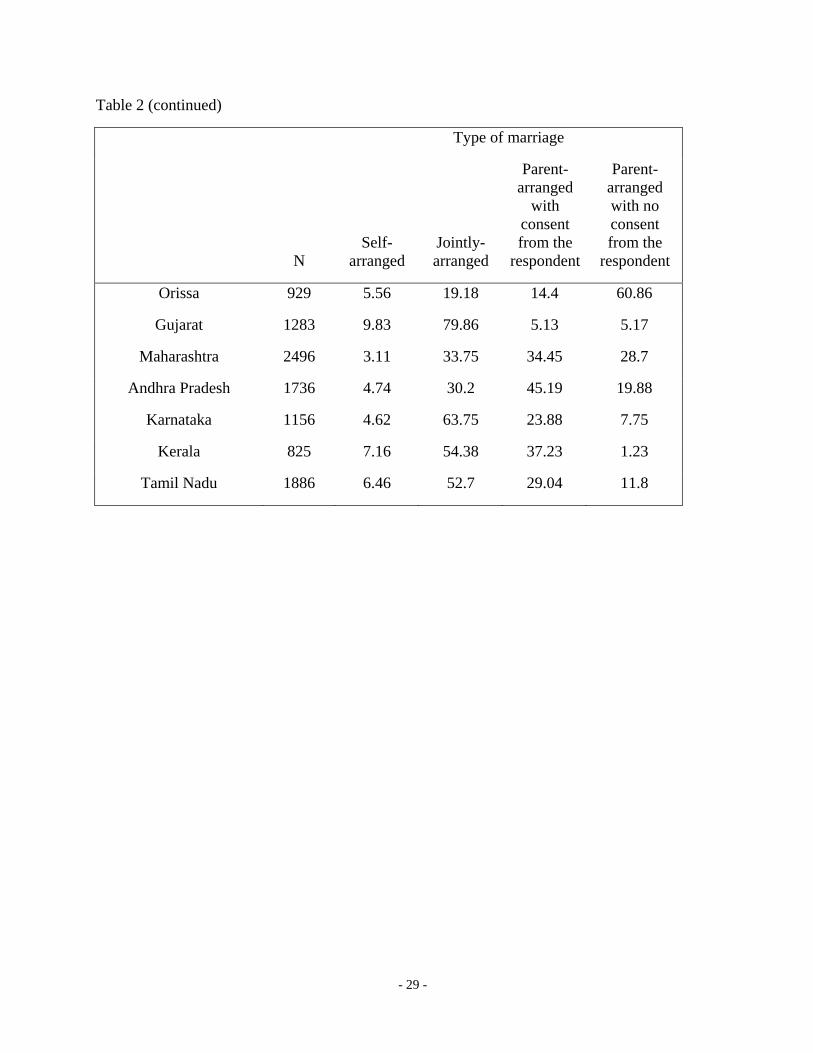
Table 2 (continued)
Type of marriage
N Self-
arranged Jointly- arranged
Parent- arranged
with consent from the
respondent
Parent- arranged with no consent from the
respondent
Orissa 929 5.56 19.18 14.4 60.86
Gujarat 1283 9.83 79.86 5.13 5.17
Maharashtra 2496 3.11 33.75 34.45 28.7
Andhra Pradesh 1736 4.74 30.2 45.19 19.88
Karnataka 1156 4.62 63.75 23.88 7.75
Kerala 825 7.16 54.38 37.23 1.23
Tamil Nadu 1886 6.46 52.7 29.04 11.8

Table 3: Results of Multinomial Regression Models
Model 1: Birth cohorts, tribal affiliations and
state dummies
Model 2: Birth cohorts, education, tribal affiliations
and state dummies Model 3: Full model 1a 1b 1c 2a 2b 2c 3a 3b 3c
With no consent v consent
With no consent vshared
determination
With no consent v
self arranged
With no consent v consent
With no consent v
shared determination
With no consent v
self arranged
With no consent v consent
With no consent v
shared determination
With no consent v
self arranged Birth Cohort
(Ref category: 1956-60 birth cohort
or 45-49 years) 1976-80 birth cohort
or 25- 29 years 0.604* 0.254* 0.719* 0.391* 0.140 0.558* 0.442* 0.191* 0.606* 0.08 0.07 0.12 0.08 0.07 0.13 0.08 0.07 0.13
1971-75 birth cohort or 30-34 years 0.484* 0.174* 0.327 0.359* 0.114 0.233 0.415* 0.164 0.278
0.07 0.07 0.13 0.08 0.07 0.13 0.08 0.07 0.131966-70 birth cohort
or 35-39 years 0.23* 0.113 0.100 0.214* 0.110 0.07 0.252* 0.147 0.105 0.07 0.06 0.13 0.08 0.07 0.13 0.08 0.07 0.13
1961-65 birth cohort or 40-44 years 0.199 0.003 0.15 0.196 0.005 0.153 0.201* 0.01 0.168
0.08 0.07 0.13 0.08 0.07 0.14 0.08 0.07 0.14Tribal/Non-tribal affiliations
(Ref category: Tribal Affiliations)
Non-tribal affiliations -0.035 -0.015 -0.73* -0.319* -0.183 -0.949* -0.359* -0.19 -0.91* (0.09) (0.08) (0.11) 0.09 0.08 0.12 0.09 0.08 0.12
Years of Education 0.127* 0.078* 0.1007* 0.097* 0.037* 0.05* 0.005 0.004 0.008 0.006 0.005 0.01
Current residence (Ref category: Rural areas)
Urban residence 0.428* 0.285* 0.13
0.05 0.05 0.09
- 31 -
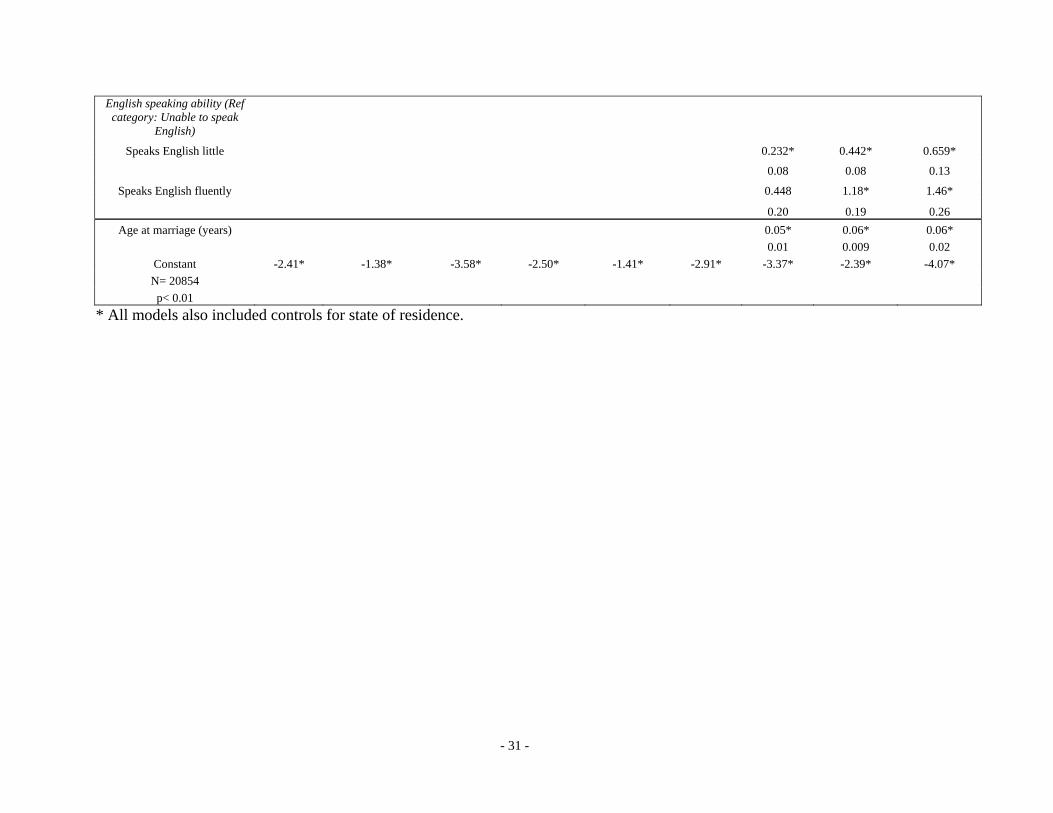
English speaking ability (Ref category: Unable to speak
English)
Speaks English little 0.232* 0.442* 0.659*
0.08 0.08 0.13
Speaks English fluently 0.448 1.18* 1.46*
0.20 0.19 0.26Age at marriage (years) 0.05* 0.06* 0.06*
0.01 0.009 0.02Constant -2.41* -1.38* -3.58* -2.50* -1.41* -2.91* -3.37* -2.39* -4.07*N= 20854 p< 0.01
* All models also included controls for state of residence.

Table 4: Distribution of period of time knew the husband before marriage for women (25-49 years) entering first marriage at ages 15-24, by type of marriage
Type of marriage
Period of time N Self-
arranged Jointly
arranged
Parent arranged
with consent from the
respondent
Parent arranged with no consent from the
respondent
On wedding day 14,506 38.97 59.55 56.75 86.07
Less than one month 2,194 7.81 15.95 11.22 3.84
More than one month but less than a year
2,459 13.49 14.15 16.47 4.93
More than one year 839 25.39 3.18 4.56 1.18
Since childhood 1,371 14.34 7.16 11.00 3.98

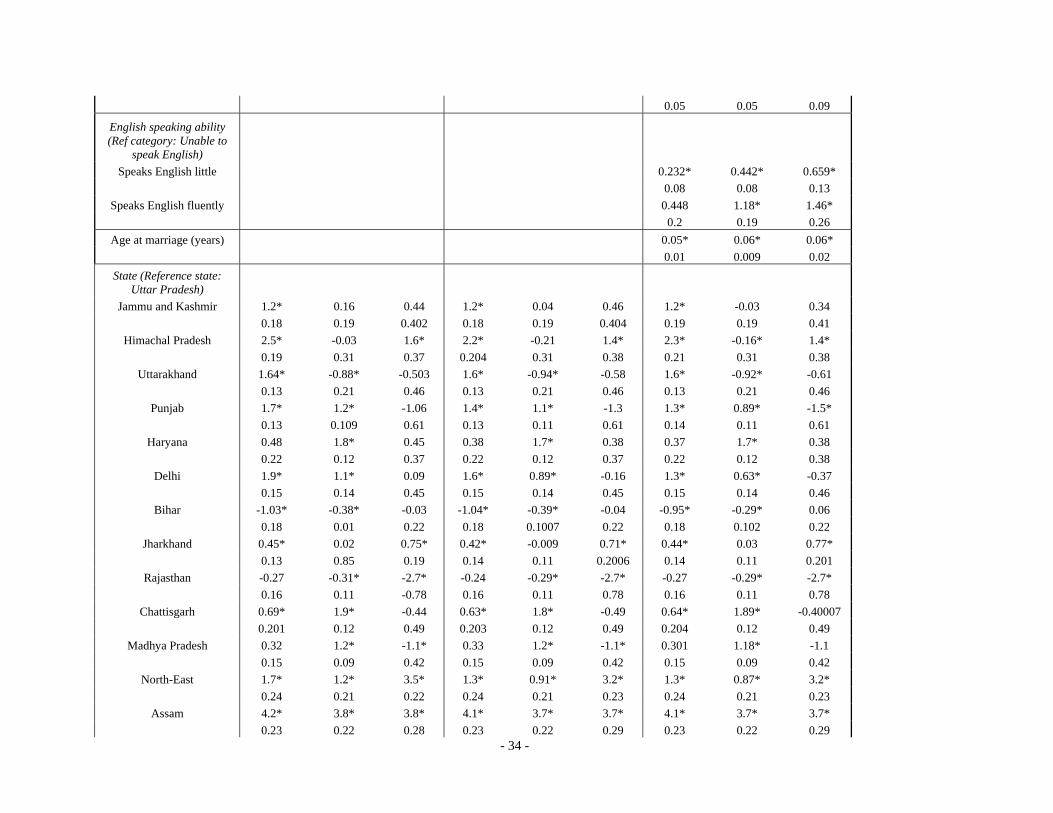
Appendix 1: Results of Multinomial Regression Model
Model 1: Birth cohorts, tribal affiliations
and state dummies
Model 2: Birth cohorts, education,tribal affiliations
and state dummies Model 3: Full model 1a 1b 1c 2a 2b 2c 3a 3b 3c
With no consent v consent
With no consent v
shared determination
With no consent
v self
arranged
With noconsent
v consent
With no consent v
shared determination
With no consent
v self
arranged
With no consent v consent
With no consent v
shared determination
With no consent v
self arranged
Birth Cohort ((Ref category: 1956-60
birth cohort or 45- 49 years)
1976-80 birth cohort
or 25- 29 years 0.604* 0.254* 0.719* 0.391* 0.14 0.558* 0.442* 0.191* 0.606* 0.08 0.07 0.12 0.08 0.07 0.13 0.08 0.07 0.13
1971-75 birth cohort or 30-34 years 0.484* 0.174* 0.327 0.359* 0.114 0.233 0.415* 0.164 0.278
0.07 0.07 0.13 0.08 0.07 0.13 0.08 0.07 0.13 1966-70 birth cohort
or 35-39 years 0.23* 0.113 0.1 0.214* 0.11 0.07 0.252* 0.147 0.105 0.07 0.06 0.13 0.08 0.07 0.13 0.08 0.07 0.13
1961-65 birth cohort or 40 -44 years 0.199 0.003 0.15 0.196 0.005 0.153 0.201* 0.01 0.168
0.08 0.07 0.13 0.08 0.07 0.14 0.08 0.07 0.14 Tribal/Non-tribal
affiliations (Ref category: Tribal
Affiliations) Non-tribal affiliations -0.035 -0.015 -0.73* -0.319* -0.183 -0.949* -0.359* -0.19 -0.91*
-0.09 -0.08 -0.11 0.09 0.08 0.12 0.09 0.08 0.12 Years of Education 0.127* 0.078* 0.1007* 0.097* 0.037* 0.05*
0.005 0.004 0.008 0.006 0.005 0.01 Current residence (Ref category: Rural areas)
Urban residence 0.428* 0.285* 0.13
- 34 -
0.05 0.05 0.09 English speaking ability (Ref category: Unable to
speak English) Speaks English little 0.232* 0.442* 0.659*
0.08 0.08 0.13 Speaks English fluently 0.448 1.18* 1.46*
0.2 0.19 0.26 Age at marriage (years) 0.05* 0.06* 0.06*
0.01 0.009 0.02 State (Reference state:
Uttar Pradesh) Jammu and Kashmir 1.2* 0.16 0.44 1.2* 0.04 0.46 1.2* -0.03 0.34
0.18 0.19 0.402 0.18 0.19 0.404 0.19 0.19 0.41 Himachal Pradesh 2.5* -0.03 1.6* 2.2* -0.21 1.4* 2.3* -0.16* 1.4*
0.19 0.31 0.37 0.204 0.31 0.38 0.21 0.31 0.38 Uttarakhand 1.64* -0.88* -0.503 1.6* -0.94* -0.58 1.6* -0.92* -0.61
0.13 0.21 0.46 0.13 0.21 0.46 0.13 0.21 0.46 Punjab 1.7* 1.2* -1.06 1.4* 1.1* -1.3 1.3* 0.89* -1.5*
0.13 0.109 0.61 0.13 0.11 0.61 0.14 0.11 0.61 Haryana 0.48 1.8* 0.45 0.38 1.7* 0.38 0.37 1.7* 0.38
0.22 0.12 0.37 0.22 0.12 0.37 0.22 0.12 0.38 Delhi 1.9* 1.1* 0.09 1.6* 0.89* -0.16 1.3* 0.63* -0.37
0.15 0.14 0.45 0.15 0.14 0.45 0.15 0.14 0.46 Bihar -1.03* -0.38* -0.03 -1.04* -0.39* -0.04 -0.95* -0.29* 0.06
0.18 0.01 0.22 0.18 0.1007 0.22 0.18 0.102 0.22 Jharkhand 0.45* 0.02 0.75* 0.42* -0.009 0.71* 0.44* 0.03 0.77*
0.13 0.85 0.19 0.14 0.11 0.2006 0.14 0.11 0.201 Rajasthan -0.27 -0.31* -2.7* -0.24 -0.29* -2.7* -0.27 -0.29* -2.7*
0.16 0.11 -0.78 0.16 0.11 0.78 0.16 0.11 0.78 Chattisgarh 0.69* 1.9* -0.44 0.63* 1.8* -0.49 0.64* 1.89* -0.40007
0.201 0.12 0.49 0.203 0.12 0.49 0.204 0.12 0.49 Madhya Pradesh 0.32 1.2* -1.1* 0.33 1.2* -1.1* 0.301 1.18* -1.1
0.15 0.09 0.42 0.15 0.09 0.42 0.15 0.09 0.42 North-East 1.7* 1.2* 3.5* 1.3* 0.91* 3.2* 1.3* 0.87* 3.2*
0.24 0.21 0.22 0.24 0.21 0.23 0.24 0.21 0.23 Assam 4.2* 3.8* 3.8* 4.1* 3.7* 3.7* 4.1* 3.7* 3.7*
0.23 0.22 0.28 0.23 0.22 0.29 0.23 0.22 0.29
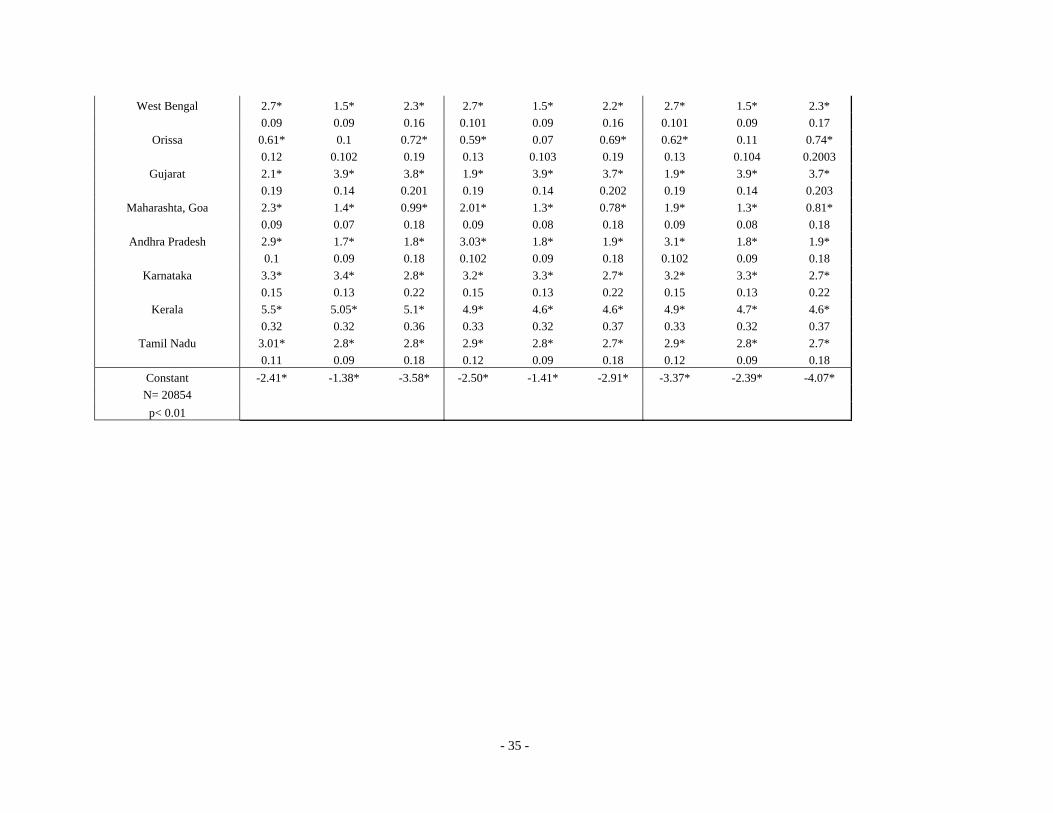
- 35 -
West Bengal 2.7* 1.5* 2.3* 2.7* 1.5* 2.2* 2.7* 1.5* 2.3* 0.09 0.09 0.16 0.101 0.09 0.16 0.101 0.09 0.17
Orissa 0.61* 0.1 0.72* 0.59* 0.07 0.69* 0.62* 0.11 0.74* 0.12 0.102 0.19 0.13 0.103 0.19 0.13 0.104 0.2003
Gujarat 2.1* 3.9* 3.8* 1.9* 3.9* 3.7* 1.9* 3.9* 3.7* 0.19 0.14 0.201 0.19 0.14 0.202 0.19 0.14 0.203
Maharashta, Goa 2.3* 1.4* 0.99* 2.01* 1.3* 0.78* 1.9* 1.3* 0.81* 0.09 0.07 0.18 0.09 0.08 0.18 0.09 0.08 0.18
Andhra Pradesh 2.9* 1.7* 1.8* 3.03* 1.8* 1.9* 3.1* 1.8* 1.9* 0.1 0.09 0.18 0.102 0.09 0.18 0.102 0.09 0.18
Karnataka 3.3* 3.4* 2.8* 3.2* 3.3* 2.7* 3.2* 3.3* 2.7* 0.15 0.13 0.22 0.15 0.13 0.22 0.15 0.13 0.22
Kerala 5.5* 5.05* 5.1* 4.9* 4.6* 4.6* 4.9* 4.7* 4.6* 0.32 0.32 0.36 0.33 0.32 0.37 0.33 0.32 0.37
Tamil Nadu 3.01* 2.8* 2.8* 2.9* 2.8* 2.7* 2.9* 2.8* 2.7* 0.11 0.09 0.18 0.12 0.09 0.18 0.12 0.09 0.18
Constant -2.41* -1.38* -3.58* -2.50* -1.41* -2.91* -3.37* -2.39* -4.07* N= 20854 p< 0.01