india: global manufacturing hub for chemicals and
TRANSCRIPT

Shri Yogendra Tripathi
India: Global Manufacturing Hub for Chemicals and Petrochemicals
March 2021

India Chem 2021
India- one of the fastest growing economies of the world
India GDP Growth Trends
• India remains an oasis of growth amongst slowing global outlook and in the post pandemic world
Source: IMF, World Bank, RBI, Goldman Sachs
Note: 1- IMF estimates Oct 2020, calendar year basis
An average ~7% annual growth in GDP in the last 20 years
FY99-00 FY19-20
Registered growth of 7.9% in FY 2004 after dot-com crash
FY20-21 FY21-22
-10.3%
-7.5%
-9.6%
-10.3%
13.0%
9.5%
9.6%
8.8%
Goldman Sachs
RBI
World Bank
IMF
-9% average GDP
growth over FY 21
10% average GDP
growth over FY 22
IMF
World Bank
RBI
Goldman
SachsRegistered growth of 8.5% in FY 2010 after global financial crises
2
17 March 2021India: Global Manuf acturing Hub f or Chemicals and Petrochemicals
Real GDP Growth Forecast
for Major Economies1
2023
India
China
France
United Kingdom
Germany
United States
Russia
Japan
World
7.6%
5.7%
2.3%
1.9%
1.8%
2.3%
2.1%
1.2%
3.8%
7.2%
5.5%
1.7%
1.6%
1.2%
1.8%
1.8%
0.6%
3.5%
2025Country
India Chem 2021
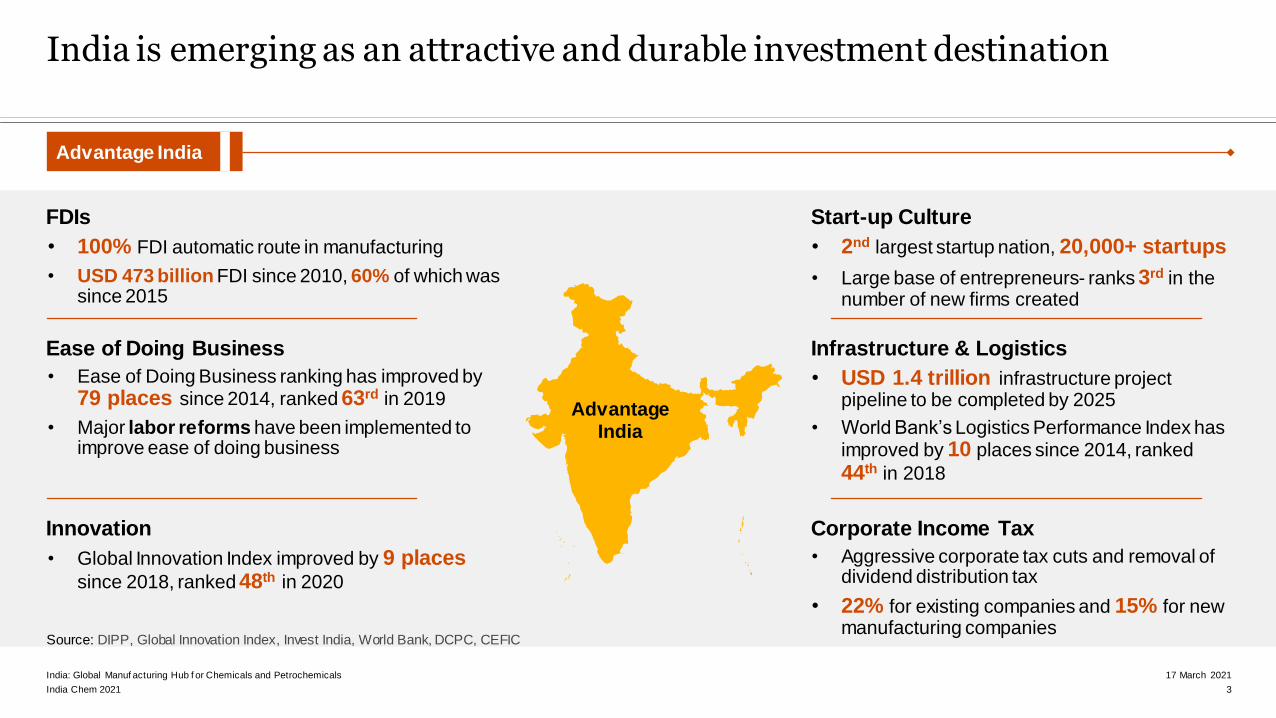
FDIs
• 100% FDI automatic route in manufacturing
• USD 473 billion FDI since 2010, 60% of which was since 2015
Ease of Doing Business
• Ease of Doing Business ranking has improved by 79 places since 2014, ranked 63rd in 2019
• Major labor reforms have been implemented to improve ease of doing business
Innovation
• Global Innovation Index improved by 9 places since 2018, ranked 48th in 2020
Start-up Culture
• 2nd largest startup nation, 20,000+ startups
• Large base of entrepreneurs- ranks 3rd in the number of new firms created
Infrastructure & Logistics
• USD 1.4 trillion infrastructure project pipeline to be completed by 2025
• World Bank’s Logistics Performance Index has improved by 10 places since 2014, ranked
44th in 2018
Corporate Income Tax
• Aggressive corporate tax cuts and removal of dividend distribution tax
• 22% for existing companies and 15% for new manufacturing companies
Advantage India
India is emerging as an attractive and durable investment destination
3
17 March 2021India: Global Manuf acturing Hub f or Chemicals and Petrochemicals
Advantage India
Source: DIPP, Global Innovation Index, Invest India, World Bank, DCPC, CEFIC

India Chem 2021
Manufacturing is a major growth sector for Indian economy
Source: 1- UNCTAD 2019, 2- UNIDO 2019, 3- Global Investment Trend Monitor, 4 Ministry of Micro, Small & Medium Enterprises, 5- Brand Finance, 6- WEF Global Competitiveness Index, 7- UNDP
4
17 March 2021India: Global Manuf acturing Hub f or Chemicals and Petrochemicals
Manufacturing Sector Competency
7th most valued
national brand in the world5
6th among the top
manufacturing countries2
Top 10 FDI
destinations in the world1
Over 63 million
registered MSMEs in India4
1st among
Greenfield FDI destinations in the
world3
Most competitive economy in South
Asia6
2nd Largest steel producer
3rd Largest producer of pharmaceuticals
Largest producer of cars5th
5th Largest exporter of textiles
4th Largest producer of chemicals in Asia
• Urbanization: Urban market shall account for 2/3rd of consumption growth by 2025
• Working population:
• India’s working age population will increase from to 1.03 billion (2030) from 0.86 billion
(2015)
• India’s average median age shall be 37.3 years by 2050- amongst youngest nations
Strong consumer market with a large working population7
India as a manufacturing destination

India Chem 2021
Chemical Industry
Chemicals industry contributes 8.8% to the manufacturing GVA
Source: 1-DCPC, 2-CEFIC 2020 Facts & Figures, 3- Ministry of Stats and Programme Implementation (At Current Prices, for FY 19), 4- Department for Promotion of Industry and Internal Trade , 5- Ministry of Commerce &
Industry, Pw C Analysis
Note: 2- Excludes Pharmaceutical industry
Indian Chemical Industry
5
17 March 2021India: Global Manuf acturing Hub f or Chemicals and Petrochemicals
Contributes 1.4% to the National GVA
3
Contributes 11.3% in India’s exports
5
India contributes to ~3% of the global chemical sales
2
4th largest producer of agrochemicals globally1
Contributes 8.8% to the manufacturing GVA
3
2nd largest manufacturer and exporter of dyes1
Ranks 6th in the World and 4th in Asia for Chemicals sales
2
Covers > 80,000 products, inevitable part of daily life1
Contributes 2.1% to total FDI Equity Inflows
4
Employs ~2 million people1
Weightage of 7.87% - IIP4
3rd largest consumer of polymers globally1

India Chem 2021
Indian Chemical Industry is poised to reach USD 300 billion by FY 25
Source: MOSPI, DCPC, Industry Sources, PwC Analysis
• Demographic Dividends, Low per capita consumption, increasing export demand and enabling government initiatives are the key growth drivers for
the chemicals industry
178166
51 39
Production Imports Exports Demand
276300
Demand
FY 20 FY 25 P
Indian Chemical Industry Market
(USD billion)
Of the total consumption,
about 70% (USD 127 billion) is produced in India
9.2% CAGR
11% CAGR
Business As usual Target
Demand
Indian Chemical Industry
6
17 March 2021India: Global Manuf acturing Hub f or Chemicals and Petrochemicals
25%
21%
19%
15%
20%
Bulk Chemicals
SpecialtyChemicals
Petrochemicals
Agrochemicals &Fertilizers
Others (Biotech,Pharma API,
Others)
Chemical Industry Market by Sub Segments, FY 20 (USD billion)

India Chem 2021
Demand Growth % CAGR (FY 19-25)
HDPE
LDPE
LLDPE
MEG
EO
AcrylonitrilePropylene
Oxide
PP
SBR ABS
Butadiene Rubber
PhenolAcetonePS
Styrene
Caprolactum
PX
PTA
PET
EDC
VCM
PVC
Acetic Acid
Methanol
-4,000
-3,000
-2,000
-1,000
0
1,000
2,000
3,000
0% 1% 2% 3% 4% 5% 6% 7% 8% 9%
Supply
Deficit
Excess
Supply
Su
pp
ly D
em
an
d G
ap
(000’
MT
), F
Y 2
5
Note: Bubble Size indicated the Supply Demand Gap and estimations include impact of COVID-19
Demand Growth (%), FY19-25 Vs Supply Demand Gap (000’ MT), FY 25
Supply demand gap provides attractive business opportunities in 2025
• Integrated styrene projects
may be explored owing to
absence of local players
Source: DCPC, Industry Sources, PwC Analysis & Research
7
17 March 2021India: Global Manuf acturing Hub f or Chemicals and Petrochemicals
• Availability of chlorine is a
challenge for vinyl value chain-
EDC, VCM, PVC. Integrated
projects can be explored.
Derivatives
C1 C2 C3 C4C2/
C6
C3/
C6C8
• Propylene access to merchant market may
trigger opportunities in downstream
chemicals- propylene oxide, propylene
glycol, polyols, acrylic acid, oxo alcohols,
cumene, bisphenol
• Integrated phenol projects may be
explored owing to Increased
custom duty on bisphenol A,
epichlorohydrin & polycarbonate
• Presence of limited players in
acetic acid value chain offers
technology tie-up opportunities

India Chem 2021
Major petrochemical projects under implementation
Source: CPMA, Industry Sources
8
17 March 2021India: Global Manuf acturing Hub f or Chemicals and Petrochemicals
Indicative Products• Polyols- 250 KT• MEG- 110 KT• Propylene Glycol- 110 KT
BPCL Kochi in (2022-23)
Investment: USD 1.5 billion
Indicative Products• PP 500 KTPA• HDPE/LLDPE 1,250 KTPA
HMEL Bhatinda (2021)
Investment: USD 2.6 billion
Indicative Products• PP- 60 KTPA
GAIL Pata UP (2023)
Investment: USD 0.13 billion
GAIL, Usar Maharashtra (2024)
Investment: USD 1.2 billion
Indicative Products• PP- 500 KTPA
Chemplast Cuddalore Vinlys Limited in (2022-23)
Indicative Products• PVC -170 KTPA
Investment: ~USD 0.1 billion
Total Investment: USD ~17.1 billion
Indicative Products• Acrylic acid- 47 KT• Butyl acrylate- 180 KT• 2-Ethyl Hexyl Acrylate- 10 KT• Butanol- 45 KT• 2 Ethyl-Hexanol- 47 KT
BPCL, Kochi in (2021)#
Investment: USD 0.7 billion
Indicative Products• PP 980 KTPA• HDPE/LLDPE 832 KTPA
HPCL Barmer Refinery
Investment: ~USD 6.8 billion
Indicative Products• Ethylene glycols- 350 KT• PX- 800 KT• PTA- 1,200 KT
IndianOil Corporation Ltd, Paradeep (2021-24)
Investment: USD 2.7 billion
JBF Mangalore (2021-22)
Indicative Products• PTA- 1,250 KTPA
Investment: USD 0.8 billion
Indicative Products• Acrylic acid- 90 KT• Butyl acrylate- 153 KT• Butanol- 100 KT
IOCL, Dumad (2022-23)
Investment: USD 0.6 billion
Indicative Products• PP- 200 KT
IOCL, Barauni (2023)
Note: #- the complex is mechanically completed and is under commissioning

India Chem 2021
Major petrochemical projects under consideration
Source: CPMA, Industry Sources
9
17 March 2021India: Global Manuf acturing Hub f or Chemicals and Petrochemicals
Indicative Products• PBR- 110 KTPA
GAIL/OPaL, Dahej, Gujarat
Investment: ~USD 0.15 billion
Indicative Products• Petroleum products• Petrochemicals
RRPCL, Ratnagiri, Maharashtra
Investment: USD 40 billion
BPCL Raigad, Maharashtra
Investment: USD 6.2 billion
Indicative Products• PP- 450 KTPA• PE- 1,500 KTPA
Indicative Products• PE 1,080 KTPA• PX 1,600 KTPA• PTA 1,250 KTPA
Haldia Petrochemicals, Balasore, Orissa
Investment: USD 10.5 billion
Haldia Petrochemicals, Haldia, West Bengal
Investment: ~USD 0.35 billion
Indicative Products• PBR/ SBR- 100-123 KTPA
Indicative Products• BR/SSBR- 60 KTPA• ESBR 60 KTPA
ISRPL, Panipat, Haryana
Investment: USD 0.2 billion
Reliance Jamnagar, Gujarat
Investment: USD 10 billion
Indicative Products• PE 3.5 MMTPA• PP 5.2 MMTPA• PVC 4.5 MMTPA• Synthetic rubber
Total Investment: USD 87.4 billion
Indicative Products• Petroleum products• Petrochemicals- PP, HDPE, LLDPE,
LDPE/ EVA, Benzene, Cumene, MEG, LAB, C2, C3
Nayara Energy, Vadinar, Gujarat under construction
Investment: USD 20 billion

India Chem 2021
Competitiveness of India w.r.t. global petrochemicals hub
0.13 0.07
0.12 0.10
0.12 0.11
0.16 0.07
0.23
BrazilIndonesia
IndiaChina
ThailandMalaysia
MexicoSaudi Arabia
Germany
Power Rates (USD/ kWh)
183118
60158
256277
134616
1,708
BrazilIndonesia
IndiaChina
ThailandMalaysia
MexicoSaudi Arabia
Germany
Minimum Labor Rates (USD/ month)
Source: Data on minimum monthly w ages w as collected from various sources including: India (Nagaland - Dept of Labour, Delhi - Govt of NCT of Delhi State Govt), Asean Briefing, Nov 2019 (Indonesia, Central Java, DKI
Jakarta), Vietnam Briefing, Nov 2019 (Vietnam, Region IV, Region I), Reuters, Dec 2019 (Mexico, Non-border, Border Zone), MOHRSS, Jun 2018 (China, Liaoning, Shanghai), Bangkok Post, Dec 2019 (Thailand, Yala, Chon
Buri and Phuket), Bloomberg, Jan 2020 (Brazil, National), Asean Briefing, Feb 2020 (Malaysia, National), US Dept. of Labor, Wage Indicator Foundation, World Bank, GlobalPetrolPrices
Data on electricity charges w as sourced from GlobalPetrolPrices.com as accessed on 20 Feb, 2021
10
17 March 2021India: Global Manuf acturing Hub f or Chemicals and Petrochemicals
Feedstock
Access1
Market
Access2
Capital
Cost3
Operating
Cost4
Commissioning
period5
Overall
Middle East 4 2 3 1 1 2.2
US 1 1 1 2 2 1.4
Europe 1 1 1 2 1 1.2
India 1 4 4 4 4 3.4
China 1 3 3 3 4 2.8
South East
Asia1 2 4 2 2 2.2
(1) Based on the local availability of petrochemical feedstocks
(2) Based on average demand grow th rate of major petrochemicals for 2019-2030
(3) Based on location factor, pre fabrication and construction costs
(4) Based on average monthly salary of employee, electricity costs, etc.
(5) Commissioning period based on examples of large petrochemical projects Highly attractive
Unattractive

India Chem 2021
Factors promoting India’s manufacturing competitiveness
Source: PwC Worldwide Tax Summaries Corporate Taxes 2018/19, MOSPI, Centre for Economics and Business Research, UK, Department of Economic Affairs, Invest India, Note: NIP- National Infrastructure Pipeline, FTA- Free Trade Agreement, PTA- Preferential Trade Agreement, FDI- Foreign Direct Investment, NSDC- National Skill Development Corporation
11
17 March 2021India: Global Manuf acturing Hub f or Chemicals and Petrochemicals
Key Investor Expectations
Good Governance
• Politically stable with good political and trade
relations with leading markets
• Development Council and Advisory Forum- Redressal
of Public Grievances & Challenges
High Quality Infrastructure
• Development of 5 industrial corridors for integrated
industrial development
• Commitment of USD 1.5 trillion as part of NIP
• 3,382 industrial parks spread across 0.475 million
hectare land
• Development of PCPIRs
Strong Regulatory & Tax Framework
• Industrial licensing has been abolished for most sub-
sectors except in hazardous chemicals
• Corporate tax rate: 22% for existing companies and
15% for new manufacturing companies
Quality Labor at Competitive Cost
• Sector-specific Skills Development programme
supported by NSDC schemes
• Competitive labor wages 60-258 USD/ month
• Standardized wages, bonus, trainings, social security
benefits for workers
Robust Investment Policy
• Make in India: USD 357 billion in FDI till FY 20 since
launch in FY 14
• 100% FDI permitted through Automatic Route
• PLI scheme for total 12 sectors – attractive incentives
and cash back benefits
Robust Domestic demand
• The large and aspirational Indian middle class
provides a readily available market
• India to become 3rd largest consumer market by FY 25
• 25 cities in India are among the world’s top 100 fastest
growing cities
Factors Promoting India’s Manufacturing Competitiveness

India Chem 2021
Policy initiatives acting as “Game Changers“ for Indian Chemical Industry
Source: DCPC, Ministry of Labor & Employment, Union Budget 2021-22, Industry Sources, WIPO, Chemexcil, PwC Analysis
Note: NIP- National Infrastructure Pipeline, BIS- Bureau of Indian Standards, NSDC- National Skill Development Corporation, IP- Intellectual Property, FTA- Free Trade Agreement, *Scheme criteria
12
17 March 2021India: Global Manuf acturing Hub f or Chemicals and Petrochemicals
Governance and
Clearances
Reduced paper work
& faster clearance for
project proposals, IP
applications, port jobs
Development Council
and Advisory Forum
for redressal of
public grievances &
challenges
Better Trade
Intelligence (New 8
digit HS Codes)
Skilled Man Power &
Labor Laws
Sector-specific Skills
Development
Programme
(NSDC Scheme)
New Codes on
Wages, Occupational
Safety, Health &
Working Conditions,
Social Security,
Industrial Relations
Compensation on
Accidents
Industrial
Infrastructure
Scheme for Setting
up Plastic Parks
(funding up to 50% of
cost of project*)
National
Infrastructure
Pipeline (NIP)-
Proposed PCPIR
Projects (Odisha &
Gujarat)
Scheme for Setting
up Mega Textile
Parks
Public procurement
policy for a total 28
Chemicals and
Petrochemicals
Local Manufacturing,
Exports & Innovation
Revised custom
duties on chemicals &
petrochemicals,
(Budget 2021-22)
Global Intellectual
Property Treaties
Centers of
Excellence and
National Awards
Export Promotion
Schemes and FTAs
Availability of
Feedstock
Reduction in Basic
Custom Duty on
naphtha
(Budget 2021-22)
New addition- Barmer
Petrochemical
Cluster
Regulations and
Quality Standards
BIS Standards for
imported & locally
produced chemicals &
petrochemicals
Note: NIP- National Infrastructure Pipeline, BIS- Bureau of Indian Standards, NSDC- National Skill Development Corporation, IP- Intellectual Property, *Ceiling at USD 5.6 mil

India Chem 2021
Production Linked Incentive Scheme for manufacturing sector
Competitive & efficient
domestic manufacturing
1Attract investment in
core sectors & cutting
edge technologies
2
Make India part of
global supply chain
4
Enable economies of
scale and exports
3
Objective of the PLI scheme
Impact and benefits of scheme
The minimum production in the country as an outcome of the PLI scheme stands to be
around USD 56 billion in the next 5 years
Cashback and incentives between 2% and 20% of the incremental sales revenue
(over the base year) and incremental exports revenue depending on the sector
Potential to create ~14 million man-months’ worth of jobs directly from 2021-22
Polymers, resins, fibres, APIs, bulk chemicals, paints, pigments, food additives, etc.
Increase in demand for Chemicals & Petrochemicals
High Efficiency Solar PV Modules, 0.6
Electronic/ Technology Products, 0.7
White Goods (ACs & Amp, LED), 0.8
Speciality Steel, 0.9
Textile Products, 1.4
Food Products, 1.5
Telecom & Networking
Products, 1.6
Pharmaceuticals, 2.0
Advance Chemistry Cell (ACC) Battery,
2.4
Automobiles & Auto
Components, 7.7
PLI Scheme Outlay for 10 Sectors (USD billion)
Total: USD 19.6 billion
PLI Scheme previously announced for Domestic
manufacturing of Key Starting Materials (KSMs), Drug Intermediates (DIs) and Active Pharmaceutical Ingredients
(APIs) and Medical DevicesSource: Government of India, PwC Analysis
13
17 March 2021India: Global Manuf acturing Hub f or Chemicals and Petrochemicals

India Chem 2021
India’s Ease of Doing Business ranking
Source: World Bank, Industry Sources, PwC Analysis
14
17 March 2021India: Global Manuf acturing Hub f or Chemicals and Petrochemicals
Process Single form for company formation
TimeFast track approval for construction
permits
LegalCommercial Courts and Appellate
Division of High Courts established
ExitInsolvency and Bankruptcy Code
2016 for resolving insolvency
TradeIndian Customs Single Window
Project implemented
Key initiatives which helped achieve 63 rank: Ease of Doing Business: Top parameter-wise rankings*
* Lower rank in a given parameter represents better positioning of the respective country
For India #, 2019; (#), 2014
Overall rank Getting creditTrading across
borders
Resolving
insolvency
Getting
electricity
* Lower rank in a given parameter represents better positioning of the respective country
India
73
60
124
70
63
Indonesia
Mexico
Brazil
Vietnam
India
48
11
104
25
25
116
69
108
104
68
38
33
77
122
52
33
106
98
27
22(142) (36) (126) (137) (186)

India Chem 2021
It is the right time to invest in INDIA
To seize the opportunity to establish India as a leading chemicals & petrochemicals manufacturing hub,
• with a thrust on reduction in import dependency
• by attracting investments for manufacturing quality products
• using cutting-edge technologies
• in specified clusters
• with focus on sustainability
...contribute to manufacturing sector of USD 5 Trillion Indian Economy
Vision of Department of Chemicals and Petrochemicals