india feasibility study on the bottom of the pyramid...
TRANSCRIPT

Republic of India
India
Feasibility Study on the Bottom of
the Pyramid (BOP) business
promotion on Drinking Water
Supply with flocculants
Summary
April 2014
Japan International Cooperation(JICA)
Poly-Glu International Co., Ltd.
Kaihatsu Management Consulting, Inc.
OS
JR14-033

Table of Contents
Outlines of Study .................................................................................................................. 1
Summary ............................................................................................................................... 3
Chapter 1 Business environment ................................................................................... 3
Chapter 2 Pilot Project ..................................................................................................... 6
Chapter 3 Business Plan ................................................................................................ 10
Chapter 4 Possibility of collaborating with other JICA schemes .............................. 12
Chapter 5 Development Effect ...................................................................................... 13
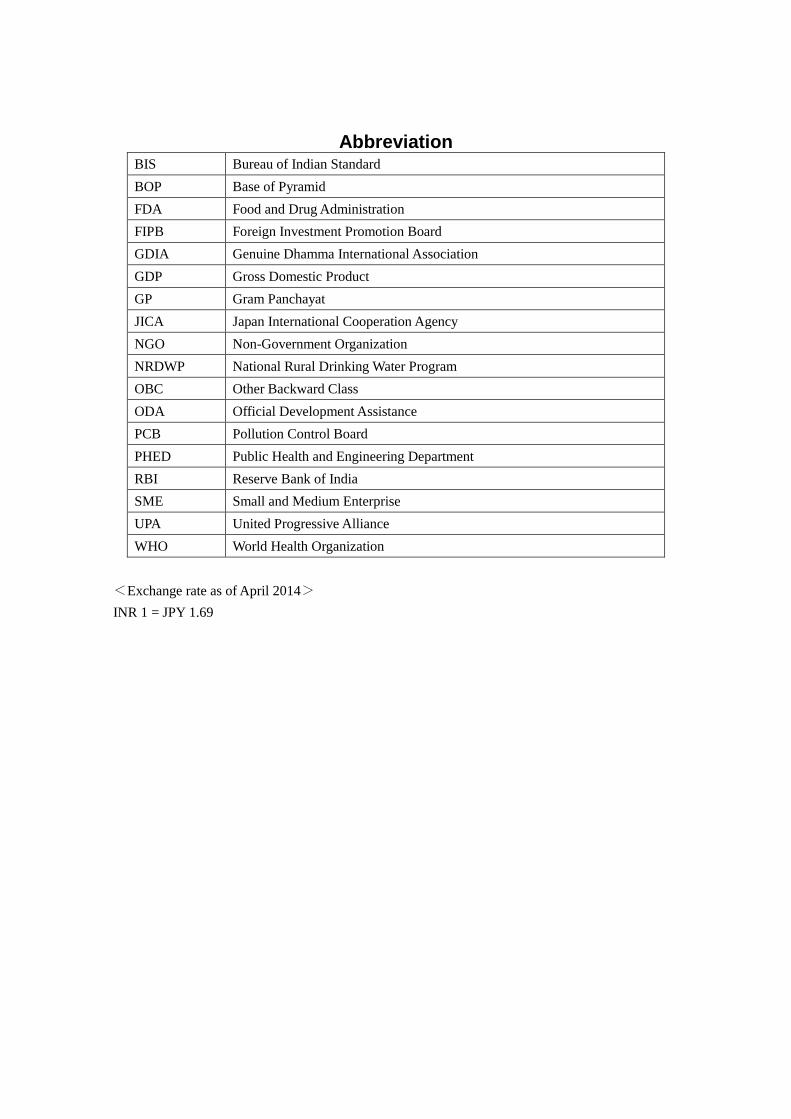
Abbreviation BIS Bureau of Indian Standard
BOP Base of Pyramid
FDA Food and Drug Administration
FIPB Foreign Investment Promotion Board
GDIA Genuine Dhamma International Association
GDP Gross Domestic Product
GP Gram Panchayat
JICA Japan International Cooperation Agency
NGO Non-Government Organization
NRDWP National Rural Drinking Water Program
OBC Other Backward Class
ODA Official Development Assistance
PCB Pollution Control Board
PHED Public Health and Engineering Department
RBI Reserve Bank of India
SME Small and Medium Enterprise
UPA United Progressive Alliance
WHO World Health Organization
<Exchange rate as of April 2014>
INR 1 = JPY 1.69

Location of Project Site
UDASA
1
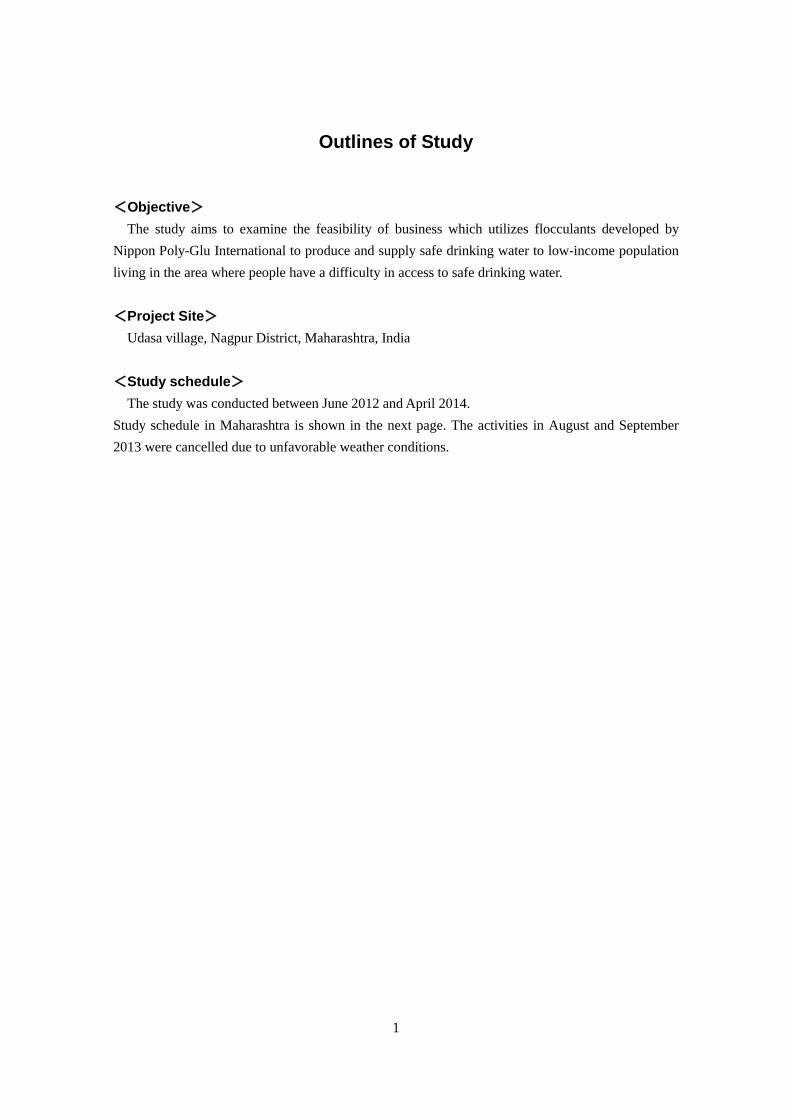
Outlines of Study
<Objective>
The study aims to examine the feasibility of business which utilizes flocculants developed by
Nippon Poly-Glu International to produce and supply safe drinking water to low-income population
living in the area where people have a difficulty in access to safe drinking water.
<Project Site>
Udasa village, Nagpur District, Maharashtra, India
<Study schedule>
The study was conducted between June 2012 and April 2014.
Study schedule in Maharashtra is shown in the next page. The activities in August and September
2013 were cancelled due to unfavorable weather conditions.

2
Study Schedule
22 29 6 13 20 27 3 10 17 24 1 8 15 22 29 7 14 21 28 4 11 18 25 2 9 16 23 6 13 20 27 3 10 17 24 3 10 17 24 31 7 14 21 28
Literature review
Field survey
Baseline survey
Develop questionnaire
Implement survey
Data entry
Send data to KMC
Setup treatment facility
Employ staffs
Training
Test water quality
Operation (1st phase)
Review
Operation (2nd phase)
Review
Business plan development
Draft business plan
Review and revise the plan
Survey on potential scaling out
Finalize business plan
Endline survey
Develop questionnaire
Implement survey
Data entry
Send data to KMC
Hold a seminar to disseminate outcomes
Writing reports
Submission of Progress reports
Submission pf Draft final report
Submission of Final report
Survey in Japan Activities by GDIA and staffs Survey in India
January February March April
Survey on present conditions and
business environment
Pilot project
2013 2014
April May June July October November December

3
Summary
Chapter 1 Business environment
(1) Overview
India, with its population of 1.2 billion, is a great regional power in South Asia. India has been a
parliamentary democracy, the world’s largest, since its independence in 1947. India began to
liberalize its economy in 1991 and has sustained high economic growth while increasing its presence
in the global economy. To attract foreign investment, the Indian government has been gradually
deregulating its foreign investment regime.
(2) Policies and legal framework for drinking water supply
The national Ministry of Urban Development is in charge of the urban drinking water supply, while
the Ministry of Rural Development takes care of rural areas. Drinking water supply projects are
fundamentally state responsibilities, however; the central government is limited to providing policy
guidance as well as technical and financial assistance to state governments.
Under India’s flagship rural drinking water supply program, the National Rural Drinking Water
Program (NRDWP), state governments are responsible for planning, monitoring, and providing
technical assistance for their water supply projects. The Gram Panchayats (GPs) are responsible for
implementing the projects in their villages.
The Bureau of Indian Standard (BIS) sets India’s water quality standard. To sell drinking water
widely in urban areas, businesses must satisfy a water quality standard, pass a water safety appraisal
by the Pollution Control Board (PCB), and obtain permissions from the Food and Drug
Administration (FDA) and the BIS. However, a business can sell drinking water to a limited number
of people in rural areas if it has obtained permission from the village’s GP.
(3) Present conditions of the drinking water supply
The 2011 census reveals that 32% of India’s households use treated tap water; the rest use untreated
tap water, well water, or surface water. States show wide gaps in their tap water coverage, and tap
water coverage is higher in urban areas than in rural areas.
In Maharashtra, most households in both urban and rural areas use tap water. However, less than
60% of households have access to tap water, while almost 90% of urban households do. Almost half
of rural households use wells, and 10% are dependent on unprotected water sources.

4
Figure 1-1 Water sources in Maharashtra, as a percentage (2008/09)
(Source: http://mahades.maharashtra.gov.in/files/publication/unicef_rpt/chap7.pdf)
Urban and rural areas display very different water source usages. While 60% of urban households
use water sources exclusively for themselves, 69% of rural households share their water sources with
others, and 60% of rural households use water sources owned by the community; this suggests that
fetching water is still a heavy burden in rural areas.
Many rural households in Maharashtra depend on shared wells and suffer from inadequate water
volumes. Thus, securing sufficient water remains a significant issue in rural areas.
(4) Present conditions of water contamination
As the use of ground water increased in rural areas, chemical contamination (especially that of
arsenic and fluoride) became a significant issue, as its impact on health is very serious. As shown in
the table below, water quality issues are especially serious in Rajasthan.
Among India’s water contaminations problems, bacteria, fluoride, and arsenic are the most serious
in terms of both gravity and scale.
Using small point-of-use appliances such as filters is the common way to address bacteriological
contamination, while state governments have installed special purification plants in arsenic-prone
areas.
However, no affordable, low-cost solutions for fluoride contamination suitable for low-income
populations have yet been found, and the government has been slow to address this issue because of
the high costs and technical difficulties involved. Consequently, many people suffer from fluorosis,
which can affect bones and joints.

5
Table 1-1 Affected populations by state
(Source: http://indiawater.nic.in)
The figure below compares the percentages of households using unimproved water sources by
wealth quintile. The percentage is much higher in rural than in urban areas. As household incomes
decrease, the percentage of households using unimproved water sources increases, indicating that
poor people are disproportionately affected by water contamination.
Figure1-2 Percentage of households using unimproved water sources by wealth quintile
(Source: http://mahades.maharashtra.gov.in/files/publication/unicef_rpt/chap7.pdf)
The government recommends using contaminated water for washing and bathing and water from
No StateTotal population
affectedFluoride Arsenic Iron Salinity Nitrate
1 Rajasthan 8,819,007 3,969,304 0 10,663 3,584,401 1,254,639
2 Andhra Pradesh 4,548,172 2,777,478 0 153,067 1,185,148 432,479
3 Bihar 3,977,418 451,810 245,857 3,279,278 0 473
4 Assam 3,872,447 2,122 142,606 3,727,719 0 0
5 West Bengal 3,554,608 77,910 1,297,072 2,178,657 969 0
6 Maharashtra 2,254,685 807,993 0 316,973 392,693 737,026
7 Orissa 2,051,603 60,675 0 1,776,361 206,897 7,670
8 Kerala 1,798,904 207,246 0 1,187,877 303,185 100,596
9 Karnataka 1,618,996 784,911 15,064 247,962 222,680 348,379
10 Tripura 1,386,488 0 0 1,386,488 0 0
11 Chattisgarh 958,359 28,116 0 889,977 40,266 0
12 Madhya Pradesh 692,551 590,367 0 49,591 52,593 0
13 Uttar Pradesh 453,814 160,467 139,672 51,240 101,849 586
14 Punjab 260,080 0 0 256,205 3,875 0
15 Tamil Nadu 197,427 1,579 0 179,094 16,204 550
16 Uttarakhand 95,711 10,810 0 70,919 0 13,982
17 Gujrat 93,385 13,595 0 0 0 79,790
18 Nagaland 33,602 0 0 33,602 0 0
19 Arunachal Pradesh 31,340 0 0 31,340 0 0
20 Haryana 25,735 25,735 0 0 0 0
36,773,496 9,974,818 1,840,271 15,869,820 6,112,417 2,976,170
4.Habitations with any contamination including salinity and without arsenic, fluoride and iron are counted under "salinity" column.
5.Habitations with only nitrate contamination are counted under "nitrate" column.
Total
1.Habitations with any contamination including arsenic are counted under "arsenic" column.
2.Habitations with any contamination including fluoride and without arsenic are counted under "fluoride" column.
3.Habitations with any contamination including iron and without arsenic and fluoride are counted under "iron" column.
6
safe sources for drinking. If no safe water source is available, the government recommends 1)
establishing new stand posts for safe water, 2) establishing new water sources, and 3) defluoridating
existing high-fluoride water sources.1
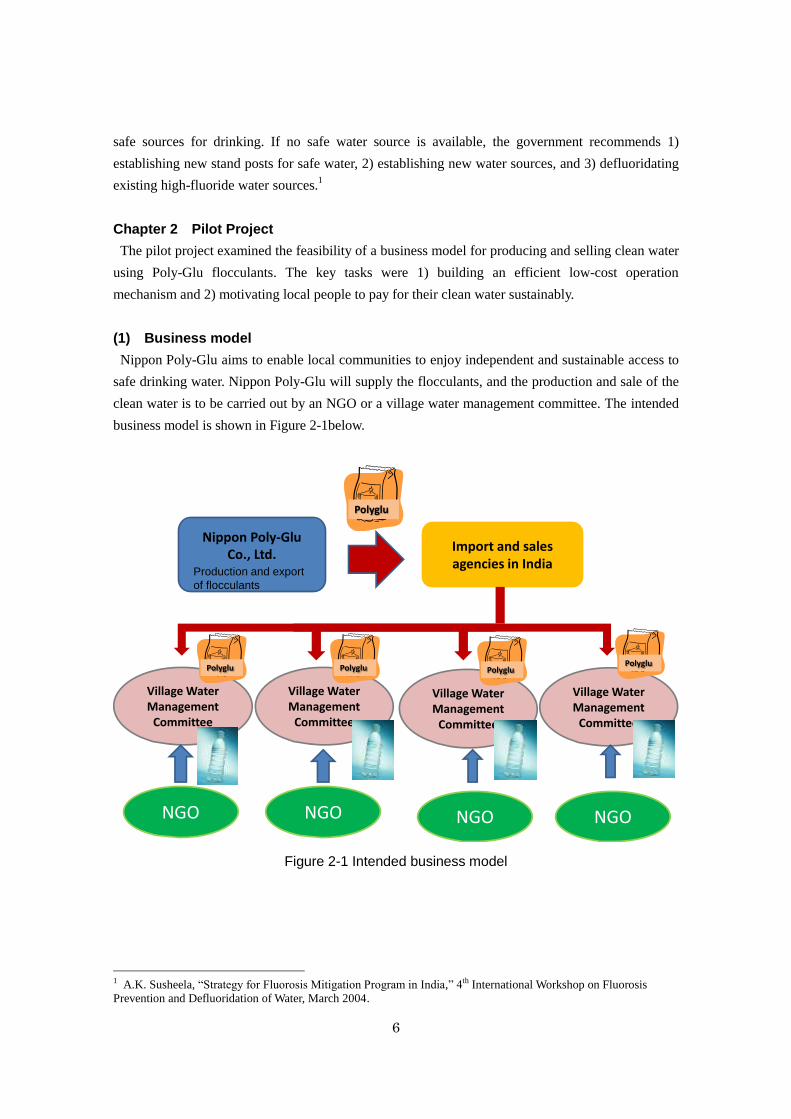
Chapter 2 Pilot Project
The pilot project examined the feasibility of a business model for producing and selling clean water
using Poly-Glu flocculants. The key tasks were 1) building an efficient low-cost operation
mechanism and 2) motivating local people to pay for their clean water sustainably.
(1) Business model
Nippon Poly-Glu aims to enable local communities to enjoy independent and sustainable access to
safe drinking water. Nippon Poly-Glu will supply the flocculants, and the production and sale of the
clean water is to be carried out by an NGO or a village water management committee. The intended
business model is shown in Figure 2-1below.
Figure 2-1 Intended business model
1 A.K. Susheela, “Strategy for Fluorosis Mitigation Program in India,” 4th International Workshop on Fluorosis
Prevention and Defluoridation of Water, March 2004.
Village WaterManagementCommittee
Village WaterManagementCommittee
Village WaterManagementCommittee
Nippon Poly-GluCo., Ltd.
Production and export
of flocculants
Import and salesagencies in India
NGO NGO NGO NGO
Polyglu
Village WaterManagementCommittee
Polyglu Polyglu PolygluPolyglu

7
Table 2-1 Tested business model
Entity Task Issues examined
Nippon Poly-Glu Co.
Ltd.
Production and export
of flocculants, technical
support
・ To export flocculants at a price and volume
sufficient to ensure profit.
・ To establish processes for the stable supply
of safe water
Import and Sales
agencies
Import and sales of
flocculants
・ To establish a stable and efficient sales
system for flocculants
Village Water
Management
Committee
Purchasing water and
consumption
・ To establish a mechanism for producing
and selling clean water sustainably using
Poly-Glu flocculants
・ To establish a mechanism for sustainably
recovering the costs required to carry out
the tasks listed above
NGO Production and sale of
treated water and
awareness-raising
activities
The pilot project aimed to establish a model by which an NGO can produce and sell clean water in
a village using Poly-Glu flocculants.
(2) Pilot Project
1) Project site
The natural and social conditions of Udasa village, the pilot site, were investigated. The results are
listed below.
Natural conditions
Udasa village is 38 km from Nagpur, the second biggest city in Maharashtra. It takes about an hour
by car from Nagpur to Udasa.
The village is in a flat area. It is completely dry during the dry season but experiences heavy
rainfall during the rainy season. Its annual rainfall is around 1,300 mm. Nagpur is known as the
hottest city in India. Temperatures in Udasa can reach up to 45 degree centigrade in April and May.
Social and economic conditions
Udasa has around 3,000 people and approximately 600 households. Although most inhabitants are
farmers, some are migrants working for the steel company or coal mines in the area. The village’s
main crops are soybeans and rice.
Of the village’s population, 60% are in the Other Backward Class (OBC), 20% in tribes, 15% are
Buddhists, and 5% are “others.” Village incomes are very low; the average annual household income
is between INR 21,000 and INR 40,000. A quarter of the population lives below the poverty line of
INR 21,000 per household per year.
The village’s education level, and especially that of its tribes, is low. The literacy rate for both
8
males and females is around 25%. However, the Buddhist community is highly aware of the
importance of education and has achieved a 100% literacy level. The entire village has seen an
increased interest in education, recently achieving a 100% primary-school enrolment rate for boys.
2) Baseline survey
A questionnaire survey assessing the baseline social and economic conditions of the village was
conducted on 100 samples living in Udasa. The samples consist of 60 respondents from among the
OBC, 20 from among the tribes, and 20 from among the Buddhists. The respondents were married
women with children; they had to be at least 17 years old and be able to respond to the questions and
explain their household’s conditions.
Table2-2 Composition of questionnaire
Category Questions
1. Water use Water source, Fetching water, Water consumption, Water quality,
Water treatment, Cost of treatment
2. Health conditions Level of understanding of the relation between water and health,
Health conditions, Water-borne diseases, Cost of medical treatment
3. Willingness to pay Willingness to pay, Payable amount, Concerns about water safety
4. Personal information Occupation, Education level, Monthly consumption, Number of
household members
The outcomes of the baseline survey are shown in Table 2-3 below.
Table 2-3 Summary of outcomes of baseline survey
Category Outcomes of survey
1. Water use ・ 80% of respondents use tap water from a government tank that
sources water from the river. However, many people also use water
from public wells or buy water from tankers between April and June,
when the river is dry in the dry season. For those fetching water from
a well, it takes ten to thirty minutes to reach one.
・ Water shortages and poor water quality are among the village’s
major water-related issues. More than 80% of respondents identified
water color and smell as problems.
・ Almost all respondents treat the water before drinking it, usually by
putting alum in it and filtering it with a cloth.
2. Health conditions ・ Almost all respondents understand that water can be a cause of
illness.
・ Only 20% of respondents said they had no health problems, while
80% said they had some health problems. Major health issues
include stomach ache (62), dehydration (50), and high fever (42).
skin irritation (22) and headache (18) were also cited.
・ Udasa has no medical facility. Patients go to district hospitals in
Nagpur or private doctors in Umred.

9
Category Outcomes of survey
・ As the chances of sickness are high, medical expenses are also high.
Respondents spend an average of INR 10,000 annually on medical
expenses.
3. Willingness to pay ・ 84% of respondents said they wanted to buy clean water.
・ When asked how much they would pay for 10 liters of clean water,
respondents ranged from INR 1 to INR 20, for an average of INR 2
to INR 4.
・ More than 90% of respondents expressed concerns about the safety
of Poly-Glu’s flocculants, which reveals a high level of water quality
awareness. In addition, 85% of respondents said they trusted NGOs’
opinions on water safety most highly.
Although the pilot project area has a water supply scheme, poor water quality and a high incidence
of waterborne diseases indicate the acute need for safe and clean drinking water, for which most
villagers are willing to pay. On the other hand, as people are very concerned about water safety,
customers need to have the safety of Poly-Glu demonstrated to them when they are being sold clean
water treated by Poly-Glu flocculants.
3) Implementation
The pilot project occurred between September 2013 and March 2014. Safe and clean water treated
by Poly-Glu flocculants was produced by a NGO and distributed to the local community. The project
is summarized in the table below.
Table 2-4 Summary of the pilot project
Period Sep.–Dec. 2013 Dec. 2013–Mar. 2014
Water production capacity 1 ton/time 2 tons/time
Water production volume 2 tons/day 4 tons/day
Distribution volume/house 20 liter/day 20 liter/day
# of households 70 137
Price INR 100 /month INR 100 /month
Payment 1 time/month 1 time/month
(3) Review of pilot project
The pilot project was implemented smoothly and efficiently to a successful completion due to the
efforts of the NGO that took a leading role.
The NGO’s staff was trained in setting up a water treatment facility and a water purification process.
The staff also conducted awareness-raising activities on health and sanitary issues and followed
sanitary procedures during their daily operations. The NGO’s door-to-door water delivery system
gained a good reputation among customers and helped increase the system’s customer base.

10
Despite its smooth operation, the project struggled to secure sufficient water sources, optimize
delivery, ensure proper sludge management, upgrade its awareness-raising program, and improve its
accounting. These are the main challenges for the future.
Moreover, the project ran a deficit of INR 17,000, as the cost of delivering the source water was
high, and the sales volume remained way below target. The project could be profitable if a pipeline
from the river were laid and if the sales target were achieved, as the table below shows.
Table 2-5 Operating costs necessary to produce 5.4–6 tons in Udasa
Chapter 3 Business Plan
An overview of the business plan is shown in Figure 3-1 below. In the first phase, a model for rural
water supply is established by studying the feasibility of the program’s operational mechanism and
cost recovery through the pilot project. The model is then disseminated in Maharashtra in the second
phase. Issues such as business experience, market needs, and potential business are studied in the
third phase, during which the business is rolled out throughout the country.
Figure 3-1 Overview of business plan
Items unit cost (Rs) unit subtotalClorine 460 4.5litters 2,070Transportation for delivery 350 30days 10,500Fulltime staff 4,000 5 person 20,000Parttime support staff 1,500 4 person 6,000Electricity 400 1 month 400PolyGlu 9kg 7,000
45,970Revenue 200 300 60,000
14,030
Operation Cost necessary for producing 5 .4~6tons
Total
Balance

11
(1) Business operational mechanism
The pilot project demonstrated the feasibility of establishing a water purification process and an
operational mechanism for water production and sales. It also showed that an experienced staff with
the appropriate knowledge and skills was necessary to disseminate the pilot to other areas in India.
An analysis of the pilot project resulted in the planned business model being changed from that seen
in Figure 2-1 to that seen in Figure 3-2 below.
Figure 3-2 New business model
The roles of each of the concerned program entities are described below.
Entity Role
Nippon Ply-Glu Co., Ltd. Produce and export the flocculant, provide technical advice for
NGO, conduct regular monitoring
NGO (GDIA) Import and sell the flocculant, provide technical training on
establishing facilities, water purification process, and water
quality tests as well as on conducting maintenance and
awareness-raising for village water management committee or
implementing entity
Village water management
committee/implementing
entities
Establish and maintain water treatment facility, produce and sell
water to end-users, conduct awareness raising activities for
promotion
Import and sales agency Import and sell the flocculant to private businesses and public
organizations for public works
12
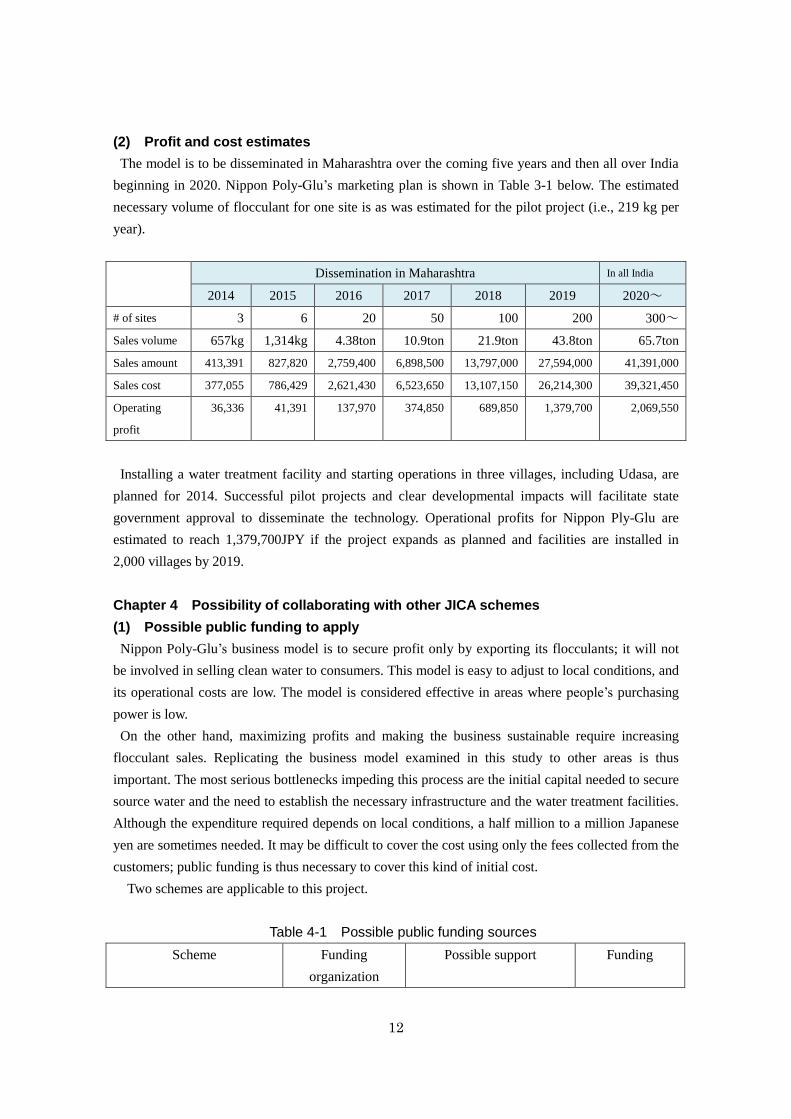
(2) Profit and cost estimates
The model is to be disseminated in Maharashtra over the coming five years and then all over India
beginning in 2020. Nippon Poly-Glu’s marketing plan is shown in Table 3-1 below. The estimated
necessary volume of flocculant for one site is as was estimated for the pilot project (i.e., 219 kg per
year).
Dissemination in Maharashtra In all India
2014 2015 2016 2017 2018 2019 2020~
# of sites 3 6 20 50 100 200 300~
Sales volume 657kg 1,314kg 4.38ton 10.9ton 21.9ton 43.8ton 65.7ton
Sales amount 413,391 827,820 2,759,400 6,898,500 13,797,000 27,594,000 41,391,000
Sales cost 377,055 786,429 2,621,430 6,523,650 13,107,150 26,214,300 39,321,450
Operating
profit
36,336 41,391 137,970 374,850 689,850 1,379,700 2,069,550
Installing a water treatment facility and starting operations in three villages, including Udasa, are
planned for 2014. Successful pilot projects and clear developmental impacts will facilitate state
government approval to disseminate the technology. Operational profits for Nippon Ply-Glu are
estimated to reach 1,379,700JPY if the project expands as planned and facilities are installed in
2,000 villages by 2019.
Chapter 4 Possibility of collaborating with other JICA schemes
(1) Possible public funding to apply
Nippon Poly-Glu’s business model is to secure profit only by exporting its flocculants; it will not
be involved in selling clean water to consumers. This model is easy to adjust to local conditions, and
its operational costs are low. The model is considered effective in areas where people’s purchasing
power is low.
On the other hand, maximizing profits and making the business sustainable require increasing
flocculant sales. Replicating the business model examined in this study to other areas is thus
important. The most serious bottlenecks impeding this process are the initial capital needed to secure
source water and the need to establish the necessary infrastructure and the water treatment facilities.
Although the expenditure required depends on local conditions, a half million to a million Japanese
yen are sometimes needed. It may be difficult to cover the cost using only the fees collected from the
customers; public funding is thus necessary to cover this kind of initial cost.
Two schemes are applicable to this project.
Table 4-1 Possible public funding sources
Scheme Funding
organization
Possible support Funding

13
Grant assistance for
grassroots projects
Embassy of Japan Infrastructure development,
provision of equipment
JPY 10 million
Pilot survey for
disseminating SME’s
technologies
JICA Infrastructure development,
provision of equipment and
technical assistance
JPY 100 million
The former scheme supports equipment installation as an initial investment in a single NGO project
site. Although its application and selection processes are simple and quick, it cannot be applied to
large scale or multiple project sites.
The latter scheme verifies and disseminates the products and technologies of Japanese small and
medium enterprises (SMEs) in response to the needs of developing countries. This scheme requires a
government agency to act as an implementation organization.
(2) Scenario applying pilot survey
1) Basic concept
・ To examine the feasibility of a low-cost water supply model using Poly-Glu flocculants in the
fluoride-affected areas of Maharashtra.
・ The government of Maharashtra will be the implementation organization.
・ The pilot will be implemented as a part of the NRDWP. The fund will cover infrastructure
development, the installation of treatment facilities, and technical assistance. If the pilot is
successful, the model may be spread through the NRDWP to other areas or states. The
operational mechanism of the model is shown below:
Installation of treatment facility and infrastructure development: central and state
governments
Ownership of facilities: village water management committee
Management of facilities: village water management committee
Facility operation, including cost recovery: NGO
2) Discussion with the counterpart organization
Three meetings were held with the Director, Water Supply and Sanitation Department, Government
of Maharashtra, in December 2013 and in January and April 2014. He was particularly interested in
the ability of Poly-Glu flocculants to remove fluoride. As the water sources of some areas in
Maharashtra suffer from fluoride contamination, they require a low cost technology for removing
fluoride safely. However, they requested more detailed information on the safety of Poly-Glu
flocculants and the water produced by it as well as on its production cost.
Chapter 5 Development Impacts
(1) How to measure development impacts
A baseline survey was conducted to assess the social and economic conditions and water usage of
the people living in the pilot village before the pilot project began. An endline survey was also

14
conducted on the same samples used for the baseline survey as well as on people who bought water
cleaned by Poly-Glu during the pilot period just before the pilot project was completed. The results
of the endline survey were compared with those of the baseline survey to evaluate the development
impacts.
(2) Targeted development impacts and indicators
The project aims to improve the health and economic conditions of its beneficiaries by improving
their access to safe drinking water. However, as observing clear changes within the limited study
period would be difficult (since health and economic conditions take a long time to change), it was
decided to include satisfaction levels along with water quality as a development indicator.
(3) Outcomes of endline survey
The endline survey was conducted using a questionnaire. The samples consist of 34 OBC, 48
tribal, and 39 Buddhist Poly-Glu-treated water customers and 39 OBC, three tribal, and
five Buddhist non-Ply-Glu-treated water customers. The results of the survey are shown in
Table 5-2 below.
Table 5-2 Summary of endline survey results
Category Outcomes of survey
1. Satisfaction with
water
・ % of respondents who have problems with the water they use
decreased drastically.
・ % of respondents who said that their water quality is poor decreased
from 83% to 33%: bad taste issues went from 42% to 12%,
muddiness issues went from 94% to 29%, smell issues went from
83% to 2%, and color problems went from 97% to 10%.
・ % of respondents with water shortages remained unchanged. This
problem was not solved.
・ Almost all customers are satisfied with the quality of
Poly-Glu-treated water.
・ The customers like Poly-Glu-treated water because of its lack of
color and taste.
・ % of respondents who were concerned about the safety of
Poly-Glu-treated water decreased from 94% to 0%.
・ About half of the customers want to continue buying
Poly-Glu-treated water even though the price rose to INR.150.
2. Health conditions ・ Large improvements were observed in many aspects of health. The
number of respondents with stomach aches decreased from 62% to
33%, that with skin irritation issues went from 22% to 1%, and that
with dehydration problems went from 50% to 4%.
・ The rate of health problems concerning Poly-Glu-treated water
customers is much lower than of non-customers.
・ 65% of respondents feel that their health improved after they started

15
drinking Poly-Glu-treated water.
3. Economic conditions ・ Employment was created for six people.
・ No change was observed in the number of people who buy tanker
water.
・ Average annual medical expenses decreased from INR 11,000 to
INR 4,810.
・ Average medical expense of customers in the past six months is
much lower than that of non-customers.
The outcome of the survey showed that, despite the limited study period, the pilot project for
supplying safe water treated by Poly-Glu flocculants offered significant developmental impacts on
both the health and economic conditions of the target beneficiaries.