india daily, july 25, 2018 - kotak securities
TRANSCRIPT

For Private Circulation Only. FOR IMPORTANT INFORMATION ABOUT KOTAK SECURITIES’ RATING SYSTEM AND OTHER DISCLOSURES. REFER TO THE END OF THIS MATERIAL.
Contents
Daily Alerts
Results
Asian Paints: Decent, ahead-of-expectations, quarter. In a sweet spot
ICICI Prudential Life: Protection drives VNB even as APE declines
Hexaware Technologies: Weaker than expected
TeamLease Services: Volumes recover, but at lower pricing
Results, Change in Reco
United Spirits: Subpar start to FY2019
Info Edge: Recovery across segments
INDIA DAILY July 25, 2018 India 24-Jul 1-day 1-mo 3-mo
Sensex 36,825 0.3 3.8 6.7
Nifty 11,134 0.4 3.5 5.3
Global/Regional indices
Dow Jones 25,242 0.8 4.1 4.8
Nasdaq Composite 7,841 (0.0) 4.1 12.0
FTSE 7,709 0.7 2.7 4.5
Nikkei 22,637 0.6 1.3 1.9
Hang Seng 28,800 0.5 (0.6) (5.0)
KOSPI 2,276 (0.2) (3.5) (7.1)
Value traded – India
Cash (NSE+BSE) 380 317 327
Derivatives (NSE) 8,742 7,125 7,131
Deri. open interest 4,051 4,024 4,246
Forex/money market
Change, basis points
24-Jul 1-day 1-mo 3-mo
Rs/US$ 68.9 4 76 193
10yr govt bond, % 8.1 3 5 12
Net investment (US$ mn)
23-Jul MTD CYTD
FIIs 24 (305) (927)
MFs (29) 805 11,353
Top movers
Change, %
Best performers 24-Jul 1-day 1-mo 3-mo
APNT IN Equity 1,468 2.4 17.1 26.2
GCPL IN Equity 1,356 0.6 16.8 24.0
INFO IN Equity 1,377 1.6 8.2 19.6
YES IN Equity 384 (0.6) 15.0 18.2
NEST IN Equity 10,291 (1.0) 4.0 17.8
Worst performers
HDIL IN Equity 19 4.4 (12.4) (51.5)
AL IN Equity 113 3.3 (14.6) (31.3)
UT IN Equity 4 6.2 (1.1) (25.9)
VEDL IN Equity 216 2.2 (6.2) (25.5)
RECL IN Equity 97 6.1 (10.4) (23.4)

For Private Circulation Only. FOR IMPORTANT INFORMATION ABOUT KOTAK SECURITIES’ RATING SYSTEM AND OTHER DISCLOSURES, REFER TO THE END OF THIS MATERIAL.
1QFY19 – a decent quarter even as the healthy headline comps are a tad misleading
Consolidated financials – revenues grew 15% yoy to `43.9 bn, broadly in line with our
expectations. Gross margins expanded 40 bps yoy to 43.2%, marginally above our estimated
42.9%. EBITDA (`8.74 bn, +31% yoy) was 5% above estimate. EBITDA margin expanded
247 bps yoy to 19.9% versus our expected 18.8% on the back of lower-than-expected staff
and other expenses. These expenses are generally difficult to forecast on a quarterly basis,
we note. The company indicated savings on freight, rent, etc. even as ad spends grew in low
double digits. Recurring PAT stood at `5.6 bn, +30% yoy and 3% beat. On a 2-year CAGR
basis, growth comps were more moderate – 11% revenues, 4% EBITDA and 2% PAT.
Standalone financials – revenues grew 16% yoy to `37.1 bn, largely in line with our
estimate. We believe volumes grew in the 13-14% range; company’s press release suggested
‘good double digit growth’. Gross margins surprised, increasing 86 bps yoy to 44.6%, 60
bps above expectations. EBITDA margins expanded a sharper 361 bps yoy to 22.3%, 205 bps
above estimate as staff costs and other expenses grew a modest 5% and 2% yoy,
respectively. Recurring net profit grew 35% yoy. 2-year CAGRs were modest for standalone
business as well – 11% revenues, 6% EBITDA and 4% PAT.
Aggregate subsidiary performance (consolidated less standalone) – even as topline
growth was a reasonable 12% yoy (off a low base), aggregate subsidiary EBITDA declined
27% yoy as gross margins declined 230 bps yoy and EBITDA margins saw a 390 bps
compression. Management called out weakness in Egypt (economy), Ethiopia (currency
unavailability), Sri Lanka (one-off heavy rain) and Bangladesh (rain, again)
Standalone GM and cost surprise drive further upward revision in forecasts
Our FY2019-21E EPS estimates go up another 4% each on top of the recent sharp upgrades
driven by GST rate reduction for the category. Our target price also stands revised up by around
4% to `1,325/share (from `1,275). We expect GST rate reduction to be a gift that keeps on
giving for the next 2-3 years and expect strong earnings momentum for this phase. Rich
valuations prevent a more constructive view on the stock, however. REDUCE stays.
Asian Paints (APNT) Consumer Products
Decent, ahead-of-expectations, quarter. In a sweet spot. APNT’s 1QFY19 earnings
print was ahead of expectations on EBITDA and PAT. Healthy yoy comps reflected a
favorable base; 2-year CAGRs on EBITDA and PAT were modest even as volume and
topline growth trends remain healthy. Even as the company’s commentary was guarded
on potential benefits from the recent GST rate cuts, we expect the same to be a kicker
to earnings for at least the next few quarters. We bake in the surprise in standalone GM
and cost control into our estimates and raise FY2019-21E EPS forecasts by around 4%
each. Fair value target stands revised to `1,325 (from `1,275). REDUCE stays.
REDUCE
JULY 25, 2018
RESULT
Coverage view: Cautious
Price (`): 1,468
Target price (`): 1,325
BSE-30: 36,825
Rohit Chordia
Jaykumar Doshi
Aniket Sethi
Asian Paints
Stock data Forecasts/Valuations 2018 2019E 2020E
52-week range (Rs) (high,low) EPS (Rs) 20.5 27.1 32.6
Market Cap. (Rs bn) EPS growth (%) 2.9 32.1 20.3
Shareholding pattern (%) P/E (X) 71.5 54.1 45.0
Promoters 52.8 Sales (Rs bn) 168.2 198.3 234.4
FIIs 15.1 Net profits (Rs bn) 19.7 26.0 31.3
MFs 2.9 EBITDA (Rs bn) 32.0 41.2 49.5
Price performance (%) 1M 3M 12M EV/EBITDA (X) 43.7 34.0 28.1
Absolute 15.8 25.4 27.0 ROE (%) 24.6 28.8 30.3
Rel. to BSE-30 12.2 17.9 11.2 Div. Yield (%) 0.6 0.8 1.0
Company data and valuation summary
1,476-1,082
1,407.9

Asian Paints Consumer Products
KOTAK INSTITUTIONAL EQUITIES RESEARCH 3
Conference call highlights
Commentary on demand—APNT management indicated that demand conditions
remain a bit challenging for the industry. There is some recovery but the pace of
improvement is slow.
Commentary on GST rate cuts—APNT management indicated that it will pass on entire
benefit of reduction in GST rate to 18% from 28% to its dealers across all product lines.
APNT expects benefit to be entirely passed on to the consumers by dealers; however, it
does not intend to control dealer margins. GST rate cut will result in reduction in price
gap between unorganized and organized sector. Organized sector should benefit from
the GST rate cut. Unorganized sector is 30% of industry in terms of value at present.
APNT management has decided to postpone impending price increase (in view of anti-
profiteering clause). it will try to offset RM inflation over time.
RM inflation—the management has hinted at about 10% inflation in RM in 2QFY19.
Cumulative price increase of 3.3% (first in March and second in May) will only partly
offset the impact of RM inflation.
Commentary on market share—APNT is witnessing some recovery in Tamil Nadu;
competitive intensity in the TN market remains high but overall market conditions have
improved.
Capacity expansion—first phase of Mysore plant will be commissioned in September
2018 and that of the upcoming facility at Vizag will be commissioned in January 2019.
New facilities would reduce logistics costs and manufacturing costs to some extent. The
ongoing capacity expansion would meet next 4-5 years’ volume growth. These new
facilities have fiscal benefits from Karnataka and Andhra Pradesh state governments on
products sold in the same state.
International business performance—(1) Sri Lanka and Bangladesh suffered from
rains, (2) Ethiopia continued to face challenges pertaining to currency availability,
(3) Egypt market was weak due to sluggish economy. Further, profitability was impacted
as competition in a few overseas markets did not take price increase to pass on RM
inflation; thus APNT also could not increase price in such markets.
Other data points—(1) consolidated capex in FY2019 would be `12-13 bn (`10 in
standalone operations) and `2-3 bn in subsidiaries, (2) other income was lower on yoy
basis largely due to forex loss in 1QFY19 as against forex gain in the base quarter,
(3) Sleek grew 22% yoy and Ess Ess grew 56% yoy on like-for-like basis.

Consumer Products Asian Paints
4 KOTAK INSTITUTIONAL EQUITIES RESEARCH
Exhibit 1: Interim consolidated results of Asian Paints (as per Ind-AS), March fiscal year-ends (Rs mn)
Source: Company, Kotak Institutional Equities
Exhibit 2: Key changes to consolidated estimates , Asian Paints, March fiscal year-ends, 2019-21E
Source: Company, Kotak Institutional Equities estimates
2-Year
1QFY19 1QFY19E 1QFY18 4QFY18 KIE Est yoy qoq FY2019E FY2018 (% chg.) 1QFY17 CAGR (%)
Net operating revenue 43,903 44,366 38,152 44,836 (1) 15 (2) 198,332 168,246 18 35,870 11
Material cost (24,923) (25,335) (21,812) (25,447) (2) 14 (2) (113,245) (96,912) 17 (18,961) 15
Gross profit 18,980 19,030 16,340 19,389 (0) 16 (2) 85,087 71,334 19 16,910 6
Gross margin (%) 43.2 42.9 42.8 43.2 33 bps 40 bps -2 bps 42.9 42.4 50 bps 47.1
Employee cost (3,064) (3,189) (2,862) (2,761) (4) 7 11 (12,495) (11,155) 12 (2,636) 8
Other expenditure (7,171) (7,507) (6,825) (8,229) (4) 5 (13) (31,389) (28,203) 11 (6,112) 8
Total expenditure (35,158) (36,032) (31,499) (36,437) (2) 12 (4) (157,129) (136,270) 15 (27,709) 13
EBITDA 8,744 8,334 6,654 8,399 5 31 4 41,203 31,976 29 8,162 4
EBITDA margin (%) 19.9 18.8 17.4 18.7 113 bps 247 bps 118 bps 20.8 19.0 176 bps 22.8
Other income 617 848 783 392 (27) (21) 57 2,404 2,206 9 719
Interest (88) (100) (80) (91) (12) 10 (4) (361) (351) 3 (63)
Depreciation (905) (942) (905) (914) (4) (0) (1) (3,817) (3,605) 6 (844)
Pretax profits 8,368 8,140 6,452 7,786 3 30 7 39,428 30,227 30 7,973 2
Tax (2,770) (2,686) (2,160) (2,877) 3 28 (4) (13,406) (10,410) 29 (2,593)
Recurring PAT 5,599 5,454 4,292 4,909 3 30 14 26,023 19,817 31 5,381 2
Extraordinary items — — 25 — - 700 19
Minority interest/share of associates (18) (60) (43) (99) (70) (58) (81) (16) (128) (88) (50)
Net profit (reported) 5,580 5,394 4,274 4,810 3 31 16 26,007 20,389 28 5,351 2
Recurring PAT post MI 5,580 5,394 4,249 4,810 3 31 16 26,007 19,689 32 5,331 2
Recurring EPS 5.8 5.6 4.4 5.0 3 31 16 27.1 20.5 32 5.6 2
Income tax rate (%) 33.1 33.0 33.5 37.0 9 bps -39 bps -386 bps 34.0 34.4 32.5
Costs as a % of net operating revenue
Material cost 56.8 57.1 57.2 56.8 -34 bps -41 bps 1 bps 57.1 57.6 -51 bps 52.9
Employee cost 7.0 7.2 7.5 6.2 -21 bps -53 bps 82 bps 6.3 6.6 -34 bps 7.3
Other expenditure 16.3 16.9 17.9 18.4 -59 bps -156 bps -202 bps 15.8 16.8 -94 bps 17.0
(% change)
2019E 2020E 2021E 2019E 2020E 2021E 2019E 2020E 2021E
Revenues (Rs mn) 198,332 234,363 270,222 199,070 235,250 271,256 (0.4) (0.4) (0.4)
EBITDA (Rs mn) 41,203 49,542 58,105 39,462 47,487 55,743 4.4 4.3 4.2
EBITDA margin (%) 20.8 21.1 21.5 19.8 20.2 20.5 95 bps 95 bps 95 bps
Net income (Rs mn) 26,007 31,277 36,996 24,902 30,001 35,486 4.4 4.3 4.3
EPS (Rs/share) 27.1 32.6 38.6 26.0 31.3 37.0 4.4 4.3 4.3
Other assumptions
Gross margin (%) 42.9 43.1 43.4 42.5 42.7 43.0 36 bps 36 bps 36 bps
Volume growth (%) 13.5 14.5 12.0 13.5 14.5 12.0 0 bps 0 bps 0 bps
Realisation growth (%) 2.0 5.0 4.0 2.5 5.0 4.0 -50 bps 0 bps 0 bps
Revised Earlier Change (%)

Asian Paints Consumer Products
KOTAK INSTITUTIONAL EQUITIES RESEARCH 5
Exhibit 3: Interim standalone results of Asian Paints (as per Ind-AS), March fiscal year-ends (Rs mn)
Source: Company, Kotak Institutional Equities
Exhibit 4: APNT delivered ‘good double-digit volume growth’ – 13%, as per our estimate
Source: Company, Kotak Institutional Equities
2-Year
1QFY19 1QFY19E 1QFY18 4QFY18 KIE Est yoy qoq FY2019E FY2018 (% chg.) 1QFY17 CAGR (%)
Net operating revenue 37,062 37,356 32,029 37,754 (1) 16 (2) 168,177 141,679 19 29,837 11
Material cost (20,525) (20,919) (18,013) (20,885) (2) 14 (2) (94,247) (79,969) 18 (15,376) 16
Gross profit 16,537 16,437 14,016 16,869 1 18 (2) 73,930 61,710 20 14,462 7
Gross margin (%) 44.6 44.0 43.8 44.7 62 bps 86 bps -7 bps 44.0 43.6 40 bps 48.5
Employee cost (2,157) (2,307) (2,060) (1,933) (7) 5 12 (8,745) (7,911) 11 (1,890) 7
Other expenditure (6,132) (6,583) (5,985) (7,082) (7) 2 (13) (27,245) (24,593) 11 (5,270) 8
Total expenditure (28,814) (29,810) (26,058) (29,900) (3) 11 (4) (130,237) (112,472) 16 (22,536) 13
EBITDA 8,248 7,546 5,971 7,854 9 38 5 37,940 29,206 30 7,301 6
EBITDA margin (%) 22.3 20.2 18.6 20.8 205 bps 361 bps 145 bps 22.6 20.6 194 bps 24.5
Other income 689 948 861 592 (27) (20) 16 2,798 2,775 1 788
Interest (48) (55) (43) (66) (13) 11 (28) (193) (211) (9) (42)
Depreciation (790) (825) (758) (801) (4) 4 (1) (3,355) (3,111) 8 (740)
Pretax profits 8,100 7,614 6,032 7,579 6 34 7 37,191 28,660 30 7,307 5
Tax (2,673) (2,513) (2,022) (2,663) 6 32 0 (12,527) (9,710) 29 (2,295)
Recurring PAT 5,426 5,101 4,010 4,916 6 35 10 24,664 18,949 30 5,012 4
Extraordinary items — — — — — — —
Net profit (reported) 5,426 5,101 4,010 4,916 6 35 10 24,664 18,949 30 5,012 4
Recurring EPS 5.7 5.3 4.2 5.1 6 35 10 25.7 19.8 30 5.2 4
Income tax rate (%) 33.0 33.0 33.5 35.1 0 bps -53 bps -214 bps 33.7 33.9 -20 bps 31.4
Costs as a % of net operating revenues
Material cost 55.4 56.0 56.2 55.3 -63 bps -87 bps 6 bps 56.0 56.4 -41 bps 51.5
Employee cost 5.8 6.2 6.4 5.1 -36 bps -62 bps 70 bps 5.2 5.6 -39 bps 6.3
Other expenditure 16.5 17.6 18.7 18.8 -108 bps -215 bps -222 bps 16.2 17.4 -116 bps 17.7
(% change)
11 12
3 4
10
7
17
14
12 12
3
10
2
9
6
10
13
-
2
4
6
8
10
12
14
16
18
1Q
FY1
5
2Q
FY1
5
3Q
FY1
5
4Q
FY1
5
1Q
FY1
6
2Q
FY1
6
3Q
FY1
6
4Q
FY1
6
1Q
FY1
7
2Q
FY1
7
3Q
FY1
7
4Q
FY1
7
1Q
FY1
8
2Q
FY1
8
3Q
FY1
8
4Q
FY1
8
1Q
FY1
9

Consumer Products Asian Paints
6 KOTAK INSTITUTIONAL EQUITIES RESEARCH
Exhibit 5: Gross margin held well notwithstanding RM inflation
Source: Company, Kotak Institutional Equities
Exhibit 6: TTM EPS growth inched up to mid-teens TTM EPS growth trend
Source: Company, Kotak Institutional Equities
42.6
43.7 43.8
45.1
42.8 42.8 43.4
45.3
47.1
44.4 43.8 43.7
42.8
41.3
42.2
43.2 43.2
38
40
42
44
46
48
50
1Q
FY1
5
2Q
FY1
5
3Q
FY1
5
4Q
FY1
5
1Q
FY1
6
2Q
FY1
6
3Q
FY1
6
4Q
FY1
6
1Q
FY1
7
2Q
FY1
7
3Q
FY1
7
4Q
FY1
7
1Q
FY1
8
2Q
FY1
8
3Q
FY1
8
4Q
FY1
8
1Q
FY1
9 (10)
(5)
-
5
10
15
20
25
30
-
5
10
15
20
25
Dec-
13
Mar-
14
Jun-1
4
Sep
-14
Dec-
14
Mar-
15
Jun-1
5
Sep
-15
Dec-
15
Mar-
16
Jun-1
6
Sep
-16
Dec-
16
Mar-
17
Jun-1
7
Sep
-17
Dec-
17
Mar-
18
Jun-1
8
Trailing 12 months EPS (Rs/share) (LHS) yoy growth (%) (RHS)

Asian Paints Consumer Products
KOTAK INSTITUTIONAL EQUITIES RESEARCH 7
Exhibit 7: Recurring PAT was above consensus estimates this quarter Quarterly earnings surprise trend vs consensus estimates
Source: Company, Kotak Institutional Equities
(9)(6)
8
(19)
(11)
25
(13)
(2)
12
(9)(18)
(12)
11
(9)
14
(6)
4 (8) (9)
(1)
(23)
0 (0)
(13)
6
(30)
(20)
(10)
-
10
20
30
1Q
FY1
3
2Q
FY1
3
3Q
FY1
3
4Q
FY1
3
1Q
FY1
4
2Q
FY1
4
3Q
FY1
4
4Q
FY1
4
1Q
FY1
5
2Q
FY1
5
3Q
FY1
5
4Q
FY1
5
1Q
FY1
6
2Q
FY1
6
3Q
FY1
6
4Q
FY1
6
1Q
FY1
7
2Q
FY1
7
3Q
FY1
7
4Q
FY1
7
1Q
FY1
8
2Q
FY1
8
3Q
FY1
8
4Q
FY1
8
1Q
FY1
9

Consumer Products Asian Paints
8 KOTAK INSTITUTIONAL EQUITIES RESEARCH
Exhibit 8: Asian Paints: Consolidated profit model, balance sheet (as per Ind-AS from 2016), March fiscal year-ends, 2014-20E
Source: Company, Kotak Institutional Equities estimates
2014 2015 2016 2017 2018 2019E 2020E 2021E
Profit model (Rs mn)
Net sales 127,148 141,828 142,715 150,620 168,246 198,332 234,363 270,222
EBITDA 19,979 22,354 27,692 29,864 31,976 41,203 49,542 58,105
Other income 1,342 1,697 2,134 2,624 2,206 2,404 2,718 3,347
Interest (422) (348) (407) (300) (351) (361) (309) (268)
Depreciation (2,457) (2,659) (2,756) (3,348) (3,605) (3,817) (4,573) (5,187)
Pretax profits 18,442 21,044 26,663 28,841 30,227 39,428 47,377 55,998
Tax (5,715) (6,495) (8,445) (9,433) (10,410) (13,406) (16,108) (19,039)
Minority interest (440) (322) (242) (272) (128) (16) 8 38
Extraordinary items (100) (276) (525) 259 700 — — —
Net income 12,188 13,952 17,452 19,394 20,389 26,007 31,277 36,996
Recurring net income 12,288 14,227 17,976 19,136 19,689 26,007 31,277 36,996
Recurring EPS (Rs) 12.8 14.8 18.7 19.9 20.5 27.1 32.6 38.6
Balance sheet (Rs mn)
Total shareholder's equity 40,392 47,424 65,248 76,039 84,102 96,361 110,417 126,181
Total borrowings 2,400 4,099 3,037 5,455 5,208 4,424 3,924 3,424
Deferred tax liability 1,878 1,799 2,950 3,430 3,975 3,975 3,975 3,975
Minority interest 2,460 2,637 3,837 3,755 3,277 3,292 3,285 3,247
Total liabilities and equity 47,131 55,959 75,072 88,679 96,562 108,053 121,601 136,828
Net fixed assets 24,918 26,102 33,240 33,678 48,101 56,414 59,314 60,286
Goodwill 1,414 2,458 1,990 1,935 3,273 3,273 3,273 3,273
Investments 14,236 15,878 27,121 26,520 21,407 21,407 21,407 21,407
Cash 2,290 2,044 4,242 8,012 4,047 2,837 10,227 21,218
Net current assets 4,274 9,477 8,480 18,534 19,735 24,122 27,380 30,644
Total assets 47,131 55,959 75,072 88,679 96,562 108,053 121,601 136,828
Free cash flow (Rs mn)
Operating cash flow, excl. working capital 15,705 16,379 20,452 21,301 21,931 29,361 35,142 40,889
Working capital (1,685) (4,502) 1,978 (6,028) (797) (4,387) (3,259) (3,264)
Capital expenditure (2,354) (4,377) (8,022) (6,672) (14,088) (12,131) (7,473) (6,158)
Free cash flow 11,667 7,500 14,408 8,601 7,047 12,843 24,411 31,466
Growth
Revenue growth 16.2 11.5 NM 5.5 11.7 17.9 18.2 15.3
EBITDA growth 15.4 11.9 23.9 7.8 7.1 28.9 20.2 17.3
EPS growth 10.3 15.8 26.4 6.5 2.9 32.1 20.3 18.3
Ratios (%)
Gross margin (%) 42.3 43.8 43.6 44.7 42.4 42.9 43.1 43.4
EBITDA margin (%) 15.7 15.8 19.4 19.8 19.0 20.8 21.1 21.5
Net profit margin (%) 9.7 10.0 12.6 12.7 11.7 13.1 13.3 13.7
RoE (%) 33.1 32.4 31.9 27.1 24.6 28.8 30.3 31.3
RoCE (%) 36.1 34.7 34.2 28.5 24.4 27.4 29.8 33.2
Key assumptions (%)
Volume growth (%) 10.5 7.0 12.0 9.5 6.8 13.5 14.5 12.0
Realisation growth (%) 3.8 3.8 (3.4) (1.8) (4.8) 2.0 5.0 4.0
IGAAP Ind-AS

For Private Circulation Only. FOR IMPORTANT INFORMATION ABOUT KOTAK SECURITIES’ RATING SYSTEM AND OTHER DISCLOSURES, REFER TO THE END OF THIS MATERIAL.
Weak APE, VNB growth strong
ICICI Prudential Life reported 34% growth in VNB on the back of 48% yoy increase in high-
margin protection APE even as the savings business APE declined by 21% to reflect 18%
decline in overall APE. Share of protection business increased to 8.2% of APE from 4.5% in
1QFY18 and 5.7% in FY2018; growth in group protection, especially credit life was higher. The
company changed tax assumptions (moving to effective tax rates from earlier assumption of
normal tax rate of 14.2%) in its VNB calculation from 4QFY18. VNB growth would be about
22% on building in the benefit of effective rate in 1QFY18 as well; for this calculation we
assume 100 bps VNB margin benefit of change in tax rate during 1QFY18.
Persistency improves; provides upside to VNB forecasts
ICICI Prudential Life reported stable persistency (retail, excluding single premium) of 85.8% in
the 13th
month bucket between 2MFY19 and 1QFY18. Persistency improved across all other
buckets. The company has currently built in 13th
month persistency of 82.5% in its
assumptions; it achieved persistency of 85% in FY2018. With improving trends continuing in
FY2019E, we find upside to persistency assumptions, leading to higher VNB margins.
Retain BUY with TP of `500
We are revising our EVOP forecasts to factor lower APE growth in FY2019E and higher margins
largely due to higher share of protection business. We are reflecting the impact of the change
in effective tax assumptions in VNB margins—this will be neutral at the EVOP level as the
benefit of higher VNB margins will be set off with the reduction in operating variance. Post the
revision in estimates, we expect the company to deliver 20% EVOP CAGR during FY2017-21E
and 19% medium-term operating RoEV. Increase in share of protection business (that will boost
higher margins) and improvement in persistency will provide upside to our estimates. At our TP,
the company will trade at 3X EV and 18X EVOP FY2020E. Lower margins in the protection
business due to heightened competition and increase in surrenders due to prolonged weakness
in capital markets are key risks.
ICICI Prudential Life (IPRU) NBFCs
Protection drives VNB even as APE declines. Increase in high-margin protection
business and improvement in persistency were key positives of ICICI Prudential Life’s
1QFY19 performance, even as APE was down yoy. Incremental focus will be on driving
volumes in the savings business and maintaining the momentum in the protection
business. A stable persistency performance from here poses upside to VNB margin
assumptions as well. The company is well on track on VNB margins and operating RoEV
improvements. Retain BUY with a TP of `500 (unchanged).
BUY
JULY 25, 2018
RESULT
Coverage view: Neutral
Price (`): 386
Target price (`): 500
BSE-30: 36,825
QUICK NUMBERS
PAT down 31% yoy;
overall APE down
18% yoy and 37%
qoq
680 bps yoy
improvement in
VNB margins to
17.5%
Share of protection
APE up 365 bps yoy
to 8.2%
Nischint Chawathe
M B Mahesh CFA
Dipanjan Ghosh
ICICI Prudential Life
Stock data Forecasts/Valuations 2018 2019E 2020E
52-week range (Rs) (high,low) EPS (Rs) 11.3 12.4 13.3
Market Cap. (Rs bn) EPS growth (%) (3.7) 10.1 7.0
Shareholding pattern (%) P/E (X) 34.2 31.1 29.0
Promoters 80.7 NII (Rs bn) 120.0 106.8 144.2
FIIs 6.5 Net profits (Rs bn) 16.2 17.8 19.1
MFs 2.9 BVPS 45.8 55.7 66.4
Price performance (%) 1M 3M 12M P/B (X) 8.4 6.9 5.8
Absolute (1.0) (7.5) (17.2) ROE (%) 25.0 24.5 21.8
Rel. to BSE-30 (4.1) (13.0) (27.5) Div. Yield (%) 1.5 0.5 0.6
Company data and valuation summary
472-347
553.8

NBFCs ICICI Prudential Life
10 KOTAK INSTITUTIONAL EQUITIES RESEARCH
PAT down 31% yoy
ICICI Prudential Life reported PAT of `2.81 bn, down 31% yoy, largely on the back of new
business strain from the protection business and higher expenses (discussed below) during
the period. Cash flows to business (post expenses and commissions) improved to `15.6 bn
from `1 bn in 1QFY18; it would, however, be inaccurate to track this on a qoq basis.
Higher expense ratio in 1QFY19
ICICI Prudential Life reported expense to premium ratio of 17.3% in 1QFY19 as compared to
14% in 1QFY18 (13.5% in FY2018). Higher share of protection business and
advertising/publicity expenses was the key reasons for the higher expenses ratio. The
cost/premium of the savings business increased marginally (13.7% in 1QFY19 from 12.5%
in 1QFY18, 11.8% in FY2018). This was largely on account of lower volumes and
investments in business; the ratio will likely improve as volumes pick up over the next few
months. However, rising share of protection business will keep the ratio at elevated levels.
Commission to premium ratio increased to 5.5% from 4.8% in 1QFY18; 5.5% in FY2018.
This was largely due to new policies sold from 2QFY18 that had higher margins and
commissions.
Capital consumption high; dividend payouts may decline
ICICI Prudential Life’s solvency ratio reduced to 235% in 1QFY19 from 253% in 4QFY18
and 289% in 1QFY18 on the back of high growth in protection business. The company has
two tools to manage solvency—(1) stop special dividend payouts and (2) raise tier-II capital
up to 25% of net worth. As of now, the company does not envisage capital issuance.

ICICI Prudential Life NBFCs
KOTAK INSTITUTIONAL EQUITIES RESEARCH 11
Exhibit 1: ICICI Prudential Life – quarterly summary March fiscal year-ends, 1QFY18-1QFY19 (Rs mn)
Source: Kotak Institutional Equities estimates
Exhibit 2: Share of protection business up 365 bps yoy to 8.2% in 1QFY19 APE break-up, March fiscal year-ends, 1QFY18-1QFY19 (Rs bn)
Source: Company
(% change)
1QFY19 1QFY18 4QFY18 1QFY18 4QFY18 2018
Premium 55,179 48,849 87,289 13 (37) 270,688
First 12,587 16,148 20,213 (22) (38) 73,562
Renewal 37,476 28,510 61,476 31 (39) 178,570
Single 5,116 4,191 5,600 22 (9) 18,556
APE 13,099 16,567 20,773 (21) (37) 75,417
Net premium 54,378 48,202 86,558 13 (37) 268,107
Commissions (I) 2,796 2,162 4,466 29 (37) 14,033
First 1,996 1,507 3,178 32 (37) 10,245
Renewal 713 612 1,161 17 (39) 3,441
Single 87 43 127 99 (32) 347
Operating expenses (II) 5,952 4,120 6,048 44 (2) 20,299
Expenses of management (I+II) 8,748 6,282 10,513 39 (17) 34,332
Other income and trf. to shareholders 1,122 165 944 579 19 1,453
Provisions and service taxes 1,759 1,388 2,079 27 (15) 6,928
Benefits paid 29,395 39,690 45,555 (26) (35) 172,808
Net cash flows 15,598 1,008 29,355 1,447 (47) 55,492
Income on investments 23,212 35,177 (16,134) (34) NM 112,615
Change in liabilities 35,801 32,220 10,481 11 242 154,475
Surplus/deficit 3,009 3,965 2,740 (24) 10 13,632
Appropriations
Transfer to shareholders 2,464 3,334 1,967 (26) 25 10,892
FFA 545 632 774 (14) (30) 2,740
Shareholders account
Transfer from policyholders 2,464 3,334 1,967 (26) 25 10,892
Total income 1,400 1,040 2,515 35 (44) 7,444
Investment income 1,396 1,038 2,473 34 (44) 7,396
Other expenses 99 91 115 9 (14) 388
Any other item 925 2 753 57,713 23 753
PBT 2,840 4,281 3,613 (34) (21) 17,196
Tax 24 221 208 (89) (89) 997
PAT 2,816 4,059 3,406 (31) (17) 16,198
Tax rate (%) 1 5 6 6
1QFY18 2QFY18 3QFY18 4QFY18 1QFY19 (% chg.) 2015 2016 2017 2018 (% chg.)
APE 17.0 18.7 20.1 22.1 14.0 (18.1) 47.4 51.7 66.3 77.9 17.6
Savings APE 16.3 18.0 19.3 20.0 12.8 (21.2) 46.7 50.3 63.6 73.5 15.4
Protection APE 0.8 0.7 0.8 2.2 1.1 48.1 0.8 1.4 2.6 4.5 71.9
% of APE 4.5 4.0 3.9 9.8 8.2 365 bps 1.6 2.7 3.9 5.7 181 bps
VNB 1.8 2.4 3.5 4.2 2.4 34.1 2.7 4.1 6.7 12.9 93.1
VNB margin (%) 10.7 12.6 17.5 18.9 17.5 680 bps 5.7 8.0 10.1 16.5 640 bps
IEV NA NA NA 187.9 NA NA 138.2 139.4 161.8 187.9 16.1

NBFCs ICICI Prudential Life
12 KOTAK INSTITUTIONAL EQUITIES RESEARCH
Exhibit 3: ICICI Prudential Life will trade at 3-3.1X EV at our appraisal value-based price target Calculation of appraisal value for ICICI Prudential Life, March fiscal year-ends, 2020-21E
Source: Kotak Institutional Equities estimates
Exhibit 4: ICICI Prudential Life trades at 2.3X price/EV FY2020E Valuation comparison across life insurance companies, March fiscal year-ends, 2017-21E
Source: Company, Kotak Institutional Equities estimates
Exhibit 5: We expect 18-19% operating RoEV and VNB margin of ~17-19% for ICICI Prudential Life Key metrics and RoEV movement, March fiscal year-ends, 2015-21E (Rs bn)
Source: Company, Kotak Institutional Equities estimates
2020E 2021E
Embedded value (EV, Rs bn) 246 285
New business value (NBV, Rs bn) 19.5 24.3
New business multiple (NBM, X) 25 25
Structural value (SV= NBV X NBM,Rs bn) 484 602
Appraisal value (AV= EV+SV, Rs bn) 730 887
Appraisal value/EV (X) 3.0 3.1
Value of ICICI Prudential Life (Rs/share) 508 618
TP Price
Market
cap. EVOP (Rs bn) Embedded value (Rs bn) VNB margin (%) Price/EV (X) Price/EVOP (X) Operating RoEV (%)
EVOP
(Rs
bn)
Rating (Rs) (Rs) (Rs bn) 2017 2018 2019E 2020E 2021E 2017 2018 2019E 2020E 2021E 2017 2018 2019E 2020E 2021E 2017 2018 2019E 2020E 2021E 2017 2018 2019E 2020E 2021E 2017 2018E 2019E 2020E 2021E
HDFC Life SELL 405 480 966 22 27 33 40 49 125 152 185 226 274 22 23 24 24 24 7.8 6.4 5.2 4.3 3.5 43.5 36.1 28.9 23.9 19.9 22 22 22 22 21
ICICI Prudential Life BUY 500 386 554 23 37 34 40 48 161 188 214 246 285 10 17 17 18 19 3.4 2.9 2.6 2.3 1.9 24.1 15.0 16.5 13.8 11.6 17 23 18 19 19
Max Life BUY 650 468 126 11 14 15 18 20 66 75 87 101 116 19 20 20 20 20 2.8 2.5 2.2 1.9 1.6 16.7 13.8 12.2 10.7 9.3 20 21 20 20 20
SBI Life ADD 815 653 653 29 30 36 45 54 165 191 224 266 318 15 16 17 17 17 4.0 3.4 2.9 2.5 2.1 22.6 22.1 17.9 14.7 12.0 23 18 19 20 20
2015 2016 2017 2018 2019E 2020E 2021E
APE 47.4 51.7 66.3 77.9 89.6 108.4 131.2
Yoy growth (%) 9.0 28.1 17.6 15.0 21.0 21.0
VNB 2.7 4.1 6.7 12.9 15.2 19.5 24.3
Yoy growth (%) 52.7 61.5 93.1 18.5 28.1 24.4
EV movement
Opening Embedded Value (EV) 117.8 137.0 138.8 161.8 187.9 213.9 245.8
Methodology changes 1.6 1.8 0.0 7.6 0.0 0.0 0.0
Economic assumption change (4.2) (0.7) 0.0 0.0 0.0 0.0 0.0
VNB (before over-run) 6.4 4.1 6.7 12.9 15.2 19.5 24.3
Acquisition expense overruns (3.7) 0.0 0.0 0.0 0.0 0.0 0.0
Expected return in force 11.7 12.6 12.2 13.7 16.3 18.6 21.4
Operating variance 2.1 4.5 4.1 2.6 2.0 2.0 2.0
Tax changes 0.0 0.0 — — — — —
Investment variance 15.1 (6.2) 5.8 1.1 1.0 1.0 1.0
Dividend payout (9.8) (14.4) (6.3) (11.9) (8.6) (9.2) (9.9)
Closing EV 137.0 138.8 161.2 187.9 213.9 245.8 284.5
Ratios (%)
VNB margins 5.7 8.0 10.1 16.5 17.0 18.0 18.5
RoEV 16.4 1.3 16.2 16.5 13.8 14.9 15.8
Operating RoEV 15.4 16.7 16.5 22.7 17.9 18.8 19.4

ICICI Prudential Life NBFCs
KOTAK INSTITUTIONAL EQUITIES RESEARCH 13
Exhibit 6: Sensitivities have dropped in FY2018 Sensitivity to VNB and EV, March fiscal year-ends, 2015-18 (%)
Source: Company, Kotak Institutional Equities estimates
Exhibit 8: ULIPs down 590 bps yoy to 79.8% Product mix, March fiscal year ends, 2015-18, 1QFY18-1QFY19 (%)
Source: Company
Exhibit 9: Bancassurance rises 700 bps yoy and 280 bps qoq to 55.6% of APE Channel-wise APE, March fiscal year ends, 2015-18, 1QFY18-1QFY19 (%)
Source: Company
VNB EV
2015 2016 2017 2018 2015 2016 2017 2018
Reference rate up 100 bps 1.7 (5.7) (5.2) (4.9) (2.4) (2.5) (2.0) (2.1)
Reference rate down 100 bps (3.0) 5.7 5.5 5.2 2.6 2.6 2.1 2.2
Discontinuance rate up 10% (16.0) (12.3) (10.6) (8.6) (1.0) (1.1) (1.1) (1.3)
Discontinuance rate down 10% 18.0 12.7 10.9 9.1 1.2 1.2 1.2 1.4
Management expenses up 10% (5.8) (6.4) (5.5) (3.5) (0.8) (1.1) (1.1) (1.0)
Management expenses down 10% 5.8 6.4 5.4 3.5 0.8 1.0 1.1 1.0
Mortality up 10% (5.9) (3.2) (6.1) (5.4) (0.7) (0.4) (0.8) (1.0)
Mortality down 10% 5.9 3.2 6.1 5.5 0.7 0.4 0.8 1.0
1QFY18 2QFY18 3QFY18 4QFY18 1QFY19 (bps change) 2015 2016 2017 2018 (bps change)
Savings 95.5 96.1 96.0 90.2 91.8 -365 bps 98.5 97.3 96.1 94.3 -182 bps
ULIP 85.7 78.3 84.9 79.4 79.8 -589 bps 83.1 80.8 84.1 81.9 -220 bps
PAR 8.3 15.9 10.1 9.2 9.7 141 bps 13.2 14.1 9.6 10.9 126 bps
Non-par 0.5 0.3 0.3 0.9 0.9 40 bps 0.9 0.6 1.1 0.5 -59 bps
Group 0.9 1.6 0.7 0.8 1.4 42 bps 1.3 1.8 1.3 1.0 -30 bps
Protection 4.5 3.9 4.0 9.8 8.2 367 bps 1.5 2.7 3.9 5.7 182 bps
Notes:
(a) Protection includes retail and group protection products.
(b) Group excludes group protection products.
1QFY18 2QFY18 3QFY18 4QFY18 1QFY19 (bps change) 2015 2016 2017 2018 (bps change)
Agency 30.5 23.9 25.1 23.0 21.8 -874 bps 24.4 23.8 23.3 25.4 210 bps
Bancassurance 48.6 53.9 53.5 52.8 55.6 700 bps 58.4 57.3 56.9 52.3 -460 bps
Corporate agents and brokers 14.2 14.6 14.6 11.1 11.7 -245 bps 7.0 7.0 6.1 13.5 743 bps
Direct 5.2 5.8 5.6 7.3 6.5 135 bps 8.8 9.9 12.0 6.0 -597 bps
Group 1.5 2.1 1.1 5.8 4.4 284 bps 1.4 2.0 1.7 2.7 103 bps
Exhibit 7: We expect protection business at 7-10% of APE Contribution of APE and VNB of the pure protection business, March fiscal year-ends, 2016-21E
Source: Company, Kotak Institutional Equities estimates
2016 2017 2018 2019E 2020E 2021E
Protection APE (%) 2.7 3.9 5.7 7.0 8.4 9.6
Protection APE (Rs bn) 1.4 2.6 4.5 6.3 9.1 12.6
YoY (%) 83.9 86.3 71.5 40.3 45.2 39.2
Protections VNB (Rs bn) 1.2 2.2 3.8 5.3 7.7 10.1
YoY (%) 83.9 86.3 71.5 40.3 45.2 31.0
Portection VNB/total VNB (%) 28.8 33.2 29.5 34.9 39.6 41.7

NBFCs ICICI Prudential Life
14 KOTAK INSTITUTIONAL EQUITIES RESEARCH
Exhibit 10: Share of ULIPs has dropped across most channels Channel-wise product mix, March fiscal year ends, 2015-18, 1QFY19 (%)
Source: Company
Exhibit 11: Persistency ratio improvement at ICICI Life across most buckets
Retail persistency (including single premium), March fiscal year ends, 2014-18, 2MFY19 (%)
Source: Company
2015 2016 2017 2018
Bancassurance
ULIP 88.4 88.9 92.1 89.8
Par 10.0 9.1 5.3 7.3
Non-par 0.1 — 0.4 0.2
Protection 1.5 2.0 2.2 2.7
Agency
ULIP 78.5 76.4 79.5 81.8
Par 19.2 19.6 14.2 13.5
Non-par 1.0 0.8 2.0 0.4
Protection 1.3 3.2 4.3 4.3
Direct
ULIP 90.5 84.3 85.3 88.0
Par 2.8 7.7 5.0 4.3
Non-par 4.7 3.6 3.2 2.4
Protection 2.0 4.4 6.5 5.3
Corporate agents and brokers
ULIP 62.0 47.4 46.5 36.8
Par 2.4 0.5 0.4 0.5
Non-par 34.4 49.0 44.1 49.9
Protection 1.2 3.1 9.0 12.8
Persistency (%) 2014 2015 2016 2017 2018 2MFY19
13th month 71.5 79.0 82.4 85.7 86.8 86.9
25th month 68.4 65.9 71.2 73.9 78.3 79.2
37th month 57.3 64.3 61.6 66.8 68.8 69.3
49th month 20.3 54.4 62.2 59.3 64.2 65.1
61st month 12.7 14.5 46.0 56.2 54.5 54.8

ICICI Prudential Life NBFCs
KOTAK INSTITUTIONAL EQUITIES RESEARCH 15
Exhibit 12: Persistency ratio improved across most channels in FY2018 Channel-wise persistency, March fiscal year ends, 2014-18 (%)
Source: Company
Exhibit 13: Cost to average AUM ratio up 47 bps yoy March fiscal year ends, 1QFY18-1QFY19 (Rs mn)
Source: Company
2014 2015 2016 2017 2018 2014 2015 2016 2017 2018
Agency Bancassurance
13th month 70 78 85 88 90 75 80 81 84 85
25 th month 65 63 69 NA NA 72 70 72 NA NA
37th month 45 60 58 NA NA 76 68 65 NA NA
49 th month 20 42 58 56 59 18 75 66 63 65
61st month 12 15 35 NA NA 13 12 64 NA NA
Corporate agency Direct sales
13th month 62 71 80 80 89 75 86 88 88 88
25 th month 71 59 66 66 NA 70 70 79 79 NA
37th month 42 68 56 56 NA 47 66 65 65 NA
49 th month 20 37 67 67 58 31 42 64 64 63
61st month 14 14 30 30 NA 13 24 34 34 NA
1QFY18 2QFY18 3QFY18 4QFY18 1QFY19 YoY (%) 2016 2017 2018 YoY (%)
Key financials (Rs mn)
Premium 48,849 65,994 68,556 87,289 55,179 13 191,644 223,540 270,688 21
First year 16,148 17,862 19,339 20,213 12,587 (22) 49,244 63,446 73,562 16
Renewal 28,510 43,194 45,390 61,476 37,476 31 123,986 144,907 178,570 23
Single 4,191 4,939 3,827 5,600 5,116 22 18,414 15,187 18,556 22
APE 16,567 18,356 19,722 20,773 13,099 (21) 51,085 64,965 75,417 16
Commission (I) 2,162 3,632 3,773 4,466 2,796 29 6,200 7,589 14,033 85
First year 1,507 2,733 2,828 3,178 1,996 32 3,744 4,601 10,245 123
Renewal 612 823 845 1,161 713 17 2,402 2,903 3,441 19
Single 43 77 100 127 87 99 53 85 347 308
Operating expenses (II) 4,120 4,921 5,211 6,048 5,952 44 18,884 23,572 20,299 (14)
Expenses of management (I)+(II) 6,282 8,553 8,984 10,513 8,748 39 25,083 31,161 34,332 10
AUM (Rs bn) 1,266 1,306 1,383 1,395 1,427 13 1,039 1,229 1,395 14
Key calculated ratios (%)
Cost/premium 13.94 13.90 13.80 12.78 17.30 336 bps 14.33 14.85 13.52 -133 bps
Cost/average AUM 2.01 2.66 2.67 3.03 2.48 47 bps 2.46 2.75 2.62 -13 bps
Net commission ratio 4.80 5.90 5.79 5.43 5.53 73 bps 3.54 3.62 5.52 191 bps
First year 13.39 20.34 19.51 22.09 22.21 882 bps 12.59 11.96 19.08 711 bps
Renewal 2.15 1.91 1.86 1.89 1.90 -24 bps 1.94 2.00 1.93 -8 bps
Single 1.04 1.55 2.62 2.27 1.69 66 bps 0.29 0.56 1.87 131 bps
Notes:
(a) Net commission ratio: commission/(total premium-0.9 X single premium).
(b) Cost/average AUM: annualised expenses of management/average AUM during the period.

NBFCs ICICI Prudential Life
16 KOTAK INSTITUTIONAL EQUITIES RESEARCH
Exhibit 14: Debt maintains share in AUM mix yoy at 53% March fiscal year ends, 2015-18, 1QFY18-1QFY19 (Rs bn)
Source: Company
Exhibit 15: Net individual agents continue to ramp up in scale Individual agents, March fiscal year ends, 2014-18, 1QFY19 (# ‘000)
Source: LIC Council
1QFY18 2QFY18 3QFY18 4QFY18 1QFY19 YoY (%) 2015 2016 2017 2018 YoY (%)
Linked mix 1,266 1,306 1,383 1,395 1,427 13 1,002 1,039 1,229 1,395 14
Linked 901 923 983 975 997 11 748 753 879 975 11
Non linked 365 382 400 420 429 18 254 286 350 420 20
Equity mix 1,266 1,306 1,383 1,395 1,427 13 1,002 1,039 1,229 1,395 14
Equity 588 705 719 656 671 14 481 481 575 656 14
Debt 678 601 664 740 756 12 521 558 654 740 13
36
12 18 16 18
5 12 51 30 1 3 1
172
132 121
136 152 156
-
70
140
210
280
350
-
12
24
36
48
60
2014 2015 2016 2017 2018 1QFY19
Additions Deletions Agents

ICICI Prudential Life NBFCs
KOTAK INSTITUTIONAL EQUITIES RESEARCH 17
Exhibit 16: New and old estimates Comparison of old and new EV estimates, March fiscal year-ends, 2019-21E (Rs bn)
Source: Kotak Institutional Equities estimates
New estimates Old estimates New versus old (%)
2019E 2020E 2021E 2019E 2020E 2021E 2019E 2020E 2021E
Opening Embedded value (EV) 188 214 246 188 214 245 0 0 0
Methodology/ assumption changes
Economic assumption change
VNB 15 20 24 15 19 24 2 5 3
Expected return in force 16 19 21 16 19 21 0 0 0
Operating variance 2 2 2 2 2 2 (9) (9) (9)
Tax changes 0 0 0 0 0 0
Economic/investment variance 1 1 1 1 1 1 0 0 0
Dividend payout (9) (9) (10) (9) (9) (10) 0 0 0
Closing EV 214 246 285 214 245 283 0 0 1
EVOP 34 40 48 33 39 47 0 2 1
RoEV (%) 14 15 16 14 15 16 6 bps 32 bps 20 bps
Operating RoEV (%) 18 19 19 18 18 19 6 bps 31 bps 19 bps
APE 90 108 131 95 115 139 (6) (6) (6)
VNB post overrun 15 20 24 15 19 24 2 5 3
VNB margins post overrun (%) 17 18 19 16 16 17 130 bps 180 bps 160 bps

For Private Circulation Only. FOR IMPORTANT INFORMATION ABOUT KOTAK SECURITIES’ RATING SYSTEM AND OTHER DISCLOSURES, REFER TO THE END OF THIS MATERIAL.
Revenue growth solid but tad lower than expectations
Revenues grew 3.8% qoq to US$168.3 mn in 2QCY18 and were 1% lower than our estimate.
In c/c terms, revenues grew 4.7% qoq and 9.9% yoy. Revenue growth was led by IMS and BPO
that grew by 8.9% each and contributed 50% to incremental revenues in the quarter. Growth
was broad-based across various client categories. EBITDA margin of 15.6% was flat despite 98
bps tailwind from Rupee depreciation (52 bps in COR line and 46 bps in SG&A). Rupee gain
was offset by 40-50 bps headwind from additional visa costs and 310 bps decline in utilization
rates. Fx gains were strong at Rs290 mn due to a mix of translation and hedge gains. Strong Fx
gains drove 5.8% net profit beat despite a 5% miss at the EBITDA line. Net profit grew 25%
yoy to Rs1.54 bn.
CY2018 revenue guidance raised on expected lines
Hexaware raised CY2018 revenue growth guidance to 12-13% from 10-12% earlier. Achieving
upper end of the guidance band requires 3.8% CQGR for the next two quarters. Most of
Hexaware’s challenge segments, viz. professional services and manufacturing & consumers have
turned around. Enterprise solutions could require a couple of more quarters to stabilize. Net
new deal wins of US$41 mn in 2QCY18 and US$69 mn in 1HCY18 remained flattish compared
to the corresponding period in the prior year. However the more meaningful announcement
was signing of two deals of US$100 mn each with existing clients. One large deal from an
existing customer is largely incremental whereas a win from another client had some renewal
component. Hexaware has guided for EPS growth of 13-14% in USD terms for CY2018.
Expensive valuations underpin our cautious stance
We cut CY2018 revenue estimate by a percent and retain CY2019 and CY2020E revenue
estimates. We incorporate KIE economist’s revised currency rates as detailed in Exhibit 2
resulting in 0.7-3.9% EPS upgrade. Roll over and marginal EPS change results in increase in
target price to Rs435 from Rs420 earlier. We value Hexaware at 18X June 2020E earnings. We
like Hexaware’s excellent management team, strategy and capabilities to build a large IMS and
BPO practice. However the current valuation at 21.7X CY2019E earnings is extremely expensive.
We maintain SELL rating.
Hexaware Technologies (HEXW) Technology
Weaker than expected. Hexaware reported 4.7% qoq and 9.9% yoy revenue growth
in c/c, weaker than expected. EBITDA margin was unchanged despite a weaker Rupee
as lower utilization and higher visa costs neutralized the benefits. Growth theme was
similar to earlier quarters i.e. IMS and BPO forming the bedrock of growth and
contributing 50% to incremental revenues. The stock trades at expensive 21.7X
CY2019E earnings. Maintain SELL rating; EPS estimates remain largely unchanged.
SELL
JULY 25, 2018
RESULT
Coverage view: Cautious
Price (`): 496
Target price (`): 435
BSE-30: 36,825
Kawaljeet Saluja
Jaykumar Doshi
Hexaware Technologies
Stock data Forecasts/Valuations 2018 2019E 2020E
52-week range (Rs) (high,low) EPS (Rs) 16.5 19.6 23.1
Market Cap. (Rs bn) EPS growth (%) 20.2 18.4 18.0
Shareholding pattern (%) P/E (X) 30.0 25.3 21.5
Promoters 71.2 Sales (Rs bn) 39.4 46.6 54.9
FIIs 14.6 Net profits (Rs bn) 5.0 5.9 7.0
MFs 6.4 EBITDA (Rs bn) 6.6 7.4 9.2
Price performance (%) 1M 3M 12M EV/EBITDA (X) 21.6 19.0 15.0
Absolute 12.3 16.5 104.7 ROE (%) 26.6 27.4 27.8
Rel. to BSE-30 8.8 9.5 79.2 Div. Yield (%) 0.8 1.6 1.6
Company data and valuation summary
558-239
147.3

Hexaware Technologies Technology
KOTAK INSTITUTIONAL EQUITIES RESEARCH 19
Key highlights from earnings call
Revenue and EPS guidance. Management revised revenue growth guidance for
CY2018 to 12-13% up from 10-12%. The company also increased its USD EPS growth
guidance from 10-12% to 13-14%. Management aims to deliver EPS growth through
revenue growth rather than margin expansion.
Forex gains. Hexaware reported forex gains of US$4.3 mn for the quarter compared to
US$3 mn in 1QCY18. Rebasing of current assets contributed substantially to the high
forex gains. Forex gains are expected to decline in the near term due to Rupee
depreciation. Management expects forex gains of US$0.76 mn in 3QCY18 and US$0.59
mn in 4QCY18 at an exchange rate of INR 68.47/USD.
Revenue walk through. US$ revenues for the quarter grew by 3.76% to US$168.3 mn.
Growth was led by (1) 490 bps tailwind from volume growth, partially offset by (2) 92
bps impact from cross currency headwinds and (3) 22 bps headwind from bill rates.
Margin walk through. EBITDA margin remained flattish sequentially at 15.6%.
Tailwinds include (1) 84 bps from calendar, (2) 98 bps from Rupee depreciation, and
(3) 71 bps from SG&A leverage. Headwinds were due to (1) 97 bps from project
efficiency gain in 1QCY18, (2) 74 bps from utilisation, (3) 51 bps from H1B visa cost,
(4) 12 bps from revenue mix and (5) 14 bps from bill rates.
Accelerated deal ramp up in Q1. Hexaware completed a cloud migration project for an
APAC client in the travel and transportation vertical, ahead of schedule in 1QCY18.
Earlier ramp up of the deal led to sequential revenue decline for APAC region and the
travel & transportation vertical in the current quarter.
Commentary on geographies. (1) America- Despite healthy qoq growth of 5.2%, tepid
yoy growth of 6.2% is due to softness in large accounts in earlier quarters. The company
expects revenues to normalize from 4QCY18. (2) Europe- The region is witnessing strong
growth. Cross currency movements caused lower revenue growth in reported currency.
(3) APAC- Accelerated ramp up of cloud migration deal caused revenue decline in the
quarter.
Utilisation. Utilisation fell by 3% sequentially to 78.2%. Lower utilisation was due to
increased hiring of freshers. Hexaware added 2,200 people in 1HCY18, an increase of
700 from last year. The company plans to reduce just-in-time hiring and reduce utilisation
to (1) improve responsiveness to customers and (2) improve cost structure and margins in
the medium term.
Client mining in Baring portfolio. Hexaware has won an application development and
testing deal with an analytics and data company partially owned by Baring, the company
is a minor partner in the deal.

Technology Hexaware Technologies
20 KOTAK INSTITUTIONAL EQUITIES RESEARCH
Exhibit 1: Hexaware – consolidated quarterly results, December year-ends (Rs mn)
Source: Company, Kotak Institutional Equities , Kotak Institutional Equities estimates
Exhibit 2: Key changes in CY2018-20E estimates
Source: Kotak Institutional Equities estimates
2QCY18 2QCY18E 2QCY17 1QCY18 KIE yoy qoq CY2018E CY2017 % chg.
Revenue (US$ mn) 168.3 170.1 152.6 162.2 (1.1) 10.3 3.8 688.4 607.4 13.3
Revenues 11,367 11,422 9,836 10,490 (0.5) 15.6 8.4 46,640 39,420 18.3
Software development costs (7,659) (7,471) (6,404) (6,949) 2.5 19.6 10.2 (31,098) (25,700) 21.0
Gross profit 3,708 3,951 3,432 3,541 (6.1) 8.1 4.7 15,543 13,720 13.3
Total SG&A expenses (1,935) (2,075) (1,834) (1,915) (6.8) 5.5 1.0 (8,143) (7,166) 13.6
EBITDA 1,773 1,875 1,598 1,626 (5.4) 11.0 9.1 7,400 6,554 12.9
Depreciation (182) (170) (157) (151) 6.9 15.8 20.4 (700) (633) 10.6
EBIT 1,591 1,705 1,441 1,475 (6.7) 10.4 7.9 6,700 5,921 13.1
Other income 327 113 146 204 188.7 124.0 60.3 766 484
Profit before tax 1,918 1,819 1,587 1,679 5.5 20.9 14.3 7,466 6,405 16.6
Provision for tax (384) (366) (363) (336) (1,552) (1,411)
Net profit 1,534 1,452 1,224 1,343 5.6 25.4 14.2 5,914 4,994 18.4
Extraordinary items — — — — — 3
Share of profit in associate 2 — — (1) — — -
Net profit - reported 1,536 1,452 1,224 1,342 5.8 25.5 14.4 5,914 4,997 18.3
Recurring EPS (Rs/share) 5.1 4.8 4.1 4.5 5.8 25.5 14.1 19.6 16.5 18.8
No. of shares outstanding (mn) 302 302 302 302 302 303
As % of revenues
Gross margin 32.6 34.6 34.9 33.8 33.3 34.8
EBITDA margin 15.6 16.4 16.2 15.5 15.9 16.6
EBIT margin 14.0 14.9 14.7 14.1 14.4 15.0
SG&A expenses 17.0 18.2 18.6 18.3 17.5 18.2
% chg.
CY2018E CY2019E CY202E CY2018E CY2019E CY2020E CY2018E CY2019E CY020E
Revenues (US$ mn) 688 790 887 693 789 886 (0.7) 0.1 0.1
Revenue growth (%) 13.3 14.7 12.3 14.1 13.8 12.3
Revenues (Rs mn) 46,640 54,894 61,647 46,408 53,547 60,922 0.5 2.5 1.2
EBITDA (Rs mn) 7,400 9,170 10,232 7,692 8,853 10,159 (3.8) 3.6 0.7
EBITDA Margin (%) 15.9 16.7 16.6 ou 16.6 16.5 16.7
Recurring EPS (Rs/ share) 19.6 23.1 25.4 19.8 22.2 25.3 (0.9) 3.9 0.7
Re/ US$ rate 67.8 69.5 69.5 67.0 67.9 68.8 1.2 2.4 1.1
New Old Change (%)

Hexaware Technologies Technology
KOTAK INSTITUTIONAL EQUITIES RESEARCH 21
Exhibit 3: Revenue growth across geographies, verticals and service lines (June-2018)
Source: Company, Kotak Institutional Equities
Exhibit 4: Top accounts show signs of revival in growth
Source: Company, Kotak Institutional Equities
Revenues Contribution to
(US$ mn) qoq yoy revenues (%)
Total revenues 168.3 3.8 10.3 100.0
Geographical split of revenues
Americas 129.6 6.1 5.1 77.0
Europe 21.4 5.4 25.1 12.7
Asia Pacific 17.3 (12.4) 42.0 10.3
Vertical split of revenues
Banking and Financial services 72.0 1.6 9.0 42.8
Travel & Transportation 18.7 (12.1) (8.6) 11.1
Healthcare & Insurance 28.8 10.9 20.9 17.1
Mfg, consumer & others 27.1 10.6 32.5 16.1
Professional services 21.7 10.6 (0.5) 12.9
Service line split of revenues
ADM 61.6 5.8 10.6 36.6
EAS 17.7 (0.0) (0.2) 10.5
Testing / QATS 31.0 (0.0) 3.0 18.4
Business intelligence & analytics 22.7 (1.4) 6.3 13.5
BPO 12.1 8.3 10.3 7.2
IMS 23.2 10.1 38.4 13.8
Delivery split of revenues
Onsite 109.7 3.4 11.1 65.2
Offshore (incl nearshore) 58.6 4.4 8.7 34.8
Client metrics
Top 5 clients 71.4 4.5 1.4
Top 10 clients 88.9 3.8 3.1
Growth (%)
8 qtr
Mar-16 Jun-16 Sep-16 Dec-16 Mar-17 Jun-17 Sep-17 Dec-17 Mar-18 Jun-18 CQGR (%)
Revenues (US$ mn)
Top client NA NA NA NA NA
Top-5 clients 52 56 64 64 66 70 67 67 68 71 3.1
Top-10 clients 67 72 79 80 82 86 84 83 86 89 2.7
Non Top-10 accounts 54 58 56 59 63 66 70 74 77 79 4.0
Growth (%)
Top client NA NA NA NA NA
Top-5 clients (0.3) 7.1 13.7 1.2 2.6 6.6 (4.8) (0.3) 2.2 4.5
Top-10 clients (0.9) 6.4 10.1 1.2 2.9 5.1 (2.1) (2.2) 3.7 3.8
Non Top-10 accounts (3.2) 6.8 (2.9) 5.0 5.9 5.9 4.9 5.6 4.1 3.8

Technology Hexaware Technologies
22 KOTAK INSTITUTIONAL EQUITIES RESEARCH
Exhibit 5: Onsite-centric growth continues
Source: Company, Kotak Institutional Equities
Exhibit 6: Strong growth from IMS and BPO
Source: Company, Kotak Institutional Equities
Exhibit 7: Hexaware: yoy growth has decelerated
Source: Company, Kotak Institutional Equities
8 qtr
Mar-16 Jun-16 Sep-16 Dec-16 Mar-17 Jun-17 Sep-17 Dec-17 Mar-18 Jun-18 CQGR (%)
Revenues (US$ mn)
Onsite 77 80 85 86 93 99 101 102 106 110 4.1
Offshore 45 50 50 53 51 54 53 54 56 59 2.0
Growth (%)
Onsite (0.7) 3.7 7.3 0.6 8.5 5.8 2.0 0.9 4.4 3.4
Offshore (4.0) 11.5 (0.6) 6.4 (3.0) 4.9 (1.1) 2.2 3.0 4.4
CAGR
Jun-15 Sep-15 Dec-15 Mar-16 Jun-16 Sep-16 Dec-16 Mar-17 Jun-17 Sep-17 Dec-17 Mar-18 Jun-18 10 quarter
IMS revenues (US$ mn) 8 9 9 9 10 12 13 15 17 17 18 21 23
IMS as % of revenues 6.7 6.9 7.3 7.3 8.0 8.7 9.1 10.7 11.0 11.3 11.7 13.0 13.8
Growth in IMS (qoq) 18 6 5 (2) 17 13 7 22 8 4 5 15 10 9.9
Growth in IMS (yoy) 15 21 24 29 28 36 40 74 62 48 44 36 38
BPO revenues (US$ mn) 6 7 7 7 8 9 9 9 11 11 11 11 12
BPO as % of revenues 5.2 5.7 5.7 5.8 6.5 6.8 6.8 6.4 7.2 7.3 7.0 6.9 7.2
Growth in BPO (qoq) 14 13 (1) (0) 19 9 3 (2) 19 2 (3) 2 8 5.5
Growth in BPO (yoy) 55 54 44 28 34 29 34 31 30 22 16 21 10
BPO+ IMS contribution to incremental revenues
BPO+ IMS revenues (US$ mn) 2 1 0 (0) 3 2 1 3 3 1 1 3 3
Incremental revenues (US$ mn) 6.4 3.8 (1.0) (2.4) 8.0 5.5 3.7 5.8 7.9 1.4 2.1 6.1 6.1
BPO+ IMS as % of incremetnal revenues (%) 32 35 (37) 8 36 39 30 46 38 61 26 51 50
3.9
6.5 8.3
1.9
7.6
11.3
14.4
19.9 18.9
13.7
8.4
5.9 6.9
8.1
12.0
18.9 17.7
13.9 12.3 12.1
10.3
0
5
10
15
20
25
25
50
75
100
125
150
175
Jun-1
3
Sep-1
3
Dec
-13
Mar-
14
Jun-1
4
Sep-1
4
Dec
-14
Mar-
15
Jun-1
5
Sep-1
5
Dec
-15
Mar-
16
Jun-1
6
Sep-1
6
Dec
-16
Mar-
17
Jun-1
7
Sep-1
7
Dec
-17
Mar-
18
Jun-1
8
Revenues (LHS, US$ mn) Growth (RHS, yoy %)

Hexaware Technologies Technology
KOTAK INSTITUTIONAL EQUITIES RESEARCH 23
Exhibit 8: EBITDA margin has remained flattish over the past few quarters
Source: Company, Kotak Institutional Equities
Exhibit 9: TCV of net new deal wins has steadied in the last 3 quarters
Source: Company, Kotak Institutional Equities
17.1
0
5
10
15
20
25
Jun-1
1
Sep-1
1
Dec
-11
Mar-
12
Jun-1
2
Sep-1
2
Dec
-12
Mar-
13
Jun-1
3
Sep-1
3
Dec
-13
Mar-
14
Jun-1
4
Sep-1
4
Dec
-14
Mar-
15
Jun-1
5
Sep-1
5
Dec
-15
Mar-
16
Jun-1
6
Sep-1
6
Dec
-16
Mar-
17
Jun-1
7
Sep-1
7
Dec
-17
Mar-
18
Jun-1
8
EBITDA margin (%)
153
142
162 163
180 183 184
-10.0
-5.0
0.0
5.0
10.0
15.0
100
120
140
160
180
200
Dec-16 Mar-17 Jun-17 Sep-17 Dec-17 Mar-18 Jun-18
TCV net new deals(US$ mn, TTM) Growth rate qoq %
Technology Hexaware Technologies
24 KOTAK INSTITUTIONAL EQUITIES RESEARCH
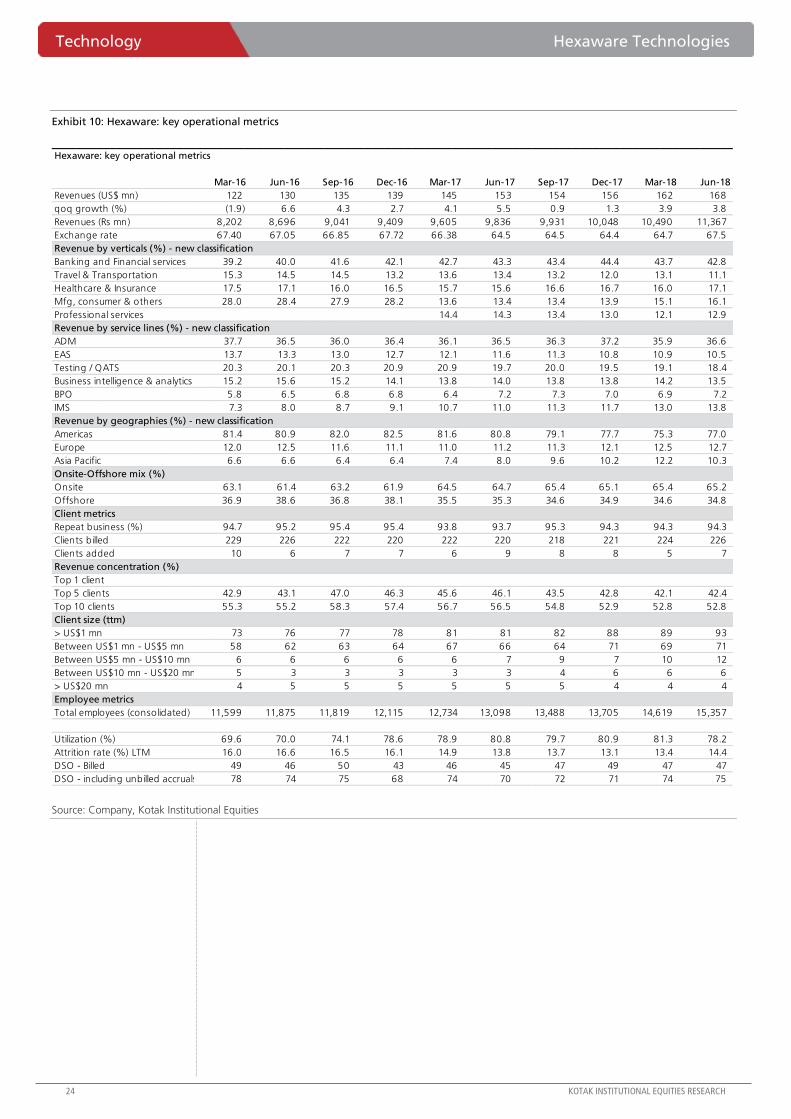
Exhibit 10: Hexaware: key operational metrics
Source: Company, Kotak Institutional Equities
Hexaware: key operational metrics
Mar-16 Jun-16 Sep-16 Dec-16 Mar-17 Jun-17 Sep-17 Dec-17 Mar-18 Jun-18
Revenues (US$ mn) 122 130 135 139 145 153 154 156 162 168
qoq growth (%) (1.9) 6.6 4.3 2.7 4.1 5.5 0.9 1.3 3.9 3.8
Revenues (Rs mn) 8,202 8,696 9,041 9,409 9,605 9,836 9,931 10,048 10,490 11,367
Exchange rate 67.40 67.05 66.85 67.72 66.38 64.5 64.5 64.4 64.7 67.5
Revenue by verticals (%) - new classification
Banking and Financial services 39.2 40.0 41.6 42.1 42.7 43.3 43.4 44.4 43.7 42.8
Travel & Transportation 15.3 14.5 14.5 13.2 13.6 13.4 13.2 12.0 13.1 11.1
Healthcare & Insurance 17.5 17.1 16.0 16.5 15.7 15.6 16.6 16.7 16.0 17.1
Mfg, consumer & others 28.0 28.4 27.9 28.2 13.6 13.4 13.4 13.9 15.1 16.1
Professional services 14.4 14.3 13.4 13.0 12.1 12.9
Revenue by service lines (%) - new classification
ADM 37.7 36.5 36.0 36.4 36.1 36.5 36.3 37.2 35.9 36.6
EAS 13.7 13.3 13.0 12.7 12.1 11.6 11.3 10.8 10.9 10.5
Testing / QATS 20.3 20.1 20.3 20.9 20.9 19.7 20.0 19.5 19.1 18.4
Business intelligence & analytics 15.2 15.6 15.2 14.1 13.8 14.0 13.8 13.8 14.2 13.5
BPO 5.8 6.5 6.8 6.8 6.4 7.2 7.3 7.0 6.9 7.2
IMS 7.3 8.0 8.7 9.1 10.7 11.0 11.3 11.7 13.0 13.8
Revenue by geographies (%) - new classification
Americas 81.4 80.9 82.0 82.5 81.6 80.8 79.1 77.7 75.3 77.0
Europe 12.0 12.5 11.6 11.1 11.0 11.2 11.3 12.1 12.5 12.7
Asia Pacific 6.6 6.6 6.4 6.4 7.4 8.0 9.6 10.2 12.2 10.3
Onsite-Offshore mix (%)
Onsite 63.1 61.4 63.2 61.9 64.5 64.7 65.4 65.1 65.4 65.2
Offshore 36.9 38.6 36.8 38.1 35.5 35.3 34.6 34.9 34.6 34.8
Client metrics
Repeat business (%) 94.7 95.2 95.4 95.4 93.8 93.7 95.3 94.3 94.3 94.3
Clients billed 229 226 222 220 222 220 218 221 224 226
Clients added 10 6 7 7 6 9 8 8 5 7
Revenue concentration (%)
Top 1 client
Top 5 clients 42.9 43.1 47.0 46.3 45.6 46.1 43.5 42.8 42.1 42.4
Top 10 clients 55.3 55.2 58.3 57.4 56.7 56.5 54.8 52.9 52.8 52.8
Client size (ttm)
> US$1 mn 73 76 77 78 81 81 82 88 89 93
Between US$1 mn - US$5 mn 58 62 63 64 67 66 64 71 69 71
Between US$5 mn - US$10 mn 6 6 6 6 6 7 9 7 10 12
Between US$10 mn - US$20 mn 5 3 3 3 3 3 4 6 6 6
> US$20 mn 4 5 5 5 5 5 5 4 4 4
Employee metrics
Total employees (consolidated) 11,599 11,875 11,819 12,115 12,734 13,098 13,488 13,705 14,619 15,357
Utilization (%) 69.6 70.0 74.1 78.6 78.9 80.8 79.7 80.9 81.3 78.2
Attrition rate (%) LTM 16.0 16.6 16.5 16.1 14.9 13.8 13.7 13.1 13.4 14.4
DSO - Billed 49 46 50 43 46 45 47 49 47 47
DSO - including unbilled accruals 78 74 75 68 74 70 72 71 74 75

Hexaware Technologies Technology
KOTAK INSTITUTIONAL EQUITIES RESEARCH 25
Exhibit 11: Consolidated financials for Hexaware, December year-ends, 2013-20E (Rs mn)
Source: Company, Kotak Institutional Equities estimates
2013 2014 2015 2016 2017 2018E 2019E 2020E
Profit model
Total income 22,854 25,817 31,235 35,348 39,420 46,640 54,894 61,647
EBITDA 5,124 4,776 5,355 5,746 6,554 7,400 9,170 10,232
Depreciation and ammortisation (386) (434) (482) (559) (633) (700) (797) (928)
Other income 58 (90) 173 394 484 766 374 407
Pretax profits 4,797 4,253 5,047 5,582 6,406 7,467 8,748 9,710
Tax (1,004) (980) (1,114) (1,411) (1,411) (1,552) (1,769) (2,036)
Profit after tax 3,793 3,273 3,933 4,171 4,995 5,915 6,979 7,674
Diluted recurring EPS (Rs/share) 12.6 10.8 12.9 13.8 16.6 19.6 23.1 25.4
Balance sheet
Total equity 11,992 12,906 14,332 17,409 20,073 23,090 27,170 31,223
Deferred taxation liability 48 (175) (256) (1,252) (1,336) (1,336) (1,336) (1,336)
Current liabilities 6,044 4,630 5,873 5,701 5,380 5,724 6,176 6,377
Total liabilities and equity 18,084 17,361 19,949 21,858 24,118 27,478 32,011 36,265
Cash 6,389 4,716 4,428 4,453 5,487 6,980 9,371 11,810
Other current assets 6,320 7,151 8,989 9,364 10,630 12,109 13,814 15,156
Tangible fixed assets 5,371 5,489 6,489 8,020 7,977 8,364 8,802 9,274
Total assets 18,084 17,361 19,949 21,858 24,118 27,478 32,011 36,265
Free cash flow
Operating cash flow, excl. WC 3,337 4,454 4,865 4,687 5,397 6,116 7,532 8,338
Working capital changes 140 (309) (595) (197) (901) (1,136) (1,252) (1,141)
Capital expenditure (393) (604) (1,482) (2,217) (954) (1,088) (1,235) (1,400)
Free cash flow 3,084 3,542 2,789 2,273 3,542 3,892 5,044 5,797
Ratios (%)
EBITDA margin 22.4 18.5 17.1 16.3 16.6 15.9 16.7 16.6
ROE 31.6 26.3 28.9 26.3 26.6 27.4 27.8 26.3
ROCE 31.2 26.8 27.9 24.4 24.6 24.6 26.6 25.2

For Private Circulation Only. FOR IMPORTANT INFORMATION ABOUT KOTAK SECURITIES’ RATING SYSTEM AND OTHER DISCLOSURES, REFER TO THE END OF THIS MATERIAL.
Revenue growth in line, margins disappoint
TeamLease reported revenue growth of 19% yoy, broadly in line with estimates. EBITDA of
`202 mn, however, missed estimates by 18% primarily due to (1) sequential decline in employee
mark-up and higher wage costs of own employees in the temporary staffing segment, and
(2) hiring of new employees in Evolve leading to higher costs and lower margins in the
specialized staffing segment. Higher other income led to lower PAT miss of 11%.
Associate employee count recovers, NETAP apprentice count addition remains strong
TeamLease added 5,412 associate employees in 1QFY19, compared to 5,860 associate
employees added in all of FY2018. The improved run-rate is certainly positive, though at 6%
yoy the associate employee count growth remains below the previously achieved 14-15%
growth rates. NETAP apprentice count continued to grow well, and at 69% yoy growth pulled
up the overall associate + apprentice count growth to a healthy 17% yoy.
Lower pricing and higher wages pull down staffing segment margins
The staffing segment posted EBIT margin of 1.6% in 1QFY19, lower than 1.7-2.0% posted in
3Q-4QFY18. The decline was surprising given TeamLease’s employee efficiency improved further
to 232 associates + apprentices staffed per own employee, from 204 in 1QFY18. We believe
the key reason for lower margin was on account of new contracts signed at lower pricing, also
reflected in the 2.5% qoq decline in TeamLease’s average monthly mark-up per associate
employee.
Strong macro fully priced in; SELL
Revival in growth in associate staffing segment is a positive, though 1QFY19 is reflective of the
fact that future growth may come in at lower pricing. We acknowledge that TeamLease may
still have margin expansion levers, as it invests in automation and sourcing. That said, we do
tweak our margin estimates for associate staffing segment, resulting in 1-2% EPS cut over
FY2019-20. Higher margins in apprentice staffing results in nil EPS impact to FY2021 estimates.
TP gets revised to `1,785 (from `1,750) on roll-forward to June 2020E. SELL stays.
TeamLease Services (TEAM) Others
Volumes recover, but at lower pricing. TeamLease’s staffing segment volumes
(associates + apprentices) grew 17% yoy, broadly in line with estimates. Margins,
however, disappointed on account of lower priced contracts, and higher wage costs of
own employees. Higher margins on apprentice staffing is positive, though our FY2019-
20 EPS estimates still get revised down by 1-2%. The stock is pricing in strong volume
and margin growth, optimistic in our view. Roll-forward leads to a new TP of `1,785
(from `1,750). SELL stays.
SELL
JULY 25, 2018
RESULT
Coverage view:
Price (`): 2,784
Target price (`): 1,785
BSE-30: 36,825
Garima Mishra
TeamLease Serives
Stock data Forecasts/Valuations 2018 2019E 2020E
52-week range (Rs) (high,low) EPS (Rs) 43.1 57.9 74.6
Market Cap. (Rs bn) EPS growth (%) 28.0 34.2 29.0
Shareholding pattern (%) P/E (X) 64.6 48.1 37.3
Promoters 42.3 Sales (Rs bn) 36.2 45.5 54.9
FIIs 33.6 Net profits (Rs bn) 0.7 1.0 1.3
MFs 5.8 EBITDA (Rs bn) 0.7 0.9 1.2
Price performance (%) 1M 3M 12M EV/EBITDA (X) 67.2 48.8 37.2
Absolute (11.3) 12.8 104.8 ROE (%) 18.2 20.1 21.1
Rel. to BSE-30 (14.0) 6.0 79.3 Div. Yield (%) 0.0 0.0 0.0
Company data and valuation summary
3,310-1,270
47.6

TeamLease Services Others
KOTAK INSTITUTIONAL EQUITIES RESEARCH 27
Exhibit 1: Steady volume growth driven by NETAP and productivity improvement drive strong operating performance Quarterly results snapshot of TeamLease, March fiscal year-ends
Source: Company, Kotak Institutional Equities estimates
Key takeaways from results conference call
Temporary staffing volumes. Volumes have recovered as the company is aggressively
focusing on new deal wins and building a healthy pipeline for future quarters. Growth is
fairly broad based, from a diverse set of industries. E-commerce-driven growth should
contribute more to 2Q and 3Q volumes. Volume growth is backed by demand from both
existing and new clients.
GST impact. While GST had promised compliance loop closures, the same hasn’t resulted
into volume growth for organized players. In that sense, the organized sector growth is
simply a function of economic activity. Shift from unorganized sector is still to happen.
Margins and pricing. TeamLease is focusing on new deal wins, and hence will not shy
away from taking contracts with pricing lower than existing contracts, as long as the
contract adds to overall margins. Pitches to clients are made on variable pricing model,
though proportion of variable has remained stagnant at ~26-27% of total contracts.
TeamLease remains extremely focused on its working capital cycle, and has seen an
improvement in the proportion of contracts on collect at pay to 84% from 80% earlier.
Apprentice staffing. This segment continues to grow well, with strong future pipeline.
Margins in this segment expanded on account of improved pricing, some of which would
be transferred to TeamLease by TLSU.
Yoy growth
1QFY19 1QFY19E 1QFY18 4QFY18 KIE yoy qoq FY2019E FY2018 (%) FY2017
Revenue from operations 10,213 10,126 8,530 9,775 0.9 19.7 4.5 45,528 36,241 25.6 30,413
Employee benefits expense (9,683) (9,682) (8,227) (9,314) 0.0 17.7 4.0 (43,723) (34,712) 26.0 (29,413)
Other expenses (329) (199) (172) (233) 65.3 90.8 40.7 (861) (841) 2.4 (629)
Total Expenses (10,012) (9,881) (8,399) (9,547) 1.3 19.2 4.9 (44,584) (35,553) 25.4 (30,043)
EBITDA 202 245 130 227 (17.8) 54.9 (11.3) 944 688 37.2 370
Finance Costs (11) (3) (2) (11) 257.6 332.2 (3.7) — (25) (100.0) (11)
Depreciation and amortization expense (27) (28) (20) (28) (4.7) 33.0 (3.5) (109) (92) 18.5 (61)
Other income 52 31 58 12 69.1 (10.2) 343.4 154 156 (1.4) 217
PBT 217 245 166 200 (11.7) 30.5 8.2 989 728 35.9 515
Tax expense 3 — (2) 15 na na na — 9 (100.0) 61
Net profit 218 245 164 212 (11.1) 33.1 2.8 989 737 34.2 576
Operational metrics
Number of associate employees 137,735 138,323 129,787 132,323 (0.4) 6.1 4.1 150,517 132,323 13.8 123,946
Number of NETAP apprentices 47,493 46,052 28,051 43,052 3.1 69.3 10.3 59,868 46,052 30.0 19,427
Number of specialized associates 6,407 5,950 1,423 5,948 7.7 350.2 7.7
Total associates and trainees 191,635 190,325 159,261 181,323 0.7 20.3 5.7 210,385 178,375 17.9
Mark-up per general staffing associate per month 736 755 729 755 (2.5) 1.0 (2.5) 733 708 3.5 691
Mark-up per NETAP trainee per month 590 — 544 544 na 8.5 8.5
Key ratios (%)
Employee cost as proportion of sales 94.8 95.6 96.5 95.3 96.0 95.8 96.7
Other cost as proportion of sales 3.2 2.0 2.0 2.4 1.9 2.3 2.1
EBITDA margin 2.0 2.4 1.5 2.3 2.1 1.9 1.2
Tax rate (1.2) 2 1 (7) — (1) (12)
Segmental performance
Revenues
Staffing and allied services 9,161 9,467 8,165 8,830 (3.2) 12.2 3.7 42,328 34,761 21.8 29,453
Specialized staffing services 750 614 246 728 22.1 204.6 3.0 1,150 1,058 8.7 508
Other HR services 303 105 118 217 188.2 155.6 39.3 2,050 1,171 75.1 452
Total operating income 10,213 10,186 8,530 9,775 0.3 19.7 4.5 45,528 36,990 23.1 30,413
EBIT
Staffing and allied services 147 — 124 154 18.4 (4.2) — 582 (100.0)
Specialized staffing services 54 — 27 53 99.0 2.0 — 175 (100.0)
Other HR services 22 — 7 26 231 (12.8) — 36 (100.0)
Unallocated 3 — 11 (24) (76.0) (110.5) — (42) (100.0)
Total 226 — 169 208 34.0 8.5 — 750 (100.0)
Less: finance costs (11) — (2) (11) 332.2 (3.7) — (25) (100.0)
PBT 215 — 166 197 29.6 9.2 — 725 (100.0)
Change (%)

Others TeamLease Services
28 KOTAK INSTITUTIONAL EQUITIES RESEARCH
HR services. The other services vertical pertains to mostly revenues from government
skilling. This has been growing well on account of government initiatives.
Telecom staffing (Evolve). Margins of 4-5% are lower than the initially guided range of 6-
8% primarily due to higher people cost (hiring of senior management).
Exhibit 2: Apprentice addition sustained at a rapid pace Cumulative apprentice count and net additions (#)
Source: Company, Kotak Institutional Equities
Exhibit 3: Associate employee count recovered in 1Q Associate employee count for TeamLease, March fiscal year-ends (#)
Source: Company, Kotak Institutional Equities
xx
-
1,000
2,000
3,000
4,000
5,000
6,000
7,000
8,000
9,000
-
5,000
10,000
15,000
20,000
25,000
30,000
35,000
40,000
45,000
50,000
1Q
FY1
6
2Q
FY1
6
3Q
FY1
6
4Q
FY1
6
1Q
FY1
7
2Q
FY1
7
3Q
FY1
7
4Q
FY1
7
1Q
FY1
8
2Q
FY1
8
3Q
FY1
8
4Q
FY1
8
1Q
FY1
9
Cumulative apprentice count (#, LHS) Quarterly net addition (#, RHS)
70,000
80,000
90,000
100,000
110,000
120,000
130,000
140,000
150,000
1Q
FY1
6
2Q
FY1
6
3Q
FY1
6
4Q
FY1
6
1Q
FY1
7
2Q
FY1
7
3Q
FY1
7
4Q
FY1
7
1Q
FY1
8
2Q
FY1
8
3Q
FY1
8
4Q
FY1
8
1Q
FY1
9
(#) Associate employee count (#)

TeamLease Services Others
KOTAK INSTITUTIONAL EQUITIES RESEARCH 29
Exhibit 4: Core employee productivity has steadily improved Associates and trainees handled per core staffing employee, March fiscal year-ends
Source: Company, Kotak Institutional Equities
Exhibit 5: Summary of changes to assumptions for TeamLease, March fiscal year-ends
Source: Kotak Institutional Equities estimates
160
170
180
190
200
210
220
230
240
80
100
120
140
160
180
200
1Q
FY1
7
2Q
FY1
7
3Q
FY1
7
4Q
FY1
7
1Q
FY1
8
2Q
FY1
8
3Q
FY1
8
4Q
FY1
8
1Q
FY1
9
(#)(#, '000) Associate+trainee count (#, LHS)
Associates+trainees handled per core staffing employee (#) (RHS)
2019E 2020E 2021E 2019E 2020E 2021E 2019E 2020E 2021E
Total
Sales (Rs mn) 45,528 54,948 66,065 45,528 54,936 66,046 0.0 0.0 0.0
Sales growth (%) 25.6 20.7 20.2 25.6 20.7 20.2
EBITDA (Rs mn) 944 1,213 1,521 966 1,224 1,525 (2.3) (0.8) (0.2)
EBITDA margin (%) 2.1 2.2 2.3 2.1 2.2 2.3
EBIT (Rs mn) 835 1,088 1,375 858 1,098 1,378 (2.6) (0.9) (0.3)
PBT (Rs mn) 989 1,276 1,642 1,013 1,288 1,649 (2.3) (1.0) (0.4)
Tax rate (%) — — — — — —
Net Profit (Rs mn) 989 1,276 1,642 1,013 1,288 1,649 (2.3) (1.0) (0.4)
EPS (Rs) 57.9 74.6 96.1 59.2 75.4 96.5 (2.3) (1.0) (0.4)
EPS growth (%) 34 29 29 37 27 28
Temporary staffing
Temporary staff count (#) 150,517 170,837 193,046 150,517 170,837 193,046 — — —
Salary per employee (Rs) 274,984 294,233 314,829 274,984 294,233 314,829 — — —
Fee per employee per month (Rs) 733 758 785 736 766 796 (0.5) (1.0) (1.4)
Revenue (Rs mn) 42,036 50,999 61,602 42,042 51,014 61,628 (0.0) (0.0) (0.0)
EBITDA (Rs mn) 510 696 908 521 709 924 (2.0) (1.8) (1.7)
EBITDA margin (%) 1.2 1.4 1.5 1.2 1.4 1.5
IT Staffing
Revenue (Rs mn) 1,150 1,252 1,364 1,150 1,252 1,364 — — —
EBITDA (Rs mn) 165 180 196 165 180 196 — — —
EBITDA margin (%) 14.3 14.3 14.4 14.3 14.3 14.4
Apprentice staffing
Apprentice count (#) 59,868 77,828 97,285 59,868 77,828 97,285 — — —
Average monthly fee per apprentice (Rs) 460 483 493 450 450 450 2.2 7.3 9.5
Revenue (Rs mn) 292 399 518 286 372 473 2.2 7.3 9.5
EBITDA (Rs mn) 146 200 259 143 186 236 2.2 7.3 9.5
EBITDA margin (%) 50.0 50.0 50.0 50.0 50.0 50.0
Other HR services
Revenue (Rs mn) 804 925 1,067 804 925 1,067 0.0 0.0 0.0
EBITDA (Rs mn) 24 28 33 24 28 33 0.0 0.0 0.0
EBITDA margin (%) 3.0 3.1 3.1 3.0 3.1 3.1
Evolve
Revenue (Rs mn) 1,246 1,373 1,514 1,246 1,373 1,514 0.0 0.0 0.0
EBITDA (Rs mn) 87 96 106 110 119 129 (20.5) (19.2) (17.7)
EBITDA margin (%) 7.0 7.0 7.0 8.8 8.7 8.5
New estimates Old estimates % revision

Others TeamLease Services
30 KOTAK INSTITUTIONAL EQUITIES RESEARCH
Exhibit 6: DCF-based valuation of TeamLease’s core staffing business of Rs1,744 per share DCF-based valuation of core business, March fiscal year-ends (Rs mn)
Source: Company, Kotak Institutional Equities estimates
Exhibit 7: SoTP-based target price of Rs1,785
Source: Kotak Institutional Equities estimates
xx
2017 2018E 2019E 2020E 2021E 2022E 2023E 2024E 2025E 2026E 2027E 2028E 2029E 2030E 2035E
Net sales 34,885 41,670 51,693 62,520 75,305 89,952 106,548 125,141 145,726 168,241 191,710 215,961 240,040 263,204 349,579
Yoy growth (%) 22 19 24 21 20 19 18 17 16 15 14 13 11 10 4
EBIT 309 556 752 995 1,272 1,583 1,949 2,390 2,899 3,482 4,121 4,793 5,496 6,210 8,248
EBIT margin (%) 0.9 1.3 1.5 1.6 1.7 1.8 1.8 1.9 2.0 2.1 2.1 2.2 2.3 2.4 2.4
EBIT*(1-tax rate) 346 542 736 974 1,239 1,534 1,879 1,912 1,913 2,298 2,720 3,164 3,627 4,099 5,444
Depreciation/Amortisation 61 90 105 122 143 174 202 233 268 306 347 363 347 321 263
(Inc.)/Dec. in working capital (19) 459 (835) (256) (155) (389) (405) (441) (473) (500) (552) (618) (614) (590) (355)
Capital expenditure (839) (400) (110) (165) (181) (179) (203) (227) (252) (275) (287) (297) (361) (347) (209)
Free cash flows (451) 691 (104) 676 1,046 1,140 1,473 1,476 1,457 1,829 2,228 2,612 3,000 3,482 5,143
Years discounted — — — — 1 2 3 4 5 6 7 8 9 10 15
Discount factor — — — 1.00 0.89 0.79 0.70 0.62 0.55 0.49 0.44 0.39 0.35 0.31 0.17
Discounted cash flow — — — 676 930 901 1,034 922 808 902 977 1,018 1,039 1,072 879
Associate employee count (#) 126,463 132,323 150,517 170,837 192,192 216,120 240,865 266,035 291,175 315,779 337,725 356,806 371,613 385,176 409,742
Risk-free rate 6.5
Risk premium 6.0
Beta (X) 1.0
Cost of equity (%) 12.5 1,744 11.5 12.0 12.5 13.0 13.5
WACC (%) 12.5 4.0 1,903 1,770 1,653 1,550 1,459
Terminal growth rate (%) 5.0 4.5 1,965 1,821 1,696 1,586 1,489
Sum of free cash flow 15,147 5.0 2,037 1,880 1,744 1,626 1,522
Terminal value 12,304 5.5 2,121 1,947 1,799 1,671 1,560
Enterprise value 27,451 6.0 2,221 2,026 1,862 1,723 1,602
Investments —
Net debt (2,362)
Equity value 29,813
No. of shares (mn) 17
Equity value per share (Rs) 1,744
WACC (%)
Terminal
growth
rate (%)
Description Rs/share
DCF based valuation of general and IT staffing businesses 1,744
Valuation of Evolve (telecom vertical staffing) at 7X EV/EBITDA 35
Valuation of Schoolguru at 1X invested capital 8
SOTP based target price 1,786

TeamLease Services Others
KOTAK INSTITUTIONAL EQUITIES RESEARCH 31
Exhibit 8: Consolidated income statement, balance sheet and cash flow, March fiscal year-ends, 2011-21E (Rs mn)
Source: Company, Kotak Institutional Equities estimates
2011 2012 2013 2014 2015 2016 2017 2018 2019E 2020E 2021E
Income statement
Total operating income 6,868 9,258 12,507 15,296 20,071 25,049 30,413 36,241 45,528 54,948 66,065
Associate employee expenses (6,351) (8,627) (11,755) (14,432) (18,990) (23,773) (28,643) (33,814) (42,698) (51,626) (62,182)
Gross profit 518 632 752 865 1,081 1,276 1,770 2,427 2,829 3,322 3,882
EBITDA (390) (207) (111) 120 241 258 370 688 944 1,213 1,521
Depreciation (66) (38) (36) (19) (27) (30) (61) (92) (109) (126) (147)
EBIT (456) (245) (147) 101 213 228 309 596 835 1,088 1,375
Other income 115 83 110 79 114 154 217 156 154 189 268
Financial charges (2) (3) (5) (2) (1) (4) (11) (25) — — —
Pre-tax profit (343) (165) (43) 178 326 378 515 728 989 1,276 1,642
Taxation — — — — (18) (130) 61 9 — — —
Net income (recurring) (343) (165) (43) 178 308 248 576 737 989 1,276 1,642
Exceptional items (53) — — — — — — — — — —
Net income (reported) (395) (165) (43) 178 308 248 576 737 989 1,276 1,642
Weighted average number of shares (mn) 12 15 15 15 15 16 17 17 17 17 17
EPS (Rs) (33.2) (10.8) (2.8) 11.6 20.1 15.9 33.7 43.1 57.9 74.6 96.1
Balance sheet
Equity share capital 4 5 5 5 5 171 171 171 171 171 171
Reserves & surplus 215 1,042 1,005 1,183 1,483 2,945 3,493 4,246 5,235 6,511 8,154
Shareholders funds 219 1,047 1,010 1,188 1,488 3,116 3,663 4,417 5,406 6,682 8,325
Loan funds 29 81 121 8 — 194 11 73 — — —
Total source of funds 247 1,127 1,131 1,197 1,488 3,309 3,686 4,490 5,406 6,682 8,325
Net fixed assets 211 195 107 107 95 111 1,069 1,378 1,379 1,418 1,452
Investments — 0 0 0 0 0 103 593 593 593 593
Cash balances 180 822 780 847 1,147 2,590 1,602 1,424 1,505 2,486 3,939
Current assets 574 952 1,355 1,478 1,827 3,039 3,224 4,045 5,207 6,435 7,736
Inventories 15 9 5 2 2 2 — — — — —
Sundry debtors 345 543 618 595 813 1,205 1,729 2,235 2,932 3,690 4,436
Other current assets 76 114 340 367 498 1,054 1,062 1,283 1,612 1,945 2,339
Loans and advances 139 286 392 515 514 778 433 527 663 800 961
Current liabilities and provisions 718 842 1,112 1,236 1,638 2,476 3,091 4,371 4,698 5,670 6,817
Total application of funds 247 1,127 1,131 1,197 1,488 3,309 3,686 4,490 5,406 6,682 8,325
Cash flow statement
Operating cash flow before WCchanges (390) (207) (111) 120 222 45 351 697 944 1,213 1,521
Change in working capital/ other adjustments 144 (255) (133) 1 53 (150) (19) 459 (835) (256) (155)
Capital expenditure (293) 61 161 60 99 (22) (917) (734) 44 24 86
Free cash flow (539) (400) (83) 181 375 (127) (585) 422 153 981 1,453

For Private Circulation Only. FOR IMPORTANT INFORMATION ABOUT KOTAK SECURITIES’ RATING SYSTEM AND OTHER DISCLOSURES, REFER TO THE END OF THIS MATERIAL.
1QFY19 earnings print – below expectations on EBITDA and PAT
Net operating revenues grew 13% yoy to `20.1 bn, broadly in line with our expected `20.3 bn.
Gross profit of `9.9 bn, +21% yoy, was again broadly in line with estimate. Gross margins
expanded 312 bps yoy to 49.1% (KIE: 48.5%) on the back of an improved mix, favorable
pricing and RM tailwinds. Adjusted EBITDA of `2.28 bn (+34% yoy) fell 16% short of our
estimate on account of higher adspends (+30% yoy to `2.11 bn; 17% higher than estimate)
and other expenses. Adjusted EBITDA margin stood at 11.3% (+178 bps yoy, 200 bps below
estimate). Recurring adjusted PAT of `1.05 bn, +45% yoy, was 26% below our estimate. ETR
stood at 34.3%. The company attributed higher adspends partly to higher activations during IPL
and FIFA world cup. Adjusted EBITDA reflects adjustments for one-off restructuring costs of
`360 mn in 1QFY19 and `130 mn in the base quarter.
2-year CAGRs (versus 1QFY17 print) weak despite several tailwinds
1QFY19 yoy comps look healthy but need to be seen in the context of the extremely favorable
base; 1QFY18 was impacted heavily by the highway ban impact. A better comparison in this
backdrop is versus 1QFY17 print. 2-year CAGR on revenue stands at -1%, on gross profit at
6%, on EBITDA at 3% and on PAT at 12% (on the back of a sharp 34% per annum fall in net
interest cost). We note that there have been several positive tailwinds in the past two years – (a)
continued mix improvement; P&A segment formed 65% of sales in 1QFY19 versus 58% in
1QFY17,
(b) franchising of popular volumes; this is EBITDA accretive, in our view, (c) generally favorable
pricing environment and (d) benign input cost trends. The reason why all of these did not add
up to a better earnings trajectory is the subdued volume trajectory – 3% decline per annum
(underlying, overall, per our math) and a modest 1.6% CAGR even in P&A.
Tweak forecasts marginally; raise fair value target and upgrade a notch to REDUCE from SELL
We tweak our forecasts marginally, raise fair value TP to `590 (from `560) and upgrade rating a
notch to REDUCE from SELL noting the sharp recent correction. Delivery needs to consistently
start backing the narrative for us to turn constructive at the current rich valuations.
United Spirits (UNSP) Consumer Products
Subpar start to FY2019. UNSP’s 1QFY19 earnings print missed our estimates on EBITDA
and PAT despite broadly in-line revenues and gross profit. Adspends and other expenses
came in higher than estimate. Headline yoy comps look healthy off a low base; however,
2-year CAGRs (flattish revenues, 6% gross profit, 3% EBITDA) are weak despite the
perfect concoction of qualitative tailwinds (mix, pricing, franchising, RM movement).
Subdued volume growth mitigated all these positives. We tweak our forecasts marginally,
raise fair value TP to `590 (from `560) and upgrade rating a notch to REDUCE from
SELL noting the sharp recent correction.
REDUCE
JULY 25, 2018
RESULT, CHANGE IN RECO.
Coverage view: Cautious
Price (`): 582
Target price (`): 590
BSE-30: 36,825
Rohit Chordia
Jaykumar Doshi
Aniket Sethi
United Spirits
Stock data Forecasts/Valuations 2018 2019E 2020E
52-week range (Rs) (high,low) EPS (Rs) 7.6 10.2 13.4
Market Cap. (Rs bn) EPS growth (%) 39.1 34.7 30.9
Shareholding pattern (%) P/E (X) 76.5 56.8 43.4
Promoters 58.5 Sales (Rs bn) 81.7 90.5 99.9
FIIs 23.3 Net profits (Rs bn) 5.5 7.4 9.7
MFs 4.1 EBITDA (Rs bn) 10.2 13.3 16.1
Price performance (%) 1M 3M 12M EV/EBITDA (X) 44.1 33.1 26.8
Absolute (14.5) (18.4) 10.2 ROE (%) 24.9 24.2 22.7
Rel. to BSE-30 (17.2) (23.3) (3.5) Div. Yield (%) 0.0 0.0 0.3
Company data and valuation summary
801-468
423.0

United Spirits Consumer Products
KOTAK INSTITUTIONAL EQUITIES RESEARCH 33
Exhibit 1: Interim standalone results of United Spirits (as per Ind-AS), March fiscal year-ends (Rs mn)
Source: Company, Kotak Institutional Equities
Exhibit 2: Key changes to standalone earnings model, UNSP, March fiscal year-ends, 2019-21E (Rs mn)
Source: Company, Kotak Institutional Equities estimates
1QFY19 1QFY19E 1QFY18 4QFY18 KIE Est yoy qoq FY2019E FY2018 % chng 1QFY17
Gross revenues 64,152 64,714 58,168 69,004 (1) 10 (7) 286,976 260,691 10 58,531 5
Less: excise duty (44,033) (44,376) (40,350) (47,267) (1) 9 (7) (196,473) (178,990) 10 (38,126)
Net operating income 20,119 20,338 17,818 21,737 (1) 13 (7) 90,504 81,701 11 20,405 (1)
Cost of materials (10,232) (10,480) (9,619) (11,134) (2) 6 (8) (46,042) (42,891) 7 (11,557)
Gross profit 9,887 9,857 8,199 10,603 0 21 (7) 44,461 38,810 15 8,848 6
Gross margin (%) 49.1 48.5 46.0 48.8 67 bps 312 bps 36 bps 49.1 47.5 162 bps 43.4
Staff cost (1,688) (1,691) (1,528) (1,853) (0) 10 (9) (6,997) (6,601) 6 (1,802) (3)
Advertising and promotion (2,112) (1,806) (1,627) (2,207) 17 30 (4) (8,751) (7,882) 11 (1,673) 12
Other expenditure (3,804) (3,650) (3,340) (3,802) 4 14 0 (15,374) (14,112) 9 (3,239) 8
Total other expenditure (7,604) (7,147) (6,495) (7,862) 6 17 (3) (31,123) (28,595) 9 (6,714)
EBITDA 2,283 2,710 1,704 2,741 (16) 34 (17) 13,339 10,215 31 2,134 3
EBITDA margin (%) 11.3 13.3 9.6 12.6 -198 bps 178 bps -127 bps 14.7 12.5 223 bps 10.5
Depreciation (339) (370) (321) (367) (8) 6 (8) (1,426) (1,351) 6 (261)
Interest (559) (575) (703) (591) (3) (20) (5) (1,999) (2,611) (23) (1,030)
Other income 214 355 309 1,210 (40) (31) (82) 1,369 2,060 (34) 241
Pretax profits 1,599 2,121 989 2,993 (25) 62 (47) 11,283 8,313 36 1,084 21
Tax (548) (700) (266) (1,126) (22) 106 (51) (3,836) (2,786) 38 (253)
Recurring PAT 1,051 1,421 723 1,867 (26) 45 (44) 7,447 5,527 35 831 12
Extraordinary (238) 1,000 (94) 243 4,000 90 (393)
Reported PAT 813 2,421 629 2,110 (66) 29 (61) 11,447 5,617 104 438 36
Recurring EPS 1.4 2.0 1.0 2.6 (26) 45 (44) 10.2 7.6 35 1.1 12
Excise as % of gross revenues 68.6 68.6 69.4 68.5 6 bps -73 bps 13 bps 68.5 68.7 65.1
Income tax rate (%) 34.3 33.0 26.9 37.6 129 bps 738 bps -333 bps 34.0 33.5 48 bps 23.3
Cost as a % of sales
Cost of materials 50.9 51.5 54.0 51.2 -68 bps -313 bps -37 bps 50.9 52.5 -163 bps 56.6
Staff cost 8.4 8.3 8.6 8.5 7 bps -19 bps -14 bps 7.7 8.1 -35 bps 8.8
Advertising and promotion 10.5 8.9 9.1 10.2 161 bps 136 bps 34 bps 9.7 9.6 2 bps 8.2
Other expenditure 18.9 17.9 18.7 17.5 96 bps 16 bps 141 bps 17.0 17.3 -29 bps 15.9
(% change) 2-year
CAGR (%)
2019E 2020E 2021E 2019E 2020E 2021E 2019E 2020E 2021E
Revenues (Rs mn) 90,504 99,880 109,278 89,891 98,693 107,954 0.7 1.2 1.2
EBITDA (Rs mn) 13,339 16,054 18,437 13,571 15,996 18,387 (1.7) 0.4 0.3
EBITDA (%) 14.7 16.1 16.9 15.1 16.2 17.0
Recurring PAT (Rs mn) 7,447 9,749 12,136 7,768 9,896 12,314 (4.1) (1.5) (1.4)
Adj. EPS (Rs/share) 10.2 13.4 16.7 10.7 13.6 16.9 (4.1) (1.5) (1.4)
Revised Earlier Change (%)

Consumer Products United Spirits
34 KOTAK INSTITUTIONAL EQUITIES RESEARCH
Highlights from concall
Overall business performance. Management believes that 1QFY19 illustrated strength
of the underlying business as regulatory challenges are now largely behind. They believe
that the business momentum is coming back and the company will capitalize on it in
times to come.
Segment-wise takeaways. Prestige segment posted 19% yoy growth in revenues (aided
by 13% volume growth) and now represents 52% of total volumes. Strong growth in the
Prestige segment was led by robust growth in its scotch portfolio – Jonnie Walker, Black
& White and Black Dog. Higher activations during IPL and the Fifa World Cup aided
connect with the younger adults. The Popular segment posted 3% yoy decline in net
sales due to 9% yoy decline in volumes – underlying net sales were flat yoy. Management
seemed satisfied with the results of its premiumization strategy and the franchise income
was also in line with expectations (expect annual income of `1.5 bn).
Acquisition of 26% stake in HipBar. Management explained that HipBar (a tech
startup in the alcoholic beverage space) seeks to solve the logistics issues at the consumer
end in the alcoholic beverage industry. Currently, it operates in the key cities of Bangalore
and Chennai and UNSP would like to support its expansion in other cities.
Adspends guidance. While adspends in 1QFY19 increased 30% yoy and stood at
10.5% of net operating revenues, management highlighted that they expect adspends to
remain in the range of 9-10%. Adspends in 1Q were higher given high spending during
IPL and FIFA. Management did acknowledge that its brands were under-supported in the
past and they have now managed to improve their share of voice.
Comments on margin expansion. EBITDA margin for 1QFY19 expanded 178 bps yoy to
11.3. However, this remains well short of the management’s medium-term guidance of
expansion of its EBITDA margins to mid-high teens. Management explained that they are
relatively satisfied with the gross margins levels (inflationary but manageable RM likely
going ahead) and are also rationalizing some of their overhead costs. However, bulk of
the margin expansion will be the back of higher volume-led operating leverage benefits.
Other takeaways. (1) The company’s ambition remains double-digit topline growth and
mid-to-high teens EBITDA margin in the medium term (we still have no idea of what the
management defines medium term as). (2) Good support from the UP excise department.
They are looking to do the right things to support the industry in the state. (3) Cost
inflation of 4-5% yoy can be assumed in overhead expenses for the next few years.
Exhibit 3: United Spirits – quarterly volume trends
Source: Company, Kotak Institutional Equities
1QFY17 2QFY17 3QFY17 4QFY17 1QFY18 2QFY18 3QFY18 4QFY18 1QFY19 FY17 FY18
Volume breakup
Volumes (mn cases)
Prestige and above segments 9.2 8.9 10.2 8.5 8.4 9.1 9.9 9.8 9.5 36.8 37.2
Regular and below segments 13.0 13.1 14.3 12.8 9.6 9.4 11.2 11.1 8.7 53.2 41.3
Total 22.2 22.0 24.5 21.3 18.0 18.5 21.1 20.9 18.2 90.0 78.5
Growth, yoy (%)
Prestige and above segments 10 11 5 5 (9) 2 (3) 15 13 1
Regular and below segments (6) (5) (11) (16) (26) (28) (22) (13) (9) (22)
Total (0) 1 (5) (9) (19) (16) (14) (2) 1 (13)
% of total volumes
Prestige and above segments 41.4 40.5 41.6 39.9 46.7 49.2 46.9 46.9 52.2 40.9 47.4
Regular and below segments 58.6 59.5 58.4 60.1 53.3 50.8 53.1 53.1 47.8 59.1 52.6
Total 100.0 100.0 100.0 100.0 100.0 100.0 100.0 100.0 100.0 100.0 100.0

United Spirits Consumer Products
KOTAK INSTITUTIONAL EQUITIES RESEARCH 35
Exhibit 4: Standalone profit model, balance sheet, cash model of United Spirits (based on Ind-AS), March fiscal year-ends, 2016-21E
Source: Company, Kotak Institutional Equities estimates
2016 2017 2018 2019E 2020E 2021E
Profit model
Net revenues 82,482 85,476 81,701 90,504 99,880 109,278
EBITDA 8,864 9,710 10,215 13,339 16,054 18,437
Other income 1,057 1,111 2,060 1,369 1,888 2,822
Interest expense (4,469) (3,690) (2,611) (1,999) (1,517) (1,065)
Depreciation (1,017) (1,323) (1,351) (1,426) (1,540) (1,666)
Pretax profits 4,435 5,808 8,313 11,283 14,884 18,528
Extraordinaries (1,280) (2,273) 90 4,000 5,000 5,000
Tax (1,936) (1,836) (2,786) (3,836) (5,135) (6,392)
Reported PAT 1,219 1,699 5,617 11,447 14,749 17,136
Adj. PAT 2,499 3,972 5,527 7,447 9,749 12,136
Adj. earnings per share (Rs) 3.4 5.5 7.6 10.2 13.4 16.7
Balance sheet
Total shareholder equity 17,140 19,378 25,038 36,485 49,484 64,433
Total borrowings 42,040 40,710 28,962 22,962 16,962 11,435
Deferred tax liability (1,539) (1,241) (856) (856) (856) (856)
Total liabilities and equity 57,641 58,847 53,144 58,591 65,590 75,012
Net fixed assets 13,211 12,723 11,001 11,325 11,785 12,307
Total investments 9,924 9,354 9,354 9,354 9,354 9,354
Cash 127 523 1,198 5,027 10,348 18,431
Net current assets 34,379 36,247 31,591 32,884 34,104 34,919
Total assets 57,641 58,847 53,144 58,591 65,590 75,012
Free cash flow
Operating cash flow, excl. working capital 8,026 6,433 7,862 9,502 10,919 12,045
Working capital changes (6,073) (1,868) 4,656 (1,293) (1,220) (816)
Capital expenditure (2,456) (835) 371 (1,750) (2,000) (2,188)
Free cash flow (502) 3,730 12,889 6,459 7,699 9,041
Ratios
Gross revenue growth (%) 9.8 2.3 10.7 11.7 10.6
Net operating revenue growth (%) 3.6 (4.4) 10.8 10.4 9.4
EBITDA growth (%) 9.5 5.2 30.6 20.4 14.8
Recurring PAT growth (%) 59.0 39.1 34.7 30.9 24.5
Gross margin (%) 41.3 42.9 47.5 49.1 49.6 49.7
EBITDA margin(%) 10.7 11.4 12.5 14.7 16.1 16.9
RoAE (%) 13.7 21.8 24.9 24.2 22.7 21.3
RoACE (%) 12.1 14.4 15.8 21.3 23.4 23.9
Key assumptions
Total core volumes (mn cases) 93.1 90.1 78.5 81.5 85.5 89.6
-Prestige and Above 34.2 36.8 37.2 40.4 43.6 46.9
-Popular 58.9 53.3 41.3 41.1 41.9 42.7
Blended Realisation (Rs/case) 872 937 1,009 1,079 1,135 1,187

For Private Circulation Only. FOR IMPORTANT INFORMATION ABOUT KOTAK SECURITIES’ RATING SYSTEM AND OTHER DISCLOSURES, REFER TO THE END OF THIS MATERIAL.
Revenue growth of 17% aided by strong growth in Naukri and 99acres
INFOE reported revenue growth of 17% yoy, in line with expectations. This was driven by
Naukri’s revenue growth normalizing to 15% yoy (from 13% in 4QFY18), and 99acres
registering strong revenue growth of 34%. Revenue growth of others segment (comprising
Jeevansathi and Shiksha) came in at a modest 7%. EBITDA beat of 5% was driven by lower ad-
spends in Naukri and Jeevansathi businesses.
Operating leverage and lower ad-spends drive margin expansion for Naukri
Naukri’s revenue growth was driven by a healthy 11.5% increase in unique customers and
3.3% increase in realizations. This, coupled with sequential reduction in ad-spends (owing to
lower TV advertising) drove a healthy 360 bps sequential improvement in Naukri’s EBITDA
margins. Deferred revenue growth of 16% yoy was broadly in line with reported revenue
growth, indicating that 1QFY19 revenue growth trajectory is sustainable. Management
mentioned that both IT and non-IT sectors such as autos, BFSI, industrials accounted for the
growth.
99acres: early signs of revival
99acres has reported strong revenue growth of 30%+ for the past three years, indicating that
the online real estate advertising market may have bottomed. INFOE continues to retain strong
50% traffic share among online real estate portals. Management indicated that while the resale
segment continues to see more interest, there is some revival in enquiries from builders,
indicating a potential pick-up in ad-spends. This is also reflected in healthy deferred revenue
growth of 43% yoy.
Downgrade rating a notch to ADD post sharp run-up in stock price
We like INFOE’s mix of businesses comprising the steady cash flow generating nature of Naukri
and high growth potential of 99acres and investee companies such as Zomato. We raise
revenue growth estimates for Naukri and 99acres by 1-4%, resulting in EPS increase of 1-3%.
This leads to an increase in our SoTP based target price to `1,425 (`1,390 earlier). The sharp
run-up in stock price drives a downgrade in our rating to ADD.
Info Edge (INFOE) Internet
Recovery across segments. INFOE reported revenue growth of 17% yoy, in line with
expectations. Naukri reported steady revenue growth of 15% and healthy margins of
57%. 99acres business reported 30%+ yoy revenue growth for the third straight
quarter. Overall EBITDA beat of 5% was driven by a higher-than-expected reduction in
ad-spends. After a sharp run-up in stock price we downgrade rating to ADD and revise
target price to `1,425 (from `1,390 earlier).
ADD
JULY 25, 2018
RESULT, CHANGE IN RECO.
Coverage view: Cautious
Price (`): 1,354
Target price (`): 1,425
BSE-30: 36,825
Kawaljeet Saluja
Garima Mishra
Info Edge
Stock data Forecasts/Valuations 2018 2019E 2020E
52-week range (Rs) (high,low) EPS (Rs) 22.5 25.9 33.0
Market Cap. (Rs bn) EPS growth (%) 33.3 14.9 27.5
Shareholding pattern (%) P/E (X) 60.1 52.4 41.1
Promoters 41.4 Sales (Rs bn) 9.2 10.7 12.6
FIIs 32.8 Net profits (Rs bn) 2.7 3.1 4.0
MFs 14.7 EBITDA (Rs bn) 3.0 3.7 4.9
Price performance (%) 1M 3M 12M EV/EBITDA (X) 50.3 39.3 29.7
Absolute 12.9 9.8 37.2 ROE (%) 13.4 13.2 14.3
Rel. to BSE-30 9.4 3.2 20.2 Div. Yield (%) 0.4 0.6 0.6
Company data and valuation summary
1,460-919
165.1

Info Edge Internet
KOTAK INSTITUTIONAL EQUITIES RESEARCH 37
Exhibit 1: Standalone quarterly financials of Info Edge, March fiscal year-ends, (Rs mn)
Source: Company, Kotak Institutional Equities
1QFY19 1QFY19E 1QFY18 4QFY18 KIE yoy qoq FY2019 FY2018
Total operating income 2,595 2,580 2,225 2,407 0.6 16.7 7.8 10,738 9,155
Employee expenses (1,106) (991) (1,048) 11.6 5.6 (4,396) (3,931)
Network, Internet and other direct charges (43) (34) (41) 26.1 3.9 (152) (143)
Administration and other expenses (228) (242) (246) (6.0) (7.5) (1,086) (944)
Advertising and promotion cost (376) (254) (478) 48.1 (21.3) (1,365) (1,164)
Operating expenses (1,753) (1,778) (1,521) (1,813) (1.4) 15.2 (3.3) (6,999) (6,182)
EBITDA 843 802 703 593 5.1 19.8 42.0 3,739 2,973
Depreciation (53) (60) (54) (56) (11.9) (2.4) (4.4) (262) (215)
EBIT 790 741 649 538 6.5 21.7 46.8 3,477 2,758
Other income 236 237 264 225 (0.3) (10.5) 5 1,215 971
Financial charges (0) — (0) (0) — 5.9 — — (1)
Pre-tax profit 1,026 978 913 763 4.8 12.4 34.4 4,692 3,728
Taxation (236) (294) (270) (197) (19.6) (12.7) 19.7 (1,548) (991)
PAT (recurring) 790 685 642 566 15.3 22.9 39.6 3,144 2,737
Exceptional items (160) — — (703) NA NA NA — —
Reported PAT 630 685 642 (138) (8.0) (1.9) (557.9) 3,144 2,737
Key ratios (%)
Direct cost of sales 44.3 0.0 46.1 45.2 42.4 44.5
Fixed cost of sales 23.3 0.0 22.3 30.1 22.8 23.0
EBITDA margin 32.5 31.1 31.6 24.7 34.8 32.5
PAT margin 30.4 26.5 28.9 23.5 29.3 29.9
Tax rate 23.0 30.0 29.6 25.8 33.0 26.6
Segmental break-up
Revenues
Recruitment Solutions 1,841 1,821 1,598 1,752 1.1 15.2 5.1 7,630 6,688
99acres 419 408 314 373 2.8 33.6 12.4 1,806 1,354
Other Verticals 335 351 313 282 (4.5) 7.0 18.9 1,301 1,113
Total 2,595 2,580 2,225 2,407 0.6 16.7 7.8 10,738 9,155
PBT
Recruitment Solutions 1,020 853 908 19.7 12.4
99acres (129) (112) (149) 15.1 (13.7)
Others (34) (30) (120) 16.0 (71.4)
Total 858 712 640 20.5 34.1
Less unallocable expenses (68) (63) (102) 8.6 (33.1)
Add unallocable income 236 264 225 (10.5) 4.9
Exceptional items (160) - (703)
Profit before tax 866 913 60 (5.1) 1,352.8
Change (%)

Internet Info Edge
38 KOTAK INSTITUTIONAL EQUITIES RESEARCH
Exhibit 2: Segmental revenue and EBITDA snapshot of INFOE, March fiscal year-ends
Source: Company, Kotak Institutional Equities
Exhibit 3: Naukri and 99acres drive deferred revenue growth of 19% in 1QFY19 Segmental deferred revenue, billing and recognized revenue trends (Ind-AS), March fiscal year-ends (Rs mn)
Source: Company, Kotak Institutional Equities
Recruitment segment – IT headwinds continue, other sectors drive growth
Recruitment segment growth came in at 15% yoy, an acceleration from 13% growth
reported in 4QFY18. Revenue growth was driven by 12% growth in customers and 3%
growth in realizations. Margins expanded meaningfully from 53% in 4QFY18 to 57% in
1QFY19.
Billing growth of 15% yoy as well as deferred revenue growth of 16% are indicative that
current revenue growth momentum can sustain.
Management mentioned that IT hiring seems to be reviving, after remaining tepid in
FY2018. Further, demand from other industries such as autos, BFSI, travel etc. seems to
be picking up. The only customer base which seems under pressure are placement
agencies.
Yoy growth
1QFY18 1QFY19 (%)
Revenues
Recruitment Solutions 1,598 1,841 15
99acres 314 419 34
Jeevansathi 137 140 2
Shiksha 176 195 11
Total 2,225 2,595 17
Operating EBITDA
Recruitment Solutions 879 1,045 19
99acres (87) (115)
Jeevansathi (41) (56)
Shiksha 20 31 55
Unallocated expenses (67) (62)
Total 703 843 20
Yoy growth
1QFY16 2QFY16 3QFY16 4QFY16 1QFY17 2QFY17 3QFY17 4QFY17 1QFY18 2QFY18 3QFY18 4QFY18 1QFY19 (%)
Deferred revenue
Recruitment Solutions 2,068 1,910 1,888 2,210 2,425 2,150 2,168 2,556 2,762 2,618 2,537 2,939 3,203 16.0
99acres 273 289 279 359 358 398 384 501 485 485 518 705 693 42.9
Other Verticals 193 187 205 244 211 199 238 310 290 245 276 313 302 4.1
Total 2,534 2,386 2,372 2,813 2,994 2,747 2,790 3,367 3,537 3,348 3,331 3,957 4,198 18.7
Billing
Recruitment Solutions 1,337 1,156 1,284 1,757 1,622 1,284 1,442 1,982 1,821 1,464 1,632 2,163 2,101 15.4
99acres 251 284 254 361 277 349 246 392 298 333 378 562 409 37.2
Other Verticals 208 175 199 267 225 225 235 328 297 228 274 318 324 9.1
Total 1,796 1,615 1,737 2,385 2,124 1,858 1,923 2,702 2,416 2,025 2,284 3,043 2,834 17.3
Revenue
Recruitment Solutions 1,263 1,289 1,314 1,423 1,440 1,555 1,404 1,555 1,598 1,648 1,690 1,752 1,841 15.2
99acres 271 268 264 280 279 308 261 275 314 326 341 373 419 33.4
Other Verticals 213 183 180 228 258 237 196 254 313 278 240 282 335 7.0
Total 1,747 1,740 1,758 1,931 1,977 2,100 1,861 2,084 2,225 2,252 2,271 2,407 2,595 16.6

Info Edge Internet
KOTAK INSTITUTIONAL EQUITIES RESEARCH 39
Naukri remains the traffic leader, with 70%+ market-share (excluding Indeed) and ~60%
share including Indeed. Advertising spends on Naukri declined sequentially, and will be
volatile depending on competitive activity. Lower ad-spends in 1QFY19 led to a sharp
sequential improvement in EBITDA margins from 53% in 4QFY18 to 57% in 1QFY19.
Naukri will selectively choose to advertise on various media.
Exhibit 4: Revenue growth inched up to 15% in 1QFY19 Recruitment sales trajectory for Info Edge, March fiscal year-ends
Notes:
(a) Revenues pertain to IGAAP till FY2015 and to IndAS FY2016 onwards.
Source: Company, Kotak Institutional Equities
Exhibit 5: Lower ad-spends drive a sequential increase in margins Recruitment EBITDA trajectory for Info Edge, March fiscal year-ends
Notes:
(a) EBITDA in IGAAP till 4QFY17, in Ind-AS 1QFY18 onwards.
Source: Company, Kotak Institutional Equities
xx
28 27
20
27
19
12 10
4
8 8
11
14 16
19 19
25
20 20 19 19
15
21
9
4
11
6
20
13
15
0
5
10
15
20
25
30
0
200
400
600
800
1000
1200
1400
1600
1800
2000
1Q
FY12
3Q
FY1
2
1Q
FY1
3
3Q
FY1
3
1Q
FY1
4
3Q
FY1
4
1Q
FY1
5
3Q
FY1
5
1Q
FY1
6
3Q
FY1
6
1Q
FY1
7
3Q
FY17
1Q
FY1
8
3Q
FY1
8
1Q
FY1
9
(%)(Rs mn) Recruitment sales (Rs mn, LHS) Yoy growth (%, RHS)
49 49 51
55
50 50
47 49
50 51 49
52 52 51 49
54 53 55
52 55
56 55 55 55 55
59 57
53
57
30
40
50
60
—
100
200
300
400
500
600
700
800
900
1Q
FY1
2
3Q
FY1
2
1Q
FY1
3
3Q
FY1
3
1Q
FY1
4
3Q
FY1
4
1Q
FY1
5
3Q
FY1
5
1Q
FY16
3Q
FY1
6
1Q
FY1
7
3Q
FY1
7
1Q
FY1
8
3Q
FY18
1Q
FY1
9
(%)(Rs mn)Recruitment EBITDA Margin(%)

Internet Info Edge
40 KOTAK INSTITUTIONAL EQUITIES RESEARCH
Exhibit 6: Unique paying customers increased 12% yoy Unique paying customers in recruitment business, March fiscal year-ends
Source: Company, Kotak Institutional Equities
Exhibit 7: Realization held steady in 1QFY19 Average realization per customer, March fiscal year-ends
Source: Company, Kotak Institutional Equities
99acres – early signs of revival
Yoy growth of 34% in revenues and 43% in deferred revenues is indicative of possible
recovery in business, albeit on a low base.
99acres revenue growth momentum has improved over the past three quarters owing to
improved momentum in secondary sales activity. Of the overall revenue, brokers
accounted for 55%, builders for 45% and property owners accounted for 5% of
revenues. While the mix has not changed meaningfully over the past two quarters,
99acres is seeing an increase in enquiries from builders.
Management mentioned that recovery is fairly broad-based, with business from key
markets such as Delhi-NCR, Mumbai, Bangalore and Pune picking up. GST and RERA
impact has been absorbed by the industry.
Real estate firms have spent `30-40 bn on advertising at peak, and current spends are
around `20 bn. There is thus a fair amount of advertising that can potentially come back
and benefit online portals.
Traffic share of 99acres is healthy at 50%, measured on the basis of time spent and user
base, based on Similarweb data. Management indicated that 99acres would continue to
advertise in order to improve market share.
5.0
7.0
9.0
11.0
13.0
-
10
20
30
40
50
60
1Q
FY16
3Q
FY16
1Q
FY17
3Q
FY17
1Q
FY18
3Q
FY18
1Q
FY19
(%)'000
Unique customers (#, LHS) Yoy growth (%, RHS)
25
27
29
31
33
35
37
1Q
FY16
3Q
FY16
1Q
FY17
3Q
FY17
1Q
FY18
3Q
FY18
1Q
FY19
Rs 000 Average realization (Rs 000)

Info Edge Internet
KOTAK INSTITUTIONAL EQUITIES RESEARCH 41
Exhibit 8: 99acres revenue growth trajectory improved in 2HFY18 99cres sales growth profile, March fiscal year-ends
Source: Company, Kotak Institutional Equities
Exhibit 9: Paid listings growth momentum yet to pick-up 99acres paid listings growth trend, March fiscal year-ends
Source: Company, Kotak Institutional Equities
Zomato – focus on food delivery
Management mentioned that Zomato continues to grow fast and food delivery is a key
focus area.
Food delivery will be a key growth driver for Zomato, and it may experiment with
different delivery models to grow this business faster. Zomato is looking to aggressively
compete with Swiggy in this business. Zomato’s order run-rate has touched 12 mn orders
a month. It is lower than Swiggy’s order run-rate though the gap is reducing.
Zomato has clearly shifted to a cash intensive model, and will continue to invest across all
its offerings such as delivery, Zomato Gold and Piggybank.
271 268 264 280 279
308
261 275
314 326 341
373
419
-5-21471013161922252831343740
-
40
80
120
160
200
240
280
320
360
400
440
480
1Q
FY1
6
2Q
FY1
6
3Q
FY1
6
4Q
FY1
6
1Q
FY1
7
2Q
FY1
7
3Q
FY1
7
4Q
FY17
1Q
FY1
8
2Q
FY1
8
3Q
FY1
8
4Q
FY1
8
1Q
FY1
9
(%)(Rs mn) 99acres Sales [LHS] Yoy growth [RHS]
(20)
0
20
40
60
80
100
0
100
200
300
400
500
600
700
800
900
1Q
FY1
2
3Q
FY1
2
1Q
FY13
3Q
FY1
3
1Q
FY1
4
3Q
FY1
4
1Q
FY15
3Q
FY1
5
1Q
FY1
6
3Q
FY1
6
1Q
FY1
7
3Q
FY1
7
1Q
FY1
8
3Q
FY1
8
1Q
FY1
9
('000)
Paid listings (LHS) Yoy growth (%)
(%)

Internet Info Edge
42 KOTAK INSTITUTIONAL EQUITIES RESEARCH
INFOE will evaluate the opportunity to invest in any future funding rounds, though given
significant investor interest, retains the option of not participating.
Exhibit 10: Key changes to estimates for Info Edge, March fiscal year-ends (Rs mn)
Source: Kotak Institutional Equities estimates
Exhibit 11: SoTP valuation of Info Edge on a June 2020 basis
Source: Kotak Institutional Equities estimates
2019E 2020E 2021E 2019E 2020E 2021E 2019E 2020E 2021E
Total
Sales 10,738 12,588 14,650 10,587 12,245 14,139 1.4 2.8 3.6
Sales growth (%) 17.3 17.2 16.4 15.6 15.7 15.5
EBITDA 3,739 4,860 5,868 3,728 4,796 5,742 0.3 1.3 2.2
EBITDA margin (%) 34.8 38.6 40.1 35.2 39.2 40.6
EPS (Rs) 25.9 33.0 39.8 25.6 32.3 38.7 0.9 2.2 2.9
EPS growth (%) 14.9 27.5 20.6 13.9 25.9 19.8
Recruitment
Sales 7,630 8,693 9,858 7,579 8,571 9,675 0.7 1.4 1.9
Growth (%) 14.1 13.9 13.4 13.3 13.1 12.9
EBITDA 4,273 4,955 5,619 4,244 4,886 5,515 0.7 1.4 1.9
EBTDA margin (%) 56.0 57.0 57.0 56.0 57.0 57.0
Jeevansaathi
Sales 859 1,038 1,220 859 1,038 1,220 0.0 0.0 0.0
Growth (%) 20.8 20.8 17.6 20.8 20.8 17.6
EBITDA (172) (21) 49 (172) (21) 49 0 0.0 0.0
EBTDA margin (%) (20.0) (2.0) 4.0 (20.0) (2.0) 4.0
99 acres
Sales 1,806 2,370 3,036 1,706 2,150 2,709 5.8 10.2 12.1
Growth (%) 33.4 31.3 28.1 26.0 26.0 26.0
EBITDA (397) (119) 152 (375) (108) 135 NA NA NA
EBTDA margin (%) (22.0) (5.0) 5.0 (22.0) (5.0) 5.0
Others
Sales 442 486 535 442 486 535 0.0 0.0 0.0
Sales growth (%) 10 10 10 10 10 10
EBITDA 35 44 48 31 39 43 14.3 12.5 12.5
EBITDA margin (%) 8.0 9.0 9.0 7.0 8.0 8.0
% revisionNew estimates Old estimates
Value Multiple Valuation Stake Valuation of stake Per share value
Parameter (Rs mn) (X) Valuation basis (Rs mn) (%) (Rs mn) (Rs)
Standalone business
ex-99 acres
June 2020E earnings (ex
interest income)3,353 30.0 P/E 100,601 100 100,601 827
99acres 7X sales 17,758 100 17,758 146
Zomato Ascribing a valuation of US$1.1 bn 72,600 31 22,441 185
Policybazaar Ascribing a valuation of US$1.0 bn 66,000 14 8,248 68
Other investments Current invested book 2,330 1.0 P/B 2,330 0 2,330 19
Cash Cash+financial investments 21,677 1.0 1X cash 21,677 100 21,677 178
Total 1,423

Info Edge Internet
KOTAK INSTITUTIONAL EQUITIES RESEARCH 43
Exhibit 12: Details of Info Edge’s investments Investment details and operating metrics of Info Edge's investee companies, March fiscal year-ends
Source: Company, Kotak Institutional Equities
Exhibit 13: Summary financials for Info Edge (standalone), March fiscal year-ends, 2009-21E (Rs mn)
Source: Company, Kotak Institutional Equities estimates
Investee company website Business 2015 2016 2017 2018 2015 2016 2017 2018 2015 2016 2017 2018 2015 2016 2017 2018
Partly owned subsidiaries
Zomato Media www.zomato.com Restaurants 3,283 50 967 (1,360)
Applect Learning Systems www.meritnation.com Education 718 968 1,205 1,350 56 59 59 66 216 287 363 310 (227) (414) (240) (130)
Canvera Digital Technologies www.canvera.com Lifestyle 901 1,074 150 49 57 62 560 490 420 (320) (220) (250)
Associates
Zomato Media www.zomato.com Restaurants 4,838 4,838 1,560 46 46 31 1,839 3,323 4,810 (4,410) (1,519) na
Etechaces Marketing and Consulting www.policybazaar.com Insurance 325 325 325 670 23 10 10 10
Kinobeo Software www.mydala.com Deals 270 270 270 0 45 42 42 42
Canvera Digital Technologies www.canvera.com Lifestyle 671 32
Happily Unmarried Marketing www.happilyunmarried.com Lifestyle 94 163 223 260 27 44 48 47
Mint Bird Technologies www.vacationlabs.com Software 60 60 60 26 26 26
Green Leaves Consumer Services www.bigstylist.com Lifestyle 64 124 0 25 39 0
Rare Media Company www.bluedolph.com 74 74 70 35 35 35
VCare Technologies 40 40 15 15
Unnati Online 40 40 29 28
Others 24 290 28 30
Total 5,361 7,663 8,297 4,490 3,301 4,747 6,643 9,380 (2,332) (6,634) (2,190) (1,880)
na2,061 (211)2,467 (745) (1,490)3,8402,118
Operating EBITDA
(Rs mn)
Investment
(Rs mn)
Shareholding
(%)
Sales
(Rs mn)
2009 2010 2011 2012 2013 2014 2015 2016 2017 2018 2019E 2020E 2021E
Profit model
Total operating income 2,452 2,322 2,936 3,771 4,373 5,059 6,116 7,176 8,021 9,155 10,738 12,588 14,650
Operating expenses (1,782) (1,637) (1,938) (2,328) (2,875) (3,391) (4,293) (5,821) (5,746) (6,182) (6,999) (7,728) (8,782)
EBITDA 669 685 998 1,443 1,498 1,668 1,822 1,355 2,275 2,973 3,739 4,860 5,868
Other income 286 320 283 395 465 433 764 785 625 971 1,215 1,387 1,585
PBDIT 956 1,005 1,280 1,837 1,963 2,100 2,586 2,140 2,900 3,944 4,954 6,247 7,454
Financial charges (17) (19) (22) (20) (25) (25) (30) (1) (1) (1) — — —
Depreciation (71) (61) (71) (77) (94) (174) (173) (210) (241) (215) (262) (264) (238)
Pre-tax profit 867 925 1,188 1,740 1,843 1,902 2,383 1,930 2,659 3,728 4,692 5,983 7,215
Taxation (270) (317) (400) (511) (528) (591) (736) (564) (575) (991) (1,548) (1,974) (2,381)
Recurring PAT 597 607 788 1,230 1,315 1,311 1,647 1,366 2,084 2,737 3,144 4,009 4,834
Recurring EPS 5.5 5.6 7.2 11.3 12.0 12.0 13.7 11.3 17.2 22.5 25.9 33.0 39.8
Balance sheet
Equity share capital 273 273 546 546 1,092 1,092 1,202 1,207 1,211 1,216 1,216 1,216 1,216
Reserves & surplus 2,995 3,547 4,084 5,198 5,563 6,530 15,422 16,742 18,620 19,859 25,336 28,138 31,517
Shareholders funds 3,267 3,820 4,630 5,744 6,654 7,622 16,624 17,950 19,831 21,074 26,551 29,353 32,733
Total source of funds 3,270 3,826 4,636 5,747 6,659 7,626 16,627 17,953 19,835 21,077 26,551 29,353 32,733
Net fixed assets 384 357 693 626 1,006 952 935 1,020 602 529 467 403 365
Investments 195 1,276 2,969 3,814 4,247 6,152 14,383 16,246 18,120 22,809 26,439 27,439 28,439
Cash balances 3,218 2,777 2,037 2,662 2,801 2,311 3,007 1,493 2,908 1,458 4,006 6,685 10,009
Net current assets excluding cash (546) (618) (1,103) (1,396) (1,440) (1,852) (1,762) (1,298) (2,091) (4,078) (4,719) (5,532) (6,438)
Total application of funds 3,270 3,826 4,636 5,747 6,659 7,626 16,627 17,953 19,835 21,077 26,551 29,353 32,733
Cash flow statement
Operating profit before working capital changes 685 688 881 1,327 1,434 1,509 1,850 1,478 2,271 2,953 3,406 4,273 5,072
Change in working capital/ other adjustments (299) 72 485 293 43 412 (90) 401 630 1,986 641 813 906
Cash flow from operating activites 387 759 1,366 1,620 1,477 1,922 1,760 1,879 2,901 4,940 4,047 5,086 5,979
Fixed assets (74) (34) (407) (9) (475) (119) (157) (293) (84) (142) (200) (200) (200)
Investments (20) (162) (164) (979) (1,307) (878) (1,878) (1,578) (347) (854) (3,630) (1,000) (1,000)
Cash (used)/ realised in investing activities (94) (196) (571) (988) (1,782) (997) (2,035) (1,871) (431) (997) (3,830) (1,200) (1,200)
Free cash flow 292 564 794 631 (305) 925 (275) 8 2,470 3,943 217 3,886 4,779
Dividend paid (24) (24) (48) (127) (127) (319) (435) (725) (437) (805) (1,207) (1,207) (1,455)
Interest charges (17) (19) (22) (20) (25) (25) (30) (1) (1) (1) — — —
Cash (used)/realised in financing activities (30) (33) (51) (136) (135) (343) 7,032 (662) (419) (582) (1,210) (1,207) (1,455)
Cash generated/ utilised 255 478 789 491 (735) 537 7,049 (654) 2,051 2,384 2,548 2,679 3,324
Cash at beginning of year 3,118 3,373 3,851 4,639 5,130 4,394 4,932 12,222 11,568 13,620 15,619 18,166 20,846
Cash at end of year 3,373 3,851 4,639 5,130 4,395 4,931 11,981 11,568 13,620 16,004 18,166 20,846 24,169

Internet Info Edge
44 KOTAK INSTITUTIONAL EQUITIES RESEARCH
Exhibit 14: Summary financials for Info Edge (consolidated), March fiscal year-ends, 2009-21E (Rs mn)
Source: Company, Kotak Institutional Equities estimates
2009 2010 2011 2012 2013 2014 2015 2016 2017 2018 2019E 2020E 2021E
Profit model
Total operating income 2,458 2,371 3,224 3,920 4,723 5,672 7,332 7,475 8,876 9,882 11,538 13,468 15,618
Operating expenses (1,796) (1,745) (2,390) (2,736) (3,513) (4,706) (7,116) (6,553) (7,104) (7,300) (8,173) (8,997) (10,152)
EBITDA 662 626 834 1,183 1,210 966 216 922 1,772 2,582 3,365 4,471 5,466
Other income 279 307 274 395 475 502 942 4,407 828 888 1,124 1,287 1,475
PBDIT 941 932 1,108 1,578 1,685 1,468 1,158 5,328 2,600 3,470 4,488 5,758 6,941
Financial charges (17) (20) (23) (22) (28) (30) (38) (1) (2) (3) (3) (3) (3)
Depreciation (71) (65) (80) (83) (118) (212) (469) (238) (328) (296) (272) (275) (251)
Pre-tax profit 853 848 1,005 1,473 1,540 1,227 651 5,089 2,270 3,170 4,214 5,480 6,688
Taxation (270) (318) (400) (529) (528) (591) (740) (573) (478) (845) (1,423) (1,843) (2,243)
Recurring PAT 570 559 581 1,043 1,153 923 296 1,501 (103) 1,883 2,632 3,581 4,386
Recurring EPS 5.2 5.1 5.3 9.5 10.6 8.4 2.5 12.4 (0.9) 15.5 21.6 29.5 36.1
Balance sheet
Equity share capital 273 273 546 546 1,092 1,092 1,202 1,207 1,211 1,216 1,216 1,216 1,216
Reserves & surplus 2,980 3,474 3,805 4,726 4,993 5,628 12,949 14,278 14,714 19,234 24,358 26,789 29,778
Minority interest — — 16 (25) 105 1,392 4,188 (236) (154) (152) (152) (152) (152)
Shareholders funds 3,252 3,746 4,367 5,247 6,189 8,112 18,339 15,249 15,771 20,298 25,422 27,852 30,842
Total source of funds 3,256 3,753 4,374 5,250 6,194 8,116 18,342 15,253 15,850 20,301 25,422 27,852 30,842
Net fixed assets 385 363 741 643 1,620 1,588 5,878 824 1,291 592 855 879 929
Investments 183 1,141 2,628 3,152 2,614 5,380 11,745 15,825 14,886 18,786 22,415 23,415 24,415
Cash balances 3,221 2,791 2,076 2,855 3,466 3,072 3,582 1,541 3,032 1,599 6,975 9,266 12,192
Net current assets excluding cash (552) (577) (1,130) (1,441) (1,551) (1,987) (2,927) (3,450) (3,703) (1,154) (5,182) (6,068) (7,054)
Total application of funds 3,256 3,753 4,374 5,250 6,194 8,116 18,342 15,253 15,850 20,301 25,422 27,852 30,842
Cash flow statement
Operating profit before working capital changes 671 615 708 1,049 1,157 877 418 4,755 2,122 2,625 3,065 3,915 4,698
Change in working capital/ other adjustments (295) 24 553 311 110 436 940 523 253 (2,549) 4,028 885 986
Cash flow from operating activites 375 639 1,261 1,361 1,267 1,313 1,358 5,278 2,375 76 7,093 4,801 5,684
Fixed assets (75) (43) (457) 14 (1,095) (180) (4,759) 4,816 (794) 402 (534) (300) (300)
Investments 2,471 (959) (1,486) (525) 538 (2,766) (6,365) (4,080) 939 (3,900) (3,630) (1,000) (1,000)
Cash (used)/ realised in investing activities 2,396 (1,001) (1,944) (510) (557) (2,946) (11,124) 736 145 (3,498) (4,164) (1,300) (1,300)
Free cash flow 2,771 (362) (683) 850 710 (1,633) (9,767) 6,015 2,520 (3,421) 2,929 3,501 4,384
Dividend paid (24) (24) (48) (127) (127) (319) (435) (725) (437) (805) (1,207) (1,207) (1,455)
Interest charges (17) (20) (23) (22) (28) (30) (38) (1) (2) (3) (3) (3) (3)
Cash (used)/realised in financing activities (17) (44) (34) (180) — 996 9,947 (4,269) 946 (487) (1,213) (1,210) (1,458)
Cash generated/ utilised 2,735 (430) (714) 779 611 (395) 510 (2,041) 1,491 (1,433) 5,376 2,291 2,926
Cash at beginning of year 486 3,221 2,791 2,076 2,855 3,466 3,072 3,582 1,541 3,032 1,599 6,975 9,266
Cash at end of year 3,221 2,791 2,076 2,855 3,467 3,072 3,582 1,541 3,032 1,599 6,975 9,266 12,192

KOTAK INSTITUTIONAL EQUITIES RESEARCH 45
Ind
ia D
aily
Su
mm
ary
- July
25, 2
01
8
45
K
OTA
K IN
STIT
UTIO
NA
L EQ
UIT
IES R
ESEA
RC
H
June 2018: Results calendar
Source: NSE, Kotak Institutional Equities
Mon Tue Wed Thu Fri Sat Sun
23-Jul 24-Jul 25-Jul 26-Jul 27-Jul 28-Jul 29-Jul
ACC Asian Paints Ambuja Cements Bharat Financial Inclusion Bank of Baroda J K Cement
Hindustan Zinc GlaxoSmithkline Pharmaceuticals Bharti Infratel Bharti Airtel Coromandel International NTPC
Indiabulls Ventures Hexaw are Technologies BHEL Biocon Equitas Holdings
L&T Infotech ICICI Prudential Life Canara Bank CESC HCL Technologies
United Spirits Info Edge Crompton Greaves Consumer Cholamandalam ICICI Bank
PFC GRUH Finance City Union Bank JSW Energy
TeamLease Services Hero Motocorp Colgate-Palmolive (India) Jubilant Life Science
IRB Infrastructure Container Corporation Mahindra & Mahindra Financial
JSW Steel Dr Reddy's Laboratories Prestige Estates Projects
Jubilant Foodw orks ITC Reliance Industries
Jyothy Laboratories J&K Bank
Karur Vysya Bank Maruti Suzuki
L&T Petronet LNG
PVR SBI Life Insurance
Reliance Nippon Life Asset Management Schaeffler India
Rural Electrif ication Corp. Shriram Transport
Shriram City Union Finance Tata Pow er
SIS WABCO India
SKF Yes Bank
30-Jul 31-Jul 1-Aug 2-Aug 3-Aug 4-Aug 5-Aug
Avenue Supermarts Ajanta Pharma Aditya Birla Fashion Godrej Properties Berger Paints Divi's Laboratories P I Industries
Axis Bank Astral Poly Technik Apollo Tyres Indiabulls Housing Carborundum Universal
Central Bank of India Bank of India Emami JK Lakshmi Cement CG Pow er and Industrial
Century Textile Bharat Electronics Exide Industries Mahindra Logistics SAIL
Escorts Castrol India Gatew ay Distriparks Marico Titan Company
Godrej Consumer Products Dabur India Orient Cement ONGC
GSPL IIFL Holdings Pidilite Industries The Ramco Cement
HDFC Jagran Prakashan Reliance Infrastructure Torrent Pharmaceuticals
Idea Mahanagar Gas Tata Global Beverages
IDFC Bank Pow er Grid Torrent Pow er
Interglobe Aviation Supreme Industries
New India Assurance Tata Motors
NHPC UPL
Oberoi Realty Vedanta
Piramal Enterprises
Shree Cement
Tech Mahindra
6-Aug 7-Aug 8-Aug 9-Aug 10-Aug 11-Aug 12-Aug
Adani Port and SEZ AU Small Finance Cipla Coffee Day Enterprises Apollo Hospitals Amara Raja Batteries
Britannia Industries GlaxoSmithkline Consumer HPCL Gujarat Pipavav Port Dr Lal Pathlabs NBCC
Ujjivan Financial Services Kalpataru Pow er Transmission Lupin HCG Endurance Technologies
Mahindra & Mahindra PNB Housing Finance S H Kelkar and Company Hindalco Industries
Motherson Sumi Systems Thermax Timken
Mphasis Voltas
SRF
TVS Motor
13-Aug 14-Aug 15-Aug 16-Aug 17-Aug 18-Aug 19-Aug
Cadila Healthcare Grasim Industries
Dew an Housing Finance
Godrej Industries

46 KOTAK INSTITUTIONAL EQUITIES RESEARCH
KO
TA
K IN
STIT
UTIO
NA
L EQ
UIT
IES R
ESEA
RC
H
46
Ind
ia D
aily
Su
mm
ary
- July
25, 2
01
8
Kotak Institutional Equities: Valuation summary of KIE Universe stocks
Source: Company, Bloomberg, Kotak Institutional Equities estimates
Target O/S ADVT
Price (Rs) price Upside Mkt cap. shares EPS (Rs) EPS growth (%) P/E (X) EV/EBITDA (X) 3mo
Company Rating 24-Jul-18 (Rs) (%) (Rs bn) (US$ bn) (mn) 2018 2019E 2020E 2018 2019E 2020E 2018 2019E 2020E 2018 2019E 2020E 2018 2019E 2020E 2018 2019E 2020E 2018 2019E 2020E (US$ mn)
Automobiles
Amara Raja Batteries REDUCE 800 780 (2.4) 137 2.0 171 28 33 39 (1.6) 21.2 15.5 29.0 23.9 20.7 15.4 12.7 10.9 4.6 4.0 3.5 17.0 18.0 18.0 0.5 0.6 0.7 5.9
Apollo Tyres BUY 274 340 23.9 157 2.3 541 13 20 25 (38.0) 48.3 25.0 20.5 13.8 11.1 11.4 8.1 6.8 1.5 1.5 1.3 8.5 11.1 12.5 1.0 1.1 1.1 9.8
Ashok Leyland BUY 113 160 41.9 331 4.8 2,926 5.4 6.2 8.9 8.0 15.3 43.2 21.0 18.2 12.7 12.1 9.2 6.6 4.6 4.0 3.3 23.7 23.4 28.4 2.2 1.7 2.4 45.2
Bajaj Auto SELL 2,649 2,500 (5.6) 766 11.1 289 140 148 161 6.0 5.4 9.0 18.9 17.9 16.4 12.7 12.3 10.9 4.0 3.6 3.2 22.9 21.2 20.7 2.3 2.2 2.4 27.7
Balkrishna Industries REDUCE 1,207 1,260 4.4 233 3.4 193 37 50 63 4.8 34.8 25.0 32.3 24.0 19.2 17.1 13.2 10.5 5.7 4.7 3.9 19.0 21.6 22.2 0.4 0.5 0.5 8.4
Bharat Forge SELL 606 600 (1.0) 282 4.1 466 16 23 27 10.1 43.0 16.8 37.4 26.2 22.4 18.0 14.9 12.8 6.1 5.2 4.4 17.3 21.5 21.4 0.7 0.8 0.9 10.3
CEAT ADD 1,337 1,500 12.2 54 0.8 40 65 99 108 (29.5) 53.7 8.3 20.7 13.4 12.4 10.1 8.6 7.4 2.1 1.8 1.6 10.4 14.4 13.8 0.9 0.7 0.7 14.1
Eicher Motors SELL 27,698 26,000 (6.1) 755 11.0 27 792 995 1,200 29.3 25.5 20.6 35.0 27.8 23.1 25.2 20.3 16.5 14.0 10.1 7.6 46.4 42.3 37.5 0.1 0.1 0.1 17.4
Escorts BUY 871 1,170 34.3 74 1.5 89 39 56 69 71.3 43.6 23.6 22.5 15.6 12.7 12.8 9.5 7.4 3.0 2.6 2.2 13.5 16.8 17.7 0.5 1.0 1.2 15.8
Exide Industries SELL 270 225 (16.8) 230 3.3 850 8 10 11 0.6 23.7 10.9 32.9 26.6 24.0 18.5 15.5 13.8 4.3 3.9 3.5 13.5 15.2 15.3 0.9 1.1 1.3 8.2
Hero Motocorp SELL 3,108 3,500 12.6 621 9.0 200 185 206 227 9.5 11.1 10.1 16.8 15.1 13.7 10.3 9.2 8.2 5.3 4.6 4.1 33.8 32.6 31.6 2.7 3.3 3.6 19.6
Mahindra CIE Automotive ADD 241 290 20.4 91 1.3 378 10 14 16 107.0 45.0 12.7 25.1 17.3 15.4 12.4 8.7 7.7 2.5 2.1 1.9 10.4 13.2 13.1 — — — 3.0
Mahindra & Mahindra BUY 920 1,015 10.3 1,144 16.6 1,138 38 44 50 22.0 15.6 14.8 24.2 21.0 18.3 15.9 13.6 11.8 3.4 3.1 2.7 15.1 15.4 15.7 0.8 1.0 1.1 32.4
Maruti Suzuki ADD 9,832 9,700 (1.3) 2,970 43.1 302 256 330 395 5.1 29.2 19.6 38.5 29.8 24.9 21.7 17.0 13.7 7.1 6.1 5.2 19.8 22.0 22.6 0.6 0.8 1.0 62.8
Motherson Sumi Systems SELL 298 265 (11.1) 627 9.1 2,105 8 11 14 6.1 37.7 21.7 36.4 26.5 21.8 13.7 10.6 8.8 6.3 5.4 4.6 19.0 22.1 22.9 0.8 0.9 1.1 13.6
MRF REDUCE 77,628 76,000 (2.1) 329 4.8 4 2,669 3,896 4,447 (23.9) 46.0 14.1 29.1 19.9 17.5 13.2 9.8 8.4 3.4 2.9 2.5 12.3 15.7 15.4 0.1 0.1 0.1 7.2
Schaeffler India BUY 5,354 6,000 12.1 89 1.3 17 143 171 207 22.0 19.4 21.1 37.4 31.3 25.9 22.0 18.9 15.3 5.2 4.7 4.1 15.0 15.8 16.9 0.3 0.6 0.8 0.7
SKF REDUCE 1,646 1,700 3.3 85 1.2 51 58 70 81 24.6 20.8 16.4 28.5 23.6 20.3 17.6 15.1 12.6 4.6 4.0 3.5 16.1 17.0 17.2 0.7 0.9 1.0 0.2
Tata Motors BUY 259 445 71.9 879 11.9 3,396 20 23 38 (28.0) 15.9 63.8 13.0 11.2 6.8 3.8 3.5 2.9 0.9 0.9 0.8 8.8 7.9 11.7 — — — 57.8
Timken SELL 726 660 (9.1) 49 0.7 68 14 19 25 (5.3) 42.3 27.5 53.6 37.7 29.6 29.9 20.8 16.6 7.0 6.0 5.0 13.9 17.1 18.5 0.1 0.1 0.1 0.4
TVS Motor SELL 552 410 (25.7) 262 3.8 475 14 18 22 18.7 26.8 21.8 39.6 31.2 25.6 24.1 18.2 15.2 9.1 7.7 6.4 25.1 26.7 27.3 0.6 1.0 1.2 11.3
WABCO India SELL 6,810 6,350 (6.8) 129 1.9 19 144 169 222 27.8 17.8 31.3 47.3 40.2 30.6 30.7 26.2 19.8 8.5 7.1 5.8 19.5 19.2 20.9 0.1 0.1 0.2 0.5
Automobiles Neutral 10,296 149 (0.9) 22.2 25.4 26.4 21.6 17.2 11.7 9.8 8.1 3.7 3.3 2.9 14.2 15.4 16.8 0.8 1.0 1.1 372.3
Banks
Axis Bank ADD 546 600 9.9 1,402 20.3 2,567 1 20 39 (92.6) 1,735.5 100.1 508.4 27.7 13.8 — — — 2.7 2.4 2.0 0.5 7.7 13.8 0.9 0.5 1.1 59.2
Bank of Baroda NR 133 — — 351 5.1 2,652 (9) 20 23 (253.2) 323.2 10.5 (14.5) 6.5 5.9 — — — 1.6 1.2 0.9 (5.8) 12.6 12.3 — — — 28.6
Bank of India ADD 88 120 36.6 153 2.2 1,744 (35) (6) 16 (134.7) 82.2 366.7 (2.5) (14.3) 5.3 — — — 1.3 1.7 1.0 (21.3) (3.6) 9.5 — (1.4) 3.7 11.1
Canara Bank ADD 253 300 18.7 185 2.7 733 (58) (2) 60 (406.6) 97.3 4,031.4 (4.4) (164.5) 4.2 — — — 1.6 1.6 0.9 (11.9) (0.3) 11.8 — — — 27.6
City Union Bank ADD 168 190 13.0 123 1.8 665 9 10 12 6.4 16.2 13.0 18.9 16.2 14.4 — — — 2.9 2.5 2.2 15.3 15.5 15.5 0.2 1.1 1.2 1.9
DCB Bank ADD 164 205 25.0 51 0.7 308 8 10 12 13.8 28.2 21.0 20.6 16.1 13.3 — — — 2.1 1.9 1.7 10.9 11.7 12.7 — 0.6 0.7 4.8
Equitas Holdings BUY 139 190 36.3 48 0.7 340 0.9 4.4 8.3 (80.4) 374.7 88.2 150.7 31.7 16.9 — — — 2.2 2.0 1.8 1.4 6.4 11.0 — — — 4.5
Federal Bank BUY 88 130 48.2 174 2.5 1,972 4.4 5.7 7.9 (9.3) 29.5 39.5 20.1 15.5 11.1 — — — 1.5 1.4 1.3 8.2 8.8 11.4 1.1 1.5 2.1 20.0
HDFC Bank REDUCE 2,161 2,000 (7.4) 5,627 81.6 2,595 67 77 93 18.7 14.1 21.1 32.1 28.1 23.2 — — — 5.4 4.1 3.6 17.9 16.5 16.2 0.6 0.7 0.8 82.7
ICICI Bank BUY 274 400 45.8 1,765 25.6 6,429 11 15 25 (31.1) 46.5 64.1 26.0 17.8 10.8 — — — 2.1 1.8 1.6 6.6 9.1 13.7 0.5 1.1 1.8 85.3
IDFC Bank NR 39 — — 132 1.9 3,404 2.5 1.6 3.3 (16.0) (38.5) 109.8 15.3 24.9 11.9 — — — 0.9 0.8 0.8 5.7 3.4 6.9 1.3 0.8 1.7 9.2
IndusInd Bank REDUCE 1,947 1,900 (2.4) 1,169 17.0 600 60 71 87 25.3 17.5 23.6 32.4 27.6 22.3 — — — 5.1 4.1 3.6 17.1 17.6 16.8 — 0.4 0.5 30.9
J&K Bank BUY 49 105 116.0 27 0.4 557 4 8 11 111.6 116.7 44.4 13.4 6.2 4.3 — — — 0.6 0.5 0.4 3.4 6.9 9.4 — 3.2 4.7 0.3
Karur Vysya Bank ADD 100 120 20.2 73 1.1 727 5 4 14 (52.2) (22.8) 274.8 21.0 27.2 7.3 — — — 1.4 1.4 1.2 6.1 4.2 14.7 0.6 0.9 3.4 1.7
Punjab National Bank ADD 79 90 13.5 219 3.2 2,761 (44) (39) 9 (814.7) 13.4 124.1 (1.8) (2.1) 8.5 — — — 4.7 (3.6) (13.5) (32.4) (31.3) 8.2 — (10.5) 2.5 29.7
RBL Bank SELL 570 475 (16.6) 240 3.5 420 15 22 29 27.3 48.1 31.5 37.6 25.4 19.3 — — — 3.7 3.3 3.0 11.5 13.3 15.5 0.4 0.6 0.8 13.0
State Bank of India BUY 267 370 38.7 2,380 34.5 8,925 (7) 18 37 (155.8) NM 106.1 NM 14.8 7.2 — — — 2.1 1.6 1.2 (3.2) 7.1 13.2 - 0.1 0.1 73.4
Ujjivan Financial Services REDUCE 392 420 7.1 47 0.7 121 1 22 29 (96.5) 3,564.0 30.0 649.7 17.7 13.6 — — — 2.8 2.4 2.1 0.4 14.2 16.1 0.0 0.5 0.8 6.8
Union Bank ADD 81 130 60.0 95 1.4 1,169 (45) 1 24 (655.5) 101.4 3,896.2 (1.8) 132.7 3.3 — — — 1.4 1.2 0.8 (23.6) 0.3 11.8 — 0.1 4.5 9.5
YES Bank SELL 384 325 (15.4) 886 12.9 2,303 18 19 21 25.7 4.6 11.0 21.0 20.0 18.1 — — — 3.6 3.1 2.8 17.7 16.0 15.7 0.6 0.8 0.9 65.2
Banks Attractive 15,146 220 (101.3) 9,688.8 104.1 (2,424.8) 25.3 12.4 1.9 1.7 1.6 (0.1) 6.9 12.6 0.5 0.4 0.9 565.4
Dividend yield (%)P/B (X) RoE (%)

KOTAK INSTITUTIONAL EQUITIES RESEARCH 47
In
dia
Da
ily S
um
ma
ry - Ju
ly 2
5, 2
01
8
47
K
OTA
K IN
STIT
UTIO
NA
L EQ
UIT
IES R
ESEA
RC
H
Kotak Institutional Equities: Valuation summary of KIE Universe stocks
Source: Company, Bloomberg, Kotak Institutional Equities estimates
Target O/S ADVT
Price (Rs) price Upside Mkt cap. shares EPS (Rs) EPS growth (%) P/E (X) EV/EBITDA (X) 3mo
Company Rating 24-Jul-18 (Rs) (%) (Rs bn) (US$ bn) (mn) 2018 2019E 2020E 2018 2019E 2020E 2018 2019E 2020E 2018 2019E 2020E 2018 2019E 2020E 2018 2019E 2020E 2018 2019E 2020E (US$ mn)
NBFCs
Bajaj Finance SELL 2,713 2,000 (26.3) 1,568 22.7 575 43 68 90 29.2 56.6 31.9 62.5 39.9 30.3 — — — 9.9 8.1 6.6 19.7 22.4 24.0 0.1 0.3 0.3 51.9
Bajaj Finserv REDUCE 6,828 6,100 (10.7) 1,087 15.8 159 176 245 307 10.3 39.7 25.2 38.9 27.8 22.2 — — — 5.4 4.4 3.7 15.6 17.5 18.1 0.2 0.2 0.2 16.9
Bharat Financial Inclusion NA 1,193 — — 166 2.4 139 33 43 54 55.5 31.1 27.2 36.5 27.9 21.9 — — — 5.5 4.5 3.7 16.7 17.9 18.5 — — — 10.2
Cholamandalam REDUCE 1,515 1,510 (0.3) 237 3.4 156 62 76 92 35.5 22.3 20.8 24.3 19.9 16.5 — — — 4.8 4.0 3.4 20.6 21.0 21.2 0.4 0.6 0.7 7.9
HDFC BUY 1,976 2,075 5.0 3,339 48.4 1,676 75 58 67 52.1 (23.1) 15.2 26.2 34.1 29.6 — — — 5.2 4.5 4.1 23.9 14.3 14.5 1.0 1.0 1.2 70.7
HDFC Standard Life Insurance SELL 480 405 (15.7) 966 14.0 2,007 6 6 7 24.4 14.8 10.9 86.8 75.6 68.2 — — — 22.4 20.0 17.9 27.3 28.0 27.7 0.3 0.3 0.4 12.9
ICICI Lombard SELL 793 620 (21.8) 360 5.2 454 19 26 32 22.0 37.1 21.5 41.8 30.5 25.1 — — — 7.9 6.7 5.6 20.8 23.8 24.2 0.5 0.8 0.9 2.3
ICICI Prudential Life BUY 386 500 29.6 554 8.0 1,436 11 12 13 (3.7) 10.1 7.0 34.2 31.1 29.0 — — — 8.4 6.9 5.8 25.0 24.5 21.8 1.5 0.5 0.6 12.3
IIFL Holdings SELL 655 625 (4.6) 209 3.0 319 29 34 41 32.4 17.3 21.4 22.9 19.5 16.1 — — — 4.1 3.6 3.1 19.0 19.3 20.0 0.9 1.1 1.3 1.4
L&T Finance Holdings ADD 179 190 6.3 357 5.2 1,996 7 13 14 23.7 70.9 12.3 24.4 14.3 12.7 — — — 2.8 2.6 2.2 14.2 18.9 18.8 1.0 1.1 1.4 10.6
LIC Housing Finance BUY 538 610 13.5 271 3.9 505 44 50 58 3.2 13.8 17.5 12.3 10.8 9.2 — — — 2.0 1.7 1.5 14.5 14.3 14.4 1.3 1.4 1.7 13.0
Magma Fincorp BUY 143 200 39.8 39 0.6 237 10 12 15 1,014.5 24.6 25.8 14.7 11.8 9.4 — — — 1.5 1.4 1.3 10.2 12.9 14.1 0.6 1.3 1.6 1.7
Mahindra & Mahindra Financial REDUCE 483 475 (1.6) 298 4.3 614 15 22 26 105.0 53.5 16.6 33.3 21.7 18.6 — — — 3.4 3.1 2.8 11.3 14.0 14.8 0.8 1.3 1.5 10.8
Max Financial Services BUY 468 650 38.9 126 1.8 268 5 6 6 (20.4) 36.9 1.8 102.1 74.6 73.2 — — — — — — 6.5 8.3 8.0 — 0.5 0.5 4.6
Muthoot Finance ADD 410 480 17.2 164 2.4 400 43 38 40 45.6 (10.8) 4.0 9.5 10.7 10.3 — — — 2.1 1.8 1.6 24.1 18.4 16.9 2.4 2.2 2.2 4.6
PNB Housing Finance REDUCE 1,267 1,375 8.5 212 3.1 167 50 61 77 57.8 23.0 25.3 25.5 20.7 16.5 — — — 3.3 3.1 2.7 14.0 15.2 16.8 0.7 0.3 0.3 10.0
SBI Life Insurance ADD 653 815 24.7 653 9.5 1,000 12 15 18 20.8 26.0 22.9 56.7 45.0 36.6 — — — 10.2 8.5 7.1 19.4 20.6 21.3 0.3 0.4 0.4 4.9
Shriram City Union Finance ADD 1,912 2,325 21.6 126 1.8 66 101 140 174 19.6 39.4 23.8 19.0 13.6 11.0 — — — 2.4 2.1 1.8 12.5 15.5 16.7 0.9 0.9 1.1 0.7
Shriram Transport ADD 1,265 1,400 10.6 287 4.2 227 69 105 125 24.7 52.1 18.7 18.3 12.0 10.1 — — — 2.4 2.1 1.8 13.1 17.6 18.0 0.9 1.2 1.4 27.9
NBFCs Neutral 11,019 160 36.9 12.0 18.8 32.2 28.7 24.2 5.4 4.6 4.0 16.8 16.1 16.6 0.7 0.7 0.8 565.4
Cement
ACC SELL 1,476 1,270 (13.9) 277 4.0 188 49 62 70 32.7 27.0 13.8 30.3 23.9 21.0 16.1 13.1 11.3 3.0 2.7 2.5 10.1 11.9 12.5 1.2 1.2 1.2 11.1
Ambuja Cements REDUCE 213 215 1.1 422 6.1 1,986 8 7 9 29.7 (1.3) 27.0 28.3 28.7 22.6 9.3 9.2 7.5 2.0 2.0 1.9 7.4 7.0 8.6 1.7 1.7 1.7 9.4
Dalmia Bharat ADD 2,576 2,900 12.6 230 3.3 89 60 98 128 55.4 62.6 30.3 42.7 26.3 20.1 13.2 10.1 8.2 3.8 3.3 2.8 9.7 13.4 15.2 0.1 0.1 0.1 4.9
Grasim Industries BUY 998 1,275 27.8 656 9.5 657 47 52 69 (30.1) 9.1 32.8 21.0 19.3 14.5 12.0 7.4 6.7 1.1 1.1 1.0 7.0 5.8 7.2 0.6 0.6 0.6 13.7
India Cements REDUCE 117 135 15.3 36 0.5 308 3 5 9 (42.5) 56.2 84.4 35.9 23.0 12.4 9.8 8.4 6.6 0.7 0.7 0.6 2.0 3.0 5.3 0.9 0.9 0.9 6.7
J K Cement REDUCE 773 1,000 29.3 54 0.8 70 43 51 83 25.1 17.0 65.0 17.9 15.3 9.3 9.5 10.2 8.3 2.7 2.4 1.9 16.2 16.7 23.2 1.0 1.0 1.0 0.5
JK Lakshmi Cement ADD 334 425 27.4 39 0.6 118 4 18 33 (35.7) 311.2 79.6 74.6 18.1 10.1 13.7 8.3 5.9 2.7 2.4 2.0 3.7 14.1 21.5 0.6 0.6 0.6 0.4
Orient Cement ADD 122 165 35.1 25 0.4 205 2 8 12 237.8 250.7 64.8 56.6 16.1 9.8 12.2 7.8 5.7 2.4 2.2 1.9 4.4 14.3 20.6 0.6 1.2 1.6 0.2
Shree Cement SELL 17,740 12,700 (28.4) 618 9.0 35 397 486 662 3.4 22.3 36.2 44.7 36.5 26.8 24.0 18.2 14.2 6.9 6.0 5.0 16.7 17.6 20.2 0.3 0.3 0.3 4.8
UltraTech Cement SELL 4,137 2,950 (28.7) 1,136 16.5 275 88 126 162 (7.8) 42.7 28.9 47.0 32.9 25.5 23.2 17.2 14.2 4.4 3.9 3.4 9.7 12.6 14.3 0.2 0.2 0.2 18.6
Cement Cautious 3,494 51 5.9 24.8 32.4 33.7 27.0 20.4 15.2 10.8 9.1 2.5 2.4 2.1 7.5 8.7 10.5 0.6 0.6 0.6 70.2
Dividend yield (%)P/B (X) RoE (%)

48 KOTAK INSTITUTIONAL EQUITIES RESEARCH
K
OTA
K IN
STIT
UTIO
NA
L EQ
UIT
IES R
ESEA
RC
H
48
Ind
ia D
aily
Su
mm
ary
- July
25, 2
01
8
Kotak Institutional Equities: Valuation summary of KIE Universe stocks
Source: Company, Bloomberg, Kotak Institutional Equities estimates
Target O/S ADVT
Price (Rs) price Upside Mkt cap. shares EPS (Rs) EPS growth (%) P/E (X) EV/EBITDA (X) 3mo
Company Rating 24-Jul-18 (Rs) (%) (Rs bn) (US$ bn) (mn) 2018 2019E 2020E 2018 2019E 2020E 2018 2019E 2020E 2018 2019E 2020E 2018 2019E 2020E 2018 2019E 2020E 2018 2019E 2020E (US$ mn)
Consumer products
Asian Paints REDUCE 1,468 1,325 (9.7) 1,408 20.4 959 21 27 33 2.9 32.1 20.3 71.5 54.1 45.0 43.7 34.0 28.1 16.7 14.6 12.8 24.6 28.8 30.3 0.6 0.8 1.0 19.1
Bajaj Corp. ADD 402 470 16.9 59 0.9 148 14 15 17 (9.4) 7.8 10.3 28.1 26.1 23.6 22.2 20.8 17.8 12.0 12.1 12.1 42.8 46.3 51.2 3.0 3.2 3.5 0.4
Britannia Industries ADD 6,470 6,000 (7.3) 777 11.3 120 84 104 126 13.5 24.4 21.5 77.3 62.2 51.2 51.2 40.2 33.1 22.8 18.1 14.6 32.9 32.4 31.6 0.4 0.5 0.7 9.5
Coffee Day Enterprises REDUCE 264 340 28.8 56 0.8 211 3 8 13 49.1 149.7 59.4 78.9 31.6 19.8 13.4 — — 2.3 2.2 2.0 3.1 7.2 10.4 — — — 1.3
Colgate-Palmolive (India) ADD 1,119 1,300 16.2 304 4.4 272 24 27 32 15.2 14.6 16.9 47.1 41.1 35.1 26.9 23.6 20.3 20.0 20.1 17.1 46.2 48.8 52.6 2.1 1.4 1.7 7.9
Dabur India REDUCE 374 350 (6.3) 660 9.6 1,762 8 9 10 7.2 16.1 11.7 48.1 41.4 37.1 40.7 35.3 30.9 11.5 11.6 10.1 25.9 27.9 29.1 2.0 1.0 1.2 9.8
GlaxoSmithKline Consumer ADD 6,408 6,750 5.3 269 3.9 42 166 189 211 6.6 13.3 11.9 38.5 34.0 30.4 26.4 22.7 19.5 7.7 7.0 6.4 21.2 21.7 22.2 1.2 1.4 1.6 2.0
Godrej Consumer Products REDUCE 1,356 1,020 (24.8) 924 13.4 681 21 25 28 11.5 17.6 13.3 63.5 54.0 47.6 45.0 38.3 33.4 14.8 12.8 11.1 25.2 25.4 24.9 0.5 0.6 0.7 8.9
Hindustan Unilever REDUCE 1,668 1,570 (5.9) 3,610 52.4 2,160 25 29 33 25.0 19.5 13.2 68.0 56.9 50.3 48.8 39.4 34.6 50.9 44.5 37.8 78.1 83.5 81.4 1.2 1.3 1.4 33.4
ITC ADD 284 315 10.8 3,473 50.4 12,275 9 10 11 7.8 7.8 12.4 31.9 29.6 26.3 20.9 19.1 16.9 6.8 6.4 6.0 19.4 20.3 22.2 1.8 2.0 2.4 41.8
Jubilant Foodworks BUY 1,437 1,500 4.4 190 2.8 132 15 24 33 191.7 64.1 39.2 98.8 60.2 43.2 42.2 29.2 21.9 19.6 14.3 11.0 21.7 27.5 28.8 0.1 0.1 0.2 37.0
Jyothy Laboratories ADD 227 220 (3.0) 82 1.2 364 4 6 6 35.1 25.4 17.2 51.5 41.1 35.1 31.6 26.1 22.6 7.2 6.2 5.4 14.3 16.3 16.6 0.2 0.4 0.7 1.5
Manpasand Beverages SELL 114 132 15.5 13 0.2 114 9 11 13 37.6 21.3 26.5 13.1 10.8 8.5 6.5 4.3 3.5 1.0 1.0 0.9 8.3 9.3 10.7 0.4 0.4 0.4 3.7
Marico ADD 354 345 (2.4) 456 6.6 1,291 6 7 8 7.4 16.7 13.7 56.4 48.3 42.5 39.8 33.4 29.1 17.9 16.6 15.3 33.2 35.7 37.5 1.2 1.3 1.6 9.1
Nestle India ADD 10,291 9,500 (7.7) 992 14.4 96 127 168 191 21.1 32.5 13.4 81.0 61.1 53.9 44.5 34.7 30.5 29.0 26.7 24.5 36.6 45.5 47.3 0.8 1.1 1.3 8.6
Page Industries SELL 28,520 21,000 (26.4) 318 4.6 11 311 392 482 32.5 26.1 22.9 91.7 72.7 59.2 58.4 46.2 38.0 37.5 29.3 23.4 45.9 45.3 44.0 0.5 0.6 0.7 7.9
Pidilite Industries REDUCE 1,077 1,050 (2.5) 547 7.9 508 18 22 26 7.5 20.4 20.4 59.7 49.6 41.2 39.9 33.2 27.4 15.3 12.9 10.8 26.0 28.2 28.5 0.6 0.6 0.8 13.3
S H Kelkar and Company BUY 199 315 58.1 29 0.4 145 7 8 11 2.1 11.8 28.4 26.9 24.1 18.8 18.8 15.7 12.3 3.4 3.0 2.7 12.8 13.3 15.3 0.9 0.9 1.0 0.2
Tata Global Beverages REDUCE 246 285 15.7 155 2.3 631 7 10 11 20.7 29.4 19.1 33.5 25.9 21.7 17.6 14.8 12.7 2.2 2.1 2.0 7.0 8.3 9.4 1.0 1.2 1.4 13.3
Titan Company SELL 862 800 (7.2) 765 11.1 888 13 16 20 43.3 26.7 20.6 67.4 53.2 44.1 46.2 35.2 28.2 15.0 12.7 10.6 24.3 25.8 26.2 0.4 0.5 0.6 35.5
United Breweries SELL 1,107 1,000 (9.7) 293 4.2 264 15 19 24 71.6 29.7 23.4 74.2 57.2 46.4 32.7 27.2 23.5 10.9 9.3 8.0 15.7 17.6 18.6 0.2 0.3 0.4 10.2
United Spirits REDUCE 582 590 1.3 423 6.1 727 8 10 13 39.1 34.7 30.9 76.5 56.8 43.4 44.1 33.1 26.8 16.9 11.6 8.5 24.9 24.2 22.7 — — 0.3 18.5
Varun Beverages ADD 699 750 7.3 128 1.9 183 12 17 22 377.8 45.4 29.8 60.7 41.7 32.1 18.7 15.1 12.9 7.2 6.2 5.3 12.1 16.0 17.7 — — 0.1 1.5
Consumer products Cautious 15,932 231 15.0 17.9 15.7 52.6 44.6 38.6 34.3 28.7 24.7 12.9 11.6 10.4 24.5 26.0 26.9 1.1 1.2 1.4 294.6
Energy
BPCL REDUCE 397 390 (1.8) 861 12.5 1,967 40 39 41 (1.5) (3.6) 5.3 9.9 10.2 9.7 8.0 7.5 6.9 2.3 2.0 1.8 24.8 21.1 20.0 5.3 3.9 4.1 32.7
Castrol India ADD 166 215 29.8 164 2.4 989 7 8 9 3.3 13.6 10.9 24.1 21.2 19.1 15.1 13.3 12.0 16.1 15.2 14.9 67.9 73.6 78.6 2.9 3.6 4.2 4.0
GAIL (India) BUY 366 410 12.1 825 12.0 2,255 20 25 27 21.8 23.2 8.3 17.9 14.5 13.4 11.2 9.3 8.6 2.0 1.9 1.7 11.7 13.5 13.5 2.0 2.3 2.5 21.6
GSPL SELL 190 170 (10.6) 107 1.6 564 12 11 11 34.5 (7.0) (4.6) 16.0 17.3 18.1 8.2 6.8 6.8 2.1 1.9 1.8 14.0 11.7 10.2 0.9 0.9 0.8 1.6
HPCL REDUCE 285 320 12.3 434 6.3 1,524 42 32 33 (3.2) (23.4) 3.4 6.8 8.9 8.6 5.9 7.7 7.8 1.8 1.6 1.5 28.7 19.3 18.2 6.0 4.6 4.7 30.8
Indraprastha Gas SELL 282 240 (15.0) 198 2.9 700 10 12 13 19.0 16.5 12.0 27.4 23.5 21.0 17.3 15.0 13.2 5.6 4.8 4.2 22.4 22.2 21.5 0.7 0.9 1.1 10.5
IOCL REDUCE 165 160 (3.0) 1,602 23.2 9,479 21 17 18 (24.8) (17.9) 7.4 8.0 9.8 9.1 4.7 5.4 5.0 1.4 1.3 1.2 18.5 14.0 14.0 7.0 4.1 4.4 25.7
Mahanagar Gas ADD 852 850 (0.2) 84 1.2 99 48 52 54 21.5 6.5 5.3 17.6 16.5 15.7 10.7 9.6 8.9 4.0 3.6 3.2 24.3 22.8 21.4 2.2 2.4 2.5 4.2
ONGC ADD 157 200 27.2 2,017 29.3 12,833 17 21 21 3.1 19.6 (1.3) 9.0 7.6 7.6 4.9 3.8 3.7 0.9 0.8 0.8 9.9 11.5 10.7 4.2 4.5 4.5 18.0
Oil India SELL 207 220 6.5 235 3.4 1,135 25 24 24 22.6 (1.3) (0.7) 8.4 8.5 8.5 6.5 5.9 5.9 0.8 0.8 0.8 9.8 9.7 9.2 5.0 5.3 5.3 3.3
Petronet LNG BUY 216 280 29.7 324 4.7 1,500 14 16 18 22.1 17.3 13.2 15.5 13.3 11.7 10.4 8.9 7.5 3.3 2.9 2.6 23.3 23.4 23.3 2.1 2.6 3.4 12.1
Reliance Industries REDUCE 1,111 930 (16.3) 6,572 95.3 5,922 59 68 77 16.9 14.9 13.9 18.8 16.4 14.4 13.9 11.2 9.4 2.2 2.0 1.8 11.6 11.9 12.1 0.5 0.6 0.6 117.6
Energy Attractive 13,423 195 1.0 5.8 7.3 13.0 12.3 11.5 8.5 7.5 6.8 1.7 1.6 1.4 13.3 12.8 12.6 2.5 2.2 2.3 282.2
Dividend yield (%)P/B (X) RoE (%)

KOTAK INSTITUTIONAL EQUITIES RESEARCH 49
In
dia
Da
ily S
um
ma
ry - Ju
ly 2
5, 2
01
8
49
K
OTA
K IN
STIT
UTIO
NA
L EQ
UIT
IES R
ESEA
RC
H
Kotak Institutional Equities: Valuation summary of KIE Universe stocks
Source: Company, Bloomberg, Kotak Institutional Equities estimates
Target O/S ADVT
Price (Rs) price Upside shares 3mo
Company Rating 24-Jul-18 (Rs) (%) (Rs bn) (US$ bn) (mn) 2018 2019E 2020E 2018 2019E 2020E 2018 2019E 2020E 2018 2019E 2020E 2018 2019E 2020E 2018 2019E 2020E 2018 2019E 2020E (US$ mn)
Industrials
ABB SELL 1,168 1,020 (12.7) 248 3.6 212 20 26 29 12.1 30.1 14.2 58.9 45.3 39.7 32.4 26.5 23.7 6.9 6.3 5.7 12.2 14.5 15.1 0.3 0.8 0.8 1.5
BHEL SELL 73 81 10.3 270 3.9 3,671 2.2 2.6 5.4 62.7 19.4 106.9 33.4 28.0 13.5 8.1 7.5 3.8 0.8 0.8 0.8 2.5 3.0 6.1 2.5 3.0 6.1 9.0
Carborundum Universal SELL 345 310 (10.1) 65 0.9 189 11 14 17 22.8 25.4 20.2 30.2 24.1 20.1 16.3 12.1 10.4 4.2 3.7 3.3 14.6 16.4 17.6 0.6 1.2 1.5 0.3
CG Power and Industrial BUY 64 65 2.1 40 0.6 627 0.8 3.1 4.3 (72.2) 275.7 40.5 78.0 20.7 14.8 11.4 8.5 7.0 1.5 1.6 1.5 1.5 7.3 10.4 — — — 6.9
Crompton Greaves Consumer SELL 242 210 (13.1) 152 2.2 627 5.2 6.2 7.5 13.3 20.0 20.9 46.8 39.0 32.3 28.7 24.3 20.5 19.2 13.3 10.2 49.5 40.5 35.9 0.6 0.8 1.0 2.4
Cummins India REDUCE 668 680 1.9 185 2.7 277 24 28 32 (7.8) 16.1 13.9 27.6 23.7 20.8 24.3 20.8 17.3 4.6 4.3 4.0 17.4 18.9 20.1 2.2 2.2 2.5 4.0
Havells India SELL 599 485 (19.0) 374 5.4 625 11 14 17 16.6 26.6 20.5 54.0 42.7 35.4 34.5 27.2 22.1 10.0 8.8 7.7 19.8 22.0 23.2 0.6 0.8 1.0 11.4
Kalpataru Power Transmission BUY 371 530 42.9 57 0.8 153 19 24 34 36.5 24.3 39.8 19.1 15.4 11.0 8.2 6.8 5.4 2.1 1.9 1.6 11.7 13.1 16.1 0.7 0.7 0.7 0.6
KEC International BUY 345 430 24.8 89 1.3 257 18 22 29 51.1 22.0 34.4 19.2 15.8 11.7 10.3 8.6 6.8 4.4 3.6 2.9 25.7 25.2 27.1 0.7 0.8 1.1 3.0
L&T BUY 1,324 1,560 17.8 1,856 26.9 1,401 52 62 76 22.4 19.4 23.0 25.6 21.4 17.4 21.0 17.3 15.3 3.7 3.4 3.0 15.0 16.5 18.2 1.2 1.7 2.1 41.6
Siemens SELL 963 975 1.2 343 5.0 356 24 30 37 22.5 23.0 23.2 39.8 32.4 26.3 22.4 17.9 14.3 4.2 3.9 3.7 10.9 12.6 14.5 1.0 1.3 1.6 3.5
Thermax REDUCE 1,062 1,065 0.3 126 1.8 113 21 30 42 (3.6) 44.2 42.8 51.5 35.7 25.0 31.4 22.2 15.8 4.4 4.1 3.6 8.8 11.8 15.3 0.6 0.7 0.9 0.8
Voltas SELL 585 525 (10.3) 194 2.8 331 17 19 22 12.6 8.3 15.6 33.8 31.2 27.0 28.1 23.9 19.9 5.0 4.4 4.0 15.9 15.0 15.5 0.7 0.7 0.9 14.1
Industrials Neutral 3,997 58 19.8 21.5 28.3 31.1 25.6 19.9 20.4 16.9 13.9 3.4 3.1 2.9 10.8 12.3 14.5 1.1 1.5 1.9 99.1
Infrastructure
Adani Ports and SEZ BUY 392 470 20.1 811 11.8 2,071 20 20 23 6.1 (0.2) 14.7 19.5 19.6 17.1 13.8 13.4 11.8 3.8 3.3 2.8 21.5 18.1 17.9 0.5 0.6 0.8 24.8
Ashoka Buildcon BUY 147 210 42.9 41 0.6 282 8 8 9 34.6 0.5 5.2 17.5 17.4 16.5 14.1 11.9 10.6 2.1 1.8 1.7 13.0 11.4 10.7 0.7 1.1 0.8 0.8
Container Corp. SELL 663 635 (4.3) 323 4.7 487 18 21 26 7.3 20.0 21.4 37.5 31.3 25.8 24.8 19.3 15.3 3.4 3.2 2.9 9.4 10.6 11.9 2.6 1.3 1.6 8.7
Dilip Buildcon BUY 662 1,220 84.4 90 1.3 137 46 54 69 76.5 16.1 28.0 14.2 12.3 9.6 8.3 6.0 4.9 3.7 2.8 2.2 29.5 25.9 25.4 — — — 8.2
Gateway Distriparks BUY 170 250 47.4 18 0.3 109 8 8 9 12.1 (1.2) 17.5 22.2 22.4 19.1 21.2 10.5 8.8 1.8 3.6 3.2 8.2 10.8 17.6 4.1 — 1.8 0.8
Gujarat Pipavav Port BUY 119 170 42.3 58 0.8 483 4.1 5.9 7.2 (20.6) 43.7 22.5 29.1 20.2 16.5 14.3 11.8 9.3 2.9 2.8 2.7 9.8 14.0 16.8 2.8 4.1 4.9 0.8
IRB Infrastructure BUY 198 330 66.8 70 1.0 351 23 31 33 10.8 36.8 7.1 8.8 6.4 6.0 7.0 6.6 7.1 1.2 1.0 0.9 14.5 17.6 16.3 1.1 1.6 2.0 8.5
Mahindra Logistics BUY 573 540 (5.8) 41 0.6 71 10 14 18 16.2 42.8 31.2 58.4 40.9 31.2 33.7 22.6 17.1 9.7 8.1 6.7 18.2 21.6 23.5 — — — 0.8
Sadbhav Engineering BUY 275 440 60.1 47 0.7 172 13 18 18 17.4 38.4 2.2 21.4 15.4 15.1 14.9 11.9 9.2 2.5 2.2 1.9 12.5 15.2 13.7 — — — 0.8
Infrastructure Attractive 1,499 22 10.9 10.5 15.5 20.7 18.7 16.2 13.2 11.7 10.2 3.3 2.9 2.5 15.8 15.4 15.5 1.1 0.9 1.1 54.2
Internet
Info Edge ADD 1,354 1,425 5.3 165 2.4 122 23 26 33 33.3 14.9 27.5 60.1 52.4 41.1 50.3 39.3 29.7 7.8 6.2 5.6 13.4 13.2 14.3 0.4 0.6 0.6 1.9
Just Dial ADD 563 610 8.4 38 0.5 67 21 26 30 21.7 23.0 15.0 26.5 21.5 18.7 15.7 12.1 9.8 3.9 3.3 2.9 15.2 16.7 16.6 — 0.5 0.5 50.1
Internet Cautious 203 3 28.0 17.6 23.0 48.7 41.4 33.6 38.0 29.9 23.5 6.6 5.4 4.8 13.5 12.9 14.2 0.3 0.6 0.6 52.0
Media
DB Corp. REDUCE 263 270 2.5 48 0.7 184 18 20 23 (14.1) 14.9 12.3 15.0 13.0 11.6 8.0 7.1 6.3 2.9 2.6 2.5 19.9 20.7 22.3 4.9 6.4 8.0 0.6
DishTV ADD 72 90 25.3 132 1.9 1,925 (0.4) 1.8 3.4 (143.0) 514.6 88.2 NM 39.3 20.9 11.7 6.1 4.9 2.1 2.0 1.8 (2.3) 5.1 8.9 — — — 7.7
Jagran Prakashan REDUCE 133 168 26.4 41 0.6 311 10 12 14 (6.0) 21.7 15.3 13.3 10.9 9.5 6.0 5.4 4.7 2.0 2.0 1.9 14.8 18.1 20.9 2.3 3.8 6.8 0.4
PVR REDUCE 1,173 1,425 21.5 55 0.8 47 27 38 50 25.5 39.8 33.2 43.7 31.2 23.5 14.9 12.3 10.2 5.1 4.5 3.8 12.3 15.2 17.5 0.2 0.3 0.4 9.2
Sun TV Network REDUCE 788 925 17.4 310 4.5 394 29 35 39 10.2 20.7 10.9 27.3 22.7 20.4 18.3 15.4 13.4 6.7 6.0 5.4 26.3 28.1 27.9 1.3 2.2 2.5 21.5
Zee Entertainment Enterprises ADD 524 600 14.6 503 7.3 960 15 17 20 7.8 11.3 17.0 34.9 31.3 26.8 22.6 19.5 16.5 6.7 5.9 5.2 20.3 19.9 20.6 0.5 0.9 1.1 15.9
Media Attractive 1,090 16 (1.5) 29.6 21.1 33.5 25.8 21.3 16.2 12.4 10.5 4.6 4.2 3.8 13.7 16.4 17.9 0.9 1.5 1.8 55.4
Dividend yield (%)P/B (X) RoE (%)Mkt cap. EPS (Rs) EPS growth (%) P/E (X) EV/EBITDA (X)

50 KOTAK INSTITUTIONAL EQUITIES RESEARCH
K
OTA
K IN
STIT
UTIO
NA
L EQ
UIT
IES R
ESEA
RC
H
50
Ind
ia D
aily
Su
mm
ary
- July
25, 2
01
8
Kotak Institutional Equities: Valuation summary of KIE Universe stocks
Source: Company, Bloomberg, Kotak Institutional Equities estimates
Target O/S ADVT
Price (Rs) price Upside shares 3mo
Company Rating 24-Jul-18 (Rs) (%) (Rs bn) (US$ bn) (mn) 2018 2019E 2020E 2018 2019E 2020E 2018 2019E 2020E 2018 2019E 2020E 2018 2019E 2020E 2018 2019E 2020E 2018 2019E 2020E (US$ mn)
Metals & Mining
Coal India ADD 266 326 22.5 1,652 24.0 6,207 11 27 28 (24.2) 138.2 3.0 23.5 9.9 9.6 17.4 6.3 5.9 6.8 6.3 6.5 26.7 66.1 66.4 6.2 7.5 9.4 13.7
Hindalco Industries BUY 208 315 51.7 466 6.8 2,229 22 27 31 155.4 23.9 13.6 9.5 7.7 6.7 6.2 5.2 4.5 0.8 0.8 0.7 9.7 10.5 10.7 0.6 0.6 0.6 34.5
Hindustan Zinc ADD 273 290 6.2 1,154 16.7 4,225 22 22 26 9.3 3.7 14.7 12.7 12.3 10.7 7.7 7.0 5.7 3.2 2.8 2.4 27.2 24.4 24.2 2.9 2.9 2.9 8.5
Jindal Steel and Power REDUCE 196 255 30.2 190 2.8 968 (8) 8 18 59.3 194.2 129.1 (23.1) 24.5 10.7 9.4 6.7 5.8 0.6 0.6 0.6 (2.7) 2.6 5.7 — — — 28.8
JSW Steel ADD 318 345 8.4 769 11.2 2,417 27 27 25 83.9 (0.7) (5.7) 11.9 12.0 12.7 7.8 7.2 7.7 2.7 2.2 2.0 24.8 20.4 16.5 1.0 1.0 1.0 19.1
National Aluminium Co. ADD 61 85 39.2 118 1.7 1,933 4 7 7 12.7 63.0 11.1 14.8 9.1 8.2 6.0 4.0 3.6 1.1 1.1 1.1 7.7 12.4 13.6 9.3 9.0 9.0 10.1
NMDC REDUCE 97 125 28.3 308 4.5 3,164 12 10 10 43.3 (16.5) 3.6 8.3 9.9 9.6 4.5 6.0 5.8 1.3 1.2 1.2 15.8 12.5 12.4 5.6 5.6 5.6 3.6
Tata Steel ADD 527 700 32.9 601 8.7 1,205 67 69 82 62.6 3.1 18.4 7.8 8 6.4 6.0 6.0 6.1 1.1 0.9 0.9 17.2 13.1 13.9 1.8 1.9 1.9 69.2
Vedanta BUY 216 415 91.9 804 11.7 3,717 22 37 43 9.6 71.9 16.9 10.0 5.8 5.0 5.5 4.1 3.4 1.3 1.1 1.0 12.9 20.6 21.4 3.7 5.1 6.0 53.2
Metals & Mining Attractive 6,062 88 32.3 39.6 11.4 12.8 9.2 8.2 7.3 5.7 5.3 1.8 1.6 1.5 14.3 17.8 18.2 3.6 4.1 4.7 240.7
Pharmaceutical
Apollo Hospitals ADD 939 1,090 16.0 131 1.9 139 8 19 26 (46.9) 124.3 38.0 111.3 49.6 35.9 20.4 17.4 14.7 4.0 3.8 3.5 3.4 7.9 10.2 0.2 0.5 0.7 7.2
Aurobindo Pharma ADD 594 640 7.7 348 5.1 584 42 45 49 6.0 8.0 9.4 14.2 13.2 12.0 10.0 9.2 8.2 3.0 2.5 2.1 23.2 20.5 17.4 0.7 0.9 1.0 20.8
Biocon SELL 574 300 (47.8) 345 5.0 601 6 8 15 (39.2) 27.1 84.9 92.7 72.9 39.5 41.6 30.6 20.1 6.1 5.7 5.2 6.9 8.1 13.7 0.4 0.5 0.9 22.5
Cipla BUY 627 650 3.6 505 7.3 805 18 26 34 40.2 48.7 30.8 35.8 24.1 18.4 18.6 13.6 10.8 3.5 3.1 2.8 10.2 13.6 15.9 0.6 0.9 1.1 23.6
Dr Lal Pathlabs REDUCE 924 865 (6.4) 77 1.1 83 20 25 29 7.0 20.8 18.5 45.2 37.4 31.6 27.4 23.0 19.3 9.8 8.1 6.8 23.5 23.7 23.4 0.5 0.5 0.6 1.5
Dr Reddy's Laboratories REDUCE 2,078 2,150 3.5 345 5.0 166 59 89 119 (18.5) 51.4 32.9 35.2 23.2 17.5 16.4 11.1 8.3 2.7 2.5 2.2 7.8 11.2 12.7 1.0 0.7 0.9 33.8
HCG REDUCE 282 305 8.2 25 0.4 85 2 3 5 (40.0) 120.9 57.3 180.3 81.6 51.9 23.8 18.5 15.7 4.7 4.4 4.1 2.8 5.5 8.1 — — — 0.2
Laurus Labs ADD 451 540 19.6 48 0.7 106 16 22 34 (11.9) 37.3 54.4 28.5 20.7 13.4 13.9 11.4 8.3 3.2 2.8 2.3 11.9 14.4 18.8 — — — 0.7
Lupin REDUCE 821 800 (2.6) 371 5.4 450 38 35 45 (32.9) (7.7) 28.6 21.5 23.3 18.1 13.3 11.8 9.7 2.7 2.5 2.2 12.6 11.1 12.9 0.6 0.6 0.8 34.0
Narayana Hrudayalaya ADD 251 275 9.4 51 0.7 204 3 4 7 (38.1) 52.2 76.9 100.0 65.7 37.1 27.5 20.8 15.2 5.0 4.6 4.1 5.1 7.3 11.7 — — — 0.4
Sun Pharmaceuticals REDUCE 563 500 (11.1) 1,350 19.6 2,406 15 17 24 (47.5) 12.0 42.0 37.1 33.1 23.3 21.9 17.9 13.2 3.6 3.2 2.9 9.8 10.2 13.1 0.4 0.6 0.9 52.6
Torrent Pharmaceuticals NR 1,465 — — 248 3.6 169 40 46 61 (27.4) 15.1 32.9 36.6 31.8 23.9 20.4 14.6 12.2 5.4 4.7 4.1 15.1 14.9 17.2 1.1 0.7 1.0 5.2
Pharmaceuticals Neutral 3,844 56 (27.6) 18.6 32.6 32.7 27.5 20.8 18.1 14.6 11.5 3.6 3.2 2.8 10.9 11.6 13.7 0.5 0.6 0.9 202.5
Real Estate
Brigade Enterprises BUY 185 340 83.9 25 0.4 136 11 9 9 (17.7) (15.1) (1.6) 16.7 19.7 20.0 10.6 10.8 10.7 1.1 1.1 1.0 7.6 5.5 5.2 1.4 1.4 1.4 0.4
DLF RS 189 — — 337 4.9 1,784 19.6 6.5 3.9 403.9 (66.9) (39.6) 9.6 29.1 48.3 28.7 12.5 12.3 1.0 0.9 0.9 11.7 3.2 1.9 1.1 1.1 1.1 16.6
Godrej Properties SELL 686 400 (41.7) 157 2.3 216 11.6 16.8 19.2 21.9 43.9 14.9 58.9 40.9 35.6 148.1 105.3 74.9 6.6 5.7 4.9 11.8 14.9 14.7 — — — 2.8
Oberoi Realty BUY 476 560 17.6 173 2.5 340 13 62 44 14.0 385.4 (28.1) 37.4 7.7 10.7 28.0 10.7 13.4 2.7 1.8 1.5 7.3 27.4 15.2 0.4 0.4 0.4 3.4
Prestige Estates Projects ADD 263 315 19.8 99 1.4 375 13 10 10 24.3 (24.2) 8.4 21.0 27.7 25.5 14.6 15.2 15.3 2.1 2.0 1.8 10.3 7.3 7.5 0.6 0.6 0.6 1.1
Sobha REDUCE 476 510 7.1 45 0.7 95 22 20 23 30.9 (7.5) 14.8 21.8 23.6 20.5 13.1 13.4 12.6 1.6 1.6 1.5 7.6 6.8 7.4 1.5 1.5 1.5 1.6
Sunteck Realty REDUCE 400 330 (17.6) 59 0.8 140 15 18 20 4.8 20.2 6.9 26.2 21.8 20.4 16.9 18.5 17.1 2.1 2.0 1.8 9.7 9.4 9.2 0.3 0.2 0.2 1.7
Real Estate Neutral 895 13 140.1 (12.6) (20.2) 17.1 19.6 24.6 23.9 14.6 14.9 1.6 1.5 1.4 9.3 7.5 5.7 0.7 0.7 0.7 27.6
Dividend yield (%)Mkt cap. EPS (Rs) EPS growth (%) P/E (X) EV/EBITDA (X) P/B (X) RoE (%)

KOTAK INSTITUTIONAL EQUITIES RESEARCH 51
In
dia
Da
ily S
um
ma
ry - Ju
ly 2
5, 2
01
8
51
K
OTA
K IN
STIT
UTIO
NA
L EQ
UIT
IES R
ESEA
RC
H
Kotak Institutional Equities: Valuation summary of KIE Universe stocks
Source: Company, Bloomberg, Kotak Institutional Equities estimates
Target O/S ADVT
Price (Rs) price Upside shares 3mo
Company Rating 24-Jul-18 (Rs) (%) (Rs bn) (US$ bn) (mn) 2018 2019E 2020E 2018 2019E 2020E 2018 2019E 2020E 2018 2019E 2020E 2018 2019E 2020E 2018 2019E 2020E 2018 2019E 2020E (US$ mn)
Technology
HCL Technologies REDUCE 992 1,010 1.9 1,381 20.0 1,409 62 68 71 5.3 9.0 5.0 15.9 14.6 13.9 11.2 9.4 8.7 3.8 3.2 2.9 24.8 23.8 21.9 0.8 2.9 3.1 35.1
Hexaware Technologies SELL 496 435 (12.3) 147 2.1 302 17 20 23 20.2 18.4 18.0 30.0 25.3 21.5 21.6 19.0 15.0 7.5 6.5 5.5 26.6 27.4 27.8 0.8 1.6 1.6 14.5
Infosys ADD 1,377 1,400 1.7 3,008 43.6 2,175 65 71 78 3.0 9.7 10.4 21.3 19.4 17.6 14.8 13.3 11.9 4.6 4.3 4.0 21.8 23.0 23.5 2.0 3.2 2.8 80.4
L&T Infotech ADD 1,803 2,000 10.9 312 4.5 175 64 83 94 13.9 30.5 13.0 28.4 21.7 19.2 25.0 16.7 14.0 8.2 6.6 5.4 31.8 33.5 30.7 0.9 1.3 1.4 4.7
Mindtree ADD 970 1,115 14.9 159 2.3 165 35 43 53 37.8 24.9 23.6 28.1 22.5 18.2 20.4 14.1 11.3 5.8 5.0 4.3 21.4 23.9 25.2 1.1 1.3 1.6 31.2
Mphasis SELL 1,171 760 (35.1) 226 3.3 193 44 52 56 14.4 18.3 8.2 26.7 22.6 20.9 19.4 15.7 14.0 4.1 3.8 3.4 14.6 17.4 17.1 1.7 1.7 1.7 11.4
TCS REDUCE 1,999 1,790 (10.5) 7,653 111.0 3,829 67 82 89 1.1 21.2 8.8 29.6 24.4 22.5 22.1 17.9 16.5 8.8 7.7 7.5 29.4 33.4 33.8 1.2 2.0 3.6 114.8
Tech Mahindra ADD 642 775 20.8 566 8.2 891 43 45 53 33.1 6.6 15.8 15.0 14.1 12.2 11.0 8.5 6.9 3.0 2.6 2.2 21.5 19.9 19.7 2.2 1.4 1.6 35.7
Wipro REDUCE 273 295 8.1 1,235 17.9 4,507 17 19 22 (3.1) 11.8 14.6 16.1 14.4 12.6 10.2 9.0 7.8 2.5 2.2 2.0 16.0 16.4 16.8 0.4 0.5 3.7 13.5
Technology Cautious 14,688 213 1.6 12.7 9.7 22.9 20.4 18.6 16.7 14.0 12.6 5.4 4.8 4.5 23.7 23.7 24.1 1.3 2.2 3.2 341.2
Telecom
Bharti Airtel ADD 357 470 31.7 1,426 20.7 3,997 5 (4) 0 (42.9) (187.4) 104.6 75.4 (86.2) 1,888.4 8.0 9.1 7.3 2.1 2.1 2.2 2.8 (2.4) 0.1 1.5 0.3 0.0 33.4
Bharti Infratel REDUCE 286 285 (0.3) 529 7.7 1,850 14 13 11 (7.4) (8.7) (9.0) 20.8 22.8 25.0 7.5 8.2 8.7 3.1 3.3 3.3 15.7 14.0 13.1 5.0 3.5 3.2 13.5
IDEA REDUCE 56 75 33.0 246 3.6 4,359 (10) (15) (14) (656.8) (54.9) 6.4 (5.9) (3.8) (4.1) 12.4 22.8 16.9 0.9 1.2 1.7 (16.0) (26.9) (34.0) — — — 15.8
Tata Communications ADD 588 725 23.4 167 2.4 285 2 4 8 (84.3) 121.9 117.7 357 160.9 73.9 10.7 9.6 8.4 33.5 27.1 19.6 4.5 18.6 30.7 1.1 1.1 1.3 4.7
Telecom Cautious 2,368 34 (94.7) (1,906.6) 36.2 753.0 (41.7) (65.3) 8.7 10.2 8.5 2.1 2.3 2.4 0.3 (5.5) (3.7) 2.0 1.0 0.7 67.4
Utilities
CESC ADD 922 1,180 27.9 122 1.8 133 87 102 118 67.1 16.8 15.5 10.6 9.1 7.8 7.7 5.6 4.9 0.8 0.8 0.7 7.9 8.8 9.4 1.3 1.1 1.1 5.8
JSW Energy REDUCE 65 80 23.6 106 1.5 1,640 3.1 5.9 8.2 (19.2) 92.2 38.7 21.1 11.0 7.9 6.8 5.4 4.4 1.0 0.9 0.8 4.7 8.5 11.0 3.1 3.1 3.1 1.7
NHPC ADD 24 30 24.2 248 3.6 10,260 2.4 3.1 3.2 (17.3) 26.9 1.8 9.9 7.8 7.7 9.2 7.2 7.0 0.8 0.8 0.8 8.5 10.4 10.2 5.8 7.2 7.3 2.1
NTPC BUY 157 190 20.7 1,298 18.8 8,245 11 15 16 (7.6) 30.9 4.4 13.8 10.6 10.1 11.1 8.6 8.0 1.3 1.2 1.1 9.5 11.6 11.3 3.6 2.8 3.0 13.3
Power Grid BUY 178 250 40.6 930 13.5 5,232 16 19 21 9.6 19.3 13.6 11.3 9.5 8.3 8.3 7.0 6.5 1.7 1.5 1.4 15.8 17.1 17.5 3.0 3.5 4.0 29.8
Reliance Power SELL 32 43 34.4 90 1.3 2,805 3.5 5.1 5.2 (16.4) 45.6 2.7 9.2 6.3 6.1 7.8 6.7 6.5 0.4 0.4 0.4 4.5 6.1 5.9 — — — 4.1
Tata Power ADD 68 97 43.1 183 2.7 2,705 5.3 7.8 8.7 (9.6) 46.1 11.2 12.7 8.7 7.8 10.1 9.3 8.4 1.2 1.1 0.9 10.7 12.9 12.7 — — — 5.3
Utilities Attractive 2,978 43 (2.4) 28.6 9.0 12.3 9.6 8.8 9.3 7.6 7.0 1.2 1.1 1.0 9.7 11.5 11.6 3.1 3.1 3.3 62.0
P/B (X) RoE (%) Dividend yield (%)Mkt cap. EPS (Rs) EPS growth (%) P/E (X) EV/EBITDA (X)
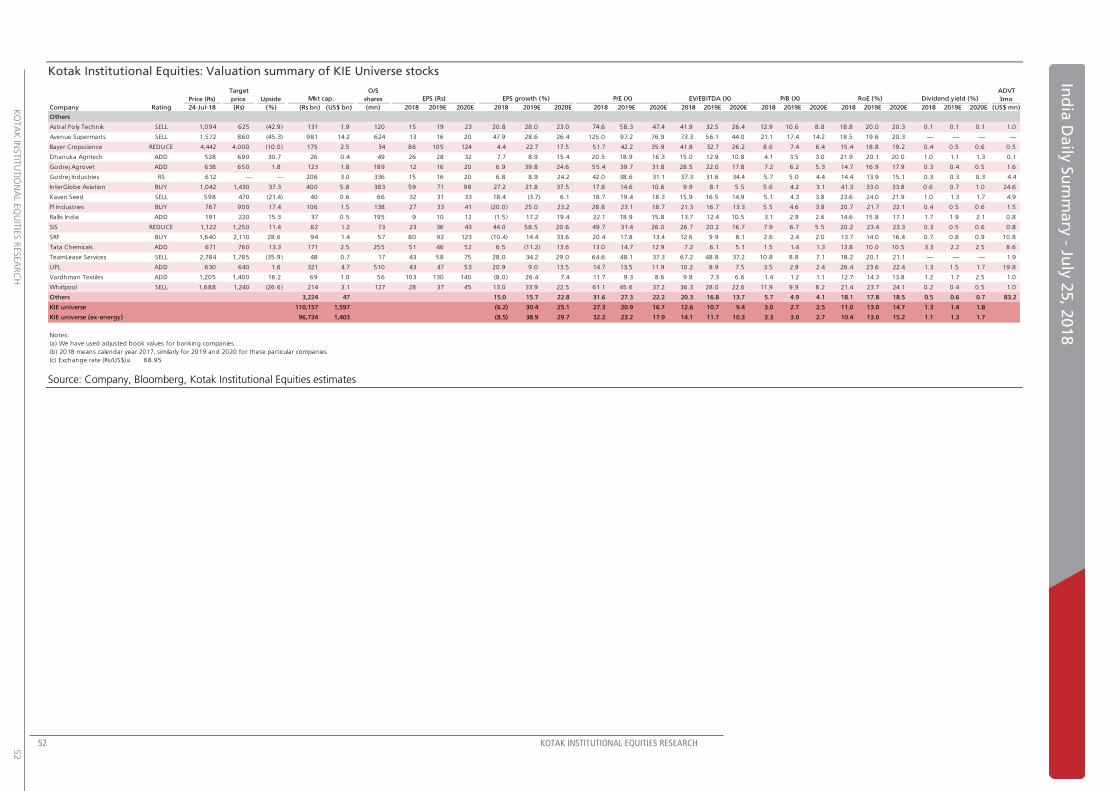
52 KOTAK INSTITUTIONAL EQUITIES RESEARCH
K
OTA
K IN
STIT
UTIO
NA
L EQ
UIT
IES R
ESEA
RC
H
52
Ind
ia D
aily
Su
mm
ary
- July
25, 2
01
8
Kotak Institutional Equities: Valuation summary of KIE Universe stocks
Source: Company, Bloomberg, Kotak Institutional Equities estimates
Target O/S ADVT
Price (Rs) price Upside shares 3mo
Company Rating 24-Jul-18 (Rs) (%) (Rs bn) (US$ bn) (mn) 2018 2019E 2020E 2018 2019E 2020E 2018 2019E 2020E 2018 2019E 2020E 2018 2019E 2020E 2018 2019E 2020E 2018 2019E 2020E (US$ mn)
Others
Astral Poly Technik SELL 1,094 625 (42.9) 131 1.9 120 15 19 23 20.8 28.0 23.0 74.6 58.3 47.4 41.9 32.5 26.4 12.9 10.6 8.8 18.8 20.0 20.3 0.1 0.1 0.1 1.0
Avenue Supermarts SELL 1,572 860 (45.3) 981 14.2 624 13 16 20 47.9 28.6 26.4 125.0 97.2 76.9 73.3 56.1 44.0 21.1 17.4 14.2 18.5 19.6 20.3 — — — —
Bayer Cropscience REDUCE 4,442 4,000 (10.0) 175 2.5 34 86 105 124 4.4 22.7 17.5 51.7 42.2 35.9 41.8 32.7 26.2 8.6 7.4 6.4 15.4 18.8 19.2 0.4 0.5 0.6 0.5
Dhanuka Agritech ADD 528 690 30.7 26 0.4 49 26 28 32 7.7 8.9 15.4 20.5 18.9 16.3 15.0 12.9 10.8 4.1 3.5 3.0 21.9 20.1 20.0 1.0 1.1 1.3 0.1
Godrej Agrovet ADD 638 650 1.8 123 1.8 189 12 16 20 6.9 39.8 24.6 55.4 39.7 31.8 28.5 22.0 17.8 7.2 6.2 5.3 14.7 16.9 17.9 0.3 0.4 0.5 1.6
Godrej Industries RS 612 — — 206 3.0 336 15 16 20 6.8 8.9 24.2 42.0 38.6 31.1 37.3 31.6 34.4 5.7 5.0 4.4 14.4 13.9 15.1 0.3 0.3 0.3 4.4
InterGlobe Aviation BUY 1,042 1,430 37.3 400 5.8 383 59 71 98 27.2 21.8 37.5 17.8 14.6 10.6 9.9 8.1 5.5 5.6 4.2 3.1 41.3 33.0 33.8 0.6 0.7 1.0 24.6
Kaveri Seed SELL 598 470 (21.4) 40 0.6 66 32 31 33 18.4 (3.7) 6.1 18.7 19.4 18.3 15.9 16.5 14.9 5.1 4.3 3.8 23.6 24.0 21.9 1.0 1.3 1.7 4.9
PI Industries BUY 767 900 17.4 106 1.5 138 27 33 41 (20.0) 25.0 23.2 28.8 23.1 18.7 21.3 16.7 13.3 5.5 4.6 3.8 20.7 21.7 22.1 0.4 0.5 0.6 1.5
Rallis India ADD 191 220 15.3 37 0.5 195 9 10 12 (1.5) 17.2 19.4 22.1 18.9 15.8 13.7 12.4 10.5 3.1 2.9 2.6 14.6 15.8 17.1 1.7 1.9 2.1 0.8
SIS REDUCE 1,122 1,250 11.4 82 1.2 73 23 36 43 44.0 58.5 20.6 49.7 31.4 26.0 26.7 20.2 16.7 7.9 6.7 5.5 20.2 23.4 23.3 0.3 0.5 0.6 0.8
SRF BUY 1,640 2,110 28.6 94 1.4 57 80 92 123 (10.4) 14.4 33.6 20.4 17.8 13.4 12.6 9.9 8.1 2.6 2.4 2.0 13.7 14.0 16.4 0.7 0.8 0.9 10.8
Tata Chemicals ADD 671 760 13.3 171 2.5 255 51 46 52 6.5 (11.2) 13.6 13.0 14.7 12.9 7.2 6.1 5.1 1.5 1.4 1.3 13.8 10.0 10.5 3.3 2.2 2.5 8.6
TeamLease Services SELL 2,784 1,785 (35.9) 48 0.7 17 43 58 75 28.0 34.2 29.0 64.6 48.1 37.3 67.2 48.8 37.2 10.8 8.8 7.1 18.2 20.1 21.1 — — — 1.9
UPL ADD 630 640 1.6 321 4.7 510 43 47 53 20.9 9.0 13.5 14.7 13.5 11.9 10.2 8.9 7.5 3.5 2.9 2.4 26.4 23.6 22.4 1.3 1.5 1.7 19.8
Vardhman Textiles ADD 1,205 1,400 16.2 69 1.0 56 103 130 140 (8.0) 26.4 7.4 11.7 9.3 8.6 9.8 7.3 6.6 1.4 1.2 1.1 12.7 14.3 13.8 1.2 1.7 2.5 1.0
Whirlpool SELL 1,688 1,240 (26.6) 214 3.1 127 28 37 45 13.0 33.9 22.5 61.1 45.6 37.2 36.3 28.0 22.6 11.9 9.9 8.2 21.4 23.7 24.1 0.2 0.4 0.5 1.0
Others 3,224 47 15.0 15.7 22.8 31.6 27.3 22.2 20.3 16.8 13.7 5.7 4.9 4.1 18.1 17.8 18.5 0.5 0.6 0.7 83.2
KIE universe 110,157 1,597 (6.2) 30.4 25.1 27.3 20.9 16.7 12.6 10.7 9.4 3.0 2.7 2.5 11.0 13.0 14.7 1.3 1.4 1.8
KIE universe (ex-energy) 96,734 1,403 (8.5) 38.9 29.7 32.2 23.2 17.9 14.1 11.7 10.3 3.3 3.0 2.7 10.4 13.0 15.2 1.1 1.3 1.7
Notes:
(a) We have used adjusted book values for banking companies.
(b) 2018 means calendar year 2017, similarly for 2019 and 2020 for these particular companies.
(c) Exchange rate (Rs/US$)= 68.95
Mkt cap. EPS (Rs) EPS growth (%) P/E (X) EV/EBITDA (X) P/B (X) RoE (%) Dividend yield (%)

Disclo
sure
s
53 KOTAK INSTITUTIONAL EQUITIES RESEARCH
Disclosures
Ratings and other definitions/identifiers
Definitions of ratings
BUY. We expect this stock to deliver more than 15% returns over the next 12 months.
ADD. We expect this stock to deliver 5-15% returns over the next 12 months.
REDUCE. We expect this stock to deliver -5-+5% returns over the next 12 months.
SELL. We expect this stock to deliver <-5% returns over the next 12 months.
Our target prices are also on a 12-month horizon basis.
Other definitions
Coverage view. The coverage view represents each analyst’s overall fundamental outlook on the Sector. The coverage view will consist of one of the following
designations: Attractive, Neutral, Cautious.
Other ratings/identifiers
NR = Not Rated. The investment rating and target price, if any, have been suspended temporarily. Such suspension is in compliance with applicable regulation(s)
and/or Kotak Securities policies in circumstances when Kotak Securities or its affiliates is acting in an advisory capacity in a merger or strategic transaction
involving this company and in certain other circumstances.
CS = Coverage Suspended. Kotak Securities has suspended coverage of this company.
NC = Not Covered. Kotak Securities does not cover this company.
RS = Rating Suspended. Kotak Securities Research has suspended the investment rating and price target, if any, for this stock, because there is not a sufficient
fundamental basis for determining an investment rating or target. The previous investment rating and price target, if any, are no longer in effect for this stock
and should not be relied upon.
NA = Not Available or Not Applicable. The information is not available for display or is not applicable.
NM = Not Meaningful. The information is not meaningful and is therefore excluded.
Kotak Institutional Equities Research coverage universe
Distribution of ratings/investment banking relationships
Source: Kotak Institutional Equities As of June 30, 2018
Percentage of companies covered by Kotak Institutional
Equities, within the specified category.
* The above categories are defined as follows: Buy = We
expect this stock to deliver more than 15% returns over
the next 12 months; Add = We expect this stock to
deliver 5-15% returns over the next 12 months; Reduce
= We expect this stock to deliver -5-+5% returns over
the next 12 months; Sell = We expect this stock to deliver
less than -5% returns over the next 12 months. Our
target prices are also on a 12-month horizon basis.
These ratings are used illustratively to comply with
applicable regulations. As of 31/03/2018 Kotak
Institutional Equities Investment Research had
investment ratings on 207 equity securities.
Percentage of companies within each category for
which Kotak Institutional Equities and or its affiliates has
provided investment banking services within the
previous 12 months.
21.4%
31.3%
25.4%21.9%
2.0%5.0% 4.5%
0.5%
0%
10%
20%
30%
40%
50%
60%
70%
BUY ADD REDUCE SELL

Corporate Office Overseas Affiliates
Kotak Securities Ltd.
27 BKC, Plot No. C-27, “G Block”
Bandra Kurla Complex, Bandra (E)
Mumbai 400 051, India
Tel: +91-22-43360000
Kotak Mahindra (UK) Ltd
8th Floor, Portsoken House
155-157 Minories
London EC3N 1LS
Tel: +44-20-7977-6900
Kotak Mahindra Inc
369 Lexington Avenue
28th Floor, New York
NY 10017, USA
Tel:+1 212 600 8856
Copyright 2018 Kotak Institutional Equities (Kotak Securities Limited). All rights reserved.
1. Note that the research analysts contributing to this report may not be registered/qualified as research analysts with FINRA; and
2. Such research analysts may not be associated persons of Kotak Mahindra Inc and therefore, may not be subject to NASD Rule 2711 restrictions on communications with a subject company, public appearances and trading securities held by a research analyst account.
3. Any U.S. recipients of the research who wish to effect transactions in any security covered by the report should do so with or through Kotak Mahindra Inc and (ii) any transactions in the securities covered by the research by U.S. recipients must be effected only through Kotak Mahindra Inc at [email protected].
This report is distributed in Singapore by Kotak Mahindra (UK) Limited (Singapore Branch) to institutional investors, accredited investors or expert investors only as defined under the Securities and Futures Act. Recipients of this analysis / report are to contact Kotak Mahindra (UK) Limited (Singapore Branch) (16 Raffles Quay, #35-02/03, Hong Leong Building, Singapore 048581) in respect of any matters arising from, or in connection with, this analysis / report. Kotak Mahindra (UK) Limited (Singapore Branch) is regulated by the Monetary Authority of Singapore. Kotak Securities Limited and its affiliates are a full-service, integrated investment banking, investment management, brokerage and financing group. We along with our affiliates are leading underwriter of securities and participants in virtually all securities trading markets in India. We and our affiliates have investment banking and other business relationships with a significant percentage of the companies covered by our Investment Research Department. Our research professionals provide important input into our investment banking and other business selection processes. Investors should assume that Kotak Securities Limited and/or its affiliates are seeking or will seek investment banking or other business from the company or companies that are the subject of this material and that the research professionals who were involved in preparing this material may participate in the solicitation of such business. Our research professionals are paid in part based on the profitability of Kotak Securities Limited, which include earnings from investment banking and other business. Kotak Securities Limited generally prohibits its analysts, persons reporting to analysts, and members of their households from maintaining a financial interest in the securities or derivatives of any companies that the analysts cover. Additionally, Kotak Securities Limited generally prohibits its analysts and persons reporting to analysts from serving as an officer, director, or advisory board member of any companies that the analysts cover. Our salespeople, traders, and other professionals may provide oral or written market commentary or trading strategies to our clients that reflect opinions that are contrary to the opinions expressed herein, and our proprietary trading and investing businesses may make investment decisions that are inconsistent with the recommendations expressed herein. Kotak Securities Limited has two independent equity research groups: Institutional Equities and Private Client Group. This report has been prepared by the Institutional Equities Research Group of Kotak Securities Limited. The views and opinions expressed in this document may or may not match or may be contrary with the views, estimates, rating, target price of the Private Client Group. In reviewing these materials, you should be aware that any or all of the foregoing, among other things, may give rise to real or potential conflicts of interest. Additionally, other important information regarding our relationships with the company or companies that are the subject of this material is provided herein. This material should not be construed as an offer to sell or the solicitation of an offer to buy any security in any jurisdiction where such an offer or solicitation would be illegal. We are not soliciting any action based on this material. It is for the general information of clients of Kotak Securities Limited. It does not constitute a personal recommendation or take into account the particular investment objectives, financial situations, or needs of individual clients. Before acting on any advice or recommendation in this material, clients should consider whether it is suitable for their particular circumstances and, if necessary, seek professional advice. The price and value of the investments referred to in this material and the income from them may go down as well as up, and investors may realize losses on any investments. Past performance is not a guide for future performance, future returns are not guaranteed and a loss of original capital may occur. Kotak Securities Limited does not provide tax advise to its clients, and all investors are strongly advised to consult with their tax advisers regarding any potential investment. Certain transactions -including those involving futures, options, and other derivatives as well as non-investment-grade securities - give rise to substantial risk and are not suitable for all investors. The material is based on information that we consider reliable, but we do not represent that it is accurate or complete, and it should not be relied on as such. Opinions expressed are our current opinions as of the date appearing on this material only. We endeavor to update on a reasonable basis the information discussed in this material, but regulatory, compliance, or other reasons may prevent us from doing so. We and our affiliates, officers, directors, and employees, including persons involved in the preparation or issuance of this material, may from time to time have "long" or "short" positions in, act as principal in, and buy or sell the securities or derivatives thereof of companies mentioned herein. Kotak Securities Limited and its non US affiliates may, to the extent permissible under applicable laws, have acted on or used this research to the extent that it relates to non US issuers, prior to or immediately following its publication. Foreign currency denominated securities are subject to fluctuations in exchange rates that could have an adverse effect on the value or price of or income derived from the investment. In addition, investors in securities such as ADRs, the value of which are influenced by foreign currencies affectively assume currency risk. In addition options involve risks and are not suitable for all investors. Please ensure that you have read and understood the current derivatives risk disclosure document before entering into any derivative transactions. Kotak Securities Limited established in 1994, is a subsidiary of Kotak Mahindra Bank Limited. Kotak Securities is one of India's largest brokerage and distribution house. Kotak Securities Limited is a corporate trading and clearing member of BSE Limited (BSE), National Stock Exchange of India Limited (NSE), MSEI a. Our businesses include stock broking, services rendered in connection with distribution of primary market issues and financial products like mutual funds and fixed deposits, depository services and Portfolio Management. Kotak Securities Limited is also a depository participant with National Securities Depository Limited (NSDL) and Central Depository Services (India) Limited (CDSL). Kotak Securities Limited is also registered with Insurance Regulatory and Development Authority as Corporate Agent for Kotak Mahindra Old Mutual Life Insurance Limited and is also a Mutual Fund Advisor registered with Association of Mutual Funds in India (AMFI). Kotak Securities Limited is registered as a Research Analyst under SEBI (Research Analyst) Regulations, 2014. We hereby declare that our activities were neither suspended nor we have defaulted with any stock exchange authority with whom we are registered in last five years. However SEBI, Exchanges and Depositories have conducted the routine inspection and based on their observations have issued advise letters or levied minor penalty on KSL for certain operational deviations. We have not been debarred from doing business by any Stock Exchange / SEBI or any other authorities; nor has our certificate of registration been cancelled by SEBI at any point of time. We offer our research services to primarily institutional investors and their employees, directors, fund managers, advisors who are registered with us Details of Associates are available on our website i.e. www.kotak.com Research Analyst has served as an officer, director or employee of subject company(ies): No We or our associates may have received compensation from the subject company(ies) in the past 12 months. We or our associates have managed or co-managed public offering of securities for the subject company(ies) in the past 12 months. YES We or our associates may have received compensation for investment banking or merchant banking or brokerage services from the subject company(ies) in the past 12 months. We or our associates may have received any compensation for products or services other than investment banking or merchant banking or brokerage services from the subject company(ies) in the past 12 months. We or our associates may have received compensation or other benefits from the subject company(ies) or third party in connection with the research report. Our associates may have financial interest in the subject company(ies). Research Analyst or his/her relative's financial interest in the subject company(ies): No Kotak Securities Limited has financial interest in the subject company(ies) at the end of the month immediately preceding the date of publication of Research Report: YES Our associates may have actual/beneficial ownership of 1% or more securities of the subject company(ies) at the end of the month immediately preceding the date of publication of Research Report. Research Analyst or his/her relatives has actual/beneficial ownership of 1% or more securities of the subject company(ies) at the end of the month immediately preceding the date of publication of Research Report: No Kotak Securities Limited has actual/beneficial ownership of 1% or more securities of the subject company(ies) at the end of the month immediately preceding the date of publication of Research Report: No Subject company(ies) may have been client during twelve months preceding the date of distribution of the research report. A graph of daily closing prices of securities is available at www.nseindia.com and http://economictimes.indiatimes.com/markets/stocks/stock-quotes. (Choose a company from the list on the browser and select the"three years" icon in the price chart). Kotak Securities Limited. Registered Office: 27 BKC, C 27, G Block, Bandra Kurla Complex, Bandra (E), Mumbai 400051. CIN: U99999MH1994PLC134051, Telephone No.: +22 43360000, Fax No.: +22 67132430. Website: www.kotak.com / www.kotaksecurities.com. Correspondence Address: Infinity IT Park, Bldg. No 21, Opp. Film City Road, A K Vaidya Marg, Malad (East), Mumbai 400097. Telephone No: 42856825. SEBI Registration No: NSE INB/INF/INE 230808130, BSE INB 010808153/INF 011133230, MSE INE 260808130/INB 260808135/INF 260808135, AMFI ARN 0164, PMS INP000000258 and Research Analyst INH000000586. NSDL/CDSL: IN-DP-NSDL-23-97. Compliance Officer Details: Mr. Manoj Agarwal. Call: 022 - 4285 8484, or Email: [email protected]. Investments in securities market are subject to market risks, read all the related documents carefully before investing. In case you require any clarification or have any concern, kindly write to us at below email ids: Level 1: For Trading related queries, contact our customer service at ‘[email protected]’ and for demat account related queries contact us at [email protected] or call us on:
Toll free numbers 18002099191 / 1800222299 and 18002099292 Level 2: If you do not receive a satisfactory response at Level 1 within 3 working days, you may write to us at [email protected] or call us on 022-42858445 and if you feel you are
still unheard, write to our customer service HOD at [email protected] or call us on 022-42858208. Level 3: If you still have not received a satisfactory response at Level 2 within 3 working days, you may contact our Compliance Officer (Name: Mr. Manoj Agarwal) at
[email protected] or call on 91- (022) 4285 8484.
Level 4: If you have not received a satisfactory response at Level 3 within 7 working days, you may also approach CEO (Mr. Kamlesh Rao) at [email protected] or call on 91-(022) 4285 8301.
First Cut notes published on this site are for information purposes only. They represent early notations and responses by analysts to recent events. Data in the notes may not have been verified by us and investors should not act upon any data or views in these notes. Most First Cut notes, but not necessarily all, will be followed by final research reports on the subject. There could be variance between the First cut note and the final research note on any subject, in which case the contents of the final research note would prevail. We accept no liability for the contents of the First Cut Notes.
For further disclosure please view https://kie.kotak.com/kinsite/index.php