india chindia chindiafrica - touteconomie · 2000/01* 2001/02* 2002/03* 2003/04* 2004/05 2005/06...
TRANSCRIPT

ChIndiAfrica - © J.J. Boillot 1
IndiaChindia
Chindiafrica
Jean-Joseph Boillot� Economist, club CEPII - EIEBG

ChIndiAfrica - © J.J. Boillot 2
I- The End of Shinning India?1- The 3 scenarios of 2006
0
2
4
6
8
10
12
2005
2006
2007
2008
2009
2010
2011
2012
2013
2014
2015
2016
2017
2018
2019
2020
2021
2022
2023
2024
2025
%
Bolly World Pahale India Atakta Bharat
3 stylized Scenarios for India 2025*
* from WEF-CII 2006
ChIndiAfrica - © J.J. Boillot 3
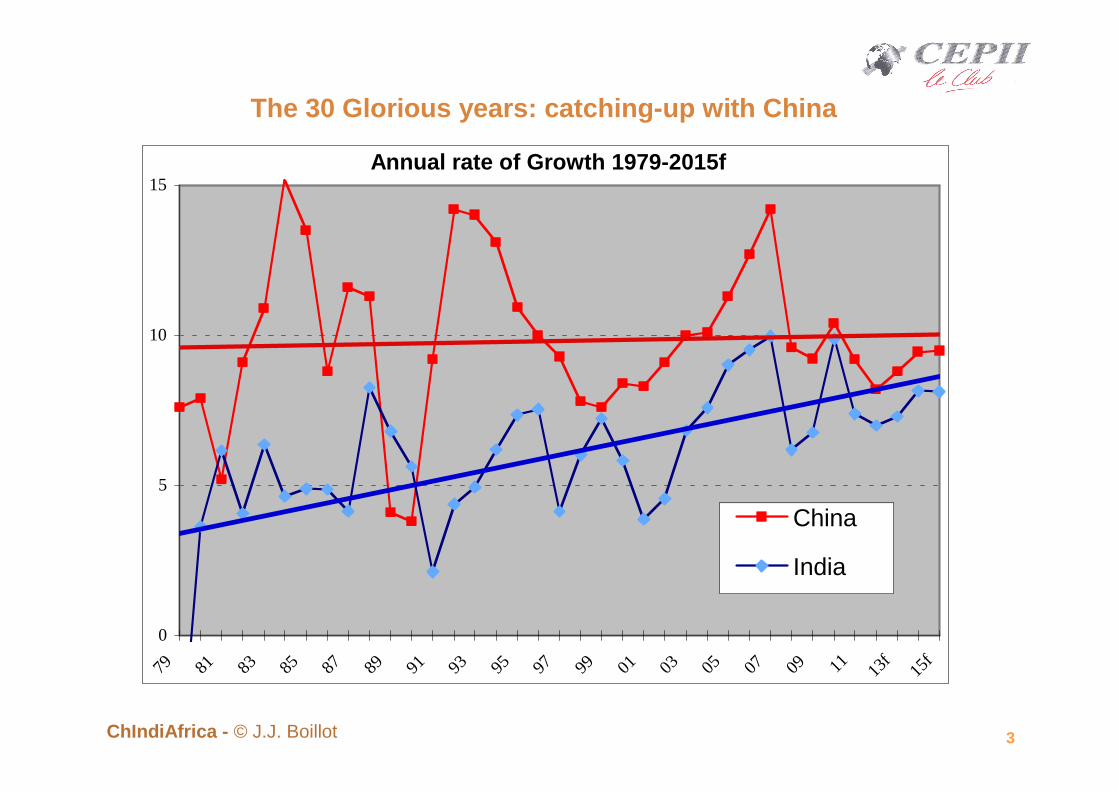
The 30 Glorious years: catching-up with China
Annual rate of Growth 1979-2015f
0
5
10
15
79 81 83 85 87 89 91 93 95 97 99 01 03 05 07 09 11 13f
15f
China
India

ChIndiAfrica - © J.J. Boillot 4
The driving forces of Growth: domestic…
0
10
20
30
40
50
60
7020
00/0
1*
2001
/02*
2002
/03*
2003
/04*
2004
/05
2005
/06
2006
/07
2007
/08
2008
/09
2009
/10
2010
/11e
2011
/12e
st
Conso priv Conso Pub Invest Saving
GDP distribution (%)

ChIndiAfrica - © J.J. Boillot 5
… and external
0
20
40
60
80
100
120
2004
/05
2005
/06
2006
/07
2007
/08
2008
/09
2009
/10
2010
/11e
2011
/12p
0,0%
1,0%
2,0%
3,0%
4,0%
5,0%
6,0%
7,0%
8,0%
9,0%
10,0%
Capital Financing bnUSD % GDP

ChIndiAfrica - © J.J. Boillot 6
2- Structural crisis or Cyclical turnaroundWorld cycle and the (de)coupling issue
GDP/PIB 1980-2011e
-5
0
5
10
15
20
80 82 84 86 88 90 92 94 96 98 00 02 04 06 08 10
taux
de
croi
ssan
ce %
USA China India

ChIndiAfrica - © J.J. Boillot 7
Agriculture: stagnation vs Income per capita Growth
Agriculture and GDP
-2,0%
0,0%
2,0%
4,0%
6,0%
8,0%
10,0%
12,0%
2005-06 2006-07 2007-08 2008-09 2009-10 2010-11e 2011-12p 2012-13p
%
GDP Agriculture

ChIndiAfrica - © J.J. Boillot 8
Mass poverty still prevalent (unicef 2012)
Malnutrition is more common in India than in Sub-Saharan Africa. One in every three malnourished children in the world lives in India.
Malnutrition limits development and the capacity to learn. It also costs lives: about 50 per cent of all childhood deaths are attributed to malnutrition.
In India, around 46 per cent of all children below the age of three are too small for their age, 47 per cent are underweight and at least 16 per cent are wasted. Many of these children are severely malnourished.
The prevalence of malnutrition varies across states, with Madhya Pradesh recording the highest rate (55 per cent) and Kerala among the lowest (27 per cent).

ChIndiAfrica - © J.J. Boillot 9
And growing Inequalities
6
1310
18
1413
25
2119
37
4853
7 7
9
0%
20%
40%
60%
80%
100%
1993-94 2004-05 2009-10
Q5 (Top)
Q4
Q3
Q2
Q1 (Bottom)

ChIndiAfrica - © J.J. Boillot 10
II- Scenario for the future: 2012-2020The Inclusive Growth Regime at stake

ChIndiAfrica - © J.J. Boillot 11
A- Rising Regionalism: political crisis & “Atakta India”1- Political factors
�Les vert-bleu
�Contre les Safran
�Et les Rouge

ChIndiAfrica - © J.J. Boillot 12
2- Regional inequalities and the political factor The demographic shift
P r o je c t io n d ˇ m o g r a p h iq u e d e s E t a t s In d ie n s * e n 2 0 5 1 e t 2 1 0 1S ta te s M illio n s % a ll In d iaS ta te s 1 9 9 1 2 0 5 1 2 1 0 1 1 9 9 1 2 0 5 1 2 1 0 1
K e r a la 2 9 ,1 3 6 2 5 ,2 3 ,5 % 2 ,2 % 1 ,4 %T a m il N a d u 5 5 ,9 7 2 5 7 6 ,6 % 4 ,4 % 3 ,1 %A n d h ra P ra d e s h 6 6 ,5 1 1 9 ,9 1 3 0 ,5 7 ,9 % 7 ,4 % 7 ,2 %
H im a c h a l P ra d e s h 5 ,2 9 ,5 1 0 ,3 0 ,6 % 0 ,6 % 0 ,6 %K a r n a ta k a 4 5 7 8 8 5 5 ,3 % 4 ,8 % 4 ,7 %
M a h ra s tra 7 8 ,9 1 4 7 ,4 1 5 9 ,6 9 ,4 % 9 ,1 % 8 ,8 %S u b to ta l 2 8 0 ,6 4 6 2 ,8 4 6 7 ,6 3 3 ,3 % 2 8 ,6 % 2 5 ,8 %
P u n ja b 2 0 ,3 3 5 ,7 3 7 ,9 2 ,4 % 2 ,2 % 2 ,1 %W e s t B e n g a l 6 8 ,1 1 2 1 ,9 1 3 2 8 ,1 % 7 ,5 % 7 ,3 %
G u ja ra t 4 1 ,3 7 3 8 0 ,2 4 ,9 % 4 ,5 % 4 ,4 %O r is s a 3 1 ,7 5 3 ,9 5 9 ,5 3 ,8 % 3 ,3 % 3 ,3 %
A s s a m 2 2 ,4 4 2 4 7 2 ,7 % 2 ,6 % 2 ,6 %S u b to ta l 1 8 3 ,8 3 2 6 ,5 3 5 6 ,6 2 1 ,8 % 2 0 ,2 % 1 9 ,7 %
H a ry a n a 1 6 ,5 4 1 ,1 4 8 ,8 2 ,0 % 2 ,5 % 2 ,7 %M a d h y a P ra d e s h 6 6 ,2 1 4 8 1 7 5 ,3 7 ,9 % 9 ,1 % 9 ,7 %
B ih a r 8 6 ,4 1 8 8 2 1 6 ,7 1 0 ,2 % 1 1 ,6 % 1 2 ,0 %R a ja s th a n 4 4 1 0 6 ,1 1 2 5 ,9 5 ,2 % 6 ,6 % 6 ,9 %
U tta r P ra d e s h 1 3 9 ,1 3 3 7 4 0 5 1 6 ,5 % 2 0 ,8 % 2 2 ,3 %S u b to ta l 3 5 2 ,2 8 2 0 ,2 9 7 1 ,7 4 1 ,8 % 5 0 ,6 % 5 3 ,6 %
A ll In d ia 8 4 3 ,3 1 6 1 9 ,5 1 8 1 2 ,2 1 0 0 ,0 % 1 0 0 ,0 % 1 0 0 ,0 %

ChIndiAfrica - © J.J. Boillot 13
One indicator of inequality : Life Expectancy
Source : National Human Development Report 2001, Pl anning Commission/ Inde Etats données+travail /2026
INDIA 60,7
1 Kerala 73,1
2 Punjab 67,4
3 Maharastra 65,2
4 Haryana 63,8
5 Tamil Nadu 63,7
6 Karnataka 62,9
7 West Bengal 62,4
8 Andhra Pradesh 62
9 Gujarat 61,4
10 Rajasthan 59,5
11 Bihar 59,4
12 Uttar Pradesh 57,2
13 Orissa 56,9
14 Assam 56,2
15 Madhya Pradesh 55,2

ChIndiAfrica - © J.J. Boillot 14
The Fertile crescent of the “Shinning India” decade…

ChIndiAfrica - © J.J. Boillot 15
… and the Political economy of Regionalism
Relation GDP per capital and Growth 2004- y = 0,2793x + 2,0859
R2 = 0,1806
100%
150%
200%
250%
300%
350%
0% 50% 100% 150% 200% 250% 300%
PIB/h India=100
ChIndiAfrica - © J.J. Boillot 16
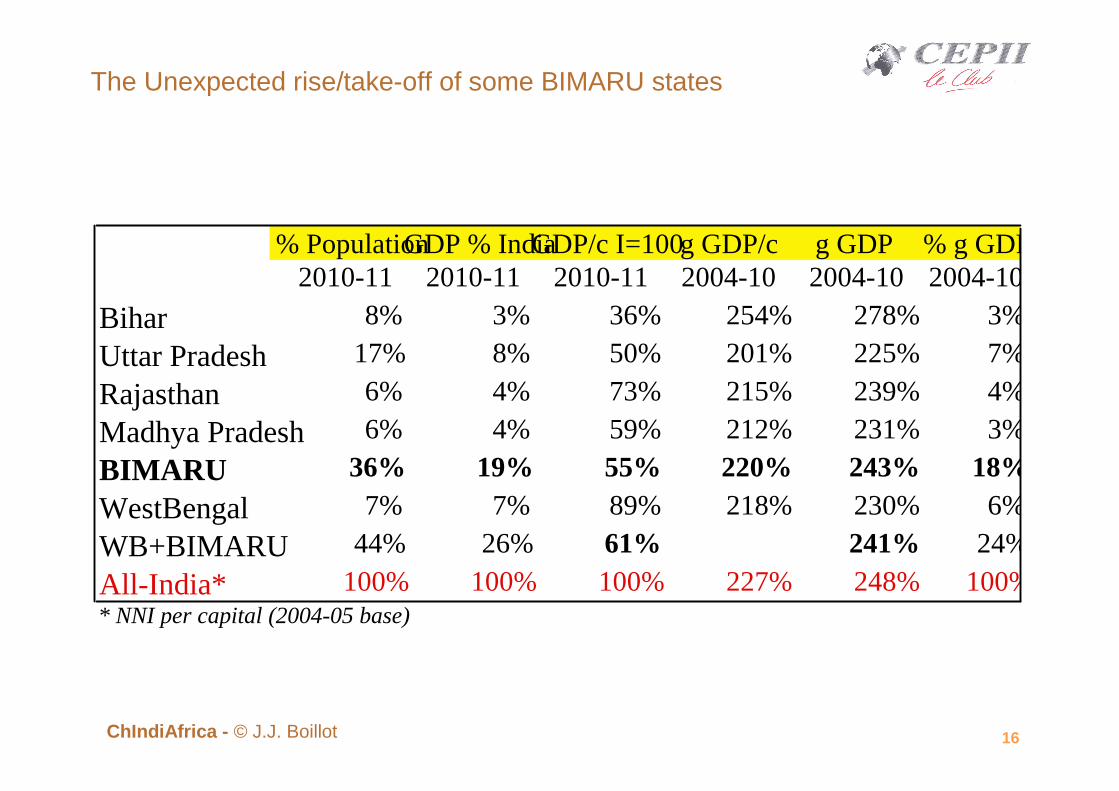
The Unexpected rise/take-off of some BIMARU states
% PopulationGDP % IndiaGDP/c I=100g GDP/c g GDP% g GDP2010-11 2010-11 2010-11 2004-10 2004-102004-10
Bihar 8% 3% 36% 254% 278% 3%
Uttar Pradesh 17% 8% 50% 201% 225% 7%
Rajasthan 6% 4% 73% 215% 239% 4%
Madhya Pradesh 6% 4% 59% 212% 231% 3%
BIMARU 36% 19% 55% 220% 243% 18%
WestBengal 7% 7% 89% 218% 230% 6%
WB+BIMARU 44% 26% 61% 241% 24%
All-India* 100% 100% 100% 227% 248% 100%* NNI per capital (2004-05 base)

ChIndiAfrica - © J.J. Boillot 17
B- The Inclusive Business Models1- The strengh of the Indian Business Culture
rang Sociˇtˇs Rˇgion d'origine
Communautˇ
1 RELIANCE INDUSTRIES (1) Gujarat Vaishnava gujarati3 TATA Gujarat (Iran) Parsi4 BHARTI TELE-VENTURES Punjab Baniya punjabi6 INFOSYS TECHNOLOGIES Tamil Nadu Brahmane Iyer/Iyengar7 WIPRO Gujarat Bora (musulman)8 AV Birla Rajasthan Baniya marwari13 RANBAXY LABORATORIES Punjab Shatriya sikh15 HCL TECHNOLOGIES Tamil Nadu Nadar16 BAJAJ Auto Rajasthan Baniya marwari24 LARSEN & TOUBRO Maharastra Brahmane marathi25 SATYAM COMPUTER SERVICES Tamil Nadu Brahmane Iyer/Iyengar27 HERO HONDA MOTORS Punjab Baniya punjabi29 United Breweries (UB) Karnataka Brahmane Chetia Naga30 CIPLA Gujarat Bora (musulman)31 SUN PHARMACEUTICAL INDS. Rajasthan Baniya marwari32 LM THAPAR Punjab Shatriya punjabi34 NICHOLAS PIRAMAL INDIA Rajasthan Baniya marwari
35 DR. REDDY'S LABORATORIES Andhra Pradesh Brahmanes
36 ASIAN PAINTS (INDIA Gujarat Choksi gujarati37 WOCKHARDT Gujarat Bora (musulman)38 Murugappa Tamil Nadu Chettiar39 ZEE TELEFILMS Rajasthan Baniya marwari40 ESSAR Rajasthan Ruia marwari42 GUJARAT AMBUJA CEMENTS Rajasthan Baniya marwari43 BIOCON Gujarat Gujarati44 jaiPrakash Maharastra Baniya mahrati45 Jindal Rajasthan Marwari46 BK BIRLA Rajasthan Baniya marwari47 Wadia Gujarat (Iran) Parsi48 Godrej Consumers products Gujarat (Iran) Parsi49 VSNL (VIDESH SANCHAR NIGAM) Gujarat (Iran) Parsi50 RP GONEKA Rajasthan Jain marwari

ChIndiAfrica - © J.J. Boillot 18
Managerial excellence, a key assetclassement des 25 meilleurs CEO 2012
1 Naveen Jindal JSPL steel & power2 A.M.Naik Larsen & Toubro3 Y.C. Deveshwar ITC4 Bhaskar Bhat TITAN5 Sunil Mittal Bharti6 R. Sridhar Shriram Capital7 Mukesh Ambani Reliance Industries8 Vijay Jindal Zee Entertainment Enterprises9 Pankaj R. Patel Cadila Healthcare10 Pangal Jayendra Nayak Axis Bank11 Subir Raha ONGC Oil & Natural Gas Corporation12 Kalyan Ganguly United Breweries President UB Group13 Madhukar B. Parekh Pidilite Industries14 Sunil Duggal Dabur India15 V.K. Rekhi United Spirits UB group16 V.S. Jain Steel Authority of India17 Prakash Kulkarni Thermax18 L.A. Dean Sesa Goa19 A.K. Puri Bharat Heavy Electricals BHEL20 Ashok Soni Voltas21 B. Muthuraman Tata Steel22 S.S. Kohli Punjab National Bank23 Anand Mahindra Mahindra & Mahindra24 R. Seshasayee Ashok Leyland25 Kamal K. Sharma Lupin

ChIndiAfrica - © J.J. Boillot 19
FDI in and outbound
Why Indian firms invest abroad? Dual explanation
0,0
10,0
20,0
30,0
40,0
50,0
60,0
2004
/05
2005
/06
2006
/07
2007
/08
2008
/09
2009
/10
2010
/11
2011
/12e
2012
/13f
Inbound FDI
Outbound FDI

ChIndiAfrica - © J.J. Boillot 20
True challenge: Nano Capitalism & Emergence of new bu siness Models(a) The « Reverse Innovation »
1) Vijay Govindarajan*, and the concept of "Reverse innovation", overtaking the « glocalisation » model of post-fordist capitalism.
* The product and process innovation took essentially its source in the advanced economies, then adapted locally;
* this time, innovation starts at the local level, and at first in the emerging countries especially China and India with processes and products adapted to their constraints (resources & incomes) and abundances (labor & consumers).
*Read in the Harvard Review of Management 2009 his article co-signed by the
CEO of GE himself, Jeffrey R. Immelt.

ChIndiAfrica - © J.J. Boillot 21
(b) The « Bottom of the Pyramid » market target
2) C.K. Prahalad, from the university of Michigan, with his concept of " base of the pyramid " (BoP or Bottom of the Pyramid), aims at the 4-5 billion human beings living with less than 2 dollars a day.
*A Whole range of products, including housing & infrastructures (water or electricity) are emerging under the push of new innovations and retain more and more the attention of international agencies as the World Bank or UNDP.
* Due to its consumption-led-growth and democratic structure, India looms more incline to the BoP approach than China who has followed the typical set of western patterns due to its export-led-growth including inequalities.

ChIndiAfrica - © J.J. Boillot 22
(c) The « Jugaad Innovation » experience
3) Navi Radjou, Jaideep Prabhu and Simone Ahuja in their book « Jugaad Innovation » have theorised the experiences of many entrepreneurs from India and other developping countries.
* Seek opportunity in adversity* Do more with less (frugality)* Think and Act flexibily
• * Keep it simple• * Include the margin
* Follow your Heart

ChIndiAfrica - © J.J. Boillot 23
Will India succeed in the modernisation of its business culture: the « Indian Way of Management » versus the old bania predatory culture?
1- PRINCIPLES1) Managing People: holistic engagement of employees- the
« Employee First » of Vineet Nayar (HCL);2) Leading the Entreprise: improvisation and adaptability (jugaad)3) Competitive Advantage: delivering the Creative Value
Proposition (Infosys/Wipro)4) Company Governance: fulfilling broad mission and purpose
2- INNOVATIONS1) Scaling-Out : the Bharti paradigm (mobile phone Airtel);2) Frugal Innovations: the GM ECG or Tata water filter;3) Inclusive innovation: the Microfinance paradigm (SHGs);4) Opportunistic solutions : the Tulsi Tanti strategic shift in
Windpower

ChIndiAfrica - © J.J. Boillot 24
III- Neither China, nor Chindia but ChindiafricaThe demographic trends
Evolution de la population du monde par grandes rˇg ions 1950-2050
0,0
0,5
1,0
1,5
2,0
2,5
1950
1960
1970
1980
1990
2000
2010
2020
2030
2040
2050
Millions
en m
illia
rd
Afrique
Inde
Chine
ASudhors Inde
ASud-est
A. Latine
Europe
Am.Nord 0
50
100
150
200
250
300
350
400
1950
1960
1970
1980
1990
2000
2010
2020
2030
2040
2050
USA Europe Inde Chine Afrique

ChIndiAfrica - © J.J. Boillot 25
The Demographic window of opportunity
0,0
2,0
4,0
6,0
8,0
10,0
12,0
14,0
54 57 60 63 66 69 72 75 78 81 84 87 90 93 96 99 02 05 08 11
40,0
45,0
50,0
55,0
60,0
65,0
70,0
75,0
80,0
Transition dˇmographique (% Pop active-ech droite) et Dˇcollage ˇconomique (croissance- ˇch gauche)
Chine
Inde
Afrique

ChIndiAfrica - © J.J. Boillot 26
And the shifting Human Capital
0%
10%
20%
30%
40%
50%
60%
70%
1980 2010 2030 2050
AFRIQUE
INDE
CHINE
EU
USA
4
6
8
10
12
14
16
2010 2020 2030 2040 2050
US
Ch
In
LA
Nafr
Afr

ChIndiAfrica - © J.J. Boillot 27
Towards a Multipolar World with three giants
0%
10%
20%
30%
40%
50%
60%
70%
80%
90%
100%
1980 2010 2020 2030 2040 2050
Ru
EU
TotAFR
India
China
Jap
LA
Bz
US
Share World GDP current USD %
0%
10%
20%
30%
40%
50%
60%
70%
80%
90%
100%
1980 2010 2020 2030 2040 2050
Ru
EU
TotAFR
India
China
Jap
LA
Bz
US
Share World GDP USD PPP %

ChIndiAfrica - © J.J. Boillot 28
And the same challenge: Sustainability

ChIndiAfrica - © J.J. Boillot 29
One example of the CIA triangle:Technologies and Business Models
Mapping of Country Capability Rating to Top 16 Technology Applications
Needed Capability Technology Applications
Low Cheap solar energy
lagging Rural wireless communications
(South Africa…) GM crops
Filters and catalysts
Cheap autonomous housing
Medium Rapid bioassays
developing Green manufacturing
(China, India…) Ubiquitous RFID tagging
Hybrid vehicles
High Targeted drug delivery
proficient Improved diagnostic and surgical methods
(Europe, ….) Quantum cryptography
Very High Ubiquitous information access
advanced Tissue engineering
(US, Japan, top Europe…)Pervasive sensors
Wearable computers
Source: Rand Corporation2006, Richard Silberglitt ... et al., The Global technology revolution 2020