india - a new player in asian production networks?
DESCRIPTION
This book seeks to identify the reasons why India has performed below its potential in this new form of international division of labor, even though that country possess several supportive factors including: (a) the sheer size of the economy and population; (b) a large pool of engineers; (c) relatively sound intellectual property protection; and (d) an increasingly open trade and investment climate resulting from progressive economic reforms.TRANSCRIPT

STUDIES IN TRADE AND INVESTMENT 75
INDIA: A NEW PLAYER in ASIAN PRODUCTION
NETWORKS?
ECONOMIC AND SOCIAL COMMISSION FOR ASIA AND THE PACIFIC

United NationsEconomic and Social Commission for Asia and the PacificTrade and Investment DivisionUnited Nations Building, Rajadamnern Nok Avenue,Bangkok 10200, ThailandTel.:Tel.: +66 2 2882252Fax.: +66 2 2881027E-mail: [email protected] [email protected] site: http://www.unescap.org

STUDIES IN TRADE AND INVESTMENT 75
INDIA: A NEW PLAYER IN ASIAN PRODUCTION NETWORKS?
Edited by Witada Anukoonwattaka and Mia Mikic
IN COLLABORATION WITH THE ASIA PACIFIC RESEARCH AND TRAINING NETWORK ON TRADE
ECONOMIC AND SOCIAL COMMISSION FOR ASIA AND THE PACIFIC

India: A new player in Asian production networks?
STUDIES IN TRADE AND INVESTMENT 75
United Nations Publication Sales No.: E.12.II.F.5 Copyright © United Nations 2011 All rights reserved ISBN-13: 978-92-1-120639-5 E-ISBN-13: 978-92-1-055288-2 ST/ESCAP/2624
The opinions, figures and estimates set forth in this publication are the responsibility of the authors, and should not necessarily be considered as reflecting the views or carrying the endorsement of the United Nations.
The designations employed and the presentation of the material in this publication do not imply the expression of any opinion whatsoever on the part of the Secretariat of the United Nations concerning the legal status of any country, territory, city or area, or of its authorities, or concerning the delimitation of the frontiers or boundaries.
Mention of firm names and commercial products does not imply the endorsement of the United Nations.
All material in this publication may be freely quoted or reprinted, but acknowledgment is required, together with a copy of the publication containing the quotation or reprint.
The use of the publication for any commercial purposes, including resale, is prohibited, unless permission is first obtained from Secretary of the Publications Board, United Nations, New York. Request for permission should state the purpose and the extent of reproduction.
This publication has been issued without formal editing.

iii
Preface and acknowledgments
Attention given to the international production networks (IPNs), alternatively referred to as “value chains”, and their significance for the economies in the Asia-Pacific region has grown in recent years, especially since the onset of the global economic crisis in 2008. The sharp reductions in exports and imports have made it very clear that IPNs make economic activities of countries interlinked and interdependent, thus playing a significant role in national economic development. This study of the position of India in this context clearly demonstrates the importance of understanding what drives the establishment and expansion of IPNs.
This publication is not intended to provide comprehensive coverage of the topic; instead, it presents mainly what are known as the views of “trade economists” rather than “international business”.
The editors are grateful to Professor Sisira K. Jayasuriya for the inspiration to undertake this study as well as the authors for the dedicated way in which they delivered their inputs, despite serious time and resource constraints. Professor Biswajit Nag read through the entire manuscript and provided detailed comments, while Mr. Rajan S. Ratna provided valuable comments on the status and future approaches to preferential trade liberalization by India. Neither one should be responsible for the errors and omissions that may remain. Special appreciation is due for the fast but thorough work of our copy/format editor, Mr. Robert Oliver. In addition, the assistance provided by Mr. Gandhip Rai in preparing chapter four of this book as well as Mr. Teemu Puutio during the final phase of preparing the manuscript and Ms. Chaveemon Sukpaibool in designing the cover page is gratefully acknowledged.
The views in this book are those of the authors and do not represent any endorsement by the United Nations or the authors’ organizations or affiliations.

iv
Abbreviations and acronyms
ACMA Automotive Component Manufacturers Association of India
AFTA ASEAN Free Trade Area
APTA Asia-Pacific Trade Agreement
APTIR Asia-Pacific Trade and Investment Review
APTIAD Asia-Pacific Trade and Investment Agreement Database
ARTNeT Asia-Pacific Research and Training Network on Trade
ASEAN Association of Southeast Asian Nations
AUT Auckland University of Technology
BEA United States Bureau of Economic Analysis
CAGR compound annual growth rate
CEPT Common Effective Preferential Tariff
DIPP Department of Industrial Policy and Promotion
ESC Electronics and Computer Software Export Promotion Council
ESCAP Economic and Social Commission for Asia and the Pacific
EU15 European Union member countries prior to 1 May 2004
FDI foreign direct investment
FTA free trade agreement
GATT General Agreement on Trade and Tariffs
GDP gross domestic product

v
G-L Grubel-Lloyd
GNI gross national income
GVC global value chain
H-O Heckscher-Ohlin
HS Harmonized Commodity Description and Coding System
IAFTA India-ASEAN Free Trade Agreement
IBEF Indian Brand Equity Foundation
IIT intra-industry trade
ICT information and communication technology
IDE Institute of Developing Economies
ILO International Labour Organization
IMF International Monetary Fund
IMV international multipurpose vehicle
IIT intra-industry trade
IPN international production network
IT information technology
JBIC Japan Bank of International Cooperation
JETRO Japan External Trade Organization
JFDI Japan foreign direct investment
LEP Look East policy
METI Ministry of Economy Trade and Industry
MFN most-favoured nation

vi
MNC multinational corporation
MNE multinational enterprise
MIIT marginal intra-industry trade
NAFTA North-American Free Trade Agreement
NEG new economic geography
NIEs newly industrialized economies
NTB non-tariff barrier
OBAJF overseas business activities of Japanese firms
OECD Organisation for Economic Co-operation and Development
OEMs original equipment manufacturers
P&C parts and components
P&CB printed circuit boards
PPP purchasing power parity
PTA preferential trade agreement
RBI Reserve Bank of India
R&D research and development
RIETI Research Institute of Economy, Trade and Industry
RoO rules of origin
RTA regional trade agreement
SAARC South Asian Association for Regional Cooperation
SAFTA South-Asian Free Trade Area
SEZ special economic zone

vii
SITC Standard International Trade Classification
SME small and medium-sized enterprise
TKAP Toyota Kirloskar Auto Parts
TRIPS Agreement on Trade-Related Aspects of Intellectual Property Rights
UNCOMTRADE United Nations Commodity Trade Statistics Database
USD United States dollar
USFDI United States foreign direct investment
VAT value added tax
WEF World Economic Forum
WITS World Integrated Trade Solution
WTO World Trade Organization

viii
List of contributors
Witada Anukoonwattka, Economic Affairs Officer, Trade and Investment
Division, United Nations Economic and Social Commission for Asia and the Pacific, Bangkok. E-mail: [email protected]
Mia Mikic, Economic Affairs Officer, Trade and Investment Division, United Nations Economic and Social Commission for Asia and the Pacific, Bangkok. E-mail: [email protected]
Rahul Sen, Lecturer in Economics, Faculty of Business and Law, Auckland University of Technology , New Zealand, E-mail: [email protected]
Sadhana Srivastava, Lecturer in Economics, Faculty of Business and Law, Auckland University of Technology, New Zealand, E-mail:sadhana.srivastava@ aut.ac.nz
Nobuaki Yamashita, Lecturer in Economics, School of Economics and Finance, La Trobe University, Melbourne, Australia, E-mail: [email protected]

ix
Contents Page
Preface and acknowledgments ............................................................................... iii Abbreviations and acronyms ................................................................................. iv
List of contributors............................................................................................... viii Introduction ....................................................................................................................1
Chapter I .........................................................................................................................7 Driving forces of Asian international production networks: A brief history and theoretical perspectives
Chapter II......................................................................................................................23
Comparative overview of economic profiles and roles of China and India in Asian international production networks
Chapter III ....................................................................................................................53 Can India become an export platform for global operations of MNCs? Perspectives from Japanese and United States MNCs
Chapter IV ....................................................................................................................78
Integrating into Asia’s international production networks: Challenges and prospects for India
Chapter V ....................................................................................................................120
Are the Indian trade agreements deep enough to support production networks? Chapter VI ..................................................................................................................137
Prospects for India and lessons for latecomers
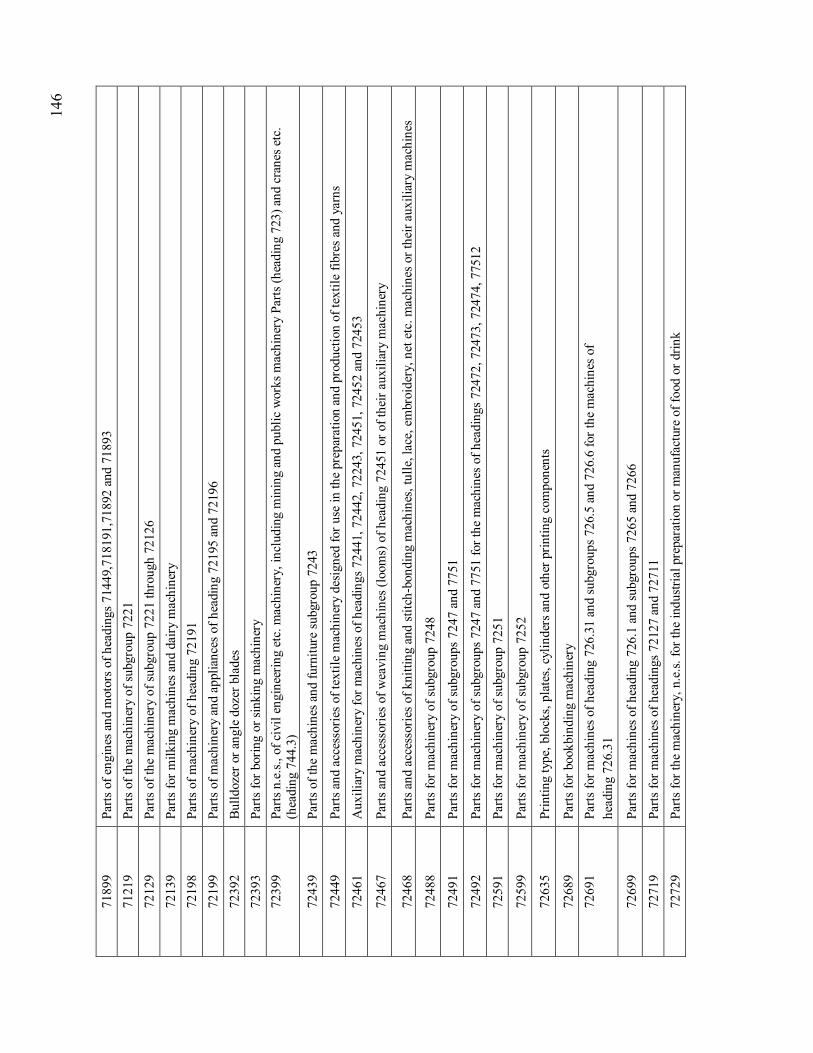
Appendix I Lists of parts and components (based on the 5-digit SITC Revision 3)....145
Appendix II India’s trade of top 10 items of manufacturing parts and components,
1994-2008 ..............................................................................................................156
Appendix III Overview of India’s preferential trade agreement, 2011 ...................161

List of tables
Page
Chapter II
Table 1. Economic profiles of China and India ........................................................ 24
Table 2. Shares of goods and services in trade by China and India ........................... 30 Table 3. Distribution of manufacturing exports by China and India ......................... 31
Table 4. Distribution of manufacturing imports by China and India ......................... 33 Table 5. Share of parts and components in manufacturing trade of selected economies .....46 Chapter III
Table 6. Country distribution of USFDI and JFDI stock, 1996-2010........................ 58
Table 7. USFDI stock in China and India, 1991-2010.............................................. 60 Table 8. Employment of Japanese and United States MNC affiliates in India and China ... 66
Table 9. Local sales and export orientation of U.S. and Japanese MNC affiliates in manufacturing, 1989-2005....................................................................................... 69
Table 10 Sales and exports by Japanese and US MNC affiliates, by industry in India and China, 2005 ...................................................................................................... 72 Chapter IV
Table 11. Marginal intra-industry trade in top 10 products involving P&C trade in 2008..... 89
Table 12. Export shares and major destinations for India’s auto-parts, 2008 ............ 92 Table 13. India’s exports of auto-parts to major countries involved in Asian IPNs, 1994-2008 ............................................................................................................... 93 Table 14. India’s exports of electronics-parts: Value and share in major destinations, 2009-2010 ............................................................................................................... 98 Table 15. Tariff structure of non-agricultural goods in India and selected developing Asian economies ....................................................................................................101 Table 16. Average MFN applied tariffs by selected product groups of India and selected developing Asian economies in the non-agricultural sector, 2009..............102 Table 17. Enabling trade index comparisons of India and selected Asian developing economies ..............................................................................................................103 Table 18. Doing Business Rank 2012 comparisons of India and selected Asian developing economies ............................................................................................105 Table 19. Recent regulatory reforms undertaken by India to improve its business environment rankings .............................................................................................106 Chapter V
Table 20. Rules of origin under preferential trade agreements.................................126 Table 21 Taxonomy of India’s PTAs ......................................................................128
Table 22. Progression from shallow to deep integration ..........................................130

List of figures
Page Introduction Figure 1. Exports of parts and components by the Asia-Pacific region and the rest of the world...1 Figure 2. Hourly compensation costs in Chinese manufacturing sectors, 2003-2008 . 3 Chapter I
Figure 3. International production network of a hard disk drive made in Thailand ..... 7
Figure 4. Production network of automotive components in ASEAN....................... 10 Chapter II
Figure 5. Growth rates of real GDP: China and India, 1990-2009 ............................ 23 Figure 6. Shares in GDP by economic sectors.......................................................... 25
Figure 7. Growth of production by economic sector ................................................ 26 Figure 8. Distribution of employment and GDP by sector, China and India, 2000.... 28
Figure 9. Shares of exports in GDP.......................................................................... 29 Figure 10.Machinery and ICT products in manufacturing exports............................ 32
Figure 11.Shares of intraregional trade in total trade of China, 1998-2009 ............... 34
Figure 12.Shares of intraregional trade in total trade by India, 1998-2009........... 35-36
Figure 13. Intraregional trade of Chinese manufacturing sector, 1995-2010............. 37 Figure 14. Chinese exports of manufactures, by destination..................................... 38
Figure 15. Intraregional trade by Indian manufacturing sector, 1995-2010............... 39 Figure 16. Manufacturing exports from India, by destination ................................... 40
Figure 17. FDI net inflows to China and India, 1990-2009....................................... 41 Figure 18. Distribution of FDI inflows to China and India by sector, 2005-2008...... 42
Figure 19. Distribution of FDI inflows by country of origin..................................... 44 Figure 20. Share of parts and components in intraregional manufacturing trade....... 47
Figure 21 Parts and components vs Final goods in China’s manufacturing trade...... 48 Figure 22. Parts and components vs. final goods in China’s trade in manufacturing and transport equipment by destination.................................................................... 49 Figure 23. Parts and components vs. final goods in India’s manufacturing trade ...... 50 Chapter III
Figure 24. Employment of Japanese MNC affiliates in India and China by sector, 1992-2005 ............................................................................................................... 63 Figure 25. Employment of United States MNC affiliates in India and China............ 64

by sector, 2008 ........................................................................................................ 64 Figure 26. Local purchase and import of Japanese MNCs in India and China, 2005..........74 Chapter IV
Figure 27. India’s shares in merchandise trade with developing Asia and China ...... 81 Figure 28. India’s share of inward FDI inflows in the top 10 sectors, April 2000-September 2011....................................................................................................... 82 Figure 29. The four phases of industrial development through utilizing IPNs........... 84
Figure 30. Growth in India's merchandise exports, 1994-2008................................. 86 Figure 31. Growth in India's merchandise imports, 1994-2008................................. 86
Figure 32. Patterns of India's parts and components trade, 1994-2008...................... 88 Figure 33. Exports of gearboxes (SITC 78434) from selected Asian countries, 1994-2008 95
Figure 34. Trends in India's electronics components production and exports, 2004-2010 ... 96 Chapter V
Figure 35. India’s “noodle bowl”...........................................................................122 Figure 36. Areas covered by PTAs in force.............................................................129

1
Introduction
Witada Anukoonwattaka
Asian international production networks (IPNs) started by the changes of MNCs’ strategies on international fragmentation of production in responding to rapid globalization, technology changes, and increasingly open trade and investment environments in Asian countries in the 1980s.1 The phenomenon was fuelled in the 1990s by the opening of China which has emerged as a global centre for manufacturing assembly. Currently, the growing IPNs have a significant impact on merchandise trade patterns and regional integration among Asian economies. The phenomenon has led to dramatic expansion in trade in parts and components with a notable development in exports by Asia-Pacific. The share of the Asia-Pacific region in total world exports of parts and components has been increasing since the 1990s, especially during the past 10 years (figure 1)
Figure 1. Exports of parts and components by the Asia-Pacific region
and the rest of the world2
0
200
400
600
800
1,000
1,200
1,400
1,600
1,800
2,000
1990
1991
1992
1993
1994
1995
1996
1997
1998
1999
2000
2001
2002
2003
2004
2005
2006
2007
2008
2009
2010
Billio
ns of
US do
llars
Asia-Pacific
Rest of the world
World total
Source: UNCOMTRADE data downloaded from WITS database.
1 International fragmentation of production generally refers to the spreading of production stages across countries. In public debates, the terms “international product fragmentation”, “offshoring” and “vertical specialization” have been used interchangeably. Slicing up the value chain allows production cost savings through cross-country differences in factor prices, resources, market sizes, infrastructures and institutional factors. The geographic dispersion of the value chain creates international production networks (IPNs) between countries where different stages of the production are located. IPNs can be organized within a single firm (vertically integrated) or can involve different companies (outsourcing). In both cases, the fragmentation of production requires a sophisticated organization, and involves trade in parts and components and/or trade in tasks. 2 Data on parts and components is based on the 5-digit SITC Revision 3, and follows the descriptions of parts and components given by Athukorala (2010). The list of parts and components is provided in the annex to this chapter.

2
During this process, China emerged as a pivotal assembling centre for a wide
range of manufactured products by importing parts and components from other East and South-East Asian countries such as the Republic of Korea, Malaysia, the Philippines, Singapore and Thailand. It appears that the phenomenon has provided tremendous trade and investment opportunities for developing Asian economies participating in IPNs. The fact that countries in East and South-East Asia have benefited from the expanding IPNs has been widely documented, especially in terms of gaining access to world market, employment creation, and technology transfer.3 Available evidence also indicates that there would be a sizable benefit for late-comer countries if and when they were to increase their presence in existing IPNs of Asian manufacturing industries.
While the IPN phenomenon has accelerated trade and investment linkages
between countries in East and South-East Asia, the remainder of the region has not matched those countries in this process. Chapter II discusses the fact that India, the second-most populous economy in the world, remains a tiny participant in the global production networks of manufacturing industries. Although India’s emergence as a world-class IT-services hub has proved that a developing country can achieve high economic growth without following the IPN-driven development strategy, concerns are mounting over the low-employment generation of India’s growth model. Heavy reliance on relatively skill-intensive service sectors created somewhat limited prospects for employment growth in India during the past two decades. An average of 13 million people is expected to enter into India’s labour force annually for the next four decades, most of whom will be unskilled workers.4 To absorb such a massive expansion of the workforce, India will need to develop more manufacturing sectors that are labour-intensive.
However, recent trends indicate that the factors shaping the manufacturing
landscape of IPNs in Asia are changing. Overall, China is facing growing competition from other low-wage countries. The costs of assembly activities in China have been increasing rapidly during recent years, especially in the highly-concentrated manufacturing centres in the coastal regions. According to the United States Bureau of Labour Statistics, the estimated hourly compensation in the Chinese manufacturing sectors more than doubled from US$ 0.62 per hour in 2003 to US$ 1.36 per hour in 2008 (figure 2). In addition, investment incentives for the majority of new manufacturing activities near the coast have been eliminated or dramatically reduced due to the efforts of the Government of China to encourage manufacturing activities
3 See, for example, Borrus, Ernst and Haggard, 2000; Ernst, 1997; and Gauiler, Lemoine and Ünal-Kesenci, 2004. 4 See, for example, Acharya, 2006; Kochhar and others, 2006; and Mehta, 2005.

3
to locate in other parts of the country (Timberlake, Schneider, and Terry, 2009). Will these dynamics create an opportunity for a low-income country to fill the labour-intensive activity gaps in Asian IPNs? What are the challenges and prospects for a country that has been lagging behind in this process?
Figure 2. Hourly compensation costs in Chinese manufacturing sectors,
2003-2008
0.62
0.66
0.73
0.81
1.06
1.36
0 0.25 0.5 0.75 1 1.25 1.5
2003
2004
2005
2006
2007
2008
United States dollars per hour
Source: United States Bureau of Labour Statistics, 2011. The objective of this study is to clarify these issues by using India’s
performance in the Asian IPNs as a case study for other countries that are trailing behind in this area. The study seeks to identify the reasons why India has performed below its potential in this new form of international division of labour, even though that country possess several supportive factors including: (a) the sheer size of the economy and population; (b) a large pool of engineers; (c) relatively sound intellectual property protection; and (d) an increasingly open trade and investment climate resulting from progressive economic reforms.5 In addition, continuing efforts towards the “Look East Policy” (LEP) have been made by forming preferential trade agreements (PTAs) with East and South-East Asian countries, including Japan, the Republic of Korea, Malaysia, Singapore and Thailand as well as the push for the India-ASEAN Free Trade Agreement (IAFTA).
It has been argued that the emphasis on PTAs with the important players in
Asian IPNs may provide a stepping stone for India to increase its integration into the
5 Based on indicators from various institutions and various years (e.g., World Bank, 2011; and A.T. Kearney’s FDI confidence index, 2004 and 2010).

4
Asian IPN process. However, the effectiveness of using PTAs to increase India’s integration with Asian IPNs will depend on the features of each PTA as well as India’s ability to engage in the division of labour in the production networks. Therefore, this study also considers PTA features that are necessary for the development of IPNs.
The reason for focusing on India is not only because that country is a gigantic
emerging economy that is expected to become another growth centre of the region within the next two decades; more importantly, it is because such a study holds important policy messages for other low-income countries that have been missing out on the opportunities offered by the IPN phenomenon. If integration of the Indian economy into Asian IPNs occurs, it may have trade opportunity implications for peripheral countries in South Asia through their trade with India.6 In a policy context, India’s growth and trade patterns are an illustration of adverse impacts generated by inward-looking policies as well as tight controls on foreign and domestic investment. The efforts of India to sign a number of PTAs with players in Asian IPNs can provide a very useful case study for countries seeking to use PTAs as a vehicle for integrating their production and trade with production networks in the region.
Chapter I of this study presents a brief review of the appearance and expansion
of the Asian IPN phenomenon, followed by a literature survey that explores key drivers of this phenomenon from theoretical perspectives. Theories point to important conditions that countries must meet in order to be successfully integrated into IPNs. These conditions highlight policy implications for creating trade and investment climates that are favourable to IPN development.
Chapter II and III undertake a comparative analysis between China and India,
with a view to understanding the divergence in the performances of the two countries. Chapter II begins with a comparative overview of the differences in the economic structures of the two countries, followed by a detailed examination of the roles of the two countries in the current landscape of Asian IPNs. Due to the fact that the IPN phenomenon has been driven by decisions of multinational corporations (MNCs) regarding operations and locations of their production systems, chapter III provides an insightful background aimed at understanding the issues involved. It examines the operational characteristics of Japanese MNC affiliates in comparison to United States-based MNCs, using affiliate-level data.
6 See, for example, United Nations (2011) exploring prospects of Sri Lanka’s integration into the global electronics value chains.

5
Chapters IV and V analyse more closely the constraints and challenges facing the integration of India into the Asian IPNs in the future. Chapter IV includes case studies of the automotive components and electronics sectors in order to illustrate the potentially successful example of India emerging as an important regional player in Asian IPNs. The policy challenges and key recommendations for India to integrate into Asian IPNs are analysed. Chapter V specifically emphasizes India’s recent initiatives towards entering into PTAs with East and South-East Asian countries. The chapter critically analyses the depth of PTAs between India and important players in IPNs in order to decide whether they contain the necessary coverage and institutional depth to provide a vehicle for the integration of India into the value chain of Asian IPNs.
Chapter VI synthesizes the findings and key messages emerging from this study
and presents policy recommendations with regard to fostering IPN participation by countries that are still lagging behind. The recommendations hold important implications for India and other developing Asian countries that have been missed out in the growing phenomenon of IPNs, given their similarity in terms of the constraints and challenges that they face.

6
References Acharya, S. (2006). Essays on macroeconomic policies and growth in India. Oxford
University Press, New Delhi. A.T. Kearney (2010). Investing in a Rebound – The 2010 A.T. Kearney FDI
Confidence Index. Available from http://www.atkearney.com/images/global/pdf/Investing_in_a_Rebound-FDICI_2010.pdf ——— (2004). Foreign Direct Investment (FDI) Confidence Index 2004. Chicago,
United States. Available from http://www.atkearney.com/index.php/Publications/2004-foreign-direct-investment.html.
Athukorala, P. (2010). “Global production sharing, trade patterns, and determinants of trade flows in East Asia”, Asian Development Bank Working Paper Series on Regional Economic Integration, No. 41. Manila.
Borrus, M., D. Ernst, and S. Haggard (2000). International production networks in Asia: Rivalry or riches? Routledge, London and New York.
Bureau of Labour Statistics (2011). “International comparisons of hourly compensation costs in manufacturing, 2009”, economic news release USDL-11-0303, United States Department of Labour. Available from http://www.bls.gov/news.release/archives/ichcc_03082011.pdf
Ernst, D. (1997). “Partners for the China circle? The Asian production networks of Japanese electronics firms”, in B. Naughton (ed.), The China Circle, The Brookings Institution, Washington, D.C.
Gaulier, G., F. Lemoine and D. Ünal-Kesenci (2004). “China’s integration in Asian production networks and its implications”, RIETI Discussion Paper Series 04-E-033. Research Institute of Economy, Trade, and Industry, Tokyo.
Kochhar, K., U. Kumar, R. Rajan, A. Subramanian and I. Tokatlidis (2006). “India’s pattern of development: What happened, what follows?” IMF Working Paper WP/06/22. International Monetary Fund, Washington. D.C.
Mehta, P. B. (2005). “How India lost the will to reform”, Financial Times, 1 November 2005. London.
Timberlake, J., P. Schneider and S. D. Terry (2009). “China: Still manufacturing’s shining star?” Deloitte Review, No. 5; pp. 105-119.
United Nations (2011). Enabling Environment for SMEs’Productive Integration in Global Value Chains: Studies of Bangladesh, Nepal, and Sri Lanka. Studies in Trade and Investment No.70. Economic and Social Commission for Asia and the Pacific, Bangkok.
World Bank (2011). Doing Business 2012: Doing Business in a More Transparent
World. World Bank and International Financial Corporation, Washington, D.C. Available from http://www.doingbusiness.org/~/media/fpdkm/doing%20business/documents/annual-reports/english/db12-fullreport.pdf

7
Chapter I
Driving forces of Asian international production networks:
A brief history and theoretical perspectives
Witada Anukoonwattaka
During the past three decades, the process of global production sharing has created a new form of division of labour between Asian economies, especially in East and Southeast Asia. The rapid growth of production networks has dramatically transformed patterns of production and international trade in the region, with a notable expansion of intra-regional trade “through multiple border crossings of parts and components” (figure 3).
Figure 3. International production network of a hard disk drive made in Thailand
Hong Kong, China
United States
Hong Kong, China
United States
Source: Baldwin, 2010.
This chapter provides a brief review of the development process of the IPN phenomenon in Asia, followed by a literature survey, with the objective of providing an analytical framework for discussing the necessary conditions for the successful integration of a country into IPNs. It conveys important policy implications for setting trade and investment climates that encourage IPNs.
8
1. Brief overview of the development of Asian IPNs
International product fragmentation has been an important feature of the
international division of labour since about the mid-1960s (Athukorala, 2008). Electronics MNCs based in the United States started the process in response to increasing pressure created by domestic real-wage increases and rising import competition from low-cost sources. The Government of the United States facilitated the process by introducing an outward processing tariff scheme under which companies were allowed to export material for processing overseas and to re-import the finished products, paying tariffs only on the value-added abroad (not the exported intermediates).
The growth of IPNs led to international division of labour between countries
along the value chain, in which the term “vertical specialization” is used interchangeably to describe the same phenomenon as documented by Hummels, Ishii and Yi (2001). Consequently, intra-industry trade in parts and components has been growing rapidly between countries participating in IPNs as intermediate inputs are imported and used in goods that are subsequently exported (so called outward processing trade).
Using the Asian input-output table maintained by Japan’s JETRO, Baldwin
(2008) concludes that international production sharing in Asia has developed from a simple North-South outward processing trade to a much broader phenomenon, for which the term “Factory Asia” is widely used. The process of linking Asia to global supply chains began in the 1960s in the electronics industry with the arrival of two United States companies, National Semiconductors and Texas Instruments, which set up plants in Singapore to assemble semiconductor devices (Athukorala, 2008 and Goh, 1993). From around the late 1970s, MNCs with production facilities in Singapore began to relocate some low-end assembly activities to neighbouring countries (particularly Malaysia, the Philippines and Thailand). Many MNCs that were newcomers to the region also set up production bases in those countries. Singapore has since become a regional centre for component design and fabrication as well as providing headquarter services for production units located in neighbouring countries.
Although the United States electronics MNCs started their IPNs in Asia in the
1960s, the vertical specialization form of trade was more important in North-North trade among European and North American nations up until the early to mid-1980s (Amador and Cabral, 2008). Initially, the United States MNCs explored opportunities for North-South offshoring in neighbouring countries in Latin America, but the unfavourable investment climate in those countries – macroeconomic instability, political tensions, trade union upheavals and uncertainty – led American producers to switch to sub-suppliers located in Asia (Feenstra, 1998; Grunwald and Flamm, 1985;

9
and Helleiner, 1973). Consequently, a rapid increase in North-South intra-industry trade occurred, especially in Asia, after the mid-1980s.
By the 2000s, rapid development of IPNs led to countries in East and South-East
Asia becoming important players in the global supply chain system. Amador and Cabral (2008) found that the group of first-tier newly industrialized economies (Republic of Korea, Singapore, Taiwan Province of China and Hong Kong, China) accounted for 24.5 per cent of global vertical intra-industry trade between 2001 and 2005. The most impressive increase took place in China; while China’s share of global vertical intra-industry trade between 1986 and 1990 was 2 per cent on average, this share increased to an average of 15 per cent between 2001 and 2005.
Corresponding to the growth of IPNs in the region, South-South trade in parts
and components became more significant. In the mid-1980s, developing nations in East and South-East Asia had little trade among themselves.7 They either supplied their own intermediates or imported intermediates from technologically advanced nations, mostly Japan, the United States and members of the European Union. In the 1990s, the importance of local sourcing declined, while imports of intermediates from Japan, the United States and Asia’s newly industrialized economies (NIEs) increased. More recently, the emergence of China as the “global assembly centre” has strengthened the linkages between countries in IPNs, as the success of China’s manufacturing exports appear to rely significantly on parts and component imported from other countries in the region particularly those in East and South-East Asia. 8
The evolution of Asian IPNs during the past two decades appears to
correspond to dynamic decisions of MNCs in responding to changes in trade and business environments. Prior to the 1990s, operations of MNCs could be divided into two categories: “vertical” and “horizontal” FDI (Markusen, 1995). Vertical FDI corresponds to international fragmentation of production on a factor-cost saving basis (such as labour), while horizontal FDI occurs when MNCs follow a “build-where-you-sell” strategy for seeking markets. In the context of Asia, vertical FDI by the United States electronics MNCs in the 1970s was documented as the beginning of IPNs in Asia. Meanwhile, investment by Japanese MNCs in the South-East Asian automotive sector during the same period is an example of horizontal FDI responding to high tariff protection in the host countries.
Since the late 1990s, MNC operations in Asia have progressively adopted an
international product fragmentation strategy; as a result, the division between the two types of investment has become unclear. Both horizontal and vertical operations of
7 Parts and components are intermediate products. The list of parts and components is given in Appendex I. 8 This is discussed in more detail in chapter II.

10
MNCs are increasingly able to coexist as declining tariffs and transportation costs allow for more flexibility in sourcing components from various countries. For example, Japanese automobile assemblers are taking advantage of regional trade liberalization programmes to consolidate duplicated production facilities in ASEAN countries and facilitate the division of labour within the region, in order to achieve a regional scale of production (figure 4).9 In addition, during the past two decades, many MNCs have significantly upgraded technical activities of their regional production networks in ASEAN, and assigned global production responsibilities to affiliates located in Singapore and, more recently, to those located in Malaysia and Thailand (Athukorala, 2008, Borrus, Ernst and Haggard, 2000; and McKendrick, Doner and Haggard, 2000). Overall, the ASEAN experience appears to support the view that MNC affiliates have a tendency to become increasingly embedded in host countries the longer they are present there (Rangan and Lawrence, 1999; and Athukorala and Yamashita, 2006).
Figure 4. Production network of automotive components in ASEAN
MalaysiaInstrumental panel assembly
BumperDrive shaft
IndonesiaCylinder head assembly
Cylinder blockEngine valve
Steering handleAutomatic transmission
PhilippinesEngine fuel system
Emission dress partsEngine electronic parts
Suspension partsManual transmission
ThailandPress parts
Frame panelsElectronics parts
Interior partsEngine parts
AFTA-CEPTMalaysia
Instrumental panel assemblyBumper
Drive shaft
IndonesiaCylinder head assembly
Cylinder blockEngine valve
Steering handleAutomatic transmission
PhilippinesEngine fuel system
Emission dress partsEngine electronic parts
Suspension partsManual transmission
ThailandPress parts
Frame panelsElectronics parts
Interior partsEngine parts
AFTA-CEPT
Source: Hiratsuka, 2010.
9 For details see, for example, Legewie, 1999a and 1999b, and Hiratsuka, 2010.

11
2. Theoretical perspectives of international production network This section reviews the literature that is relevant to this area of research with
the objective of identifying the key determinants in the successful integration of a country into IPNs. This will be built into an analytical framework for providing guidelines for policy reform aimed at enhancing IPN-friendly trade and business environments.
IPNs are driven by firm-level decisions regarding the organization and
locations of their production system. When factor-cost savings are large relative to the costs of fragmenting business activities across countries, a multinational firm will decide whether or not to fragment the production into stages as well as where to locate those fragmented units. The firm will optimize these decisions, given a set of exogenous factors.
Two elements of the relevant literature are of particular relevance: (a)
offshoring literature that models the process of international fragmentation of production; and (b) new economic geography (NEG) literature that discusses how industrial locations are shaped in general equilibrium.10 The focus of the offshoring literature is on factors driving a firm to split its production process into stages and locate them between countries, while the focus of the NEG literature is on discussing simultaneously the centripetal forces that cause economic activities to cluster together in particular locations and the centrifugal forces that push it apart. In the context of Asian IPNs, these two elements of literature coexist. The offshoring literature helps us to understand important factors driving rapid growth of IPNs in Asia. Meanwhile, the NEG literature completes the picture by helping to clarify the reasons for the concentration of a particular industry in a certain country (for example, why assembly activities are concentrating in China whereas manufacturing parts and components are clustering in South-East Asia).
Offshoring literature contains comparative-advantage elements of international
trade theory. This is a large area of research that could be divided into groups. One is the literature on international fragmentation of production, such as Jones (2000), Jones and Kierzkowski (2001), and Feenstra and Hanson (1996a and 1996b). The literature directly discusses the vertical specialization in the international supply chain. A general conclusion is that the division of labour between countries in an IPN is
10 Another branch of literature looks at a firm’s organization issues arising from the fact that production networks can be organized within the boundary of a single firm or take place between different firms. However, such organization decisions of MNCs are not a focus of this study. Literature in this area looks at microeconomic decisions of MNCs regarding organizations governing IPNs, i.e., the literature on outsourcing versus vertical integration. Antràs and Rossi-Hansberg (2009) provide a comprehensive review of this intersection of organizational economics and international trade.

12
determined by factor intensity of production stages and differences in factor prices between countries. An implication of this proposition is that relative abundance of labour was an important factor driving China to become a major assembly centre in the past decade.
A comparative advantage element is that studies of international fragmentation
of production share a common feature with a branch of the FDI literature that models vertical investment of MNCs. In general, vertical FDI models assume that activities of a multinational firm differ in factor intensities, while host countries differ in factor proportions. Early general equilibrium trade models of vertical firms include Helpman (1984) and Helpman and Krugman (1985). Recently, attempts to integrate vertical and horizontal FDI models have led to a modern view of multinational firms. In recent models, parent firms are exporters of services that are produced using knowledge-based assets to foreign subsidiaries (Markusen, 1995, 1998, 2002 and 2005). These models are referred to as “knowledge-capital” models. They assume that firm-specific knowledge assets are geographically mobile and are a joint input to multiple production facilities. An important implication of these FDI models is that reducing trade barriers will enable location advantages to be more easily realized and will allow MNCs more greater flexibility in sourcing components across countries. Consequently, trade liberalization is expected to increase intra-firm trade within the production network of MNCs.
A recent attempt to discuss the growing phenomenon of trade in tasks and
components in the literature led to development of modelling the production process as combining a continuum of components or tasks (Baldwin and Robert-Nicoud, 2010; Deardorff, 2001; Dixit and Grossman, 1982; Feenstra and Hanson 1996a; Grossman and Rossi-Hansberg, 2008; and Yi, 2003). The literature discusses trade in tasks or components between that stand at different levels of development, i.e., countries that differ in factor endowments or disparate technological capabilities. Motivated by the fact that trade in intermediate goods largely take places between advanced industrial countries, more recent literature in this area started to discuss trade in tasks between countries with similar characteristics by sharing the “new trade theory” features of (external) economies-of-scale at the task level (Grossman and Rossi-Hansberg, forthcoming).
The NEG literature covers several levels of agglomeration. At one extreme,
the literature discusses a core-periphery structure of production where factor mobility in some areas results in a great deal of economic activity while in other areas there is almost no such activity. 11 Another form of agglomeration is industrial concentration,
11 An example of this type of agglomeration is the fear about crowding-out effects resulting from the rise of China.

13
where different sectors cluster in different countries This form of agglomeration is particularly related to internationalization and trade in IPNs. Of the large number of studies that deal with this area, Fujita, Krugman and Venables (1999) provided a comprehensive framework for the agglomeration mechanisms. As shown by Venables (1996) and Krugman and Venables (1995), there are backward and forward linkages that tend to draw the upstream and downstream producers of an industry to concentrate in a single location.
The forward linkages, which depend on market size issues, form an important
force for agglomeration of firms in a country with a relatively large domestic market. Firms want to locate where they will have good access to a large demand, thus enabling them to reduce trade costs. When a large firm or many firms doing so, their suppliers then move to nearby areas in order to serve their customers and minimize trade costs. As a result of this circular mechanism of forward linkages, agglomeration may begin.
The second driver of industry agglomeration is through the backward
linkages.12 Firms buy inputs such as raw materials, intermediate goods, machinery and equipment as well as services (e.g., financial and logistic services) from service providers. The cost linkages work by encouraging firms to locate near their suppliers to save transport costs and trade-related costs. When many firms move to a low-cost location for intermediates, the cost of intermediates in that location reduce even further because suppliers of intermediates can enjoy economies–of-scale. As final products of some firms are also intermediates for other firms, an additional benefit for these upper-stream producers comes from increases in demand for their final goods.
Key messages from the NEG literature are that: (a) The input-output linkages form a key driving force for industries to choose
particular regions within which to become concentrated; (b) Economies-of-scale, transportation costs, and mobility of factors can cause
spatial structure of industrial sectors to emerge and changes; (c) The landscape of industrial concentration may change in response to trade
cost reductions in a non-linear manner. Trade cost reductions from high to intermediate levels will lead to a concentration of manufacturing activities in a country already having many firms located there because firms want to be located near their major markets to save trade costs while reductions in trade costs allow them to export their goods to peripheral markets. If trade costs are reduced further to a very low level, production cost savings start to dominate trade-cost saving. Consequently, firms will disperse their
12 See, for example, Grossman and Helpman, 2002, 2003 and 2005.

14
manufacturing activities out of the core location to peripheral countries in order to exploit benefits arising from differences in factor prices and other advantages in those latter countries.
3. Key factors driving integration of a country into IPNs
On the basis of the literature reviewed above, this section summarizes important factors for countries to successfully integrate into the IPNs, which are:
(a) Factor-cost advantages
Theory suggests that international fragmentation of production allows firms to reduce production costs as some intermediate inputs are cheaper to produce in some countries. Therefore, given that trade costs are relatively small, interactions between factor-intensity of fragmenting tasks and factor-price differences between potential host countries will determine the division of labour between countries participating in IPNs. The emergence of China as a major assembly centre during the past decade, and the division of labour in IPNs between countries in East and South-East Asia, appear to support this view. Empirically, MNCs tend to spread production stages over different countries due to production-cost savings. For example, Kimura (2006) reveals a fact about IPNs in East Asia that wage differential plays a crucial role for multinational firms when taking location decisions. Meanwhile, Athukorala (2008) indicates that significant differences in wages among the countries within the East and South-East Asian regions have provided the basis for rapid expansion of intraregional product-sharing systems, giving rise to increased cross-border trade in parts and components.
China’s emergence as a major assembly centre in Asian IPNs appears to
support this supposition. However an ongoing transition of industrialization in China that has led to rapid increases in real wages could change the location advantages of China. In this context, relative abundance of labour of an emerging economy such as India appears to be a supportive factor for participation by such a country in labour-intensive activities in IPNs, including assembly activities.
(b) Economies-of-scale
Certain stages of production that involve high fixed costs require scale
economies from specialized providers (Abraham and Taylor, 1996). According to the new trade theory, a country will export goods for which it has a large home market, which is called “the home market effect”. Large domestic industries serve as a base for exports because the operation of increasing returns-to-scale makes manufactured products cheaper in a country that has a large domestic market. In addition, the NEG literature points out that for firms clustering in a single location positive externality

15
emerges from knowledge spillovers and backward- and forward-linkages, called “the agglomeration effect”.
In the context of domestic market size, China appears to have the location
advantage for scale-intensive activities such as automotive manufacturing due to its large and rapidly growing home market. The apparent consolidation of Japanese operations in the ASEAN automotive sector in order to use benefits of regional trade liberalization programmes to overcome the limitations on domestic market sizes of ASEAN countries also appears to be consistent with the literature. In the case of India, the country offers the advantage of a huge and fast-growing economy even though the level of per capita income is still relatively low. Therefore, the country appears to offer a supportive environment in this regard, especially in the medium to long term. (c) Thickness of markets
One implication of the NEG literature is that for an industry having a vertical
production structure, the input-output relationships create forward and backward linkages between firms, and lead to industry concentration in a particular country or region. Such linkages rest on issues concerning thickness of markets, which implies ability to access to downstream customers and upstream suppliers.
In this context, early establishment appears to be an important factor
determining location decisions of firms. Based on experiences of ASEAN and China, Athukorala (2008) indicated that site selection decisions by MNCs operating in assembly activities were strongly influenced by the presence of other key market players in a given country or in neighboring countries. In this context, late establishment of manufacturing industries as well as poor development of supporting industries and supply-chain networks appears to put late entry into global production networks by countries such as India and other South Asian nations at a serious disadvantage. (d) Low international trade costs
International fragmentation of production requires intermediate inputs to be
manufactured in one or more countries and then shipped to another destination for final assembly. In addition, operating international supply chain requires sophisticated management and the use of infrastructure services, such as telecoms, the Internet, air freight and trade-related finance, in order to coordinate the production process and flows between production units in different locations. Costs related to those operations are commonly termed as “international trade costs”. A broad definition of trade costs includes: policy barriers from tariffs; non-tariff barriers; transportation, communications

16
and information costs; exchange rate costs; legal, regulatory and enforcement costs, and local distribution costs (WTO, 2008).13
Trade in IPNs involves multiple cross-borders trading of a good-in-process
during different stages of production. As international trade costs are incurred each time a good-in-process crosses a border, even a minor reduction in trade costs can result in the cost of a vertically-integrated good being reduced considerably below the initial trade cost reduction.
An obvious precondition for the international unbundling production process
is that such international trade costs must be low enough to enable firms to utilize location advantages of countries arising from factor-price differences and economies-of-scale. A trade cost reduction may make it profitable for firms that previously concentrated all of their production stages in one country to move some stages of the production overseas. Firms that have already been internationally fragmenting their production are also likely to increase their flows of component trade when trade costs decline.
Several factors can result in reductions in trade costs, including: eliminating
trade and investment barriers; trade facilitation; deregulation; infrastructure improvements; technological advances in communications; transportation and logistics services; increased automation; and standardization of production technology.14 Except for technology factors, all of these factors can be influenced by policy and its implementation. The next section considers policy implications for countries that have been missed out on taking advantage of the IPN phenomenon in order to create a more IPN-attracting environment.
4. The way forward: Creation of IPN-attracting environments
To benefit from the opportunities for trade and employment expansion through the international fragmentation of production in IPNs, policymakers need to create IPN-attracting environments, which will require major reforms. The implications drawn from theoretical debates on policy reforms are discussed below.
13 Kimura and Ando (2005) termed the costs of coordinating production units over different locations as “service link costs”. Therefore, service link costs are a subcategory of trade cost in broad terms. 14 The rapid development in automation of production technology has allowed an increasing number of tasks to be standardized. These tasks can easily be offshored. An implication is that the development of automation and specialized software that allows workers to follow a set of routine procedures has been a driving force in IPN development (for example, in the automotive industry). Evidence supporting this argument is found in the changes in distribution of tasks performed in the United States. Since the 1970s, the share of routine tasks has been falling, while that of non-routine tasks has been rising (WTO, 2008).
17
(a) Promote comprehensive trade liberalization
Trade barriers – not only tariffs but also non-tariff barriers – are an important element of international trade costs. 15 Trade within IPNs is postulated as being relatively more sensitive to changes in trade barriers because it involves multiple cross-borders trading in parts and components. Tariffs have been progressively reduced globally, especially in most Asian countries, because of unilateral liberalization, multilateral commitments, and preferential trade agreements (PTAs). However, most trade barriers are in forms of non-tariff barriers (NTBs) that include quantitative restrictions, subsidies, anti-dumping and countervailing duties, customs valuations, standard and technical regulations.
The comprehensiveness of liberalization is highly important, because trade in
IPNs involves international trading in extensive areas, not only manufacturing (such as final and intermediate goods) but also agricultures (such as primary and intermediate inputs), and services (communications, finances and logistics, and other related services). In addition, tariff escalation in favour of domestic production in final goods should be avoided because it creates a bias against domestic manufacturers of parts and components.
At the national level, several approaches to trade liberalization are available:
(a) a regional approach to liberalization through PTAs; (b) multilateral liberalization through WTO; and (c) unilateral liberalization. In theory, the trade-stimulating effects of preferential trade liberalization would be high for trade of participants in IPNs, which require multiple border crossings in the trading of parts and components. However, in practice, the actual benefits of PTAs with regard to increasing the trade of participants in IPNs depends much on the nature of the rules of origin built into PTAs. Trade-distorting effects of rules of origin can be more detrimental to trade in IPNs than the conventional style of trade in which firms only trade in final goods because trade costs arising from the bureaucratic process of utilizing tariff preferences will be accumulated over multiple cross-border trading in parts and components at different stages of production. Moreover, maintaining trade barriers against non-members may distort the natural expansion of fragmentation trade across countries. In the policymaking context, it is difficult to define products giving tariff preferences because vertical specialization in IPNs may need a very fine level of product categorization.
Under multilateral liberalization, trade diversion is supposed to be
insignificant since the liberalization tends to cover almost all important trading
15 For more details on trade cost calculation, see the comprehensive ARTNeT trade cost database available at www.unescap.org/tid/artnet/trade-costs.asp.

18
partners in IPNs. Furthermore, transaction costs associated with multilateral liberalization are expected to be lower than those under preferential trade liberalization. However, the complexity of the nature of trade within IPNs has already gone beyond the current scope of multilateral trading rules designed under GATT/WTO. Doing business abroad and connecting international production facilities means that IPN-type trade barriers are now not only tariffs and other border measures, but also threaten tangible and intangible property rights, discriminatory treatment of foreign investment, restricted movement of capital, and anticompetitive practices. Currently, the multilateral system still lacks deeper disciplines in these regulatory measures.
Unilateral liberalization with comprehensive and deep coverage appears to
cause fewer distortions than other approaches to liberalization, ceteris paribus. The non-reciprocal approach of unilateral liberalization also makes the process associated with low transaction costs. Under this approach, a country also has full control over the pace and sequence of liberalization measures. On the other hand, because of the absence of reciprocity in the opening of market access, in reality it is the least favoured road to take.
(b) Combine trade and investment liberalization
Based on experience of East and South-East Asian countries, direct investment
by global producers is a necessary starting condition for developing countries to become integrated into the global value chain. Vertical (efficiency-seeking) FDI has been a major driver of the growth of IPNs. The type of FDI attracted by a country is mainly governed by the characteristics and policy environment of that country; for example, trade barriers and protection given to domestic producers will create incentives for market-seeking FDI rather than efficiency-seeking FDI. An open investment climate is more necessary for efficiency-seeking operations than for market-seeking operations, because efficiency-seeking MNCs rely not on economic rents created by protection but on profit margins, which are determined by the cost competitiveness of a vertically-integrated good. To establish an investment-friendly environment, restrictions on investment have to be relaxed in an effort to simplify investment procedures, remove investment bottlenecks on a national treatment basis, and capital and financial market openness to inward and outward investment flows.
(c) Spend on infrastructure improvement
Coordinating international production requires assurances of world-class
telecommunications and goods transportation as well as efficient financial services and customs clearance. These “infrastructure” services are necessary in order to facilitate international business transactions that are highly intensive in the IPN operations. In much the same way as trade barriers, the costs of those infrastructure services penalize goods produced in multiple stages across different countries,

19
because producers need to pay for moving goods at each stage of the production process. A reduction in costs and the time required for those services will therefore be beneficial to trade in IPNs.
Although investment in infrastructure and technological advancement has
played an important role in reducing costs and the time required for shipping and communications, infrastructure services are still state-monopolized in many developing countries. However, state monopolization results in distortions in trade and investment, and the often inefficient operation of the services providers.
Therefore, comprehensive policy reforms to promote trade and investment in
services are needed in order to minimize trade costs arising from inefficiency of service sectors. As pointed out by ESCAP (2011), FDI can play a key role in improving the efficiency of service sectors, especially infrastructure services which are characterized as capital- and technology-intensive. International service providers are a major source of capital, technology transfer and improved managerial skills for host developing economies.
20
References Abraham, K. G. and S. K. Taylor (1996). “Firms’ use of outside contractors: Theory
and evidence”, Journal of Labor Economics, vol. 14, No. 3; pp. 394-424.
Amador, J. and S. Cabral (2008). “Vertical specialization across the world: A relative measure”, Bank of Portugal Working Paper No. 10-2008.
Ando, M. and F. Kimura (2010). “The special patterns of production and distribution networks in East Asia”, in P. Athukorala (ed.), The Rise of Asia: Trade and Investment in Global Perspective; pp. 61-88. Routledge, London.
Antràs, P. and E. Rossi-Hansberg (2009) “Organizations and trade”, Annual Review of Economics, vol. 1; pp. 43-64.
Athukorala, P. (2008). “China’s integration into global production networks and its implications for export-led growth strategy in other countries in the region”, ANU working paper on trade and development, No. 2008/04. Australian National University, Canberra.
Athukorala, P. and N. Yamashita (2006). “Production fragmentation and trade integration: East Asia in a global context”, North American Journal of Economics and Finance, vol. 17, No. 4; pp. 233-256.
Baldwin, R. E. (2010). “21st century regionalism: Filling the gap between 21st century trade and 20th century trade rule”, presentation at WTO Workshop on New Era Preferential Trade Agreements, 3 November 2010, World Trade Organization, Geneva. Available from http://www.wto.org/english/res_e/reser_e/ersd201108_e.pdf
——— (2008). “Managing the Noodle Bowl: The fragility of East Asian Regionalism”, Singapore Economic Review, vol. 53, No. 3; pp. 449-478.
Baldwin, R. E. and F. Robert-Nicoud (2010). “Trade-in-goods and trade-in-tasks: An integrating framework, NBER Working Paper No. 15882. National Bureau of Economic Research, Cambridge, MA, United States.
Borrus, M., D. Ernst and S. Haggard (2000). International Production Networks in Asia: Rivalry or Riches? Routledge, London and New York.
Deardorff, A. (2001). “Fragmentation in simple trade models”, North American Journal of Economics and Finance, vol. 12; pp. 121-137.
Dixit, A. and G. M. Grossman (1982). “Trade and protection with multi-stage production’, Review of Economic Studies, vol. 49; pp. 583-594.
ESCAP (2011). Asia-Pacific Trade and Investment Report 2011. Economic and Social Commission for Asia and the Pacific, Bangkok.
Feenstra, R. C. (1998). “Integration of trade and disintegration of production in the global economy”, Journal of Economic Perspectives, vol. 14, No. 4; pp. 31-50.
Feenstra, R. C. and G. H. Hanson (1996a). ‘Globalization, outsourcing and wage inequality’, American Economic Review, vol. 86; pp. 240-245.
——— (1996b). “Foreign investment, outsourcing, and relative wages”, in R. C. Feenstra, G. M. Grossman and D. A. Irwin (eds.), The Political Economy of Trade Policy: Papers in Honor of Jagdish Bhagwati; pp. 89-127. London, and Cambridge, MA, United States.

21
Fujita, M., P. Krugman and A. J. Venables (1999). The Spatial Economy: Cities, Regions and International Trade. MIT Press, Cambridge, MA, United States.
Goh, K. S. (1993). “What causes fast economic growth?” Fourth K.T. Li Lecture, Harvard University, reproduced in L. Low (ed.), Wealth of East Asian Nations, Speeches and Writings by Goh Keng Swee; pp. 243-258 (1995). Federation Publications, Singapore.
Grossman, G. M. and E. H. Helpman (2005). “Outsourcing in global economy”, Review of Economic Studies, vol. 72; pp.135-160.
——— (2003). “Outsourcing versus FDI in industry equilibrium”, Journal of European Economic Association, vol. 1; pp.317-327.
——— (2002). “Integration versus outsourcing in industry equilibrium”, Quarterly Journal of Economics, vol. 117; pp. 85-119.
Grossman, G. M. and E. Rossi-Hansberg (2008). “Trading tasks: A simple theory of offshoring”, American Economic Review, vol. 98; pp. 1978-1997.
——— (forthcoming). “Task trade between similar countries”, Econometrica. Grunwald, J. and K. Flamm (1985). The Global Factory: Foreign Assembly in
International Trade. Brookings Institution, Washington, D.C. Helleiner, G. K. (1973). “Manufactured exports from less-developed countries and
multinational firms”, Economic Journal, vol. 83, No. 329; pp. 21-47. Helpman, E. H. (1984). “A simple theory of trade with multinational corporations”,
Journal of Political Economy, vol. 92; pp. 451-471. Helpman, E. H. and P. Krugman (1985). Market Structure and Foreign Trade. MIT
Press, Cambridge, MA, United States. Hiratsuka, D. (2010). “Characteristics and determinants of East Asia’s trade patterns”,
in D. Hiratsuka and Y. Uchida (eds.) (2010). Input Trade and Production Networks in East Asia, Institute of Developing Economies, Japan External Trade Organization, Chiba, Japan, and Edward Elgar Publishing, Cheltenham, United Kingdom and Northampton, MA, United States.
Hummels, D., J. Ishii and K-M Yi (2001). “The nature and growth of vertical specialization in world trade”, Journal of International Economics, vol. 54, No. 1; pp. 75-96.
Ishii, J. and K-M Yi (1997). “The growth of world trade”, Research Paper No. 9718, Federal Reserve Bank of New York.
Jones, R. W. (2000). Globalization and the Theory of Input Trade. MIT Press, London, and Cambridge, MA, United States.
Jones, R. W. and H. Kierzkowski (2001). “Globalization and the consequences of international fragmentation”, in R. Dornbusch, G. Calvo and M. Obsfeld (eds.), Money, Factor Mobility and Trade: The Festschrift in Honor of Robert A. Mundell. MIT Press, Cambridge, MA, United States.
Kimura, F. (2006). “International production and distribution networks in East Asia: 18 facts, mechanics, and policy implications”, vol. 1, No.1; pp. 346-347.
22
Kimura, F. and M. Ando (2005). “Two-dimensional fragmentation in East Asia: Conceptual framework and empirics”, International Review of Economics & Finance, vol. 14, No. 3; pp. 317-348.
Krugman, P. and A. J. Venables (1995). “Globalization and the inequality of nations”, Quarterly Journal of Economics, vol. 110, No. 4; pp. 857-880.
Legewie, J. (1999a). “Manufacturing strategies for Southeast Asia after the crisis: European, US and Japanese firms”, Business Strategy Review, vol. 10; pp. 55-64.
——— (1999b). “Driving regional integration: Japanese firms and the development of the ASEAN automobile industry”, Working Paper No. 99/1, Philipp Franz von Siebold Stiftung, German Institute for Japanese Studies, Tokyo.
Markusen, J. R. (2005). “Modelling the offshoring of white-collar services: From comparative advantage to the new theories of trade and FDI”, NBER Working Paper No. 11827. National Bureau of Economic Research, Cambridge, MA, United States.
——— (2002). Multinational Firms and the Theory of International Trade. MIT Press, London.
——— (1998). “Multinational firms, location and trade”, The World Economy, vol. 21, No. 6; pp. 733-756.
——— (1995). “The boundaries of multinational firms and the theory of international trade”, Journal of Economic Perspectives, vol. 9; pp. 169-189.
McKendrick, D. G., R. F. Doner and S. Haggard (2000). From Silicon Valley to Singapore: Location and Competitive Advantage in the Hard Disk Drive industry. Stanford University Press, Stanford, California.
Rangan, S. and R. Z. Lawrence (1999). A Prism on Globalization. Brookings Institution, Washington, D.C.
Venables, A. J. (1996). “Equilibrium locations of vertically linked industries”, International Economic Review, vol. 37; pp. 341-335.
WTO (2008). “Trade, the location of production and the industrial organization of firms”, World Trade Report 2008 – Trade in a Globalizing World. Geneva.
Yi, K-M (2003). “Can vertical specialization explain the growth of world trade?” Journal of Political Economy, vol. 111; pp. 52-102.

143
Appendices

144
List of Appendix tables
Appendix I Lists of parts and components (based on the 5-digit SITC Revision 3)………145
Appendix II India’s trade of top 10 items of manufacturing parts and components, 1994 2008…………………………………………………………………………….....156
Appendix III Overview of India’s preferential trade agreement, 2011 ........................161

145
App
endi
x I
Li
sts o
f par
ts a
nd c
ompo
nent
s (ba
sed
on th
e 5-
digi
t SIT
C R
evisi
on 3
) C
omm
odity
cod
e D
escr
iptio
n 71
191
Parts
for b
oile
rs o
f sub
grou
p 71
11
7119
2 Pa
rts fo
r app
arat
us a
nd a
pplia
nces
of s
ubgr
oup
7112
7128
Pa
rts fo
r tur
bine
s of s
ubgr
oup
7121
71
311
Spar
k-ig
nitio
n re
cipr
ocat
ing
or ro
tary
inte
rnal
com
bust
ion
pist
on e
ngin
es fo
r airc
raft
7131
9 Pa
rts, n
.e.s.
, of a
ircra
ft en
gine
s of h
eadi
ng 7
1311
7132
1 Re
cipr
ocat
ing
pist
on e
ngin
es o
f a c
ylin
der c
apac
ity n
ot e
xcee
ding
1,0
00 c
c
7132
2 Re
cipr
ocat
ing
pist
on e
ngin
es o
f a c
ylin
der c
apac
ity n
ot e
xcee
ding
1,0
00 c
c
7132
3 C
ompr
essi
on-ig
nitio
n en
gine
s (di
esel
or s
emi-d
iese
l eng
ines
)
7133
2 O
ther
spar
k-ig
nitio
n re
cipr
ocat
ing
or ro
tary
eng
ines
7133
3 C
ompr
essi
on-ig
nitio
n en
gine
s (di
esel
or s
emi-d
iese
l eng
ines
)
7139
1 Pa
rts, n
.e.s.
, sui
tabl
e fo
r use
sole
ly o
r prin
cipa
lly w
ith sp
ark-
igni
tion
inte
rnal
com
bust
ion
pist
on e
ngin
es
7139
2 Pa
rts, n
.e.s.
, sui
tabl
e fo
r use
sole
ly o
r prin
cipa
lly w
ith c
ompr
essi
on-ig
nitio
n in
tern
al c
ombu
stio
n pi
ston
eng
ines
7144
1 Tu
rboj
ets
7144
9 O
ther
than
turb
ojet
s 71
481
Turb
o pr
opel
lers
71
489
Oth
er g
as tu
rbin
es
7149
1 Pa
rts fo
r tur
boje
ts o
r tur
bo p
rope
llers
71
499
Parts
for g
as tu
rbin
es, n
.e.s.
71
69
Parts
, n.e
.s., s
uita
ble
for u
se so
lely
or p
rinci
pally
with
the
mac
hine
s fal
ling
with
in g
roup
718
93
7181
9 Pa
rts, i
nclu
ding
regu
lato
rs, o
f hyd
raul
ic tu
rbin
es a
nd w
ater
/whe
els
7187
8 Pa
rts o
f nuc
lear
reac
tors
146
7189
9 Pa
rts o
f eng
ines
and
mot
ors o
f hea
ding
s 714
49,7
1819
1,71
892
and
7189
3 71
219
Parts
of t
he m
achi
nery
of s
ubgr
oup
7221
72
129
Parts
of t
he m
achi
nery
of s
ubgr
oup
7221
thro
ugh
7212
6 72
139
Parts
for m
ilkin
g m
achi
nes a
nd d
airy
mac
hine
ry
7219
8 Pa
rts o
f mac
hine
ry o
f hea
ding
721
91
7219
9 Pa
rts o
f mac
hine
ry a
nd a
pplia
nces
of h
eadi
ng 7
2195
and
721
96
7239
2 Bu
lldoz
er o
r ang
le d
ozer
bla
des
7239
3 Pa
rts fo
r bor
ing
or si
nkin
g m
achi
nery
72
399
Pa
rts n
.e.s.
, of c
ivil
engi
neer
ing
etc.
mac
hine
ry, i
nclu
ding
min
ing
and
publ
ic w
orks
mac
hine
ry P
arts
(hea
ding
723
) and
cra
nes e
tc.
(hea
ding
744
.3)
7243
9 Pa
rts o
f the
mac
hine
s and
furn
iture
subg
roup
724
3
7244
9 Pa
rts a
nd a
cces
sorie
s of t
extil
e m
achi
nery
des
igne
d fo
r use
in th
e pr
epar
atio
n an
d pr
oduc
tion
of te
xtile
fibr
es a
nd y
arns
7246
1 A
uxili
ary
mac
hine
ry fo
r mac
hine
s of h
eadi
ngs 7
2441
, 724
42, 7
2243
, 724
51, 7
2452
and
724
53
7246
7 Pa
rts a
nd a
cces
sorie
s of w
eavi
ng m
achi
nes (
loom
s) o
f hea
ding
724
51 o
r of t
heir
auxi
liary
mac
hine
ry
7246
8 Pa
rts a
nd a
cces
sorie
s of k
nitti
ng a
nd st
itch-
bond
ing
mac
hine
s, tu
lle, l
ace,
em
broi
dery
, net
etc
. mac
hine
s or t
heir
auxi
liary
mac
hine
s
7248
8 Pa
rts fo
r mac
hine
ry o
f sub
grou
p 72
48
7249
1 Pa
rts fo
r mac
hine
ry o
f sub
grou
ps 7
247
and
7751
7249
2 Pa
rts fo
r mac
hine
ry o
f sub
grou
ps 7
247
and
7751
for t
he m
achi
nes o
f hea
ding
s 724
72, 7
2473
, 724
74, 7
7512
7259
1 Pa
rts fo
r mac
hine
ry o
f sub
grou
p 72
51
7259
9 Pa
rts fo
r mac
hine
ry o
f sub
grou
p 72
52
7263
5 Pr
intin
g ty
pe, b
lock
s, pl
ates
, cyl
inde
rs a
nd o
ther
prin
ting
com
pone
nts
7268
9 Pa
rts fo
r boo
kbin
ding
mac
hine
ry
7269
1
Parts
for m
achi
nes o
f hea
ding
726
.31
and
subg
roup
s 726
.5 a
nd 7
26.6
for t
he m
achi
nes o
f he
adin
g 72
6.31
7269
9 Pa
rts fo
r mac
hine
s of h
eadi
ng 7
26.1
and
subg
roup
s 726
5 an
d 72
66
7271
9 Pa
rts fo
r mac
hine
s of h
eadi
ngs 7
2127
and
727
11
7272
9 Pa
rts fo
r the
mac
hine
ry, n
.e.s.
for t
he in
dustr
ial p
repa
ratio
n or
man
ufac
ture
of f
ood
or d
rink

147
7281
9
Parts
and
acc
esso
ries s
uita
ble
for u
se so
lely
or p
rinci
pally
with
mac
hine
tool
s of s
ubgr
oup
7281
72
839
Pa
rts o
f mac
hine
ry fo
r sor
ting,
was
hing
, cru
shin
g or
mix
ing
earth
, sto
ne, o
res e
tc.,
and
for s
hapi
ng so
lid m
iner
al fu
els,
cera
mic
pas
tes
etc.
72
851
Parts
for m
achi
nes o
f hea
ding
728
41
7285
2 Pa
rts o
f mac
hine
ry fo
r wor
king
rubb
er o
r pla
stic
s or m
anuf
actu
ring
prod
ucts
mad
e fr
om ru
bber
or p
lasti
cs, n
.e.s.
7285
3 Pa
rts fo
r mac
hine
s of h
eadi
ng 7
2843
7285
5
Parts
, n.e
.s., o
f mac
hine
ry fo
r pub
lic w
orks
etc
., pr
epar
ing
anim
al o
r fix
ed v
eget
able
fats
and
oils
, and
spec
ializ
ed fo
r par
ticul
ar
indu
strie
s n.e
.s.
7351
1
Tool
hol
ders
and
self-
open
ing
die-
head
s
7351
3 W
ork
hold
ers
7351
5 D
ivid
ing
head
s and
oth
er sp
ecia
l atta
chm
ents
for m
achi
ne to
ols
7359
1
Parts
, n.e
.s., a
nd a
cces
sorie
s sui
tabl
e so
lely
or p
rinci
pally
for u
se w
ith m
etal
wor
king
mac
hine
tool
s wor
king
by
rem
ovin
g m
etal
or o
ther
m
ater
ial
7359
5 Pa
rts a
nd a
cces
sorie
s sui
tabl
e fo
r use
sole
ly o
r prin
cipa
lly in
mac
hine
s of g
roup
731
for m
achi
nes o
f gro
up 7
33
7371
9 Fo
undr
y m
achi
ne p
arts
73
729
Rol
ls a
nd o
ther
Par
ts fo
r met
al-r
ollin
g m
ills
7373
9
Parts
for m
achi
nes a
nd a
ppar
atus
of s
ubgr
oup
7373
73
749
Pa
rts fo
r mac
hine
ry a
nd a
ppar
atus
of s
ubgr
oup
7374
74
128
Pa
rts fo
r bur
ners
and
oth
er a
rticl
es o
f sub
grou
p 74
12
7413
5 Pa
rts fo
r the
equ
ipm
ent o
f hea
ding
s 741
31 th
roug
h 74
134
7413
9 Pa
rts fo
r fur
nace
s and
ove
ns o
f hea
ding
s 741
36 th
roug
h 74
138
7414
9 Pa
rts o
f ref
riger
ator
s, fre
ezer
s and
oth
er re
frig
erat
ing
or fr
eezi
ng e
quip
men
t (el
ectri
c or
oth
er)
7415
9
Parts
for a
ir-co
nditi
onin
g m
achi
nes (
havi
ng a
mot
or-d
riven
fan
and
elem
ents
for c
hang
ing
the
tem
pera
ture
and
hum
idity
) of h
eadi
ng
7415
74
172
Pa
rts fo
r gen
erat
ors o
f hea
ding
741
71
7419
Pa
rts, n
.e.s.
, for
mac
hine
ry o
f hea
ding
s 741
73 th
roug
h 74
189
7429
1 Pa
rts o
f pum
ps fo
r liq
uids
74
295
Parts
of t
he p
umps
and
liqu
id e
leva
tors
of g
roup
742
, of l
iqui
d el
evat
ors

148
7438
Pa
rts fo
r pum
ps, c
ompr
esso
rs, f
ans a
nd h
oods
of s
ubgr
oups
743
1 an
d 74
34
7439
1
Parts
of m
achi
nes a
nd a
ppar
atus
of s
ubgr
oups
743
5 an
d 74
36 o
f cen
trifu
ges (
incl
udin
g ce
ntrif
ugal
drie
rs)
7439
5 Pa
rts o
f filt
erin
g or
pur
ifyin
g m
achi
nery
and
app
arat
us
7441
9 Pa
rts o
f tru
cks a
nd tr
acto
rs o
f hea
ding
s 744
14 a
nd 7
4415
74
491
Parts
suita
ble
for u
se in
mac
hine
ry o
f sub
grou
ps 7
442
and
7444
74
492
Parts
suita
ble
for u
se in
mac
hine
ry o
f hea
ding
s 744
.1, 7
4412
and
744
13
7449
3 Pa
rts su
itabl
e fo
r use
in li
fts, s
kip
hois
ts o
r esc
alat
ors
7449
4 Pa
rts fo
r lift
ing,
han
dlin
g, lo
adin
g or
unl
oadi
ng m
achi
nery
, n.e
.s.
7451
9 Pa
rts o
f too
ls o
f sub
grou
p 74
51
7452
9 Pa
rts o
f mac
hine
ry o
f sub
grou
p 74
52 a
nd h
eadi
ng 7
753
7453
9 W
eigh
ing-
mac
hine
wei
ghts
of a
ll ki
nds;
Parts
of t
he w
eigh
ing
mac
hine
ry o
f sub
grou
p 74
53
7456
8
Parts
of a
pplia
nces
of s
ubgr
oup
7456
7459
3 cy
linde
rs a
nd o
ther
Par
ts fo
r mac
hine
s of h
eadi
ng 7
4591
74
597
Parts
for a
utom
atic
goo
ds-v
endi
ng m
achi
nes (
post
age
stam
ps, c
igar
ette
s, fo
od e
tc.)
7461
Ba
ll-be
arin
gs
7462
Ta
pere
d ro
ller b
earin
gs (i
nclu
ding
con
e an
d ta
pere
d ro
ller a
ssem
blie
s)
7463
Sp
heric
al ro
ller b
earin
gs
7464
N
eedl
e ro
ller b
earin
gs
7465
O
ther
cyl
indr
ical
rolle
r bea
rings
74
68
Oth
er b
all-
or ro
ller b
earin
gs (i
nclu
ding
com
bine
d ba
ll-/ro
ller b
earin
gs)
7469
1 Ba
lls, n
eedl
es a
nd ro
llers
74
699
Parts
of b
all a
nd ro
ller b
earin
gs, n
.e.s.
74
71
Pres
sure
-red
ucin
g va
lves
74
72
Val
ves f
or o
leo-
hydr
aulic
or p
neum
atic
tran
smis
sion
s 74
73
C
heck
-val
ves
7474
Sa
fety
or r
elie
f val
ves
7478
Ta
ps, c
ocks
, val
ves a
nd si
mila
r app
lianc
es, n
.e.s.

149
7479
Pa
rts fo
r the
app
lianc
es o
f gro
up 7
47
7481
Tran
smis
sion
shaf
ts (i
nclu
ding
cam
shaf
ts a
nd c
rank
shaf
ts) a
nd c
rank
s 74
821
Bear
ing
hous
ings
, inc
orpo
ratin
g ba
ll- o
r rol
ler b
earin
gs
7482
2 Be
arin
g ho
usin
gs, n
ot in
corp
orat
ing
ball-
or r
olle
r bea
rings
; pla
in sh
aft b
earin
gs
7483
9 Pa
rts o
f arti
cula
ted
link
chai
n
7484
G
ears
and
gea
ring
and
othe
r tra
nsm
issi
on e
lem
ents
pre
sent
ed se
para
tely
) 74
85
Flyw
heel
s and
pul
leys
(inc
ludi
ng p
ulle
y bl
ocks
) 74
86
Clu
tche
s and
shaf
t cou
plin
gs (i
nclu
ding
uni
vers
al jo
ints
) 74
89
Parts
, n.e
.s., f
or a
rticl
es o
f gro
up 7
48
7492
G
aske
ts a
nd si
mila
r joi
nts o
f met
al sh
eetin
g co
mbi
ned
with
oth
er m
ater
ials
7499
1 Sh
ips’
or b
oats
’ pro
pelle
rs a
nd b
lade
s
7499
9 M
achi
nery
Par
ts, n
ot c
onta
inin
g el
ectri
cal c
onne
ctor
s, in
sula
tors
, coi
ls, c
onta
cts o
r oth
er e
lect
rical
feat
ures
, n.e
.s.
7591
Pa
rts a
nd a
cces
sorie
s of p
hoto
copy
ing
and
ther
mo-
copy
ing
appa
ratu
s of s
ubgr
oup
7513
7599
1
Parts
and
acc
esso
ries f
or m
achi
nes o
f sub
grou
p 75
11
7599
3
Parts
and
acc
esso
ries f
or m
achi
nes o
f sub
grou
p 75
19
7599
5
Parts
of c
alcu
latin
g m
achi
nes,
acco
untin
g m
achi
nes,
cash
regi
ster
s. po
stag
e-fra
nkin
g m
achi
nes a
nd si
mila
r mac
hine
s inc
orpo
ratin
g a
calc
ulat
ing
devi
ce
7599
7
Parts
of a
utom
atic
dat
a pr
oces
sing
mac
hine
s and
uni
ts th
ereo
f, m
agne
tic o
r opt
ical
read
ers,
and
mac
hine
s for
tran
scrib
ing
and
proc
essi
ng d
ata,
n.e
.s.
7621
1
Radi
o br
oadc
ast r
ecei
vers
, inc
orpo
ratin
g so
und-
reco
rdin
g or
repr
oduc
ing
appa
ratu
s
7621
2 Ra
dio
broa
dcas
t rec
eive
rs, n
ot in
corp
orat
ing
soun
d-re
cord
ing
or re
prod
ucin
g ap
para
tus
7649
1 Pa
rts o
f ele
ctric
al a
ppar
atus
for l
ine
tele
phon
y or
line
tele
grap
hy (i
nclu
ding
app
arat
us fo
r car
rier-
curr
ent l
ine
syst
ems)
76
492
Pa
rts o
f mic
roph
ones
, lou
dspe
aker
s, he
adph
ones
, ear
phon
es a
nd c
ombi
ned
mic
roph
one/
spea
ker s
ets;
aud
io-fr
eque
ncy
elec
tric
ampl
ifier
s et
c.
7649
3
Parts
of t
elev
isio
n re
ceiv
ers,
radi
o br
oadc
ast r
ecei
vers
, tra
nsm
issi
on a
ppar
atus
for r
adio
tele
phon
y, te
legr
aphy
, bro
adca
stin
g or
te
levi
sion
etc
. 76
499
Parts
of a
ppar
atus
for s
ound
reco
rder
s or r
epro
duce
rs a
nd p
arts
of t
elev
isio
n im
age
and
soun
d re
cord
ers o
r rep
rodu
cers

150
7712
9 Pa
rts o
f ele
ctric
pow
er m
achi
nery
(oth
er th
an ro
tatin
g el
ectri
c po
wer
gen
erat
ing
mac
hine
ry a
nd e
quip
men
t), a
nd p
arts
ther
eof
7722
Pr
inte
d ci
rcui
ts
7723
1 Fi
xed
carb
on re
sist
ors,
com
posi
tion-
or f
ilm-ty
pe
7723
2 O
ther
fixe
d re
sist
ors
7723
3
Wire
-wou
nd v
aria
ble
resi
stor
s (in
clud
ing
rheo
stat
s and
pot
entio
met
ers)
7723
5 O
ther
var
iabl
e re
sist
ors (
incl
udin
g rh
eost
ats a
nd p
oten
tiom
eter
s)
7723
8 Pa
rts fo
r ele
ctric
al re
sist
ors o
f sub
grou
p 77
23
7724
1
Fuse
s
7724
2 A
utom
atic
circ
uit-b
reak
ers f
or v
olta
ges o
f les
s tha
n 72
.5 k
v
7724
3
Oth
er a
utom
atic
circ
uit-b
reak
ers
7724
4 Is
olat
ing
switc
hes a
nd m
ake-
and-
brea
k sw
itche
s
7724
5 Li
ghtn
ing
arre
ster
s, vo
ltage
lim
iters
and
surg
e su
ppre
ssor
s for
vol
tage
s exc
eedi
ng 1
,000
vol
ts
7724
9
Elec
trica
l app
arat
us fo
r sw
itchi
ng o
r pro
tect
ing
elec
trica
l circ
uits
, or m
akin
g co
nnec
tions
to o
r in
elec
trica
l circ
uits
, n.e
.s., e
xcee
ding
1,
000
volts
77
251
Fu
ses
7725
2 A
utom
atic
circ
uit-b
reak
ers f
or a
vol
tage
not
exc
eedi
ng 1
,000
vol
ts
7725
3 A
ppar
atus
for p
rote
ctin
g el
ectri
cal c
ircui
ts, n
.e.s.
, not
exc
eedi
ng 1
,000
vol
ts 77
254
Rela
ys
7725
5
Oth
er sw
itche
s
7725
7 La
mp-
hold
ers
7725
8 Pl
ugs a
nd so
cket
s 77
259
El
ectri
cal a
ppar
atus
for s
witc
hing
or p
rote
ctin
g el
ectri
cal c
ircui
ts o
r mak
ing
conn
ectio
ns to
or i
n el
ectri
cal c
ircui
ts, n
.e.s.
, not
exc
eedi
ng
1,00
0 v
7726
1
Switc
hboa
rds e
tc <
1000
v 77
262
Switc
hboa
rds e
tc >
1000
v
7728
1 Sw
itchb
oard
s etc
une
quip

151
7728
2 Sw
itchg
ear p
arts
nes
7731
2
Co-
axia
l cab
les a
nd o
ther
co-
axia
l con
duct
ors
7731
3
Igni
tion
wiri
ng se
ts an
d ot
her w
iring
sets
of a
type
use
d in
veh
icle
s, ai
rcra
ft or
ship
s
7732
2
Elec
trica
l ins
ulat
ors o
f gla
ss
7732
3 El
ectri
cal i
nsul
ator
s of c
eram
ics
7732
4 El
ectri
cal i
nsul
ator
s of m
ater
ials
oth
er th
an g
lass
or c
eram
ics
7742
3
X-r
ay tu
bes
7742
9
Elec
tro-d
iagn
ostic
app
arat
us fo
r med
ical
, sur
gica
l, de
ntal
or v
eter
inar
y sc
ienc
es a
nd ra
diol
ogic
al a
ppar
atus
, n.e
.s., i
nclu
ding
par
ts an
d ac
cess
orie
s
7754
9
Parts
of h
air c
lippe
rs
7757
9 Pa
rts o
f foo
d gr
inde
rs a
nd m
ixer
s (fru
it or
veg
etab
le ju
ice
extra
ctor
s)
7758
9 Pa
rts o
f ele
ctro
-ther
mic
app
lianc
es o
f sub
grou
p 77
58
7761
1 Te
levi
sion
pic
ture
tube
s, co
lour
77
612
Tele
visi
on p
ictu
re tu
bes,
blac
k an
d w
hite
or o
ther
mon
ochr
ome
7762
1 Te
levi
sion
cam
era
tube
s; im
age
conv
erte
rs a
nd in
tens
ifier
s; o
ther
pho
toca
thod
e tu
bes
7762
3 O
ther
cat
hode
-ray
tube
s 77
625
Mic
row
ave
tube
s (ex
clud
ing
grid
-con
trolle
d tu
bes)
77
627
O
ther
val
ves a
nd tu
bes
7762
9 Pa
rts o
f the
tube
s and
val
ves o
f sub
grou
ps 7
761
and
7762
77
631
D
iode
s, ot
her t
han
phot
osen
sitiv
e or
ligh
t-em
ittin
g di
odes
77
632
Tran
sisto
rs (e
xclu
ding
pho
tose
nsiti
ve tr
ansi
stor
s) w
ith a
dis
sipat
ion
rate
of l
ess t
han
one
wat
t 77
633
Tran
sisto
rs (e
xclu
ding
pho
tose
nsiti
ve tr
ansi
stor
s) w
ith a
dis
sipat
ion
rate
of o
ne w
att o
r mor
e 77
635
Thyr
isto
rs, d
iacs
and
tria
cs (e
xclu
ding
pho
tose
nsiti
ve d
evic
es)
7763
7 Ph
otos
ensi
tive
sem
icon
duct
or d
evic
es; l
ight
em
ittin
g di
odes
77
639
Oth
er se
mic
ondu
ctor
dev
ices
77
641
Dig
ital m
onol
ithic
inte
grat
ed u
nits
77
643
Non
-dig
ital m
onol
ithic
inte
grat
ed u
nits

152
7764
5 H
ybrid
inte
grat
ed c
ircui
ts
7764
9 El
ectro
nic
inte
grat
ed c
ircui
ts a
nd m
icro
-ass
embl
ies,
n.e.
s.
7768
1
Piez
oele
ctric
cry
stal
s, m
ount
ed
7768
8
Pa
rts o
f the
dev
ices
of s
ubgr
oup
7763
and
of t
he m
ount
ed p
iezo
elec
tric
crys
tals
of i
tem
77
681
7768
9 Pa
rts o
f ele
ctro
nic
inte
grat
ed c
ircui
ts an
d m
icro
-ass
embl
ies
7781
1 Pr
imar
y ce
lls a
nd p
rimar
y ba
tterie
s 77
812
Elec
tric
accu
mul
ator
s (st
orag
e ba
tterie
s)
7781
7 Pa
rts o
f prim
ary
cells
and
prim
ary
batte
ries
7781
9 Pa
rts o
f ele
ctric
acc
umul
ator
s 77
822
Dis
char
ge la
mps
(oth
er th
an u
ltrav
iole
t lam
ps)
7782
3
Seal
ed-b
eam
lam
p un
its
7782
4
Ultr
avio
let o
r inf
rare
d la
mps
; arc
lam
ps
7782
9 Pa
rts o
f ele
ctric
fila
men
ts or
dis
char
ge la
mps
77
831
El
ectri
cal i
gniti
on o
r sta
rting
equ
ipm
ent u
sed
for s
park
-igni
tion
or c
ompr
essi
on-ig
nitio
n
inte
rnal
com
bust
ion
engi
nes
7783
3
Parts
of e
lect
rical
igni
tion
or st
artin
g eq
uipm
ent f
or in
tern
al c
ombu
stio
n en
gine
s; pa
rts o
f gen
erat
ors a
nd c
ut-o
uts u
sed
with
such
en
gine
s
7783
4
El
ectri
cal l
ight
ing
or si
gnal
ling
equi
pmen
t, w
inds
cree
n w
iper
s etc
., us
ed fo
r cyc
les
or m
otor
veh
icle
s
7783
5
Parts
of e
quip
men
t of h
eadi
ng 7
7834
7784
8
Han
d el
ec-m
ech
tool
par
t
7786
9 Pa
rts o
f ele
ctric
al c
apac
itors
7787
9 Pa
rts e
l equ
ip o
f 778
7
7788
3
Parts
of t
he e
quip
men
t of h
eadi
ng 7
7882
7788
5 Pa
rts o
f ele
ctric
soun
d or
vis
ual s
igna
ling
appa
ratu
s, n.
e.s.
(incl
udin
g pa
rts o
f ind
icat
or p
anel
s, bu
rgla
r and
fire
ala
rms)
7788
6
Car
bon
elec
trode
s, ca
rbon
bru
shes
, lam
p ca
rbon
s, ba
ttery
car
bons
and
oth
er c
arbo
n ar
ticle
s
7788
9 El
ectri
cal p
arts
of m
achi
nery
or a
ppar
atus
, n.e
.s.
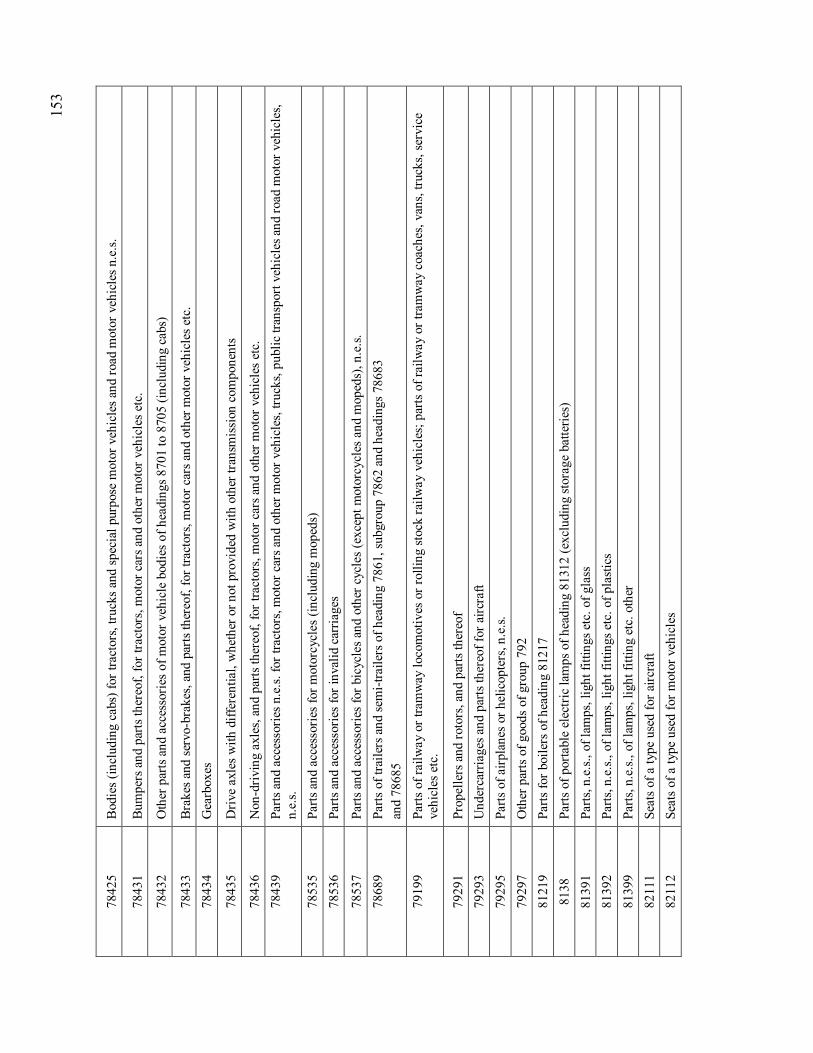
153
7842
5 B
odie
s (in
clud
ing
cabs
) for
trac
tors
, tru
cks a
nd sp
ecia
l pur
pose
mot
or v
ehic
les a
nd ro
ad m
otor
veh
icle
s n.e
.s.
7843
1 Bu
mpe
rs a
nd p
arts
ther
eof,
for t
ract
ors,
mot
or c
ars a
nd o
ther
mot
or v
ehic
les e
tc.
7843
2 O
ther
par
ts a
nd a
cces
sorie
s of m
otor
veh
icle
bod
ies o
f hea
ding
s 870
1 to
870
5 (in
clud
ing
cabs
)
7843
3 Br
akes
and
serv
o-br
akes
, and
par
ts th
ereo
f, fo
r tra
ctor
s, m
otor
car
s and
oth
er m
otor
veh
icle
s etc
. 78
434
Gea
rbox
es
7843
5
Driv
e ax
les w
ith d
iffer
entia
l, w
heth
er o
r not
pro
vide
d w
ith o
ther
tran
smis
sion
com
pone
nts
7843
6 N
on-d
rivin
g ax
les,
and
parts
ther
eof,
for t
ract
ors,
mot
or c
ars a
nd o
ther
mot
or v
ehic
les e
tc.
7843
9
Parts
and
acc
esso
ries n
.e.s.
for t
ract
ors,
mot
or c
ars a
nd o
ther
mot
or v
ehic
les,
truck
s, pu
blic
tran
spor
t veh
icle
s and
road
mot
or v
ehic
les,
n.e.
s. 78
535
Parts
and
acc
esso
ries f
or m
otor
cycl
es (i
nclu
ding
mop
eds)
78
536
Parts
and
acc
esso
ries f
or in
valid
car
riage
s
7853
7 Pa
rts a
nd a
cces
sorie
s for
bic
ycle
s and
oth
er c
ycle
s (ex
cept
mot
orcy
cles
and
mop
eds)
, n.e
.s.
7868
9
Parts
of t
raile
rs a
nd se
mi-t
raile
rs o
f hea
ding
786
1, su
bgro
up 7
862
and
head
ings
786
83
and
7868
5 79
199
Pa
rts o
f rai
lway
or t
ram
way
loco
mot
ives
or r
ollin
g st
ock
railw
ay v
ehic
les;
par
ts o
f rai
lway
or t
ram
way
coa
ches
, van
s, tru
cks,
serv
ice
vehi
cles
etc
.
7929
1
Prop
elle
rs a
nd ro
tors
, and
par
ts th
ereo
f 79
293
Und
erca
rria
ges a
nd p
arts
ther
eof f
or a
ircra
ft 79
295
Parts
of a
irpla
nes o
r hel
icop
ters
, n.e
.s.
7929
7 O
ther
par
ts o
f goo
ds o
f gro
up 7
92
8121
9
Parts
for b
oile
rs o
f hea
ding
812
17
8138
Pa
rts o
f por
tabl
e el
ectri
c la
mps
of h
eadi
ng 8
1312
(exc
ludi
ng st
orag
e ba
tterie
s)
8139
1 Pa
rts, n
.e.s.
, of l
amps
, lig
ht fi
tting
s etc
. of g
lass
81
392
Parts
, n.e
.s., o
f lam
ps, l
ight
fitti
ngs e
tc. o
f pla
stics
81
399
Pa
rts, n
.e.s.
, of l
amps
, lig
ht fi
tting
etc
. oth
er
8211
1
Seat
s of a
type
use
d fo
r airc
raft
8211
2
Seat
s of a
type
use
d fo
r mot
or v
ehic
les

154
8211
9
Parts
of s
eats
of s
ubgr
oup
8211
84
848
H
eadb
ands
, lin
ings
, cov
ers,
hat f
ound
atio
ns, h
at fr
ames
, pea
ks a
nd c
hin-
traps
, for
hea
dgea
r 87
119
Bino
c/te
lesc
ope
part/
acc
8713
9 El
ectro
n/et
c di
ffr p
arts
87
149
M
icro
scop
es p
arts
/acc
ess
8719
9 Pa
rts a
nd a
cces
sorie
s of l
iqui
d cr
ysta
l dev
ices
, n.e
.s., l
aser
s (ot
her t
han
lase
r dio
des)
, and
oth
er o
ptic
al a
pplia
nces
and
instr
umen
ts, n
.e.s.
87
319
Pa
rts a
nd a
cces
sorie
s of g
as, l
iqui
d or
ele
ctric
ity m
eter
s
8732
9 Pa
rts a
nd a
cces
sorie
s of r
evol
utio
n an
d pr
oduc
tion
coun
ters
, odo
met
ers,
pedo
met
ers,
spee
dom
eter
s, ta
chom
eter
s, str
obos
cope
s etc
.
8741
2
Pa
rts a
nd a
cces
sorie
s of n
avig
atio
nal i
nstru
men
ts an
d ap
plia
nces
8741
4
Pa
rts a
nd a
cces
sorie
s for
arti
cles
of h
eadi
ng 8
7413
87
424
Parts
and
acc
esso
ries f
or a
rticl
es o
f hea
ding
s 874
22 a
nd 8
7423
87
426
Pa
rts a
nd a
cces
sorie
s for
arti
cles
of h
eadi
ng 8
7425
8743
9
Flui
d in
strum
par
ts/a
cc
8745
4
Pa
rts a
nd a
cces
sorie
s for
mac
hine
s and
app
lianc
es o
f hea
ding
874
53
8745
6
Parts
and
acc
esso
ries f
or in
strum
ents
of h
eadi
ng 8
7455
87
469
Parts
and
acc
esso
ries f
or a
utom
atic
regu
latin
g or
con
trolli
ng in
strum
ents
, and
app
arat
us
8747
9 Pa
rts a
nd a
cces
sorie
s for
instr
umen
ts a
nd a
ppar
atus
of s
ubgr
oup
8747
8749
Pa
rts a
nd a
cces
sorie
s for
mac
hine
s, ap
plia
nces
, ins
trum
ents
and
app
arat
us, n
.e.s.
8811
2
Fl
ash
bulb
s, fla
sh-c
ubes
and
the
like
8811
3 Ph
otog
raph
ic fl
ashl
ight
app
arat
us (o
ther
than
the
disc
harg
e la
mps
of s
ubgr
oup
7782
)
8811
4 Pa
rts a
nd a
cces
sorie
s for
the
phot
ogra
phic
cam
eras
of h
eadi
ng 8
8111
8811
5
Parts
and
acc
esso
ries f
or p
hoto
grap
hic
flash
light
app
arat
us
8812
3 Pa
rts a
nd a
cces
sorie
s for
the
cine
mat
ogra
phic
cam
eras
of h
eadi
ng 8
2121
8812
4
Parts
and
acc
esso
ries f
or c
inem
atog
raph
ic p
roje
ctor
s
8813
4 Pa
rts a
nd a
cces
sorie
s for
the
equi
pmen
t of h
eadi
ngs 8
8131
thro
ugh
8813
3
8813
6
Parts
and
acc
esso
ries f
or th
e ap
para
tus a
nd e
quip
men
t of h
eadi
ng 8
8135

155
8842
2
Parts
for f
ram
es a
nd m
ount
ings
of s
pect
acle
s, go
ggle
s or t
he li
ke
8843
1
Obj
ectiv
e le
nses
for c
amer
as, p
roje
ctor
s or p
hoto
grap
hic
enla
rger
s or r
educ
ers
8843
2
Oth
er o
bjec
tive
lens
es
8843
3 Fi
lters
8843
9 M
ount
ed o
ptic
al e
lem
ents
, n.e
.s.
8857
1
Instr
umen
t pan
el c
lock
s and
clo
cks o
f a si
mila
r typ
e, fo
r veh
icle
s, ai
rcra
ft, sp
acec
raft
or
vess
els
8859
1 W
atch
-cas
es, a
nd p
arts
ther
eof
8859
7 C
lock
cas
es a
nd c
ases
of a
sim
ilar t
ype
for o
ther
goo
ds o
f gro
up 8
85, a
nd p
arts
ther
eof
8859
8 C
ompl
ete
wat
ch o
r clo
ck m
ovem
ents
, una
ssem
bled
or p
artly
ass
embl
ed (m
ovem
ent s
ets)
8859
9 C
lock
or w
atch
par
ts, n
.e.s.
8912
1 C
artri
dges
for r
ivet
ing
or si
mila
r too
ls o
r for
cap
tive-
bolt
hum
ane
kille
rs, a
nd p
arts
ther
eof
8919
5
O
ther
par
ts o
f sho
tgun
s and
rifle
s of h
eadi
ng 8
9131
8941
0 Ba
by c
arria
ges,
and
parts
ther
eof,
n.e.
s.
8942
3 Pa
rts a
nd a
cces
sorie
s of d
olls
repr
esen
ting
only
hum
an b
eing
s
8989
Pa
rts a
nd a
cces
sorie
s of m
usic
al in
strum
ents
8993
5
Parts
of l
ight
ers,
n.e.
s., o
ther
than
flin
ts or
wic
ks
8994
9
Pa
rts, t
rimm
ings
and
acc
esso
ries o
f arti
cles
falli
ng u
nder
hea
ding
899
41 o
r 899
42
8998
4
Butto
n m
ould
s and
oth
er p
arts
of b
utto
ns; b
utto
n bl
anks
8998
6
Parts
of s
lide
fast
ener
s
8999
2
Skin
s and
oth
er p
arts
of b
irds w
ith th
eir f
eath
ers o
r dow
n, fe
athe
rs, p
arts
of fe
athe
rs, d
own
an
d ar
ticle
s the
reof
89
994
Hum
an h
air,
anim
al h
air,
or o
ther
text
ile m
ater
ials
, pre
pare
d fo
r use
in m
akin
g w
igs o
r the
like
8999
7 V
acuu
m fl
asks
and
oth
er v
acuu
m v
esse
ls, c
ompl
ete
with
cas
es, a
nd p
arts
ther
eof (
othe
r tha
n gl
ass i
nner
s)
Sour
ce: A
thuk
oral
a, 2
010.

156
A
ppen
dix
II
Indi
a’s t
rade
of t
op 1
0 ite
ms o
f man
ufac
turi
ng p
arts
and
com
pone
nts,
1994
-200
8
Ta
ble
1a.
Indi
a’s e
xpor
ts o
f top
10
item
s of m
anuf
actu
ring
par
ts a
nd c
ompo
nent
s, 19
94-2
004
Expo
rts (
1994
) Ex
port
s (19
99)
Expo
rts (
2004
)
Com
mod
ity
code
V
alue
(U
S$ m
illio
n)
Shar
e in
tota
l P&
C
expo
rts (
%)
Com
mod
ity
code
V
alue
(U
S $
mill
ion)
Sh
are
in to
tal P
&C
ex
port
s (%
C
omm
odity
co
de
Val
ue
(US$
mill
ion)
Sh
are
in to
tal P
&C
ex
port
s (%
) 78
537
101.
2 15
.9
7843
6 1
64.0
14
.9
7843
9 52
9.7
17.5
78
439
100.
4 15
.8
7853
6 14
5.4
13.2
75
997
221.
1 7.
3 75
997
66.
2 10
.4
7599
5 84
.6
7.7
7139
2 16
2.5
5.4
7139
2 3
3.6
5.3
77
885
66.8
6.
1 78
537
139.
1 4.
6 71
391
28.
0 4
.4
7139
2 47
.6
4.3
7285
5 13
3.1
4.4
7724
9 1
3.5
2.1
71
391
32.0
2.
9 71
391
111.
3 3.
7 78
431
13.
2 2
.1
7929
3 26
.1
2.4
8941
0 87
.1
2.9
7429
1 1
2.9
2.0
76
499
25.1
2.
3 77
637
85.0
2.
8 72
855
12.
2 1
.9
7244
9 22
.9
2.1
7843
1 82
.7
2.7
7244
9 1
2.1
1.9
72
855
21.6
2.
0 77
611
80.3
2.
7 To
p 10
P&
C
393.
2 61
.8
Top
10 P
&C
63
6.1
57.9
To
p 10
P&
C
1,63
1.9
53.9
To
tal P
&C
63
6.5
To
tal P
&C
1,
098.
4
Tota
l P&
C
3,02
7.8
Sh
are
of P
&C
ex
ports
in to
tal
mfg
. exp
orts
(%)
3.2
Shar
e of
P&
C
expo
rts in
tota
l m
fg. e
xpor
ts (%
) 3.
8
Shar
e of
P&
C
expo
rts in
tota
l m
fg. e
xpor
ts (%
) 5.
2
Sour
ce: C
alcu
late
d fro
m U
nite
d N
atio
ns, 2
010.
Not
e: S
ee A
ppen
dix
I of t
his b
ook
for d
etai
led
com
mod
ity d
escr
iptio
n.

157
Tabl
e 1b
. In
dia’
s exp
orts
of t
op 1
0 ite
ms o
f man
ufac
turi
ng p
arts
and
com
pone
nts,
2005
-200
8
Exp
orts
(200
5)
Exp
orts
(200
6)
Exp
orts
(200
7)
Exp
orts
(200
8)
Com
mod
ity
code
Val
ue
(US$
m
illio
n)
Shar
e in
to
tal P
&C
ex
port
s (%
)
Com
mod
ity
code
Val
ue
(US$
m
illio
n)
Shar
e in
to
tal P
&C
ex
port
s (%
)
Com
mod
ity
code
Val
ue
(US$
m
illio
n)
Shar
e in
to
tal P
&C
ex
port
s (%
)
Com
mod
ity
code
Val
ue
(US$
m
illio
n)
Shar
e in
to
tal P
&C
ex
port
s (%
) 78
439
778.
3 20
.5
7843
9 88
0.0
18.8
78
439
919.
5 15
.6
7929
5 1,
119.
4 13
.1
7139
2 22
9.3
6.0
7139
2 32
7.0
7.0
7139
2 42
3.5
7.2
7843
9 1,
085.
1 12
.7
7599
7 22
1.3
5.8
7599
7 20
0.6
4.3
7929
5 28
8.6
4.9
7763
7 52
8.8
6.2
7285
5 15
5.5
4.1
7285
5 16
4.4
3.5
7763
7 21
2.8
3.6
7139
2 50
5.7
5.9
7853
7 14
8.8
3.9
7853
7 16
0.7
3.4
7649
3 19
3.4
3.3
7929
7 24
2.8
2.9
7139
1 13
8.3
3.6
7843
1 15
0.0
3.2
7285
5 16
7.0
2.8
7728
2 23
3.9
2.7
7843
1 11
3.0
3.0
7139
1 14
3.5
3.1
7728
2 14
1.2
2.4
7843
4 20
6.9
2.4
7763
7 93
.7
2.5
7763
7 13
3.9
2.9
7139
1 13
7.5
2.3
7853
7 18
4.4
2.2
7359
1 82
.8
2.2
7649
3 12
2.0
2.6
7843
1 13
6.9
2.3
7649
3 17
5.4
2.1
7843
4 78
.9
2.1
7843
4 11
2.6
2.4
7843
4 12
4.6
2.1
7285
5 15
8.0
1.9
Top
10
P&C
2,
039.
6 53
.8
Top
10 P
&C
2,
394.
6 51
.2
Top
10 P
&C
2,
745.
1 46
.5
Top
10 P
&C
4,
440.
5 52
.1
Tota
l P&
C
3,79
5.0
To
tal
P&C
4,
673.
8
Tota
l P&
C
5,90
5.0
To
tal P
&C
8,
526.
6
Shar
e of
P&
C
expo
rts in
to
tal m
fg.
expo
rts (%
)
5.3
Sh
are
of P
&C
ex
ports
in to
tal
mfg
. exp
orts
(%
)
5.8
Sh
are
of P
&C
ex
ports
in to
tal
mfg
. exp
orts
(%
)
6.2
Sh
are
of P
&C
ex
ports
in to
tal
mfg
. exp
orts
(%)
7.3
Sour
ce: C
alcu
late
d fro
m U
nite
d N
atio
ns, 2
010.
. N
ote:
See
App
endi
x I
for d
etai
led
com
mod
ity d
escr
iptio
n.

158
Ta
ble
2a. I
ndia
’s im
port
s of t
op 1
0 ite
ms o
f man
ufac
turi
ng p
arts
and
com
pone
nts,
1994
-200
4
Impo
rts (
1994
) Im
port
s (19
99)
Impo
rts (
2004
) C
omm
odity
cod
e
Val
ue (U
S$
mill
ion)
Sh
are
in to
tal
P&C
impo
rts (
%)
Com
mod
ity c
ode
V
alue
(US$
m
illio
n)
Shar
e in
tota
l P&
C
impo
rts (
%)
Com
mod
ity c
ode
V
alue
(US$
m
illio
n)
Shar
e in
tota
l P&
C im
port
s (%
) 79
295
292.
1 12
.4
7599
7 42
8.3
14.2
75
997
1,06
4.5
15.2
78
439
156.
9 6.
7 78
439
309.
9 10
.3
7843
9 54
6.6
7.8
7599
7 12
9.2
5.5
7764
1 20
2.8
6.7
7649
3 44
5.2
6.3
7149
9 12
3.1
5.2
7649
3 13
8.0
4.6
7929
5 39
6.3
5.6
7649
3 75
.5
3.2
7139
2 10
4.7
3.5
7649
1 29
2.8
4.2
7244
9 73
.2
3.1
7649
1 77
.9
2.6
7764
3 22
6.1
3.2
7764
3 67
.3
2.9
7139
1 69
.5
2.3
7728
2 17
2.6
2.5
7139
2 66
.2
2.8
7429
1 54
.2
1.8
7239
9 13
9.5
2.0
7843
1 64
.5
2.8
7149
9 54
.1
1.8
7139
2 13
3.1
1.9
7449
4 60
.5
2.6
7929
5 53
.1
1.8
7239
3 13
3.0
1.9
Top
10 P
&C
1,
108.
5 47
.2
Top
10 P
&C
1,
492.
5 49
.5
Top
10 P
&C
3,
549.
6 50
.5
Tota
l P&
C
2,34
9.9
To
tal P
&C
3,
017.
6
Tota
l P&
C
7,02
8.0
Sh
are
of P
&C
im
ports
in to
tal
mfg
. im
ports
(%)
16.3
Shar
e of
P&
C
impo
rts in
tota
l m
fg. i
mpo
rts (%
) 13
.2
Sh
are
of P
&C
im
ports
in to
tal
mfg
. im
ports
(%)
13.7
Sour
ce: C
alcu
late
d fro
m U
nite
d N
atio
ns, 2
010.
N
ote:
Ple
ase
see
App
endi
x I o
f thi
s boo
k fo
r det
aile
d co
mm
odity
des
crip
tion.
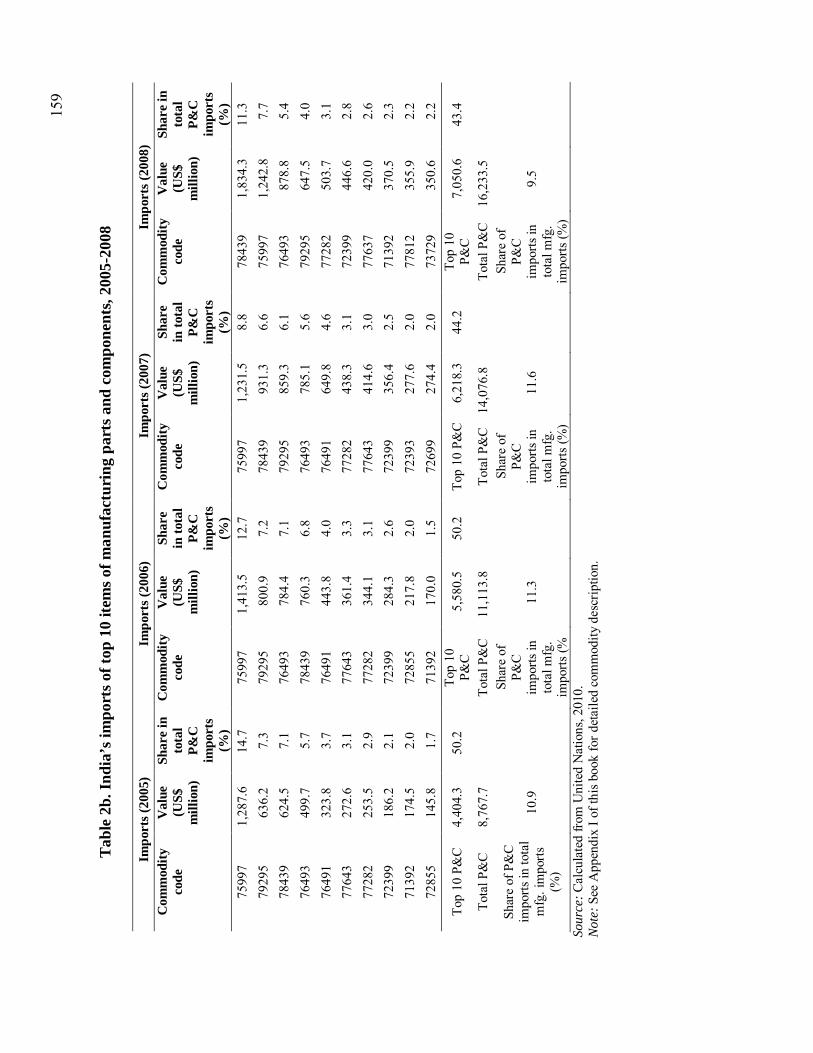
159
Tabl
e 2b
. Ind
ia’s
impo
rts o
f top
10
item
s of m
anuf
actu
ring
par
ts a
nd c
ompo
nent
s, 20
05-2
008
Im
port
s (20
05)
Impo
rts (
2006
) Im
port
s (20
07)
Impo
rts (
2008
) C
omm
odity
co
de
Val
ue
(US$
m
illio
n)
Shar
e in
to
tal
P&C
im
port
s (%
)
Com
mod
ity
code
Val
ue
(US$
m
illio
n)
Shar
e in
tota
l P&
C
impo
rts
(%)
Com
mod
ity
code
Val
ue
(US$
m
illio
n)
Shar
e in
tota
l P&
C
impo
rts
(%)
Com
mod
ity
code
Val
ue
(US$
m
illio
n)
Shar
e in
to
tal
P&C
im
port
s (%
) 75
997
1,28
7.6
14.7
75
997
1,41
3.5
12.7
75
997
1,23
1.5
8.8
7843
9 1,
834.
3 11
.3
7929
5 63
6.2
7.3
7929
5 80
0.9
7.2
7843
9 93
1.3
6.6
7599
7 1,
242.
8 7.
7 78
439
624.
5 7.
1 76
493
784.
4 7.
1 79
295
859.
3 6.
1 76
493
878.
8 5.
4 76
493
499.
7 5.
7 78
439
760.
3 6.
8 76
493
785.
1 5.
6 79
295
647.
5 4.
0 76
491
323.
8 3.
7 76
491
443.
8 4.
0 76
491
649.
8 4.
6 77
282
503.
7 3.
1 77
643
272.
6 3.
1 77
643
361.
4 3.
3 77
282
438.
3 3.
1 72
399
446.
6 2.
8 77
282
253.
5 2.
9 77
282
344.
1 3.
1 77
643
414.
6 3.
0 77
637
420.
0 2.
6 72
399
186.
2 2.
1 72
399
284.
3 2.
6 72
399
356.
4 2.
5 71
392
370.
5 2.
3 71
392
174.
5 2.
0 72
855
217.
8 2.
0 72
393
277.
6 2.
0 77
812
355.
9 2.
2 72
855
145.
8 1.
7 71
392
170.
0 1.
5 72
699
274.
4 2.
0 73
729
350.
6 2.
2
Top
10 P
&C
4,
404.
3 50
.2
Top
10
P&C
5,
580.
5 50
.2
Top
10 P
&C
6,
218.
3 44
.2
Top
10
P&C
7,
050.
6 43
.4
Tota
l P&
C
8,76
7.7
To
tal P
&C
11
,113
.8
To
tal P
&C
14
,076
.8
To
tal P
&C
16
,233
.5
Shar
e of
P&
C
impo
rts in
tota
l m
fg. i
mpo
rts
(%)
10.9
Shar
e of
P&
C
impo
rts in
to
tal m
fg.
impo
rts (%
11.3
Shar
e of
P&
C
impo
rts in
to
tal m
fg.
impo
rts (%
)
11.6
Shar
e of
P&
C
impo
rts in
to
tal m
fg.
impo
rts (%
)
9.5
Sour
ce: C
alcu
late
d fro
m U
nite
d N
atio
ns, 2
010.
N
ote:
See
App
endi
x I o
f thi
s boo
k fo
r det
aile
d co
mm
odity
des
crip
tion.

160
Tabl
e 3a
. Est
imat
es o
f int
ra-in
dust
ry tr
ade
in in
dia’
s top
10
prod
ucts
invo
lvin
g P&
C tr
ade:
199
4-20
04
19
94
1999
20
04
Com
mod
ity
code
II
T (U
S$
mill
ion)
G
-L
Inde
x C
omm
odity
co
de
IIT
(US$
m
illio
n)
G-L
In
dex
Com
mod
ity
code
II
T (U
S$
mill
ion)
G
-L
Inde
x 78
439
200.
8 78
.1
7139
2 95
.2
62.5
78
439
1,05
9.4
98.4
75
997
132.
4 67
.8
7139
1 64
.1
63.1
75
997
442.
1 34
.4
7139
2 67
.1
67.3
76
499
50.2
87
.1
7139
2 26
6.2
90.0
71
391
28.8
67
.9
7244
9 45
.9
90.5
72
855
201.
9 86
.3
7843
1 26
.4
33.9
72
855
43.2
74
.9
7761
1 16
0.7
86.2
74
291
25.8
54
.2
7359
1 39
.7
98.4
71
391
127.
8 72
.9
7285
5 24
.3
43.8
77
811
22.1
97
.4
7742
9 10
8.0
88.5
72
449
24.1
28
.3
7725
2 21
.3
93.0
73
591
103.
2 96
.9
7359
1 20
.1
81.7
87
469
21.2
56
.4
7763
7 89
.6
69.0
78
535
17.9
94
.5
7783
3 20
.5
80.8
74
291
88.6
63
.9
Sour
ce: C
alcu
late
d fro
m U
nite
d N
atio
ns, 2
010.
N
ote:
See
App
endi
x 1
for d
etai
led
com
mod
ity d
escr
iptio
n.
Ta
ble
3b. E
stim
ates
of i
ntra
-indu
stry
trad
e in
Indi
a’s t
op 1
0 pr
oduc
ts in
volv
ing
P&C
trad
e: 2
005-
08
20
05
2006
20
07
2008
C
omm
odity
co
de
IIT
(US$
m
illio
n)
G-L
In
dex
Com
mod
ity
code
II
T (U
S$
mill
ion)
G
-L
Inde
x C
omm
odity
co
de
IIT
(US$
m
illio
n)
G-L
In
dex
Com
mod
ity
code
II
T (U
S$
mill
ion)
G
-L
Inde
x 78
439
1,24
9.1
89.0
78
439
1,52
0.6
92.7
78
439
1,83
8.9
99.4
78
439
2,17
0.2
74.3
75
997
442.
5 29
.3
7599
7 40
1.1
24.9
79
295
577.
1 50
.3
7929
5 1,
295.
0 73
.3
7139
2 34
9.0
86.4
71
392
340.
0 68
.4
7139
2 48
1.7
72.5
77
637
840.
1 88
.5
7285
5 29
1.6
96.8
72
855
328.
8 86
.0
7649
3 38
6.9
39.5
71
392
741.
0 84
.6
7359
1 15
1.2
95.4
76
493
244.
0 26
.9
7763
7 33
7.8
88.5
77
282
467.
9 63
.4
7725
9 13
4.1
75.9
78
537
229.
0 83
.2
7285
5 33
4.0
76.8
78
434
380.
9 95
.9
7139
1 12
4.5
62.1
77
637
209.
6 87
.8
7728
2 28
2.3
48.7
76
493
350.
8 33
.3
7742
9 11
7.2
93.5
71
391
194.
7 80
.8
7139
1 27
5.0
94.2
78
537
318.
6 92
.7
7429
1 11
1.8
57.5
77
129
157.
5 95
.8
7599
7 24
7.0
18.2
72
855
316.
0 65
.0
7712
9 10
9.6
83.1
77
259
154.
4 67
.4
7283
9 22
0.0
86.9
71
391
303.
4 88
.7
Sour
ce: C
alcu
late
d fro
m U
nite
d N
atio
ns, 2
010.
N
ote:
See
App
endi
x I o
f thi
s boo
k fo
r det
aile
d co
mm
odity
des
crip
tion.

161
Appendix III Overview of India's preferential trade agreements, 2011
Asia Pacific Trade Agreement (APTA)
Parties Bangladesh, China, India, Korea (Rep. of), Lao People's Democratic Republic and Sri Lanka
Date of signature/entry into force 31.07.1975/17.06.1976a
Transition for full implementation Immediately on implementation
India's duty-free tariff lines (2009/10) 3.36% of the totalb
Provisions concerning goods Rules of origin, safeguards, balance-of-payment measures, and dispute settlement
Trade in goods Tariff concessions apply to 570 HS 6-digit tariff lines (margin of preferences: 5%-100%) Special concessions apply to 48 HS 6-digit tariff lines (margin of preferences: 14%-100%) for LDC members. The fourth round of negotiations aimed at widening the coverage of preferences to at least 40% of the tariff lines of each member State at an average margin of preference of 40%, was scheduled to be completed in October 2009 but has not been concluded yet
India's merchandise trade (2009/10) Imports from APTA: 13.9% of total; exports to APTA: 11% of total
of which preferential Imports: ..
WTO document series L/4418 (GATT), BISD 25S/L4635 (GATT), WT/COMTD/N/22, and WT/COMTD/62
South Asian Free-Trade Agreement (SAFTA)
Parties Afghanistan, Bangladesh, Bhutan, India, Maldives, Nepal, Pakistan and Sri Lanka
Date of signature/entry into force 06.01.2004/01.06.2006
Transition for full implementation 2013
India's duty-free tariff lines (2009/10) 0.028% of the totalb
Provisions concerning goods Rules of origin, safeguards, balance-of-payment measures, general exceptions, and dispute settlement
Trade in goods Tariff reduction to 20% for non-LDC members by 2008 (30% for LDC members), followed by a reduction to 0%-5% by 2013 (by 2014 for Sri Lanka and by 2018 for LDC members). Tariff reduction to 0%-5% on imports from LDC members by 2009. However, India granted duty-free access on imports from LDC members on 1 January 2008 (i.e., one year ahead of the tariff liberalization schedule). The base rate is the MFN tariff in force on 1 January 2006. India's sensitive list includes 744 products from LDC members and 865 products from non-LDC membersc
India's merchandise trade (2009/10) Imports from SAFTA: 0.5% of total; exports to SAFTA: 4.4% of total
of which preferential Imports ..
WTO document series WT/COMTD/N/26
South Asian Preferential Trade Arrangement (SAPTA)d
Parties Bangladesh, Bhutan, India, Maldives, Nepal, Pakistan and Sri Lanka
Date of signature/entry into force 11.04.1993/07.12.1995
Transition for full implementation On implementation
India's duty-free tariff lines (2009/10) 0.028% of the totalb
Provisions concerning goods Balance-of-payment measures, dispute settlement, rules of origin, and safeguards
Trade in goods Tariff concessions apply to 2,565 HS 6-digit tariff lines (margin of preferences: 10%-90% for non-LDC members and 10%-100% for LDC members)
India's merchandise trade (2009/10) Imports from SAPTA: 0.5% of total; exports to SAPTA: 4.4% of total
of which preferential Imports: ..
WTO document series WT/COMTD/10
Association of Southeast Asian Nations (ASEAN)
Parties India and Brunei Darussalam, Cambodia, Indonesia, Lao People's Democratic Republic, Malaysia, Myanmar, Philippines, Singapore, Thailand and Viet Nam
Date of signature/entry into force 13.08.2009/01.01.2010e
Transition for full implementation 31.12.2019

162
India's duty-free tariff lines (2009/10) 1.13% of the totalb
Provisions concerning goods Rules of origin, dispute settlement, safeguards, balance-of-payment measures, customs-related measures, exceptions (general and for security) and dispute settlement
Trade in goods Tariff concessions apply to 12,169 HS 8-digit tariff lines. For “normal track” products, applied MFN rates will be reduced and subsequently eliminated by end-December 2013 (7,775 HS 8-digit tariff lines) and by end-December 2016 (1,252 HS 8-digit tariff lines). For “sensitive track” products (1,805 HS 8-digit tariff lines), applied MFN rates higher than 5% will be reduced to 5% by end-December 2016. For special products,f applied MFN rates will be reduced from 70%-100% to 37.5%-50% by end-December 2019. For “highly sensitive” products, MFN applied rates will be reduced to 50% for category I products (nine HS 8-digit tariff lines), 45% for category II products (30 HS 8-digit tariff lines), and 37.5% for category III products (one HS 8-digit tariff line) by end-December 2019. The exclusion list (1,297 HS 8-digit tariff lines) must be reviewed annually
India's merchandise trade (2009/10) Imports from ASEAN: 8.9% of total; exports to ASEAN: 10.1% of total
of which preferential Imports: ..
WTO document series WT/COMTD/N/35
MERCOSUR
Parties India and Argentina, Brazil, Paraguay, and Uruguay Date of signature/entry into force 25.01.2004/01.06.2009 Transition for full implementation Immediate on implementation India's duty-free tariff lines (2009/10) 0.25% of the totalb Provisions concerning goods Rules of origin, safeguards, and dispute settlement Trade in goods 450 HS 8-digit tariff lines are granted tariff concessions (margin of preferences: 10%, 20% or 100%) India's merchandise trade (2009/10) Imports from MERCOSUR: 1.4% of total; exports to MERCOSUR: 1.5% of total
of which preferential Imports: .. WTO document series WT/COMTD/N/31
India-Afghanistan
Parties India and Afghanistan Date of signature/entry into force 06.03.2003/13.05.2003 Transition for full implementation Immediately on implementation India's duty-free tariff lines (2009/10) Nilb Provisions concerning goods Rules of origin, safeguards, balance-of-payment measures, state trading, dispute settlement, general
exceptions, safeguards, and national treatment Trade in goods Tariff reductions apply to 38 HS 6-digit tariff lines. Margin of preferences is 50% or 100% of the MFN
tariff in force as of 13 May 2003 India's merchandise trade (2009/10) Imports from Afghanistan: 0.04% of total; exports to Afghanistan: 0.3% of total
of which preferential Imports: .. WTO document series WT/COMTD/N/32
India-Bhutan
Parties India and Bhutan Date of signature/entry into force 28.07.2006/29.07.2006 Transition for full implementation Immediate India's duty-free tariff lines (2009/10) Negligibleb Provisions concerning goods Safeguards and customs-related measures Trade in goods Tariff exemptions on all goods imported from Bhutan. No restrictions on Bhutan's trade with third
countries. Non-tariff restrictions may be imposed on imports of third countries from Bhutan. Annual refund of excise duties. Bhutan-flagged vessels operating to and from Indian ports are given equal treatment than granted to vessels from other foreign country
India's merchandise trade (2009/10) Imports from Bhutan: 0.1% of total; exports to Bhutan: 0.1% of total of which preferential Imports: ..
WTO document series WT/COMTD/N/28

163
India-Chile
Parties India and Chile Date of signature/entry into force 08.03.2006/17.08.2007g Transition for full implementation Immediately on implementation India's duty-free tariff lines (2009/10) 0.004% of the total Provisions concerning goods Anti-dumping and countervailing measures, customs-related measures, dispute settlement, general
exceptions, import/export restrictions, rules of origin, safeguards, sanitary and phytosanitary measures, national treatment, state trading, agriculture export subsidies, and technical barriers to trade
Trade in goods Tariff preferences apply to 178 HS 8-digit tariff lines (margin of preferences: 10%-50%) India's merchandise trade (2009/10) Imports from Chile: 0.4% of total; exports to Chile: 0.2% of total
of which preferential Imports: .. WTO document series WT/COMTD/N/30, WT/COMTD/RTA/M/3, and WT/COMTD/RTA/4
India-Korea (Rep. of)
Parties India and Republic of Korea Date of signature/entry into force 07.08.2009/01.01.2010 Transition for full implementation 2019 India's duty-free tariff lines (2009/10) 0.32% of the totalb Provisions concerning goods Rules of origin, customs-related measures, anti-dumping and countervailing measures, safeguards,
technical regulations, exceptions (general and for security), state trading, non-tariff measures, and sanitary and phytosanitary measures
Trade in goods E-0 group of products (460 HS 8-digit tariff lines) have been free of duty since 1 January 2010. Phased elimination of duty for E-5 group of products (448 HS 8-digit tariff lines) by 2014. Phased elimination of duty for E-8 group of products (7,248 HS 8-digit tariff lines) by 2017. Phased reduction of duty to 0%-5% for RES products (941 HS 8-digit tariff lines) by 2017. Phased reduction of duty to 50% for SEN products (704 HS 8-digit tariff lines) by 2019. Exemption of tariff reduction or elimination applies to 1,895 HS 8-digit tariff lines. The base rate is the MFN duty in force as of 1 April 2006
Provision concerning services Yes India's merchandise trade (2009/10) Imports from the Republic of Korea: 3.0% of total; exports to Republic of Korea: 1.9% of total
of which preferential Imports: .. India's commercial services trade (2009/10)
..
WTO document series WT/REG286/N/1 and S/C/N/558, and WT/COMTD/N/36 and S/C/N/570
India-Nepal
Parties India and Nepal Date of signature/entry into force 27.10.2009/27.10.2009 Transition for full implementation Immediate on implementation India's duty-free tariff lines (2009/10) 0.002% of the totalb Provisions concerning goods Rules of origin and safeguards Trade in goods Tariff exemptions for all goods. Imports of vegetable fats, copper products, acrylic yarn, and zinc oxide
are subject to annual quotas. Imports of alcoholic liquors/beverages (except industrial spirits),h perfumes, and cosmetics with non-Nepalese/non-Indian brand names, and cigarettes and tobacco are not allowed preferential entry into India
India's merchandise trade (2009/10) Imports from Nepal: 0.2% of total; exports to Nepal: 0.9% of total of which preferential Imports: ..
WTO document series WT/COMTD/N/34
India-Singapore
Parties India and Singapore Date of signature/entry into force 29.06.2005/01.08.2005 Transition for full implementation 01.12.2015
India's duty-free tariff lines (2009/10) ..
Provisions concerning goods Rules of origin, customs-related measures, safeguards, standards and technical regulations, sanitary and phytosanitary measures, and dispute settlement

164
Trade in goods 506 HS 8-digit tariff lines have been granted duty-free access since 1 August 2005. Phased elimination of duty for 2,202 HS 8-digit tariff lines by 1 April 2009. Phased reduction of duty for 2,407 HS 8-digit tariff lines by 1 April 2009. Some 6,550 HS 8-digit tariff lines are excluded from duty reductions
Provision concerning services Yes
Other provisions Investment and government procurement
India's merchandise trade (2009/10) Imports from Singapore: 2.2% of total; exports to Singapore: 4.2% of total
of which preferential Imports: 0.58% of total during 2009-10
India's commercial services trade (2009/10)
..
WTO document series WT/REG228/N/1 and S/C/N/393, WT/REG228/2, WT/REG228/1/Rev.1, WT/REG228/3, and WT/REG228/M/1
India-Sri Lanka
Parties India and Sri Lanka Date of signature/entry into force 28.12.1998/15.12.2001 Transition for full implementation 18.03.2003 India's duty-free tariff lines (2009/10) 0.001% of the totalb Provisions concerning goods General exceptions, national treatment, state trading, rules of origin, safeguards, balance-of-payment
measures, disputes settlement, and rules of origin Trade in goods As of 18 March 2003, all tariff lines (except those in the negative list and those under tariff rate quotas)
have been free of duty. India's negative list comprises 429 tariff lines. Tariff concessions on textiles are restricted to 25% below the MFN rate; although textiles under HS chapters 61-62 remain in India's negative list, an annual quota of 8 million pieces is offered a 75% tariff concession on a fixed basis.i Tariff quota also applies to tea: a 50% tariff concession on a fixed basis is offered, subject to an annual quota of 15 million kg
India's merchandise trade (2009/10) Imports from Sri Lanka: 0.1% of total; exports to Sri Lanka: 1.2% of total of which preferential Imports: ..
WTO document series WT/COMTD/N/16
India-Japan
Date of signature/entry into force 16.02.2011/.. Transition for full implementation Within 10 years from the date of implementation India's duty-free tariff lines (2009/10) 0.25% of the totalb Provisions concerning goods Customs-related measures, export subsidies, import/export restrictions, safeguards, anti-dumping
measures, balance-of-payment measures, and rules of origin Trade in goods For category A products (1,378 HS 8-digit tariff lines), customs duties are to be eliminated as from the
date of entry into force of the agreement. For category B5 products (509 HS 8-digit tariff lines), customs duties are to be eliminated in six equal annual installments from the base rate to free. For category B7 products (two HS 8-digit tariff lines), customs duties are to be eliminated in eight equal annual instalments from the base rate to free. For category B10 products (7,151 HS 8-digit tariff lines), customs duties are to be eliminated in 11 equal annual instalments from the base rate to free. For gearboxes and diesel engines of a capacity exceeding 250 cc (two HS 8-digit tariff lines), customs duties are to be reduced to 6.25% and 5%, respectively, by 1 January 2019. Category X products (1,535 HS 8-digit tariff lines) are to be excluded from any customs reduction or elimination
Provision concerning services Yes Other provisions Investment, intellectual property, government procurement, and competition India's merchandise trade (2009/10) Imports from Japan: 2.3% of total; exports to Japan: 2% of total
of which preferential Imports: .. India's commercial services trade (2009/10)
..
WTO document series Not notified to the WTO
India-Malaysia
Parties India and Malaysia
Date of signature/entry into force 18.02.2011/01.07.2011
Transition for full implementation 31.12.2019
India's duty-free tariff lines (2009/10) 0.25% of the totalb

165
Provisions concerning goods Rules of origin, sanitary and phytosanitary measures, technical barriers to trade, trade remedies, general exceptions, and customs-related measures
Trade in goods For “normal track” products: (a) applied MFN rate will be reduced and subsequently eliminated for 7,747 HS 8-digit tariff lines by end-September 2013 and for 1,270 HS 8-digit tariff lines by end-June 2016; and (b) tariff lines that bear a zero-rated duty cannot be changed (402 HS 8-digit tariff lines). For “sensitive track” products, applied MFN rates higher than 5% will be reduced to 5% by end-June 2016. For special products,j the applied MFN rates will be reduced from 80%-100% to 37.5%-50% by end-December 2019. For “highly sensitive” products, MFN applied rates will be reduced to 50% and 45% for category I and II products, respectively, (42 HS 8-digit tariff lines) and to 37.5% for category III products (one HS 8-digit tariff line) by end-December 2019. For “special track” products,k the applied MFN rate will be reduced from 30% to 5%-10% by end-December 2016. The exclusion list (1,224 HS 8-digit tariff lines) must be reviewed annually
Provision concerning services Yes
Other provisions Dispute settlement and investment
India's merchandise trade (2009/10) Imports from Malaysia: 1.6% of total; exports to Malaysia: 1.8% of total
of which preferential Imports: ..
India's commercial services trade (2009/10)
..
WTO document series Not notified to the WTO
India-Thailand
Parties India and Thailand Date of signature/entry into force 09.10.2003/01.09.2004 Transition for full implementation 17 rounds of negotiations have been held. The free-trade agreement is expected to be concluded during
2011 India's duty-free tariff lines (2009/10) 0.09% of the totalb Provisions concerning goods Rules of origin, general exceptions, and dispute settlement Trade in goods Duty-free access for 82 HS 6-digit tariff lines since March 2006 Provision concerning services Yes Other provisions Investment, dispute settlement, and trade facilitation India's merchandise trade (2009/10) Imports from Thailand: 1% of total; exports to Thailand: 1% of total
of which preferential Imports: India's commercial services trade (2009/10)
..
WTO document series Not notified to the WTO
GSTP
Parties (as notified) Algeria, Argentina, Bangladesh, Benin, Bolivarian Republic of Venezuela, Brazil, Cameroon, Chile, Colombia, Cuba, Democratic People's Republic of Korea, Ecuador, Egypt, Ghana, Guinea, Guyana, India, Indonesia, Iran (Islamic Rep. of), Iraq, Korea (Rep. of), Libyan Arab Jamahiriya, Macedonia (FYR), Malaysia, Mexico, Morocco, Mozambique, Myanmar, Nicaragua, Nigeria, Pakistan, Peru, Philippines, Pluri-national State of Bolivia, Singapore, Sri Lanka, Sudan, Tanzania, Thailand, Trinidad and Tobago, Tunisia, Viet Nam and Zimbabwe
Date of signature/entry into force 13.04.1988/19.04.1989 Transition for full implementation On implementation India's duty-free tariff lines (2009/10) .. Provisions concerning goods Rules of origin, balance-of-payment measures, safeguards and dispute settlement
Trade in goods Tariff concessions on 53 HS 6-digit tariff lines (margin of preferences: 10%-30%). A 50% tariff concession applies to three tariff lines for imports from LDC members only (Bangladesh, Benin, Guinea, Haiti, Mozambique, Sudan, and Tanzania)
India's merchandise trade (2009/10) Imports from GSTP: 26.5% of total; exports to GSTP: 23.4% of total
of which preferential Imports: ..
WTO document series L/6564 (GATT)
Source: WTO Trade Policy Review India, WT/TPR/S/249, September 2011. .. = Not available.

166
a APTA was formerly known as the Bangkok Agreement. The amended agreement entered into force on 1 September 2006.
b Information provided by the Indian authorities. c India has offered Bangladesh market access for 8 million pieces of garments, which are on India's sensitive list,
without any sourcing condition. d SAPTA was superseded by SAFTA. However, concessions granted under SAPTA remain in force for the
contracting parties until the SAFTA trade liberalization programme is completed by 2014 (SAFTA Agreement, Article 22).
e The agreement entered into force on 1 January 2010 for India, Malaysia, Singapore and Thailand, and on 1 June 2010 for Myanmar and Viet Nam. For the remaining parties, entry into force is in accordance with Article 23 of the Agreement (i.e., mutually agreed date).
f India's special products are crude and refined palm oil, coffee, black tea and pepper. g The Agreement effectively entered into force in India on 11 September 2007. h Nepalese beers can be imported on payment of the applicable liquor excise duty equal to the effective excise duty as
levied on Indian beers. i Of which 6 million pieces will be extended the concession only if made of Indian fabric, provided that no category
of garments exceeds 1.5 million pieces per year. j India's special products are crude palm oil, refined palm oil, palm kernel oil, palm kernel oil and its fractions,
margarine of vegetable origin, coffee, black tea and pepper. k India’s “special track” products include pineapples and bird eggs (HS 0407.00.10, 0407.00.20 and 0407.00.90).


ESCAP is the regional development arm of the United Nations and serves as the main economic and social development centre for the United Nations in Asia and the Pacific. Its mandate is to foster cooperation between its 53 members and 9 associate members. ESCAP provides the strategic link between global and country-level programmes and issues. It supports Governments of the region in consolidating regional positions and advocates regional approaches to meeting the region’s unique socio-economic challenges in a globalizing world. The ESCAP office is located in Bangkok, Thailand. Please visit our website at www.unescap.org for further information.
The shaded areas of the map are ESCAP Members and Associate members.