independent review of distribution network feeder category definitions
TRANSCRIPT
Independent review of distribution
network feeder category definitions
An independent review of distribution network feeder
category definitions for the Utilities Commission
October 2012

ACIL Tasman Pty Ltd
ABN 68 102 652 148 Internet www.aciltasman.com.au
Melbourne (Head Office) Level 4, 114 William Street Melbourne VIC 3000
Telephone (+61 3) 9604 4400 Facsimile (+61 3) 9604 4455 Email [email protected]
Brisbane Level 15, 127 Creek Street
Brisbane QLD 4000 GPO Box 32
Brisbane QLD 4001
Telephone (+61 7) 3009 8700 Facsimile (+61 7) 3009 8799
Email [email protected]
Canberra Level 2, 33 Ainslie Place Canberra City ACT 2600
GPO Box 1322 Canberra ACT 2601
Telephone (+61 2) 6103 8200 Facsimile (+61 2) 6103 8233 Email [email protected]
Perth Centa Building C2, 118 Railway Street
West Perth WA 6005
Telephone (+61 8) 9449 9600 Facsimile (+61 8) 9322 3955
Email [email protected]
Sydney Level 20, Tower 2 Darling Park 201 Sussex Street
Sydney NSW 2000 GPO Box 4670
Sydney NSW 2001
Telephone (+61 2) 9389 7842 Facsimile (+61 2) 8080 8142
Email [email protected]
For information on this report
Please contact:
Jeremy Tustin
Telephone (03) 9604 4411 Mobile (0421) 053 240 Email [email protected]
Contributing team members
Simon Sagerer Tammy Read

Independent review of distribution network feeder category definitions
ii
Contents
1 Introduction 4
2 Distribution networks – service standard regulation 6
2.1 Service quality for a distribution business – reliability of supply 6
2.2 Regulating reliability of supply 7
2.3 Segmenting performance targets 8
2.3.1 National level 9
2.3.2 Victoria 10
2.3.3 South Australia 11
2.3.4 Tasmania 12
2.3.5 Queensland 13
2.3.6 New South Wales 15
2.3.7 AER approach 16
2.4 Comparing performance with other jurisdictions 17
2.5 Conclusion – how feeders should be categorised 18
3 Feeder categorisation and the Northern Territory 20
3.1 Whether PWC has applied the feeder categorisation correctly 25
3.2 Alternative approach to feeder categorisation 25
3.2.1 Re-align feeder categories by altering threshold value 26
3.2.2 Categorise feeders as radial or meshed 27
3.2.3 Set performance targets for identified geographic locations 28
3.3 Recommended approach – a hybrid 28
4 The available data 30
5 Application of feeder categories 34
5.1 Categorise areas in the Territory 34
5.2 Determine which zones each feeder supplies 34
5.3 Select the threshold value 39
6 Conclusion and recommendations 50
Appendix A Compiled feeder categorisations A-1
List of figures
Figure 1 Darwin – feeder categorisation and population density 21
Figure 2 Katherine – feeder categorisation and population density 22
Figure 3 Tennant Creek – feeder categorisation and population density 23
Figure 4 Alice Springs – feeder categorisation and population density 24
Figure 5 ‘Fit’ between categorisations with different thresholds 39

Independent review of distribution network feeder category definitions
iii
Figure 6 Darwin – recommended feeder categorisation and population density 46
Figure 7 Katherine – recommended feeder categorisation and population density 47
Figure 8 Tennant Creek – recommended feeder categorisation and population density 48
Figure 9 Alice Springs – recommended feeder categorisation and population density 49
List of tables
Table 1 Feeders with full set of data 32
Table 2 Target feeder categorisations 36
Table 3 PWC definition matched target definition – no further analysis 41
Table 4 Feeders recommended to be re-categorised as urban 42
Table 5 Mixed feeders 42
Table 6 Feeders with incomplete data 43
Table 7 Mismatched feeders 43
Table 8 Recommended feeder categories 44
Table A1 Type table title here A-1

Independent review of distribution network feeder category definitions
Introduction 4
1 Introduction
The Utilities Commission (the Commission) is the independent industry
regulator for the Northern Territory (the Territory). It has various
responsibilities in the energy, water and sewerage industries. Those
responsibilities include regulating the electricity transmission and distribution
networks in the Darwin-Katherine, Alice Springs and Tennant Creek regions
(the regulated networks).
Electricity supply in the Territory is characterised by Government-owned and
vertically integrated generation and transmission and distribution networks.
Power and Water Corporation (PWC) is the monopoly operator of the
electricity generators and networks in the Territory. Electricity retailing is
dominated by PWC, although it has recently been opened to competition and
two licences have been issued to other retailers.
Much of the Commission’s current work stems from the Territory
Government’s approval, in 2009, of a reform program to strengthen regulatory
oversight of the regulated industries (including electricity) in the Territory. The
Commission’s projects under that reform program are wide ranging. They
include a review of Electricity Standards of Service for the Territory. Standard
of Service in the electricity supply industry is governed by the Commission’s
Electricity Standards of Service Code, which took effect in 2006 (original
Code).
The Commission is in the process of revoking the original Code and has been
consulting on replacing it with the “Northern Territory of Australia Electricity
Standards of Service Code” (the draft Code).
In the draft Code, the Commission proposes that reporting and targets for
distribution network reliability performance should be segmented by feeder
category. The feeder categories are defined in the draft Code.
Consistent with PWC’s submission to the draft Code, the Commission initially
proposed to base the feeder category definitions in the draft Code on the same
definitions that have been used for distribution network performance reporting
around Australia for some time.
However, PWC’s recent application of the categories to its networks has
revealed that parts of the Territory that would otherwise be considered urban
are defined as rural (short). This was an unintended consequence in light of
which the Commission is seeking to ascertain whether the application of
standard feeder categories is consistent with the objectives of the draft Code.

Independent review of distribution network feeder category definitions
Introduction 5
In particular, the Commission is concerned that the presence of so many rural
feeders in areas it regards as urban areas may affect the reliability performance
target levels set for each feeder category and any like-for-like comparisons with
other Australian distribution networks.
In this report ACIL Tasman has revisited the application of the standard
feeder categories to the regulated networks. Three issues were considered:
1. whether the feeder categories have been properly applied or whether the
issues the Commission has identified has resulted from error;
2. whether having feeders categorised as ‘Rural short’ supplying areas that
would normally be considered to be ‘Urban’ has any implications for
regulation of service performance in the Territory; and
3. whether adjustments to the feeder category definitions can be made to
address those implications.
The remainder of this report is structured as follows.
Section 2 provides an overview of standard of service regulation and the way it
is applied to electricity distributors in Australia.
Section 3 provides an overview of electricity networks in the Territory and a
more detailed description of the Commission’s concern.
Section 4 provides a brief overview of the data used in conducting this analysis.
Section 5 contains our review of PWC’s application of the feeder categories to
the regulated networks and our analysis of the possibility that the standard
feeder categories could be redefined to address the misalignment identified by
the Commission.
Section 6 provides a conclusion and recommendation.

Independent review of distribution network feeder category definitions
Distribution networks – service standard regulation 6
2 Distribution networks – service standard regulation
Electricity distribution networks in Australia are, without exception,
monopolies. This means that, unlike almost every other market in Australia,
consumers are unable to choose who ‘their’ electricity distributor will be. It
also means that electricity distributors are not subject to competitive forces
when they set the price and quality of the distribution services they provide.
As competition between them is not possible, electricity distributors in
Australia are subject to economic regulation. This approach is primarily
concerned with the price(s) an electricity distributor may charge, or the revenue
it may earn. However, to prevent regulated businesses from cutting reliability
and quality of supply to improve profitability, price regulation is usually
accompanied by service standard regulation. This forms an important part of
the ‘regulatory bargain’ that a regulator strikes with a regulated business on
behalf of customers.
2.1 Service quality for a distribution business –
reliability of supply
Electricity distribution businesses ‘deliver’ electricity. The key distinction
between ‘high’ and ‘low’ quality electricity distribution services is the frequency
and duration of supply interruptions (blackouts). This is known as the
reliability of supply.1,2
Supply interruptions are infrequent in Australian electricity systems and the
vast majority of Australian electricity customers enjoy highly reliable electricity
supply.
However, supply interruptions still occur. Most of those that do occur are
caused on distribution networks.
From a technical perspective the frequency and duration of supply
interruptions could be reduced by investing in more network infrastructure.
However, this is costly.
1 There are also other aspects of service quality, such as a distribution business’ responsiveness to customer calls. The focus of this report is on reliability of supply, so these other aspects are not discussed.
2 This report focuses on feeders, which are a component of an electricity distribution network. Therefore, the term ‘supply interruptions’ in this report refers only to interruptions caused on the distribution network, supply interruptions caused by generation and transmission network issues are excluded.

Independent review of distribution network feeder category definitions
Distribution networks – service standard regulation 7
The cost of providing improvements in reliability of supply must be traded off
against the benefit received, taking into account the number of customers who
will receive that benefit and the value they place on improved reliability of
supply.
2.2 Regulating reliability of supply
Reliability (and other measures of supply quality3) is regulated using an
incentive based approach.
In this approach a regulator does not specify which improvements the
distribution business should (or should not) make. Rather, the regulator creates
a system of incentives, often financial bonuses and penalties, intended to
encourage the distribution business to provide customers with optimal
reliability of supply.
A service standard regime for electricity distribution generally consists of two
components:
1. average standards for frequency and duration of outages, supply quality and
customer service, some of which may be coupled with a financial incentive
to improve service over time or penalty for failing to achieve a target level
of service
2. a Guaranteed Service Level (GSL) scheme, designed to compensate
individual customers who receive an unacceptable level of service.
S-factor schemes may or may not be accompanied with a financial incentive.4
GSL schemes routinely include a payment to customers who do not receive the
guaranteed level of service.
Between them, average service standards and GSL schemes give electricity
distributors an incentive to ensure that, while the service experienced by
individual customers will vary, the average level of service is satisfactory and, at
the same time, no individual customer experiences service that is far below that
average target level.
3 See footnote 1.
4 We understand from the Commission that it has decided not to proceed with a financial incentive scheme for average reliability performance. The Commission considers that PWC is not ready and that it would be premature to apply this type of scheme in the 2014-19 network price determination. It is understood that there will be no other penalty/reward in relation to network performance other than the GSL scheme. For readability, in this report we refer to regulating reliability of supply as a generic reference to regimes including either an s-factor or GSL scheme or both.

Independent review of distribution network feeder category definitions
Distribution networks – service standard regulation 8
Another approach that is used, either with these two methods or on its own, is
reporting. Some jurisdictions require electricity distributors to report reliability
performance at the individual feeder level for the worst performing feeders.
As discussed in the previous section, it is optimal for a distribution business to
invest in improving reliability of supply where the benefit of doing so (to
customers) is greater than the cost of the investment
It follows from this that a service standard regime should encourage a
distribution business to make investments to improve reliability that meet this
test or, in other words, investments that are economically justified. Therefore,
the targets for s-factor schemes and the guaranteed service levels for GSL
schemes should be set with regard to the cost of providing improvements and
customers’ willingness to pay for those improvements.
2.3 Segmenting performance targets
It is common for electricity distribution networks to be described as if they are
a single, homogeneous unit. Performance is often reported and compared at
the network level, which assumes that all customers connected to the network
receive the same level of service.
In practice, though, networks are not homogeneous. A network consists of a
series of feeders that are all connected to one another. The performance of the
network is the aggregate of the performance of each feeder, which varies
feeder by feeder depending on local conditions, whether the feeder is part of a
meshed or radial network, the feeder’s length, the number of customers it
supplies and other factors.
Distribution networks typically consist of two broad types of feeders:
• meshed feeders, which are characterised by multiple redundant elements
• radial feeders, which are characterised by few, if any, redundant elements.
Regardless of the nature of the network that supplies a particular customer, or
group of customers, improving service standards is costly. However, the cost
of providing improved service varies substantially for different types of
feeders. In particular, it can be much more costly (in absolute terms) to make
improvements in reliability of supply on radial as opposed to meshed feeders.
Furthermore, given that radial feeders typically supply fewer customers per
kilometre (km) of feeder length than meshed feeders, the cost of improving
service on a per customer basis on radial feeders can be substantially higher
than the corresponding cost on meshed feeders.

Independent review of distribution network feeder category definitions
Distribution networks – service standard regulation 9
Targets for reliability of supply (or other service standards5) could be set across
groups of feeders that are characterised by a significantly different cost of
providing improvements in reliability of supply (on a per customer basis). If
this approach is taken, the targets will tend to be:
• more stringent than economically justifiable for feeders with high ‘cost to
improve’, generally radial feeders on the edge of the network; and
• less stringent than economically justifiable for feeders with low ‘cost to
improve’, generally meshed feeders in the middle of the network.
Therefore, a ‘one size fits all’ approach to applying reliability standards would
typically result in targets that are ‘dragged down’ by the performance that can
reasonably be achieved on the (radial) fringe of the network. These average
targets would not reflect the reliability experienced by those customers
supplied by feeders in the meshed part of the network. Nor would it reflect the
reliability of supply for which those customers are willing to pay (as a group).
Over time a ‘one size fits all’ approach to applying reliability standards may
lead to deterioration in the service standards experienced by the majority of
customers.
To prevent this, regulators in most Australian jurisdictions have service
standards to reflect the nature of the network in different places. This has been
achieved by applying different reliability standards to different feeders.
Rather than assigning performance targets to individual feeders, which would
be administratively cumbersome, reliability standards have typically been
applied to groups of feeders.
This raises the question of which feeders should be grouped together and
which separated. In other words, how feeders should be categorised.
The approach taken in different Australian jurisdictions is discussed in sections
2.3.1 to 2.3.7 below.
2.3.1 National level
Feeders were first categorised by Victoria’s Office of the Regulator General
(ORG). The ORG determined that feeders should be divided into four
categories, defined as follows:
1. CBD – a feeder supplying predominantly commercial, high-rise buildings,
supplied by a predominantly underground distribution network containing
significant interconnection and redundancy when compared to urban areas.
5 See footnote 1

Independent review of distribution network feeder category definitions
Distribution networks – service standard regulation 10
2. Urban - a feeder, which is not a CBD feeder, with actual maximum demand
over the reporting period per total feeder route length greater than
0.3 MVA/km.
.3 Rural short - a feeder which is not a CBD or urban feeder with a total
feeder route length less than 200 km.
4. Rural long - a feeder which is not a CBD or urban feeder with a total
feeder route length greater than 200 km.
These four feeder categories were later adopted by the Steering Committee on
National Regulatory Reporting Reform (SCONRRR).
When the feeder categories were adopted, SCONRRR noted that they were
not widely supported. However, with a desire for national consistency and no
common theme to the alternative proposals, SCONRRR had no practical
alternative.6
Distribution networks were not regulated at the national level at that time, so,
while the SCONRRR feeder categories were adopted nationally, this was for
national reporting purposes only. Service standard regulation was managed by
individual State regulators.
This began to change with the inception of the Australian Energy Regulator
(AER) in 2007. The AER’s approach is discussed in section 2.3.7.
2.3.2 Victoria
Since 2001, the Essential Services Commission (ESC) has been responsible for
regulating Victoria’s distribution and retail energy markets, taking over from
the ORG.7 The establishment of the ESC coincided with the introduction of
full retail contestability for domestic and small business customers. In
preparation for full retail contestability, the ORG put in place a suite of
regulatory protections and, since then, the ESC has amended the regulatory
framework, including new guidelines concerning service standards.
6 SCONRRR, “National regulatory reporting for electricity distribution and retailing
businesses”, March 2002, p. 7, available at http://www.accc.gov.au/content/index.phtml/itemId/332190/fromItemId/3894, accessed 17 July 2012
7 Review of Regulatory Instruments: Stage 1 Final Decision October 2008 http://www.esc.vic.gov.au/getattachment/1bdc8bfa-4f68-4cde-8982-d56a9193117d/Review-of-Regulatory-Instruments-Stage-1-Final-Dec.pdf

Independent review of distribution network feeder category definitions
Distribution networks – service standard regulation 11
Victorian electricity distributors work to a set of average supply reliability
targets based on the SCONRRR feeder categories. They also operate under a
GSL scheme which applies equally regardless of feeder category.8
Electricity distributors are held to an Electricity Distribution Code which
requires that reporting against targets is based on the SCONRRR feeder
categories.9,10
2.3.3 South Australia
In 2003, the Essential Services Commission of South Australia (ESCOSA)
adopted the SCONRRR feeder categories for reporting purposes, albeit with
some modifications to take account of the limitations of ETSA Utilities’ data
(namely line lengths were approximations and load estimates were not
necessarily up to date).
Service standards have never been set by reference to the SCONRRR
categories in South Australia.11 Rather, in conjunction with ETSA Utilities,
ESCOSA undertook an analysis of three years of historical reliability
performance data (2000/01 to 2002/03) to assess the degree of volatility within
and across the thirteen development regions identified at the time by ETSA
Utilities and to form a view on the degree to which it would be reasonable to
combine some regions in order to reduce this volatility.
The outcome was to reduce the number of regions from thirteen to seven
which were considered to provide a reasonable representation of differences in
reliability performance across the State while eliminating more extreme
variations arguably attributable to random, severe weather events.
Reliability of supply targets were set for each of these seven regions and these
formed the basis of the service standard regime. ETSA Utilities was also
required to report its performance against the SCONRRR feeder categories for
the purpose of national comparison.
8 Essential Services Commission Electricity Distribution Code January 2011
http://www.esc.vic.gov.au/getattachment/a6b85585-af03-4a2e-bb17-dfff74bbd886/Electricity-Distribution-Code-January-2011.pdf
9 Electricity Distribution Code May 2012 Version 7 http://www.esc.vic.gov.au/getattachment/c2697e4e-d485-4b6d-a5a5-11149fa3b3df/Electricity-Distribution-Code-May-2012.pdf
10 Electricity Distribution Code May 2012 Version 7 http://www.esc.vic.gov.au/getattachment/c2697e4e-d485-4b6d-a5a5-11149fa3b3df/Electricity-Distribution-Code-May-2012.pdf
11 South Australian Electricity Distribution Service Standards 2010 -2015 Final Decision http://www.escosa.sa.gov.au/library/100617-ServiceStandards2010-2015-FinalDecision.pdf

Independent review of distribution network feeder category definitions
Distribution networks – service standard regulation 12
ESCOSA faced a similar issue in South Australia as does the Commission in
the Northern Territory. The strict application of the SCONRRR categories to
ETSA Utilities’ network would have resulted in approximately 85 feeders (or
110,000 customers) previously classified as urban being reclassified as rural,
due to their load density being less than 0.3 MVA per km.12 ETSA Utilities
individually assessed each of the potential “abnormal” feeders and applied a
“commonly accepted notion” of urban versus rural.
ETSA Utilities’ submission to ESCOSA’s draft decision for the 2010-15
determination of service standards reinforced its reluctance to use the regional
approach to reliability reporting and its preference for using the SCONRRR
categories alone. Notwithstanding this, ESCOSA’s Final Decision for the
2010-2015 regulatory period was that reliability of supply standards:
will continue to be applied on the basis of the seven regions presently established
under the Electricity Distribution Code, with an enhanced reporting regime to be
established for reporting on performance on the [SCONRRR feeder categories].
2.3.4 Tasmania
The approach taken by the Office of the Tasmanian Energy Regulator
(OTTER) to distribution performance and reliability standards represents a
significant departure from the SCONRRR approach. It is not based on the
nature of the distribution network, but on the community that it serves.
This approach was developed by matching standards to the nature of the
individual community, the value of electricity supply reliability to the
community, and the cost of providing this level of reliability.
In January 2008, OTTER set distribution network reliability standards for
Tasmania through a process of determining the boundaries of geographic
regions (those that may have different performance standards from
neighbouring regions) of which 101were identified.13 It then grouped these
regions into the following five categories:
1. critical infrastructure;
2. high density commercial;
3. urban;
4. higher density rural; and
12 See footnote 12
13 The proposed regions have been classified based on electricity consumption density per unit area. The ability of Aurora Energy to relate sales data to connection points within its geographical information system (GIS) has enabled this approach. In taking this approach, the working group has assumed that in areas where electricity use is higher, reliability will consequently have a higher value. The working group noted that, in reality, the value of reliability is highly variable within areas, between different consumers and even between times of day.

Independent review of distribution network feeder category definitions
Distribution networks – service standard regulation 13
5. lower density rural.
These regions and categories were developed by a working group made up of
representatives from OTTER, Aurora Energy (Aurora) and the Office of
Energy Planning and Conservation and were based on the following design
principles:1415
• that it is equitable to have different reliability standards for distinctly
different types of communities;
• that like communities should receive like levels of supply reliability;
• that current average performance is generally acceptable to the community
in relation to the community’s willingness to pay for improved reliability,
noting that there exist areas of poor performance;
• that communities receiving a level of supply reliability lower than that
appropriate for the nature of that community should be individually
recognised by the standards; and
• that there exists a minimum level of supply reliability that an electricity
distributor should provide to all customers.
Despite this approach to the determination of reliability standards, similarly to
ETSA Utilities in South Australia, Aurora continues to report performance
against the SCONRRR feeder categories for national comparison.16
2.3.5 Queensland
In May 2001, the Queensland Competition Authority (QCA) noted that the
quality and quantity of available data was not sufficient to enable an effective
service quality regime to be put in place.17
14 Joint Working Group Final Report Distribution Network Reliability Standards Volume I-
Summary of Recommendations and Overview. http://www.economicregulator.tas.gov.au/domino/otter.nsf/LookupFiles/R%20-%20Dx%20Standards%2007%20Final%20Report%20v1.0%20Volume%201.pdf/$file/R%20-%20Dx%20Standards%2007%20Final%20Report%20v1.0%20Volume%201.pdf
15 The second volume of the Joint Working Group Final Report contains more technical details on the methodology employed in relation to the above, including the way in which the maps were developed.
16 Joint Working Group Final Report Distribution Network Reliability Standards Volume I – Summary of Recommendations and Overview.http://www.economicregulator.tas.gov.au/domino/otter.nsf/LookupFiles/R%20-%20Dx%20Standards%2007%20Final%20Report%20v1.0%20Volume%201.pdf/$file/R%20-%20Dx%20Standards%2007%20Final%20Report%20v1.0%20Volume%201.pdf
17 Final Determination Regulation of Electricity Distribution May 2001 http://www.qca.org.au/files/ACF895.pdf

Independent review of distribution network feeder category definitions
Distribution networks – service standard regulation 14
To address this, the QCA introduced a comprehensive service quality reporting
and monitoring regime for the 2001-2005 regulatory period. The intention was
that this would support the development of an appropriate incentive regime
for the next regulatory period. Electricity distributors were required to report
specific service quality measures which would support the development of an
appropriate regime in the next regulatory period.
Service quality data were segmented by classifying feeders according to
whether they served a CBD, Urban or Rural area using the SCONRRR feeder
categories.
The QCA also sought a method of segmenting service quality data, stating
service quality measures need to not only reflect the performance of the
electricity distributor, but also the basic geographic and demographic
characteristics of the region. Its objective was to allow a comparison with
distribution systems with broadly similar characteristics.
In its Final Determination Regulation of Electricity Distribution of April
200518, the QCA noted the difficulty experienced in developing a set of service
quality incentives in 2001 due to the lack of available and comparable service
quality data for distributors. A number of service quality initiatives were
announced and the QCA released its decision on a service quality incentive
scheme to be incorporated into the regulatory arrangements commencing 1
July 2005. This scheme was to be based on a regulatory contract with each
distributor and targeting specific service quality outcomes to be achieved by
the end of the next regulatory period.
In 2008, the AER published its framework and approach paper for Qld
electricity distributors in November 2008, in which it stated that it would apply
its Service Target Performance Incentive Scheme for Electricity Distribution
Network Service Providers (STPIS) in the next regulatory period (2010-2015).
When the application of the STPIS was imminent, Ergon Energy sought
increased capital expenditure for a feeder improvement program to meet it. 19
However, the AER did not consider that this increased capital expenditure was
necessary or prudent. It maintained that Ergon Energy’s forecast reliability and
quality improvement capital expenditure should remain at current regulatory
period levels in the final decision.20
18 http://www.qca.org.au/files/ACF14.pdf
19 Ergon Energy, Revised regulatory proposal, January 2010.
20 Queensland Final Distribution Decision, 2011 – 2015, pg 119. http://www.aer.gov.au/sites/default/files/Queensland%20distribution%20decision.pdf

Independent review of distribution network feeder category definitions
Distribution networks – service standard regulation 15
In its Final Decision for the current period, the AER has set STPIS targets
based on the SCONRRR classification of feeders with adjustments made on an
individual distributor basis which require steady improvements in the reliability
of supply provided by Energex and Ergon Energy.
2.3.6 New South Wales
The New South Wales Minister for Energy (the Minister) is responsible for the
design, reliability and performance licence conditions for electricity distributors
operating in New South Wales.
The Independent Pricing and Regulatory Tribunal (IPART) is the independent
regulator that determines the maximum prices that can be charged for retail
energy and monitors service delivery, and licence compliance.
Effective from 1 December 2007, utilising the SCONRRR feeder
classifications, NSW electricity distributors were required to reach minimum
average reliability performance standards, measured as System Average
Interruption Duration Index (SAIDI) and System Average Interruption
Frequency Index (SAIFI) by individual feeder type. 21
These licencing conditions were to be reviewed by the Minister by June 2010
so that any changes or amendments could coincide with the commencement of
the 2014-19 regulatory period. To date this has not taken place, however the
Australian Energy Market Commission presented its Final Report – NSW
Workstream, Review of Distribution Reliability Outcomes and Standards to
the New South Wales Government on 31 August 2012 which is currently
under review by the Minister.22
At present in NSW, the electricity distributors are required to meet and report
on the reliability standards on an average basis across their network, and also
meet and report on reliability performance on an individual feeder basis, which
provides a minimum level of performance for all customers.
Where an electricity distributor does not meet the individual standard,
additional reporting is required, including the cause of exceeding the standard,
any action to improve the performance and any operational actions which were
identified.23
21 Design, Reliability and Performance Licence Conditions for Distribution Network Service
Providers http://www.ipart.nsw.gov.au/Home/Industries/Electricity/Licensing/Licence_Conditions
22 Australian Energy Market Commission Final Report – NSW Workstream, Review of Distribution Reliability Outcomes and Standards, 31 August 2012
23 Australian Energy Market Commission Final Report – NSW Workstream, Review of Distribution Reliability Outcomes and Standards, 31 August 2012

Independent review of distribution network feeder category definitions
Distribution networks – service standard regulation 16
2.3.7 AER approach
Since its inception in 2007, the AER has made regulatory determinations for
electricity distributors in all National Electricity Market (NEM) jurisdictions.24
Its most recent determination was for Aurora in Tasmania in April 2012.
Generally, the AER’s approach to service standard regulation of electricity
distribution businesses has been to apply its STPIS, which has four
components, namely reliability of supply, GSLs, quality of supply and customer
service.
Only the reliability of supply and GSL components of the STPIS are relevant
for present purposes.
The reliability of supply component of the STPIS is based on average
performance and implemented through a parameter known as the ‘s-factor’. If
a business exceeds an average performance target for a reliability of supply or
customer service indicator it receives a payment. If it falls short of the target, it
pays a penalty.
The size of the payment or penalty is determined in advance and known as the
incentive rate. Any payment or penalty becomes an adjustment in the electricity
distribution tariff, so customers ultimately pay more for superior performance
or less for inferior performance, though the magnitude for an individual
customer will typically be small.
By contrast to the s-factor, under the GSL component of the STPIS an
individual customer who receives service that is below a particular level
receives a direct payment.
These two components of the STPIS can be varied in their application by
changing their parameters. For the s-factor, the average targets and incentive
rates can be changed, while for the GSL component, the GSL payments and
GSLs can be changed. In setting the parameters, the regulator needs to remain
aware that improved service can only be improved at a cost, so increasing these
parameters has implications for network costs and therefore tariffs.
The AER has invariably applied the ‘s-factor’ to feeder categories in all
jurisdictions other than Tasmania. It has applied the s-factor using the
SCONRRR feeder categories. However, it is not clear that this reflects the
AER’s preference or that the AER has necessarily considered the question of
feeder categorisation in detail.
24 This is all Australian jurisdictions except the Northern Territory and Western Australia.

Independent review of distribution network feeder category definitions
Distribution networks – service standard regulation 17
Under the National Electricity Rules, the AER regulates electricity distribution
businesses using a ‘propose-respond’ model. Electricity distributors begin the
process by proposing a regulatory framework which the AER has the choice of
either accepting or rejecting entirely. The AER cannot modify an electricity
distributor’s proposal and can only reject it if it is unreasonable.
In the case of feeder categories, the AER has invariably accepted the electricity
distributor’s proposed approach. The only exception is that Aurora proposed
that the s-factor scheme should not be applied to its business. The AER did
not accept Aurora’s original regulatory proposal, partly for this reason. In its
revised proposal, Aurora proposed that the s-factor scheme be applied to the
five categories and 101 regions discussed in section 2.3.4 above. The AER
accepted Aurora’s revised proposal.
2.4 Comparing performance with other jurisdictions
The purpose of this report is, in part, to assist the Commission in considering
whether it is appropriate for the Territory to adopt a different approach to
feeder categorisation that is currently used in other jurisdictions.
Any change from the standard feeder type definitions will reduce the extent to
which comparisons can be made between the Territory and other jurisdictions.
While this is a reason to consider changes carefully, thought should also be
given to the value of those comparisons in the first instance.
Broadly, two types of comparison can be made.
First, with standard feeder categories and reporting, it is relatively simple to
compare performance in one jurisdiction with another.
Second, the cost of improving performance could be compared between
jurisdictions. For example, the cost of reducing SAIDI by a certain amount
could be compared between jurisdictions.
The value of the first comparison is unclear. According to the Energy Supply
Association of Australia (esaa) SAIDI in the Territory in 2011was 405.6
minutes. 25 This is more than any other State or Territory, and more than
double that experienced in some States. In 2011 South Australia experienced
the lowest SAIDI, with 155.1 minutes, closely followed by Victoria with 186.8
minutes.
In our view this comparison, in itself, is of little value.
25 This excludes Indigenous Essential Services.

Independent review of distribution network feeder category definitions
Distribution networks – service standard regulation 18
The Territory has a particular set of characteristics and a particular network. Its
SAIDI performance reflects these things. It would not be reasonable to expect
that SAIDI performance in the Territory should be the same as in smaller,
more densely populated areas such as Victoria or that portion of South
Australia connected to ETSA Utilities’ main distribution network. However,
there is also no way to determine what the relationship between SAIDI
performance in those two places should be.
In any case, at the ‘whole of network’ level reported by esaa, the ability to make
these comparisons is unaffected by feeder category.
Similarly, the value of the second comparison is also unclear. From a regulatory
point of view, rather than asking whether a reduction in SAIDI could be
achieved more cheaply in another jurisdiction a more important question is to
ask whether customers are experiencing optimal levels of service. The answer
to this question depends on customers’ willingness to pay for service
improvements and the cost of supplying those improvements.
To analyse this question, it is important to understand the true cost of
improving the service experienced by customers on the particular part of the
network to which the customer is connected. The cost of improving service in
other jurisdictions is not relevant.
2.5 Conclusion – how feeders should be
categorised
The purpose of this report is to consider whether the SCONRRR feeder
categories are appropriate for the Territory, or, if they are not, how they should
be changed.
Before conclusions can be reached about this, the objective of categorising
feeders must be defined.
Sections 2.3.1 to 2.3.7 summarise the approaches taken to feeder categorisation
in each of the NEM jurisdictions. It is clear that there are two different
objectives for feeder categorisation.
It is also clear the same categorisation is not necessarily applied for both
objectives.
The two objectives are to apply feeder categories:
1. to enable nationally consistent reporting; and
2. as the basis of regulating service quality, specifically reliability of supply.
Insofar as jurisdictions require their electricity distributors to report reliability
performance for national comparison, the basis is the SCONRRR feeder

Independent review of distribution network feeder category definitions
Distribution networks – service standard regulation 19
categories. 26 However some jurisdictions, such as Queensland, have noted the
importance of comparing ‘like with like’ and contemplated using different
feeder categories to enable this comparison.
Insofar as feeder categorisation is intended as the basis for regulating reliability
performance, the approaches vary.
Sections 2.3.1 to 2.3.7 above illustrate that where this issue has been
considered closely, the approach, and the conclusion, has been broadly similar.
All jurisdictions that have considered the use of feeder categories as the basis
of regulating reliability of supply have concluded that it is equitable for
customers in like areas to receive a similarly reliable supply of electricity.
Similarly, it is equitable for the level of supply reliability to be different in
different ‘types’ of area.
The objective of this report is to make recommendations regarding the
appropriate feeder categorisation for the draft Code. This aligns closely with
the second of the two objectives above. Therefore, for these purposes, our
conclusion is that the feeder categories should provide a suitable basis for
regulating reliability of supply. In doing this, they should reflect the notion that
people in areas that are alike should receive like levels of supply reliability.
For the purposes of this report we have assumed that there are two ‘types’ of
areas in the Territory supplied by regulated electricity networks, namely urban
and rural areas. In effect, we proceed on the basis that it is reasonable for
people in either urban or rural areas to expect to receive the same level of
supply reliability as other people living in either urban or rural areas, but that it
may be unreasonable to expect the same level of reliability in rural areas as in
urban areas.
It should be noted that our analysis excludes those parts of the Territory that
are not supplied by regulated electricity networks, notably indigenous
settlements and Yulara.
26 This requirement has now been discontinued in South Australia.

Independent review of distribution network feeder category definitions
Feeder categorisation and the Northern Territory 20
3 Feeder categorisation and the Northern Territory
The Territory occupies a significant part of the centre of the Australian
continent. However, much of it is barely populated. Outside Darwin, the
Territory’s capital, there are a few smaller cities, namely Alice Springs,
Katherine, Nhulunbuy and Tennant Creek. Outside these, the population is
very sparse.
PWC’s regulated electricity networks are in Darwin/Katherine, Alice Springs
and Tennant Creek.27 Between them, these networks comprise of
approximately 370 feeders. However, only 162 of these supply customers
directly. The remainder are excluded from the analysis in this report.28
As required under the Commission’s GSL Code, PWC applied the SCONRRR
feeder categories to the regulated networks. PWC has suggested that the
SCONRRR feeder categories should also be adopted in the draft Code.
The categorisation of feeders in the Darwin area is shown in Figure 1, with
different feeder types shown in different colours.
Figure 1 also shows, in pink shading, the various parts of the greater Darwin
area that satisfy the Australian Bureau of Statistics’ (ABS) definition of an
urban area.29
There is a large area in the middle of this region that does not meet the ABS’s
definition of an urban area because it is occupied by a Royal Australian Air
Force (RAAF) facility, and is thus sparsely populated.
Further, some parts of Darwin south of the RAAF base are primarily
industrial, and do not have sufficient population density to satisfy the ABS’s
definition of an urban area.
For this report the key issue is to distinguish between urban and rural areas.
The industrial part of Darwin and the RAAF base are clearly not rural so they
were manually added to the urban area shown in Figure 1 notwithstanding
their relatively low population density.
27 The extent of the draft Code, and therefore the analysis in this report, is limited to the
networks in these areas.
28 Some feeders act as backups for other feeders. These feeders do not supply customers in their own right. Other feeders supply bus bars or transformers rather than customers.
29 The ABS defines an urban area as a population centre of more than 1,000 people with a population density of at least 200 people per square kilometre

Independent review of distribution network feeder category definitions
Feeder categorisation and the Northern Territory 21
Figure 1 Darwin – feeder categorisation and population density
Source: Power and Water Corporation (feeder categorisation) and Australian Bureau of Statistics 2011 census (population density)
A clear example of the Commission’s concern is seen in the suburbs north of
Darwin Airport. Most of that area is supplied by feeders categorised as rural
short. However, as the first map shows, this area, which is essentially suburban
Darwin, fits entirely within the ABS’s definition of ‘urban’.
Figure 2, Figure 3 and Figure 4 show the corresponding information for
Katherine, Tennant Creek and Alice Springs respectively. They show that a
significant proportion of each of these towns is supplied by feeders categorised
as rural.

Independent review of distribution network feeder category definitions
Feeder categorisation and the Northern Territory 22
Figure 2 Katherine – feeder categorisation and population density
Source: Power and Water Corporation (feeder categorisation) and Australian Bureau of Statistics 2011 census (population density)

Independent review of distribution network feeder category definitions
Feeder categorisation and the Northern Territory 23
Figure 3 Tennant Creek – feeder categorisation and population density
Source: Power and Water Corporation (feeder categorisation) and Australian Bureau of Statistics 2011 census (population density)

Independent review of distribution network feeder category definitions
Feeder categorisation and the Northern Territory 24
Two aspects of the definition of urban should be noted.
First, there is an area on the western edge of Darwin airport, between Ludmilla
and Coconut Grove, which is too sparsely populated to meet the ABS
definition of urban, though we note that the definition also extends to include
areas surrounded by areas with sufficiently dense population. Notwithstanding
that this extension may incorporate this area, it is not marked as urban in the
maps in this report. However, this makes no difference to the feeder
categorisation.
Second, there is an area south of Alice Springs and disconnected from the
main township that is sufficiently densely populated to meet the ABS’s
definition of urban. This is Statistical Area 1 number 7105202. It has an area of
0.86 square kilometres and a population of 561, so it meets the ABS’s
definition. This said, there does not appear to be a large cluster of homes in
this region. In the absence of specific information to the contrary we have
trusted the 2011 ABS census data to be correct.
Figure 4 Alice Springs – feeder categorisation and population density
Source: Power and Water Corporation (feeder categorisation) and Australian Bureau of Statistics 2011 census (population density)

Independent review of distribution network feeder category definitions
Feeder categorisation and the Northern Territory 25
3.1 Whether PWC has applied the feeder
categorisation correctly
ACIL Tasman applied the SCONRRR feeder categories to PWC’s networks
based on data supplied by PWC. In some cases we did not have sufficient data
to compute the categorisation, though we understand this only affected feeders
that do not supply customers. In all other cases, our analysis confirmed PWC’s
application of the SCONRRR categories. Therefore, we conclude that PWC’s
application of the categories was correct.
In conducting this check we attempted to reproduce the feeder length data that
PWC provided from the GIS data for a sample of feeders in Tennant Creek.
We were not able to replicate the feeder lengths. However, this appears to
reflect the fact that feeders may comprise several smaller elements, which our
approach to estimating feeder length would tend to double count.
We cannot confirm PWC’s data regarding the length of its feeders, but nor can
we conclude that it is not correct.
3.2 Alternative approach to feeder categorisation
Having verified PWC’s application of the SCONRRR feeder categories, the
next tasks for which ACIL Tasman was engaged were to:
• identify alternatives to the SCONRRR feeder categories that would best
serve the objectives of the Code while allowing PWC to report consistently
with its peers and minimising reporting costs;
• determine whether it is appropriate for the Commission to use the
SCONRRR feeder categories as the basis for setting targets for reliability of
supply and, if not, what alternative methods may be more appropriate
(including, but not limited to, amendments to the SCONRRR feeder
definition categories).
These two items are similar. They are addressed jointly in this section.
The Commission’s concern arises from the fact that a number of feeders in
urban areas are categorised as rural.30 We are not aware of any concerns
regarding the feeders defined as CBD. Therefore, our analysis was focussed on
the distinction between urban and rural feeders.
30 The distinction between short and long rural feeders is based on the length of the feeder. It
is not relevant for present purposes.

Independent review of distribution network feeder category definitions
Feeder categorisation and the Northern Territory 26
We identified three alternative approaches that could be used to categorise
feeders in the Territory. These were:
1. apply the same approach as the SCONRRR definitions, but change the
threshold MVA/km value to better distinguish urban and rural feeders
2. categorise feeders as ‘radial’ or ‘meshed’
3. set performance targets for specific (geographic) locations.
These three options are discussed in more detail in sections 3.2.1 to 3.2.3. Our
recommended approach, which is a hybrid of these three options, is discussed
in section 3.3. That approach is applied to the regulated networks in chapter 5.
3.2.1 Re-align feeder categories by altering threshold value
The two feeder categories that are central to the Commission’s concern are
‘rural (short and long)’ and ‘urban’. The difference between feeders in these
two categories, as defined, is that urban feeders serve load above a threshold of
0.3 MVA per km while rural feeders (long or short) serve less load.31
Conceptually, the SCONRRR feeder categories could be altered simply by
changing the threshold value. All else being equal if the threshold was lowered
the number of ‘rural’ feeders would reduce and the number of ‘urban’ feeders
would increase.
We understand that the threshold value in SCONRRR’s definition was selected
by taking frequency scatter plots of the maximum demand observed on feeders
in Victoria. The threshold value was somewhat arbitrary and inherently reflects
Victorian conditions from the late 1990s.
Given the structure of the definitions, the feeder categories could be redefined
simply by changing the threshold value. The advantage of this approach is that
it may only require a small change from the existing SCONRRR definitions.
There are three disadvantages.
First, categorising feeders by reference to the load they serve is only as accurate
as the link between the load served and the type of area the feeder serves. For
example, a long feeder that serves a very large load would have the same
average MVA/km as a shorter feeder with a smaller load, though the areas they
serve may not be alike.
In other words, there may be little or no relationship between the load on a
feeder (per km) and the type of area it supplies. In practice we expect that there
is a high correlation between the load on a feeder and the type of area it
31 Rural feeders are then categorised by feeder length using a threshold of 200 km.

Independent review of distribution network feeder category definitions
Feeder categorisation and the Northern Territory 27
supplies, so this may not be a large problem and that it could be addressed by
including an element of discretion to override the automatic categorisation of
certain feeders.
Second, the approach is inherently arbitrary. Without an additional source of
information it would be impossible to know if the ‘right’ threshold value has
been chosen. A method for overcoming this disadvantage is discussed in
section 3.3.
Third, as with any change from the standard SCONRRR definitions, changing
the threshold would reduce the ability to compare with other jurisdictions.
However, we anticipate that systems could be established to ensure that, if
desired, reporting could be based on the standard SCONRRR definition even
if the threshold value was changed for the purpose of setting reliability targets.
3.2.2 Categorise feeders as radial or meshed
Rather than categorising feeders according to the SCONRRR definitions, it
would be possible to categorise them simply as ‘radial’ or ‘meshed’. This
approach is applied under the original Code.
The advantage of this approach is that it is more closely related to the nature of
the network.
The disadvantage is that there does not appear to be a universally accepted
definition of the terms ‘radial’ and meshed’. Our understanding of these two
terms is that a radial network is characterised by few, if any, redundant
elements. By contrast, a meshed network is characterised by multiple
redundant elements.
We note that the number of redundant elements is a question of degree and
this definition may not be sufficiently precise for regulatory purposes.
Contrary to our understanding of the terms, we understand that under the
original Code PWC has interpreted these terms such that ‘radial’ feeders were
all feeders operating at 22kV and meshed feeders were all feeders operating at
11kV.
A modification of this approach would be to use these two voltage levels as the
basis of feeder categorisation. PWC has traditionally used 22kV feeders in rural
areas and 11kV feeders in urban areas.
However, we also understand that PWC now has plans to increase the use of
22kV feeders in urban areas. Therefore, while continuing to rely on this
definition of feeder types may address the Commission’s concern in the short
term, the issue is likely to return in future.

Independent review of distribution network feeder category definitions
Feeder categorisation and the Northern Territory 28
Another disadvantage with this approach is that, as with any departure from
the SCONRRR definitions, it would not allow comparison with other
jurisdictions. Unlike an approach based on a different threshold value, we
anticipate that producing reports based on feeder voltages would require a
more substantial redesign of PWC’s information systems, though the necessary
systems may also be in place given that this approach has been used
historically.
3.2.3 Set performance targets for identified geographic locations
The third approach we considered to feeder categorisation for the purpose of
setting reliability of supply targets was to base them on pre-determined
geographic zones.
This is similar to the approach ESCOSA took with its seven regional zones
(see section 2.3.3). It is also similar to the approach taken in Tasmania where
its 101 regions were identified based on ‘likeness’ and then assigned to a
service category (see section 2.3.4).
This approach has the advantage of allowing a great deal of flexibility, as the
Commission could simply apply standards on a ‘place by place’ basis. It has the
advantage that targets can be set to reflect either the actual performance in an
area or a reasonable improvement from that level.
However, this approach has two disadvantages.
First, as with the approach discussed in section 3.2.2, the change from the
SCONRRR definitions represented by this approach are likely to be such that
it would not provide a meaningful comparison with other jurisdictions.
Second, as with the voltage based option discussed in section 3.2.2, producing
the necessary reports may require a more substantial redesign of PWC’s
information systems than a simple change to the threshold value.
3.3 Recommended approach – a hybrid
Our recommended approach to categorising feeders in the Territory is a hybrid
of options 1 and 3 above.
We recommend that the Commission adopt the principle that customers in like
areas can reasonably expect to receive similar levels of reliability performance
to one another and set its feeder definitions and GSL scheme accordingly.
To minimise the extent of the change from the SCONRRR definitions, and
thus to minimise the change (and cost) required of PWC and to preserve the
ability to report on a nationally consistent basis, we recommend that the

Independent review of distribution network feeder category definitions
Feeder categorisation and the Northern Territory 29
Commission defines feeder categories using the SCONRRR definitions and
reduce the MVA/km but reduce threshold value used to define urban feeders.
To identify the appropriate threshold value, the Commission will need to
identify which parts of the Territory are alike and different. We recommend
dividing the Territory into three area types:
• Urban areas – areas that satisfy the ABS’s definition of an urban area or are
otherwise identified as being urban (industrial) areas
• Rural areas – areas that are supplied by the regulated networks but do not
meet the definition of urban
• Unregulated areas – areas that are not supplied by the regulated networks
Having done this, we recommend that the Commission identify the types of
areas that each customer feeder supplies and allocate feeders accordingly.
This will provide a ‘target’ categorisation for each feeder, but not necessarily
the final definition.
We recommend that the Commission identifies the threshold value that
provides the best match with the ‘target’ categorisation and adopt this as the
threshold value for its feeder categories.
We have applied our recommended approach to PWC’s network in chapter 5

Independent review of distribution network feeder category definitions
The available data 30
4 The available data
The analysis in chapter 5 of this report was based on data provided to ACIL
Tasman by PWC, through the Commission. That data came in two tranches:
1. feeder data - feeder load, length and connections (customers) data and
PWC’s application of the SCONRRR feeder categories provided for 372
feeders
2. geographic information system (GIS) data - were provided for 237 items,
though these appear to be only 162 unique feeders.32
A brief overview of the data PWC supplied is provided below. There are some
aspects of the data that require explanation or in relation to which we made
certain assumptions. Those aspects are outlined in this section.
We understand that the two tranches of data were drawn from different
systems. Data drawn from PWC’s Feeder Information System (FIS) were only
available for customer feeders, that is, feeders that were included in PWC’s
calculation of SAIDI and SAIFI.
Generally the data were straightforward and, in our view, appropriate for the
analysis required.
The feeder data were provided in an Excel spreadsheet. The columns included
in the spreadsheet, along with our understanding of their contents, were:
1. Two Feeder Identifiers:
a) First, an alphanumeric ‘name’ for each feeder which appears to provide
certain descriptive information, such as voltage and location, e.g.
11AK02 Knuckey St; and
b) Second, a shorter alphanumeric ‘name’ for each feeder with no
descriptive information, e.g. NR0006.
2. Feeder final – an alphanumeric ‘name’ for each feeder formatted similarly
to the longer form of feeder ID and usually the same as FEEDER_ID
though for some feeders it was blank. We understand that feeder final was
drawn from the FIS and that the purpose of this column was to link data
from the two systems together. It was blank for feeders not modelled in
FIS.
32 There were two additional feeders for which GIS data were provided without identifiers.
These feeders were disregarded.
Independent review of distribution network feeder category definitions
The available data 31
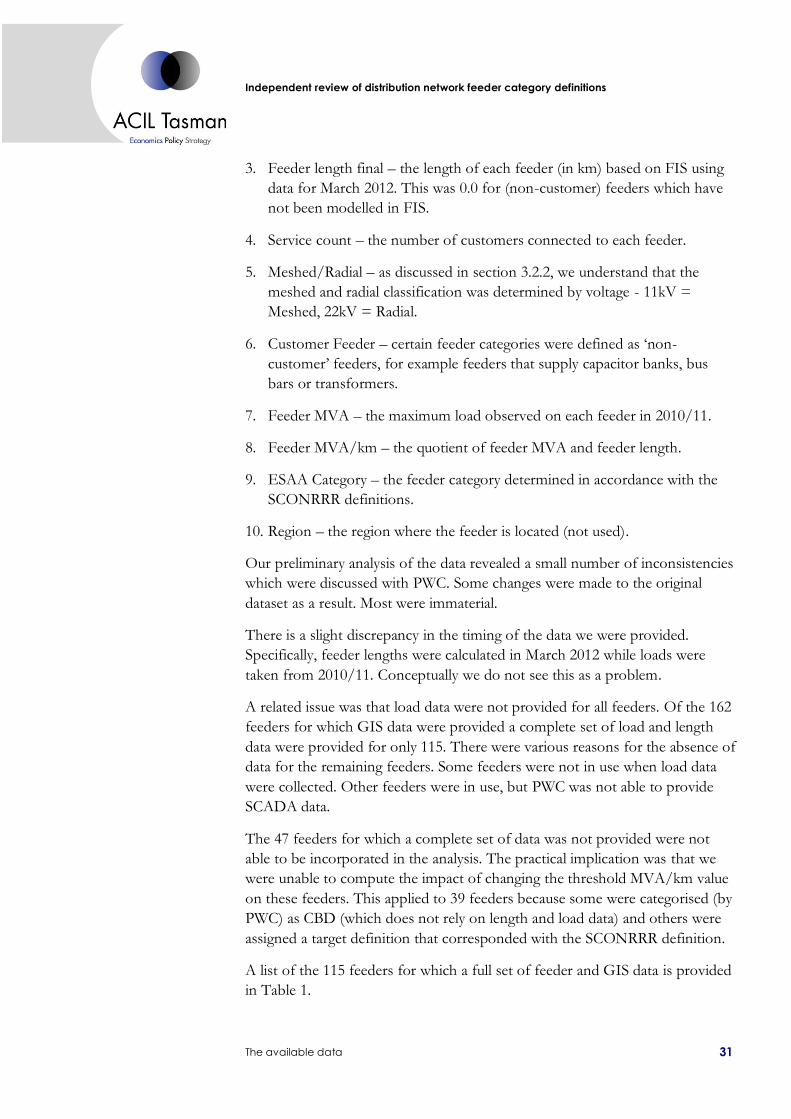
3. Feeder length final – the length of each feeder (in km) based on FIS using
data for March 2012. This was 0.0 for (non-customer) feeders which have
not been modelled in FIS.
4. Service count – the number of customers connected to each feeder.
5. Meshed/Radial – as discussed in section 3.2.2, we understand that the
meshed and radial classification was determined by voltage - 11kV =
Meshed, 22kV = Radial.
6. Customer Feeder – certain feeder categories were defined as ‘non-
customer’ feeders, for example feeders that supply capacitor banks, bus
bars or transformers.
7. Feeder MVA – the maximum load observed on each feeder in 2010/11.
8. Feeder MVA/km – the quotient of feeder MVA and feeder length.
9. ESAA Category – the feeder category determined in accordance with the
SCONRRR definitions.
10. Region – the region where the feeder is located (not used).
Our preliminary analysis of the data revealed a small number of inconsistencies
which were discussed with PWC. Some changes were made to the original
dataset as a result. Most were immaterial.
There is a slight discrepancy in the timing of the data we were provided.
Specifically, feeder lengths were calculated in March 2012 while loads were
taken from 2010/11. Conceptually we do not see this as a problem.
A related issue was that load data were not provided for all feeders. Of the 162
feeders for which GIS data were provided a complete set of load and length
data were provided for only 115. There were various reasons for the absence of
data for the remaining feeders. Some feeders were not in use when load data
were collected. Other feeders were in use, but PWC was not able to provide
SCADA data.
The 47 feeders for which a complete set of data was not provided were not
able to be incorporated in the analysis. The practical implication was that we
were unable to compute the impact of changing the threshold MVA/km value
on these feeders. This applied to 39 feeders because some were categorised (by
PWC) as CBD (which does not rely on length and load data) and others were
assigned a target definition that corresponded with the SCONRRR definition.
A list of the 115 feeders for which a full set of feeder and GIS data is provided
in Table 1.

Independent review of distribution network feeder category definitions
The available data 32
Table 1 Feeders with full set of data
# Feeder
1 11AK03 AUSTIN LANE
2 11BE01 LEANYER
3 11BE03 TDZ
4 11BE04 MCMILLANS
5 11BE06 KARAMA 1
6 11BE07 NAVY
7 11BE09 JAIL
8 11BE10 KARAMA 2
9 11BE13 KORMILDA
10 11BE14 ROBINSON
11 11BE16 ANULA
12 11BE18 PORT
13 11CA00 NIGHTCLIFF 1
14 11CA03 BRADSHAW
15 11CA04 NTU
16 11CA06 FAC- LYONS
17 11CA07 JINGILI
18 11CA10 MILLNER
19 11CA12 MARRARA
20 11CA13 WANGURI
21 11CA15 HOSPITAL
22 11CA16 NAKARA
23 11CA17 CAS SQUARE
24 11CA19 CAS VILLAGE
25 11CA23 MOIL
26 11CA24 CAZSS BUSTIE 3/4
27 11CA25 BRINKIN
28 11CZ02 WEST BENNETT 1
29 11CZ03 AUSTIN KNUCKEY 1
30 11CZ05 WOODS ST 1
31 11CZ06 MOTT ST 1
32 11CZ07 STUART PARK
33 11CZ09 AUSTIN KNUCKEY 2
34 11CZ10 MITCHELL ST 1
35 11CZ12 MOTT STREET 2
36 11CZ13 WEST BENNETT 2
37 11CZ14 GARDENS
38 11CZ16 WOODS ST 2
39 11CZ17 MITCHELL ST 2
40 11CZ19 CITY VALLEY
# Feeder
41 11CZ20 DINAH BEACH
42 11FB09 WATERFRONT
43 11LG06 BRADSHAW
44 11LG07 ARALUEN
45 11LG13 ELDER
46 11LG15 LARAPINTA
47 11LG16 BRAITLING
48 11ML09 DALY
49 11PA02 WALER
50 11PA03 PALM SHOPS
51 11PA04 BAKEWELL
52 11PA07 GRAY
53 11PA08 GUNN
54 11PA09 TF T1
55 11PA10 DRIVER
56 11PA11 FARRAR
57 11PA15 MOULDEN
58 11PA17 THORNGATE
59 11PA18 WOODROFFE
60 11PA19 DURACK
61 11PA21 YARRAWONGA
62 11PA22 PALM CIVIC
63 11PA23 GEORGINA
64 11RG01 GAP
65 11RG02 GOLF COURSE
66 11RG06 SADADEEN
67 11RG07 HOSPITAL
68 11RG08 CBD
69 11RG19 NTHSTUHWY
70 11RG20 WILLS
71 11RG21 GILLEN
72 11SN01 FANNIE BAY
73 11SN02 BAGOT
74 11SN05 MARANGA
75 11SN07 BAYVIEW
76 11SN10 GOYDER
77 11SN13 BISHOP
78 11SN14 COONAWARRA
79 11SN16 PARAP
80 11SN17 RAAF

Independent review of distribution network feeder category definitions
The available data 33
# Feeder
81 11SN19 LUDMILLA
82 11WB08 WHARF PRECINCT
83 11WS03 DASHWOOD
84 11WS08 CULLEN
85 11WS11 KITCHENER
86 22BR102 BOREFIELDS
87 22HD402 LAMBELLS
88 22HD403 MIDDLE POINT
89 22KP03 TINDAL 2
90 22KP04 KATH EAST
91 22KP06 PINE CREEK
92 22KP07 MATARANKA
93 22KP11 OPS TIE
94 22KP12 FLORINA
95 22KP14 GORGE
96 22KP15 TINDAL 1
97 22MA02 BATCHELOR
98 22MA03 ADELAIDE RIVER
# Feeder
99 22MA07 ACACIA
100 22MM05 HERBERT
101 22MM06 STRANGWAYS
102 22MM07 NOONAMAH
103 22MM09 MCMINNS PUMPS
104 22MM10 VIRGINIA
105 22MM11 DARWIN RIVER
106 22MM13 DUNDEE
107 22MR103 MT BUNDY
108 22PA101 HOWARD SPRINGS
109 22PC308 PCK TOWNSHIP
110 22RG04 BREWER 2
111 22RG09 FARMS
112 22RG13 BREWER 1
113 22TC202 FEEDER 2
114 22TC302 FEEDER 3
115 22TC602 FEEDER 6

Independent review of distribution network feeder category definitions
Application of feeder categories 34
5 Application of feeder categories
As discussed in section 3.3, we recommend that the Commission take a three
step approach to categorising feeders as follows:
1. Identify areas in the Territory using ‘urban’, ‘rural’ and ‘unregulated’ zones.
2. Determine which of these two zones each feeder supplies.33
3. Identify the threshold value that provides the best correspondence between
the feeder categorisation developed in step 2 and SCONRRR
categorisation based on that threshold.
These three steps are applied in the following sections.
5.1 Categorise areas in the Territory
As discussed in section 3, the ABS defines an urban centre as one which has:
• a population of more than 1,000 persons.
• a population density of at least 200 persons per square km.
Figure 1 to Figure 4 above show the parts of the Territory that we consider to
be urban areas. The areas marked in those figures either satisfy the ABS’s
definition of urban, based on population density, or have been identified as
being industrial in nature, and are thus clearly not rural. The remainder of the
area connected to the regulated networks is defined as rural.
5.2 Determine which zones each feeder supplies
The next step was to identify the feeders that supply ‘urban’ areas and those
which supply rural areas. For this purpose PWC provided GIS data regarding
the location of each of its (customer) feeders.
Theoretically, this analysis should be based on the location of customers
supplied by each feeder. However, this is not available. That is, PWC does not
have detailed data regarding the location of each of its customers.34
In the absence of data concerning the location of customers themselves we
assumed that feeders supply the area where they are located. In most cases this
was acceptable. However, in a small number of cases we noted that some
33 By definition the regulated networks do not supply customers in unregulated areas so the
feeder with which we are concerned can only be in one of the other two zones.
34 It is not surprising that a distribution network business does not have this level of data.

Independent review of distribution network feeder category definitions
Application of feeder categories 35
feeders passed through urban areas and then extended for a significant distance
into rural areas. These feeders are marked here as ‘mixed’.35
Therefore, each feeder was assigned a target categorisation as shown in Table
2. Note that all 162 feeders are listed in Table 2, though the next section,
relating to selecting the threshold value, is limited to the 115 feeders for which
a full set of data was available.
35 We have no way of knowing whether those feeders supply customers in urban areas ‘on
their way’ to rural areas, though it seems likely.

Independent review of distribution network feeder category definitions
Application of feeder categories 36
Table 2 Target feeder categorisations
# Feeder target
1 11AK03 AUSTIN LANE CBD
2 11BE01 LEANYER Urban
3 11BE03 TDZ Urban
4 11BE04 MCMILLANS Urban
5 11BE06 KARAMA 1 Urban
6 11BE07 NAVY Urban
7 11BE08 BEZSS BUSTIE
1/2
Urban
8 11BE09 JAIL Urban
9 11BE10 KARAMA 2 Urban
10 11BE11 BEZSS CAP
BANK
Urban
11 11BE13 KORMILDA Urban
12 11BE14 ROBINSON Urban
13 11BE16 ANULA Urban
14 11BE17 BEZSS BUSTIE
2/3
Urban
15 11BE18 PORT Urban
16 11BE21 BEZSS BUSTIE
3/4
Urban
17 11CA00 NIGHTCLIFF 1 Urban
18 11CA01 CA CAP NO 1 Urban
19 11CA01 CAZSS CAP
BANK No 1
Urban
20 11CA03 BRADSHAW Urban
21 11CA04 NTU Urban
22 11CA06 FAC- LYONS Urban
23 11CA07 JINGILI Urban
24 11CA08 NORTH LAKES Urban
25 11CA09 CAZSS BUSTIE
1/2
Urban
26 11CA10 MILLNER Urban
27 11CA11 CAZSS CAP
BANK No 2
Urban
28 11CA12 MARRARA Urban
29 11CA13 WANGURI Mixed
30 11CA15 HOSPITAL Urban
31 11CA16 NAKARA Urban
32 11CA17 CAS SQUARE Urban
33 11CA18 CAZSS BUSTIE
2/3
Urban
34 11CA19 CAS VILLAGE Urban
# Feeder target
35 11CA21 NIGHTCLIFF 2 Urban
36 11CA23 MOIL Urban
37 11CA24 CAZSS BUSTIE
3/4
Urban
38 11CA25 BRINKIN Urban
39 11CAZSS BUS 1 Urban
40 11CAZSS BUS 3 Urban
41 11CP4306 WAGAIT Rural
Short
42 11CP4307 BELYUEN Rural
Short
43 11CZ01 CZZSS CAP
BANK No 2
CBD
44 11CZ02 WEST
BENNETT 1
CBD
45 11CZ03 AUSTIN
KNUCKEY 1
CBD
46 11CZ05 WOODS ST 1 CBD
47 11CZ06 MOTT ST 1 CBD
48 11CZ07 STUART PARK Urban
49 11CZ08 CZZSS BUSTIE
1/2
CBD
50 11CZ09 AUSTIN
KNUCKEY 2
CBD
51 11CZ10 MITCHELL ST
1
CBD
52 11CZ12 MOTT
STREET 2
CBD
53 11CZ13 WEST
BENNETT 2
CBD
54 11CZ14 GARDENS Urban
55 11CZ16 WOODS ST 2 CBD
56 11CZ17 MITCHELL ST
2
CBD
57 11CZ19 CITY VALLEY Urban
58 11CZ20 DINAH BEACH Urban
59 11CZ21 CZZSS CAP
BANK No 1
Urban
60 11CZZSS BUS 1 CBD
61 11CZZSS BUS 2 CBD
62 11CZZSS BUS 3 CBD
63 11FB09 WATERFRONT Urban
64 11LG06 BRADSHAW Urban
65 11LG07 ARALUEN Urban

Independent review of distribution network feeder category definitions
Application of feeder categories 37
# Feeder target
66 11LG13 ELDER Urban
67 11LG15 LARAPINTA Urban
68 11LG16 BRAITLING Urban
69 11ML09 DALY CBD
70 11PA01 PAZSS BUSTIE
1/2
Urban
71 11PA02 WALER Urban
72 11PA03 PALM SHOPS Urban
73 11PA04 BAKEWELL Urban
74 11PA06 PAZSS CAP
BANK No 2
Urban
75 11PA07 GRAY Urban
76 11PA08 GUNN Urban
77 11PA09 TF T1 Urban
78 11PA10 DRIVER Mixed
79 11PA11 FARRAR Urban
80 11PA12 PAZSS AUX TF
1
Urban
81 11PA13 PAZSS BUSTIE
2/3
Urban
82 11PA14 PAZSS AUX TF
2
Urban
83 11PA15 MOULDEN Urban
84 11PA16 PAZSS CAP
BANK No 1
Urban
85 11PA17 THORNGATE Urban
86 11PA18 WOODROFFE Urban
87 11PA19 DURACK Urban
88 11PA21
YARRAWONGA
Urban
89 11PA22 PALM CIVIC Urban
90 11PA23 GEORGINA Urban
91 11RG01 GAP Urban
92 11RG02 GOLF
COURSE
Urban
93 11RG06 SADADEEN Urban
94 11RG07 HOSPITAL Urban
95 11RG08 CBD Urban
96 11RG19 NTHSTUHWY Urban
97 11RG20 WILLS Urban
98 11RG21 GILLEN Urban
99 11SN01 FANNIE BAY Urban
100 11SN02 BAGOT Urban
101 11SN04 SNZSS CAP
BANK No 2
Urban
# Feeder target
102 11SN05 MARANGA Urban
103 11SN07 BAYVIEW Urban
104 11SN10 GOYDER Urban
105 11SN13 BISHOP Urban
106 11SN14
COONAWARRA
Urban
107 11SN16 PARAP Urban
108 11SN17 RAAF Urban
109 11SN19 LUDMILLA Urban
110 11SN20 SNZSS CAP
BANK No 1
Urban
111 11WB01 PARLIAMENT CBD
112 11WB08 WHARF
PRECINCT
Urban
113 11WS03 DASHWOOD CBD
114 11WS08 CULLEN Urban
115 11WS11 KITCHENER CBD
116 11YU04 No.1 FEEDER Rural
Short
117 11YU10 No.2 FEEDER Rural
Short
118 11YU17 No.3 FEEDER Rural
Short
119 22BR102 BOREFIELDS Rural
Short
120 22HD402 LAMBELLS Rural
Short
121 22HD403 MIDDLE
POINT
Rural
Short
122 22KP01 AUX TF 1 Rural
Short
123 22KP03 TINDAL 2 Rural
Short
124 22KP04 KATH EAST Urban
125 22KP06 PINE CREEK Rural
Short
126 22KP07 MATARANKA Rural
Long
127 22KP11 OPS TIE Rural
Short
128 22KP12 FLORINA Rural
Short
129 22KP14 GORGE Rural
Short
130 22KP15 TINDAL 1 Rural
Short
131 22KP17 AUX TF 2 Rural
Short

Independent review of distribution network feeder category definitions
Application of feeder categories 38
# Feeder target
132 22KP19 KATHERINE
TOWN
Urban
133 22MA02 BATCHELOR Rural
Short
134 22MA03 ADELAIDE
RIVER
Rural
Short
135 22MA04 NTP Rural
Short
136 22MA05 LAKE
BENNETT
Rural
Short
137 22MA07 ACACIA Rural
Short
138 22MM02 MMZSS CAP
BANK
Rural
Short
139 22MM05 HERBERT Rural
Short
140 22MM06
STRANGWAYS
Rural
Short
141 22MM07 NOONAMAH Rural
Short
142 22MM09 MCMINNS
PUMPS
Rural
Short
143 22MM10 VIRGINIA Rural
Short
144 22MM11 DARWIN
RIVER
Rural
Short
145 22MM13 DUNDEE Rural
Short
146 22MR103 MT BUNDY Rural
# Feeder target
Short
147 22MR303 TOMS GULLY Rural
Short
148 22PA101 HOWARD
SPRINGS
Rural
Short
149 22PC306 MOLINE Rural
Short
150 22PC308 PCK
TOWNSHIP
Rural
Short
151 22RG04 BREWER 2 Rural
Short
152 22RG09 FARMS Mixed
153 22RG13 BREWER 1 Mixed
154 22TC202 FEEDER 2 Rural
Short
155 22TC302 FEEDER 3 Urban
156 22TC402 FEEDER 4 Urban
157 22TC502 FEEDER 5 Mixed
158 22TC602 FEEDER 6 Rural
Long
159 CZ-CP Rural
Short
160 LOVEGROVE
EXPRESS FDR 1
Urban
161 LOVEGROVE
EXPRESS FDR 2
Mixed
162 PINE CK - COSMO
HOWLEY
Rural
Short

Independent review of distribution network feeder category definitions
Application of feeder categories 39
5.3 Select the threshold value
The third step in our approach was to select a threshold value that, when used
in the SCONRRR definition, would provide the best possible match with the
target categorisation.
Feeder categorisation for PWC’s customer feeders was re-calculated with
thresholds ranging from 0.05 MVA/km to 1.0 MVA/km. The resulting
categories were compared with the standard SCONRRR categorisations of
PWC’s customer feeders. The degree to which the two definitions matched is
shown in Figure 5.36
Figure 5 ‘Fit’ between categorisations with different thresholds
Source: ACIL Tasman analysis
As Figure 5 shows, the best match, approximately 95 per cent of the 117
feeders for which the necessary data were provided,37 is achieved with a
threshold of 0.12 MVA/km. That is, if the SCONRRR definition is modified
so that the distinction between rural and urban feeders is drawn at a load of
0.12 MVA/km, rather than 0.3 MVA/km, 95 per cent of PWC’s feeders would
be categorised in accordance with our view based on the feeder locations.
With the standard SCONRRR threshold the match is 75 per cent. The lower
threshold provides a significantly better match between the two definitions. In
fact, any value less than 0.3 MVA/km provides a better match than the
SCONRRR threshold of 0.3 MVA/km.
36 Percentages are shown based on 117 feeders. Feeders for which a full set of data was not
provided are excluded unless they were categorised as CBD. Mixed feeders are excluded.
37 See footnote 36.
0%
10%
20%
30%
40%
50%
60%
70%
80%
90%
100%
0 0.1 0.2 0.3 0.4 0.5
%
Threshold MVA/km
% matching 0.3 MVA/km 0.12 MVA/km

Independent review of distribution network feeder category definitions
Application of feeder categories 40
This process identified a hierarchy of feeder ‘groups’ as follows. The details of
which feeders fall into which group are shown in the following tables:
1. 87 feeders for which the SCONRRR definition corresponds with our
‘target’ definition and thus required no further analysis (Table 3).
2. 75 feeders for which the SCONRRR definition does not correspond with
our target definition comprising:
a) 30 feeders which would be re-categorised from rural to urban based on
a threshold value of 0.12 MVA/km (Table 4)
b) 45 feeders for which we cannot make a firm recommendation,
comprising:
i 6 feeders defined as rural using the SCONRRR definition that
cross from urban to rural areas (mixed feeders) (Table 5); amd
ii 39 feeders for which we received incomplete data and thus cannot
compute the impact of a 0.12 MVA/km threshold (Table 6).
c) 6 feeders which would be ‘mis-matched’ with our target categorisation
at a threshold of 0.12 MVA/km.38
38 Three of these feeders are among the 30 that would be re-categorised at the identified
threshold as well as the 87 whose initial and target categorisations align. Therefore the numbers here do not add to 162 due to double counting. To reconcile to 162, sum:
84 feeders with ‘matching’ definitions that are not also identified as mismatches
6 feeders with mismatched definitions (three that are changed incorrectly and three that are not changed)
27 feeders whose categorisation is recommended to change that are not also identified as mismatches
6 mixed feeders and
39 feeders with incomplete data.

Independent review of distribution network feeder category definitions
Application of feeder categories 41
Table 3 PWC definition matched target definition – no further analysis
# Feeder
1 11AK03 AUSTIN LANE
2 11BE07 NAVY
3 11BE10 KARAMA 2
4 11BE14 ROBINSON
5 11CA00 NIGHTCLIFF 1
6 11CA04 NTU
7 11CA12 MARRARA
8 11CA15 HOSPITAL
9 11CA17 CAS SQUARE
10 11CA24 CAZSS BUSTIE 3/4
11 11CA25 BRINKIN
12 11CZ01 CZZSS CAP BANK No 2
13 11CZ02 WEST BENNETT 1
14 11CZ03 AUSTIN KNUCKEY 1
15 11CZ05 WOODS ST 1
16 11CZ06 MOTT ST 1
17 11CZ07 STUART PARK
18 11CZ08 CZZSS BUSTIE 1/2
19 11CZ09 AUSTIN KNUCKEY 2
20 11CZ10 MITCHELL ST 1
21 11CZ12 MOTT STREET 2
22 11CZ13 WEST BENNETT 2
23 11CZ14 GARDENS
24 11CZ16 WOODS ST 2
25 11CZ17 MITCHELL ST 2
26 11CZ19 CITY VALLEY
27 11CZZSS BUS 1
28 11CZZSS BUS 2
29 11CZZSS BUS 3
30 11FB09 WATERFRONT
31 11LG06 BRADSHAW
32 11LG07 ARALUEN
33 11LG13 ELDER
34 11LG16 BRAITLING
35 11ML09 DALY
36 11PA02 WALER
37 11PA03 PALM SHOPS
38 11PA07 GRAY
39 11PA08 GUNN
40 11PA09 TF T1
# Feeder
41 11PA18 WOODROFFE
42 11PA19 DURACK
43 11PA22 PALM CIVIC
44 11RG01 GAP
45 11RG02 GOLF COURSE
46 11RG07 HOSPITAL
47 11RG08 CBD
48 11RG20 WILLS
49 11SN07 BAYVIEW
50 11SN10 GOYDER
51 11SN13 BISHOP
52 11SN14 COONAWARRA
53 11SN16 PARAP
54 11SN17 RAAF
55 11SN19 LUDMILLA
56 11WB01 PARLIAMENT
57 11WB08 WHARF PRECINCT
58 11WS03 DASHWOOD
59 11WS08 CULLEN
60 11WS11 KITCHENER
61 22BR102 BOREFIELDS
62 22HD402 LAMBELLS
63 22HD403 MIDDLE POINT
64 22KP03 TINDAL 2
65 22KP06 PINE CREEK
66 22KP07 MATARANKA
67 22KP11 OPS TIE
68 22KP12 FLORINA
69 22KP14 GORGE
70 22KP15 TINDAL 1
71 22MA02 BATCHELOR
72 22MA03 ADELAIDE RIVER
73 22MA07 ACACIA
74 22MM05 HERBERT
75 22MM06 STRANGWAYS
76 22MM07 NOONAMAH
77 22MM09 MCMINNS PUMPS
78 22MM10 VIRGINIA
79 22MM11 DARWIN RIVER
80 22MM13 DUNDEE

Independent review of distribution network feeder category definitions
Application of feeder categories 42
# Feeder
81 22MR103 MT BUNDY
82 22PA101 HOWARD SPRINGS
83 22PC308 PCK TOWNSHIP
84 22RG04 BREWER 2
# Feeder
85 22TC202 FEEDER 2
86 22TC302 FEEDER 3
87 22TC602 FEEDER 6
Data source: ACIL Tasman analysis
Table 4 Feeders recommended to be re-categorised as urban
# Feeder
1 11BE01 LEANYER
2 11BE03 TDZ
3 11BE06 KARAMA 1
4 11BE09 JAIL
5 11BE13 KORMILDA
6 11BE16 ANULA
7 11CA03 BRADSHAW
8 11CA06 FAC- LYONS
9 11CA07 JINGILI
10 11CA10 MILLNER
11 11CA16 NAKARA
12 11CA19 CAS VILLAGE
13 11CA23 MOIL
14 11CZ20 DINAH BEACH
15 11LG15 LARAPINTA
# Feeder
16 11PA04 BAKEWELL
17 11PA11 FARRAR
18 11PA15 MOULDEN
19 11PA17 THORNGATE
20 11PA21 YARRAWONGA
21 11PA23 GEORGINA
22 11RG06 SADADEEN
23 11RG19 NTHSTUHWY
24 11RG21 GILLEN
25 11SN01 FANNIE BAY
26 11SN05 MARANGA
27 22BR102 BOREFIELDS
28 22KP03 TINDAL 2
29 22KP04 KATH EAST
30 22MM09 MCMINNS PUMPS a the McMinns pumps feeder may require special consideration, see below.
Data source: ACIL Tasman analysis
Table 5 Mixed feeders
# Feeder
1 11CA13 WANGURI
2 11PA10 DRIVER
3 22RG09 FARMS
4 22RG13 BREWER 1
5 22TC502 FEEDER 5
6 LOVEGROVE EXPRESS
FDR 2
Data source: ACIL Tasman analysis

Independent review of distribution network feeder category definitions
Application of feeder categories 43
Table 6 Feeders with incomplete data
# Feeder
1 11BE08 BEZSS BUSTIE 1/2
2 11BE11 BEZSS CAP BANK
3 11BE17 BEZSS BUSTIE 2/3
4 11BE21 BEZSS BUSTIE 3/4
5 11CA01 CA CAP NO 1
6 11CA01 CAZSS CAP BANK No 1
7 11CA08 NORTH LAKES
8 11CA09 CAZSS BUSTIE 1/2
9 11CA11 CAZSS CAP BANK No 2
10 11CA18 CAZSS BUSTIE 2/3
11 11CA21 NIGHTCLIFF 2
12 11CAZSS BUS 1
13 11CAZSS BUS 3
14 11CP4306 WAGAIT
15 11CP4307 BELYUEN
16 11CZ21 CZZSS CAP BANK No 1
17 11PA01 PAZSS BUSTIE 1/2
18 11PA06 PAZSS CAP BANK No 2
19 11PA12 PAZSS AUX TF 1
20 11PA13 PAZSS BUSTIE 2/3
# Feeder
21 11PA14 PAZSS AUX TF 2
22 11PA16 PAZSS CAP BANK No 1
23 11SN04 SNZSS CAP BANK No 2
24 11SN20 SNZSS CAP BANK No 1
25 11YU04 No.1 FEEDER
26 11YU10 No.2 FEEDER
27 11YU17 No.3 FEEDER
28 22KP01 AUX TF 1
29 22KP17 AUX TF 2
30 22KP19 KATHERINE TOWN
31 22MA04 NTP
32 22MA05 LAKE BENNETT
33 22MM02 MMZSS CAP BANK
34 22MR303 TOMS GULLY
35 22PC306 MOLINE
36 22TC402 FEEDER 4
37 CZ-CP
38 LOVEGROVE EXPRESS FDR 1
39 PINE CK - COSMO HOWLEY
Data source: ACIL Tasman analysis
The 0.12MVA/km threshold does not provide a perfect match with our target
categorisations. At this threshold the six feeders listed in Table 7 would be
mis-categorised by reference to their target categorisation.
Table 7 Mismatched feeders
Feeder Initial
categorisation
Target
categorisation
MVA/km Recommended
categorisation
at 0.12
MVA/km
11BE04 MCMILLANS Rural Short Urban 0.07 Rural Short
11BE18 PORT Rural Short Urban 0.07 Rural Short
11SN02 BAGOT Rural Short Urban 0.11 Rural Short
22BR102 BOREFIELDS Rural Short Rural Short 0.23 Urban
22KP03 TINDAL 2 Rural Short Rural Short 0.13 Urban
22MM09 MCMINNS PUMPS Rural Short Rural Short 0.26 Urban
Note: Three of the feeders in this table are also in Table 3, so the total number of feeders does not add correctly.
For three of these feeders, the load is not high enough to ‘cross’ even the lower
threshold. In other words, while our recommended approach resolves some of
the Commission’s concerns, it does not resolve all of them.

Independent review of distribution network feeder category definitions
Application of feeder categories 44
For the remaining three mismatched feeders, adopting a threshold of 0.12
causes them to be defined as urban even though they are not in urban areas.
That is, the change in threshold creates the reverse issue to that identified by
the Commission in the first place.
This is a counter-intuitive result that should ideally be avoided. However, we
understand that none of these feeders could be described as a typical rural
feeder. Rather, we understand that one supplies a water pumping station
owned by PWC and no other services, which makes it an unusual feeder that is
not truly a customer feeder. Another of these feeders appears to supply a
borefield, making it different from a typical rural feeder. The third, 22KP03
TINDAL 2, appears to supply a Royal Australian Air Force Base.
Given the unusual nature of these feeders, we do not see this result as a reason
to modify our recommended approach. However, it underscores the
importance of retaining a discretionary element in the final approach to feeder
categorisation. Therefore, our final recommendation is that the 162 feeders for
which a full set of data was provided should be categorised as per Table 8
(details for each feeder are in Appendix A):
Table 8 Recommended feeder categories
Feeder categorisation Number of feeders
CBD 20
Urban (based on threshold) 68
Urban (based on location alone) 3
Rural Short 21
Rural Long 2
Mixed 9
Subtotal 123
Local Judgement 39
Total 162
Figures 6, 7, 8 and 9 provide maps showing the effect of re-categorising the
regulated networks using a threshold of 0.12 MVA/km. Feeders that were
categorised as rural under the standard SCONRRR approach and are
categorised as urban with this lower threshold are identified separately from
feeders whose categorisation is not changed.
The figures show that, for the most part, when feeders are categorised using a
threshold of 0.12 MVA/km to distinguish between urban and rural feeders, the
urban areas of the Territory are supplied by feeders categorised as urban.
There is an area between Darwin and Palmerston where the feeder
categorisation is varied (see Figure 6). Some feeders in this area are categorised

Independent review of distribution network feeder category definitions
Application of feeder categories 45
as urban and others rural. This may reflect the specific nature of this area, or it
may be reason to examine the appropriate categorisation of these feeders more
closely.
It is clear from the maps that a number of feeders for which a full set of data
was not available, that is, those listed in Table 6, are in urban areas. As with the
six mismatched feeders listed in Table 7 our recommendation is that these
feeders be categorised based on the best available information as to where the
customers they supply are located.

46
Ap
plic
atio
n o
f fee
de
r ca
teg
orie
s
Ind
ep
en
de
nt re
vie
w o
f distrib
utio
n n
etw
ork
fee
de
r ca
teg
ory
de
finitio
ns
Figure 6 Darwin – recommended feeder categorisation and population density
Note: the urban (blue) feeder largely on its own in approximately the middle of the map is 11BE14 ROBINSON. The urban (blue) feeder continuing to the north of Palmerston is 11PA02
WALER. These were both originally categorised as Urban and remained so in our target categorisation.
Data source: Power and Water Corporation (feeder categorisation) and Australian Bureau of Statistics 2011 census (population density)

47
Ap
plic
atio
n o
f fee
de
r ca
teg
orie
s
Ind
ep
en
de
nt re
vie
w o
f distrib
utio
n n
etw
ork
fee
de
r ca
teg
ory
de
finitio
ns
Figure 7 Katherine – recommended feeder categorisation and population density
Note: the two Urban (red) feeders outside the urban area are 22KP04 KATH East (upper) and 22KP03 Tindal 2 (lower). The former is marked Urban because a significant portion of it is within
the urban area. It has an MVA/km of 0.27, very close to the SCONRRR threshold. The latter is identified as a ‘mismatched feeder’ in Table 7.
Data source: Power and Water Corporation (feeder categorisation) and Australian Bureau of Statistics 2011 census (population density)
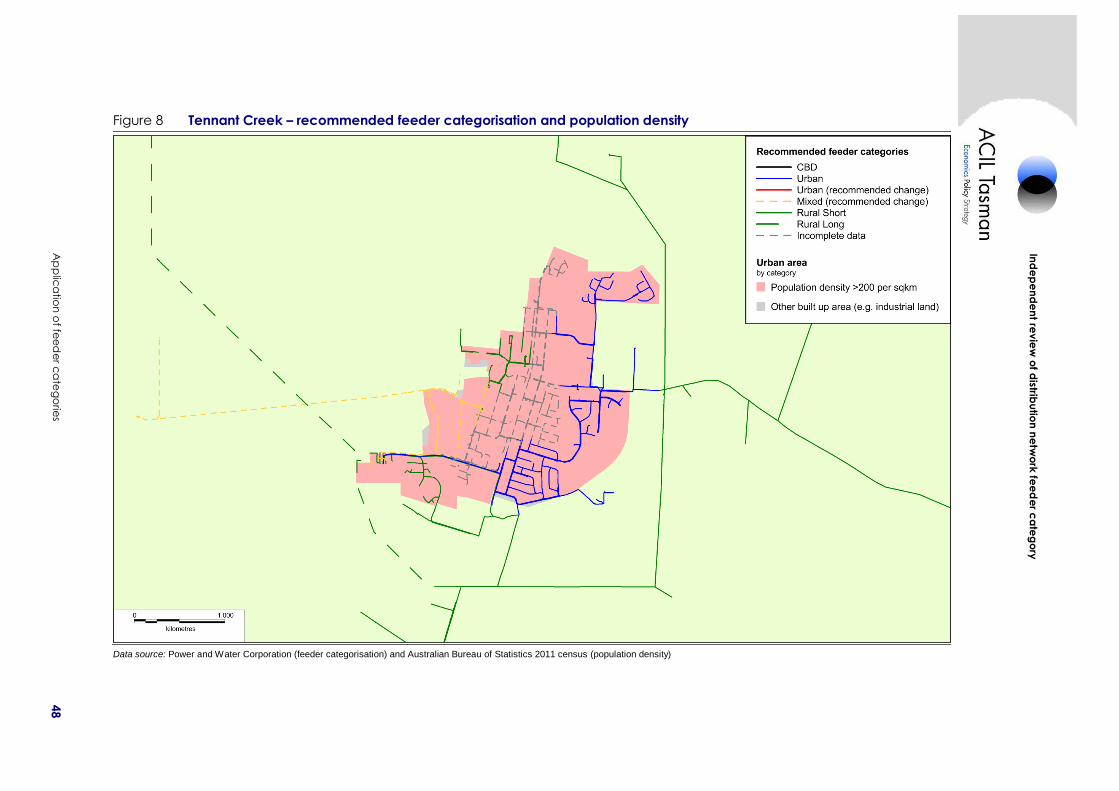
48
Ap
plic
atio
n o
f fee
de
r ca
teg
orie
s
Ind
ep
en
de
nt re
vie
w o
f distrib
utio
n n
etw
ork
fee
de
r ca
teg
ory
de
finitio
ns
Figure 8 Tennant Creek – recommended feeder categorisation and population density
Data source: Power and Water Corporation (feeder categorisation) and Australian Bureau of Statistics 2011 census (population density)

49
Ap
plic
atio
n o
f fee
de
r ca
teg
orie
s
Ind
ep
en
de
nt re
vie
w o
f distrib
utio
n n
etw
ork
fee
de
r ca
teg
ory
de
finitio
ns
Figure 9 Alice Springs – recommended feeder categorisation and population density
NOTE: the urban (red) feeder that extends off the map to the south is 22BR102 BOREFIELDS, see Table 7
Data source: Power and Water Corporation (feeder categorisation) and Australian Bureau of Statistics 2011 census (population density)

Independent review of distribution network feeder category definitions
Conclusion and recommendations 50
6 Conclusion and recommendations
Based on the analysis presented above we have identified a number of
preliminary recommendations for the Commission’s consideration. The
Commission should note that these recommendations might, if adopted,
require PWC to make changes to its databases and other information systems.
These recommendations are based, in part, on our expectation that it would be
simpler for PWC to make some changes to its systems than others. However,
these expectations have not been tested by PWC.
Our recommendations are:
1 That the Commission adopt the view that:
d) customers who are in like areas can reasonably expect to receive a
similarly reliable supply of electricity; and
e) it is reasonable for the level of supply reliability to be different in
different ‘types’ of area.
2. That, for these purposes, parts of the Territory supplied by the regulated
networks can be divided into two types of areas, namely urban and rural
and that the maps presented in this report are a reasonable approximation
of where these types of areas are.
3. That the Commission adopt the view that:
a) the purpose of feeder categorisation in the draft Code is to provide a
reasonable basis for regulating reliability of supply
b) alternative feeder categorisations may be adopted for other reporting
purposes.
4. That, for the impending regulatory period:
a) it would be appropriate to use the standard SCONRRR definitions as a
guide to feeder categorisation with the modification that the threshold
for distinguishing between urban and rural feeders should be 0.12
MVA/km
b) in cases where this method leads to unintended or unacceptable
categorisations, such as mixed feeders which run through urban areas
into rural areas, those categorisations should be amended by agreement
between PWC and the Commission based in part on PWC’s detailed
knowledge of the regulated networks
c) the column in Table A1 headed final recommendation should form the
basis of feeder categorisations for the impending regulatory period.
Feeders marked there as ‘local judgement’ should be categorised based
on the nature and location of customers they supply
5. That, the objectives of the draft Code would be best served by preserving a
degree of discretion over feeder categorisation by making decisions

Independent review of distribution network feeder category definitions
Conclusion and recommendations 51
regarding feeder categorisation in the Commission’s determinations rather
than in the draft Code itself. In practice:
a) the draft Code may indicate that feeder categorisation would be
determined through the regulatory process
b) the regulatory determination, or associated documents, may specify the
categorisation of each feeder.
6. That the Commission make a separate decision as to the basis, if any, on
which it would require reliability of supply to be reported for the purpose
of making comparisons with other jurisdictions.

Independent review of distribution network feeder category definitions
Compiled feeder categorisations A-1
Appendix A Compiled feeder categorisations
Table A1 Type table title here
feeder Initial categorisation
(PWC)
Target
categorisation
Categorisation at threshold of 0.12
MVA/km
Final recommendation
11AK03 AUSTIN LANE CBD CBD CBD CBD
11BE01 LEANYER Rural Short Urban Urban Urban
11BE03 TDZ Rural Short Urban Urban Urban
11BE04 MCMILLANS Rural Short Urban Rural Short
Urban (based on location
alone)
11BE06 KARAMA 1 Rural Short Urban Urban Urban
11BE07 NAVY Urban Urban Urban Urban
11BE08 BEZSS BUSTIE
1/2 Rural Short Urban Incomplete data Local Judgement
11BE09 JAIL Rural Short Urban Urban Urban
11BE10 KARAMA 2 Urban Urban Urban Urban
11BE11 BEZSS CAP
BANK Rural Short Urban Incomplete data Local Judgement
11BE13 KORMILDA Rural Short Urban Urban Urban
11BE14 ROBINSON Urban Urban Urban Urban
11BE16 ANULA Rural Short Urban Urban Urban
11BE17 BEZSS BUSTIE
2/3 Rural Short Urban Incomplete data Local Judgement
11BE18 PORT Rural Short Urban Rural Short
Urban (based on location
alone)
11BE21 BEZSS BUSTIE
3/4 Rural Short Urban Incomplete data Local Judgement
11CA00 NIGHTCLIFF 1 Urban Urban Urban Urban
11CA01 CA CAP NO 1 Rural Short Urban Incomplete data Local Judgement
11CA01 CAZSS CAP
BANK No 1 Rural Short Urban Incomplete data Local Judgement
11CA03 BRADSHAW Rural Short Urban Urban Urban
11CA04 NTU Urban Urban Urban Urban
11CA06 FAC- LYONS Rural Short Urban Urban Urban
11CA07 JINGILI Rural Short Urban Urban Urban
11CA08 NORTH LAKES Rural Short Urban Incomplete data Local Judgement
11CA09 CAZSS BUSTIE
1/2 Rural Short Urban Incomplete data Local Judgement
11CA10 MILLNER Rural Short Urban Urban Urban
11CA11 CAZSS CAP
BANK No 2 Rural Short Urban Incomplete data Local Judgement
11CA12 MARRARA Urban Urban Urban Urban
11CA13 WANGURI Rural Short Mixed mixed mixed
11CA15 HOSPITAL Urban Urban Urban Urban
11CA16 NAKARA Rural Short Urban Urban Urban

Independent review of distribution network feeder category definitions
Compiled feeder categorisations A-2
feeder Initial categorisation
(PWC)
Target
categorisation
Categorisation at threshold of 0.12
MVA/km
Final recommendation
11CA17 CAS SQUARE Urban Urban Urban Urban
11CA18 CAZSS BUSTIE
2/3 Rural Short Urban Incomplete data Local Judgement
11CA19 CAS VILLAGE Rural Short Urban Urban Urban
11CA21 NIGHTCLIFF 2 Rural Short Urban Incomplete data Local Judgement
11CA23 MOIL Rural Short Urban Urban Urban
11CA24 CAZSS BUSTIE
3/4 Urban Urban Urban Urban
11CA25 BRINKIN Urban Urban Urban Urban
11CAZSS BUS 1 Rural Short Urban Incomplete data Local Judgement
11CAZSS BUS 3 Rural Short Urban Incomplete data Local Judgement
11CP4306 WAGAIT Rural Short Rural Short Incomplete data Local Judgement
11CP4307 BELYUEN Rural Short Rural Short Incomplete data Local Judgement
11CZ01 CZZSS CAP
BANK No 2 CBD CBD CBD CBD
11CZ02 WEST BENNETT
1 CBD CBD CBD CBD
11CZ03 AUSTIN
KNUCKEY 1 CBD CBD CBD CBD
11CZ05 WOODS ST 1 CBD CBD CBD CBD
11CZ06 MOTT ST 1 CBD CBD CBD CBD
11CZ07 STUART PARK Urban Urban Urban Urban
11CZ08 CZZSS BUSTIE
1/2 CBD CBD CBD CBD
11CZ09 AUSTIN
KNUCKEY 2 CBD CBD CBD CBD
11CZ10 MITCHELL ST 1 CBD CBD CBD CBD
11CZ12 MOTT STREET 2 CBD CBD CBD CBD
11CZ13 WEST BENNETT
2 CBD CBD CBD CBD
11CZ14 GARDENS Urban Urban Urban Urban
11CZ16 WOODS ST 2 CBD CBD CBD CBD
11CZ17 MITCHELL ST 2 CBD CBD CBD CBD
11CZ19 CITY VALLEY Urban Urban Urban Urban
11CZ20 DINAH BEACH Rural Short Urban Urban Urban
11CZ21 CZZSS CAP
BANK No 1 Rural Short Urban Incomplete data Local Judgement
11CZZSS BUS 1 CBD CBD CBD CBD
11CZZSS BUS 2 CBD CBD CBD CBD
11CZZSS BUS 3 CBD CBD CBD CBD
11FB09 WATERFRONT Urban Urban Urban Urban
11LG06 BRADSHAW Urban Urban Urban Urban
11LG07 ARALUEN Urban Urban Urban Urban
11LG13 ELDER Urban Urban Urban Urban
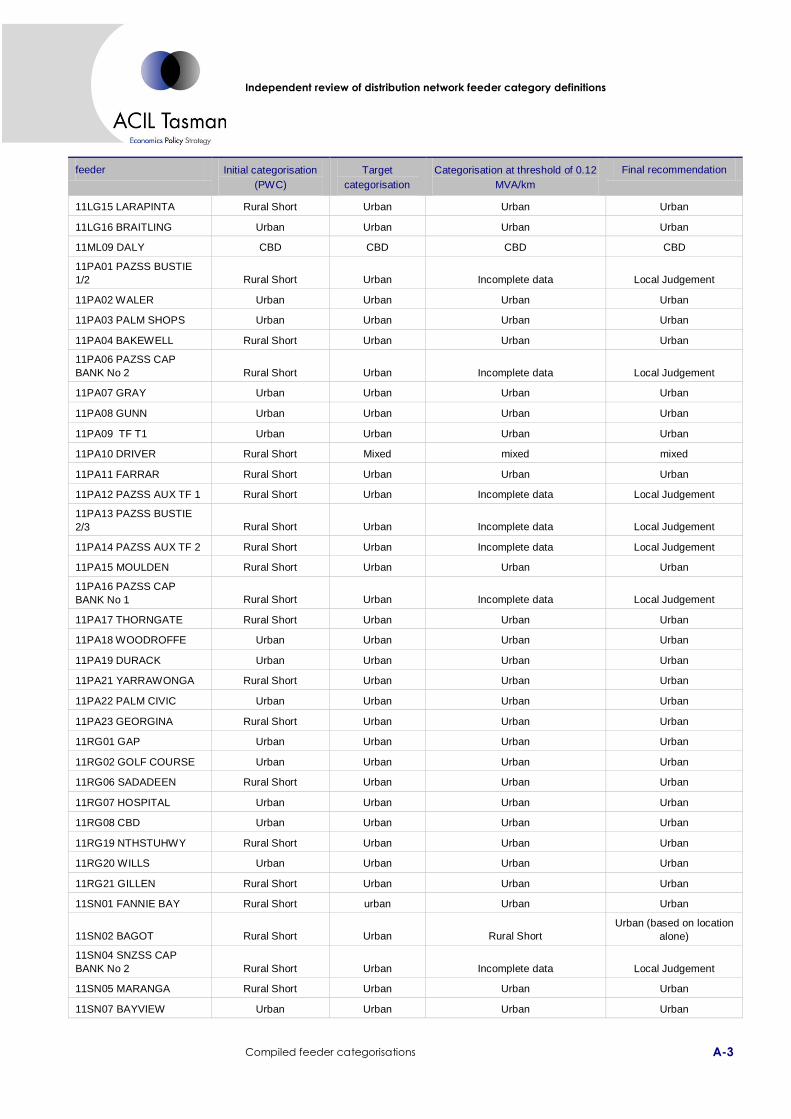
Independent review of distribution network feeder category definitions
Compiled feeder categorisations A-3
feeder Initial categorisation
(PWC)
Target
categorisation
Categorisation at threshold of 0.12
MVA/km
Final recommendation
11LG15 LARAPINTA Rural Short Urban Urban Urban
11LG16 BRAITLING Urban Urban Urban Urban
11ML09 DALY CBD CBD CBD CBD
11PA01 PAZSS BUSTIE
1/2 Rural Short Urban Incomplete data Local Judgement
11PA02 WALER Urban Urban Urban Urban
11PA03 PALM SHOPS Urban Urban Urban Urban
11PA04 BAKEWELL Rural Short Urban Urban Urban
11PA06 PAZSS CAP
BANK No 2 Rural Short Urban Incomplete data Local Judgement
11PA07 GRAY Urban Urban Urban Urban
11PA08 GUNN Urban Urban Urban Urban
11PA09 TF T1 Urban Urban Urban Urban
11PA10 DRIVER Rural Short Mixed mixed mixed
11PA11 FARRAR Rural Short Urban Urban Urban
11PA12 PAZSS AUX TF 1 Rural Short Urban Incomplete data Local Judgement
11PA13 PAZSS BUSTIE
2/3 Rural Short Urban Incomplete data Local Judgement
11PA14 PAZSS AUX TF 2 Rural Short Urban Incomplete data Local Judgement
11PA15 MOULDEN Rural Short Urban Urban Urban
11PA16 PAZSS CAP
BANK No 1 Rural Short Urban Incomplete data Local Judgement
11PA17 THORNGATE Rural Short Urban Urban Urban
11PA18 WOODROFFE Urban Urban Urban Urban
11PA19 DURACK Urban Urban Urban Urban
11PA21 YARRAWONGA Rural Short Urban Urban Urban
11PA22 PALM CIVIC Urban Urban Urban Urban
11PA23 GEORGINA Rural Short Urban Urban Urban
11RG01 GAP Urban Urban Urban Urban
11RG02 GOLF COURSE Urban Urban Urban Urban
11RG06 SADADEEN Rural Short Urban Urban Urban
11RG07 HOSPITAL Urban Urban Urban Urban
11RG08 CBD Urban Urban Urban Urban
11RG19 NTHSTUHWY Rural Short Urban Urban Urban
11RG20 WILLS Urban Urban Urban Urban
11RG21 GILLEN Rural Short Urban Urban Urban
11SN01 FANNIE BAY Rural Short urban Urban Urban
11SN02 BAGOT Rural Short Urban Rural Short
Urban (based on location
alone)
11SN04 SNZSS CAP
BANK No 2 Rural Short Urban Incomplete data Local Judgement
11SN05 MARANGA Rural Short Urban Urban Urban
11SN07 BAYVIEW Urban Urban Urban Urban

Independent review of distribution network feeder category definitions
Compiled feeder categorisations A-4
feeder Initial categorisation
(PWC)
Target
categorisation
Categorisation at threshold of 0.12
MVA/km
Final recommendation
11SN10 GOYDER Urban Urban Urban Urban
11SN13 BISHOP Urban Urban Urban Urban
11SN14 COONAWARRA Urban Urban Urban Urban
11SN16 PARAP Urban Urban Urban Urban
11SN17 RAAF Urban Urban Urban Urban
11SN19 LUDMILLA Urban Urban Urban Urban
11SN20 SNZSS CAP
BANK No 1 Rural Short Urban Incomplete data Local Judgement
11WB01 PARLIAMENT CBD CBD CBD CBD
11WB08 WHARF
PRECINCT Urban Urban Urban Urban
11WS03 DASHWOOD CBD CBD CBD CBD
11WS08 CULLEN Urban Urban Urban Urban
11WS11 KITCHENER CBD CBD CBD CBD
11YU04 No.1 FEEDER Rural Short Rural Short Incomplete data Local Judgement
11YU10 No.2 FEEDER Rural Short Rural Short Incomplete data Local Judgement
11YU17 No.3 FEEDER Rural Short Rural Short Incomplete data Local Judgement
22BR102 BOREFIELDS Rural Short Rural Short Urban mixed
22HD402 LAMBELLS Rural Short Rural Short Rural Short Rural Short
22HD403 MIDDLE POINT Rural Short Rural Short Rural Short Rural Short
22KP01 AUX TF 1 Rural Short Rural Short Incomplete data Local Judgement
22KP03 TINDAL 2 Rural Short Rural Short Urban mixed
22KP04 KATH EAST Rural Short Urban Urban Urban
22KP06 PINE CREEK Rural Short Rural Short Rural Short Rural Short
22KP07 MATARANKA Rural Long Rural Long Rural Long Rural Long
22KP11 OPS TIE Rural Short Rural Short Rural Short Rural Short
22KP12 FLORINA Rural Short Rural Short Rural Short Rural Short
22KP14 GORGE Rural Short Rural Short Rural Short Rural Short
22KP15 TINDAL 1 Rural Short Rural Short Rural Short Rural Short
22KP17 AUX TF 2 Rural Short Rural Short Incomplete data Local Judgement
22KP19 KATHERINE
TOWN Rural Short urban Incomplete data Local Judgement
22MA02 BATCHELOR Rural Short Rural Short Rural Short Rural Short
22MA03 ADELAIDE
RIVER Rural Short Rural Short Rural Short Rural Short
22MA04 NTP Rural Short Rural Short Incomplete data Local Judgement
22MA05 LAKE BENNETT Rural Short Rural Short Incomplete data Local Judgement
22MA07 ACACIA Rural Short Rural Short Rural Short Rural Short
22MM02 MMZSS CAP
BANK Rural Short Rural Short Incomplete data Local Judgement
22MM05 HERBERT Rural Short Rural Short Rural Short Rural Short
22MM06 STRANGWAYS Rural Short Rural Short Rural Short Rural Short

Independent review of distribution network feeder category definitions
Compiled feeder categorisations A-5
feeder Initial categorisation
(PWC)
Target
categorisation
Categorisation at threshold of 0.12
MVA/km
Final recommendation
22MM07 NOONAMAH Rural Short Rural Short Rural Short Rural Short
22MM09 MCMINNS
PUMPS Rural Short Rural Short Urban mixed
22MM10 VIRGINIA Rural Short Rural Short Rural Short Rural Short
22MM11 DARWIN RIVER Rural Short Rural Short Rural Short Rural Short
22MM13 DUNDEE Rural Short Rural Short Rural Short Rural Short
22MR103 MT BUNDY Rural Short Rural Short Rural Short Rural Short
22MR303 TOMS GULLY Rural Short Rural Short Incomplete data Local Judgement
22PA101 HOWARD
SPRINGS Rural Short Rural Short Rural Short Rural Short
22PC306 MOLINE Rural Short Rural Short Incomplete data Local Judgement
22PC308 PCK
TOWNSHIP Rural Short Rural Short Rural Short Rural Short
22RG04 BREWER 2 Rural Short Rural Short Rural Short Rural Short
22RG09 FARMS Rural Short Mixed mixed mixed
22RG13 BREWER 1 Rural Short Mixed mixed mixed
22TC202 FEEDER 2 Rural Short Rural Short Rural Short Rural Short
22TC302 FEEDER 3 Urban Urban Urban Urban
22TC402 FEEDER 4 Rural Short Urban Incomplete data Local Judgement
22TC502 FEEDER 5 Rural Short Mixed mixed mixed
22TC602 FEEDER 6 Rural Long Rural Long Rural Long Rural Long
CZ-CP Rural Short Rural Short Incomplete data Local Judgement
LOVEGROVE EXPRESS
FDR 1 Rural Short Urban Incomplete data Local Judgement
LOVEGROVE EXPRESS
FDR 2 Rural Short Mixed mixed mixed
PINE CK - COSMO
HOWLEY Rural Short Rural Short Incomplete data Local Judgement

Melbourne (Head Office) Level 4, 114 William Street
Melbourne VIC 3000
Telephone (+61 3) 9604 4400 Facsimile (+61 3) 9604 4455
Email [email protected]
Brisbane Level 15, 127 Creek Street
Brisbane QLD 4000 GPO Box 32
Brisbane QLD 4001
Telephone (+61 7) 3009 8700 Facsimile (+61 7) 3009 8799
Email [email protected]
Canberra Level 2, 33 Ainslie Place
Canberra City ACT 2600 GPO Box 1322
Canberra ACT 2601
Telephone (+61 2) 6103 8200 Facsimile (+61 2) 6103 8233
Email [email protected]
Perth Centa Building C2, 118 Railway Street
West Perth WA 6005
Telephone (+61 8) 9449 9600 Facsimile (+61 8) 9322 3955
Email [email protected]
Sydney Level 20, Tower 2 Darling Park
201 Sussex Street Sydney NSW 2000
GPO Box 4670 Sydney NSW 2001
Telephone (+61 2) 9389 7842 Facsimile (+61 2) 8080 8142 Email [email protected]
www.aciltasman.com.au