incubator initiative: improving vineyard water efficiency …€¦ · · 2015-12-03incubator...
TRANSCRIPT

INCUBATOR INITIATIVE: Improving vineyard water efficiency by addition of biochar derived from grape stalks and vineyard prunings
FINAL REPORT to
AUSTRALIAN GRAPE AND WINE AUTHORITY
Principal Investigators: Richard Muhlack
Philip Kwong
Project Number: UA 1404
Research Organisation: The University of Adelaide
Date: 24 July 2015
Incubator Initiative: Improving vineyard water efficiency by addition of biochar derived from grape stalks and vineyard prunings AGWA project number: UA 1404
Author details: Dr Richard Muhlack School of Agriculture, Food and Wine The University of Adelaide PMB 1 Glen Osmond South Australia, 5064 Email: [email protected] Phone: +61 8 8313 6771 Dr Philip Kwong School of Chemical Engineering The University of Adelaide South Australia 5005 Email: [email protected] Phone: +61 8 8313 0724 Date: 24 July, 2015 Disclaimer: The advice presented in this document is intended as a source of information only. The University of Adelaide (UA) and the Australian Grape and Wine Authority (AGWA) accept no responsibility for the results of any actions taken on the basis of the information contained within this publication, nor for the accuracy, currency or completeness of any material reported and therefore disclaim all liability for any error, loss or other consequence which may arise from relying on information in this publication.
Table of Contents
Abstract ...................................................................................................................................... 1
Executive summary .................................................................................................................... 2 Background ................................................................................................................................ 4 Project Aims and Performance targets ....................................................................................... 5 Materials and Method ................................................................................................................ 6
Sample collection ................................................................................................................... 6
Biomass pre-processing ......................................................................................................... 6 Thermo-gravimetric analysis ................................................................................................. 6 Pyrolysis ................................................................................................................................. 6 Biochar physico-chemical characterisation ........................................................................... 7
Hydrostatic Water Retention.................................................................................................. 7 Results and Discussion .............................................................................................................. 8
Thermo-gravimetric analysis ................................................................................................. 8 Biochar physico-chemical characterisation ........................................................................... 9 Hydrostatic Water Retention................................................................................................ 21
Outcomes and Conclusions ...................................................................................................... 24 Recommendations .................................................................................................................... 25 Appendix 1: Communication: .................................................................................................. 26
Appendix 2: Intellectual Property ............................................................................................ 27 Appendix 3: References ........................................................................................................... 28
Appendix 4: Staff ..................................................................................................................... 30

Page 1
Abstract
The Australian wine sector generates substantial quantities of vineyard biomass waste including vineyard prunings and stalks. The objective of this project was to pyrolyse these materials to produce biochar, and then characterise the treatment effects on biochar physical properties and water-holding capacity. Biochar addition to sandy vineyard soils may improve water holding, however further testing is required. Vineyard pruning biochars displayed vastly superior phosphorus adsorption compared with other studies and may have substantial economic value as a slow release fertiliser. Further research to explore regional effects and optimisation opportunities is highly recommended.

Page 2
Executive summary
The Australian grape and wine sector generates substantial quantities of biomass waste materials, including vineyard prunings and grape stalks. These would normally be considered organic waste; an unavoidable but nonetheless necessary part of the production process. In some cases, materials might be recycled as compost, or perhaps given away for ethanol or tartrate extraction. However, instead of being seen as waste, these materials could be utilised for a range of uses that would create additional value: from renewable energy to farming applications such as biochar and stockfeed supplements. These applications have carbon as well as economic benefits, providing wine producers with additional “green” credentials and alternative revenue streams. One such waste stream is biomass, including vineyard prunings and grape stalks, which are the subject of this project. For grape and wine production, issues around how application of biochar to soil affects grape productivity and the effect of different biochar production parameters on the biochar makeup is still unclear. Water availability is also a limiting resource for most grape growing regions, with water cost and allocations to primary producers of major concern in regional communities across Australia (particularly in inland regions such Clare, the Riverland, Sunraysia and the MIA).This project was designed to provide new knowledge that would in the future allow grape and wine producers to convert their waste products into energy and biochar for improved water efficiency and carbon management. For this project, vineyard prunings and grape stalks were sourced from four regions across South Australia: Adelaide (Waite), McLaren Vale, Padthaway and Clare Valley. All feedstocks were heated at temperatures ranging from 400-700°C in the absence of oxygen (a process known as pyrolysis) to produce biochars with different chemical and physical characteristics. These biochars were examined to determine the effects of pyrolysis conditions and other factors – in particular region (GI), feedstock type, and heating temperature – on key biochar quality parameters such as surface area, porosity or pore volume, and water holding capacity. From this, an assessment of the potential for enhancing water retention in soils through use of grape derived biochars for soil amendment could be made. Biochars are typically very porous materials with a high surface area, and it is these characteristics that give biochars distinct properties regarding their potential as adsorbents. In this study, biochars produced from grape stalk feedstocks were found to be more porous and with a higher surface area compared with biochars produced from pruning feedstocks that were produced under the same conditions. Increasing the pyrolysis temperature was also observed to increase porosity and surface area. As a result, the biochar produced from grape stalks exhibited superior water holding performance compared with biochars from grape prunings. Water holding performance was also increased with increasing pyrolysis temperature, again largely due to surface area and pore volume effects. Interestingly calcium content may also be a factor in water holding behaviour and so additional research is recommended to investigate this further. Biochars were found to display similar water retention performance to typical sandy-loam and loam soil types. Addition of biochar to loam soils is therefore unlikely to provide a significant additional benefit in vineyard water holding, particularly if irrigation strategies such as partial root-zone drying or regulated deficit irrigation are employed. However, the biochars produced were superior in water retention performance compared with typical sandy soils and so addition of biochar to these vineyard soil types may improve water holding (particularly at field capacity), although further study would be required to confirm water retention behaviour under viticultural conditions. The most exciting finding from this study however was related not to water efficiency (the main focus of the project) but rather to phosphorus adsorption. Due to the naturally high calcium content of biomass feedstocks investigated in this work, both vineyard pruning and grape stalks displayed phosphorus adsorption capacities more than 10 times that of other natural unmodified biochars in the literature, with Padthaway feedstocks having the highest calcium content of the four regions studied. Further research is recommended to explore this regional aspect, and to determine whether biomass feedstocks can be further enhanced or fine-tuned (either by selection based on regional characteristics or by engineering intervention) to optimise a biochar with superior phosphorus adsorption capacity. Favorable results from optimisation studies could be used to inform the development of a subsequent large-scale project involving field application or pot trials to assess the impact of soil enrichment with grape stalk and vineyard pruning derived biochars. As with the present study, the continuous pyrolysis equipment to be used in this project is suited to mobile in-field use, and so would mitigate feedstock transportation costs which must be considered in all biomass

Page 3
applications. The economic and environmental benefits from a superior phosphorus adsorbent would be substantial and certainly worthy of further investigation. The assistance and cooperation of Accolade Wines for the provision of vineyard prunings and grape stalks from McLaren Vale, Padthaway and Clare is gratefully acknowledged. Dr Cameron Grant of the Soil Science Group at the School of Agriculture, Food and Wine is thanked for access to pressure plate apparatus used for determination of sample water retention. Prof. David Chittleborough of the Department of Earth Sciences at the School of Physical Sciences is also thanked for the valuable feedback on the phosphate adsorption analysis.
Page 4
Background Grape and wine producers have experienced tumultuous economic and environmental pressure in recent times. Supply/demand imbalance and the impact of extreme weather on agricultural production and regional prosperity continue to cause concern in regional Australia. The need for grape and wine production strategies that are resilient to climate challenges and effectively manage key natural resources are arguably more critical than ever before. Equally important, perhaps more so, is the ability to extract full value from by-products and waste streams as well as from fruit and raw materials, in order to improve efficiency and profitability in the vineyard and winery without compromising sustainability, productivity or quality. One such waste stream is biomass, including vineyard prunings and grape stalks, which are the subject of this project. The Australian grape and wine sector generates substantial quantities of these materials, which would normally be considered organic waste; an unavoidable but nonetheless necessary part of the production process. In some cases, materials might be recycled as compost, or perhaps given away for ethanol or tartrate extraction. However, instead of being seen as waste, these materials could be utilised for a range of purposes that would create additional value: from renewable energy to farming applications such as biochar and stockfeed supplements. These applications have carbon as well as economic benefits, providing wine producers with additional ‘green’ credentials and alternative revenue streams. Pyrolysis of these feedstocks to produce biochar would add considerable value to these agricultural residues, from accountable carbon sequestration (Kyoto Protocol Article 3.4) to nutrient recycling, improved soil fertility and enhanced water-holding capacity. For grape and wine production, issues around how the application of biochar to soil affects grape productivity and the effect of different pyrolysis parameters on the performance of biochars produced from vineyard and grape derived biomass is still unclear. Water availability is also a limiting resource for most grape growing regions, with water cost and allocations to primary producers of major concern in regional communities across Australia (particularly in inland regions such Clare, the Riverland, Sunraysia and the MIA).This project was designed to provide new knowledge that would in the future allow grape and wine producers to convert their waste products into energy and biochar for improved water efficiency and carbon management.
The objective of this project was to undertake pyrolysis of grape stalks and vineyard prunings sourced from multiple regions within South Australia, and to then characterise the effects of pyrolysis conditions on biochar physical properties and water-holding capacity. Favourable results from the project could be used to inform the development of a subsequent large-scale project involving field application or pot trials to assess the impact of soil enrichment with grape stalk and vineyard pruning derived biochars. The continuous pyrolysis equipment to be used in this project is suited to mobile in-field use, and so mitigates feedstock transportation costs which must be considered in all biomass applications.

Page 5
Project Aims and Performance targets The main aim of this Incubator Project was to investigate the opportunity for the grape and wine sector to utilise vineyard derived biochar for improved climate adaptability and process and water efficiency, by:
1. Sourcing vineyard prunings and grape stalks from across South Australia to assess regional feedstock variability
2. Undertaking pyrolysis of grape stalk and vine pruning feedstocks for biochar production
3. Elucidating the effect of pyrolysis conditions and process factors (e.g. feedstock type (stalks, pruning wood, age, region), residence time, temperature, heating rate, feedstock moisture) on biochar quality (porosity, surface area, water-holding capacity); and
4. Assessing the potential for enhanced water retention in vineyard soils by enrichment with biochar from grape stalk and vine pruning feedstocks.

Page 6
Materials and Method Sample collection Grapevine pruning biomass sourced from four South Australian wine producing regions (Adelaide-Waite, 10 July 2014; Padthaway, 11 July 2014; McLaren Vale, 16 July 2014; Clare Valley, 17 July 2014) immediately following pruning operations. Approximately 20kg of pruning material was sourced from each location. Pruning material was stored indoors at the University of Adelaide winery at room temperature until further processing. Average moisture content of samples as received was 35.4% w/w. Grape stalk biomass was collected from the same four regions during the 2015 vintage (Adelaide-Waite, 2 Feb 2015; Padthaway, 20 Feb 2015; McLaren Vale, 9 Feb 2015; Clare Valley, 20 Feb 2015), with samples sourced directly following crushing and destemming operations. Stalks were stored at 0°C in air-tight containers until further processing to prevent microbial spoilage prior to subsequent processing. Average moisture content of samples as received was 75.5 % w/w.
Biomass pre-processing Pruning biomass was prepared for pyrolysis by milling using a Retsch rotary knife mill with a 0.75 mm screen, before oven drying at 105°C for 16 hours. Due to the fibrous nature of grapevine prunings, frequent blockages of the conical feed hopper were encountered during initial testing of the continuous pyrolysis unit. To alleviate this, the particle size distribution following drying was adjusted by sieving to 212-500 µm to facilitate a reliable and consistent feed rate for continuous pyrolysis processing. Several feed hopper prototypes with varying geometries were trialled over several weeks. A design modification featuring installation of a 1mm screen with a motor-driven sweeping arm was eventually settled on to ensure feed consistency. Due to the significantly higher water content and risk of microbial spoilage, grape stalk biomass was dried prior to milling at 105°C for 16 hours. Milling using a Retsch rotary knife mill with a 0.75 mm screen was performed, and the resulting biomass sieved to between 212-500 µm as before. After pre-processing, biomass feedstocks samples were stored in air-tight containers prior to pyrolysis.
Thermo-gravimetric analysis Thermo-gravimetric analysis (TGA) was conducted using a Setraram Labsys Thermo-gravimetric analyser (TG-DTA) with Differential Scanning Calorimeter (DSC) to establish the required residence time for pyrolysis and ratios of ash to fixed and volatile carbon. Feedstock samples were progressively heated to the target temperature in a programmable furnace, and the total mass and mass rate change recorded.
Pyrolysis Both continuous and batch pyrolysis systems were used in this project. For batch processing, each feedstock was pyrolysed by heating at 10°C/min to the target pyrolysis temperature in an argon environment using a three-zone tubular furnace (Lindberg Blue) and held for 1 hour before cooling overnight. Four separate pyrolysis temperatures were used: 400°C, 500°C, 600°C and 700°C. The resulting biochar was crushed and sieved to 90-500 µm and stored in air-tight sealed containers prior to characterisation studies. The continuous pyrolysis unit used for this project consisted of an insulated tubular furnace fitted with a continuous feed hopper, screw auger and char pot. Various design challenges needed to be addressed to allow reliable and consistent biomass feed rate. An 820 mm long screw auger was used, with screw diameter of 27.3 mm and screw pitch of 10 mm. Based on preliminary TGA analysis of grape feedstock samples, a constant feed rate corresponding to a residence time of 15.5 minutes was used (the maximum permitted with this apparatus) with a nitrogen carrier gas flow rate of 1.2 L/min to purge oxygen from the reaction zone. Four separate pyrolysis temperatures were used: 400°C, 500°C, 600°C and 700°C. The resulting biochar was crushed and sieved as before to 90-500 µm and stored in air-tight sealed containers prior to characterisation studies.

Page 7
The char pot used for collection of the pyrolysed biochar was fitted with gas purge system utilising a nitrogen flowrate of 0.5 L/min, to prevent tar condensation and (as a safety precaution) to displace syngas with nitrogen, with flue gases extracted using an exhaust system.
Biochar physicochemical characterisation Elemental Analysis Elemental analyses were undertaken on grapevine pruning and grape stalk feedstocks as well as batch and continuous biochars using Radial CIROS Inductively Coupled Plasma Atomic Emission Spectrometry (ICP-AES) with nitric/perchloric acid digestion, according to the method of Wheal et al (2011). Ratios of Carbon : Hydrogen : Nitrogen : Oxygen were established for feedstock and biochar samples using a CHN Elemental Analyser. Zeta potential and pH Zeta potential was determined using a Malvern Instruments Zetasizer Nano ZS with MilliQ water as the carrier fluid with an average of 20 runs. Sample material used in calculations is carbon (lamp black, graphite) with refractive index of 2.420 and Absorption of 0.9000. Sample pH was measured using the standardised conditions of Kameyama et al (2012), in which 1 g of biochar was dispersed in 25mL of Milli Q water and mixed using an end-over-end shaker for 24 hours before measurement of the suspension. Surface Area Pore size and surface area was determined via N2 adsorption at 77 K and CO2 adsorption at 273 K with a BELSORP-max instrument (Bel, Japan) using the Brunauer-Emmett-Teller (BET) and Density Functional Theory methods respectively. Contact Angle To achieve a smooth solid surface for testing, biochar samples were first pressed into a tablet using a pressure of approximately 12 tonnes. Contact angle was then measured using the sessile drop method on an Attension Theta Optical Tensiometer. Phosphate adsorption potential Phosphate solutions were prepared with potassium phosphate monobasic (KH2PO4) dissolved in Milli Q water with 0.01 M calcium chloride (CaCl2) as an electrolyte and 1 g/L sodium azide (NaN3) to inhibit microbial growth. Based on procedure of Nair et al (1984) 1 g of biochar was mixed with 25 mL of phosphate solution (at concentrations ranging from 0 – 1473 mg PO4/L). Sample tubes were shaken for 24 hours at 50 rpm at room temperature on an end-over-end shaker to reach equilibrium. Samples were centrifuged at 4000 rpm for 5 minutes and the supernatant filtered using a 0.45 µm nylon filter (Membrane Solutions). The ascorbic acid method was used to determine the phosphate concentrations of the filtered solution with a UV-Visible Spectrophotometer (Schmadzu UV-vis 1601) at a wavelength of 660nm. The amount of phosphate sorption was calculated based on the difference between the initial and final solution concentrations with reference to a standard curve. All tests were performed in triplicate. SEM/EDX A Philips XL-30 scanning electron microscope (SEM) was used to determine the structure and surface characteristics of each char. Elemental analysis of the surface occurred simultaneously using energy dispersive x-ray spectroscopy (EDX).
Hydrostatic Water Retention To evaluate biochar water holding performance, biochar samples were placed into 19mm Perspex rings on each of four porous plates and saturated with RO water. The four wetted porous plates were then each placed into a pressure chamber as described by Creswell et al (2008) and Bittely and Flury (2009), and samples subjected to a matric pressure of 1m, 3m, 10m and 50m respectively. Samples were held at these pressures for approximately eight weeks (24 March 2015 – 21 May 2015) to allow hydraulic equilibrium to be established at all pressures, after which samples were weighed, oven dried and then weighed again to determine gravimetric water content. The bulk density of each biochar sample was then used to convert gravimetric water content to volumetric water content, to allow biochar hydrostatic water retention to be modelled using the methods of Grant et al (2010) and compared with standard soil water retention profiles to determine the water holding potential as a function of soil addition rate.

Page 8
Results and Discussion
Thermo-gravimetric analysis During preliminary TGA testing, derivative weight stabilised after approximately 12 minutes as shown in Figure 1, indicating that complete pyrolysis had occurred. Based on these preliminary TGA results of grape feedstock samples and to provide a contingency buffer period, a constant fixed feed rate corresponding to a residence time of 15.5 minutes (the maximum permitted with this apparatus) was used for all subsequent runs. Under these circumstances a two level factorial design was not deemed to be the most appropriate statistical method to investigate links between pyrolysis conditions and water holding capacity or physicochemical properties of resulting biochars, as this would not permit detailed examination of temperature effects which based on other studies were likely to dominate biochar behaviour. Rather a modified fractional design examining all feedstocks at a common temperature (600°C) plus a single region (Padthaway) examined at four temperatures (400°C, 500°C, 600°C and 700°C) was considered the most strategic way to elucidate the main effects of relevant process factors in the timeframe for this project. Consequently these process conditions were adopted for all subsequent pyrolysis investigations.
Figure 1 – Thermogravimetric analysis of McLaren Vale prunings
-25
-20
-15
-10
-5
0
5
0
100
200
300
400
500
600
700
800
900
0 20 40 60 80 100 120
De
riva
tive
We
igh
t (m
g/m
in)
Furn
ace
Te
mp
era
ture
(°C
) &
We
igh
t (m
g x
10
)
Time (minutes)
Furnace Temperature Weight Derivative Weight

Page 9
Biochar physicochemical characterisation
Elemental analysis
Elemental analysis showed feedstocks to be carbon rich with carbon contents ranging from 45-48% (Table 1). Carbon content was increased in all biochar samples as expected (64-79%), with a corresponding decrease in hydrogen and oxygen following pyrolysis. ICP-AES analysis (Table 2) showed all samples to be extremely high in calcium, magnesium, potassium, sodium and (to a lesser extent) phosphorus, with levels two to five times higher in the biochars compared with the raw feedstocks. It is notable that Padthaway samples are particularly high in calcium, possibly owing to the limestone rich soils in that region. Table 1 Elemental analysis by CHN
Sample Identification
Carbon Hydrogen Nitrogen Oxygen*
(% w/w) (% w/w) (% w/w) (% w/w)
F-Pr-Clare 48.1 5.29 0.83 45.8
F-Pr-McLaren Vale 45.2 8.80 0.80 45.2
F-Pr-Waite 45.9 5.87 0.74 47.5
F-Pr-Padthaway 46.5 5.83 0.81 46.9
F-S-Clare 46.8 5.51 0.68 47.0
F-S-McLaren Vale 47.3 5.04 0.64 47.0
F-S-Waite 44.6 5.63 0.55 49.3
F-S-Padthaway 44.8 5.70 0.84 48.7
4-Pr-Padthaway 70.5 4.23 1.21 24.0
5-Pr-Padthaway 75.7 3.07 1.06 20.2
6-Pr-Padthaway 77.5 2.12 1.07 19.3
7-Pr-Padthaway 75.4 1.76 0.87 22.0
6-Pr-McLaren Vale 77.9 2.09 1.22 18.8
6-Pr-Clare 77.7 2.31 1.07 19.0
6-Pr-Waite 78.4 2.27 1.25 18.1
4-S-Padthaway 64.3 3.82 0.90 31.0
5-S-Padthaway 70.6 2.67 0.96 25.8
6-S-Padthaway 70.8 2.02 0.81 26.4
7-S-Padthaway 72.3 2.00 0.94 24.7
6-S-McLaren Vale 71.7 1.94 0.76 25.6
6-S-Clare 73.0 1.79 1.02 24.2
6-S-Waite 73.8 1.87 0.84 23.5
Sample Identification: F = Feedstock sample, Pr = Prunings, S = Stalks, 4 = 400°C Biochar, 5 = 500°C Biochar, 6 = 600°C Biochar, 7=700°C Biochar *Oxygen by difference
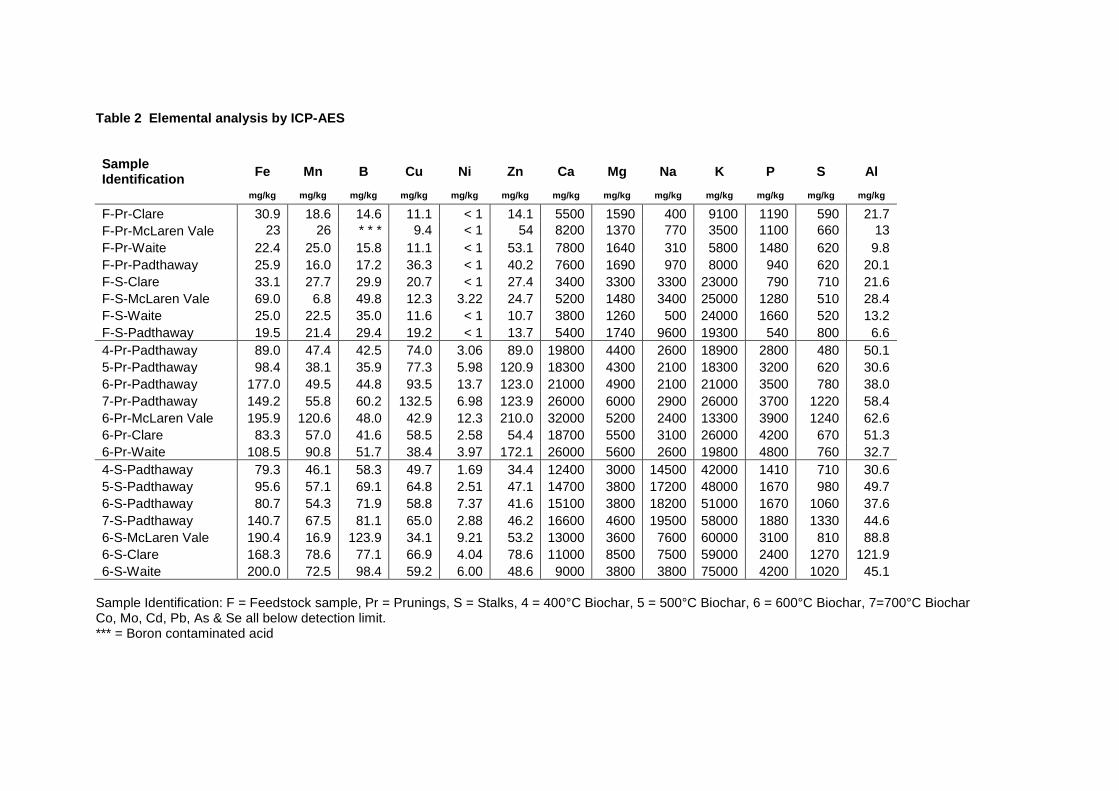
Table 2 Elemental analysis by ICP-AES Sample Identification
Fe Mn B Cu Ni Zn Ca Mg Na K P S Al
mg/kg mg/kg mg/kg mg/kg mg/kg mg/kg mg/kg mg/kg mg/kg mg/kg mg/kg mg/kg mg/kg
F-Pr-Clare 30.9 18.6 14.6 11.1 < 1 14.1 5500 1590 400 9100 1190 590 21.7
F-Pr-McLaren Vale 23 26 * * * 9.4 < 1 54 8200 1370 770 3500 1100 660 13
F-Pr-Waite 22.4 25.0 15.8 11.1 < 1 53.1 7800 1640 310 5800 1480 620 9.8
F-Pr-Padthaway 25.9 16.0 17.2 36.3 < 1 40.2 7600 1690 970 8000 940 620 20.1
F-S-Clare 33.1 27.7 29.9 20.7 < 1 27.4 3400 3300 3300 23000 790 710 21.6
F-S-McLaren Vale 69.0 6.8 49.8 12.3 3.22 24.7 5200 1480 3400 25000 1280 510 28.4
F-S-Waite 25.0 22.5 35.0 11.6 < 1 10.7 3800 1260 500 24000 1660 520 13.2
F-S-Padthaway 19.5 21.4 29.4 19.2 < 1 13.7 5400 1740 9600 19300 540 800 6.6
4-Pr-Padthaway 89.0 47.4 42.5 74.0 3.06 89.0 19800 4400 2600 18900 2800 480 50.1
5-Pr-Padthaway 98.4 38.1 35.9 77.3 5.98 120.9 18300 4300 2100 18300 3200 620 30.6
6-Pr-Padthaway 177.0 49.5 44.8 93.5 13.7 123.0 21000 4900 2100 21000 3500 780 38.0
7-Pr-Padthaway 149.2 55.8 60.2 132.5 6.98 123.9 26000 6000 2900 26000 3700 1220 58.4
6-Pr-McLaren Vale 195.9 120.6 48.0 42.9 12.3 210.0 32000 5200 2400 13300 3900 1240 62.6
6-Pr-Clare 83.3 57.0 41.6 58.5 2.58 54.4 18700 5500 3100 26000 4200 670 51.3
6-Pr-Waite 108.5 90.8 51.7 38.4 3.97 172.1 26000 5600 2600 19800 4800 760 32.7
4-S-Padthaway 79.3 46.1 58.3 49.7 1.69 34.4 12400 3000 14500 42000 1410 710 30.6
5-S-Padthaway 95.6 57.1 69.1 64.8 2.51 47.1 14700 3800 17200 48000 1670 980 49.7
6-S-Padthaway 80.7 54.3 71.9 58.8 7.37 41.6 15100 3800 18200 51000 1670 1060 37.6
7-S-Padthaway 140.7 67.5 81.1 65.0 2.88 46.2 16600 4600 19500 58000 1880 1330 44.6
6-S-McLaren Vale 190.4 16.9 123.9 34.1 9.21 53.2 13000 3600 7600 60000 3100 810 88.8
6-S-Clare 168.3 78.6 77.1 66.9 4.04 78.6 11000 8500 7500 59000 2400 1270 121.9
6-S-Waite 200.0 72.5 98.4 59.2 6.00 48.6 9000 3800 3800 75000 4200 1020 45.1
Sample Identification: F = Feedstock sample, Pr = Prunings, S = Stalks, 4 = 400°C Biochar, 5 = 500°C Biochar, 6 = 600°C Biochar, 7=700°C Biochar Co, Mo, Cd, Pb, As & Se all below detection limit. *** = Boron contaminated acid

Page 11
Zeta potential and pH
Measured zeta potentials of stalk-derived biochars were found to be lower than the corresponding pruning-derived biochars in all cases. All biochars were negatively charged and alkaline under test conditions; this is typical of charcoal surfaces such as biochar and activated carbon, and consistent with the observations of Yao et al (2011a) and Jung et al (2015) for various biochars derived from agricultural residues. Table 3 Zeta potential and pH Sample Identification Zeta Potential pH
mV SD
SD
4-Pr-Padthaway -33.4 0.42 8.17 0.114
5-Pr-Padthaway -32.5 0.96 10.03 0.040
6-Pr-Padthaway -33.2 0.81 9.35 0.010
7-Pr-Padthaway -29.0 1.65 9.82 0.042
6-Pr-McLaren -30.3 1.61 9.53 0.217
6-Pr-Waite -30.9 1.68 8.55 0.095
6-Pr-Clare -37.1 1.30 8.97 0.092
4-S-Padthaway -41.2 0.95 9.17 0.143
5-S-Padthaway -43.5 1.02 10.31 0.025
6-S-Padthaway -41.1 0.88 9.95 0.031
7-S-Padthaway -41.2 0.58 10.69 0.012
6-S-McLaren -39.7 2.48 9.40 0.006
6-S-Waite -43.4 0.59 9.69 0.012
6-S-Clare -39.9 0.64 9.81 0.040 Sample Identification: Pr = Prunings, S = Stalks, 4 = 400°C Biochar, 5 = 500°C Biochar, 6 = 600°C Biochar, 7=700°C Biochar
Page 12
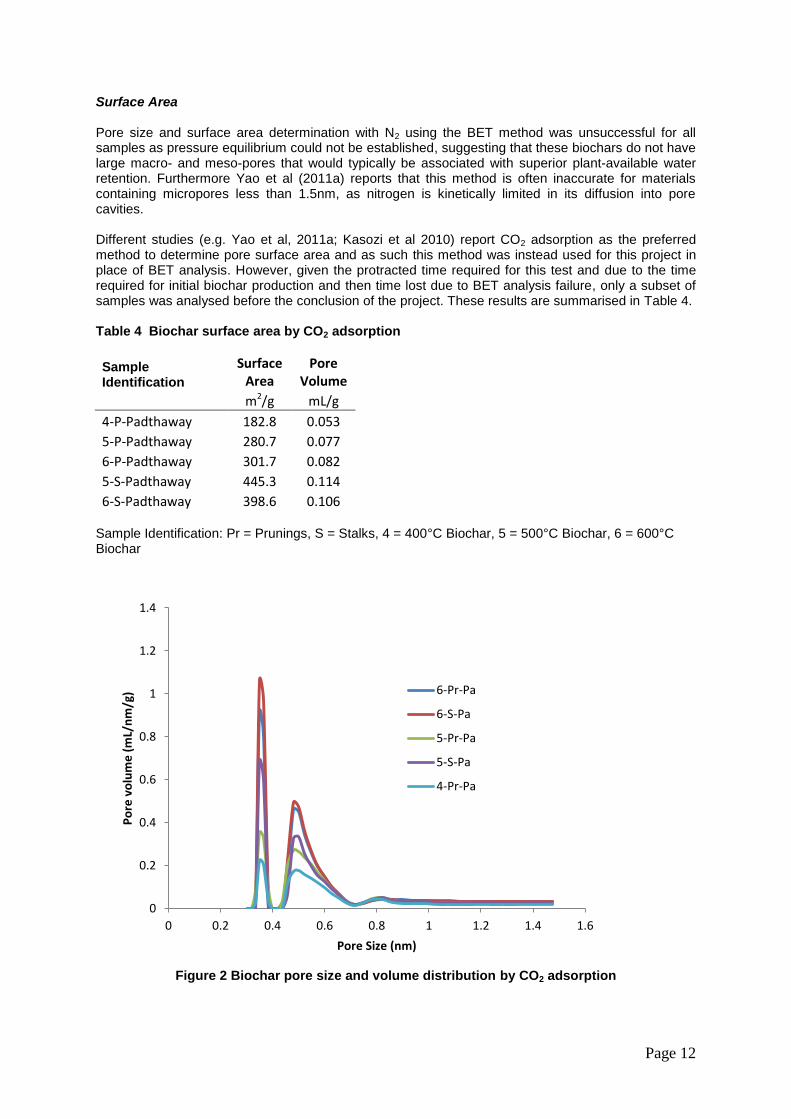
Surface Area Pore size and surface area determination with N2 using the BET method was unsuccessful for all samples as pressure equilibrium could not be established, suggesting that these biochars do not have large macro- and meso-pores that would typically be associated with superior plant-available water retention. Furthermore Yao et al (2011a) reports that this method is often inaccurate for materials containing micropores less than 1.5nm, as nitrogen is kinetically limited in its diffusion into pore cavities. Different studies (e.g. Yao et al, 2011a; Kasozi et al 2010) report CO2 adsorption as the preferred method to determine pore surface area and as such this method was instead used for this project in place of BET analysis. However, given the protracted time required for this test and due to the time required for initial biochar production and then time lost due to BET analysis failure, only a subset of samples was analysed before the conclusion of the project. These results are summarised in Table 4. Table 4 Biochar surface area by CO2 adsorption
Sample Identification
Surface Area
Pore Volume
m2/g mL/g
4-P-Padthaway 182.8 0.053
5-P-Padthaway 280.7 0.077
6-P-Padthaway 301.7 0.082
5-S-Padthaway 445.3 0.114
6-S-Padthaway 398.6 0.106 Sample Identification: Pr = Prunings, S = Stalks, 4 = 400°C Biochar, 5 = 500°C Biochar, 6 = 600°C Biochar
Figure 2 Biochar pore size and volume distribution by CO2 adsorption
0
0.2
0.4
0.6
0.8
1
1.2
1.4
0 0.2 0.4 0.6 0.8 1 1.2 1.4 1.6
Po
re v
olu
me
(m
L/n
m/g
)
Pore Size (nm)
6-Pr-Pa
6-S-Pa
5-Pr-Pa
5-S-Pa
4-Pr-Pa

Page 13
Contact Angle Grapevine biochar samples proved to be too hydrophilic for contact angle measurement using the tensiometer apparatus. Water droplets were adsorbed too quickly for the high speed camera of this apparatus to record sufficient frames to allow the contact angle to be calculated. Interestingly, 400°C biochars and 700°C stalk biochars which had previously been found to be hydrophobic immediately following production using a simple water droplet test were found to exhibit hydrophilic behaviour when subjected to formal tensiometer contact angle measurement. Re-testing of these samples using the simple water droplet test showed that these same samples exhibited hydrophilic behaviour, suggesting that the hydrophilic nature of the biochars had possibly changed (or ‘matured’) during storage. While the samples were kept in sealed air-tight containers in the absence of light they were not stored under an inert gas cover, and so it is possible that oxidation of the samples occurred during storage, altering the initial hydrophobic nature of the surface. This behaviour is not described in literature and warrants further examination.
Figure 3 Tensiometer contact angle test
1 2
3 4
Page 14
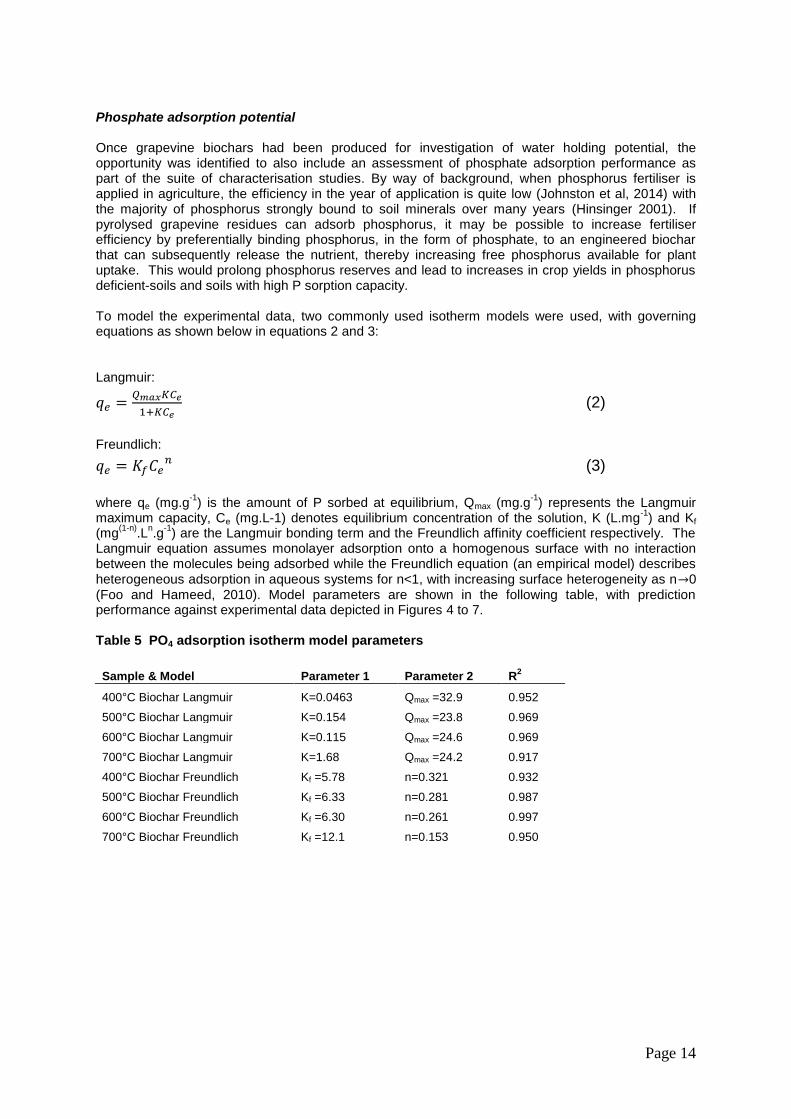
Phosphate adsorption potential Once grapevine biochars had been produced for investigation of water holding potential, the opportunity was identified to also include an assessment of phosphate adsorption performance as part of the suite of characterisation studies. By way of background, when phosphorus fertiliser is applied in agriculture, the efficiency in the year of application is quite low (Johnston et al, 2014) with the majority of phosphorus strongly bound to soil minerals over many years (Hinsinger 2001). If pyrolysed grapevine residues can adsorb phosphorus, it may be possible to increase fertiliser efficiency by preferentially binding phosphorus, in the form of phosphate, to an engineered biochar that can subsequently release the nutrient, thereby increasing free phosphorus available for plant uptake. This would prolong phosphorus reserves and lead to increases in crop yields in phosphorus deficient-soils and soils with high P sorption capacity. To model the experimental data, two commonly used isotherm models were used, with governing equations as shown below in equations 2 and 3: Langmuir:
(2)
Freundlich:
(3)
where qe (mg.g
-1) is the amount of P sorbed at equilibrium, Qmax (mg.g
-1) represents the Langmuir
maximum capacity, Ce (mg.L-1) denotes equilibrium concentration of the solution, K (L.mg-1
) and Kf (mg
(1-n).L
n.g
-1) are the Langmuir bonding term and the Freundlich affinity coefficient respectively. The
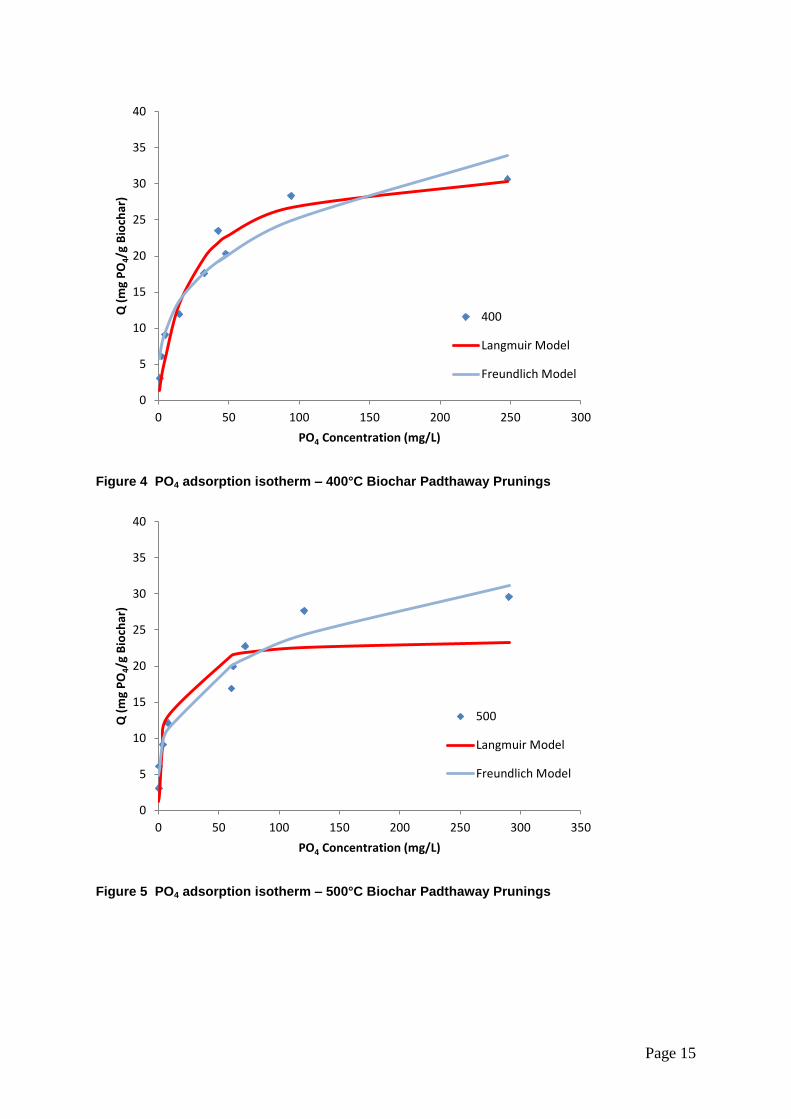
Langmuir equation assumes monolayer adsorption onto a homogenous surface with no interaction between the molecules being adsorbed while the Freundlich equation (an empirical model) describes heterogeneous adsorption in aqueous systems for n<1, with increasing surface heterogeneity as n 0 (Foo and Hameed, 2010). Model parameters are shown in the following table, with prediction performance against experimental data depicted in Figures 4 to 7. Table 5 PO4 adsorption isotherm model parameters
Sample & Model Parameter 1 Parameter 2 R2
400°C Biochar Langmuir K=0.0463 Qmax =32.9 0.952
500°C Biochar Langmuir K=0.154 Qmax =23.8 0.969
600°C Biochar Langmuir K=0.115 Qmax =24.6 0.969
700°C Biochar Langmuir K=1.68 Qmax =24.2 0.917
400°C Biochar Freundlich Kf =5.78 n=0.321 0.932
500°C Biochar Freundlich Kf =6.33 n=0.281 0.987
600°C Biochar Freundlich Kf =6.30 n=0.261 0.997
700°C Biochar Freundlich Kf =12.1 n=0.153 0.950
Page 15
Figure 4 PO4 adsorption isotherm – 400°C Biochar Padthaway Prunings
Figure 5 PO4 adsorption isotherm – 500°C Biochar Padthaway Prunings
0
5
10
15
20
25
30
35
40
0 50 100 150 200 250 300
Q (
mg
PO
4/g
Bio
char
)
PO4 Concentration (mg/L)
400
Langmuir Model
Freundlich Model
0
5
10
15
20
25
30
35
40
0 50 100 150 200 250 300 350
Q (
mg
PO
4/g
Bio
char
)
PO4 Concentration (mg/L)
500
Langmuir Model
Freundlich Model
Page 16
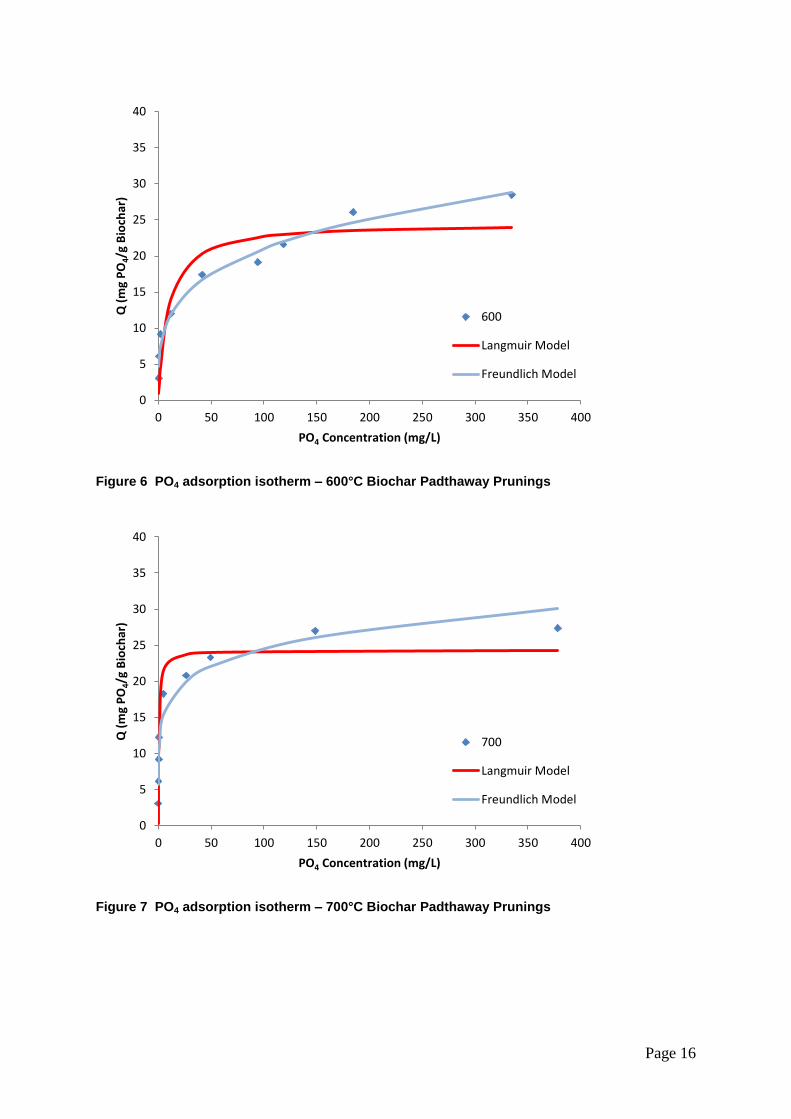
Figure 6 PO4 adsorption isotherm – 600°C Biochar Padthaway Prunings
Figure 7 PO4 adsorption isotherm – 700°C Biochar Padthaway Prunings
0
5
10
15
20
25
30
35
40
0 50 100 150 200 250 300 350 400
Q (
mg
PO
4/g
Bio
char
)
PO4 Concentration (mg/L)
600
Langmuir Model
Freundlich Model
0
5
10
15
20
25
30
35
40
0 50 100 150 200 250 300 350 400
Q (
mg
PO
4/g
Bio
char
)
PO4 Concentration (mg/L)
700
Langmuir Model
Freundlich Model
Page 17
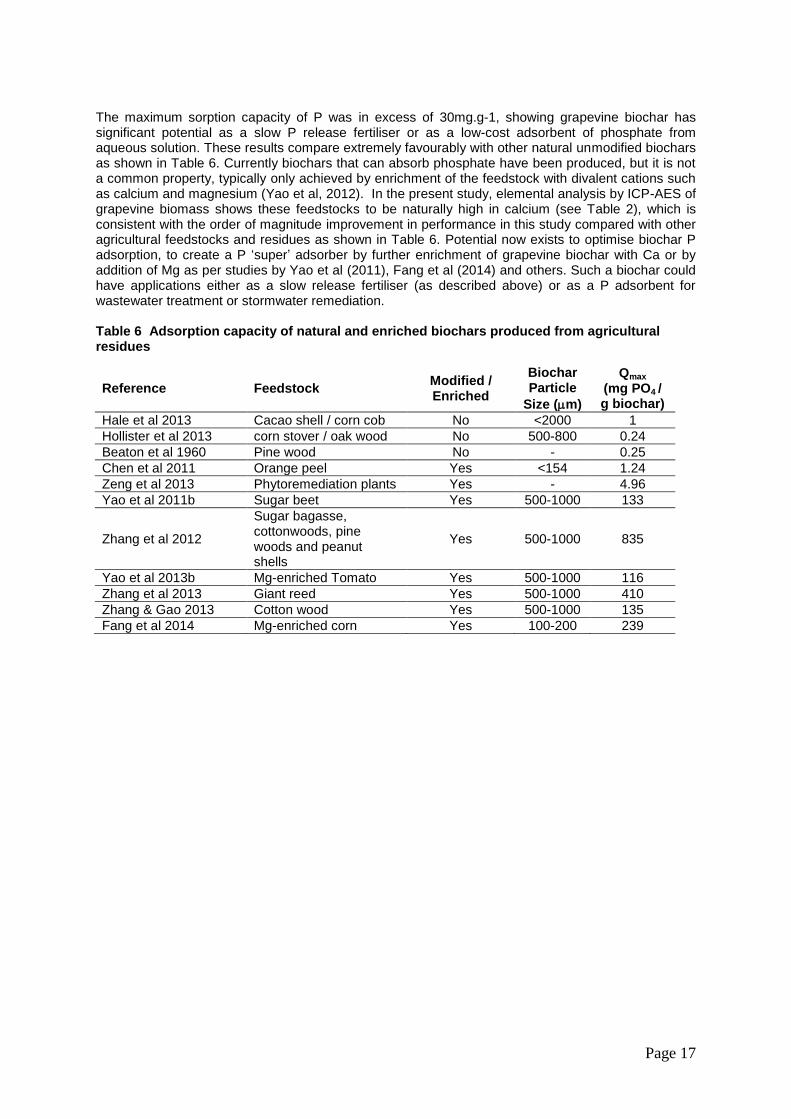
The maximum sorption capacity of P was in excess of 30mg.g-1, showing grapevine biochar has significant potential as a slow P release fertiliser or as a low-cost adsorbent of phosphate from aqueous solution. These results compare extremely favourably with other natural unmodified biochars as shown in Table 6. Currently biochars that can absorb phosphate have been produced, but it is not a common property, typically only achieved by enrichment of the feedstock with divalent cations such as calcium and magnesium (Yao et al, 2012). In the present study, elemental analysis by ICP-AES of grapevine biomass shows these feedstocks to be naturally high in calcium (see Table 2), which is consistent with the order of magnitude improvement in performance in this study compared with other agricultural feedstocks and residues as shown in Table 6. Potential now exists to optimise biochar P adsorption, to create a P ‘super’ adsorber by further enrichment of grapevine biochar with Ca or by addition of Mg as per studies by Yao et al (2011), Fang et al (2014) and others. Such a biochar could have applications either as a slow release fertiliser (as described above) or as a P adsorbent for wastewater treatment or stormwater remediation. Table 6 Adsorption capacity of natural and enriched biochars produced from agricultural residues
Reference Feedstock Modified / Enriched
Biochar Particle
Size (m)
Qmax (mg PO4 / g biochar)
Hale et al 2013 Cacao shell / corn cob No <2000 1
Hollister et al 2013 corn stover / oak wood No 500-800 0.24
Beaton et al 1960 Pine wood No - 0.25
Chen et al 2011 Orange peel Yes <154 1.24
Zeng et al 2013 Phytoremediation plants Yes - 4.96
Yao et al 2011b Sugar beet Yes 500-1000 133
Zhang et al 2012
Sugar bagasse, cottonwoods, pine woods and peanut shells
Yes 500-1000 835
Yao et al 2013b Mg-enriched Tomato Yes 500-1000 116
Zhang et al 2013 Giant reed Yes 500-1000 410
Zhang & Gao 2013 Cotton wood Yes 500-1000 135
Fang et al 2014 Mg-enriched corn Yes 100-200 239

Page 18
XRD The XRD spectra of the 600°C biochar shows calcite (CaCO3) as the dominant signal prior to adsorption of P. Following adsorption, calcite is still present but the new compounds brushite (CaHPO4) and sylvite (KCl) also have strong signals. Based on this observation as well as the observed solution pH data shown in Table 3, it is postulated that calcite adsorbs phosphate according to the following reaction (Karageorgiou et al 2007) Ca
2+ + HPO4
- = CaHPO4, pK = -7.0 (1)
Figure 8 XRD spectrum of 600°C biochar before (top) and after P sorption (bottom)
47- 1743 CALCITE
46- 1045 QUARTZ, SYN
File Name: c:\sel034\xrd\3142\3142-42305_ar.xpt
42305. 600C BCB 510. As received.
2-Theta Angle (deg)10.00 20.00 30.00 40.00 50.00 60.00 70.00
2
4
6
8
10
Inte
nsity (
Counts
) X
1000
47- 1743 CALCITE
72- 713 BRUSHITE
73- 380 SYLVITE, SYN
46- 1045 QUARTZ, SYN
File Name: c:\sel034\xrd\3142\3142-42306_ar.xpt
42306. T2 600C BCB Post Sorption 1427 mg/l 509. As received.
2-Theta Angle (deg)10.00 20.00 30.00 40.00 50.00 60.00 70.00
2
4
6
8
10
12
Inte
nsity (
Counts
) X
1000
Page 19
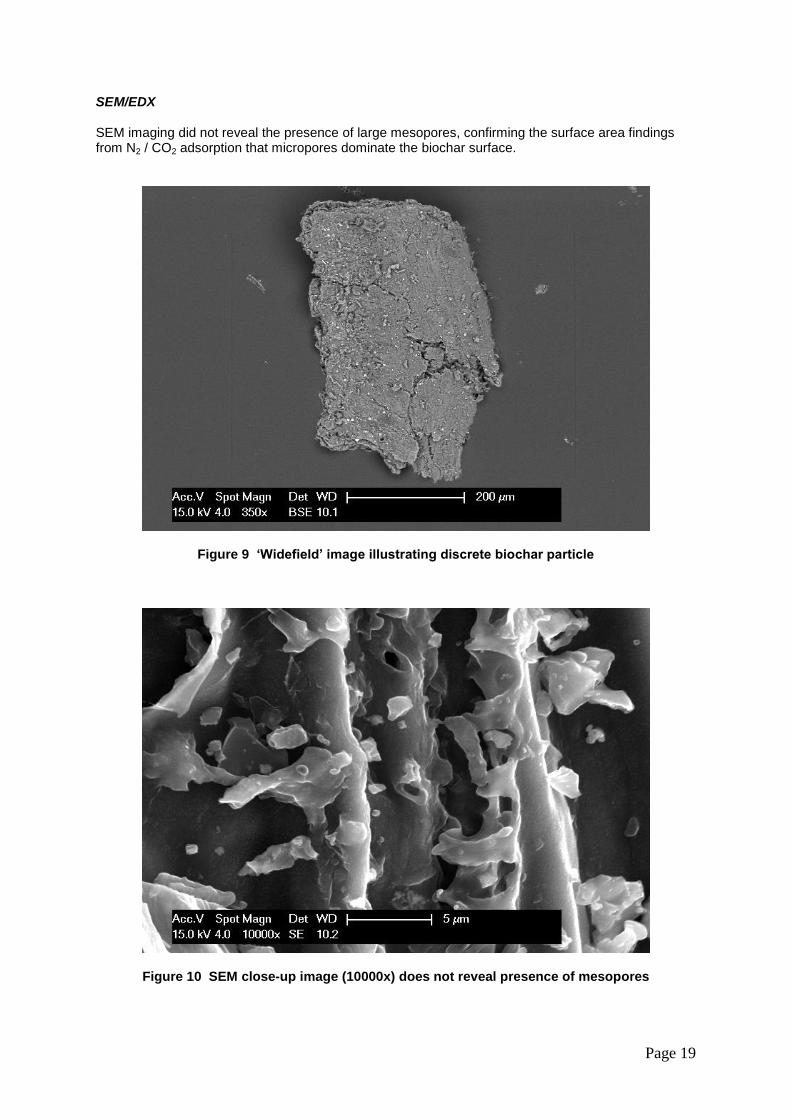
SEM/EDX SEM imaging did not reveal the presence of large mesopores, confirming the surface area findings from N2 / CO2 adsorption that micropores dominate the biochar surface.
Figure 9 ‘Widefield’ image illustrating discrete biochar particle
Figure 10 SEM close-up image (10000x) does not reveal presence of mesopores
Page 20
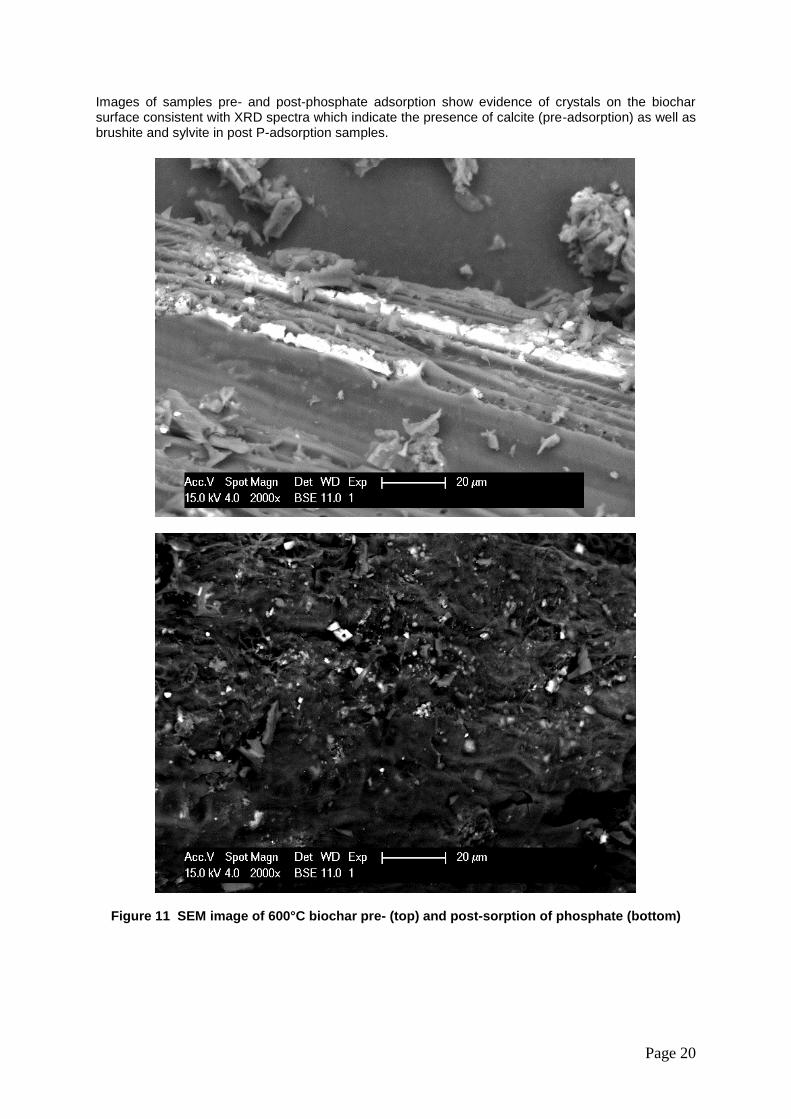
Images of samples pre- and post-phosphate adsorption show evidence of crystals on the biochar surface consistent with XRD spectra which indicate the presence of calcite (pre-adsorption) as well as brushite and sylvite in post P-adsorption samples.
Figure 11 SEM image of 600°C biochar pre- (top) and post-sorption of phosphate (bottom)

Page 21
Hydrostatic Water Retention
In general, stalk biochars exhibited superior water retention compared with pruning biochars, owing to the larger surface area and pore volume of the stalk samples. Similarly, water retention performance was observed to increase with increasing pyrolysis temperature, which is likely also related to the larger surface area and pore volume produced under those process conditions. Water retention properties were modelled using the Groenevelt-Grant water retention model (Grant et al 2010) as shown in Equation 4:
( ) { [ (
)
] [ (
)
]} (4)
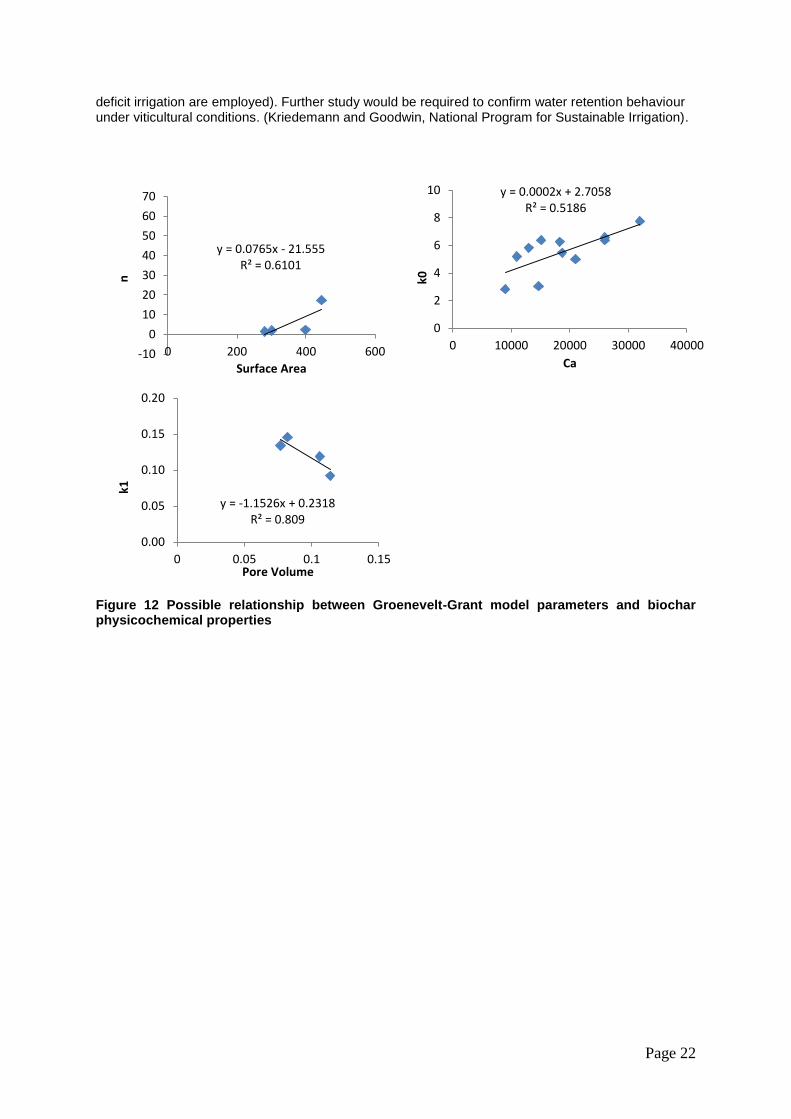
where k0, k1 and n are freely adjustable fitting parameters obtained from water retention data by curve-fitting through an ‘anchor’ point ( , ha), in this case ha = 1 m. Comparison of Groenevelt-Grant model parameters with physicochemical characterisation data suggests a link between water retention and biochar surface area (parameter n), calcium content (parameter k0) and pore size (parameter k1) as shown in Figure 12. Further analysis of additional samples is required to confirm these relationships, and additional characterisation experiments (following on from this project) are now in progress to examine this.
Table 7 Grapevine biochar water retention data
Sample
Matric head (m) Groenevelt-Grant Model Parameters
1 3 10 50 k0 k1 n R2 SSE
5-Pr-Pa 0.211 0.204 0.131 0.084 6.262 0.134 1.461 0.989 1.17E-31
6-Pr-Pa 0.244 0.234 0.133 0.101 4.988 0.145 1.896 0.984 7.78E-32
7-Pr-Pa 0.276 0.327 0.151 0.130 6.377 0.146 4.202 0.970 2.61E-03
6-Pr-M 0.260 0.295 0.147 0.087 7.766 0.173 3.310 0.971 1.24E-03
6-Pr-C 0.207 0.203 0.124 0.128 5.472 0.081 62.14 0.994 2.57E-05
6-Pr-W 0.212 0.212 0.136 0.099 6.573 0.114 2.155 0.990 1.28E-30
5-S-Pa 0.309 0.281 0.217 0.218 3.029 0.092 17.20 0.994 6.25E-07
6-S-Pa 0.341 0.341 0.258 0.223 6.388 0.119 2.287 0.989 7.49E-31
6-S-M 0.300 0.293 0.209 0.167 5.822 0.136 1.682 0.987 7.28E-31
6-S-C 0.342 0.329 0.243 0.204 5.196 0.141 1.577 0.987 1.36E-30
6-S-W 0.377 0.309 0.232 0.231 2.822 0.146 4.517 0.985 5.34E-31
Sample Identification: Pr = Prunings, S = Stalks, 5 = 500°C Biochar, 6 = 600°C Biochar, 7=700°C Biochar Based on typical soil water retention data presented by Grant et al (2010), volumetric water content of pure biochars is similar to that of sandy-loam to loam type soil over the matric pressure range examined, as depicted in Figure 13. These results in isolation would suggest that over the matric pressure range tested (which represents typical vineyard soil water management from field capacity to beyond the normal limits of vineyard regulated deficit irrigation), biochar is unlikely to have a significant additional effect on water retention when applied to vineyards with loam soils. A recent study by Kameyama et al (2012) examined water retention of clay soil amended with biochar derived from sugar cane bagasse, with similar results observed to those of the present study for matric pressures in excess of 10kPa (1m). However, water content was increased in biochar-amended soils when compared with the control at matric pressures between 0-10kPa (<1m); i.e. from saturation to field capacity. Kameyama et al (2012) reported that volumetric water content at saturation was increased significantly, (from 0.57-0.60 for the soil control compared with 0.76-0.80 for a 10% w/w addition of biochar) with studies by Karhu et al (2011) and Novak et al (2012) showing similar findings in biochar-amended sandy soils. Biochar application to sandy vineyard soils may result in an improvement in soil water retention, however matric pressures investigated by Karhu et al (2011) and Novak et al (2012) are not typically seen in conventional vineyard irrigation management over the growing season (particularly if management practices such as partial root-zone drying or regulated
Page 22
deficit irrigation are employed). Further study would be required to confirm water retention behaviour under viticultural conditions. (Kriedemann and Goodwin, National Program for Sustainable Irrigation).
Figure 12 Possible relationship between Groenevelt-Grant model parameters and biochar physicochemical properties
y = 0.0765x - 21.555 R² = 0.6101
-10
0
10
20
30
40
50
60
70
0 200 400 600
n
Surface Area
y = 0.0002x + 2.7058 R² = 0.5186
0
2
4
6
8
10
0 10000 20000 30000 40000
k0
Ca
y = -1.1526x + 0.2318 R² = 0.809
0.00
0.05
0.10
0.15
0.20
0 0.05 0.1 0.15
k1
Pore Volume

Figure 13 Grapevine biochar volumetric water content, and comparison with standard soil types
0
0.1
0.2
0.3
0.4
0.5
0.6
0 10 20 30 40 50 60
Vo
lum
etr
ic W
ate
r co
nte
nt
(v)
Matric Suction Head (m)
5-S-Pa
6-S-Pa
6-S-C
6-S-W
6-S-M
7-Pr-Pa
6-Pr-Pa
5-Pr-Pa
6-Pr-C
6-Pr-M
6-Pr-W
Coarse Sand
Medium fine sand
Sandy loam
Loam
Clay loam
Silty clay

Page 24
Outcomes and Conclusions
The project successfully achieved its planned outputs and performance targets however there were a few surprises and unexpected results. Grapevine prunings and stalks were sourced from four regions across South Australia. All feedstocks were pyrolysed to produce biochars under different process conditions. These biochars were characterised to elucidate the effects of pyrolysis conditions and process factors – in particular region (GI), feedstock type, and heating temperature – on biochar quality parameters such as surface area, porosity or pore volume, and water holding capacity. From these data, an assessment of the potential for enhancing water retention in soils through use of grape-derived biochars as vineyard soil adjuvants can now be made. Initially, significant difficulties were encountered in simply producing biochar with the continuous pyrolyser, due to problems with consistent feed of biomass feedstock into the pyrolysis furnace. Design modifications to the lab rig were necessary to ensure reliable processing. The small size of the pyrolysis test rig may have played a factor, and similar problems may not be evident in a larger installation. Nonetheless modifications to the lab scale unit could easily be scaled up as required to ensure these process issues did not arise in a commercial sized plant. Biochars produced at 400°C were initially hydrophobic immediately after production, but became hydrophilic after storage. Whilst samples were kept in sealed containers in the absence of light it is possible that oxidation of the samples may have occurred during storage, altering the initial hydrophobic nature of the surface. This behaviour is not described in literature and warrants further examination. Biochars produced from grape stalk feedstocks were found to have a higher surface area and pore volume (porosity) compared with biochars produced from pruning feedstocks under the same process conditions. Increasing pyrolysis temperature was also observed to increase surface area and pore volume. As a result, biochars produced from stalk feedstock exhibited superior water retention performance compared with biochars from grape prunings. Water retention performance was also increased with increasing temperature, again largely due to surface area and pore volume effects. Interestingly, calcium content may also be a factor in water holding behaviour and further research is recommended to investigate this. Pure biochars were found to display similar water retention performance to sandy-loam to loam type soil over the matric pressure range examined. Addition of biochar to vineyard loam soils is unlikely to provide a significant additional benefit in water holding over the range of matric water potential typically encountered during conventional vineyard irrigation management. In contrast, pure biochars were superior in water retention performance to typical sandy soils, and so addition of biochar to these vineyard soil types may improve water holding (particularly at field capacity) however further study would be required to confirm water retention behaviour under viticultural conditions. The most surprising finding was that pruning derived biochars were found have a phosphorus adsorption capacity over 10 times that of other natural unmodified biochars in the literature. Biochars that can adsorb phosphate in significant quantities have been produced, but it is not a common property, typically only achieved by enrichment of the feedstock with divalent cations such as calcium and magnesium. Grape pruning and grape stalk biochars examined in this project were found to be naturally high in calcium, especially feedstocks from Padthaway, most likely due to the limestone soils prevalent in that region. The maximum sorption capacity of phosphorus was in excess of 30mg.g-1, showing grapevine biochar has significant potential as a slow P release fertiliser or as a low-cost adsorbent of phosphate for environmental and wastewater remediation applications. The potential to improve fertiliser efficiency is especially significant as the efficiency of phosphorus use in the year of application is quite low. Given the likely increase in efficiency of biochar application on broadacre agriculture using banding techniques, an engineered biochar that facilitates phosphorus availability could be highly economically viable. Other studies have shown that biochar application to soils is capable of reducing emissions of other greenhouse gases such as methane through better aeration (less anaerobic conditions) and greater stabilisation of soil carbon. Slower nitrogen cycling also contributes to the suppression of nitrous oxide emissions (by as much as 80% in some studies.). Any reduced demand for fertiliser application as a result therefore would have demonstrable environmental and economic benefit.

Page 25
Recommendations
The research undertaken in this study was a part of the AGWA Incubator Initiative, a scheme for short-term projects (12 months) in which the aim was to generate fundamental knowledge and research capacity that could be to the long-term benefit of the Australian grape and wine sector. Pure biochars were superior in water retention performance to typical sandy soils, and so biochar amendment of these vineyard soil types may improve water holding (particularly at field capacity) however further study with pot or field trials is recommended to confirm water retention behaviour under different viticultural irrigation regimes. The activation of biochar is also recommended to enhance water retention performance. The most exciting finding from this study was related not to water efficiency (the main focus of the project) but rather to phosphorus adsorption. Due to the naturally high calcium content of biomass feedstocks investigated in this work, vineyard pruning displayed phosphorus adsorption capacities more than 10 times that of other natural unmodified biochars in the literature, with Padthaway feedstocks having the highest calcium content of the four regions studied. Further research is recommended to explore this regional aspect, and to determine whether biomass feedstocks can be further enhanced or fine-tuned (either by selection based on regional characteristics or by engineering intervention) to optimise a biochar with superior phosphorus adsorption capacity. Favorable results from optimisation studies could be used to inform the development of a subsequent large-scale project involving field application or pot trials to assess the impact of soil enrichment with grape stalk and vineyard pruning derived biochars. As with the present study, the continuous pyrolysis equipment used in this project is suited to mobile in-field use, and so would mitigate feedstock transportation costs which must be considered in all biomass applications. The economic and environmental benefits from a superior phosphorus adsorbent would be substantial and certainly worthy of further investigation.

Page 26
Appendix 1: Communication On two occasions the project proposal and preliminary results and final project overview have been presented to the Wine Future Advisory Board. Preliminary results were also presented at the University of Adelaide School of Agriculture, Food and Wine Research Day. Due to the short term nature of this project (12 months) it is anticipated that at least two papers arising from this project will be published in peer-reviewed journals in the following months as well as future presentations focusing on engagement with the industry . Further extension materials such as fact sheets could be developed from this project and made publically available at ag-sector industry field days, roadshows and trade expos. Findings from this project will also be integrated into teaching activities in the University of Adelaide’s Wine Science programs at the Waite Campus which is training the next generation of leading Australian (and global) viticulturists and winemakers.

Page 27
Appendix 2: Intellectual Property No commercial IP has been identified for this project. Much of the work contained in this report is currently being prepared for publication, thus future use of tables and figures may require copyright permission to use.

Page 28
Appendix 3: References Provide a list of all references cited in the report Beaton, J.D., Peterson, H.B., Bauer, N. (1960) “Some Aspects of Phosphate Adsorption by Charcoal”, Soil Science Society Proceedings, 340-346 Bittelli, M., Flury, M. (2009) “Errors in Water Retention Curves Determined with Pressure Plates”, Soil Sci. Soc. Am. J. 73:1453-1460 Chen, B., Chen, Z., Lv, S. (2011) “A novel magnetic biochar efficiently sorbs organic pollutants and phosphate” Bioresource Technology 102 (2011) 716–723 Cresswell, H. P., Green, T.W., McKenzie, N.J. (2008) “The Adequacy of Pressure Plate Apparatus for Determining Soil Water Retention”, Soil Sci. Soc. Am. J. 72:41-49 Fang, C., Zhang, T., Li, P., Jiang, R-f., Wang, Y-c. (2014) “Application of Magnesium Modified Corn Biochar for Phosphorus Removal and Recovery from Swine Wastewater” Int. J. Environ. Res. Public Health, 11, 9217-9237 Foo, KY, and B. H. Hameed. (2010) "Insights into the modeling of adsorption isotherm systems." Chemical Engineering Journal 156(1): 2-10. Grant, C.D., Groenevelt, P.H., Robinson, N.I (2010) “Application of the Groenevelt-Grant soil water retention model to predict the hydraulic conductivity”, Australian Journal of Soil Research, 48, 447-458 Hale, S., Alling, V., Marinsen, V., Mulder, J., Breedveld, G. and Cornelissen, G. (2013) 'The sorption and desorption of phosphate-P, ammonium-N and nitrate-N in cacao shell and corn cob biochars', Chemosphere, 91(11), pp. 1612-1619. Hinsinger, P. (2001) 'Bioavailability of soil inorganic P in the rhizosphere as affected by root-induced chemical changes: a review', Plant and Soil, 237, pp. 173-195. Hollister, C., Bisogni, J. & Lehmann, J. (2013) 'Ammonium, nitrate, and phosphate sorption to and solute leaching from biochars prepared from corn stover (Zea mays L.) and oak wood (Quercus spp.)', Journal of Environmental Quality, 42, pp. 137-144. Johnston, A., Poulton, P., Fixen, P. & Curtin, D. (2014) 'Phosphorus: its efficient use in agriculture', Advances in agronomy, 123, pp. 177-227. Jung, K.W., Hwang, M.J., Ahn, K.H., Ok, Y.S. (2015) “Kinetic study on phosphate removal from aqueous solution by biochar derived from peanut shell as renewable adsorptive media” Int. J. Environ. Sci. Technol. DOI 10.1007/s13762-015-0766-5 Kameyama, K., Miyamoto, T., Shiono, T., Shinogi, T. (2012) “Influence of Sugarcane Bagasse-derived Biochar Application on Nitrate Leachin in Calcaric Dark Red Soil”, Journal of Environmental Quality, Vol.41(4), pp.1131-7 Karageorgiou, K., Paschalis, M., Anastassakis, G.N. (2007) “Removal of phosphate species from solution by adsorption onto calcite used as natural adsorbent” Journal of Hazardous Materials, A139, 447-452 Karhu, K., Mattila, T., Bergstrom, I., Regina, K. (2011) Biochar addition to agricultural soil increased CH4 uptake and water holding capacity – Results from a short-term pilot field study, Agriculture, Ecosystems and Environment, 140, 309-313 Kasozi, G.N., Zimmerman, A.R., Nkedi-Kizza, P., Gao, B. (2010) “Catechol and humic acid sorption onto a range of laboratory-produced black carbons (biochars)”. Environ. Sci. Technol. 44(16), 6189-6195

Page 29
Kriedemann, P.E., Goodwin, I. Regulated Deficit Irrigation and Partial Rootzone Drying, National Program for Sustainable Irrigation, Irrigation Insights No 4, http://research.agwa.net.au/wp-content/uploads/2012/09/NPI-01-01-RECV-27-10-03-PRD-irrigation-insights.pdf (accessed 22/7/15) Nair, P., Logan, T., Sharpley, A., Sommers, L., Tabatabai, M. and Yuan, T. (1984) 'Interlaboratory Comparison of a Standardized Phosphorus Adsorption Procedure', Journal of Environmental Quality, 13(4), pp. 591-594. Novak, J.M., Busscher, W.J., Watts, D.W., Amonette, J.E., Ippolito, J.A., Lima, I.M., Gaskin, J., Das, K.C., Steiner, C., Ahmedna, M., Rehrah, D., Schomberg, H. (2012) “Biochars Impact on Soil-Moisture Storage in an Ultisol and Two Aridisols”, Soil Science, 177(5), 310-320 Yao, Y.,Gao, B., Inyang, M., Zimmerman, A., Cao, X., Prullammanappallil, P. and Yang, L. (2011a) 'Biochar derived from anaerobically digested sugar beet tailings: characterization and phosphate removal potential', Bioresource Technology, 102, pp. 6273-6278. Yao, Y.,Gao, B., Inyang, M., Zimmerman, A., Cao, X., Prullammanappallil, P. and Yang, L. (2011b) 'Removal of phosphate from aqueous solution by biochar derived from anaerobically digested sugar beet tailings', Journal of Hazardous Materials, 109, pp. 501-507. Yao, Y., Gao, B., Chen, J., Zhang, M., Inyang, M., Li, Y., Alva, A. and Yang, L. (2013a) 'Engineered carbon (biochar) prepared by direct pyrolysis of Mg-accumulated tomato tissues: Characterization and phosphate removal potential', Bioresource Technology, 138, pp. 8-13. Yao, Y., Gao, B., Chen, J. and Yang, L. (2013b) 'Engineered biochar reclaiming phosphate from aqueous solutions: mechanisms and potential application as a slow-release fertilizer', Environmental Science and Technology, 47(15), pp. 8700-8708. Zeng, Z., Zhang, S., Li, T., Zhao, F., He, Z., Zhao, H., Yang, X., Wang, H., Zhao, J. and Rafiq, M. (2013) 'Sorption of ammonium and phosphate from aqueous solution by biochar derived from phytoremediation plants', Journal of Zhejiang University, 14(12), pp. 1152-1161. Zhang, M., Gao, B., Yao, Y. & Inyang, M. (2013) 'Phosphate removal ability of biochar/MgAl-LDH ultra-fine composites prepared by liquid-phase deposition', Chemosphere, 92(8), pp. 1042-1047. Zheng, H., Wang, Z., Deng, X., Zhao, J., Luo, Y., Novak, J., Herbert, S. & Xing, B. (2013) 'Characteristics and nutrient values of biochars produced from giant reed at different temperatures', Bioresource Technology, 130, pp. 463-471.

Page 30
Appendix 4: Staff Dr Richard Muhlack School of Agriculture, Food and Wine The University of Adelaide SA 5005 Dr Philip Kwong School of Chemical Engineering The University of Adelaide SA 5005 Mr Jon Marshall School of Chemical Engineering The University of Adelaide SA 5005 The authors wish to thank the Australian Grape and Wine Authority for financial support. The assistance and cooperation of Accolade Wines for the provision of vineyard prunings and grape stalks from McLaren Vale, Padthaway and Clare is gratefully acknowledged. Dr Cameron Grant of the Soil Science Group at the School of Agriculture, Food and Wine is thanked for access to pressure plate apparatus used for determination of sample water holding capacity. Prof. David Chittleborough of the Department of Earth Sciences at the School of Physical Sciences is also thanked for the valuable feedback on the phosphate adsorption analysis.